Getting Started With Images, Video, and...
62
Getting Started With Images, Video, and Matlab CSE 6367 – Computer Vision Vassilis Athitsos University of Texas at Arlington
Transcript of Getting Started With Images, Video, and...

Getting Started With Images,
Video, and Matlab
CSE 6367 – Computer Vision
Vassilis Athitsos
University of Texas at Arlington

What Is An Image?
• Grayscale image:
– A 2D array of intensity
values.
• rows x columns.
– Typically, 8 bits per
intensity value
• Range from 0 to 255.
• Color image:
– Three 2D arrays of
intensity values.
• Red, green, blue.

Reading Images in Matlab
>> hand_image = imread('data/hands/frame2.bmp', 'bmp');
>> hand_image(53,122,1) % Red value for row=53, col=122
ans =
64
>> hand_image(53,122,2) % Green value for row=53, col=122
ans =
83
>> hand_image(53,122,3) % Blue value for row=53, col=122
ans =
89

Displaying Images
• For color images of type uint8, size rows x cols x 3:
>> imshow(hand_image);
• For color images of type double:
– values must be between 0 and 1.
>> imshow(hand_image);
• For grayscale images with values in range [0 255]
>> imshow(gray_hand, [0 255]);
• For grayscale images with values in range [low high]
>> imshow(gray_hand, [low high]);
>> imshow(gray_hand, []);
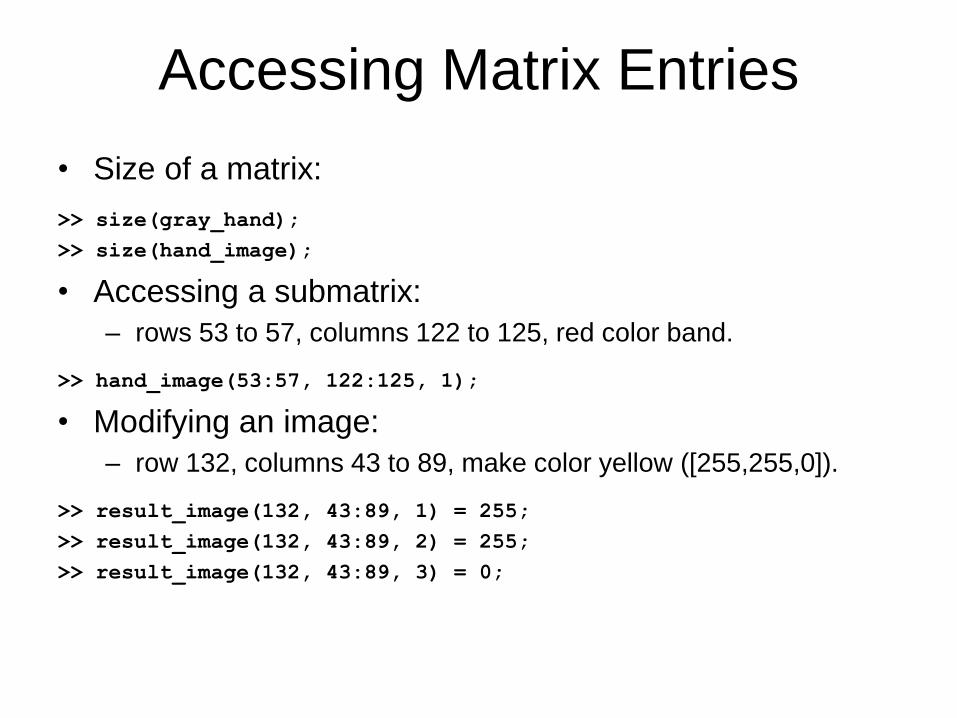
Accessing Matrix Entries
• Size of a matrix:
>> size(gray_hand);
>> size(hand_image);
• Accessing a submatrix:
– rows 53 to 57, columns 122 to 125, red color band.
>> hand_image(53:57, 122:125, 1);
• Modifying an image:
– row 132, columns 43 to 89, make color yellow ([255,255,0]).
>> result_image(132, 43:89, 1) = 255;
>> result_image(132, 43:89, 2) = 255;
>> result_image(132, 43:89, 3) = 0;

Useful Things in Matlab
>> addpath('c:/users/athitsos/matlab_code’);
>> type read_gray
>> help imwrite
>> who
>> which read_gray
>> clear

A Simple Computer Vision Example
• Consider the “walkstraight”
sequence. • Copyright: Hedvig Kjellström.
– Static background.
– Only moving person is a walking
human.
• How can we find where the
human is in frame 62?
– By finding where the motion occurs.
frame 61
frame 62
frame 63

Identifying Where Motion Occurred
• Step 1: compute frame differences
with previous and next frame:
– diff1 = abs(frame61 – frame62).
– diff2 = abs(frame63 – frame62).
• Note: frames must first be cast to double,
Otherwise, the above lines will not work.
• E.g.: frame61 = double(frame61);
frame 61
frame 62
frame 63
diff1 diff2
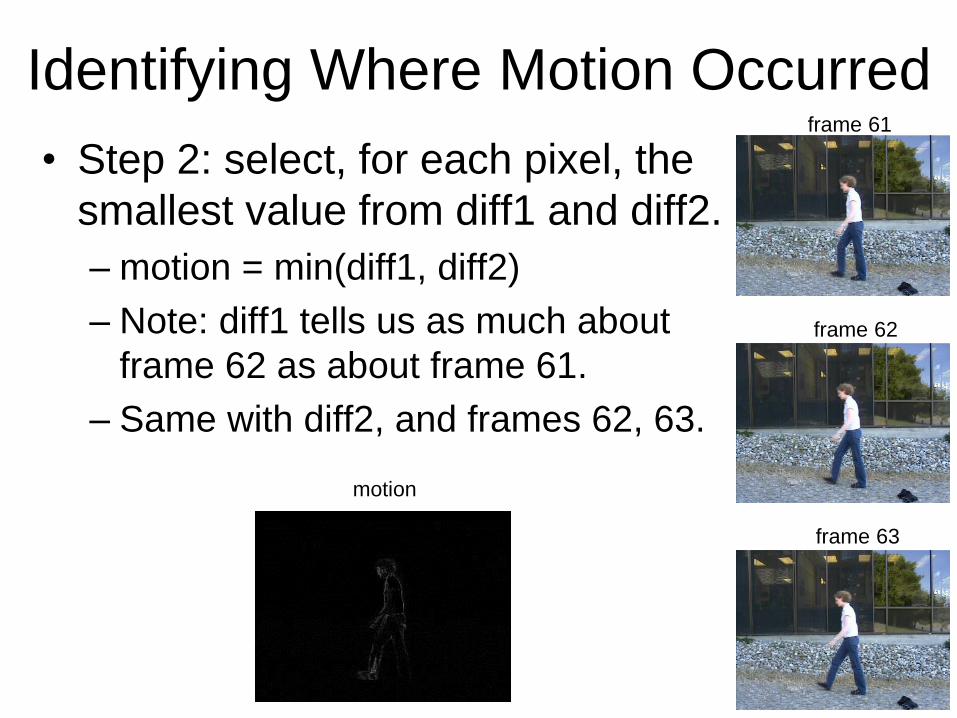
Identifying Where Motion Occurred
• Step 2: select, for each pixel, the
smallest value from diff1 and diff2.
– motion = min(diff1, diff2)
– Note: diff1 tells us as much about
frame 62 as about frame 61.
– Same with diff2, and frames 62, 63.
frame 61
frame 62
frame 63
motion
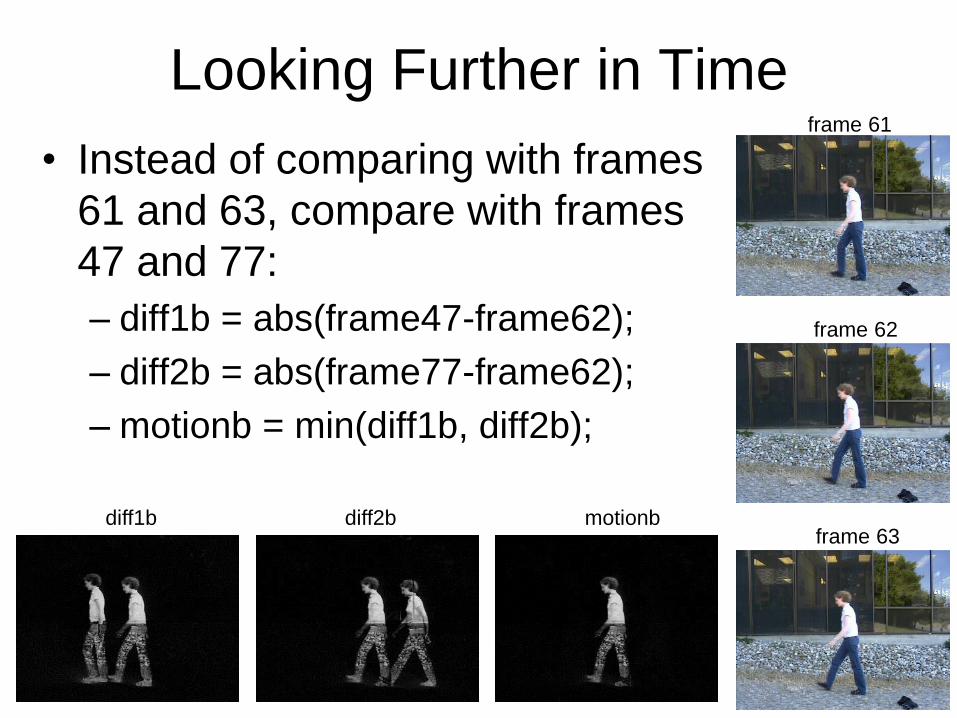
Looking Further in Time
• Instead of comparing with frames
61 and 63, compare with frames
47 and 77:
– diff1b = abs(frame47-frame62);
– diff2b = abs(frame77-frame62);
– motionb = min(diff1b, diff2b);
frame 61
frame 62
frame 63 diff1b diff2b motionb

Computing the Position
• How can we represent the
position? frame 62
motionb

Computing the Position
• How can we represent the
position?
– Answer 1: a set of pixels.
• A set of pixels is one of many
different ways to represent
shape.
• How do we get from the motion
image to shape?
frame 62
motionb
shape

From Motion to Shape
• Step 1:
thresholding.
threshold = 10;
thresholded = (motion2 > threshold);
imshow(thresholded, []);
Thr = 1 Thr = 50
Thr = 10 Thr = 100
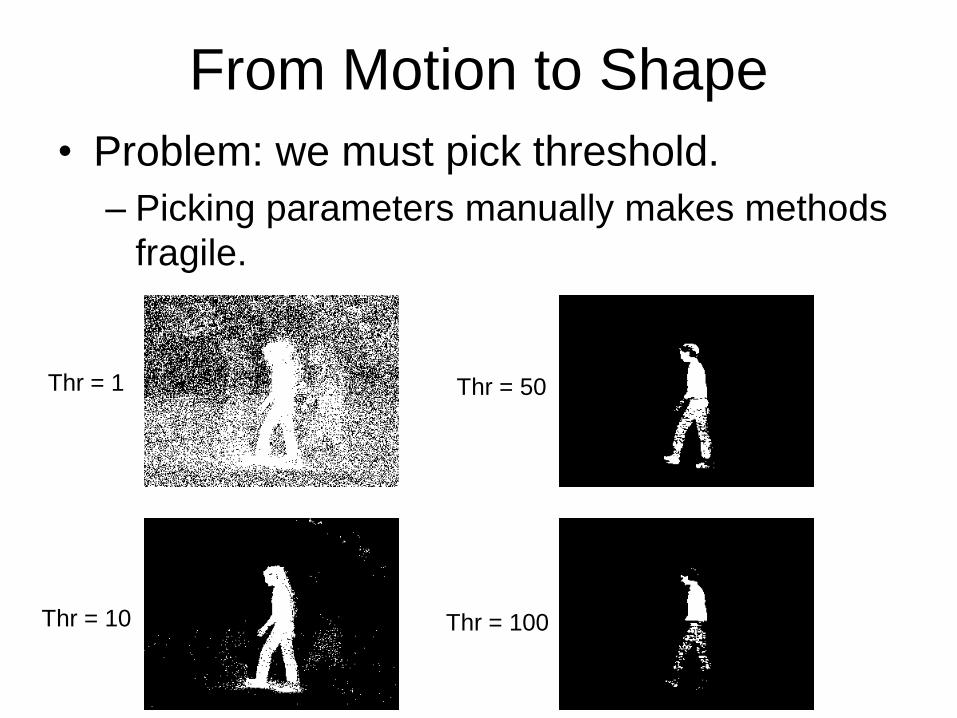
From Motion to Shape
• Problem: we must pick threshold.
– Picking parameters manually makes methods
fragile.
Thr = 50
Thr = 100
Thr = 1
Thr = 10

From Motion to Shape
• Choosing a threshold
manually:
– OK for toy example.
– bad practice oftentimes.
– sometimes, unavoidable or
extremely convenient.
• For our example: thr = 10.
• Problem: lots of small
motion areas.
– What causes them?
Thr = 10

From Motion to Shape
• We should identify the
biggest “area”.
– Connected Component
Analysis.
• What is a connected
component?
Thr = 10

From Motion to Shape
• We should identify the
biggest “area”.
– Connected Component
Analysis.
• What is a connected
component?
– Set of pixels such that you
can find a white-pixel path
from any of them to any of
them.
Thr = 10

From Motion to Shape
• We should identify the
biggest “area”.
– Connected Component
Analysis.
• What is a connected
component?
– Set of pixels such that you
can find a white-pixel path
from any of them to any of
them.
• 4-connected, 8-connected.
Thr = 10
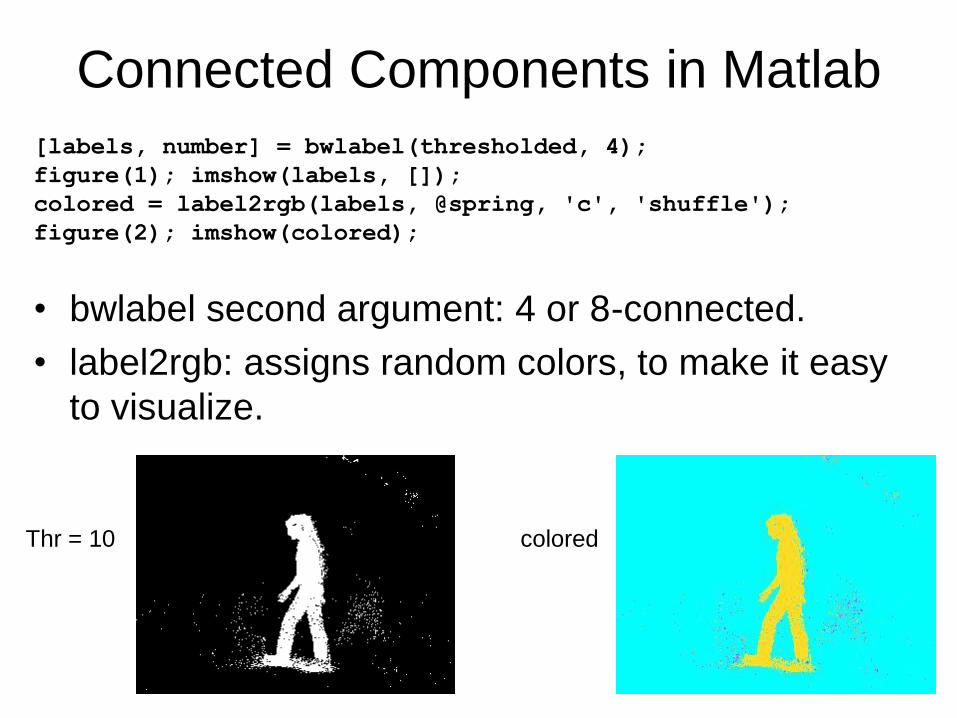
Connected Components in Matlab
[labels, number] = bwlabel(thresholded, 4);
figure(1); imshow(labels, []);
colored = label2rgb(labels, @spring, 'c', 'shuffle');
figure(2); imshow(colored);
• bwlabel second argument: 4 or 8-connected.
• label2rgb: assigns random colors, to make it easy
to visualize.
Thr = 10 colored

Identifying the Largest Component
[labels, number] = bwlabel(thresholded, 4);
• labels is an image of connected component IDs.
– 0 is the ID of the background, which we ignore.
• number is the number of connected components.
• We can count the pixels of each component.
counters = zeros(1,number);
for i = 1:number
% first, find all pixels having that label.
component_image = (labels == i);
% second, sum up all white pixels in component_image
counters(i) = sum(component_image(:));
end
[area, id] = max(counters);
person = (labels == id);

Result shape
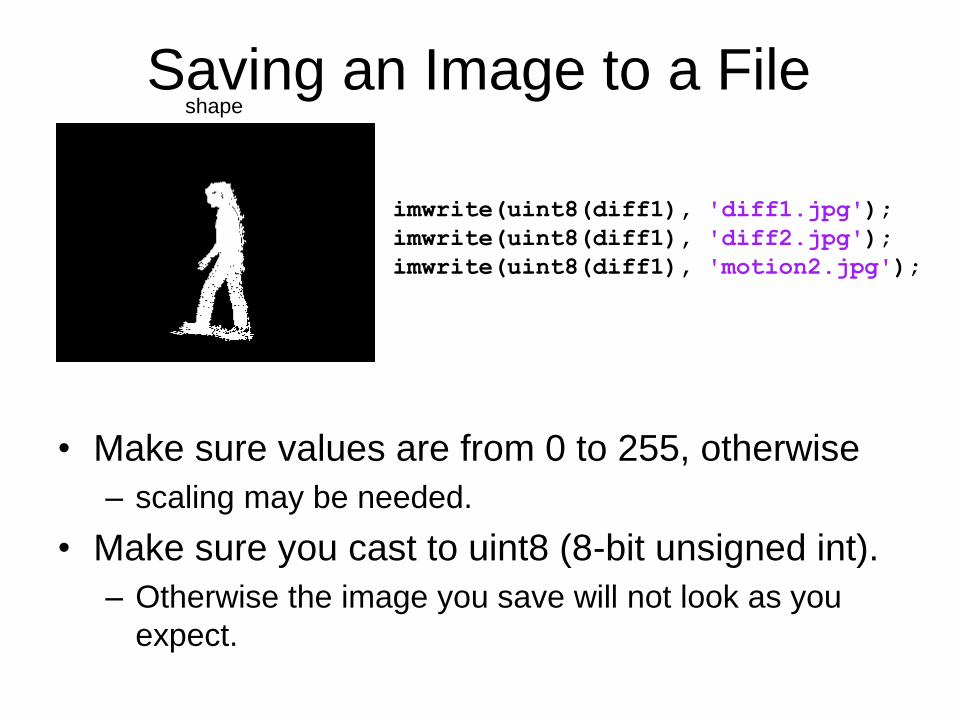
Saving an Image to a File shape
• Make sure values are from 0 to 255, otherwise
– scaling may be needed.
• Make sure you cast to uint8 (8-bit unsigned int).
– Otherwise the image you save will not look as you
expect.
imwrite(uint8(diff1), 'diff1.jpg');
imwrite(uint8(diff1), 'diff2.jpg');
imwrite(uint8(diff1), 'motion2.jpg');

Image Range Outside [0 255]
my_image = [
-2 -2 -2 -2 -2 -2 -2 -2 -2
-2 -2 -2 -2 -2 -2 -2 -2 -2
-2 -2 -2 -2 -2 -2 -2 -2 -2
5 5 5 5 5 5 5 5 5
-2 -2 -2 -2 -2 -2 -2 -2 -2
-2 -2 -2 -2 -2 -2 -2 -2 -2
-2 -2 -2 -2 -2 -2 -2 -2 -2
-2 -2 -2 -2 -2 -2 -2 -2 -2];
my_image = imresize(my_image, 20);
figure(1); imshow(my_image, []);

Pitfalls of Saving an Image
% this will not work (produces warning, and black image)
imwrite(my_image, 'trash/my_image.gif');
my_image2 = imread('trash/my_image.gif');
figure(2); imshow(my_image2, []);
my_image my_image2

Normalizing the Image Range
• How do we convert an image so that its
range is between 0 and 255?

Normalizing the Image Range
• How do we convert an image so that its
range is between 0 and 255?
% converting to [0 255] range:
low = min(my_image(:));
high = max(my_image(:));
range = high - low;
% this will give warning
converted = (my_image - low) * 255 / range;
% this will also give warning.
imwrite(converted, 'trash/my_image2.gif');
my_image2 = imread('trash/my_image2.gif');
figure(2); imshow(my_image2, []);

function result = normalize_range(input_image, target_low, target_high)
% function result = normalize_range(input_image, target_low, target_high)
%
% shift the values in input_image so that the minimum value is
% target_low and the maximum value is target_high.
%
% function result = normalize_range(input_image)
%
% returns normalize_range(input_image, 0, 255)
if nargin == 1
target_low = 0;
target_high = 255;
end
target_range = target_high - target_low;
low = min(input_image(:));
high = max(input_image(:));
range = high - low;
result = (input_image - low) * target_range / range + target_low;

function save_normalized(input_image, filename)
% function result = save_normalized(input_image, filename)
%
% normalize the values in input_image so that the minimum value is
% 0 and the maximum value is 255, and save the normalized image
% to the specified filename.
normalized = normalize_range(input_image);
imwrite(uint8(normalized), filename);

Image Formats
• Why are we saving as JPG?
• What about other formats (GIF, BMP,
TIFF)?

Image Formats
• Why are we saving as JPEG?
• What about other formats (GIF, BMP,
TIFF)?
• JPEG: good for photographs
– lossy compression.
• GIF: good for images with single-color
regions, few colors.
– Possibly lossy, only supports 256 image colors.
• TIFF, BMP: larger files, no loss of
information.

Shape Representations
• How about other representations of shape, in
addition to connected components?
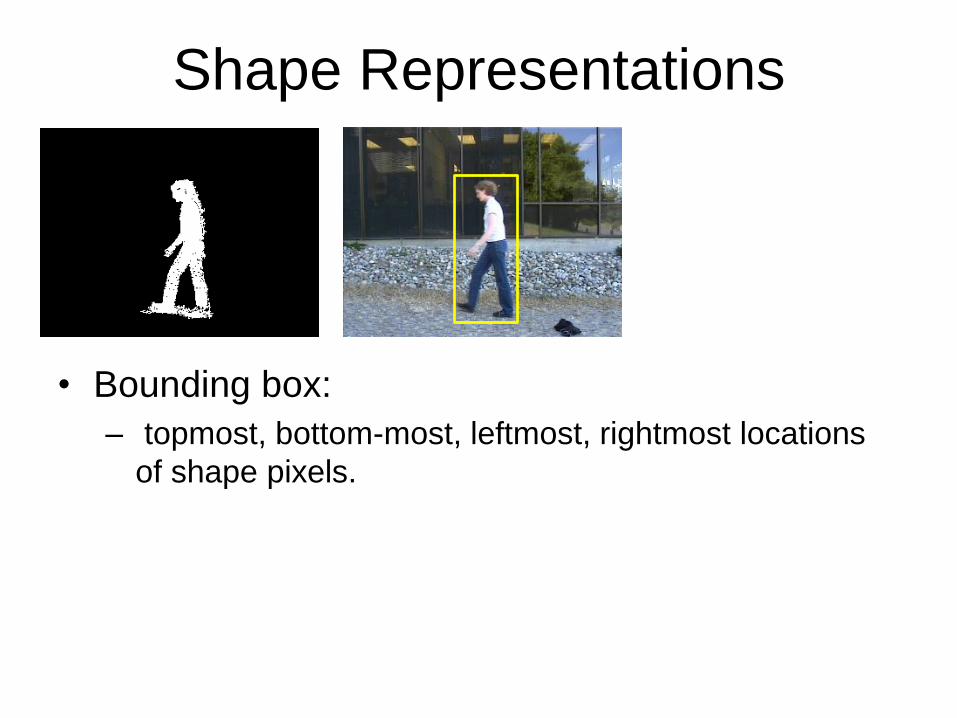
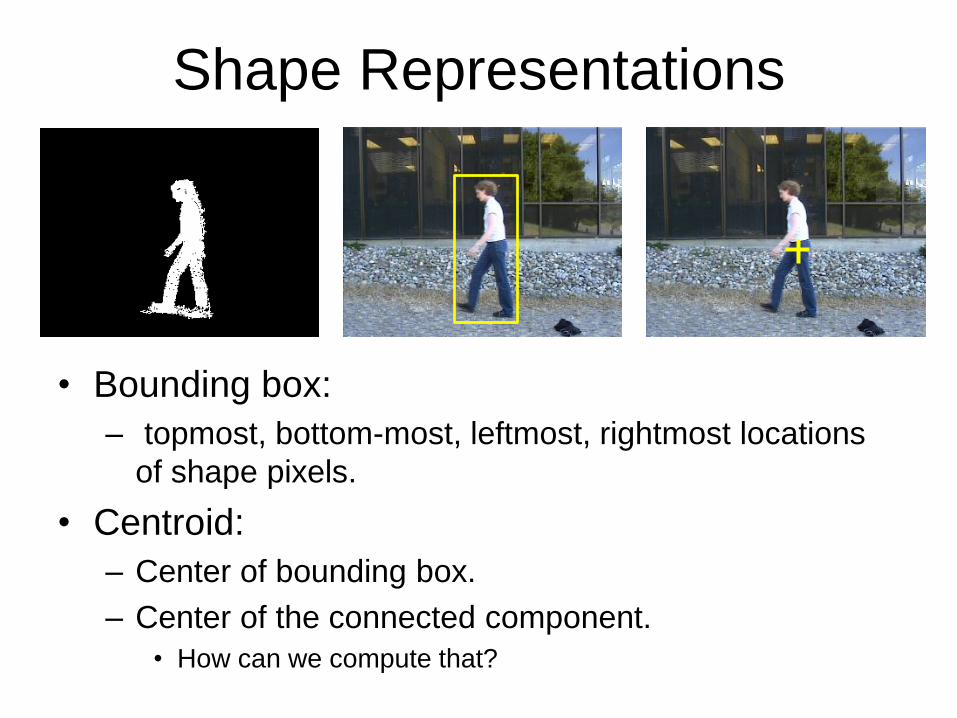
Shape Representations
• Bounding box:
– topmost, bottom-most, leftmost, rightmost locations
of shape pixels.

Shape Representations
• Bounding box:
– topmost, bottom-most, leftmost, rightmost locations
of shape pixels.
• Centroid:

Shape Representations
• Bounding box:
– topmost, bottom-most, leftmost, rightmost locations
of shape pixels.
• Centroid:
– Center of bounding box.

Shape Representations
• Bounding box:
– topmost, bottom-most, leftmost, rightmost locations
of shape pixels.
• Centroid:
– Center of bounding box.
– Center of the connected component.
Shape Representations
• Bounding box:
– topmost, bottom-most, leftmost, rightmost locations
of shape pixels.
• Centroid:
– Center of bounding box.
– Center of the connected component.
• How can we compute that?

Center of Connected Component
[rows, cols] = size(person);
sum_i = 0;
sum_j = 0;
counter = 0;
for i = 1:rows;
for j = 1:cols
if person(i,j) ~= 0
sum_i = sum_i + i;
sum_j = sum_j + j;
counter = counter + 1;
end
end
end
center_i = sum_i / counter;
center_j = sum_j / counter;
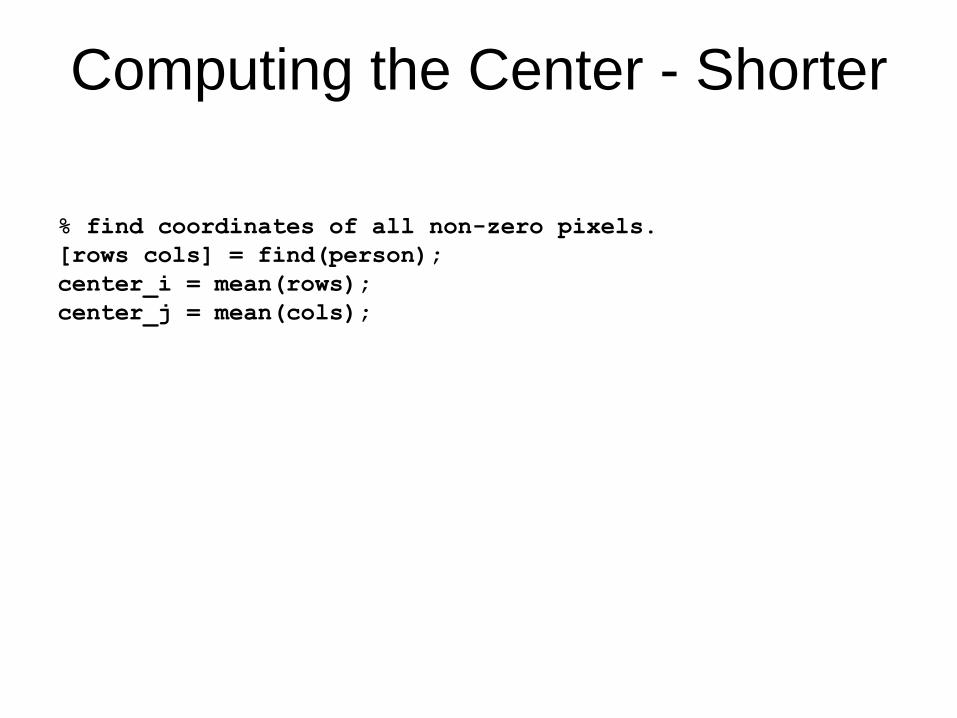
Computing the Center - Shorter
% find coordinates of all non-zero pixels.
[rows cols] = find(person);
center_i = mean(rows);
center_j = mean(cols);

Visualizing the Result
result_image = original_image; % make a copy
center_row = round(center_i);
center_col = round(center_j);
left = max(center_col - 5, 1);
right = min(center_col + 5, cols);
bottom = min(center_row + 5, rows);
top = max(center_row - 5, 1);
% draw horizontal line of cross
result_image(center_row, left:right, 1) = 255;
result_image(center_row, left:right, 2) = 255;
result_image(center_row, left:right, 3) = 255;
% draw vertical line of cross, use shortcut since all
values are 255
result_image(top:bottom, center_col, :) = 255;
imshow(result_image / 255);

Morphology: Dilation
• For every white pixel in original
image:
– Make all neighbors white in result.
• What is a neighbor?
– Specified as an extra parameter.
% 8-connected neighbors
imdilate(person, ones(3,3))
person
% 4-connected neighbors
neighborhood = [0,1,0; 1,1,1; 0,1,0])
imdilate(person, neighborhood)
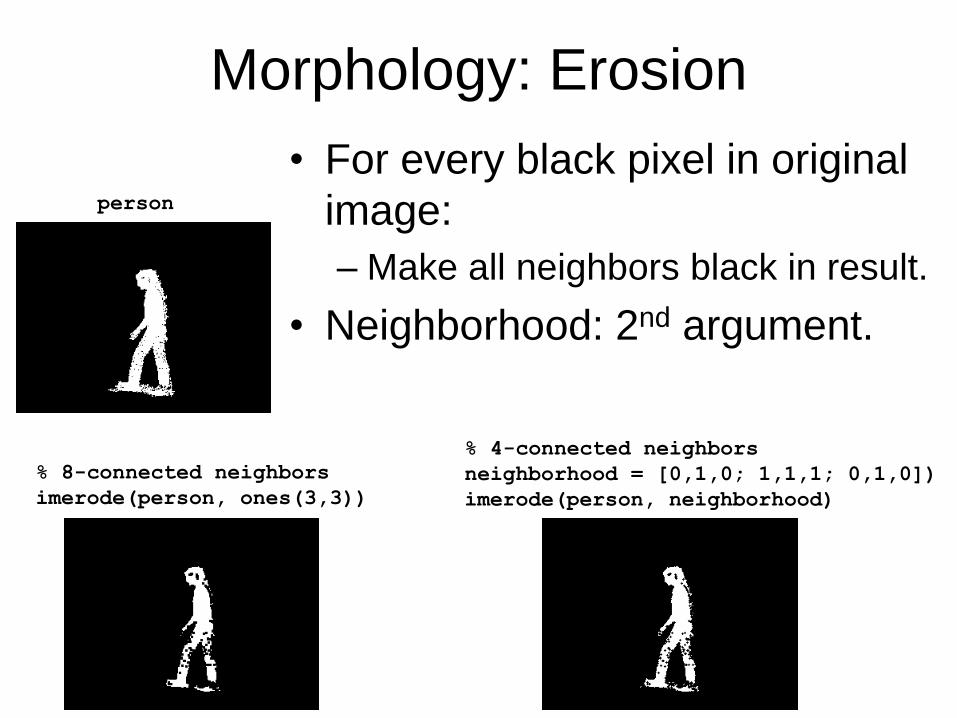
Morphology: Erosion
• For every black pixel in original
image:
– Make all neighbors black in result.
• Neighborhood: 2nd argument.
% 8-connected neighbors
imerode(person, ones(3,3))
person
% 4-connected neighbors
neighborhood = [0,1,0; 1,1,1; 0,1,0])
imerode(person, neighborhood)

Note on Erosion and Dilation
• Are erosion and dilation mathematical
inverses of each other?
– If we erode and then dilate, do we get the
original image?

Note on Erosion and Dilation
• Erosion and dilation are not mathematical
inverses of each other.
– If they were, opening and closing would not
change the image.
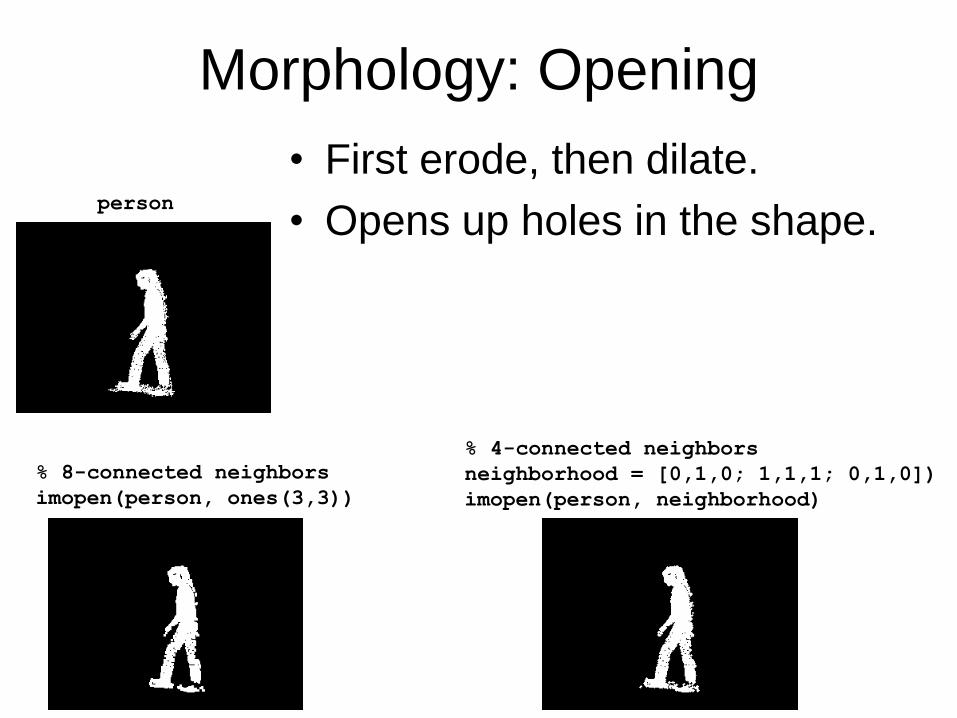
Morphology: Opening
• First erode, then dilate.
• Opens up holes in the shape.
% 8-connected neighbors
imopen(person, ones(3,3))
person
% 4-connected neighbors
neighborhood = [0,1,0; 1,1,1; 0,1,0])
imopen(person, neighborhood)

Morphology: Closing
• First dilate, then erode.
• Shrinks or eliminates holes in
the shape.
% 8-connected neighbors
imclose(person, ones(3,3))
person
% 4-connected neighbors
neighborhood = [0,1,0; 1,1,1; 0,1,0])
imclose(person, neighborhood)
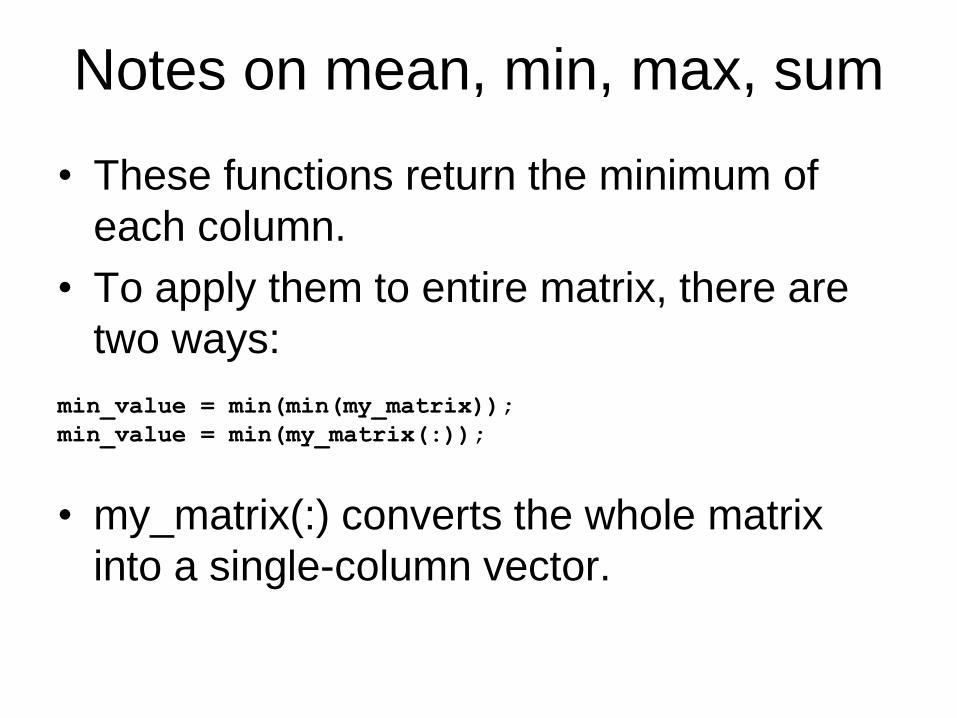
Notes on mean, min, max, sum
• These functions return the minimum of
each column.
• To apply them to entire matrix, there are
two ways:
min_value = min(min(my_matrix));
min_value = min(my_matrix(:));
• my_matrix(:) converts the whole matrix
into a single-column vector.

Information from Color
• Color can provide useful information about
object location and shape.
– Morphological operations can help refine that
information.
• A simple example: finding boundaries of a
tennis court.

• Extract each of the three color bands.
• Identify red areas:
• Identify green areas:
Tennis Boundaries
red
filename = 'data/tennis_court2.jpg';
color = double(imread(filename));
r = color(:,:, 1);
g = color(:,:, 2);
b = color(:,:, 3);
red = ((r - g > 10) & (r - b > 10));
red = imdilate(red, ones(7,7));

Tennis Boundaries
• Extract each of the three color bands.
• Identify red areas:
• Identify green areas:
filename = 'data/tennis_court2.jpg';
color = double(imread(filename));
r = color(:,:, 1);
g = color(:,:, 2);
b = color(:,:, 3);
red = ((r - g > 10) & (r - b > 10));
red = imdilate(red, ones(7,7));
green
green = ((g - r > 10) & (g - b > 0));
green = imdilate(green, ones(7,7));

Tennis Boundaries
• Find boundary between red and green areas.
– Note: red and green were dilated (see Matlab
code on previous slide), so that their boundary is
part of both the red and the green area.
– We note that the boundaries
of the two courts are the
two largest connected
components.
boundary = (red & green);
green

Extracting the Boundaries
• Extract the first and second largest
connected component of the boundary
image.
– See code/get_component.m
b1 = get_component(boundary, 1);
b2 = get_component(boundary, 2);
figure(1); imshow(b1 | b2);
final result

Blurring
• Intuitively: replacing each pixel value with a
weighted average of values in its
neighborhood.
– Simplest: N x N neighborhood, all weights equal.
original = double(imread('walkstraight/frame0062.tif'));
kernel = ones(5,5) / 25;
blurred = imfilter(original, kernel);
original blurred

Blurring
• What happens if we increase the kernel
size?
original = double(imread('walkstraight/frame0062.tif'));
kernel = ones(5,5) / 25;
blurred = imfilter(original, kernel);
original blurred

Blurring
• What happens if we increase the kernel
size?
– More blurring.
original = double(imread('walkstraight/frame0062.tif'));
kernel = ones(5,5) / 25;
blurred = imfilter(original, kernel);
original blurred
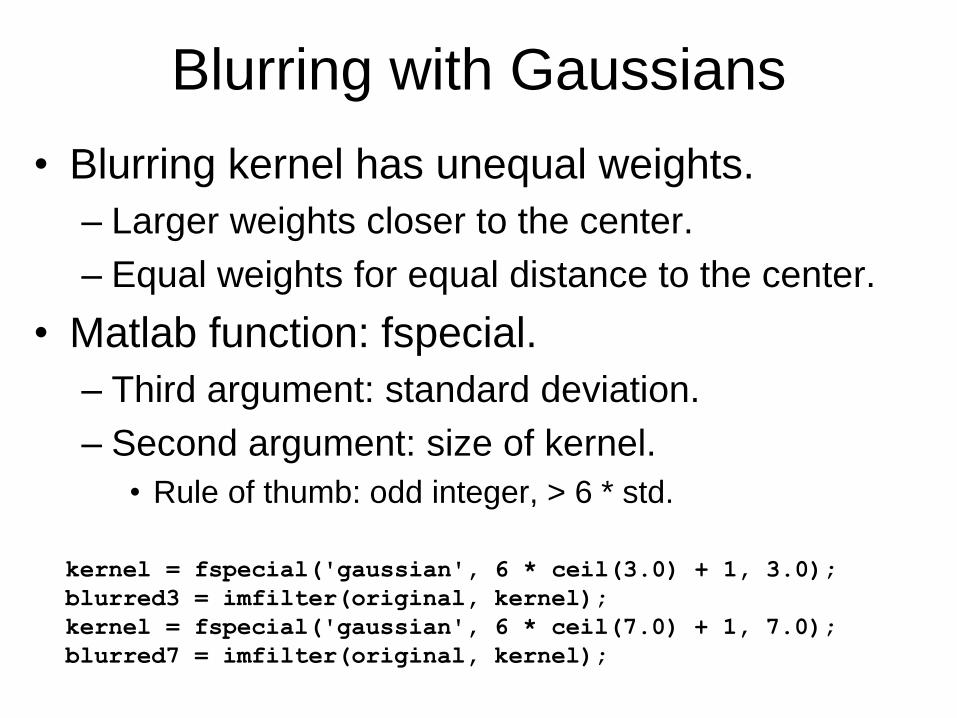
Blurring with Gaussians
• Blurring kernel has unequal weights.
– Larger weights closer to the center.
– Equal weights for equal distance to the center.
• Matlab function: fspecial.
– Third argument: standard deviation.
– Second argument: size of kernel.
• Rule of thumb: odd integer, > 6 * std.
kernel = fspecial('gaussian', 6 * ceil(3.0) + 1, 3.0);
blurred3 = imfilter(original, kernel);
kernel = fspecial('gaussian', 6 * ceil(7.0) + 1, 7.0);
blurred7 = imfilter(original, kernel);

Blurring with Gaussians
original
blurred3 (std = 3) blurred7 (std = 7)

Why Blur?
• Can remove a lot of noise.
• Throws away details we want to ignore.
• Emphasizes larger-scale structures.
• Creates smoother images.
– Useful for some optimization methods, such
as gradient descent, that we will study later.
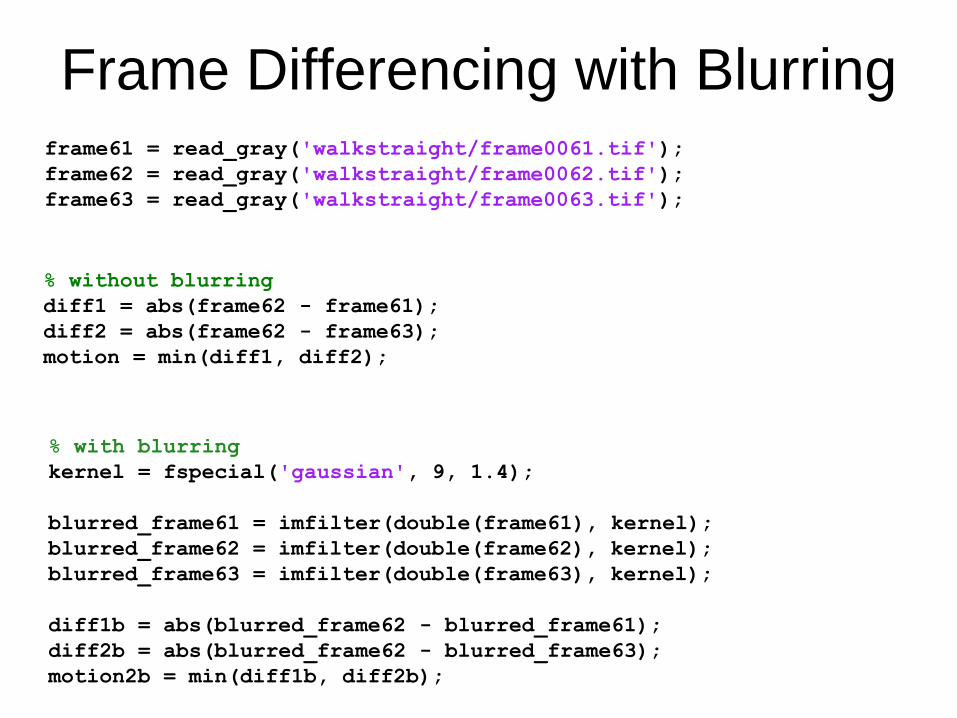
Frame Differencing with Blurring frame61 = read_gray('walkstraight/frame0061.tif');
frame62 = read_gray('walkstraight/frame0062.tif');
frame63 = read_gray('walkstraight/frame0063.tif');
% without blurring
diff1 = abs(frame62 - frame61);
diff2 = abs(frame62 - frame63);
motion = min(diff1, diff2);
% with blurring
kernel = fspecial('gaussian', 9, 1.4);
blurred_frame61 = imfilter(double(frame61), kernel);
blurred_frame62 = imfilter(double(frame62), kernel);
blurred_frame63 = imfilter(double(frame63), kernel);
diff1b = abs(blurred_frame62 - blurred_frame61);
diff2b = abs(blurred_frame62 - blurred_frame63);
motion2b = min(diff1b, diff2b);

Results
original
motion > 3
(no blurring)
motion2 > 3
(blurring, std = 1.4)

Linear Filtering
• Linear filtering is the exact same operation as
convolution with a kernel/filter.
• If:
– kernel has 2M+1 rows, 2N+1 cols.
– input is the original image, of U rows and V cols.
– result is the output of convolution.
• Then convolution can be coded as:
result = zeros(U, V);
for i = (M+1):(U-M)
for j = (N+1):(V-N)
result(i,j) = sum(sum(kernel .* input((i-M):(i+M), (j-N):(j+N))));
end
end
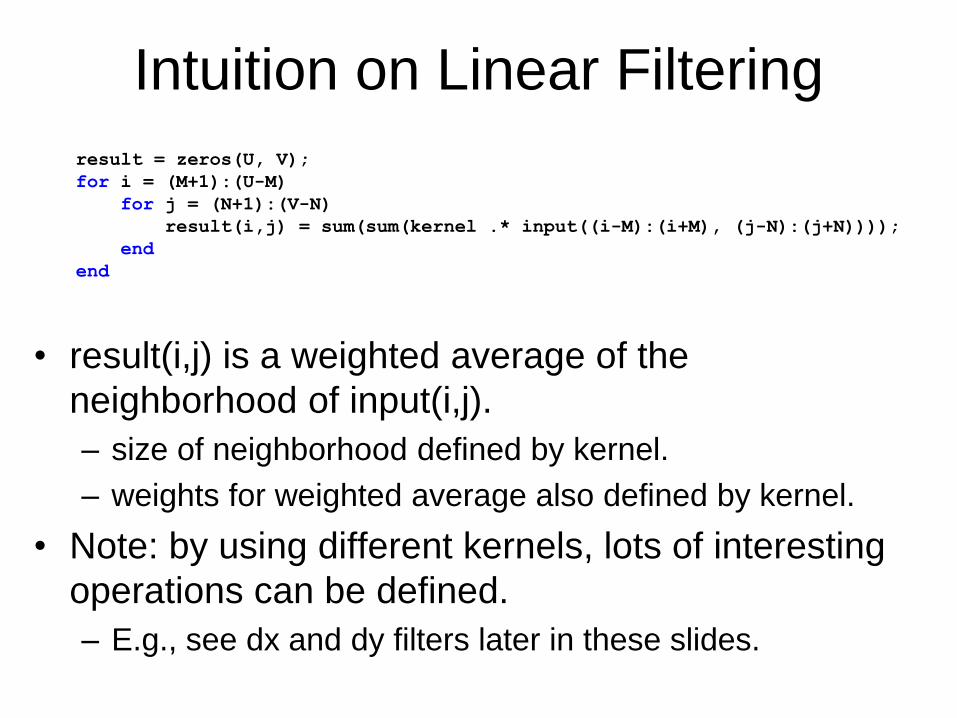
Intuition on Linear Filtering
• result(i,j) is a weighted average of the
neighborhood of input(i,j).
– size of neighborhood defined by kernel.
– weights for weighted average also defined by kernel.
• Note: by using different kernels, lots of interesting
operations can be defined.
– E.g., see dx and dy filters later in these slides.
result = zeros(U, V);
for i = (M+1):(U-M)
for j = (N+1):(V-N)
result(i,j) = sum(sum(kernel .* input((i-M):(i+M), (j-N):(j+N))));
end
end

Nonlinear vs. Linear Filters
• Linear filters are convolutions with a kernel.
– In Matlab, use imfilter, or filter2.
• Nonlinear filters are not convolutions.
– The result value at a pixel is a function of the original
values in a neighborhood of that pixel.
– Each nonlinear filter must be implemented as a
separate function.
• Examples of nonlinear filters:
– Thresholding.
– Non-maxima suppression (see lecture on edge
detection).