Getting From Problem to Solution: Reducing Diesel Pollution From Goods Movement
33
Getting From Problem to Solution: Reducing Diesel Pollution From Goods Movement Rich Kassel September 23, 2011 [email protected]
-
Upload
cedric-mccall -
Category
Documents
-
view
18 -
download
0
description
Getting From Problem to Solution: Reducing Diesel Pollution From Goods Movement. Rich Kassel September 23, 2011 [email protected]. Introduction: A Vision of Goods Movement. We all want and need stuff—more all the time - PowerPoint PPT Presentation
Transcript of Getting From Problem to Solution: Reducing Diesel Pollution From Goods Movement
Getting From Problem to Solution: Reducing Diesel Pollution From
Goods Movement
Rich KasselSeptember 23, [email protected]
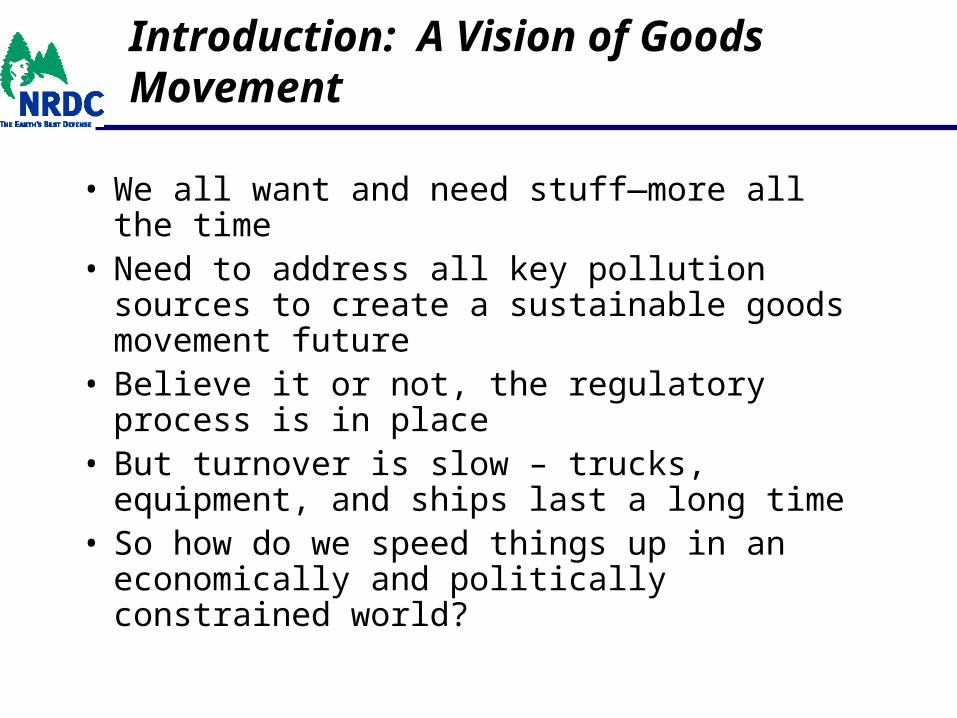
Introduction: A Vision of Goods Movement
• We all want and need stuff—more all the time• Need to address all key pollution sources to
create a sustainable goods movement future• Believe it or not, the regulatory process is in
place• But turnover is slow – trucks, equipment, and
ships last a long time• So how do we speed things up in an
economically and politically constrained world?

How the Dump Dirty Diesels Campaign began…
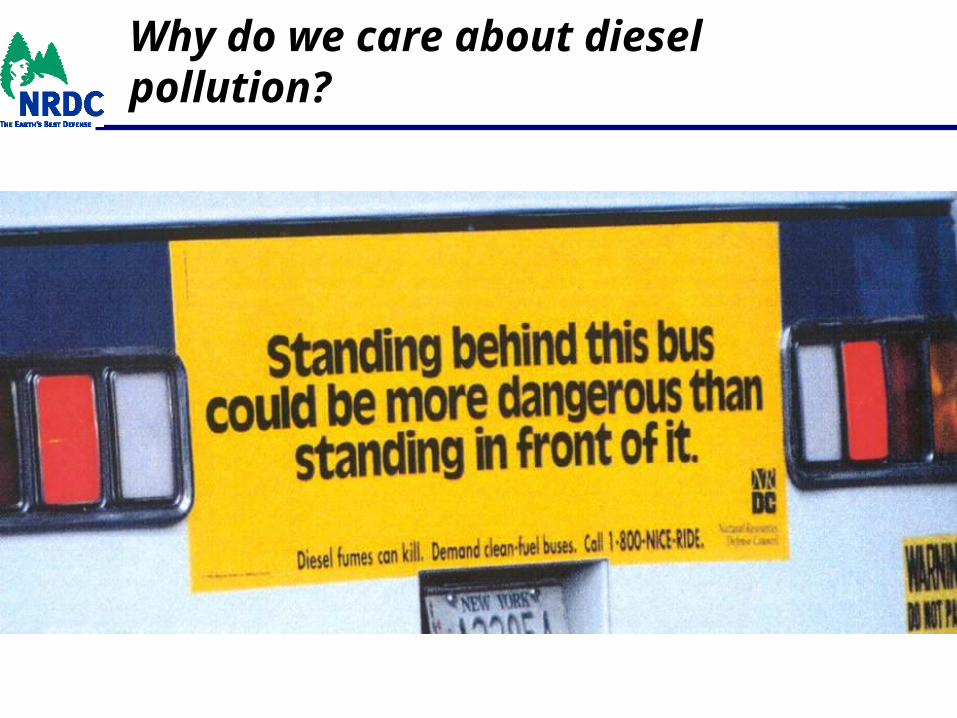
Why do we care about diesel pollution?
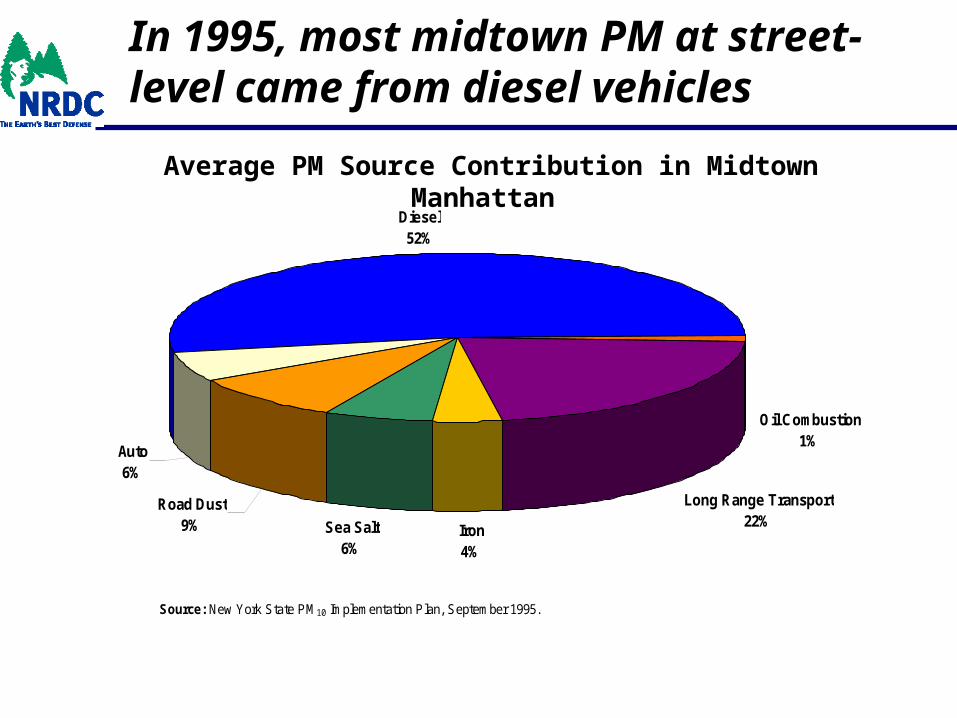
In 1995, most midtown PM at street-level came from diesel vehicles
Average PM Source Contribution in Midtown Manhattan
Diesel52%
Oil Combustion1%
Long Range Transport22%
Iron4%
Sea Salt6%
Road Dust9%
Auto6%
Source: New York State PM10 Implementation Plan, September 1995.

MTA New York City Transit Bus Fleet EmissionsAnnual PM Emissions
0
50
100
150
200
250
300
1995 1996 1997 1998 1999 2000 2001 2002 2003 2004 2005 2006
To
ns
per
yea
r
97% Reduction
NYC Transit Clean-Fuel Bus Program showed Clean Diesels possible
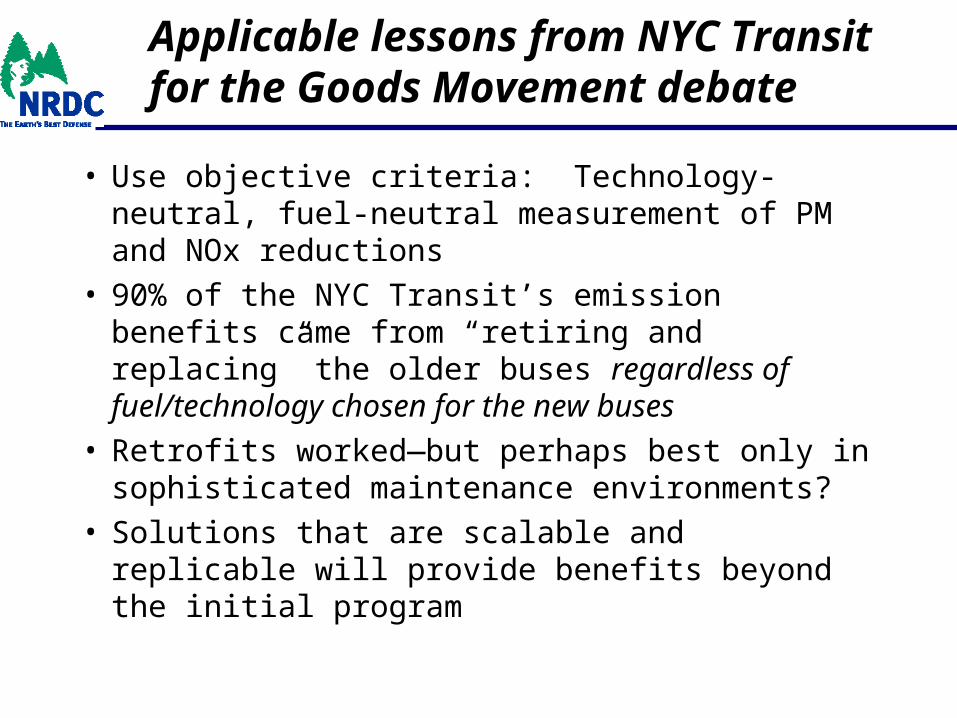
Applicable lessons from NYC Transit for the Goods Movement debate
• Use objective criteria: Technology-neutral, fuel-neutral measurement of PM and NOx reductions
• 90% of the NYC Transit’s emission benefits came from “retiring and replacing” the older buses regardless of fuel/technology chosen for the new buses
• Retrofits worked—but perhaps best only in sophisticated maintenance environments?
• Solutions that are scalable and replicable will provide benefits beyond the initial program
A Bit of Context: Goods Movement impacts
In A Few Quick Slides
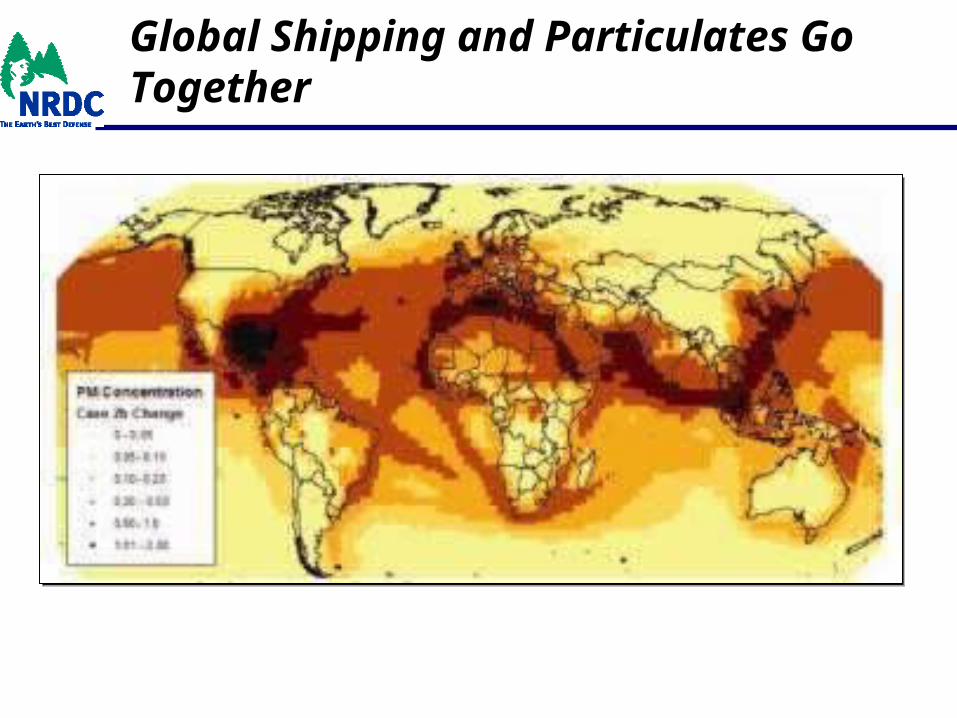
Global Shipping and Particulates Go Together
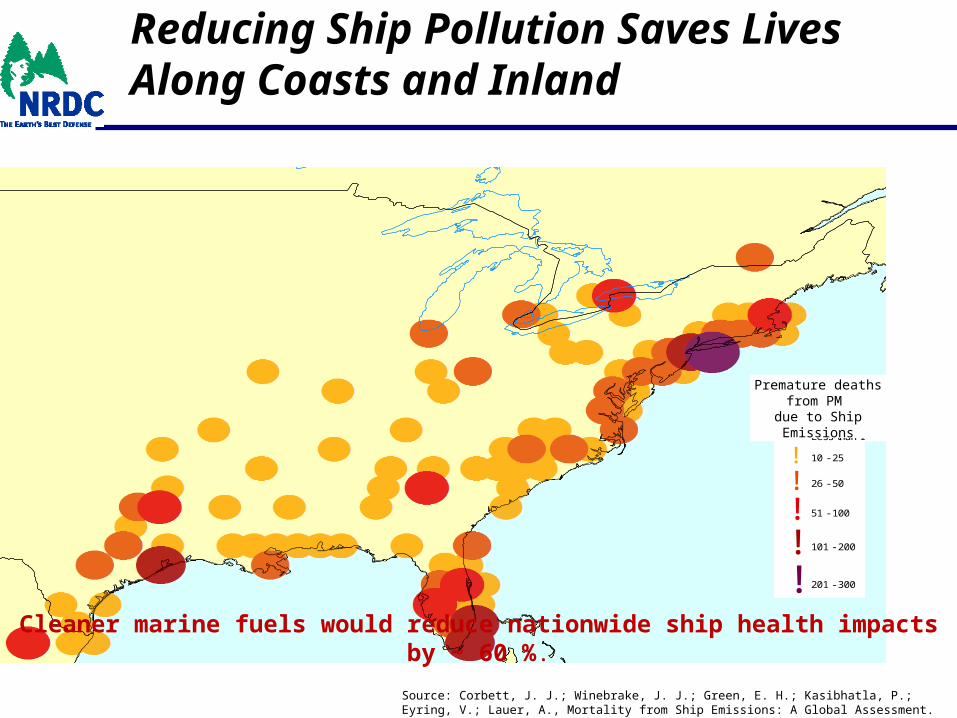
Reducing Ship Pollution Saves Lives Along Coasts and Inland
Source: Corbett, J. J.; Winebrake, J. J.; Green, E. H.; Kasibhatla, P.; Eyring, V.; Lauer, A., Mortality from Ship Emissions: A Global Assessment. Environmental Science & Technology 2007, 41, (24), 8512–8518
Premature deaths from PM
due to Ship Emissions
Cleaner marine fuels would reduce nationwide ship health impacts by ~ 60 %.
Case 2b MortalityCardiopulmonary
Less than 10
! 10 - 25
! 26 - 50
! 51 - 100
! 101 - 200
! 201 - 300
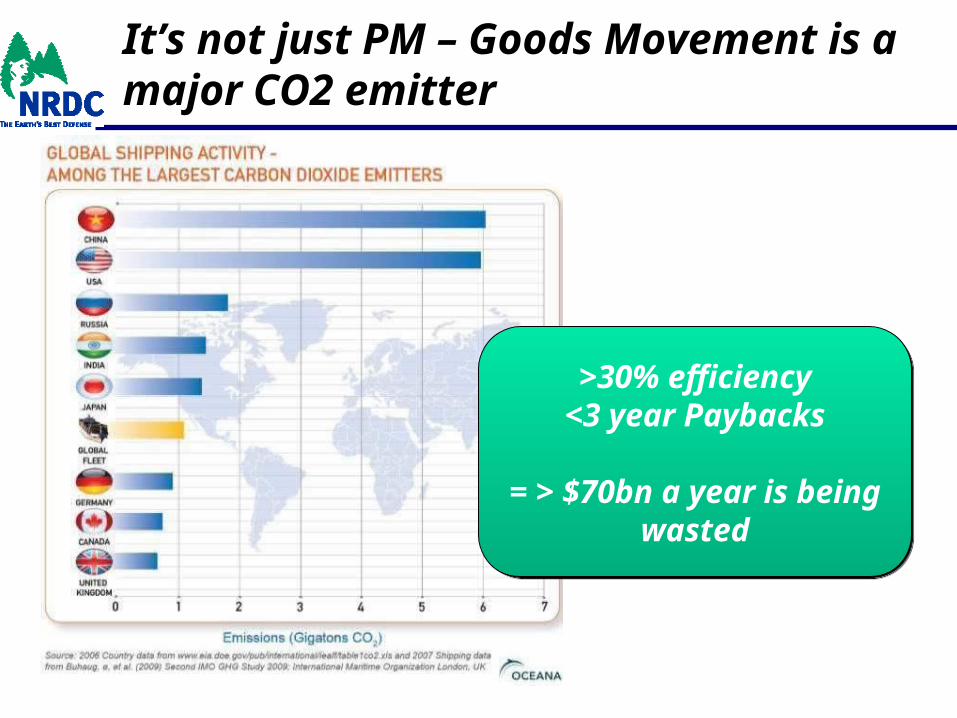
It’s not just PM – Goods Movement is a major CO2 emitter
>30% efficiency<3 year Paybacks
= > $70bn a year is being wasted
>30% efficiency<3 year Paybacks
= > $70bn a year is being wasted

Older ship engines are so dirty…
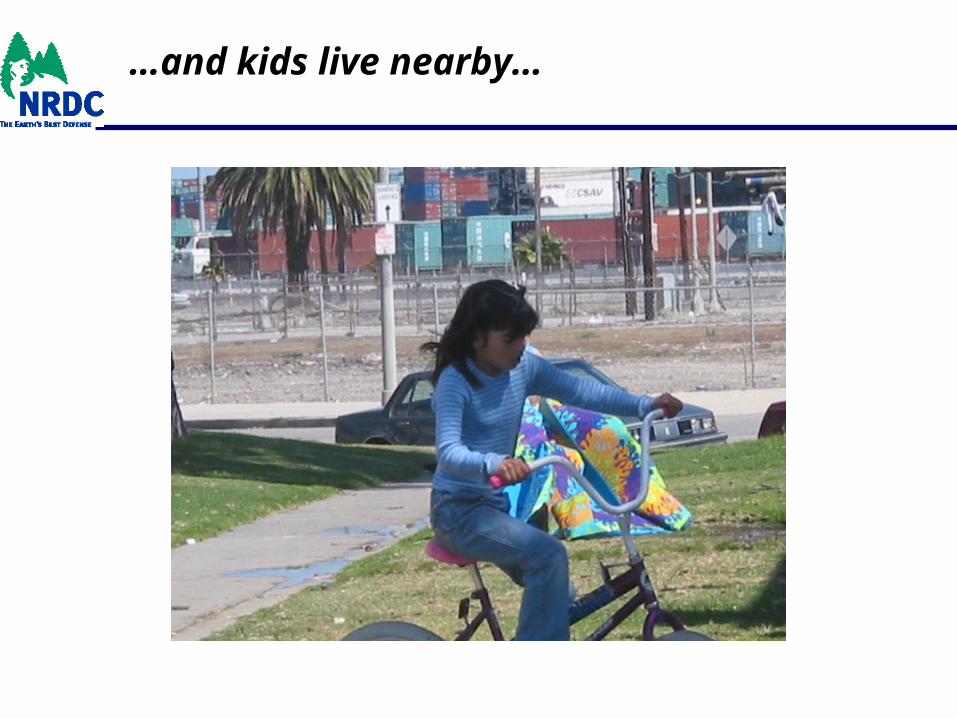
…and kids live nearby…
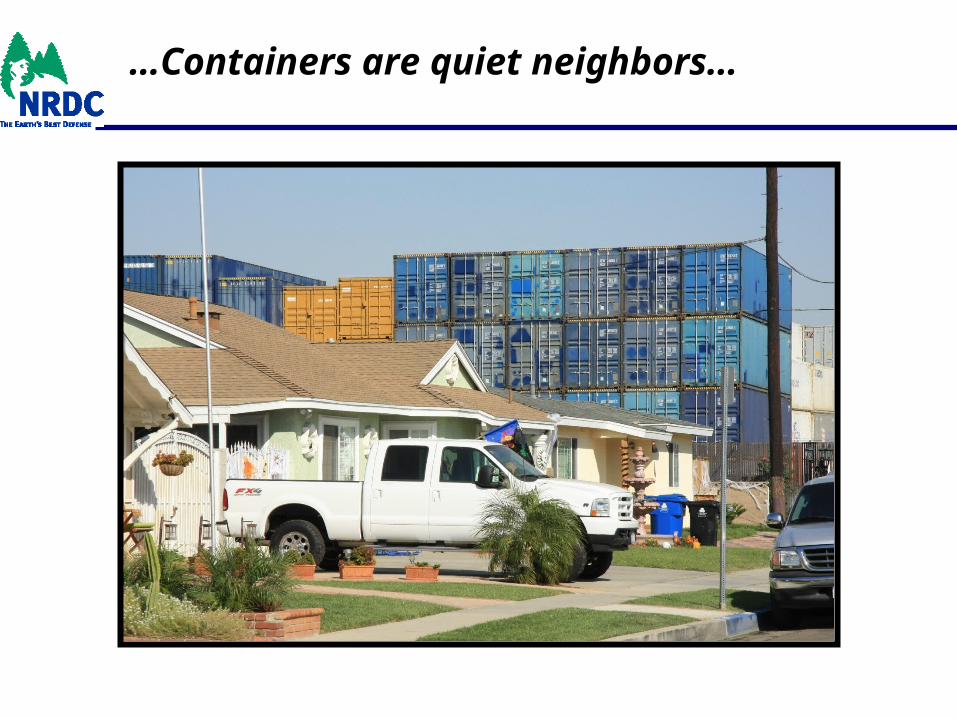
…Containers are quiet neighbors…

…until the train shows up to get them…
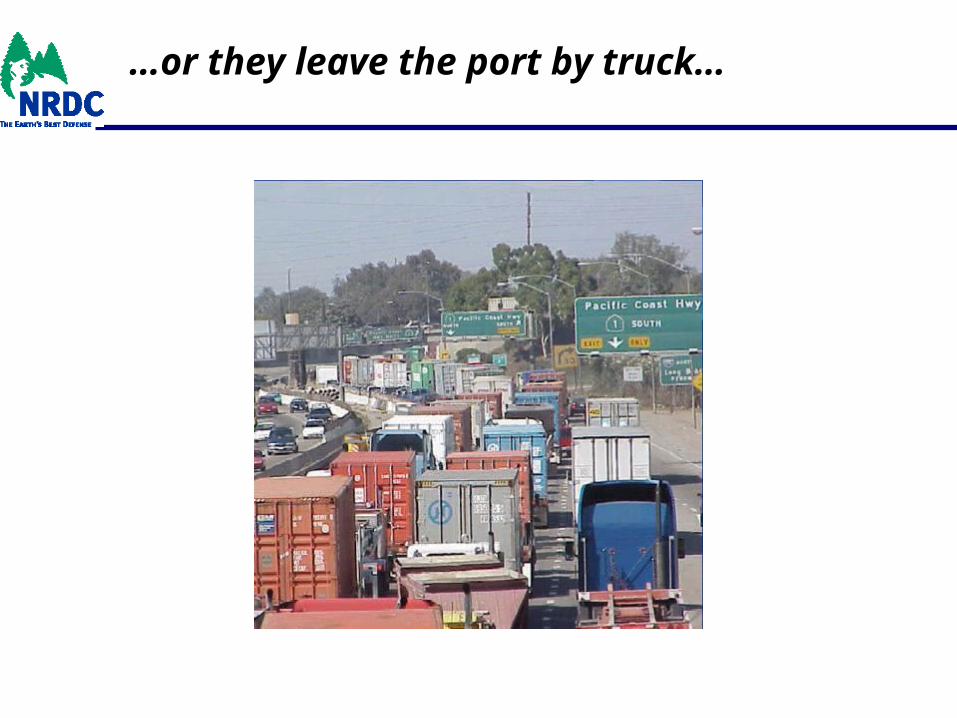
…or they leave the port by truck…
The Regulatory Structure is in Place

EPA truck standards are cleanest in the world…but old trucks are dirty
0.010.01 0.100.10
0.20.2
1.21.2
2.52.5
4.04.0
5.05.0
1994
1998
2002
2007
2010010
NO
x
NO
x [
g/H
P-h
r][g
/HP
-hr]
PM PM [g/HP-hr][g/HP-hr]
ULSDULSD15 PPM15 PPM
(7/06)
500 PPM500 PPM(6/93)
SULFURSULFUR
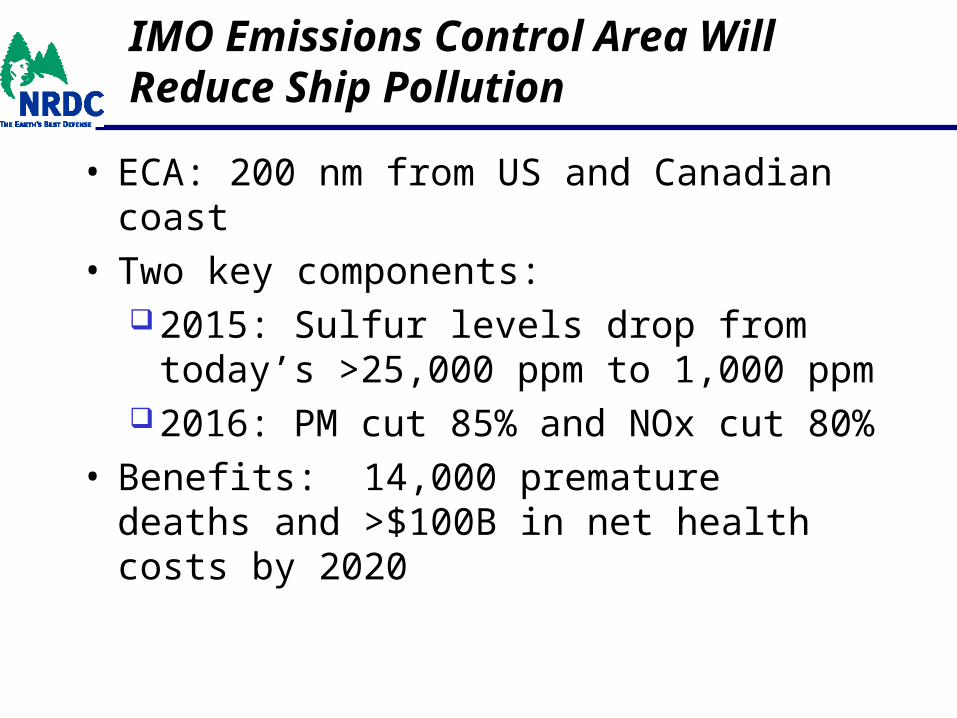
IMO Emissions Control Area Will Reduce Ship Pollution
• ECA: 200 nm from US and Canadian coast• Two key components:
2015: Sulfur levels drop from today’s >25,000 ppm to 1,000 ppm
2016: PM cut 85% and NOx cut 80%• Benefits: 14,000 premature deaths and
>$100B in net health costs by 2020
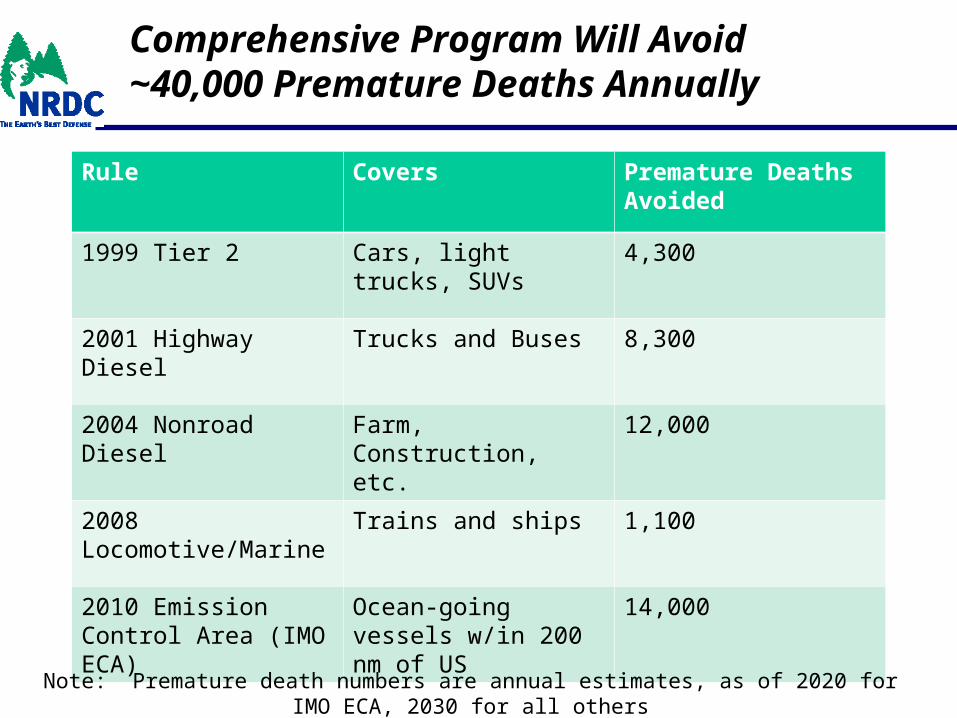
Comprehensive Program Will Avoid ~40,000 Premature Deaths Annually
Rule Covers Premature Deaths Avoided
1999 Tier 2 Cars, light trucks, SUVs 4,300
2001 Highway Diesel Trucks and Buses 8,300
2004 Nonroad Diesel Farm, Construction, etc. 12,000
2008 Locomotive/Marine Trains and ships 1,100
2010 Emission Control Area (IMO ECA)
Ocean-going vessels w/in 200 nm of US
14,000
Note: Premature death numbers are annual estimates, as of 2020 for IMO ECA, 2030 for all others

U.S. Vehicle Regulations Are Extremely Cost-Effective
0 20 40 60 80 100 120
2010 IMO ECA
2008 Locomotive-Marine
2004 Nonroad Diesel
2001 Truck and Bus Rule
1999 Tier 2 Light-Duty
$ Billion Annually in 2030
Total Cost: approx. $13 Total Cost: approx. $13 BillionBillionTotal Benefits: approx. Total Benefits: approx. $290 Billion$290 Billion
CostsBenefits

…But These Engines Last for Decades, So We Need to Accelerate
the Phase-out…
2 Examples of Drayage Clean-up Worth Exploring


Example 1: POLA Clean Air Action Plan
• Resulted from NRDC’s China Shipping lawsuit.
• Addressed all major sources of port pollution: trucks, ships, trains, cargo handling equipment.
• Set firm goals for reductions of diesel particulate matter from each source.

Solutions in the Clean Air Action Plan
• Diesel trucks: Progressive ban on older trucks Cargo container fee on dirty trucks Structural change in employment structure
• Ships: Cold ironing Cleaner fuel Speed reduction
• Cargo handling equipment: Electrification
• Trains: Anti-idling recommendations
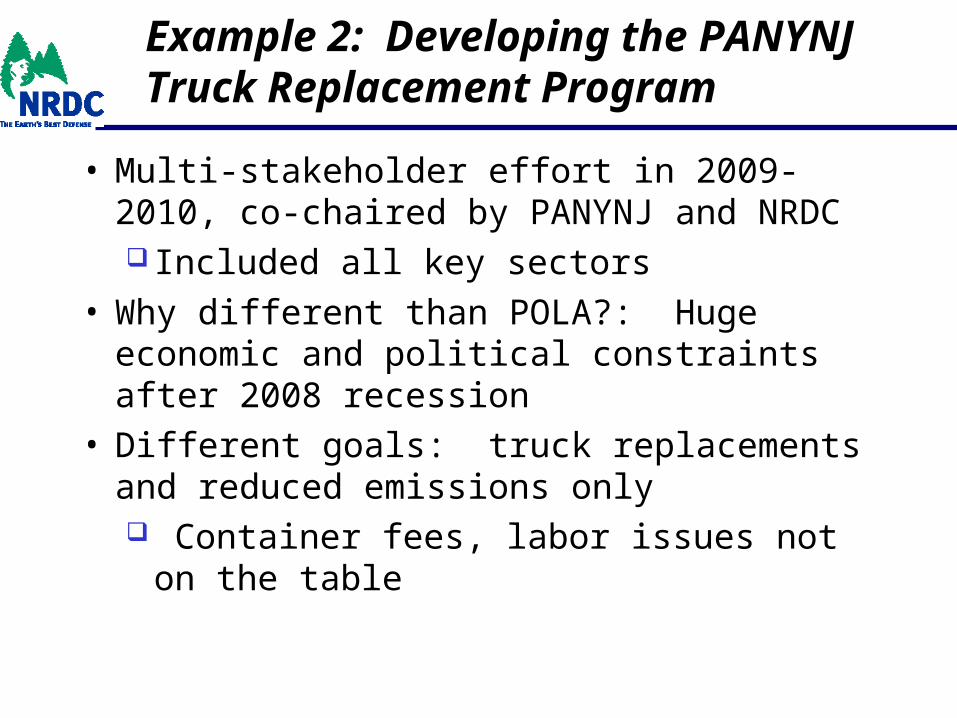
Example 2: Developing the PANYNJ Truck Replacement Program
• Multi-stakeholder effort in 2009-2010, co-chaired by PANYNJ and NRDC Included all key sectors
• Why different than POLA?: Huge economic and political constraints after 2008 recession
• Different goals: truck replacements and reduced emissions only Container fees, labor issues not on the
table

PANYNJ Truck Replacement and Phase Out Programs
• Truck Phase Out Program Phase 1: Ban pre-1994 NY engines, as of Jan. 2011 Phase 2: Ban pre-2007 engines, as of Jan. 2017 Trucks register in Drayage Truck Registry, voluntary sticker system
• Truck Replacement Program (TRP): Received 180 applications for 202 trucks (72% IOO) 63 trucks sold (70% IOO) Eligibility now expanded to trucks with 2003 or older engines
• Supplemental TRP $1.57M EPA grant; $4.3M PA funds (financing @5.25%) Eligibility: Trucks with engines 2003 or older Replacement vehicle must be 2007 emission compliant
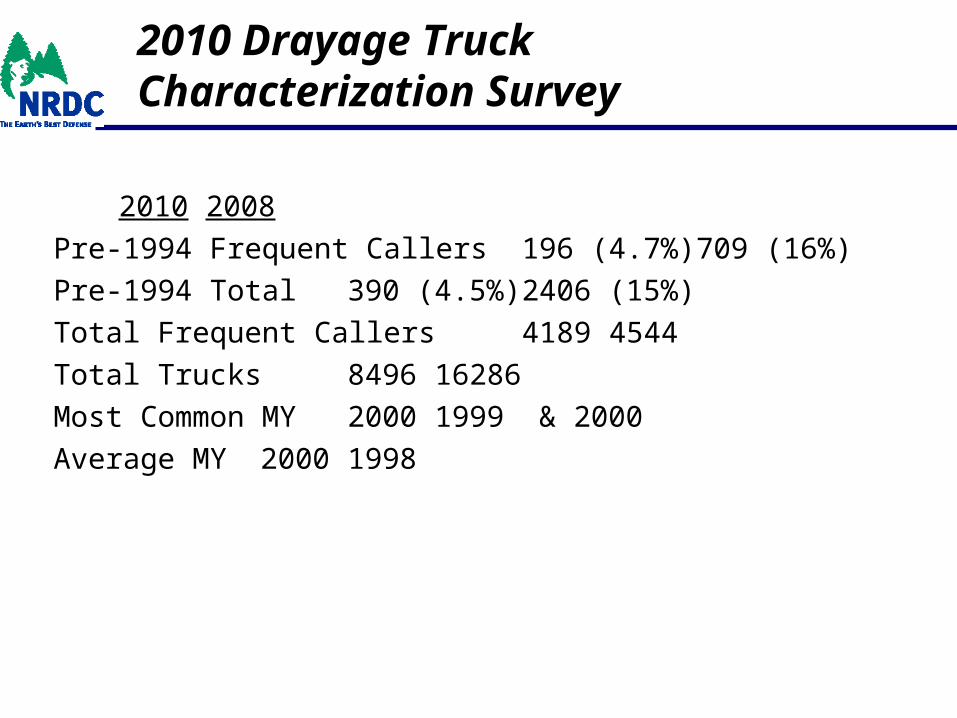
2010 Drayage Truck Characterization Survey
2010 2008
Pre-1994 Frequent Callers 196 (4.7%) 709 (16%)
Pre-1994 Total 390 (4.5%) 2406 (15%)
Total Frequent Callers 4189 4544
Total Trucks 8496 16286
Most Common MY 2000 1999 & 2000
Average MY 2000 1998
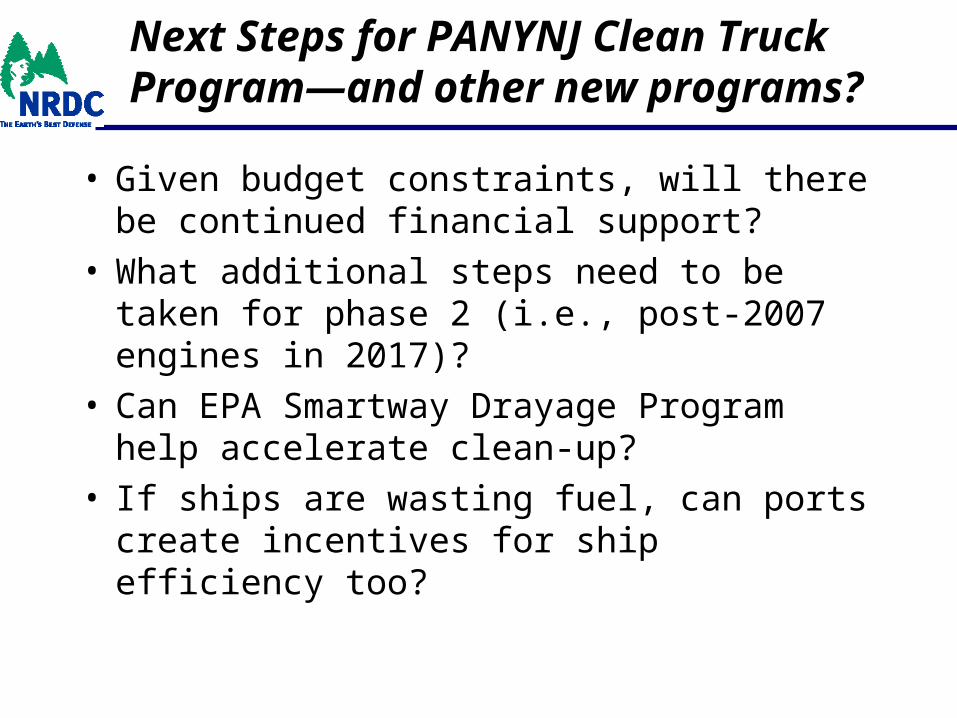
Next Steps for PANYNJ Clean Truck Program—and other new programs?
• Given budget constraints, will there be continued financial support?
• What additional steps need to be taken for phase 2 (i.e., post-2007 engines in 2017)?
• Can EPA Smartway Drayage Program help accelerate clean-up?
• If ships are wasting fuel, can ports create incentives for ship efficiency too?
Conclusions
• Thanks to EPA and IMO regulations, new truck, equipment, and ship engines will be much cleaner than old models
• But turnover is very, very slow• No one-size-fits-all approach to accelerating
the clean-up: POLA and PANYNJ show different ways to eliminate old trucks
• Successful solutions must take into account needs of all stakeholders and local environmental, economic, and political conditions

If A Picture is Worth A Thousand Words, How Much Are These Two
Slides Worth?
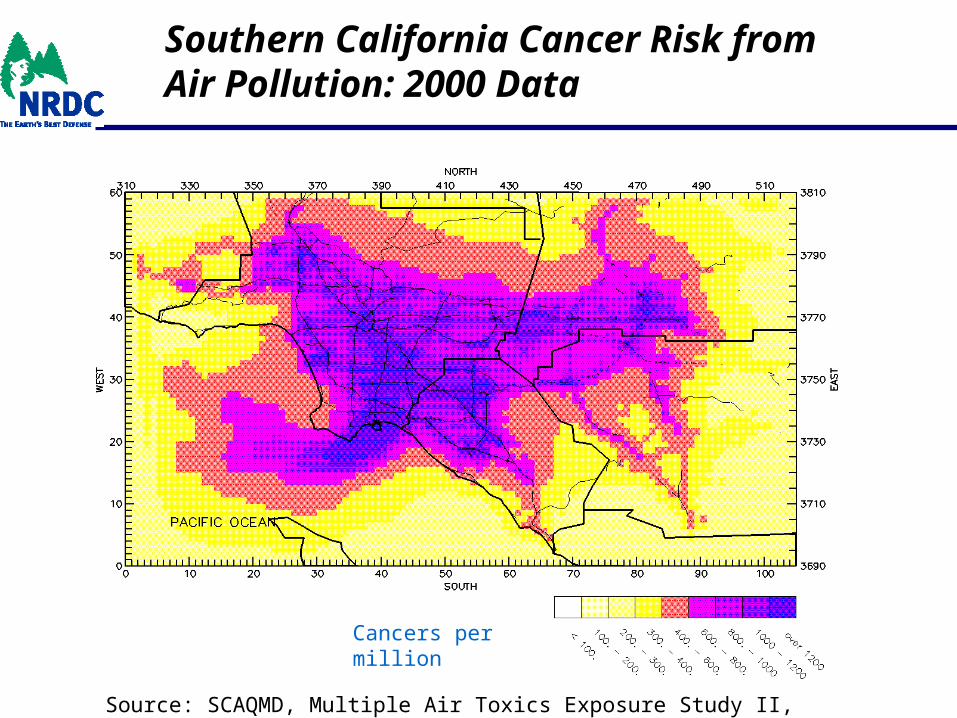
Southern California Cancer Risk from Air Pollution: 2000 Data
Source: SCAQMD, Multiple Air Toxics Exposure Study II, March 2000
Cancers per million

So. CA Cancer Risk from Air Pollution: When All Trucks, Equipment, and Ships are Clean
Source: SCAQMD, Multiple Air Toxics Exposure Study II, March 2000
Cancers per million