Get the most from your Merrill Lynch statement · 3 Get your statement your way Your Merrill Lynch...
22
Learn about its features and benefits Get the most from your Merrill Lynch statement
Transcript of Get the most from your Merrill Lynch statement · 3 Get your statement your way Your Merrill Lynch...
Learn about its features and benefits
Get the most from your Merrill Lynch statement
1 For more information please visit corporateinsight.com2 For more information please visit WWW.DALBAR.COMMerrill Lynch Wealth Management makes available products and services offered by Merrill Lynch, Pierce, Fenner & Smith Incorporated, a registered broker-dealer and Member SIPC, and other subsidiaries of Bank of America Corporation (“BofA Corp.”).Banking products are provided by Bank of America, N.A., and affiliated banks, Members FDIC and wholly owned subsidiaries of BofA Corp.Investment products:
Are Not FDIC Insured Are Not Bank Guaranteed May Lose Value
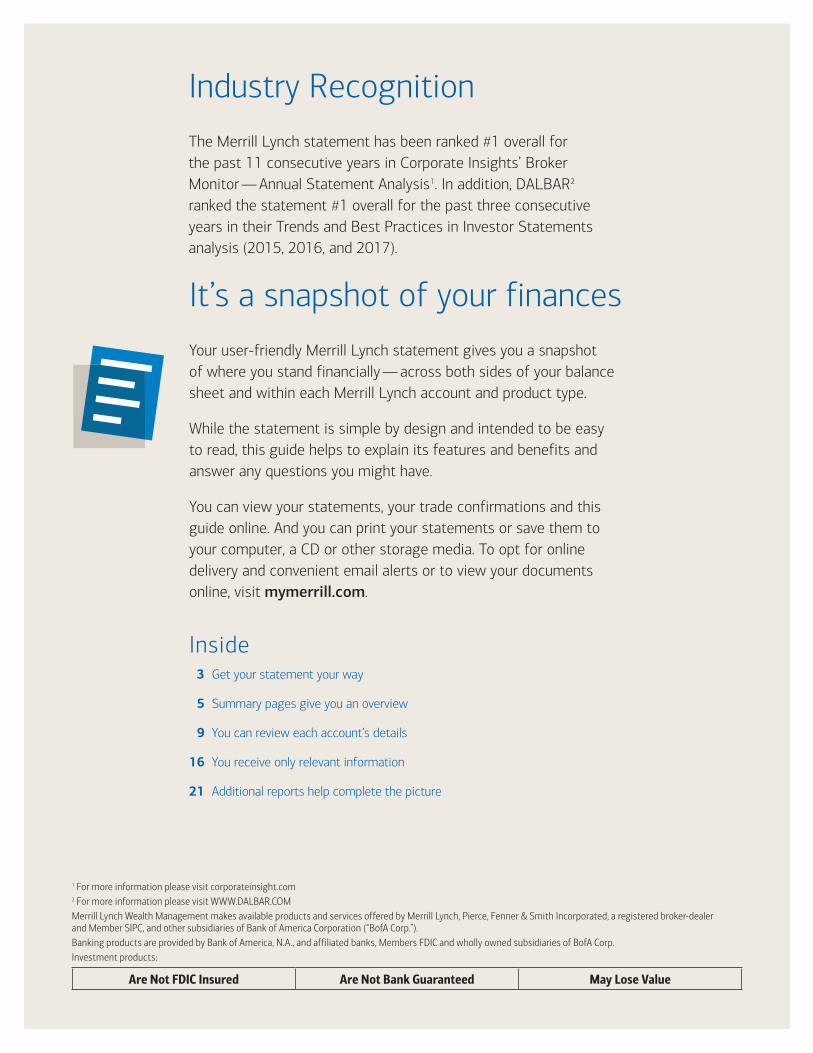
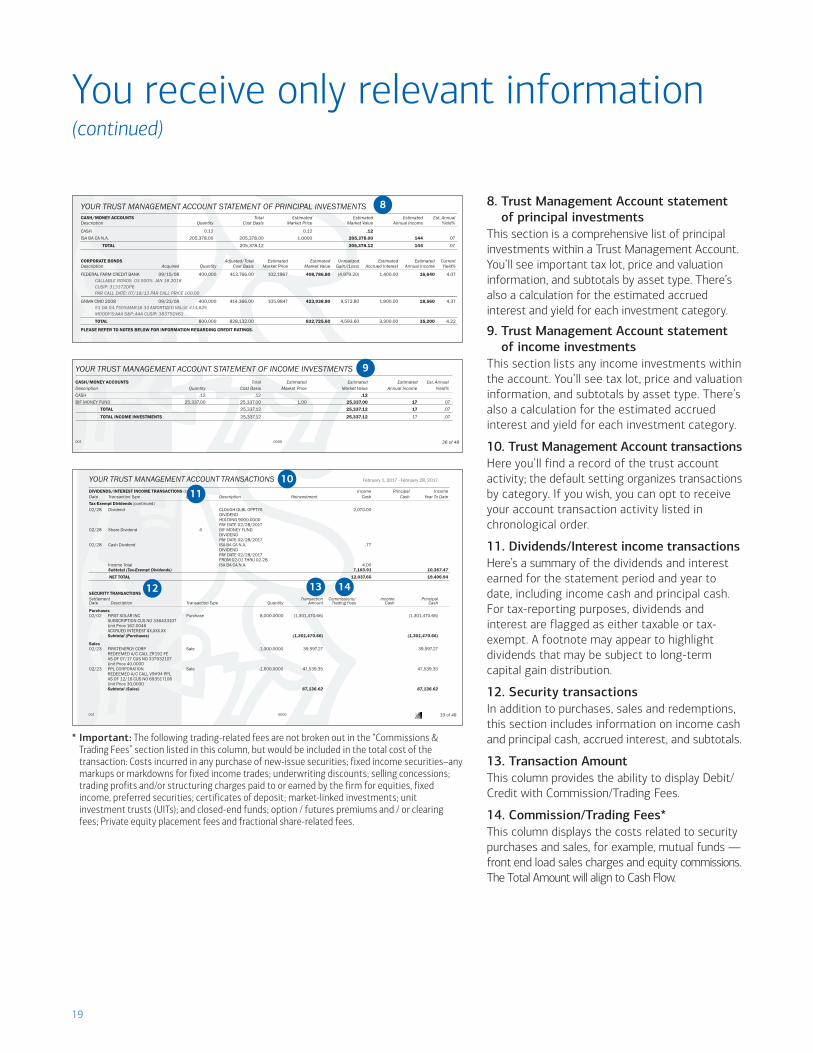
Your user-friendly Merrill Lynch statement gives you a snapshot of where you stand financially — across both sides of your balance sheet and within each Merrill Lynch account and product type.
While the statement is simple by design and intended to be easy to read, this guide helps to explain its features and benefits and answer any questions you might have.
You can view your statements, your trade confirmations and this guide online. And you can print your statements or save them to your computer, a CD or other storage media. To opt for online delivery and convenient email alerts or to view your documents online, visit mymerrill.com.
It’s a snapshot of your finances
Inside 3 Get your statement your way
5 Summary pages give you an overview
9 You can review each account’s details
16 You receive only relevant information
21 Additional reports help complete the picture
The Merrill Lynch statement has been ranked #1 overall for the past 11 consecutive years in Corporate Insights’ Broker Monitor — Annual Statement Analysis 1. In addition, DALBAR 2 ranked the statement #1 overall for the past three consecutive years in their Trends and Best Practices in Investor Statements analysis (2015, 2016, and 2017).
Industry Recognition
3
Get your statement your wayYour Merrill Lynch statement is based directly on our clients’ recommendations and preferences, which we uncovered through extensive research conducted throughout the country. You’ll find that the statement is logical and easy to use. You’ll also find relevant Merrill Lynch phone numbers, Web addresses, and your financial advisor’s name and contact information throughout the statement in case you need to get more information.
The statement brings together key information about your investments, retirement savings, credit and lending, estate planning services, and business finances where appropriate. Plus, you can choose optional features, like including an amortization/accretion schedule or selecting how you want your statement delivered to you.
Convenient online delivery
To cut down on the amount of paper mail you receive, you can sign up for secure online delivery. You’ll get your statements two to three days faster, and you can view, save or print them. You’ll also be able to access statements from the past seven years.
Your options for online statement delivery and access include:
• Online delivery for all accounts. You receive an email notification when your statements are available online, with no paper statement mailed.
• Mail summary only. The statement summary section is sent to you in the mail, with detail sections available electronically for you to view online.
• Delivery options by account. Choose either paper mail or online delivery on an account-by-account basis. You can choose the exact combination of delivery options you want for each account.
• One-click statement view. With online access, you can view, download, save or print your entire linked statement package into a single PDF file.
• Date-range download. You can download, save or print multiple statement PDFs from various time frames into a single PDF.
You can choose online delivery for other account records too, such as performance reports, trade confirmations, prospectuses, tax statements, notices and disclosures, and shareholder notices.
• Third-party online access. You can designate read-only online access to a third party, such as a family member, lawyer or accountant. They can review account balances, activity, and monthly brokerage and tax statements for any authorized account.
• Statement repagination. This allows you the flexibility to select specific statements from a linked statement package and renumber them so you’ll have a version with a page count specific to that statement.
To enroll in online delivery, log into MyMerrill.com.® From the Help & Support tab, select Paperless Settings under the Account Preferences section. You’ll be able to enter your delivery preference for monthly statements and other eligible account records.
Statement frequency options
For some account types, you can opt to receive summary pages on a monthly basis and the individual account statement details quarterly. Speak to your financial advisor to find out which accounts qualify for this feature.
4
Get your statement your wayLess mail with statement linking
By linking your eligible Merrill Lynch accounts, you’ll receive your statements together in one envelope. Linking your accounts allows you to receive account
summary pages along with detail pages for each account in the linked relationship. It may also make you eligible to earn higher interest rates by putting you in a higher asset tier. Contact your financial advisor to learn more.
Streamlined retirement statement
To help simplify your financial life, some clients who have certain retirement accounts, or who just want a more simplified statement, might be eligible
to receive a streamlined version of the retirement statement so it’s easier to understand your investment holdings and activity.
The streamlined version of the retirement statement presents information in a logical, clear and easy-to-read design that resembles other Merrill Lynch statements. Plus, it consolidates the individual tax lots and includes categorical holdings, account level “cash flow” and a separate listing of money fund transactions.
Personalized accounts
Nickname feature. You can personalize individual accounts in your statement link with unique identifiers by designating a nickname for each.
Customizable options you can choose
Account transaction activity. This default setting lists transactions by category and includes each transaction’s date, description, type, quantity, unit price and debit/ credit differentiation. As an alternative, you can opt to receive your account transaction activity listed in chronological order.
Alphabetical sort order for bonds. The default is maturity/callable date order; however, you can elect to have the bonds in the Asset section of your account listed in alphabetical order.
Amortization/Accretion schedule. You can opt in to receive an amortization/accretion schedule that provides additional details such as year to date, life to date, and adjusted total cost basis for certain fixed-income securities and/or bonds that you purchased at a premium or discount. The schedule is provided at the account level and will report open and closed lots at the security level.
5
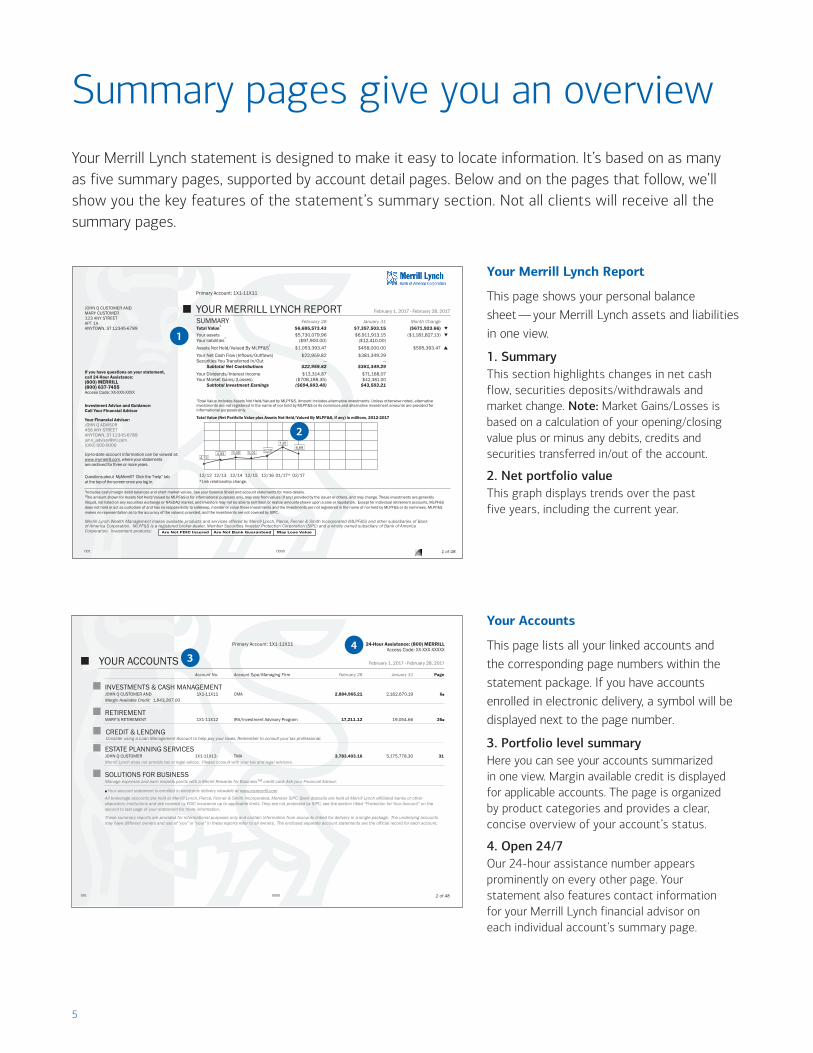
Summary pages give you an overviewYour Merrill Lynch statement is designed to make it easy to locate information. It’s based on as many as five summary pages, supported by account detail pages. Below and on the pages that follow, we’ll show you the key features of the statement’s summary section. Not all clients will receive all the summary pages.
Your Merrill Lynch Report
This page shows your personal balance sheet — your Merrill Lynch assets and liabilities in one view.
1. SummaryThis section highlights changes in net cash flow, securities deposits/withdrawals and market change. Note: Market Gains/Losses is based on a calculation of your opening/closing value plus or minus any debits, credits and securities transferred in/out of the account.
2. Net portfolio valueThis graph displays trends over the past five years, including the current year.
Your Accounts
This page lists all your linked accounts and the corresponding page numbers within the statement package. If you have accounts enrolled in electronic delivery, a symbol will be displayed next to the page number.
3. Portfolio level summaryHere you can see your accounts summarized in one view. Margin available credit is displayed for applicable accounts. The page is organized by product categories and provides a clear, concise overview of your account’s status.
4. Open 24/7Our 24-hour assistance number appears prominently on every other page. Your statement also features contact information for your Merrill Lynch financial advisor on each individual account’s summary page.
001 0000 1 of 48
JOHN Q CUSTOMER ANDMARY CUSTOMER123 ANY STREETAPT 1AANYTOWN, ST 12345-6789
If you have questions on your statement,call 24-Hour Assistance:(800) MERRILL(800) 637-7455Access Code: XX-XXX-XXXX
Investment Advice and Guidance:Call Your Financial Advisor
Your Financial Advisor:JOHN Q ADVISOR456 ANY STREETANYTOWN, ST [email protected](000) 000-0000
Up-to-date account information can be viewed at:www.mymerrill.com, where your statements are archived for three or more years.
Questions about MyMerrill? Click the “help” tab at the top of the screen once you log in.
Primary Account: 1X1-11X11
� YOUR MERRILL LYNCH REPORT February 1, 2017 - February 28, 2017
SUMMARY February 28 January 31 Month Change Total Value
1$6,685,573.43 $7,357,503.15 ($671,923.66) q
Your assets $5,730,079.96 $6,911,913.15 ($1,181,827.13) q Your liabilities
2($97,900.00) ($12,410.00)
Assets Not Held/Valued By MLPF&S3
$1,053,393.47 $458,000.00 $595,393.47 � Your Net Cash Flow (Inflows/Outflows) $22,959.82 $381,349.29 Securities You Transferred In/Out — —
Subtotal Net Contributions $22,959.82 $381,349.29
Your Dividends/Interest Income $13,314.87 $71,168.07 Your Market Gains/(Losses) ($708,198.35) $42,381.00
Subtotal Investment Earnings ($694,883.48) $43,583.21
1Total Value includes Assets Not Held/Valued by MLPF&S. Amount includes alternative investments. Unless otherwise noted, alternative investments are not registered in the name of nor held by MLPF&S or its nominees and alternative investment amounts are provided for informational purposes only.
Total Value (Net Portfolio Value plus Assets Not Held/Valued By MLPF&S, if any) in millions, 2012-2017
Are Not FDIC Insured Are Not Bank Guaranteed May Lose ValueCorporation. Investment products:
12/12 12/13 12/14 12/15 12/16 01/17* 02/17*Link relationship change.
2Includes cash/margin debit balances and short market values. See your Balance Sheet and account statements for more details.3The amount shown for Assets Not Held/Valued by MLPF&S is for informational purposes only, may vary from values (if any) provided by the issuer or others, and may change. These investments are generally illiquid, not listed on any securities exchange or NASDAQ market, and investors may not be able to sell them or realize amounts shown upon a sale or liquidation. Except for individual retirement accounts, MLPF&S does not hold or act as custodian of and has no responsibility to safekeep, monitor or value these investments and the investments are not registered in the name of nor held by MLPF&S or its nominees. MLPF&S makes no representation as to the accuracy of the value(s) provided, and the investments are not covered by SIPC.
Merrill Lynch Wealth Management makes available products and services offered by Merrill Lynch, Pierce, Fenner & Smith Incorporated (MLPF&S) and other subsidiaries of Bank of America Corporation. MLPF&S is a registered broker-dealer, Member Securities Investor Protection Corporation (SIPC) and a wholly owned subsidiary of Bank of America
5.05 6.50
7.356.68
4.724.93 5.01
1
2
001 0000 2 of 48
Primary Account: 1X1-11X11 24-Hour Assistance: (800) MERRILLAccess Code: XX-XXX-XXXXX
� YOUR ACCOUNTS February 1, 2017 - February 28, 2017
Account No. Account Type/Managing Firm February 28 January 31 Page
� INVESTMENTS & CASH MANAGEMENTJOHN Q CUSTOMER AND 1X1-11X11 CMA 2,884,965.21 2,162,670.19 6�
Margin Available Credit: 1,843,267.00
� RETIREMENTMARY’S RETIREMENT 1X1-11X12 IRA/Investment Advisory Program 17,211.12 19,054.66 26�
� CREDIT & LENDINGConsider using a Loan Management Account to help pay your taxes. Remember to consult your tax professional.
� ESTATE PLANNING SERVICESJOHN Q CUSTOMER 1X1-11X13 TMA 3,783,403.16 5,175,778.30 31Merrill Lynch does not provide tax or legal advice. Please consult with your tax and legal advisors.
� SOLUTIONS FOR BUSINESSManage expenses and earn rewards points with a Merrill Rewards for BusinessTM credit card. Ask your Financial Advisor.
� Your account statement is enrolled in electronic delivery viewable at www.mymerrill.com
All brokerage accounts are held at Merrill Lynch, Pierce, Fenner & Smith Incorporated, Member SIPC. Bank deposits are held at Merrill Lynch affiliated banks or other depository institutions and are covered by FDIC insurance up to applicable limits. They are not protected by SIPC, see the section titled "Protection for Your Account" on the second to last page of your statement for more information.
These summary reports are provided for informational purposes only and contain information from accounts linked for delivery in a single package. The underlying accounts may have different owners and use of “you” or “your” in these reports refer to all owners. The enclosed separate account statements are the official record for each account.
34
6
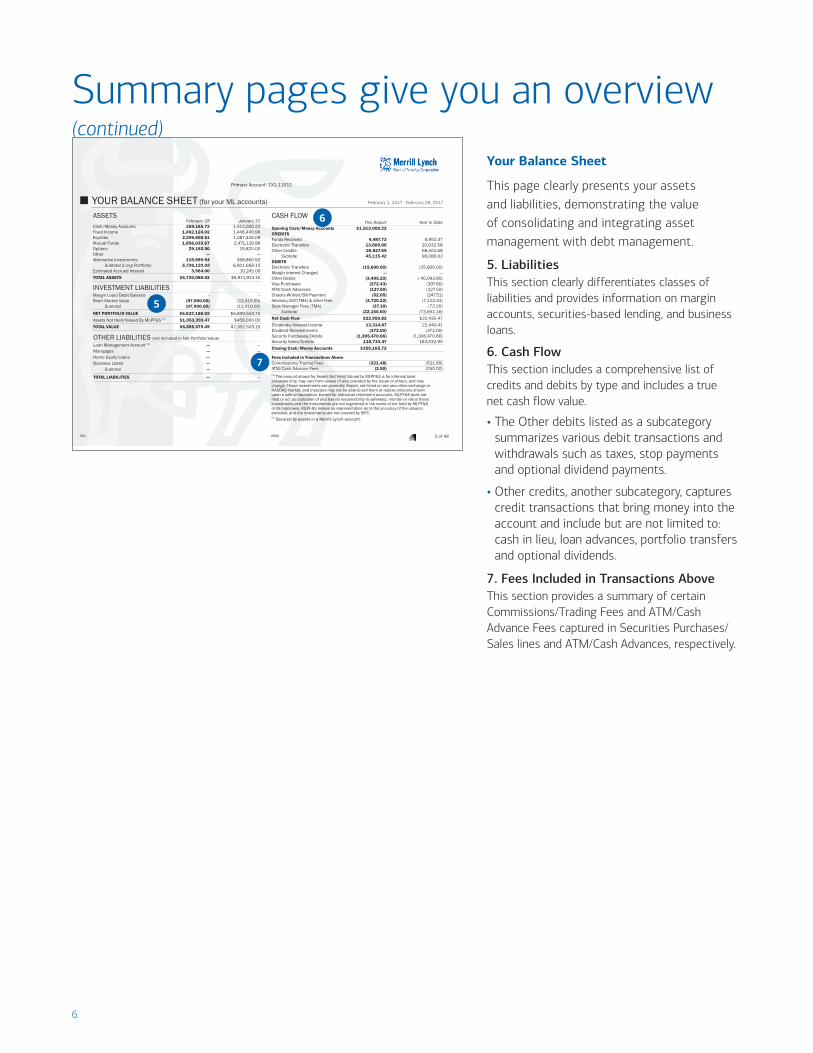
Summary pages give you an overview
(continued)Your Balance Sheet
This page clearly presents your assets and liabilities, demonstrating the value of consolidating and integrating asset management with debt management.
5. LiabilitiesThis section clearly differentiates classes of liabilities and provides information on margin accounts, securities-based lending, and business loans.
6. Cash Flow This section includes a comprehensive list of credits and debits by type and includes a true net cash flow value.
• The Other debits listed as a subcategory summarizes various debit transactions and withdrawals such as taxes, stop payments and optional dividend payments.
• Other credits, another subcategory, captures credit transactions that bring money into the account and include but are not limited to: cash in lieu, loan advances, portfolio transfers and optional dividends.
7. Fees Included in Transactions AboveThis section provides a summary of certain Commissions/Trading Fees and ATM/Cash Advance Fees captured in Securities Purchases/Sales lines and ATM/Cash Advances, respectively.
001 0000 3 of 48
Primary Account: 1X1-11X11
� YOUR BALANCE SHEET (for your ML accounts) February 1, 2017 - February 28, 2017
ASSETSFebruary 28 January 31
Cash/Money Accounts 359,165.72 1,512,000.22Fixed Income 1,062,124.02 1,446,440.96Equities 2,299,600.51 1,087,426.09Mutual Funds 1,856,033.67 2,471,119.96Options 29,192.50 15,820.00Other — —Alternative Investments 119,999.54 368,860.92 Subtotal (Long Portfolio) 5,726,122.02 6,901,668.15
Estimated Accrued Interest 3,964.00 10,245.00TOTAL ASSETS $5,730,086.02 $6,911,913.15
INVESTMENT LIABILITIESMargin Loan/Debit Balance -- --Short Market Value (97,900.00) (12,410.00) Subtotal (97,900.00) (12,410.00)
NET PORTFOLIO VALUE $5,632,186.02 $6,899,503.15Assets Not Held/Valued By MLPF&S (1) $1,053,393.47 $458,000.00TOTAL VALUE $6,685,579.49 $7,357,503.15
OTHER LIABILITIES (not included in Net Portfolio Value)Loan Management Account (1) — —Mortgages — —Home Equity Loans — —Business Loans — — Subtotal — —
TOTAL LIABILITIES — —
CASH FLOWThis Report Year to Date
Opening Cash/Money Accounts $1,512,000.22CREDITSFunds Received 4,487.73 6,952.37Electronic Transfers 13,800.00 20,632.58Other Credits 26,827.69 68,501.68 Subtotal 45,115.42 96,086.63DEBITSElectronic Transfers (15,600.00) (25,600.00)Margin Interest Charged — —Other Debits (3,495.22) ( 40,093.95)Visa Purchases (272.43) (397.66)ATM/Cash Advances (127.50) (127.50)Checks Written/Bill Payment (52.05) (247.51)Advisory/UST(TMA) & other fees (3,720.22) (7,112.34)Style Manager Fees (TMA) (37.10) (72.20) Subtotal (22,155.60) (73,651.16)
Net Cash Flow $22,959.82 $22,435.47Dividends/Interest Income 13,314.87 22,440.41Dividend Reinvestments (372.00) (372.00)Security Purchases/Debits (1,305,470.66) (1,306,470.66)Security Sales/Credits 116,733.47 163,532.90Closing Cash/Money Accounts $359,165.72
Fees Included in Transactions AboveCommissions/Trading Fees (321.48) (521.69)ATM/Cash Advance Fees (2.50) (250.00)(1) The amount shown for Assets Not Held/Valued by MLPF&S is for informationalpurposes only, may vary from values (if any) provided by the issuer or others, and maychange. These investments are generally illiquid, not listed on any securities exchange orNASDAQ market, and investors may not be able to sell them or realize amounts shownupon a sale or liquidation. Except for individual retirement accounts, MLPF&S does nothold or act as custodian of and has no responsibility to safekeep, monitor or value theseinvestments and the investments are not registered in the name of nor held by MLPF&Sor its nominees. MLPF&S makes no representation as to the accuracy of the value(s)provided, and the investments are not covered by SIPC.(2) Secured by assets in a Merrill Lynch account.
5
6
7
7
Summary pages give you an overview
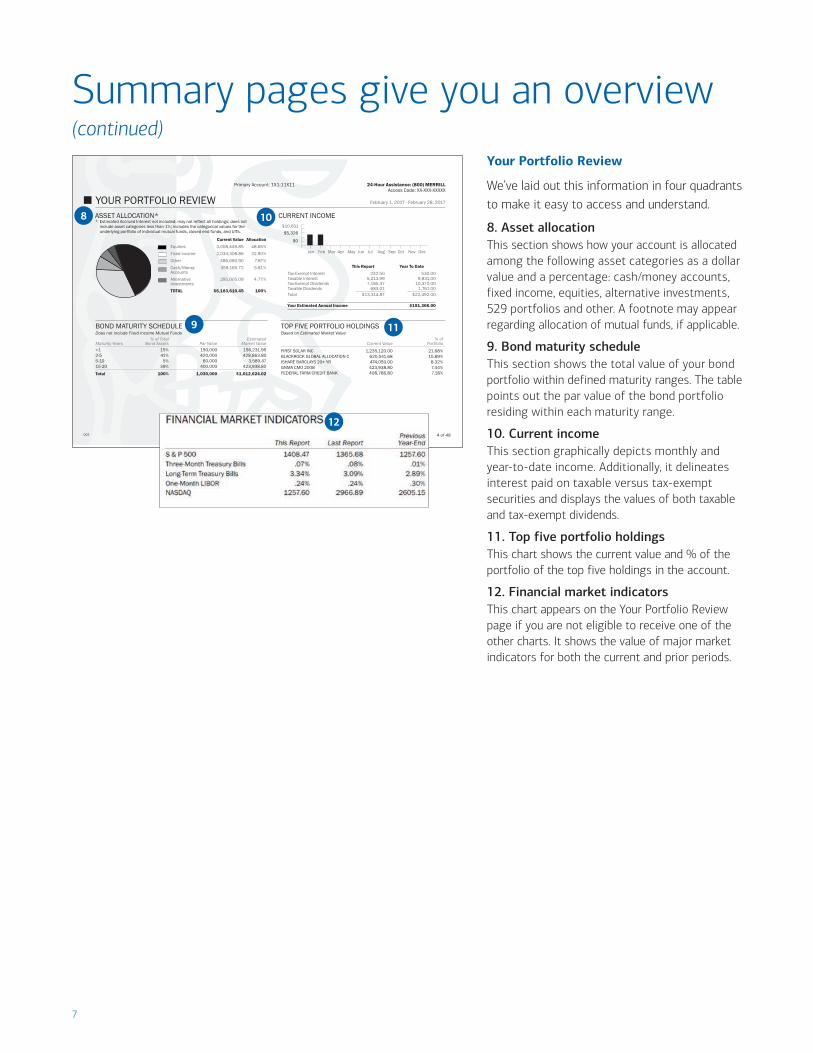
(continued)Your Portfolio Review
We’ve laid out this information in four quadrants to make it easy to access and understand.
8. Asset allocationThis section shows how your account is allocated among the following asset categories as a dollar value and a percentage: cash/money accounts, fixed income, equities, alternative investments, 529 portfolios and other. A footnote may appear regarding allocation of mutual funds, if applicable.
9. Bond maturity scheduleThis section shows the total value of your bond portfolio within defined maturity ranges. The table points out the par value of the bond portfolio residing within each maturity range.
10. Current incomeThis section graphically depicts monthly and year-to-date income. Additionally, it delineates interest paid on taxable versus tax-exempt securities and displays the values of both taxable and tax-exempt dividends.
11. Top five portfolio holdingsThis chart shows the current value and % of the portfolio of the top five holdings in the account.
12. Financial market indicatorsThis chart appears on the Your Portfolio Review page if you are not eligible to receive one of the other charts. It shows the value of major market indicators for both the current and prior periods.
001 0000 4 of 48
Primary Account: 1X1-11X11 24-Hour Assistance: (800) MERRILLAccess Code: XX-XXX-XXXXX
� YOUR PORTFOLIO REVIEW February 1, 2017 - February 28, 2017
CURRENT INCOME$10,651
Jan Feb Mar Apr May Jun Jul Aug Sep Oct Nov Dec
Current Value AllocationEquities 3,008,449.85 48.65%Fixed income 2,034,308.86 32.90%Other 486,680.90 7.87%Cash/Money 359,165.72 5.81%AccountsAlternative 295,005.09 4.77%InvestmentsTOTAL $6,183,610.45 100%
ASSET ALLOCATION** Estimated Accrued Interest not included; may not reflect all holdings; does not
include asset categories less than 1%; includes the categorical values for theunderlying portfolio of individual mutual funds, closed end funds, and UITs.
TOP FIVE PORTFOLIO HOLDINGSBased on Estimated Market Value
% ofCurrent Value Portfolio
FIRST SOLAR INC 1,235,120.00 21.68%BLACKROCK GLOBAL ALLOCATION C 620,541.68 10.89%ISHARE BARCLAYS 20+ YR 474,050.00 8.32%GNMA CMO 2008 423,938.80 7.44%FEDERAL FARM CREDIT BANK 408,786.80 7.18%
BOND MATURITY SCHEDULEDoes not include Fixed Income Mutual Funds
% of Total EstimatedMaturity Years Bond Assets Par Value Market Value<1 15% 150,000 156,231.952-5 41% 420,000 428,863.805-10 5% 60,000 3,589.4715-20 39% 400,000 423,938.80
Total 100% 1,030,000 $1,012,624.02
This Report Year To DateTax-Exempt Interest 232.50 530.00Taxable Interest 5,213.99 9,831.00Tax-Exempt Dividends 7,185.37 10,370.00Taxable Dividends 683.01 1,761.00 ���������������������������������� ����������������������������������
Total $13,314.87 $22,492.00
Your Estimated Annual Income $151,366.00
8
9
12
11
10
8
Summary pages give you an overview
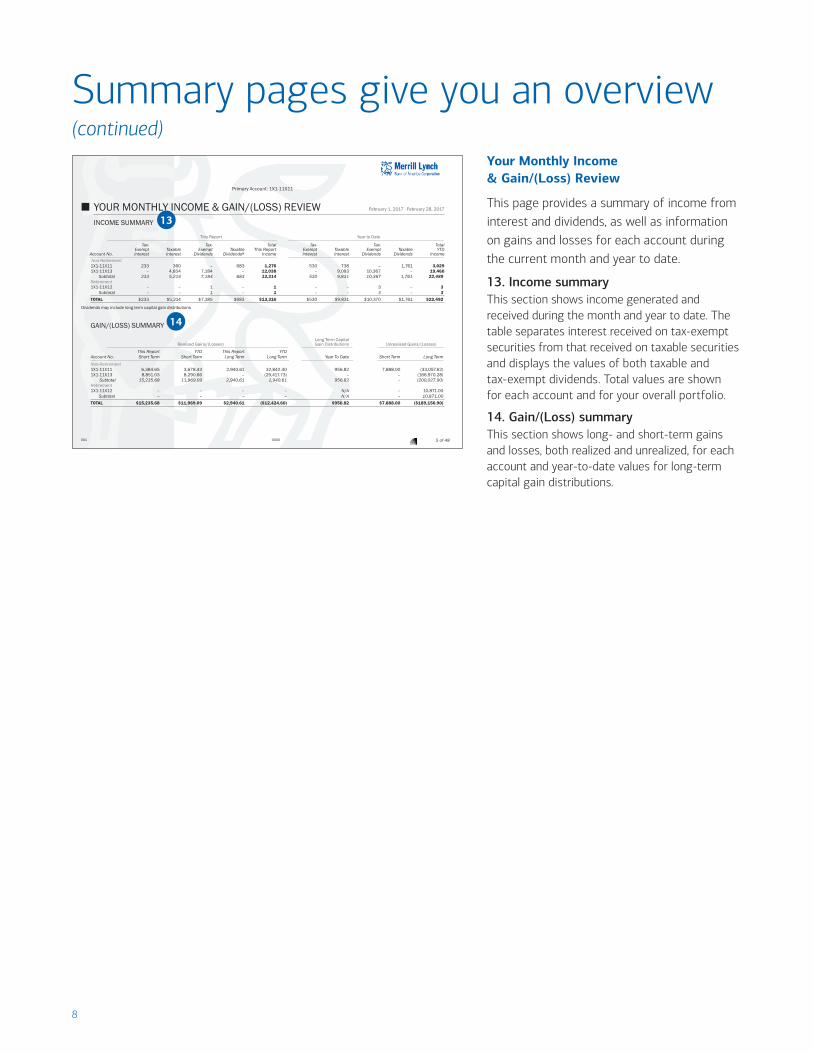
(continued)Your Monthly Income & Gain/(Loss) Review
This page provides a summary of income from interest and dividends, as well as information on gains and losses for each account during the current month and year to date.
13. Income summaryThis section shows income generated and received during the month and year to date. The table separates interest received on tax-exempt securities from that received on taxable securities and displays the values of both taxable and tax-exempt dividends. Total values are shown for each account and for your overall portfolio.
14. Gain/(Loss) summaryThis section shows long- and short-term gains and losses, both realized and unrealized, for each account and year-to-date values for long-term capital gain distributions.
001 0000 5 of 48
Primary Account: 1X1-11X11
� YOUR MONTHLY INCOME & GAIN/(LOSS) REVIEW February 1, 2017 - February 28, 2017
INCOME SUMMARY
This Report Year to Date���������������������������������������������������������������������������������������������������������������������������������������������������������������������������������������������������������� �����������������������������������������������������������������������������������������������������������������������������������������������������������������������������������������
Tax- Tax- Total Tax- Tax- TotalExempt Taxable Exempt Taxable This Report Exempt Taxable Exempt Taxable YTD
Account No. Interest Interest Dividends Dividends» Income Interest Interest Dividends Dividends Income������������������������������������������������������������������������������������������������������������������������������������������������������������������������������������������������������������������������������� �����������������������������������������������������������������������������������������������������������������������������������������������������������������������������������������
Non-Retirement 1X1-11X11 233 360 – 683 1,276 530 738 – 1,761 3,029 1X1-11X13 – 4,854 7,184 – 12,038 – 9,093 10,367 – 19,460
Subtotal 233 5,214 7,184 683 13,314 530 9,831 10,367 1,761 22,489 Retirement 1X1-11X12 – – 1 – 1 – – 3 – 3
Subtotal – – 1 – 1 – – 3 – 3
TOTAL $233 $5,214 $7,185 $683 $13,316 $530 $9,831 $10,370 $1,761 $22,492
Dividends may include long term capital gain distributions
GAIN/(LOSS) SUMMARY
Long Term CapitalRealized Gains/(Losses) Gain Distributions Unrealized Gains/(Losses)
����������������������������������������������������������������������������������������������������������������������������������������������������������������������������������������������������������������������� ������������������������������������������������������������ �������������������������������������������������������������������������������
This Report YTD This Report YTD Account No. Short Term Short Term Long Term Long Term Year To Date Short Term Long Term
�������������������������������������������������������������������������������������������������������������������������������������������������������������������������������������������������������������������������������������������� ������������������������������������������������������������� �������������������������������������������������������������������������������
Non-Retirement 1X1-11X11 6,384.65 3,678.43 2,940.61 32,842.40 956.82 7,888.00 (33,057.62) 1X1-11X13 8,851.03 8,290.66 – (29,417.73) -- – (166,970.28)
Subtotal 15,235.68 11,969.09 2,940.61 2,940.61 956.82 – (200,027.90) Retirement 1X1-11X12 – – – – N/A – 10,871.00
Subtotal – – -- -- N/A – 10,871.00
TOTAL $15,235.68 $11,969.09 $2,940.61 ($12,424.60) $956.82 $7,888.00 ($189,156.90)
13
14
9
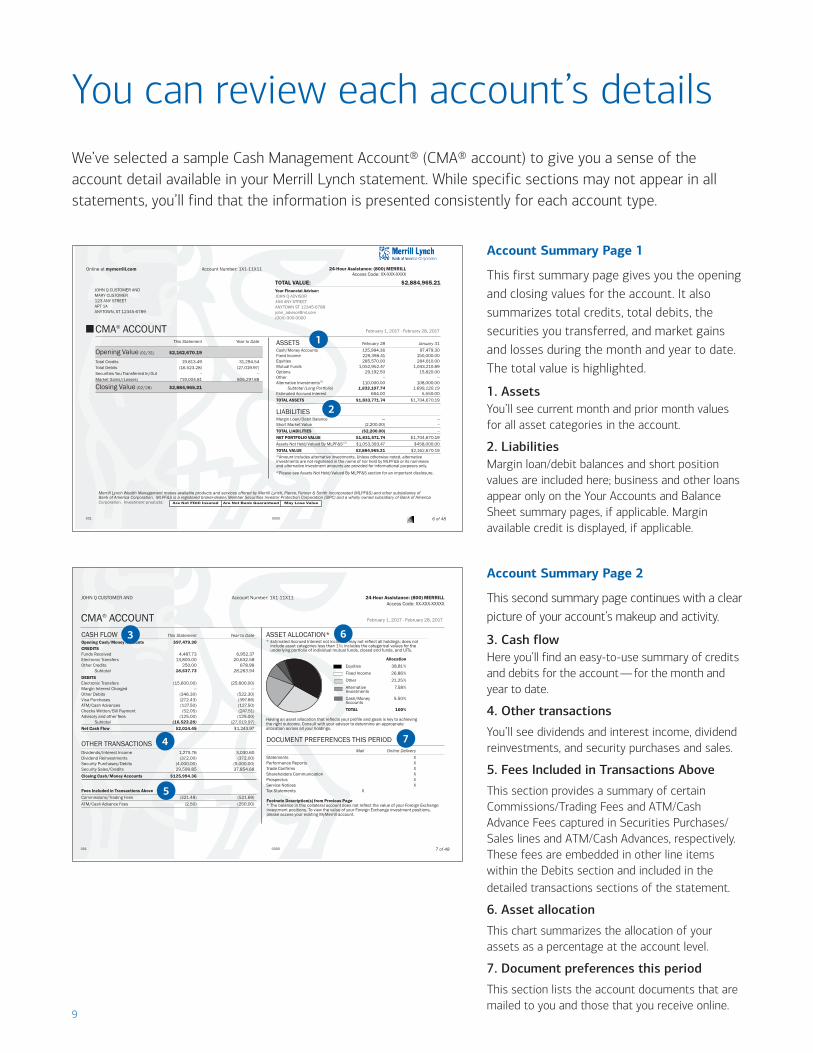
You can review each account’s detailsWe’ve selected a sample Cash Management Account® (CMA® account) to give you a sense of the account detail available in your Merrill Lynch statement. While specific sections may not appear in all statements, you’ll find that the information is presented consistently for each account type.
Account Summary Page 1
This first summary page gives you the opening and closing values for the account. It also summarizes total credits, total debits, the securities you transferred, and market gains and losses during the month and year to date. The total value is highlighted.
1. AssetsYou’ll see current month and prior month values for all asset categories in the account.
2. LiabilitiesMargin loan/debit balances and short position values are included here; business and other loans appear only on the Your Accounts and Balance Sheet summary pages, if applicable. Margin available credit is displayed, if applicable.
Account Summary Page 2
This second summary page continues with a clear picture of your account’s makeup and activity.
3. Cash flowHere you’ll find an easy-to-use summary of credits and debits for the account — for the month and year to date.
4. Other transactions
You’ll see dividends and interest income, dividend reinvestments, and security purchases and sales.
5. Fees Included in Transactions Above
This section provides a summary of certain Commissions/Trading Fees and ATM/Cash Advance Fees captured in Securities Purchases/Sales lines and ATM/Cash Advances, respectively. These fees are embedded in other line items within the Debits section and included in the detailed transactions sections of the statement.
6. Asset allocation
This chart summarizes the allocation of your assets as a percentage at the account level.
7. Document preferences this period
This section lists the account documents that are mailed to you and those that you receive online.
001 0000 6 of 48
Merrill Lynch Wealth Management makes available products and services offered by Merrill Lynch, Pierce, Fenner & Smith Incorporated (MLPF&S) and other subsidiaries of Bank of America Corporation. MLPF&S is a registered broker-dealer, Member Securities Investor Protection Corporation (SIPC) and a wholly owned subsidiary of Bank of America
Are Not FDIC Insured Are Not Bank Guaranteed May Lose ValueCorporation. Investment products:
This Statement Year to Date
Opening Value (01/31) $2,162,670.19
Total Credits 19,813.49 31,294.54Total Debits (16,523.28) (27,019.97)Securities You Transferred In/Out -- --Market Gains/(Losses) 719,004.81 806,297.88
Closing Value (02/28) $2,884,965.21
24-Hour Assistance: (800) MERRILLAccess Code: XX-XXX-XXXX
TOTAL VALUE: $2,884,965.21Your Financial Advisor:JOHN Q ADVISOR456 ANY STREETANYTOWN ST [email protected](000) 000-0000
Online at mymerrill.com Account Number: 1X1-11X11
JOHN Q CUSTOMER AND MARY CUSTOMER 123 ANY STREET APT 1A ANYTOWN, ST 12345-6789
�CMA® ACCOUNT February 1, 2017 - February 28, 2017
ASSETS February 28 January 31
Cash/Money Accounts 125,994.36 97,479.30Fixed Income 229,398.41 150,000.00Equities 285,570.00 284,610.00Mutual Funds 1,052,952.47 1,043,210.89Options 29,192.50 15,820.00Other -- --Alternative Investments(1) 110,000.00 108,000.00 Subtotal (Long Portfolio) 1,833,107.74 1,699,120.19Estimated Accrued Interest 664.00 5,550.00TOTAL ASSETS $1,833,771.74 $1,704,670.19
LIABILITIESMargin Loan/Debit Balance --- --Short Market Value (2,200.00) --TOTAL LIABILITIES ($2,200.00) --NET PORTFOLIO VALUE $1,831,571.74 $1,704,670.19Assets Not Held/Valued By MLPF&S (2) $1,053,393.47 $458,000.00TOTAL VALUE $2,884,965.21 $2,162,670.19(1)Amount includes alternative investments. Unless otherwise noted, alternativeinvestments are not registered in the name of nor held by MLPF&S or its nomineesand alternative investment amounts are provided for informational purposes only.(2)Please see Assets Not Held/Valued By MLPF&S section for an important disclosure.
2
1
001 0000 7 of 48
DOCUMENT PREFERENCES THIS PERIODMail Online Delivery
Statements XPerformance Reports XTrade Confirms XShareholders Communication XProspectus XService Notices XTax Statements X
Footnote Description(s) from Previous Page* The balance in this collateral account does not reflect the value of your Foreign Exchangeinvestment positions. To view the value of your Foreign Exchange investment positions,please access your existing MyMerrill account.
AllocationEquities 38.81%Fixed Income 26.86%Other 21.25%Alternative 7.58%InvestmentsCash/Money 5.50%AccountsTOTAL 100%
JOHN Q CUSTOMER AND Account Number: 1X1-11X11 24-Hour Assistance: (800) MERRILLAccess Code: XX-XXX-XXXXX
CMA® ACCOUNT February 1, 2017 - February 28, 2017
CASH FLOW This Statement Year to Date
Opening Cash/Money Accounts $97,479.30CREDITSFunds Received 4,487.73 6,952.37Electronic Transfers 13,800.00 20,632.58Other Credits 250.00 678.99 Subtotal 18,537.73 28,263.94
DEBITSElectronic Transfers (15,600.00) (25,600.00)Margin Interest Charged — —Other Debits (346.30) (522.30)Visa Purchases (272.43) (397.66)ATM/Cash Advances (127.50) (127.50)Checks Written/Bill Payment (52.05) (247.51)Advisory and other fees (125.00) (125.00) Subtotal (16,523.28) (27,019.97)
Net Cash Flow $2,014.45 $1,243.97
OTHER TRANSACTIONSDividends/Interest Income 1,275.76 3,030.60Dividend Reinvestments (372.00) (372.00)Security Purchases/Debits (4,000.00) (5,000.00)Security Sales/Credits 29,596.85 37,854.68Closing Cash/Money Accounts $125,994.36
Fees Included in Transactions AboveCommissions/Trading Fees (321.48) (521.69)ATM/Cash Advance Fees (2.50) (250.00)
ASSET ALLOCATION** Estimated Accrued Interest not included; may not reflect all holdings; does not
include asset categories less than 1%; includes the categorical values for theunderlying portfolio of individual mutual funds, closed end funds, and UITs.
Having an asset allocation that reflects your profile and goals is key to achievingthe right outcome. Consult with your advisor to determine an appropriateallocation across all your holdings.
3
4
5
6
7
10
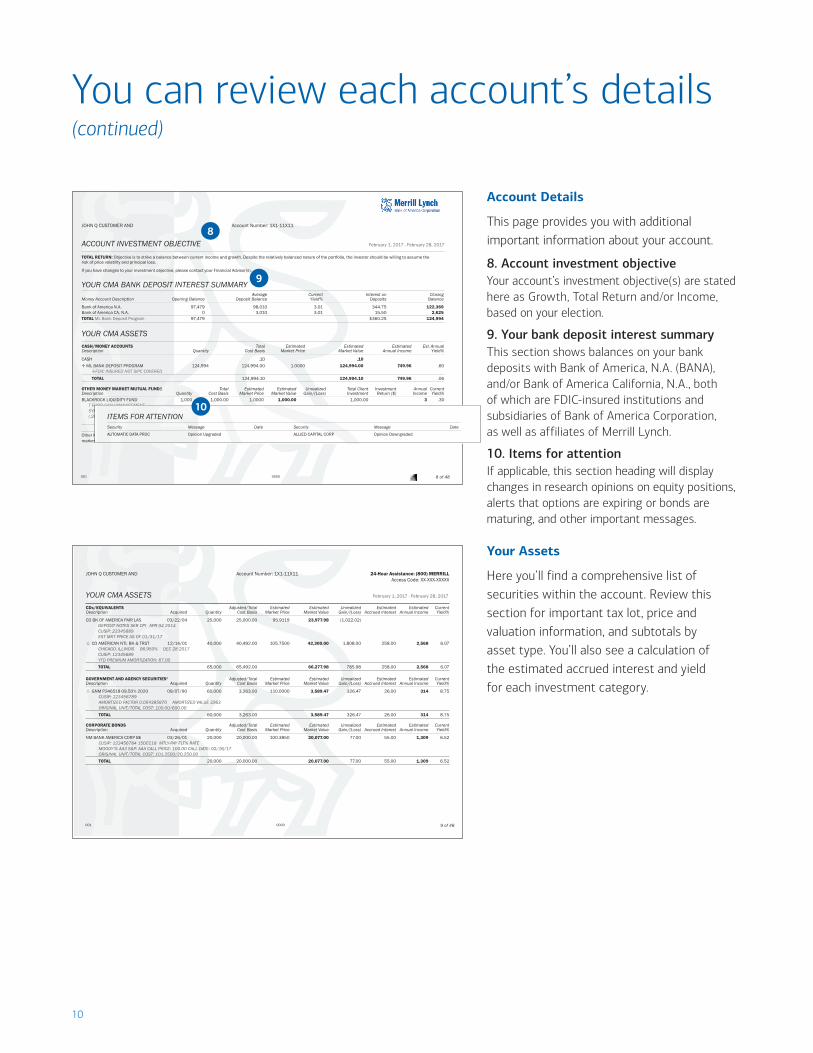
Account Details
This page provides you with additional important information about your account.
8. Account investment objectiveYour account’s investment objective(s) are stated here as Growth, Total Return and/or Income, based on your election.
9. Your bank deposit interest summaryThis section shows balances on your bank deposits with Bank of America, N.A. (BANA), and/or Bank of America California, N.A., both of which are FDIC-insured institutions and subsidiaries of Bank of America Corporation, as well as affiliates of Merrill Lynch.
10. Items for attentionIf applicable, this section heading will display changes in research opinions on equity positions, alerts that options are expiring or bonds are maturing, and other important messages.
001 0000 8 of 48
JOHN Q CUSTOMER AND Account Number: 1X1-11X11
ACCOUNT INVESTMENT OBJECTIVE February 1, 2017 - February 28, 2017
TOTAL RETURN: Objective is to strike a balance between current income and growth. Despite the relatively balanced nature of the portfolio, the investor should be willing to assume therisk of price volatility and principal loss.
If you have changes to your investment objective, please contact your Financial Advisor(s).
YOUR CMA BANK DEPOSIT INTEREST SUMMARYAverage Current Interest on Closing
Money Account Description Opening Balance Deposit Balance Yield% Deposits Balance
Bank of America N.A. 97,479 98,010 3.01 344.75 122,369Bank of America CA, N.A. 0 3,010 3.01 15.50 2,625TOTAL ML Bank Deposit Program 97,479 $360.25 124,994
YOUR CMA ASSETS
CASH/MONEY ACCOUNTS Total Estimated Estimated Estimated Est. AnnualDescription Quantity Cost Basis Market Price Market Value Annual Income Yield%
CASH .10 .10✢ ML BANK DEPOSIT PROGRAM 124,994 124,994.00 1.0000 124,994.00 749.96 .60
✢FDIC INSURED NOT SIPC COVERED
TOTAL 124,994.10 124,994.10 749.96 .06
OTHER MONEY MARKET MUTUAL FUNDS Total Estimated Estimated Unrealized Total Client Investment Annual CurrentDescription Quantity Cost Basis Market Price Market Value Gain/(Loss) Investment Return ($) Income Yield%BLACKROCK LIQUIDITY FUND 1,000 1,000.00 1.0000 1,000.00 1,000.00 3 .30 T FUND CASH MANAGEMENT SYMBOL: BPTXX Initial Purchase: 04/15/16 (.2600 FRACTIONAL SHARE) .26 1.0000 .26 .30 Subtotal 1,000.2600 1,000.26 1,000.26 3 TOTAL 1,000.26 1,000.26 3 .30Other Money Market Mutual Funds includes money market mutual funds with a floating net asset value or whose trade settlement occurs on the business day after the trade date. Money market mutual funds whose trade settlement typically occurs on the same business day as the trade date will appear in the “Cash/Money Accounts” section.
8
You can review each account’s details
(continued)
9
Your Assets
Here you’ll find a comprehensive list of securities within the account. Review this section for important tax lot, price and valuation information, and subtotals by asset type. You’ll also see a calculation of the estimated accrued interest and yield for each investment category.
001 0000 9 of 48
JOHN Q CUSTOMER AND Account Number: 1X1-11X11 24-Hour Assistance: (800) MERRILLAccess Code: XX-XXX-XXXXX
YOUR CMA ASSETS February 1, 2017 - February 28, 2017
CDs/EQUIVALENTS Adjusted/Total Estimated Estimated Unrealized Estimated Estimated CurrentDescription Acquired Quantity Cost Basis Market Price Market Value Gain/(Loss) Accrued Interest Annual Income Yield%
CD BK OF AMERICA FMR LAS 03/22/04 25,000 25,000.00 95.9119 23,977.98 (1,022.02) DEPOSIT NOTES SER CPI APR 04 2014 CUSIP: 23345689 EST MKT PRICE AS OF 01/31/17
+ CD AMERICAN NTL BK & TRST 12/14/01 40,000 40,492.00 105.7500 42,300.00 1,808.00 258.00 2,568 6.07 CHICAGO, ILLINOIS 06.950% DEC 28 2017 CUSIP: 12345689 YTD PREMIUM AMORTIZATION: 67.00
TOTAL 65,000 65,492.00 66,277.98 785.98 258.00 2,568 6.07
GOVERNMENT AND AGENCY SECURITIES1 Adjusted/Total Estimated Estimated Unrealized Estimated Estimated CurrentDescription Acquired Quantity Cost Basis Market Price Market Value Gain/(Loss) Accrued Interest Annual Income Yield%
+ GNM P246518 09.50% 2020 09/07/90 60,000 3,263.00 110.0000 3,589.47 326.47 26.00 314 8.75 CUSIP: 123456789 AMORTIZED FACTOR 0.054385870 AMORTIZED VALUE 3263 ORIGINAL UNIT/TOTAL COST: 100.00/600.00
TOTAL 60,000 3,263.00 3,589.47 326.47 26.00 314 8.75
CORPORATE BONDS Adjusted/Total Estimated Estimated Unrealized Estimated Estimated CurrentDescription Acquired Quantity Cost Basis Market Price Market Value Gain/(Loss) Accrued Interest Annual Income Yield%
NM BANK AMERICA CORP BE 03/26/01 20,000 20,000.00 100.3850 20,077.00 77.00 55.00 1,309 6.52 CUSIP: 123456784 15DEC18 MTLY-PAY FLT% RATE MOODY’S: AA3 S&P: AAA CALL PRICE: 100.00 CALL DATE: 02/16/17 ORIGINAL UNIT/TOTAL COST: 101.2500/20,250.00
TOTAL 20,000 20,000.00 20,077.00 77.00 55.00 1,309 6.52
001 0000 27 of 43
MARY’S RETIREMENT Account Number: 1X1-11X12
ACCOUNT INVESTMENT OBJECTIVE December 01, 2015 - December 31, 2015
TOTAL RETURN: Objective is to strike a balance between fixed-income instruments for current income and equities for growth. Despite the relatively balanced nature of the portfolio, theinvestor should be willing to assume the risk of price volatility and principal loss.If you have changes to your investment objective, please contact your Financial Advisor(s).
ITEMS FOR ATTENTIONSecurity Message Date Security Message Date
AUTOMATIC DATA PROC Opinion Upgraded ALLIED CAPITAL CORP Opinion Downgraded
YOUR RETIREMENT ACCOUNT ASSETSCASH/MONEY ACCOUNTS Total Estimated Estimated Estimated Est. AnnualDescription Quantity Cost Basis Market Price Market Value Annual Income Yield%
CASH .26Bank of America, NA RASP 2,455.00 2,455.00 1.0000 2,455.00 15 .63 TOTAL 2,455.00 2,455.00 2,455.26 15 .63
EQUITIES Initial Unit Total Estimated Estimated Unrealized Estimated CurrentDescription Symbol Purchase Quantity Cost Basis Cost Basis Market Price Market Value Gain/(Loss) Annual Income Yield%
AUTOMATIC DATA PROC ADP 05/02/05 400 9.46 3,784.00 35.7000 14,280.00 10,496.00 458 3.21ALLIED CAPITAL CORP ALD 05/07/05 8 12.50 100.00 59.3750 475.00 375.00 15 3.16 TOTAL 3,884.00 14,755.00 10,871.00 473 3.21
RESEARCH RATINGSSecurity Symbol BofAML Research Morningstar S&P
AUTOMATIC DATA PROC ABC Buy (B17) Buy HoldALLIED CAPITAL CORP ALD Underperform (C37) Hold SellPLEASE REFER TO THE BACK OF YOUR STATEMENT FOR A GUIDE TO BofAML AND THIRD PARTY RESEARCH RATINGS.
LONG PORTFOLIO Adjusted/Total Estimated Unrealized Estimated Estimated Current Cost Basis Market Value Gain/(Loss) Accrued Interest Annual Income Yield%
TOTAL 6,339.00 17,211.12 10,871.00 488 2.84
10
11
You can review each account’s details
(continued)
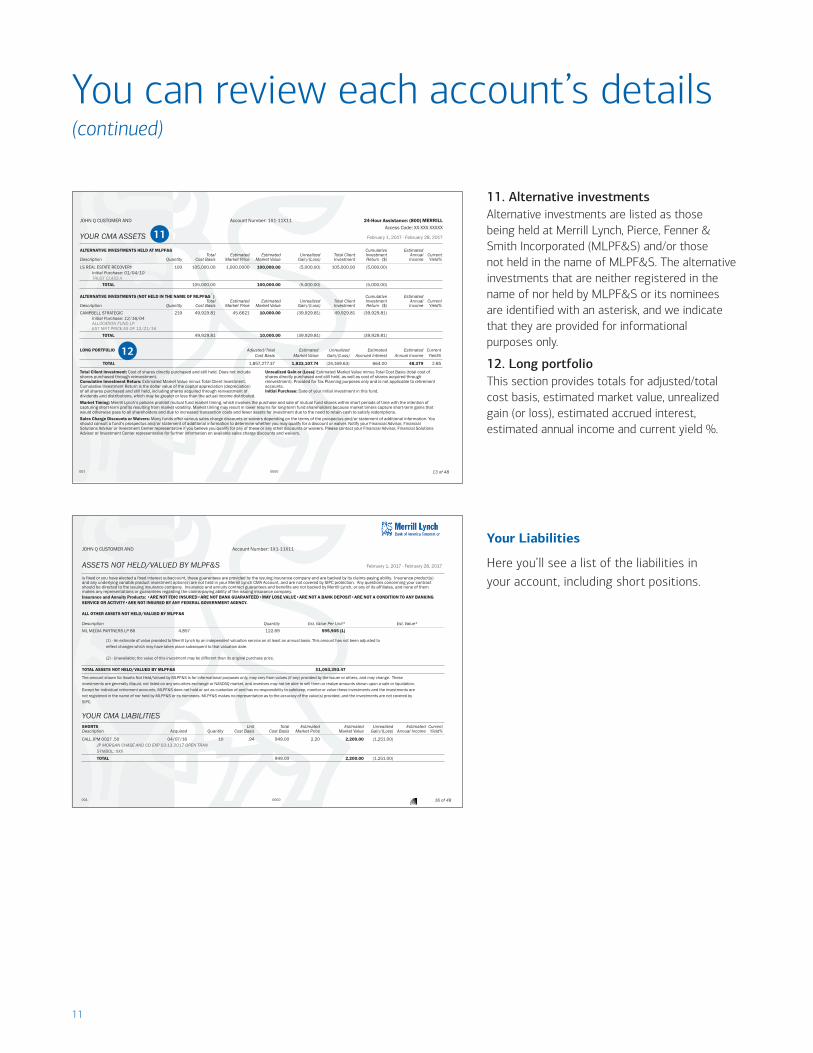
11. Alternative investments Alternative investments are listed as those being held at Merrill Lynch, Pierce, Fenner & Smith Incorporated (MLPF&S) and/or those not held in the name of MLPF&S. The alternative investments that are neither registered in the name of nor held by MLPF&S or its nominees are identified with an asterisk, and we indicate that they are provided for informational purposes only.
12. Long portfolioThis section provides totals for adjusted/total cost basis, estimated market value, unrealized gain (or loss), estimated accrued interest, estimated annual income and current yield %.
001 0000 13 of 48
JOHN Q CUSTOMER AND Account Number: 1X1-11X11 24-Hour Assistance: (800) MERRILLAccess Code: XX-XXX-XXXXX
YOUR CMA ASSETS February 1, 2017 - February 28, 2017
ALTERNATIVE INVESTMENTS HELD AT MLPF&S Cumulative EstimatedTotal Estimated Estimated Unrealized Total Client Investment Annual Current
Description Quantity Cost Basis Market Price Market Value Gain/(Loss) Investment Return ($) Income Yield%
LS REAL ESTATE RECOVERY 100 105,000.00 1,000.0000 100,000.00 (5,000.00) 105,000.00 (5,000.00) Initial Purchase: 01/04/10 TRUST CLASS A
TOTAL 105,000.00 100,000.00 (5,000.00) (5,000.00)
ALTERNATIVE INVESTMENTS (NOT HELD IN THE NAME OF MLPF&S✩
) Cumulative EstimatedTotal Estimated Estimated Unrealized Total Client Investment Annual Current
Description Quantity Cost Basis Market Price Market Value Gain/(Loss) Investment Return ($) Income Yield%
CAMPBELL STRATEGIC 219 49,929.81 45.6621 10,000.00 (39,929.81) 49,929.81 (39,929.81) Initial Purchase: 12/16/04 ALLOCATION FUND LP EST MKT PRICE AS OF 12/21/16
TOTAL 49,929.81 10,000.00 (39,929.81) (39,929.81)
LONG PORTFOLIO Adjusted/Total Estimated Unrealized Estimated Estimated CurrentCost Basis Market Value Gain/(Loss) Accrued Interest Annual Income Yield%
TOTAL 1,857,277.37 1,833,107.74 (24,169.63) 664.00 48,379 2.85
Total Client Investment: Cost of shares directly purchased and still held. Does not include Unrealized Gain or (Loss): Estimated Market Value minus Total Cost Basis (total cost ofshares purchased through reinvestment. shares directly purchased and still held, as well as cost of shares acquired throughCumulative Investment Return: Estimated Market Value minus Total Client Investment. reinvestment). Provided for Tax Planning purposes only and is not applicable to retirementCumulative Investment Return is the dollar value of the capital appreciation (depreciation) accounts.of all shares purchased and still held, including shares acquired through reinvestment of Initial Purchase: Date of your initial investment in this fund.dividends and distributions, which may be greater or less than the actual income distributed.Market Timing: Merrill Lynch’s policies prohibit mutual fund market timing, which involves the purchase and sale of mutual fund shares within short periods of time with the intention of capturing short-term profits resulting from market volatility. Market timing may result in lower returns for long-term fund shareholders because market timers capture short-term gains that would otherwise pass to all shareholders and due to increased transaction costs and fewer assets for investment due to the need to retain cash to satisfy redemptions.Sales Charge Discounts or Waivers: Many funds offer various sales charge discounts or waivers depending on the terms of the prospectus and/or statement of additional information. Youshould consult a fund’s prospectus and/or statement of additional information to determine whether you may qualify for a discount or waiver. Notify your Financial Advisor, FinancialSolutions Advisor or Investment Center representative if you believe you qualify for any of these or any other discounts or waivers. Please contact your Financial Advisor, Financial SolutionsAdvisor or Investment Center representative for further information on available sales charge discounts and waivers.
11
001 0000 16 of 48
JOHN Q CUSTOMER AND Account Number: 1X1-11X11
ASSETS NOT HELD/VALUED BY MLPF&S February 1, 2017 - February 28, 2017
is fixed or you have elected a fixed interest subaccount, these guarantees are provided by the issuing insurance company and are backed by its claims-paying ability. Insurance product(s) and any underlying variable product investment option(s) are not held in your Merrill Lynch CMA Account, and are not covered by SIPC protection. Any questions concerning your contract should be directed to the issuing insurance company. Insurance and annuity contract guarantees and benefits are not backed by Merrill Lynch, or any of its affiliates, and none of them makes any representations or guarantees regarding the claims-paying ability of the issuing insurance company.Insurance and Annuity Products: •ARE NOT FDIC INSURED•ARE NOT BANK GUARANTEED•MAY LOSE VALUE•ARE NOT A BANK DEPOSIT•ARE NOT A CONDITION TO ANY BANKING SERVICE OR ACTIVITY•ARE NOT INSURED BY ANY FEDERAL GOVERNMENT AGENCY.
ALL OTHER ASSETS NOT HELD/VALUED BY MLPF&S
Description Quantity Est. Value Per Unit* Est. Value*
ML MEDIA PARTNERS LP 86 4,857 122.69 595,905 (1)
(1) - An estimate of value provided to Merrill Lynch by an independent valuation service on at least an annual basis. This amount has not been adjusted toreflect changes which may have taken place subsequent to that valuation date.
(2) - Unavailable; the value of this investment may be different than its original purchase price.
TOTAL ASSETS NOT HELD/VALUED BY MLPF&S $1,053,393.47
The amount shown for Assets Not Held/Valued by MLPF&S is for informational purposes only, may vary from values (if any) provided by the issuer or others, and may change. Theseinvestments are generally illiquid, not listed on any securities exchange or NASDAQ market, and investors may not be able to sell them or realize amounts shown upon a sale or liquidation.Except for individual retirement accounts, MLPF&S does not hold or act as custodian of and has no responsibility to safekeep, monitor or value these investments and the investments are not registered in the name of nor held by MLPF&S or its nominees. MLPF&S makes no representation as to the accuracy of the value(s) provided, and the investments are not covered by SIPC.
YOUR CMA LIABILITIESSHORTS Unit Total Estimated Estimated Unrealized Estimated CurrentDescription Acquired Quantity Cost Basis Cost Basis Market Price Market Value Gain/(Loss) Annual Income Yield%
CALL JPM 0027 .50 04/07/16 10 .94 949.00 2.20 2,200.00 (1,251.00)JP MORGAN CHASE AND CO EXP 03-13 2017 OPEN TRANSYMBOL: XXX
TOTAL 949.00 2,200.00 (1,251.00)
Your Liabilities
Here you’ll see a list of the liabilities in your account, including short positions.
12
12
You can review each account’s details
(continued)
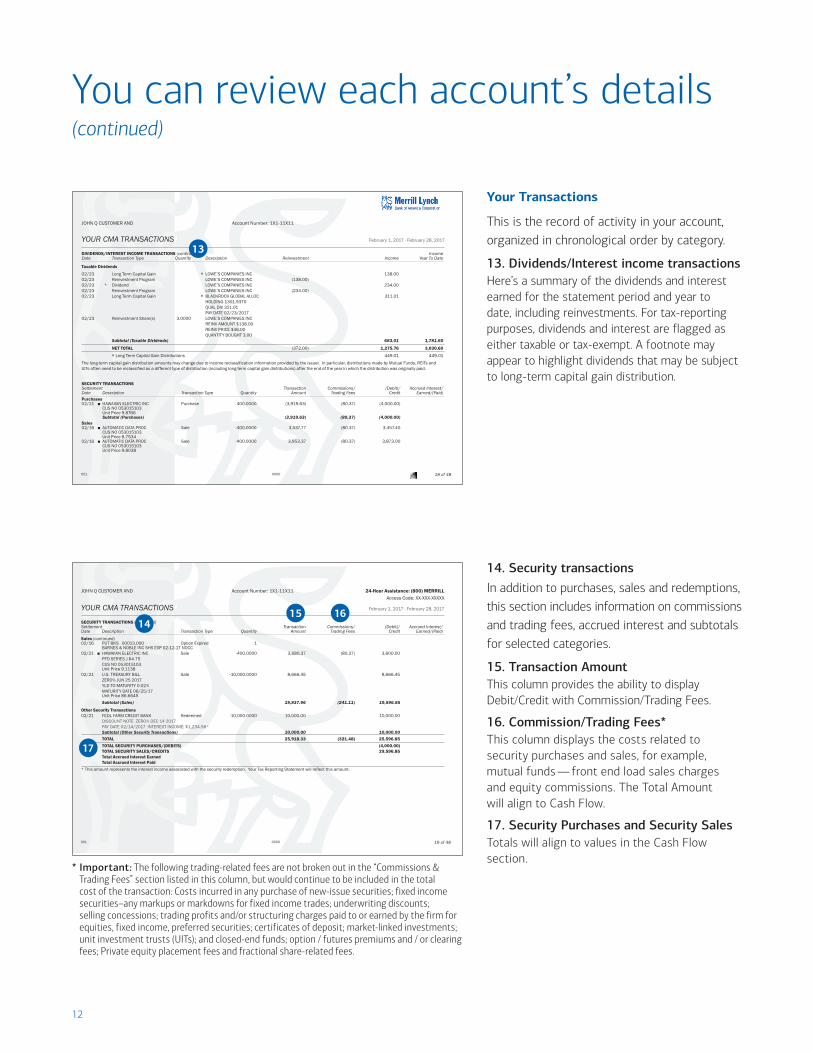
Your Transactions
This is the record of activity in your account, organized in chronological order by category.
13. Dividends/Interest income transactionsHere’s a summary of the dividends and interest earned for the statement period and year to date, including reinvestments. For tax-reporting purposes, dividends and interest are flagged as either taxable or tax-exempt. A footnote may appear to highlight dividends that may be subject to long-term capital gain distribution.
001 0000 18 of 48
JOHN Q CUSTOMER AND Account Number: 1X1-11X11
YOUR CMA TRANSACTIONS February 1, 2017 - February 28, 2017
DIVIDENDS/INTEREST INCOME TRANSACTIONS (continued) IncomeDate Transaction Type Quantity Description Reinvestment Income Year To Date
Taxable Dividends
02/23 Long Term Capital Gain » LOWE’S COMPANIES INC 138.0002/23 Reinvestment Program LOWE’S COMPANIES INC (138.00)02/23 * Dividend LOWE’S COMPANIES INC 234.0002/23 Reinvestment Program LOWE’S COMPANIES INC (234.00)02/23 Long Term Capital Gain » BLACKROCK GLOBAL ALLOC 311.01
HOLDING 1301.9370QUAL DIV 311.01PAY DATE 02/23/2017
02/23 Reinvestment Share(s) 3.0000 LOWE’S COMPANIES INCREINV AMOUNT $138.00REINV PRICE $46.00QUANTITY BOUGHT 3.00
Subtotal (Taxable Dividends) 683.01 1,781.60
NET TOTAL (372.00) 1,275.76 3,030.60
» Long Term Capital Gain Distributions 449.01 449.01
The long-term capital gain distribution amounts may change due to income reclassification information provided by the issuer. In particular, distributions made by Mutual Funds, REITs andUITs often need to be reclassified as a different type of distribution (including long-term capital gain distributions) after the end of the year in which the distribution was originally paid.
SECURITY TRANSACTIONSSettlement Transaction Commissions/ (Debit)/ Accrued Interest/Date Description Transaction Type Quantity Amount Trading Fees Credit Earned/(Paid)Purchases02/21 � HAWAIIAN ELECTRIC INC Purchase 400.0000 (3,919.63) (80.37) (4,000.00)
CUS NO 053015103Unit Price 9.8766Subtotal (Purchases) (3,919.63) (80.37) (4,000.00)
Sales02/16 � AUTOMATIC DATA PROC Sale -400.0000 3,537.77 (80.37) 3,457.40
CUS NO 053015103Unit Price 8.7534
02/16 � AUTOMATIC DATA PROC Sale -400.0000 3,953.37 (80.37) 3,873.00CUS NO 053015103Unit Price 9.8038
001 0000 19 of 48
JOHN Q CUSTOMER AND Account Number: 1X1-11X11 24-Hour Assistance: (800) MERRILLAccess Code: XX-XXX-XXXXX
YOUR CMA TRANSACTIONS February 1, 2017 - February 28, 2017
SECURITY TRANSACTIONS (continued)Settlement Transaction Commissions/ (Debit)/ Accrued Interest/Date Description Transaction Type Quantity Amount Trading Fees Credit Earned/(Paid)
Sales (continued)02/16 PUT BKS 00013.000 Option Expired 1
BARNES & NOBLE INC SHS EXP 02-12-17 NOCC02/21 � HAWAIIAN ELECTRIC INC Sale -400.0000 3,680.37 (80.37) 3,600.00
PFD SERIES J $4.75CUS NO 053015103Unit Price 9.1138
02/21 U.S. TREASURY BILL Sale -10,000.0000 8,666.45 8,666.45ZERO% JUN 25 2017YLD TO MATURITY 0.02%MATURITY DATE 06/25/17Unit Price 86.6645Subtotal (Sales) 19,837.96 (241.11) 19,596.85
Other Security Transactions02/21 FEDL FARM CREDIT BANK Redeemed -10,000.0000 10,000.00 10,000.00
DISCOUNT NOTE ZERO% DEC 14 2017PAY DATE 02/14/2017 INTEREST INCOME: $1,234.56*
Subtotal (Other Security Transactions) 10,000.00 10,000.00
TOTAL 25,918.33 (321.48) 25,596.85TOTAL SECURITY PURCHASES/(DEBITS) (4,000.00)TOTAL SECURITY SALES/CREDITS 29,596.85Total Accrued Interest Earned Total Accrued Interest Paid
* This amount represents the interest income associated with the security redemption. Your Tax Reporting Statement will reflect this amount.
14. Security transactionsIn addition to purchases, sales and redemptions, this section includes information on commissions and trading fees, accrued interest and subtotals for selected categories.
15. Transaction AmountThis column provides the ability to display Debit/Credit with Commission/Trading Fees.
16. Commission/Trading Fees*This column displays the costs related to security purchases and sales, for example, mutual funds — front end load sales charges and equity commissions. The Total Amount will align to Cash Flow.
17. Security Purchases and Security Sales Totals will align to values in the Cash Flow section.
13
1514
* Important: The following trading-related fees are not broken out in the “Commissions & Trading Fees” section listed in this column, but would continue to be included in the total cost of the transaction: Costs incurred in any purchase of new-issue securities; fixed income securities–any markups or markdowns for fixed income trades; underwriting discounts; selling concessions; trading profits and/or structuring charges paid to or earned by the firm for equities, fixed income, preferred securities; certificates of deposit; market-linked investments; unit investment trusts (UITs); and closed-end funds; option / futures premiums and / or clearing fees; Private equity placement fees and fractional share-related fees.
16
17
13
001 0000 20 of 48
JOHN Q CUSTOMER AND Account Number: 1X1-11X11
YOUR CMA TRANSACTIONS February 1, 2017 - February 28, 2017
REALIZED GAINS/(LOSSES)Acquired/ Liquidation/
Cover Short Short Sale Gains/(Losses) *Description Quantity Date Date Sale Amount Cost Basis This Statement Year To Date
Long-Termx AUTOMATIC DATA PROC 400 07/17/95 02/16/17 3,457.40 2,016.79 1,440.61
100 07/17/98 02/16/17 3,873.00 2,373.00 1,500.00� HAWAIIAN ELECTRIC INC 400 07/17/95 02/16/17 3,600.00 3,400.00 N/C
Subtotal 2,940.61 3,678.43Acquired/ Liquidation/
Cover Short Short Sale Gains/(Losses) *Description Quantity Date Date Sale Amount Cost Basis This Statement Year To Date
Short-Term PUT BKS APR 00013.00 1.0000 02/16/17 09/25/16 S 89.99 .00 89.99 U.S. TREASURY BILL 10,000 01/28/15 02/17/17 8,666.45 8,661.79 N/C
Subtotal 89.99 8,290.66
TOTAL 19,686.84 16,451.58 3,030.60 11,969.09* Excludes transactions for which we have insufficient dataX The cost basis on the sale or redemption of this security is determined utilizing the First-In First-Out (FIFO) accounting methodology. If you transferred this security to Merrill Lynch from another firm, the cost basismay have been reported to you by the other firm using an average cost methodology. If you previously used an average cost methodology in reporting sales transactions of this security to the IRS, you may need to usean adjusted basis other than the one shown above. Please consult your tax advisor for more information�This transaction has been identified as a "Wash Sale" based on IRS regulations. The Gain or (Loss) column displays an N/C and the loss has been added to the cost basis of the relatedpurchase. In addition, the cost basis of this transaction has been adjusted for the deferred loss amount of a previous "Wash Sale".✧This transaction has been affected by a "Wash Sale" based on IRS regulations. There are two different types of adjustments that may be occurring.(A) If the gain/loss displays as N/C, this transaction has been identified as a "Wash Sale" based on IRS regulations and the loss has been added to the cost basis of the related purchase.(B) If the gain/loss is calculated, the cost basis has been adjusted by the deferred loss amount from a previous "Wash Sale" and your gain or loss will be inclusive of this amount.S - Short SaleN/C - Results may not be calculated for transactions which involve the sale of partnership interests, short term debt instruments, derivative products purchased in the secondary market,or the determination of ordinary income and/or capital items for discount and zero-coupon issues.
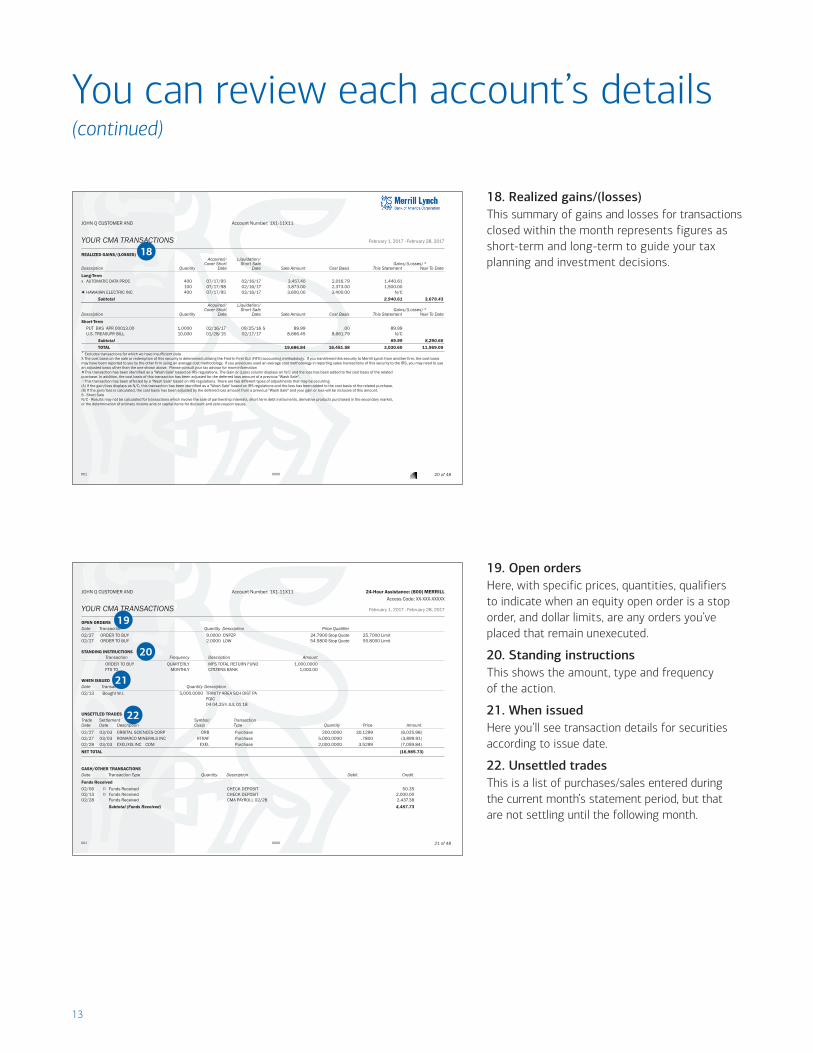
18. Realized gains/(losses)This summary of gains and losses for transactions closed within the month represents figures as short-term and long-term to guide your tax planning and investment decisions.
You can review each account’s details
(continued)
19. Open ordersHere, with specific prices, quantities, qualifiers to indicate when an equity open order is a stop order, and dollar limits, are any orders you’ve placed that remain unexecuted.
20. Standing instructionsThis shows the amount, type and frequency of the action.
21. When issuedHere you’ll see transaction details for securities according to issue date.
22. Unsettled tradesThis is a list of purchases/sales entered during the current month’s statement period, but that are not settling until the following month.
001 0000 21 of 48
JOHN Q CUSTOMER AND Account Number: 1X1-11X11 24-Hour Assistance: (800) MERRILLAccess Code: XX-XXX-XXXXX
YOUR CMA TRANSACTIONS February 1, 2017 - February 28, 2017
OPEN ORDERSDate Transaction Quantity Description Price Qualifier
02/27 ORDER TO BUY 9.0000 CNPZP 24.7900 Stop Quote 25.7000 Limit 02/27 ORDER TO BUY 2.0000 LOW 54.5800 Stop Quote 55.8000 Limit
STANDING INSTRUCTIONSTransaction Frequency Description Amount
ORDER TO BUY QUARTERLY MFS TOTAL RETURN FUND 1,000.0000FTS TO MONTHLY CITIZENS BANK 1,000.00
WHEN ISSUEDDate Transaction Quantity Description
02/13 Bought W.I. 5,000.0000 TRINITY AREA SCH DIST PAFGIC04 04.25% JUL 01 18
UNSETTLED TRADESTrade Settlement Symbol/ TransactionDate Date Description Cusip Type Quantity Price Amount
02/27 03/03 ORBITAL SCIENCES CORP ORB Purchase 200.0000 30.1299 (6,025.98) 02/27 03/03 ROMARCO MINERALS INC RTRAF Purchase 5,000.0000 .7800 (3,899.91) 02/28 03/03 EXELIXIS INC COM EXEL Purchase 2,000.0000 3.5299 (7,059.84)
NET TOTAL (16,985.73)
CASH/OTHER TRANSACTIONSDate Transaction Type Quantity Description Debit Credit
Funds Received02/06 ³ Funds Received CHECK DEPOSIT 50.3502/13 ³ Funds Received CHECK DEPOSIT 2,000.0002/28 Funds Received CMA PAYROLL 02/28 2,437.38
Subtotal (Funds Received) 4,487.73
18
20
19
21
22
14
001 0000 22 of 48
JOHN Q CUSTOMER AND Account Number: 1X1-11X11
YOUR CMA TRANSACTIONS February 1, 2017 - February 28, 2017
CASH/OTHER TRANSACTIONS (continued)Date Transaction Type Quantity Description Debit Credit
Electronic Transfers02/06 Direct Deposit US TREASURY 310 250.0002/13 Funds Received CITIZENS BANK 1,050.0002/13 Wire Transfer In WIRE TRF IN D200000293232 12,500.0002/13 Wire Transfer Out WIRE TRF OUTP20002103037 3,500.0002/23 Pre-Authorized Deposit SYMBOL TECH 100.0002/23 Funds Received BANK RETURN 500.0002/23 Pre-Authorized Deposit SYMBOL TECH 100.0002/27 Withdrawal WCM # 1234567 200.0002/27 Wire Transfer Out WCM TRF OUT P20002104148 10,000.0002/27 Funds Received BANK ONE 500.0002/27 Funds Received WCM #7654321 350.0002/27 Funds Received BANK RETURN #7654321 350.00
Subtotal (Electronic Transfers) 15,600.00 13,800.00
Other Debits/Credits02/06 Transfer / Adjustment Tr From 222-22222 250.0002/16 FATCA Tax Withholding BLACKROCK MULTI ASSET 69.75
INCOME PORTFOLIO INSTL02/21 Transfer / Adjustment Tr To 222-1111 7.5002/27 Month-End Summary Debit MONTH-END SUMMARY DEBIT 272.4302/28 Withdrawal CK #21006-23525 269.05
FIRST FEDERAL BANKSubtotal (Other Debits/Credits) 618.73 250.00
NET TOTAL 2,319.00
ADVISORY AND OTHER FEESDate Fee Type Quantity Description Debit Credit
02/02 Annual Account Fee CMA Annual Fee 125.00NET TOTAL 125.00
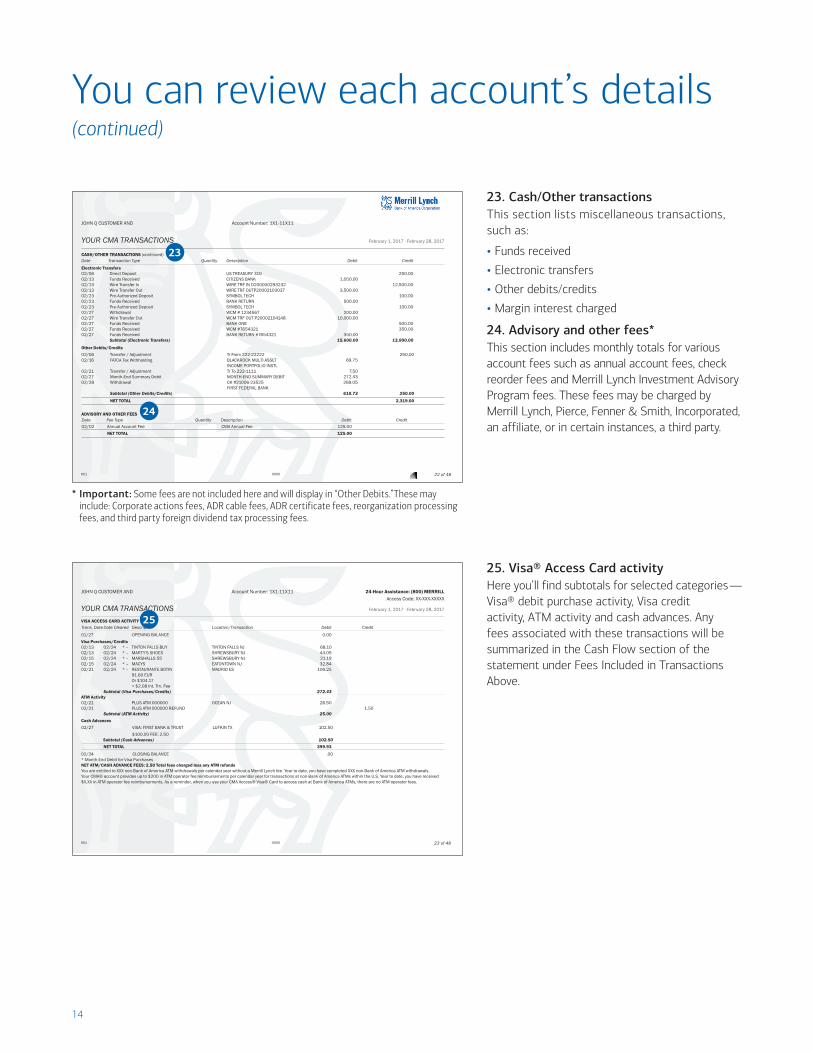
23. Cash/Other transactionsThis section lists miscellaneous transactions, such as:
• Funds received
• Electronic transfers
• Other debits/credits
• Margin interest charged
24. Advisory and other fees*This section includes monthly totals for various account fees such as annual account fees, check reorder fees and Merrill Lynch Investment Advisory Program fees. These fees may be charged by Merrill Lynch, Pierce, Fenner & Smith, Incorporated, an affiliate, or in certain instances, a third party.
You can review each account’s details
(continued)
25. Visa® Access Card activityHere you’ll find subtotals for selected categories — Visa® debit purchase activity, Visa credit activity, ATM activity and cash advances. Any fees associated with these transactions will be summarized in the Cash Flow section of the statement under Fees Included in Transactions Above.
001 0000 23 of 48
JOHN Q CUSTOMER AND Account Number: 1X1-11X11 24-Hour Assistance: (800) MERRILLAccess Code: XX-XXX-XXXXX
YOUR CMA TRANSACTIONS February 1, 2017 - February 28, 2017
VISA ACCESS CARD ACTIVITYTrans. DateDate Cleared Description Location/Transaction Debit Credit
01/27 OPENING BALANCE 0.00Visa Purchases/Credits02/13 02/24 * – TINTON FALLS BUY TINTON FALLS NJ 68.1002/13 02/24 * – MARTY'S SHOES SHREWSBURY NJ 44.0502/15 02/24 * – MARSHALLS 55 SHREWSBURY NJ 21.1902/15 02/24 * – MACYS EATONTOWN NJ 32.8402/21 02/24 * – RESTAURANTE BOTIN MADRID ES 106.25
91.60 EUROr $104.17+ $2.08 Int. Trn. Fee
Subtotal (Visa Purchases/Credits) 272.43ATM Activity02/21 PLUS ATM 000000 OCEAN NJ 26.5002/21 PLUS ATM 000000 REFUND 1.50
Subtotal (ATM Activity) 25.00
Cash Advances02/27 VISA: FIRST BANK & TRUST LUFKIN TX 102.50
$100.00 FEE: 2.50Subtotal (Cash Advances) 102.50
NET TOTAL 399.93
02/24 CLOSING BALANCE .00*-Month-End Debit for Visa PurchasesNET ATM/CASH ADVANCE FEES: 2.50 Total fees charged less any ATM refundsYou are entitled to XXX non-Bank of America ATM withdrawals per calendar year without a Merrill Lynch fee. Year to date, you have completed XXX non-Bank of America ATM withdrawals.Your CMA® account provides up to $200 in ATM operator fee reimbursements per calendar year for transactions at non-Bank of America ATMs within the U.S. Year to date, you have received$X.XX in ATM operator fee reimbursements. As a reminder, when you use your CMA Access® Visa® Card to access cash at Bank of America ATMs, there are no ATM operator fees.
24
23
25
* Important: Some fees are not included here and will display in “Other Debits.”These may include: Corporate actions fees, ADR cable fees, ADR certificate fees, reorganization processing fees, and third party foreign dividend tax processing fees.
15
001 0000 24 of 48
JOHN Q CUSTOMER AND Account Number: 1X1-11X11
YOUR CMA TRANSACTIONS February 1, 2017 - February 28, 2017
CHECKS WRITTEN/BILL PAYMENTDate Written Date Cleared Check Number Description Transaction Debit Credit
02/27 1234* PROVISIONAL CREDIT CHECK DISPUTE 289.7902/18 02/23 5678# JOHN SMITH 100.0002/18 02/23 9125 MACY'S 241.84
NET TOTAL 52.05
* Indicates gap in check sequence# Check converted to ACH debit by payeeTo report Lost or Stolen Visa Cards or Checks, please call (800) CMA-LOST.
YOUR CMA MONEY ACCOUNT TRANSACTIONS
Date Description Withdrawals Deposits Date Description Withdrawals Deposits
02/06 ML Bank Deposit Program 300.00 02/23 ML Bank Deposit Program 8,677.0002/09 ML Bank Deposit Program 250.00 02/27 ML Bank Deposit Program 10,043.0002/13 ML Bank Deposit Program 2,000.00 02/29 ML Bank Deposit Program 2,009.0002/16 ML Bank Deposit Program 9,330.00 02/21 ML Bank Deposit Program 248.0002/22 ML Bank Deposit Program 10,000.00 NET TOTAL 22,275.00
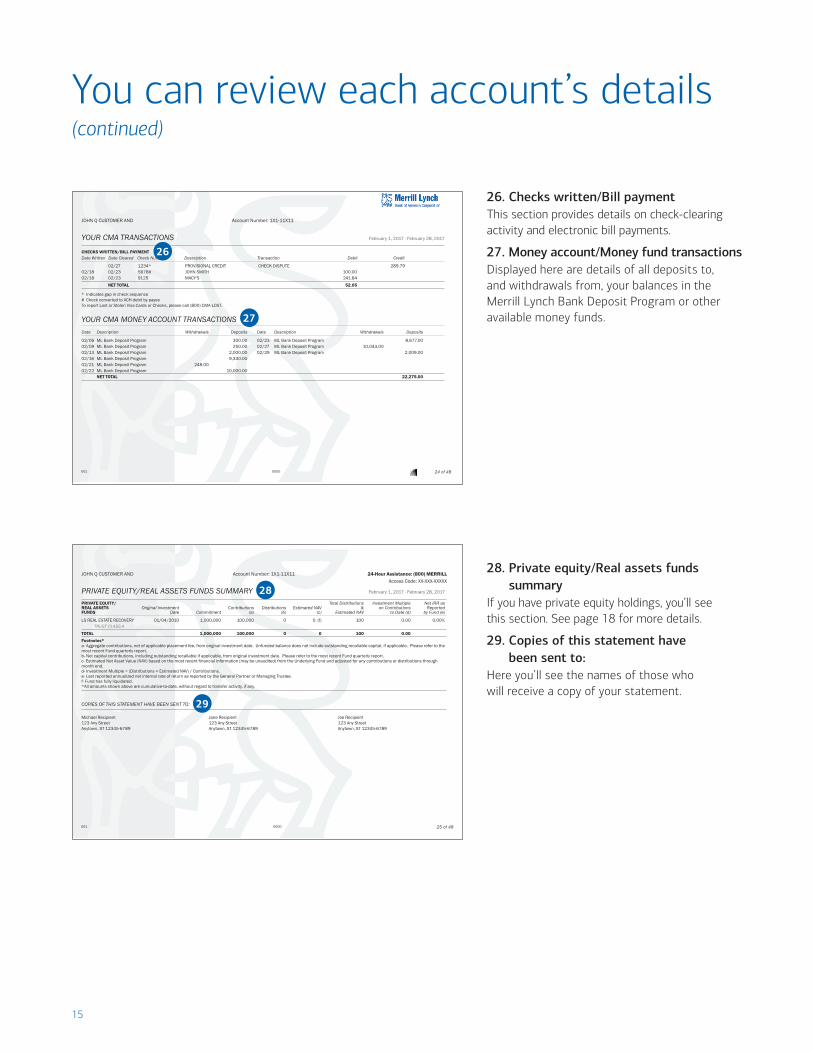
26. Checks written/Bill paymentThis section provides details on check-clearing activity and electronic bill payments.
27. Money account/Money fund transactionsDisplayed here are details of all deposits to, and withdrawals from, your balances in the Merrill Lynch Bank Deposit Program or other available money funds.
You can review each account’s details
(continued)
26
001 0000 25 of 48
JOHN Q CUSTOMER AND Account Number: 1X1-11X11 24-Hour Assistance: (800) MERRILLAccess Code: XX-XXX-XXXXX
PRIVATE EQUITY/REAL ASSETS FUNDS SUMMARY February 1, 2017 - February 28, 2017
PRIVATE EQUITY/ Total Distributions Investment Multiple Net IRR asREAL ASSETS Original Investment Contributions Distributions Estimated NAV & on Contributions ReportedFUNDS Date Commitment (a) (b) (c) Estimated NAV to Date (d) by Fund (e)
LS REAL ESTATE RECOVERY 01/04/2010 1,000,000 100,000 0 0 (f) 100 0.00 0.00% TRUST CLASS A
TOTAL 1,000,000 100,000 0 0 100 0.00Footnotes*a- Aggregate contributions, net of applicable placement fee, from original investment date. Unfunded balance does not include outstanding recallable capital, if applicable. Please refer to themost recent Fund quarterly report.b- Net capital contributions, including outstanding recallable if applicable, from original investment date. Please refer to the most recent Fund quarterly report.c- Estimated Net Asset Value (NAV) based on the most recent financial information (may be unaudited) from the Underlying Fund and adjusted for any contributions or distributions throughmonth end.d- Investment Multiple = (Distributions + Estimated NAV) / Contributions.e- Last reported annualized net internal rate of return as reported by the General Partner or Managing Trustee.f- Fund has fully liquidated.*All amounts shown above are cumulative-to-date, without regard to transfer activity, if any.
COPIES OF THIS STATEMENT HAVE BEEN SENT TO:
Michael Recipient Jane Recipient Joe Recipient123 Any Street 123 Any Street 123 Any StreetAnytown, ST 12345-6789 Anytown, ST 12345-6789 Anytown, ST 12345-6789
28. Private equity/Real assets funds summary
If you have private equity holdings, you’ll see this section. See page 18 for more details.
29. Copies of this statement have been sent to:
Here you’ll see the names of those who will receive a copy of your statement.
29
28
27
16
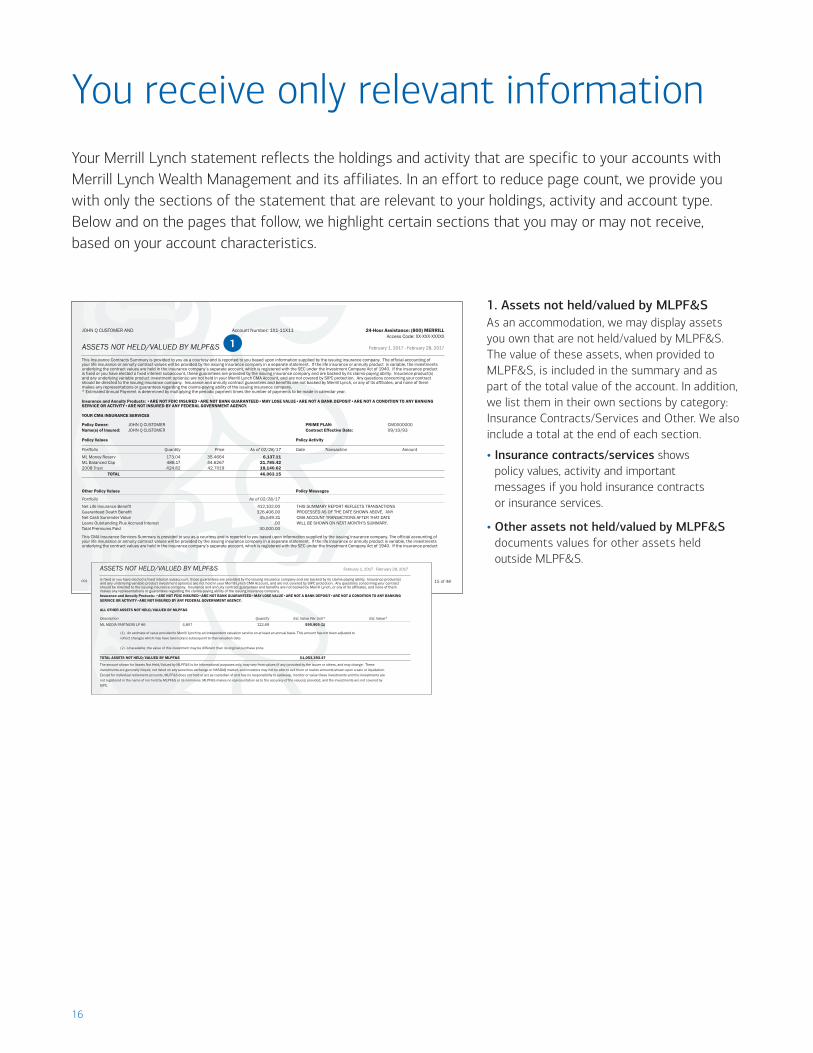
1. Assets not held/valued by MLPF&SAs an accommodation, we may display assets you own that are not held/valued by MLPF&S. The value of these assets, when provided to MLPF&S, is included in the summary and as part of the total value of the account. In addition, we list them in their own sections by category: Insurance Contracts/Services and Other. We also include a total at the end of each section.
• Insurance contracts/services shows policy values, activity and important messages if you hold insurance contracts or insurance services.
• Other assets not held/valued by MLPF&S documents values for other assets held outside MLPF&S.
You receive only relevant informationYour Merrill Lynch statement reflects the holdings and activity that are specific to your accounts with Merrill Lynch Wealth Management and its affiliates. In an effort to reduce page count, we provide you with only the sections of the statement that are relevant to your holdings, activity and account type. Below and on the pages that follow, we highlight certain sections that you may or may not receive, based on your account characteristics.
001 0000 15 of 48
JOHN Q CUSTOMER AND Account Number: 1X1-11X11 24-Hour Assistance: (800) MERRILLAccess Code: XX-XXX-XXXXX
ASSETS NOT HELD/VALUED BY MLPF&S February 1, 2017 - February 28, 2017
This Insurance Contracts Summary is provided to you as a courtesy and is reported to you based upon information supplied by the issuing insurance company. The official accounting of your life insurance or annuity contract values will be provided by the issuing insurance company in a separate statement. If the life insurance or annuity product is variable, the investments underlying the contract values are held in the insurance company’s separate account, which is registered with the SEC under the Investment Company Act of 1940. If the insurance product is fixed or you have elected a fixed interest subaccount, these guarantees are provided by the issuing insurance company and are backed by its claims-paying ability. Insurance product(s) and any underlying variable product investment option(s) are not held in your Merrill Lynch CMA Account, and are not covered by SIPC protection. Any questions concerning your contract should be directed to the issuing insurance company. Insurance and annuity contract guarantees and benefits are not backed by Merrill Lynch, or any of its affiliates, and none of them makes any representations or guarantees regarding the claims-paying ability of the issuing insurance company.* Estimated Annual Payment is determined by multiplying the periodic payment times the number of payments to be made in calendar year.
Insurance and Annuity Products: •ARE NOT FDIC INSURED•ARE NOT BANK GUARANTEED•MAY LOSE VALUE•ARE NOT A BANK DEPOSIT•ARE NOT A CONDITION TO ANY BANKING SERVICE OR ACTIVITY•ARE NOT INSURED BY ANY FEDERAL GOVERNMENT AGENCY.
YOUR CMA INSURANCE SERVICES
Policy Owner: JOHN Q CUSTOMER PRIME PLAN: CM0000000Name(s) of Insured: JOHN Q CUSTOMER Contract Effective Date: 09/10/93
Policy Values Policy Activity
Portfolio Quantity Price As of 02/28/17 Date Transaction Amount
ML Money Reserv 173.04 35.4664 6,137.11ML Balanced Cap 488.17 44.6267 21,785.422008 Trust 424.82 42.7019 18,140.62
TOTAL 46,063.15
Other Policy Values Policy Messages
Portfolio As of 02/28/17
Net Life Insurance Benefit 412,102.00 THIS SUMMARY REPORT REFLECTS TRANSACTIONSGuaranteed Death Benefit 326,406.00 PROCESSED AS OF THE DATE SHOWN ABOVE. ANYNet Cash Surrender Value 45,549.31 CMA ACCOUNT TRANSACTIONS AFTER THAT DATE Loans Outstanding Plus Accrued Interest .00 WILL BE SHOWN ON NEXT MONTH’S SUMMARY.Total Premiums Paid 30,000.00
This CMA Insurance Services Summary is provided to you as a courtesy and is reported to you based upon information supplied by the issuing insurance company. The official accounting of your life insurance or annuity contract values will be provided by the issuing insurance company in a separate statement. If the life insurance or annuity product is variable, the investments underlying the contract values are held in the insurance company’s separate account, which is registered with the SEC under the Investment Company Act of 1940. If the insurance product
1
001 0000 16 of 48
JOHN Q CUSTOMER AND Account Number: 1X1-11X11
ASSETS NOT HELD/VALUED BY MLPF&S February 1, 2017 - February 28, 2017
is fixed or you have elected a fixed interest subaccount, these guarantees are provided by the issuing insurance company and are backed by its claims-paying ability. Insurance product(s) and any underlying variable product investment option(s) are not held in your Merrill Lynch CMA Account, and are not covered by SIPC protection. Any questions concerning your contract should be directed to the issuing insurance company. Insurance and annuity contract guarantees and benefits are not backed by Merrill Lynch, or any of its affiliates, and none of them makes any representations or guarantees regarding the claims-paying ability of the issuing insurance company.Insurance and Annuity Products: •ARE NOT FDIC INSURED•ARE NOT BANK GUARANTEED•MAY LOSE VALUE•ARE NOT A BANK DEPOSIT•ARE NOT A CONDITION TO ANY BANKING SERVICE OR ACTIVITY•ARE NOT INSURED BY ANY FEDERAL GOVERNMENT AGENCY.
ALL OTHER ASSETS NOT HELD/VALUED BY MLPF&S
Description Quantity Est. Value Per Unit* Est. Value*
ML MEDIA PARTNERS LP 86 4,857 122.69 595,905 (1)
(1) - An estimate of value provided to Merrill Lynch by an independent valuation service on at least an annual basis. This amount has not been adjusted toreflect changes which may have taken place subsequent to that valuation date.
(2) - Unavailable; the value of this investment may be different than its original purchase price.
TOTAL ASSETS NOT HELD/VALUED BY MLPF&S $1,053,393.47
The amount shown for Assets Not Held/Valued by MLPF&S is for informational purposes only, may vary from values (if any) provided by the issuer or others, and may change. Theseinvestments are generally illiquid, not listed on any securities exchange or NASDAQ market, and investors may not be able to sell them or realize amounts shown upon a sale or liquidation.Except for individual retirement accounts, MLPF&S does not hold or act as custodian of and has no responsibility to safekeep, monitor or value these investments and the investments are not registered in the name of nor held by MLPF&S or its nominees. MLPF&S makes no representation as to the accuracy of the value(s) provided, and the investments are not covered by SIPC.
YOUR CMA LIABILITIESSHORTS Unit Total Estimated Estimated Unrealized Estimated CurrentDescription Acquired Quantity Cost Basis Cost Basis Market Price Market Value Gain/(Loss) Annual Income Yield%
CALL JPM 0027 .50 04/07/16 10 .94 949.00 2.20 2,200.00 (1,251.00)JP MORGAN CHASE AND CO EXP 03-13 2017 OPEN TRANSYMBOL: XXX
TOTAL 949.00 2,200.00 (1,251.00)
17
You receive only relevant information (continued)
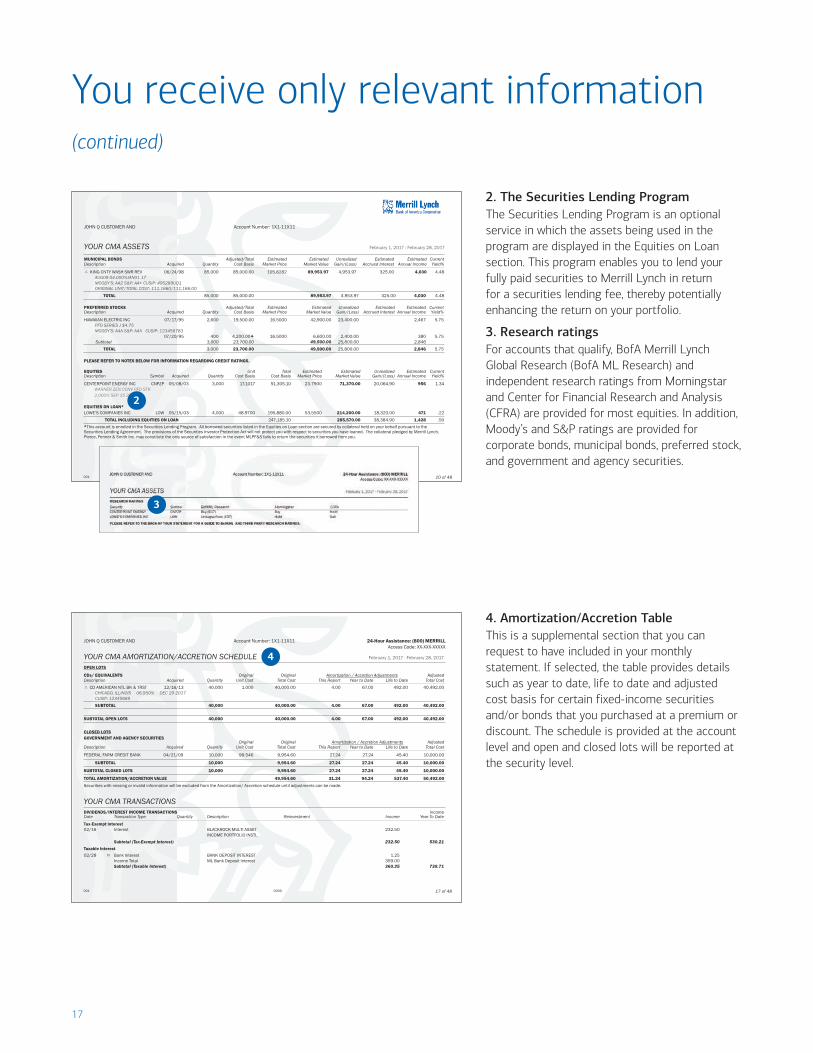
2. The Securities Lending ProgramThe Securities Lending Program is an optional service in which the assets being used in the program are displayed in the Equities on Loan section. This program enables you to lend your fully paid securities to Merrill Lynch in return for a securities lending fee, thereby potentially enhancing the return on your portfolio.
3. Research ratingsFor accounts that qualify, BofA Merrill Lynch Global Research (BofA ML Research) and independent research ratings from Morningstar and Center for Financial Research and Analysis (CFRA) are provided for most equities. In addition, Moody’s and S&P ratings are provided for corporate bonds, municipal bonds, preferred stock, and government and agency securities.
4. Amortization/Accretion TableThis is a supplemental section that you can request to have included in your monthly statement. If selected, the table provides details such as year to date, life to date and adjusted cost basis for certain fixed-income securities and/or bonds that you purchased at a premium or discount. The schedule is provided at the account level and open and closed lots will be reported at the security level.
001 0000 10 of 48
JOHN Q CUSTOMER AND Account Number: 1X1-11X11
YOUR CMA ASSETS February 1, 2017 - February 28, 2017
MUNICIPAL BONDS Adjusted/Total Estimated Estimated Unrealized Estimated Estimated CurrentDescription Acquired Quantity Cost Basis Market Price Market Value Gain/(Loss) Accrued Interest Annual Income Yield%
+ KING CNTY WASH SWR REV 06/24/98 85,000 85,000.00 105.8282 89,953.97 4,953.97 325.00 4,030 4.48 AUG09 04.000%JAN01 17 MOODY'S: AA2 S&P: AA+ CUSIP: 495289UQ1 ORIGINAL UNIT/TOTAL COST: 111.1660/111,166.00
TOTAL 85,000 85,000.00 89,953.97 4,953.97 325.00 4,030 4.48
PREFERRED STOCKS Adjusted/Total Estimated Estimated Unrealized Estimated Estimated CurrentDescription Acquired Quantity Cost Basis Market Price Market Value Gain/(Loss) Accrued Interest Annual Income Yield%
HAWAIIAN ELECTRIC INC 07/17/95 2,600 19,500.00 16.5000 42,900.00 23,400.00 2,467 5.75 PFD SERIES J $4.75 MOODY’S: AAA S&P: AAA CUSIP: 123456783
07/20/95 400 4,200.00� 16.5000 6,600.00 2,400.00 380 5.75 Subtotal 3,000 23,700.00 49,500.00 25,800.00 2,846
TOTAL 3,000 23,700.00 49,500.00 25,800.00 2,846 5.75
PLEASE REFER TO NOTES BELOW FOR INFORMATION REGARDING CREDIT RATINGS.
EQUITIES Unit Total Estimated Estimated Unrealized Estimated CurrentDescription Symbol Acquired Quantity Cost Basis Cost Basis Market Price Market Value Gain/(Loss) Annual Income Yield%
CENTERPOINT ENERGY INC CNPZP 05/08/03 3,000 17.1017 51,305.10 23.7900 71,370.00 20,064.90 956 1.34 WARNER ZEN CONV PFD STK 2.000% SEP 15 2029
EQUITIES ON LOAN*LOWE’S COMPANIES INC LOW 05/15/03 4,000 48.9700 195,880.00 53.5500 214,200.00 18,320.00 471 .22
TOTAL INCLUDING EQUITIES ON LOAN 247,185.10 285,570.00 38,384.90 1,428 .50*This account is enrolled in the Securities Lending Program. All borrowed securities listed in the Equities on Loan section are secured by collateral held on your behalf pursuant to theSecurities Lending Agreement. The provisions of the Securities Investor Protection Act will not protect you with respect to securities you have loaned. The collateral pledged by Merrill Lynch,Pierce, Fenner & Smith Inc. may constitute the only source of satisfaction in the event MLPF&S fails to return the securities it borrowed from you.
001 0000 17 of 48
JOHN Q CUSTOMER AND Account Number: 1X1-11X11 24-Hour Assistance: (800) MERRILLAccess Code: XX-XXX-XXXXX
YOUR CMA AMORTIZATION/ACCRETION SCHEDULE February 1, 2017 - February 28, 2017
OPEN LOTS
CDs/ EQUIVALENTS Original Original Amortization / Accretion Adjustments AdjustedDescription Acquired Quantity Unit Cost Total Cost This Report Year to Date Life to Date Total Cost
+ CD AMERICAN NTL BK & TRST 12/16/13 40,000 1.000 40,000.00 4.00 67.00 492.00 40,492.00 CHICAGO, ILLINOIS 06.950% DEC 29 2017 CUSIP: 12345689
SUBTOTAL 40,000 40,000.00 4.00 67.00 492.00 40,492.00
SUBTOTAL OPEN LOTS 40,000 40,000.00 4.00 67.00 492.00 40,492.00
CLOSED LOTSGOVERNMENT AND AGENCY SECURITIES
Original Original Amortization / Accretion Adjustments AdjustedDescription Acquired Quantity Unit Cost Total Cost This Report Year to Date Life to Date Total Cost
FEDERAL FARM CREDIT BANK 04/21/09 10,000 99.546 9,954.60 27.24 27.24 45.40 10,000.00
SUBTOTAL 10,000 9,954.60 27.24 27.24 45.40 10,000.00
SUBTOTAL CLOSED LOTS 10,000 9,954.60 27.24 27.24 45.40 10,000.00
TOTAL AMORTIZATION/ACCRETION VALUE 49,954.60 31.24 94.24 537.40 50,492.00
Securities with missing or invalid information will be excluded from the Amortization/ Accretion schedule until adjustments can be made.
YOUR CMA TRANSACTIONSDIVIDENDS/INTEREST INCOME TRANSACTIONS IncomeDate Transaction Type Quantity Description Reinvestment Income Year To Date
Tax-Exempt Interest02/16 Interest BLACKROCK MULTI ASSET 232.50
INCOME PORTFOLIO INSTL Subtotal (Tax-Exempt Interest) 232.50 530.21
Taxable Interest02/28 ³ Bank Interest BANK DEPOSIT INTEREST 1.25
Income Total ML Bank Deposit Interest 359.00Subtotal (Taxable Interest) 360.25 738.71
2
3
4
18
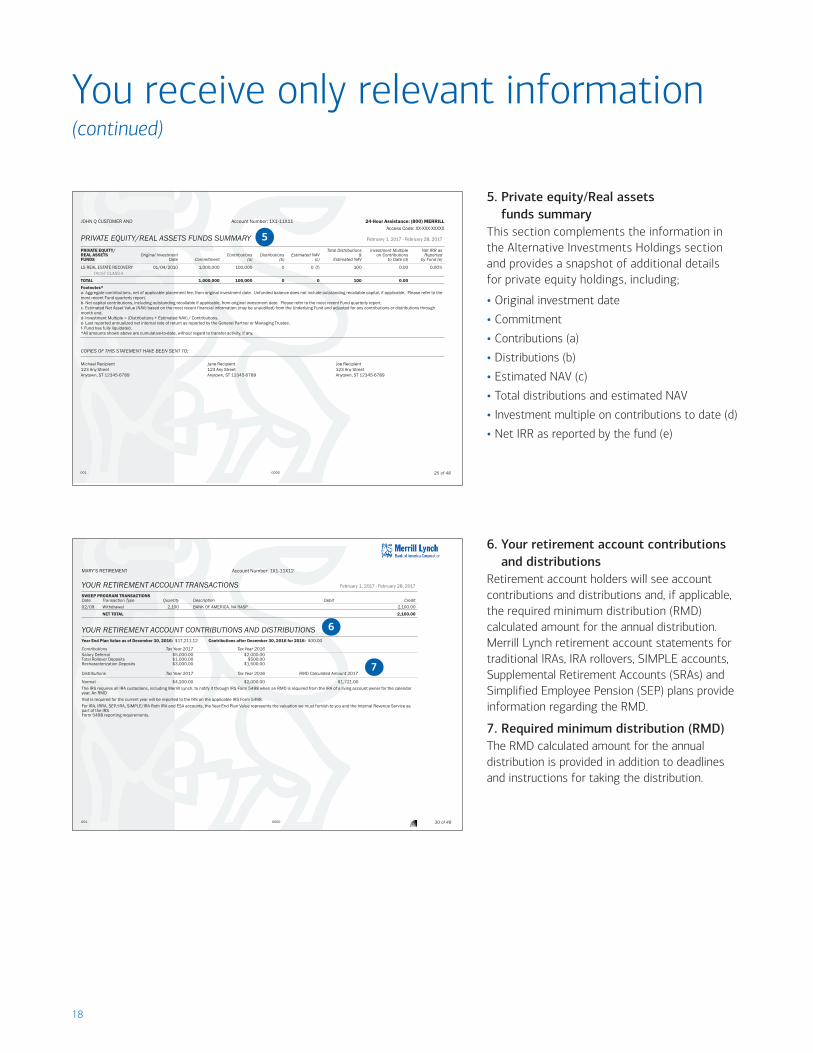
6. Your retirement account contributions and distributions
Retirement account holders will see account contributions and distributions and, if applicable, the required minimum distribution (RMD) calculated amount for the annual distribution. Merrill Lynch retirement account statements for traditional IRAs, IRA rollovers, SIMPLE accounts, Supplemental Retirement Accounts (SRAs) and Simplified Employee Pension (SEP) plans provide information regarding the RMD.
7. Required minimum distribution (RMD)The RMD calculated amount for the annual distribution is provided in addition to deadlines and instructions for taking the distribution.
001 0000 30 of 48
MARY’S RETIREMENT Account Number: 1X1-11X12
YOUR RETIREMENT ACCOUNT TRANSACTIONS February 1, 2017 - February 28, 2017
SWEEP PROGRAM TRANSACTIONSDate Transaction Type Quantity Description Debit Credit
02/09 Withdrawal 2,100 BANK OF AMERICA, NA RASP 2,100.00NET TOTAL 2,100.00
YOUR RETIREMENT ACCOUNT CONTRIBUTIONS AND DISTRIBUTIONSYear End Plan Value as of December 30, 2016: $17,211.12 Contributions after December 30, 2016 for 2016: $00.00
Contributions Tax Year 2017 Tax Year 2016Salary Deferral $5,000.00 $2,000.00Total Rollover Deposits $1,000.00 $500.00Recharacterization Deposits $3,000.00 $1,500.00
Distributions Tax Year 2017 Tax Year 2016 RMD Calculated Amount 2017
Normal $4,200.00 $2,000.00 $1,721.00The IRS requires all IRA custodians, including Merrill Lynch, to notify it through IRS Form 5498 when an RMD is required from the IRA of a living account owner for the calendaryear. An RMDthat is required for the current year will be reported to the IRS on the applicable IRS Form 5498.For IRA, IRRA, SEP/IRA, SIMPLE/IRA Roth IRA and ESA accounts, the Year-End Plan Value represents the valuation we must furnish to you and the Internal Revenue Service aspart of the IRSForm 5498 reporting requirements.
6
7
You receive only relevant information (continued)
001 0000 25 of 48
JOHN Q CUSTOMER AND Account Number: 1X1-11X11 24-Hour Assistance: (800) MERRILLAccess Code: XX-XXX-XXXXX
PRIVATE EQUITY/REAL ASSETS FUNDS SUMMARY February 1, 2017 - February 28, 2017
PRIVATE EQUITY/ Total Distributions Investment Multiple Net IRR asREAL ASSETS Original Investment Contributions Distributions Estimated NAV & on Contributions ReportedFUNDS Date Commitment (a) (b) (c) Estimated NAV to Date (d) by Fund (e)
LS REAL ESTATE RECOVERY 01/04/2010 1,000,000 100,000 0 0 (f) 100 0.00 0.00% TRUST CLASS A
TOTAL 1,000,000 100,000 0 0 100 0.00Footnotes*a- Aggregate contributions, net of applicable placement fee, from original investment date. Unfunded balance does not include outstanding recallable capital, if applicable. Please refer to themost recent Fund quarterly report.b- Net capital contributions, including outstanding recallable if applicable, from original investment date. Please refer to the most recent Fund quarterly report.c- Estimated Net Asset Value (NAV) based on the most recent financial information (may be unaudited) from the Underlying Fund and adjusted for any contributions or distributions throughmonth end.d- Investment Multiple = (Distributions + Estimated NAV) / Contributions.e- Last reported annualized net internal rate of return as reported by the General Partner or Managing Trustee.f- Fund has fully liquidated.*All amounts shown above are cumulative-to-date, without regard to transfer activity, if any.
COPIES OF THIS STATEMENT HAVE BEEN SENT TO:
Michael Recipient Jane Recipient Joe Recipient123 Any Street 123 Any Street 123 Any StreetAnytown, ST 12345-6789 Anytown, ST 12345-6789 Anytown, ST 12345-6789
5. Private equity/Real assets funds summary
This section complements the information in the Alternative Investments Holdings section and provides a snapshot of additional details for private equity holdings, including;
• Original investment date
• Commitment
• Contributions (a)
• Distributions (b)
• Estimated NAV (c)
• Total distributions and estimated NAV
• Investment multiple on contributions to date (d)
• Net IRR as reported by the fund (e)
5
19
001 0000 36 of 48
JOHN Q CUSTOMER TRUST Account Number: 1X1-11X13
YOUR TRUST MANAGEMENT ACCOUNT STATEMENT OF PRINCIPALINVESTMENTS February 1, 2017 - February 28, 2017
Total Client Investment: Cost of shares directly purchased and still held. Does not include Unrealized Gain or (Loss): Estimated Market Value minus Total Cost Basis (total cost ofshares purchased through reinvestment. shares directly purchased and still held, as well as cost of shares acquired throughCumulative Investment Return: Estimated Market Value minus Total Client Investment. reinvestment). Provided for Tax Planning purposes only and is not applicable to retirementCumulative Investment Return is the dollar value of the capital appreciation (depreciation) accounts.of all shares purchased and still held, including shares acquired through reinvestment of Initial Purchase: Date of your initial investment in this fund.dividends and distributions, which may be greater or less than the actual income distributed.Market Timing: Merrill Lynch’s policies prohibit mutual fund market timing, which involves the purchase and sale of mutual fund shares within short periods of time with the intention of capturing short-term profits resulting from market volatility. Market timing may result in lower returns for long-term fund shareholders because market timers capture short-term gains that would otherwise pass to all shareholders and due to increased transaction costs and fewer assets for investment due to the need to retain cash to satisfy redemptions.Sales Charge Discounts or Waivers: MMany funds offer various sales charge discounts or waivers depending on the terms of the prospectus and/or statement of additional information. Youshould consult a fund’s prospectus and/or statement of additional information to determine whether you may qualify for a discount or waiver. Notify your Financial Advisor, FinancialSolutions Advisor or Investment Center representative if you believe you qualify for any of these or any other discounts or waivers. Please contact your Financial Advisor, Financial SolutionsAdvisor or Investment Center representative for further information on available sales charge discounts and waivers.Notes✩
These alternative investments are provided for informational purposes only, and are not registered in the name of nor held by MLPF&S or its nominees.< Derived from Moody’s and/or S & P ratings for other debt securities of this issuer and provided by a third party vendor.+Debt Instruments purchased at a premium show amortization q Debt Instruments purchased at a discount show accretionTotal values exclude N/A items.1 Some agency securities are not backed by the full faith and credit of the United States government.*** Rating currently unavailable or not rated/unrated as provided by Rating Agency or recognized industry wide third party vendor source.@ These shares result from a stock dividend or split and will be payable to your account on the date shown. The market price has been changed to reflect that dividend or split. The unit cost will beadjusted on the payable-date.For Credit Ratings: S&P and Moody's provide credit ratings on the credit quality of certain bonds and preferred stocks. For a credit enhanced security,Moody's and S&P publish and provide third party vendors the higher of the rating on the credit enhancer (guarantor) or the stand alone rating onthe underlying security.�Cost basis has been adjusted by the deferred loss amount from a previous "Wash Sale" and the acquisition date has been adjusted toinclude the holding period of the lot closed by that previous "Wash Sale".N/C - Results may not be calculated for transactions which involve the amortization of premium, the repayment of principal, the sale of partnership interests, derivative products purchased in thesecondary market, or the determination of ordinary income and/or capital items for discount and zero-coupon issues.
YOUR TRUST MANAGEMENT ACCOUNT STATEMENT OF INCOME INVESTMENTS
CASH/MONEY ACCOUNTS Total Estimated Estimated Estimated Est. AnnualDescription Quantity Cost Basis Market Price Market Value Annual Income Yield%
CASH .12 .12 .12BIF MONEY FUND 25,337.00 25,337.00 1.00 25,337.00 17 07
TOTAL 25,337.12 25,337.12 17 .07
TOTAL INCOME INVESTMENTS 25,337.12 25,337.12 17 .07
001 0000 39 of 48
JOHN Q CUSTOMER TRUST Account Number: 1X1-11X13
YOUR TRUST MANAGEMENT ACCOUNT TRANSACTIONS February 1, 2017 - February 28, 2017
DIVIDENDS/INTEREST INCOME TRANSACTIONS (continued) Income Principal IncomeDate Transaction Type Quantity Description Reinvestment Cash Cash Year To Date
Tax-Exempt Dividends (continued)02/28 Dividend CLOUGH GLBL OPPTYS 2,070.00
DIVIDENDHOLDING 9000.0000PAY DATE 02/28/2017
02/28 Share Dividend 4 BIF MONEY FUNDDIVIDENDPAY DATE 02/28/2017
02/28 Cash Dividend ISA BA CA N.A. .77DIVIDENDPAY DATE 02/28/2017FROM 02-01 THRU 02-28
Income Total ISA BA CA N.A. 4.00Subtotal (Tax-Exempt Dividends) 7,183.91 10,367.47
NET TOTAL 12,037.65 19,406.94
SECURITY TRANSACTIONSSettlement Transaction Commissions/ Income PrincipalDate Description Transaction Type Quantity Amount Trading Fees Cash Cash
Purchases02/02 FIRST SOLAR INC Purchase 8,000.0000 (1,301,470.66) (1,301,470.66)
SUBSCRIPTION CUS NO 336433107Unit Price 162.0046ACCRUED INTEREST $X,XXX.XXSubtotal (Purchases) (1,301,470.66) (1,301,470.66)
Sales02/23 FIRSTENERGY CORP Sale -1,000.0000 39,597.27 39,597.27
REDEEMED A/C CALL ZR192 FEAS OF 07/17 CUS NO 337932107Unit Price 40.0000
02/23 PPL CORPORATION Sale -1,600.0000 47,539.35 47,539.35REDEEMED A/C CALL V9H94 PPLAS OF 12/16 CUS NO 69351T106Unit Price 30.0000Subtotal (Sales) 87,136.62 87,136.62
You receive only relevant information (continued)
001 0000 33 of 48
JOHN Q CUSTOMER TRUST Account Number: 1X1-11X13
ITEMS FOR ATTENTION February 1, 2017 - February 28, 2017
Security Message Date Security Message Date
CALL ILT 0100 Option Expiring 03/13/17 CALL HJQ 0160 Option Expiring 02/16/17CALL XEL 0020 Option Expiring 03/13/17 CALL CHK 0025 Option Expiring 02/16/17
YOUR TRUST MANAGEMENT ACCOUNT STATEMENT OF PRINCIPAL INVESTMENTSCASH/MONEY ACCOUNTS Total Estimated Estimated Estimated Est. Annual Description Quantity Cost Basis Market Price Market Value Annual Income Yield%
CASH 0.12 0.12 .12ISA BA CA N.A. 205,378.00 205,378.00 1.0000 205,378.00 144 07
TOTAL 205,378.12 205,378.12 144 .07
CORPORATE BONDS Adjusted/Total Estimated Estimated Unrealized Estimated Estimated CurrentDescription Acquired Quantity Cost Basis Market Price Market Value Gain/(Loss) Accrued Interest Annual Income Yield%
FEDERAL FARM CREDIT BANK 09/15/08 400,000 413,766.00 102.1967 408,786.80 (4,979.20) 1,400.00 16,640 4.07 CALLABLE BONDS 03.500% JAN 18 2018 CUSIP: 313372DP6 PAR CALL DATE: 07/18/13 PAR CALL PRICE 100.00
GNMA CMO 2008 09/23/08 400,000 414,366.00 105.9847 423,938.80 9,572.80 1,900.00 18,560 4.37 51 DA 04.750%MAR16 33 AMORTIZED VALUE 414,625 MOODY'S:AAA S&P: AAA CUSIP: 38375QV63
TOTAL 800,000 828,132.00 832,725.60 4,593.60 3,300.00 35,200 4.22
PLEASE REFER TO NOTES BELOW FOR INFORMATION REGARDING CREDIT RATINGS.
8. Trust Management Account statement of principal investments
This section is a comprehensive list of principal investments within a Trust Management Account. You’ll see important tax lot, price and valuation information, and subtotals by asset type. There’s also a calculation for the estimated accrued interest and yield for each investment category.
9. Trust Management Account statement of income investments
This section lists any income investments within the account. You’ll see tax lot, price and valuation information, and subtotals by asset type. There’s also a calculation for the estimated accrued interest and yield for each investment category.
10. Trust Management Account transactionsHere you’ll find a record of the trust account activity; the default setting organizes transactions by category. If you wish, you can opt to receive your account transaction activity listed in chronological order.
11. Dividends/Interest income transactionsHere’s a summary of the dividends and interest earned for the statement period and year to date, including income cash and principal cash. For tax-reporting purposes, dividends and interest are flagged as either taxable or tax-exempt. A footnote may appear to highlight dividends that may be subject to long-term capital gain distribution.
12. Security transactionsIn addition to purchases, sales and redemptions, this section includes information on income cash and principal cash, accrued interest, and subtotals.
13. Transaction AmountThis column provides the ability to display Debit/Credit with Commission/Trading Fees.
14. Commission/Trading Fees*This column displays the costs related to security purchases and sales, for example, mutual funds — front end load sales charges and equity commissions. The Total Amount will align to Cash Flow.
8
9
1110
12 13 14
* Important: The following trading-related fees are not broken out in the “Commissions & Trading Fees” section listed in this column, but would be included in the total cost of the transaction: Costs incurred in any purchase of new-issue securities; fixed income securities–any markups or markdowns for fixed income trades; underwriting discounts; selling concessions; trading profits and/or structuring charges paid to or earned by the firm for equities, fixed income, preferred securities; certificates of deposit; market-linked investments; unit investment trusts (UITs); and closed-end funds; option / futures premiums and / or clearing fees; Private equity placement fees and fractional share-related fees.
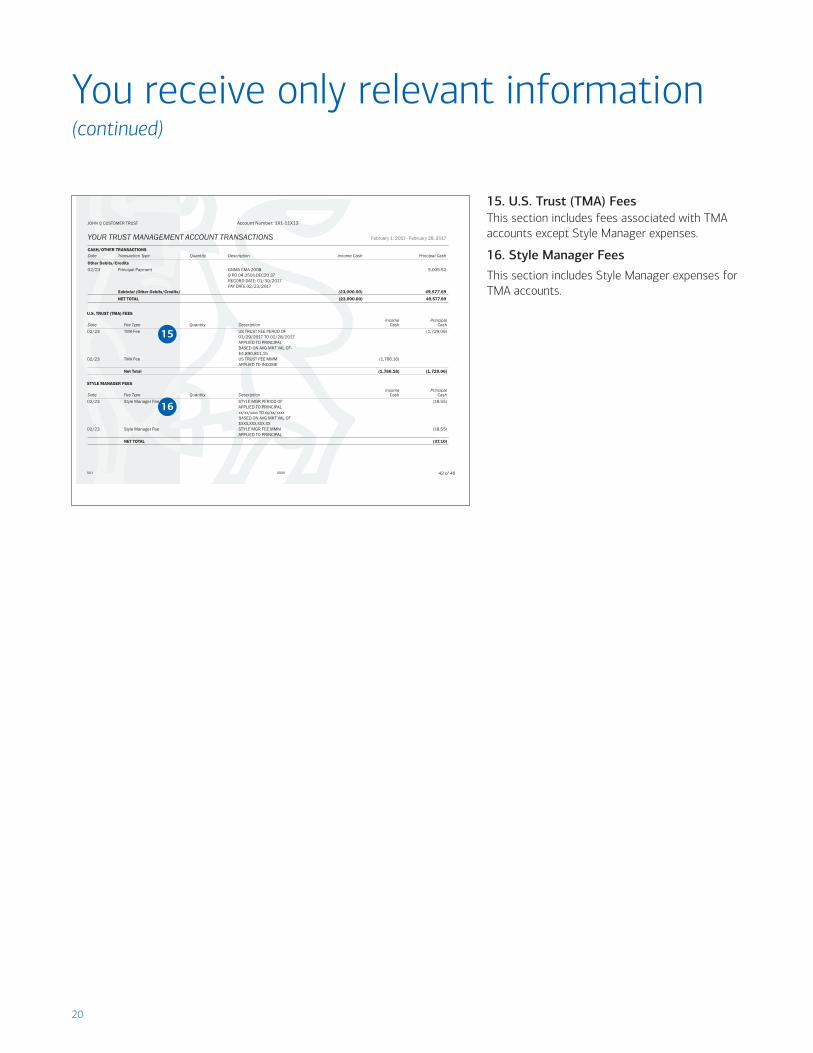
20
001 0000 42 of 48
JOHN Q CUSTOMER TRUST Account Number: 1X1-11X13
YOUR TRUST MANAGEMENT ACCOUNT TRANSACTIONS February 1, 2017 - February 28, 2017
CASH/OTHER TRANSACTIONSDate Transaction Type Quantity Description Income Cash Principal Cash
Other Debits/Credits02/23 Principal Payment GNMA CMA 2008 5,005.52
9 PD 04.250%DEC20 37RECORD DATE: 01/30/2017PAY DATE 02/23/2017
Subtotal (Other Debits/Credits) (23,000.00) 49,577.69
NET TOTAL (23,000.00) 49,577.69
U.S. TRUST (TMA) FEESIncome Principal
Date Fee Type Quantity Description Cash Cash
02/23 TMA Fee US TRUST FEE PEROD OF (1,729.06)01/29/2017 TO 02/28/2017APPLIED TO PRINCIPALBASED ON AVG MKT VAL OF-$4,890,811.15
02/23 TMA Fee US TRUST FEE MMM (1,766.16)APPLIED TO INCOME
Net Total (1,766.16) (1,729.06)
STYLE MANAGER FEESIncome Principal
Date Fee Type Quantity Description Cash Cash
02/23 Style Manager Fee STYLE MGR PERIOD OF (18.55)APPLIED TO PRINCIPALxx/xx/xxxx TO xx/xx/xxxxBASED ON AVG MKT VAL OF$XXX,XXX,XXX.XX
02/23 Style Manager Fee STYLE MGR FEE MMM (18.55)APPLIED TO PRINCIPAL
NET TOTAL (37.10)
You receive only relevant information (continued)
15. U.S. Trust (TMA) FeesThis section includes fees associated with TMA accounts except Style Manager expenses.
16. Style Manager Fees
This section includes Style Manager expenses for TMA accounts.
15
16
21
Additional reports help complete the picture
Other accounts and services
Depending on the nature of your linked account statements, your statement may also contain complete details of the following:
• Retirement accounts
• Merrill Lynch Investment Advisory Program accounts
• Merrill Lynch Mutual Fund Advisor® accounts
• Loan Management Account®
• Trust Management Account
• College savings plan accounts
Performance Report
Accounts enrolled in the Merrill Lynch Investment Advisory Program (Merrill Lynch One®) will receive an Annual Client Review package which includes the Annual Performance Report (APR). The mailing will align to the time of the annual client review with your financial advisor. Additionally your advisor may elect to send a performance report at year-end or quarter end. You will receive these reports through the mail or online, based on your preference.
Managed accounts not enrolled in the Merrill Lynch Investment Advisory Program (Merrill Lynch One®) will receive a separate Quarterly Performance Report (QPR). Both the QPR and APR provide detailed information on the rates of return for the account or Account Group against its benchmark.
Fiscal Statement
If you have a Retirement Cash Management Account (RCMA® account), Working Capital Management Account® (WCMA® account), Endowment Management Account
(EMA® account), Business Investor Account (BIA) or Trust Management Account (TMA), you are eligible to receive an annual Fiscal Statement in addition to the Merrill Lynch monthly statement. The Fiscal Statement is a comprehensive statement that combines 12 months of activity and is generated once in a 12-month cycle based on a fiscal plan month the client chooses.
Annual Consolidated Tax Reporting Statement
Each February, if you are eligible, you’ll receive a special tax reporting statement that contains account data to help with tax-return preparation. The Consolidated Tax Reporting Statement contains the following key features:
• A summary of taxable activities in your account and a detailed chronological breakdown of reportable transactions grouped by category. This section legally substitutes for IRS Forms 1099-DIV, 1099-INT, 1099-OID, 1099-B and 1099-MISC.
• The Non-Reportable Income/Expense section goes beyond providing the details of your transactions. It also includes income and expenses that, although we do not report to the IRS, can help with tax preparation.
CMA Visa Access Card Summary
This statement includes Check Summary and Visa Access Card Transaction Summary sections that list all checks numerically and all card transactions by date and category. This statement also offers a month-by-month analysis of all expenditures and includes preauthorized debits and Web bill payments. Note: This statement will be provided if there has been any CMA Visa card or checking activity during the reporting year and will only be available online. You must be enrolled in the free MyMerrill.com® or Merrill Edge® service in order to be able to view, print or download this statement.
Supplemental Tax Information Statement
If you hold Widely Held Fixed Investment Trusts (WHFITS), Real Estate Mortgage Investment Conduits (REMICs) and/ or collateral debt obligations (CDOs), in March you’ll receive a Supplemental Tax Information statement that provides a consolidated summary of gross income and expenses for these securities.

Unless otherwise noted, all trademarks and registered trademarks are the property of Bank of America Corporation. Visa is a registered trademark of Visa International Service Association.
© 2018 Bank of America Corporation. All rights reserved. | AR89H8XW | BRO-06-18-0358 | 313901PM-0718 | 07/2018
To learn about Bank of America’s environmental goals and initiatives, go to bankofamerica.com/environment. Leaf icon is a registered trademark of Bank of America Corporation.