GET READY TO EXPLORE - hurtigruten.no · GET READY TO EXPLORE. 1 Business Update 1. 2 Hurtigruten...
32
0 Q1 2020 Earnings Presentation May 26, 2020 GET READY TO EXPLORE
Transcript of GET READY TO EXPLORE - hurtigruten.no · GET READY TO EXPLORE. 1 Business Update 1. 2 Hurtigruten...

0
Q1 2020 Earnings Presentation
May 26, 2020
GET READY TOEXPLORE

1
Business Update
1

2
Hurtigruten had a strong
position going into 2020 and
a healthy financial outlook
• Market leading position within cruise-based exploration and adventure travel and a highly satisfied customer base
• Strong financial outlook with a run rate normalized EBITDA of >EUR 200m (LTM Q1 2020 Normalised adjusted EBITDA of ~EUR 145m)
• All time high customer satisfaction in March 2020 provide robust position when market recovers
• Bookings for 2021 are now 4% higher compared to bookings for 2020 at the same time last year with above 20% of pre Covid-19 sales
targets for 2021 already booked
The emergence of Covid-19
has however lead to short
term operational challenges
• Temporary halted the majority of our sailings until 15 June 2020 as a result of travel restrictions
• Plan to resume operations with 4 ships on the Norwegian Coast commencing 16th of June
• Continue to receive full payment under the Coastal Service Agreement despite limited production, generating EUR 6.4m per month in revenue
• No confirmed or suspected cases of Covid-19 on any Hurtigruten ships
We have taken proactive
steps to improve our
liquidity position
• Comfortable liquidity position of ~EUR 100m as of 19 May 2020 incl. the EUR 85m RCF that is fully drawn
• Warm lay up of 14 out of 16 vessels and temporary lay offs of employees are key components to cutting net OPEX to ~EUR 7-8m per
month
• All non-critical capex put on hold until further notice, reducing Jun-Dec 2020 and FY 2021 net capex to ~EUR 13m and ~EUR 35m,
respectively
• Good visibility on future cash flows with volume expectation supported by strong booking curve (both new and re-bookings)
Our position is built on
Northern European travels
which enables us to take
advantage of the reopening
• Opening of European borders in June and July to allow for local travels and tourism will benefit the Coastal product and certain European sailings
with >70% of our customers from Germany, UK and the Nordics
• Operations along the Norwegian coast and in Arctic waters – less impacted by Covid-19 than other travel destinations and typically seen as a
“safe” alternative
• Lower occupancy levels required compared to large cruise companies given higher ticket prices, lower reliance on onboard spend and fixed
inflow from government contract
1
2
3
4
Poised to return to pre-crisis levels of growth and profitability with short term visibility on
starting operations

3
80
90
100
110
120
130
140
150
160
EURm
LTM normalised adjusted EBITDA
LTM reported EBITDA before other gains/losses
• The uplift is mainly explained by full year earnings contribution from Amundsen
and Nansen
• ~80% of the budgeted group revenues for 2020 were pre-booked as of 1 March
2020, up from ~60% in January 2020
150
207
140
160
180
200
220
EURm
LTM Feb
2020 norm
adj EBITDA
Government
agreement fixed
Full year RA
contribution
Full year FN
contribution
Project ECO SG&A increase Pf norm adj.
EBTIDA
We entered 2020 with a strong position en-route for EBITDA >EUR 200m pre Covid-19
with strong momentum continuing into 2020 pre Covid-19
• Consistent upward trajectory leading into Covid-19
• LTM February 2020 EBITDA at all time high with EUR 150m
Consistent positive normalised adjusted EBITDA improvement pre Covid-191 Clear bridge to achieve EBITDA >EUR 200m in 2020 pre Covid-192
EUR 150m
1) As of 1st of January 2020 Hurtigruten is changing functional and reporting currency to EUR. LTM graph is based on last three years reported numbers and normalization as if the functional and reporting currency was EUR for the period 2017 to YE 2019 in accordance with IFRS
2) Numbers are converted from NOK to EUR using a EUR/NOK exchange rate of 9.8500 which was the basis of the 2020 budget
CAGR 18%

4
6668
64
58
53
56
69 70
63
60
66
74
0
10
20
30
40
50
60
70
80
51
Jan-20Apr-19Mar-19 Jul-19May-19 Jun-19 Aug-19 Sep-19 Oct-19 Nov-19 Dec-19 Feb-20 Mar-20
+8
Net promoter score (NPS)
NPS results LTM
NPS score relative to
selected other Norwegian businesses
New vessel
introduction
“hick-ups”
83
79
78
77
77
77
76
74
74
74
Norway Bussekspress
Color Line
Flytoget
Hurtigruten
Avinor
Sporveien T-Bane
TUI
Ving
Fjord1
Nettbuss
Norsk Kundebarometer (2019) - Top 10
Customer satisfaction at all time high including the March 2020 survey gives a solid
platform for a quick rebound as travel patterns return back to a new normal
Source: Hurtigruten, Facebook, Norsk Kundebarometer

5
Our pro-active approach to Covid-19 and the way we treated guests in the crisis will give
us an head start as travel reopens as customer trust is critical
70%
NET PROMOTER SCORE*
Total of 1,216 survey respondents across 13 sailings during the “Covid-19” affected period, i.e., 13th to 19th March 2020
Highest rating (ship-level) reflected from MS Roald Amundsen guests – resulting to a 97% NPS score, based on a response rate of 60%
Average rating of 4.5 (out of 5) on 3 areas:Overall Service Experience, Covid-19 Information, and Guest Repatriation support
“We can't adequately express our gratitude to all staff, crew and Hurtigruten. You went far and above to ensure a wonderful trip and to get us home safely. You have won life long devoted fans. Thank you.”
“Hurtigruten you are the BEST! This was the most memorable cruise for me and I have been on many cruises including 2 Around the World […] I appreciate the endless hours you all spent to get us home. I 🙏🏻 you all be safe!”
* Based on a special Covid-19 customer satisfaction survey done towards passengers that had their voyages cut short due to
travel restrictions or other challenges like port access etc.

6
The very strong customer satisfaction supports the strong booking development for 2021 with
current 2021 bookings 3.8% higher compared to same time last year
– above 20% of Pre-Covid 19 2021 sales targets already achieved
Comments
⚫ As of 1st of March 2020 we had bookings for 2020 of 80% of our 2020 budget
with continued solid momentum
⚫ EUR 6.1m in new bookings for 2020 during the last 30 days whereof EUR 5.3m
for Coastal and EUR 0.8m for Expedition
⚫ Bookings for Q3 and Q4 are supportive for a gradual ramp up of operations as
Northern European travel patterns resume in the Nordics, Germany and UK
Booking status as of 24 May 20201
⚫ We are experiencing a very good traction for 2021 bookings in spite of the
current Covid-19 pandemic
⚫ We see strong demand for sailings in Norway both in the classic Hurtigruten
voyage, but also for the Expedition sailings on the Norwegian Coast
⚫ The main booking window for the 2021 season is from August-November 2020
⚫ The figure to the left shows the inflow of bookings for 2021 the last 30 days
compared to the same time last year for 2020
⚫ Significant inflow of bookings in 2021 driven by rebookings
⚫ Hurtigruten has had EUR 5.9m in new bookings for 2021 during the last 30
days whereof EUR 4.8m for Expedition and EUR 1.1m for Coastal, this shows
also that there is interest from new customers as well
Bookings
for current
year
Bookings
for next
year
Booking
inflow last
thirty days
1) NOK booking revenues originally forecast in constant currency (EURNOK 8.00, USDNOK 6.00, GBPNOK 9.70, DKKNOK 1.15, SEKNOK 0.91)
98,4
130,8149,4
88,097,1
31,5
87,877,2
-
50
100
150
200
Q1 Q2 Q3 Q4
EURm
2019 2020
58,2
29,1 28,1
12,9
47,042,7
32,3
11,2
-
20
40
60
80
Q1 Q2 Q3 Q4
EURm2020 2021
4,1
6,5
3,7 3,5
1,4
11,0 10,8
1,9
-
2
4
6
8
10
12
Q1 Q2 Q3 Q4
EURm2020 2021

7
0
5
10
15
20
25
30
1994 1996 1998 2000 2002 2004 2006 2008 2010 2012 2014 2016 2018
EUR m
Dot-com
bubble
Financial
crisis
Swine flu Costa Concordia
sinking
Number of global ocean cruise passengers have proven robust (millions)1
Observations:
• Cruise markets have proven resilient to downturns
• Our customers come from local European markets
– we are not dependent on US or Asian cruise
tourists
Cruise markets have historically been resilient and we are slowly seeing European
tourism reopen
Source: Clarksons Platou Company market study, CLIA 2018 Global Passenger Report, RCCL Annual Report 2018
1) CLIA changed methodology for calculating passenger volume in 2009. Therefore, consistent data for non-CLIA member cruise lines is unavailable prior to 2009. All passenger figures prior to 2009 are calculated by indexing CLIA-reported statistics to 2009 total of 17.8m
European commission promotes opening of local tourism
Positive momentum for local travel
Lifting restrictions
for member states
with similar
epidemiological
situation
Gradual restoration
of passenger
transportation
Safely resuming
tourism services
Making vouchers a
more attractive
option for
consumers

8
Hurtigruten’s differentiated destinations and small ship focus position us well, as the
cruise industry eventually emerges from Covid-19
Small ship cruising poised to benefit with easing restrictions
⚫ Hurtigruten to benefit from geographical mix of its passengers
- Norway to ease travel restrictions and allow businesses to open by June
15
- Germany to open its borders by June 15; currently has restriction free
travel with certain neighbors
- Iceland to reopen its borders to tourists on June 15, under certain
conditions with respect to quarantine and testing
- UK has no travel restrictions with airlines to gradually restart operations
next month
“Arctic expeditions will resume later in the summer although these will be limited to
Norwegian waters. Cruises in other regions, including Alaska and the Northwest Passage,
have been cancelled for 2020.
However, with a relatively early return to the ocean, the future for Hurtigruten
seems brighter compared to many in the industry”
May 22, 2020
“Could some cruisers be turned off by the size and the passenger count of these
mega ships? Sure…That could spell new demand for smaller operators that can
weather the storm, such as expeditions and river cruises”
April 21, 2020
Areas where Hurtigruten is cruising are pristine, with low density of people
⚫ Hurtigruten’s primary itineraries in Antarctica, Greenland, Iceland and Norway
are extremely unique, and often in some of the most remote areas globally
⚫ Low levels of Covid-19 risk with zero instances of infected passengers
⚫ Experiential travel destinations are centered around exploration and nature,
providing customers a highly differentiated experience versus mass market
cruising

9
Majority of customer base in adjacent countries provide comfort in face of Covid-19 Northern Europeans have multiple options when planning a voyage with Hurtigruten due to favorable location and communication
⚫ With Covid-19 guidelines still restricting international travel in most Northern European
countries, non-diversified cruise lines dependent on passengers from all corners of the
world are experiencing extraordinary hardship
⚫ Hurtigruten is relatively well-positioned in the cruise segment, with a majority of the
customer base located in Northern Europe – in close proximity to the routes
⚫ As restrictions are gradually lifted all over Europe, domestic travel within the European
Union and Norway is expected to surge – direct flights from large European cities to
Bergen greatly enhances the attractiveness of Hurtigruten as a travel destination
⚫ Estimated schedule of re-opening tourism markets to Norway:
— Nordics: June 2020
— Europe: could open in July, but at latest August 2020
Hurtigruten is well positioned to temporarily focus all sales toward
Northern Europe Direct flights and other transportation alternatives
Direct flights from large
cities in Europe to Bergen
London - Bergen
Hamburg - Bergen
Direct flight
European port
European cities where
Hurtigruten has turn around
London/Dover
Hamburg
Northern Europe is both a
destination and core source
market to Hurtigruten
Key markets will start gradually opening up in June
The Nordic
countries are in
discussions to open
internal borders for
travel and will
conclude by
June 15
Germany reopened
borders with
Luxembourg on
May 15, and is to
fully open three
more borders on
June 15
Belgium, France
and several more
European
countries plan to
open borders on
June 15
Share of European guest
in pre Covid 19 2020
bookings
Germany – 41%
UK – 17%
Nordics – 20%
Rest of Europe – 12%
+ 40 other cities

10
Our core sources of demand are located close to Norway, highly supportive for attractive
occupancy from Q3 onwards as we deploy at least 4 ships in the Coastal segment
Hurtigruten is well positioned to temporarily focus all sales toward Northern Europe1
47
36
20
6 4 5
42
42
38
44
3638
17
2716
20
16
21
27
18
19
0%
10%
20%
30%
40%
50%
60%
70%
80%
90%
100%
110%
120%
3
Aug-20Jul-20
2
Nov-20Sep-20
3
Oct-20 Dec-20
112
96
82
94
85
78
61 61 61 61 61
1) Bookings as of 24th of May 2020. Excluding deck space
APCNs (‘000) three
Millennium ships and
one 90’s class ship:
RoW
UK
Germany
Nordics
Coastal segment bookings per customers’ country (%)
~60-80% of Aug-
Dec bookings
are from UK,
Germany and
Nordic
customers
61
11
Q1 2020 Update
2

12
• Currently operating 2 vessels for freight and local transport and receive full payment on government contract at EUR 6.4m per month; remaining
14 vessels placed in “warm stack layup” with significantly reduced operating costs
• Pre-booking levels for 2021 as of 22nd of May are 3.9% higher than 2020 pre-booking levels in May 2019, driven by a significant amount of re-
bookings from 2020 sailings
• Entered into sale leaseback contract on MS Richard With and MS Nordlys with Bank of Communications China on 10th of January 2020; lease
amount of EUR 60 million in total, 10 years BB charter, with additional lease amount of EUR 50 million upon completion of LNG conversion
• Refinanced ECA loan for Explorer II with a EUR 300m bond @ 3.375% coupon rate / five years tenor; bond was issued on 25th of February
2020 and is to be listed on the Oslo Stock Exchange by August 2020 latest
Q1 2020 financial highlights
• Q1-20 total revenue growth of 8.3% YoY driven by higher capacity from MS Roald Amundsen and higher
gross yield per cruise night
• Q1-20 normalized adjusted EBITDA before other gains and losses down -2.5% YoY, driven by Covid-19
effects in March; impact of Covid-19 was EUR 5.8m
• Q1-20 reported EBITDA was up 26.2% YoY, driven by higher yields in both the Coastal and Expedition
segments
13
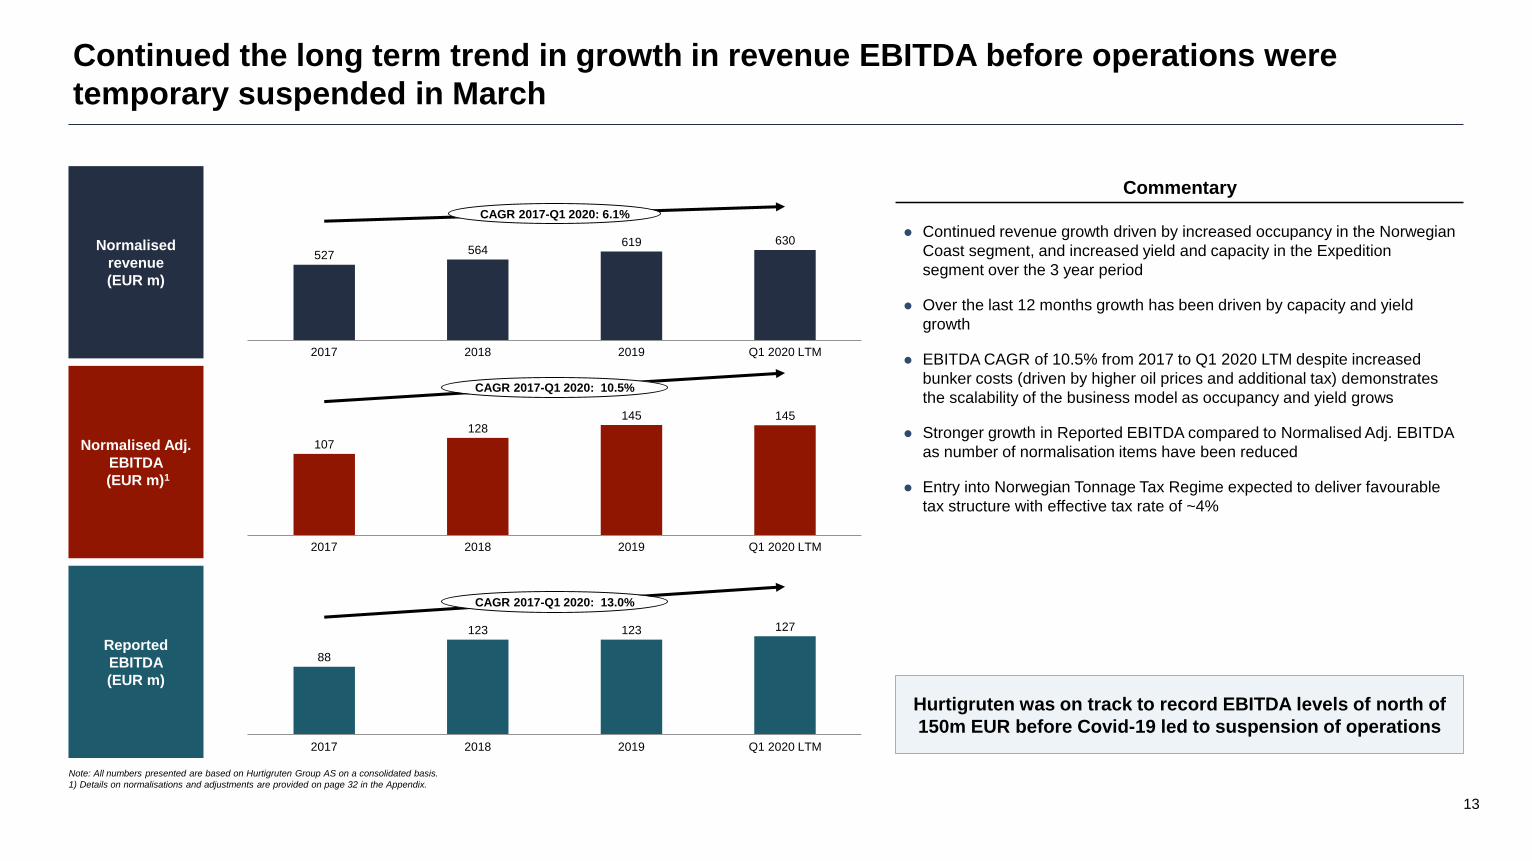
Continued the long term trend in growth in revenue EBITDA before operations were
temporary suspended in March
Note: All numbers presented are based on Hurtigruten Group AS on a consolidated basis.
1) Details on normalisations and adjustments are provided on page 32 in the Appendix.
Normalised Adj.
EBITDA
(EUR m)1
Normalised
revenue
(EUR m)
Reported
EBITDA
(EUR m)
⚫ Continued revenue growth driven by increased occupancy in the Norwegian
Coast segment, and increased yield and capacity in the Expedition
segment over the 3 year period
⚫ Over the last 12 months growth has been driven by capacity and yield
growth
⚫ EBITDA CAGR of 10.5% from 2017 to Q1 2020 LTM despite increased
bunker costs (driven by higher oil prices and additional tax) demonstrates
the scalability of the business model as occupancy and yield grows
⚫ Stronger growth in Reported EBITDA compared to Normalised Adj. EBITDA
as number of normalisation items have been reduced
⚫ Entry into Norwegian Tonnage Tax Regime expected to deliver favourable
tax structure with effective tax rate of ~4%
527 564619 630
2017 2018 2019 Q1 2020 LTM
CAGR 2017-Q1 2020: 6.1%
107
128145 145
2017 2018 2019 Q1 2020 LTM
CAGR 2017-Q1 2020: 10.5%
88
123 123 127
2017 Q1 2020 LTM2018 2019
CAGR 2017-Q1 2020: 13.0%
Commentary
Hurtigruten was on track to record EBITDA levels of north of
150m EUR before Covid-19 led to suspension of operations
14
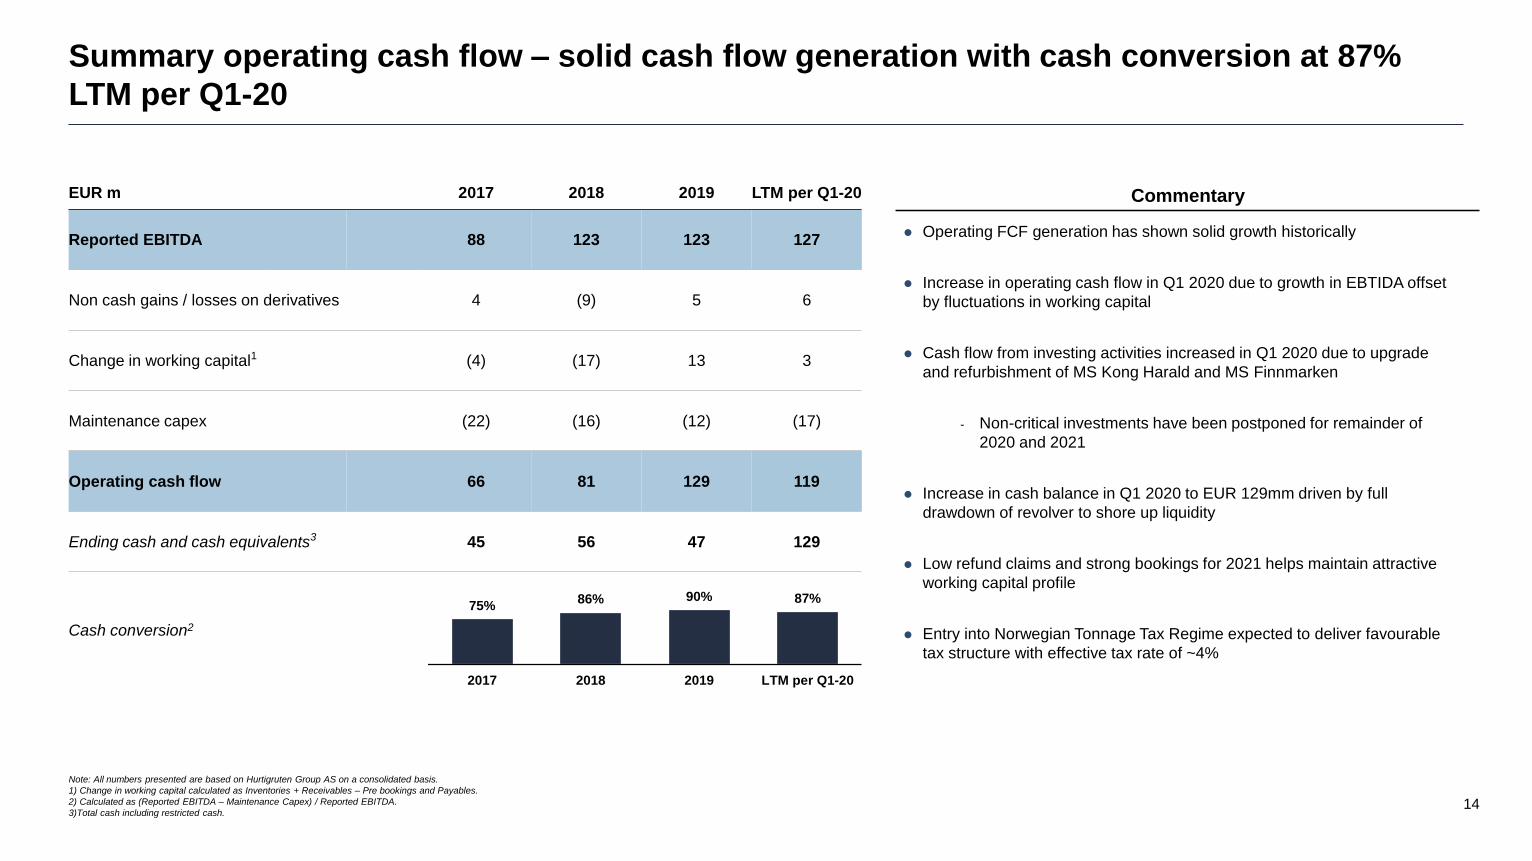
Summary operating cash flow – solid cash flow generation with cash conversion at 87%
LTM per Q1-20
Note: All numbers presented are based on Hurtigruten Group AS on a consolidated basis.
1) Change in working capital calculated as Inventories + Receivables – Pre bookings and Payables.
2) Calculated as (Reported EBITDA – Maintenance Capex) / Reported EBITDA.
3)Total cash including restricted cash.
⚫ Operating FCF generation has shown solid growth historically
⚫ Increase in operating cash flow in Q1 2020 due to growth in EBTIDA offset
by fluctuations in working capital
⚫ Cash flow from investing activities increased in Q1 2020 due to upgrade
and refurbishment of MS Kong Harald and MS Finnmarken
- Non-critical investments have been postponed for remainder of
2020 and 2021
⚫ Increase in cash balance in Q1 2020 to EUR 129mm driven by full
drawdown of revolver to shore up liquidity
⚫ Low refund claims and strong bookings for 2021 helps maintain attractive
working capital profile
⚫ Entry into Norwegian Tonnage Tax Regime expected to deliver favourable
tax structure with effective tax rate of ~4%
EUR m 2017 2018 2019 LTM per Q1-20
Reported EBITDA 88 123 123 127
Non cash gains / losses on derivatives 4 (9) 5 6
Change in working capital1 (4) (17) 13 3
Maintenance capex (22) (16) (12) (17)
Operating cash flow 66 81 129 119
Ending cash and cash equivalents3 45 56 47 129
75%86% 90% 87%
2017 2018 2019 LTM per Q1-20
Commentary
Cash conversion2
15
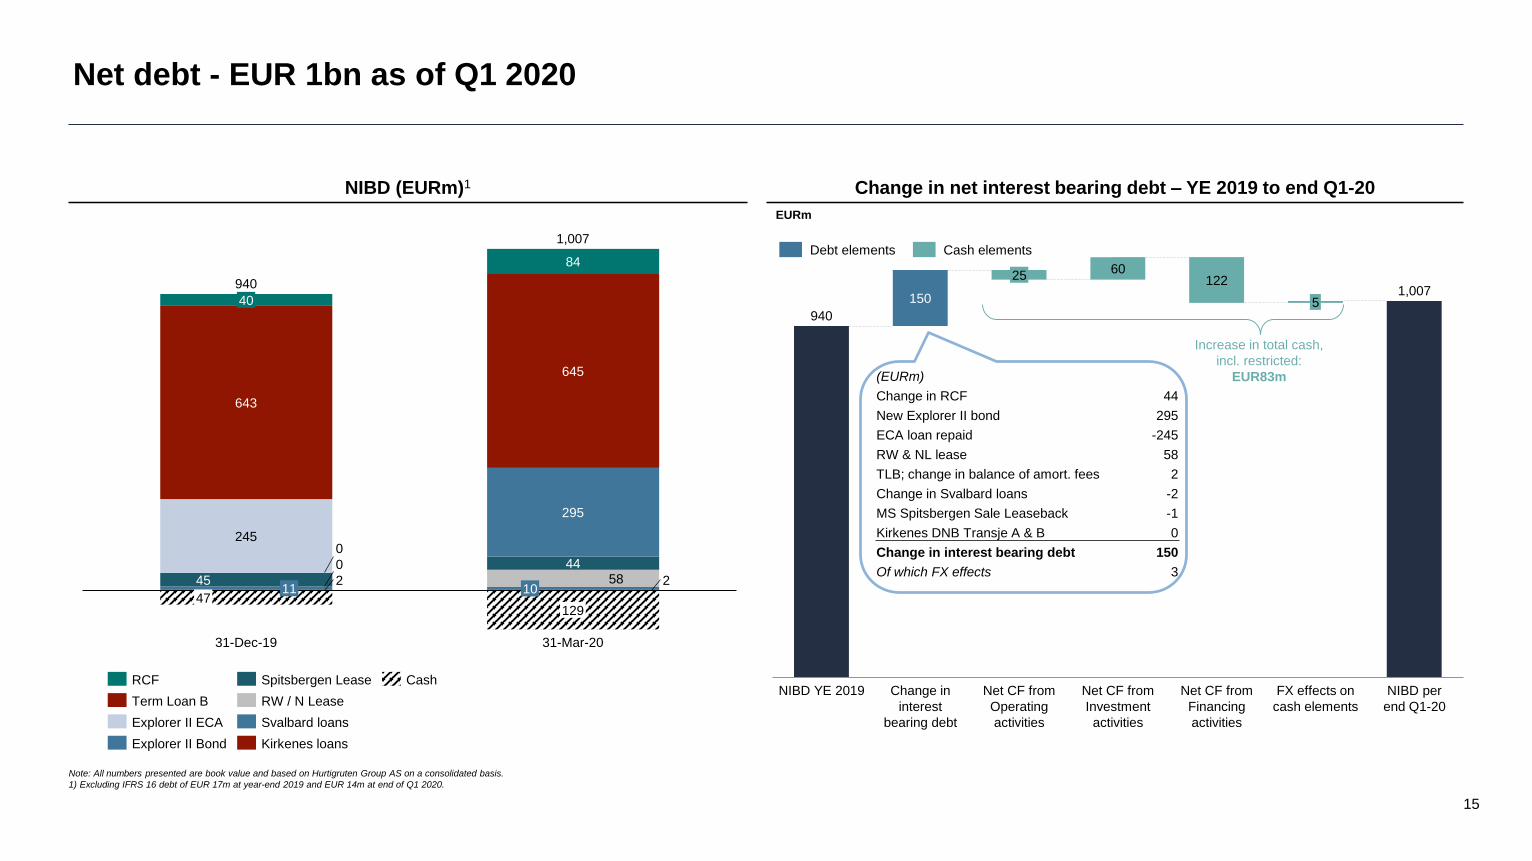
Net debt - EUR 1bn as of Q1 2020
Note: All numbers presented are book value and based on Hurtigruten Group AS on a consolidated basis.
1) Excluding IFRS 16 debt of EUR 17m at year-end 2019 and EUR 14m at end of Q1 2020.
40
643
11
645
2450
45
440
2
47
31-Dec-19
84
31-Mar-20
295
25810
129
940
1,007
NIBD (EURm)1
Term Loan B
RCF
Explorer II ECA
Explorer II Bond
Spitsbergen Lease
RW / N Lease
Svalbard loans
Kirkenes loans
Cash
60
NIBD YE 2019
150
Change in
interest
bearing debt
25 122
Net CF from
Operating
activities
Net CF from
Investment
activities
Net CF from
Financing
activities
5
FX effects on
cash elements
NIBD per
end Q1-20
940
1,007
(EURm)
Change in RCF 44
New Explorer II bond 295
ECA loan repaid -245
RW & NL lease 58
TLB; change in balance of amort. fees 2
Change in Svalbard loans -2
MS Spitsbergen Sale Leaseback -1
Kirkenes DNB Transje A & B 0
Change in interest bearing debt 150
Of which FX effects 3
EURm
Debt elements Cash elements
Increase in total cash,
incl. restricted:
EUR83m
Change in net interest bearing debt – YE 2019 to end Q1-20

16
All time high financial performance in Q1 driven by increased capacity and increase in yield
1) Normalised adjusted EBITDA is calculated as Reported EBITDA excluding other gains and losses adjusted for cost and revenue items which is deemed extraordinary, exceptional, unusual or non-recurring.
2) EUR 5.8m impact on EBITDA from effects of Covid-19 in March 2020.
129,4
140,2
Q1 2019 Q1 2020
Reported Total Revenue (EUR m) Reported EBITDA (EUR m) Normalised Adjusted EBITDA1 (EUR m)
+8.3% YoY
15,7
19,8
Q1 2019 Q1 2020
12.1% 14.1%Margin
(%)
19,7 19,2
Q1 2019 Q1 2020
15.2% 13.7%Margin
(%)
• Total Revenue growth of 8.3% YoY was driven by higher capacity and higher gross yield per cruise night, primarily due to the introduction of MS Roald Amundsen
• Normalized adjusted EBITDA margin was down 150bps YoY to 13.7%, driven by EUR 5.8m impact from effects of Covid-19; when further adjusted for Covid
impact, margin increased by 160bps YoY to 17.8%
• Before the effects of Covid-19, normalized adjusted EBITDA1 through February YTD was up 46% YoY due to higher ticket revenues per PCN and volumes from the
introduction of MS Roald Amundsen
25.02
/ 17.8%
17
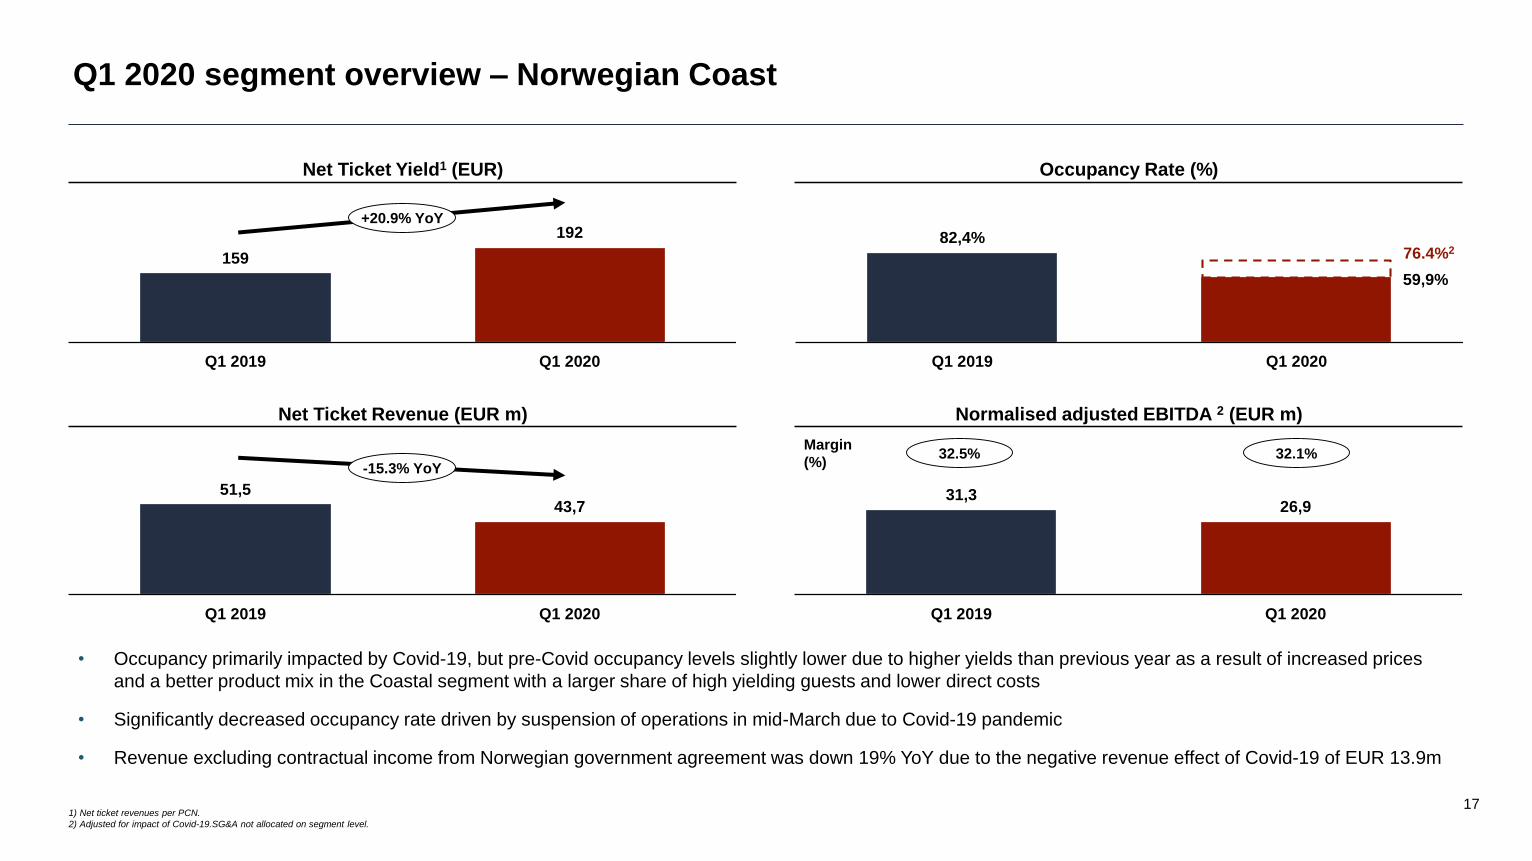
Q1 2020 segment overview – Norwegian Coast
159
192
Q1 2019 Q1 2020
Net Ticket Yield1 (EUR)
82,4%
59,9%
Q1 2019 Q1 2020
Occupancy Rate (%)
51,543,7
Q1 2019 Q1 2020
Net Ticket Revenue (EUR m)
• Occupancy primarily impacted by Covid-19, but pre-Covid occupancy levels slightly lower due to higher yields than previous year as a result of increased prices
and a better product mix in the Coastal segment with a larger share of high yielding guests and lower direct costs
• Significantly decreased occupancy rate driven by suspension of operations in mid-March due to Covid-19 pandemic
• Revenue excluding contractual income from Norwegian government agreement was down 19% YoY due to the negative revenue effect of Covid-19 of EUR 13.9m
+20.9% YoY
-15.3% YoY
76.4%2
1) Net ticket revenues per PCN.
2) Adjusted for impact of Covid-19.SG&A not allocated on segment level.
Normalised adjusted EBITDA 2 (EUR m)
31,326,9
Q1 2019 Q1 2020
32.5%Margin
(%)32.1%

18
Q1 2020 segment overview – Expedition
345
460
Q1 2019 Q1 2020
Net Ticket Yield1 (EUR)
93,2%
75,1%
Q1 2019 Q1 2020
Occupancy Rate (%)
17,7
36,1
Q1 2019 Q1 2020
Net Ticket Revenue (EUR m) Normalised adjusted EBITDA2 (EUR m)
• Net ticket yield, revenue and vessel contribution growth largely driven by the introduction of MS Roald Amundsen in H2 2019
• Decrease in occupancy driven by fewer voyages with 100% occupancy due to greater capacity and the effects of Covid-19 on operations for the last sailings in
March
• Rest of year performance of Expedition segment remains uncertain given suspension of sailings due to Covid-19 pandemic
+33.3% YoY
+103.6% YoY
84.1%2
9,8
18,5
Q1 2019 Q1 2020
38.4%Margin
(%)36.6%
1) Net ticket revenues per PCN.
2) Adjusted for impact of Covid-19.SG&A not allocated on segment level.
19
Liquidity Update
3

20
Flexible re-booking policy and
rebooking incentives
Non-critical investments
postponed
Warm lay-up of 14 out of 16
vessels
Temporary lay-offs and SG&A
initiatives
Norwegian and EU governments
provides support
during the downturn
A company-wide set of proactive measures initiated to improve our liquidity position
during the Covid-19 outbreak and to make sure the rebound will occur rapidly
I
II
III
IV
V
• On 18 March a flexible re-booking policy was initiated to give our passengers comfort to sail with Hurtigruten later in 2020 or 2021
• Important to be able to move as many bookings as possible into 2021 in order to reduce the amount of bookings required to fill 2021
in the main booking window in August-November 2020
• Only EUR 8.7m refund claims which is 20% of the deposits of cancelled sailings compared to industry average around of 50%
• All non-critical projects are put on hold until further notice, only critical maintenance work on ships is conducted
• Annual capex reduced, with net remaining capex of ~EUR 13m in 2020 and ~EUR 35m in 2021
• Potential to reduce 2021 capex further if the market does not recover as expected
• In order to reduce opex. 14 out of 16 ships temporarily warm stacked with only two ships currently operating on the Norwegian coast
• 85% of the crew has been temporary laid off and 73% of total number of employees
• Monthly cruise operating expenses including loss on fuel hedges reduced approx. 65% to ~EUR 6m per month
• Termination, pausing or renegotiation of consultant contracts
• Pause all non-essential traveling, non-committed marketing spend, centrally and across local markets
• Monthly SG&A costs have been reduced by approx. 60% to ~EUR 4m while the company is in the current operating state
• Deferral of all bonuses and 20% pay-cut for the management team
• Government backed guarantee loans expected to release up to EUR 15m by end of June
• Compensation support expected to release grants in the range of EUR 9m to be released by end of June
• Norwegian government extended the deadline to provide refunds to customers with cancelled sailings from 2 weeks to 3 months
• Germany is about to give state credit support to issued vouchers to incentivize guests to take vouchers
• France as implemented mandatory vouchers that can be refunded no earlier than 31.12.2021
Note: Numbers converted from NOK to EUR using a EUR/NOK exchange rate of 9.8500.
21
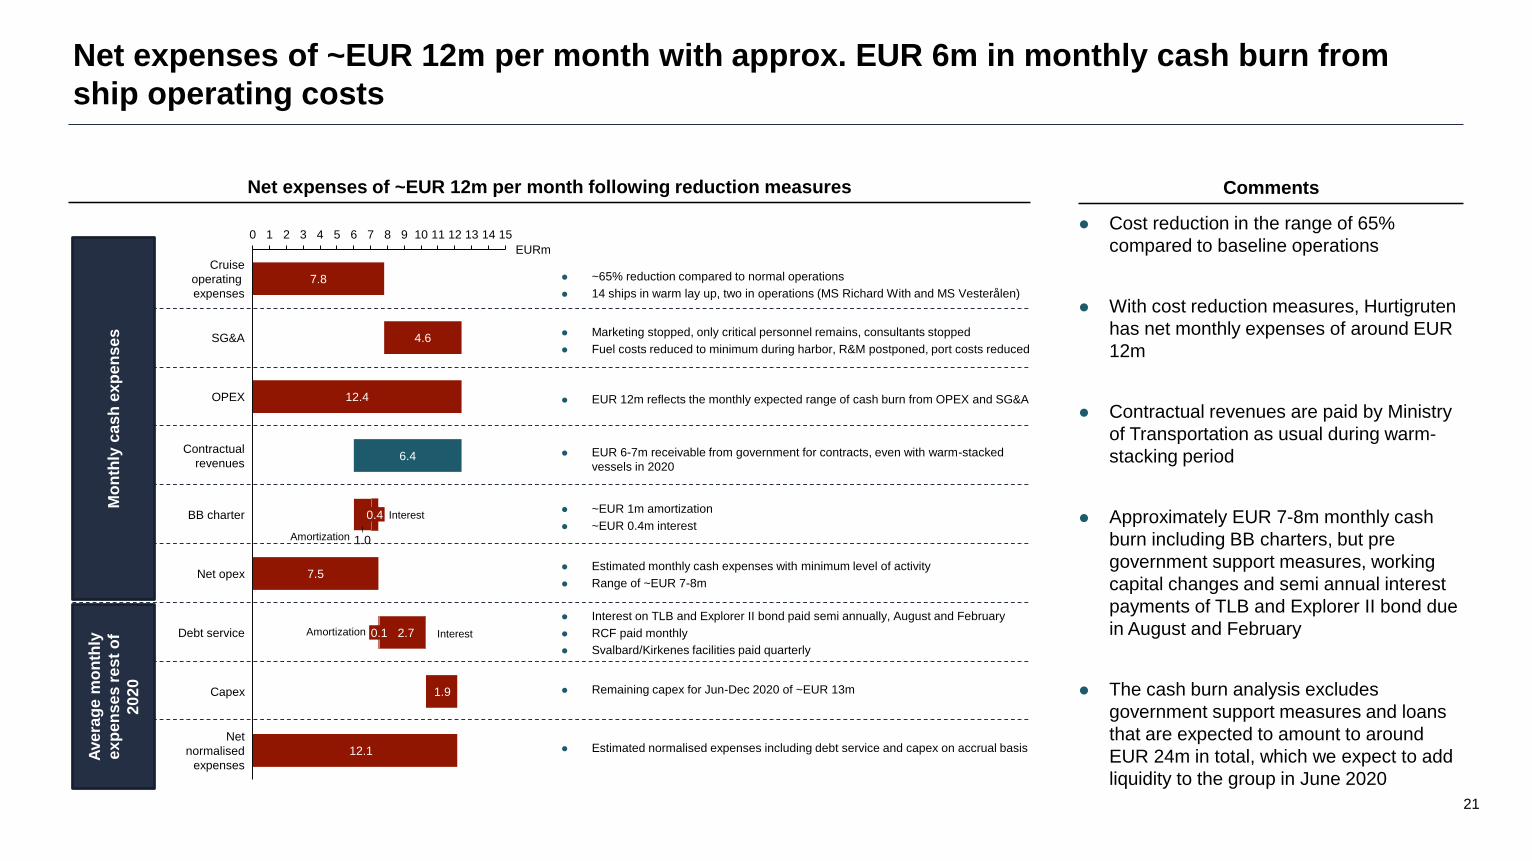
Net expenses of ~EUR 12m per month with approx. EUR 6m in monthly cash burn from
ship operating costs
CommentsNet expenses of ~EUR 12m per month following reduction measures
⚫ Cost reduction in the range of 65%
compared to baseline operations
⚫ With cost reduction measures, Hurtigruten
has net monthly expenses of around EUR
12m
⚫ Contractual revenues are paid by Ministry
of Transportation as usual during warm-
stacking period
⚫ Approximately EUR 7-8m monthly cash
burn including BB charters, but pre
government support measures, working
capital changes and semi annual interest
payments of TLB and Explorer II bond due
in August and February
⚫ The cash burn analysis excludes
government support measures and loans
that are expected to amount to around
EUR 24m in total, which we expect to add
liquidity to the group in June 2020
4 10 11 1560 1271 2 133 145 8 9
12.1
0.1
BB charter
6.4Contractual
revenues
EURm
Cruise
operating
expenses
4.6SG&A
Debt service
12.4OPEX
0.4
1.0
7.5Net opex
1.9Capex
Net
normalised
expenses
2.7
7.8 ⚫ ~65% reduction compared to normal operations
⚫ 14 ships in warm lay up, two in operations (MS Richard With and MS Vesterålen)
⚫ Marketing stopped, only critical personnel remains, consultants stopped
⚫ Fuel costs reduced to minimum during harbor, R&M postponed, port costs reduced
⚫ EUR 6-7m receivable from government for contracts, even with warm-stacked
vessels in 2020
⚫ ~EUR 1m amortization
⚫ ~EUR 0.4m interest
⚫ Interest on TLB and Explorer II bond paid semi annually, August and February
⚫ RCF paid monthly
⚫ Svalbard/Kirkenes facilities paid quarterly
⚫ Remaining capex for Jun-Dec 2020 of ~EUR 13m
Mo
nth
ly c
as
h e
xp
en
se
s
Ave
rag
e m
on
thly
ex
pe
ns
es r
es
t o
f
20
20
⚫ EUR 12m reflects the monthly expected range of cash burn from OPEX and SG&A
Amortization
Interest
Amortization Interest
⚫ Estimated monthly cash expenses with minimum level of activity
⚫ Range of ~EUR 7-8m
⚫ Estimated normalised expenses including debt service and capex on accrual basis

22
Low risk on pre-payments; majority of customers are rebooking journeys and
governmental directives effectively reduces risks of refund claims in the short term
Build-up of existing customer pre-payments1
EUR 57m
Overview of pre-payments split by future sailings date1
Comments• Government policies move customers towards re-booking rather than making refund claims
• Near-term bookings have pre-dominantly taken action and moved to postpone journey – refund claims of 20% of prepayments associated with cancelled sailings (EUR 8.7m)
• As traveling in Northern Europe opens up we expect a lower level of refund claims compared to the last 2 months
Only ~EUR 8.7m
refund claims
made to date
1) Shows the pre-payments received divided into the respective months where the departure date of the cruise. Status as per 24 May 2020. Underlying currency assumptions: EURNOK = 10.95, USDNOK = 10.04, GBPNOK = 12.24, SEKNOK = 1.04, DKKNOK = 1.47, AUDNOK = 6.57, CADNOK = 7.18.
EUR 110m pre-
paid as of
15 March 2020
52 52
4
32
21
110
Ordinary Bookings Identified RebookBacklog
Identified Vouchers Likely Rebooked Total
0
2
4
6
8
10
12
14
Ordinary Bookings Identified Rebook Backlog Identified Vouchers Likely RebookedEUR m EUR m

23
EUR m
Good visibility of the liquidity runway for remainder of 2020 based on current information
and trends
Extended warm layup2 case – assumes operations begin in January 2021
Assumes operations1 begin in June 2020
EUR m
100
52 39
30
100
24
124
53
20
13
9
Cash balanceon 19 May
2020
Governmentsupport
Gross liquidity Net opex Debt service Capex Refund claims Net liquidityYE 2020
100
78 65
56
100
24
124
26
20
13
9
Cash balanceon 19 May
2020
Governmentsupport
Gross liquidity Net opex Debt service Capex Refund claims Net liquidityYE 2020
EUR m
Remainder Q1 / Q2 37
Q3 24
Q4 14
Total 2020 Customer Pre-payments 76
Less: Total 2020 Vouchers issued for cancelled sailings 32
Total 2020 Pre-payments net of vouchers 44
Total 2021+ Pre-payments 34
May 19th Pre-payments balance 110
Customer pre-payments as of 15 March 20203
Future cash
refunds
⚫ Out of the total cancelled bookings, guests have requested cash refunds for
approximately EUR 8.7 million as of 19 May 2020, which is a refund share of
20% of pre-payments related to cancelled sailings
⚫ 80% of the prepayments of cancelled sailings are either converted to a
voucher or rebooked to future sailings
“Voluntary vouchers instead of ‘money back.’ With the additional state bankruptcy
protection, we create a real incentive for vouchers instead of repaying the deposit if
the trip is canceled because of the corona pandemic”Christine Lambrecht
German Minister of Justice and Consumer ProtectionMay 20, 2020
56
Future cash
refunds
30
1) Gradual phasing of operations, with at least four ships from mid-June
2) 14 out of 16 ships in warm lay-up (crew onboard to keep machinery and necessary equipment ready and available in order to re-start operations on short notice)
3) Shows the pre-payments received divided into the respective months where the departure date of the cruise. Status as per 24 May 2020. Underlying currency assumptions: EURNOK = 10.95, USDNOK = 10.04, GBPNOK = 12.24, SEKNOK = 1.04, DKKNOK = 1.47, AUDNOK = 6.57, CADNOK = 7.18.

24
Summary and Outlook
4

25
Hurtigruten came into the Covid-19 crisis from a position of strength with all time high revenues, EBITDA and customer satisfaction which is an
excellent platform to rebound from when travel restrictions are lifted
Comfortable liquidity position of ~EUR 100m as of 19 May 2020 incl. the EUR 85m RCF that is fully drawn with low level of refund claims of 20%
compared to the industry average of 50% and with no newbuild programs/capital commitments
Hurtigruten’s differentiated destinations in regions with low level of infections and small ship focus position us well as the cruise industry emerges
from Covid-19
Majority of customer base in adjacent countries provide comfort in face of Covid-19 with key markets like the Nordics and Germany opening borders
in June and July supporting profitable operations along the Norwegian coast from Q3 2020
The very strong customer satisfaction supports the strong booking development for 2021 with current 2021 bookings 3.8% higher compared to same
time last year – Above 20% of Pre-Covid-19 2021 sales targets already achieved with main booking period commencing
We have the platform to quickly rebound as travel restrictions are lifted leveraging on our
strong customer satisfaction and source markets close to our destinations
I
II
III
IV
V

26
Appendix
5

27
Increased capacity coupled with increasing occupancy and revenue yield demonstrates
the attractiveness and robustness of Hurtigruten’s offering
1) Figures does not include further newbuilds beyond MS Roald Amundsen and MS Fridtjof Nansen.
2) Occupancy = Passenger cruise nights / Available passenger cruise nights (PCN/APCN).
3) Gross revenue yield = Total revenue / Passenger cruise nights. Excluding revenue from Government agreement for Norwegian Coast ((Total revenue – Contract revenues) / Passenger cruise nights).
Q1-20 LTM20182017
1596
2019
1613
238
228
1619
288
1605
337
167
1 249
2019
222
2017
155
2018 Q1-20 LTM
1 3531 314
1 217
249
78%
84%81%
76%
65%
73%77%
74%
2017 Q1-20 LTM2018 2019
271 271 282 293
551585
610643
20182017 2019 Q1-20 LTM
Norwegian Coast Expedition
Expedition segment expected to
constitute more than half of total
capacity from 2021 and onwards
Passenger cruise nights has grown at
a higher rate than overall capacity…
…yielding increased occupancy
levels, also in the shoulder
seasons
Focused product offering has
resulted in growing yield. Yield in
Expedition segment ~100% higher
than Norwegian Coast historically
Available passenger cruise nights1 Passenger cruise nights Occupancy2 Gross revenue yield3
Thousands Thousands EURLess focus on catering to low-yield
passengers such as bus groups has
resulted in slight reduction in occupancy
in the Norwegian Coast segment for 2019
and Q1 2020. The effect is offset by
increased yield levels
28
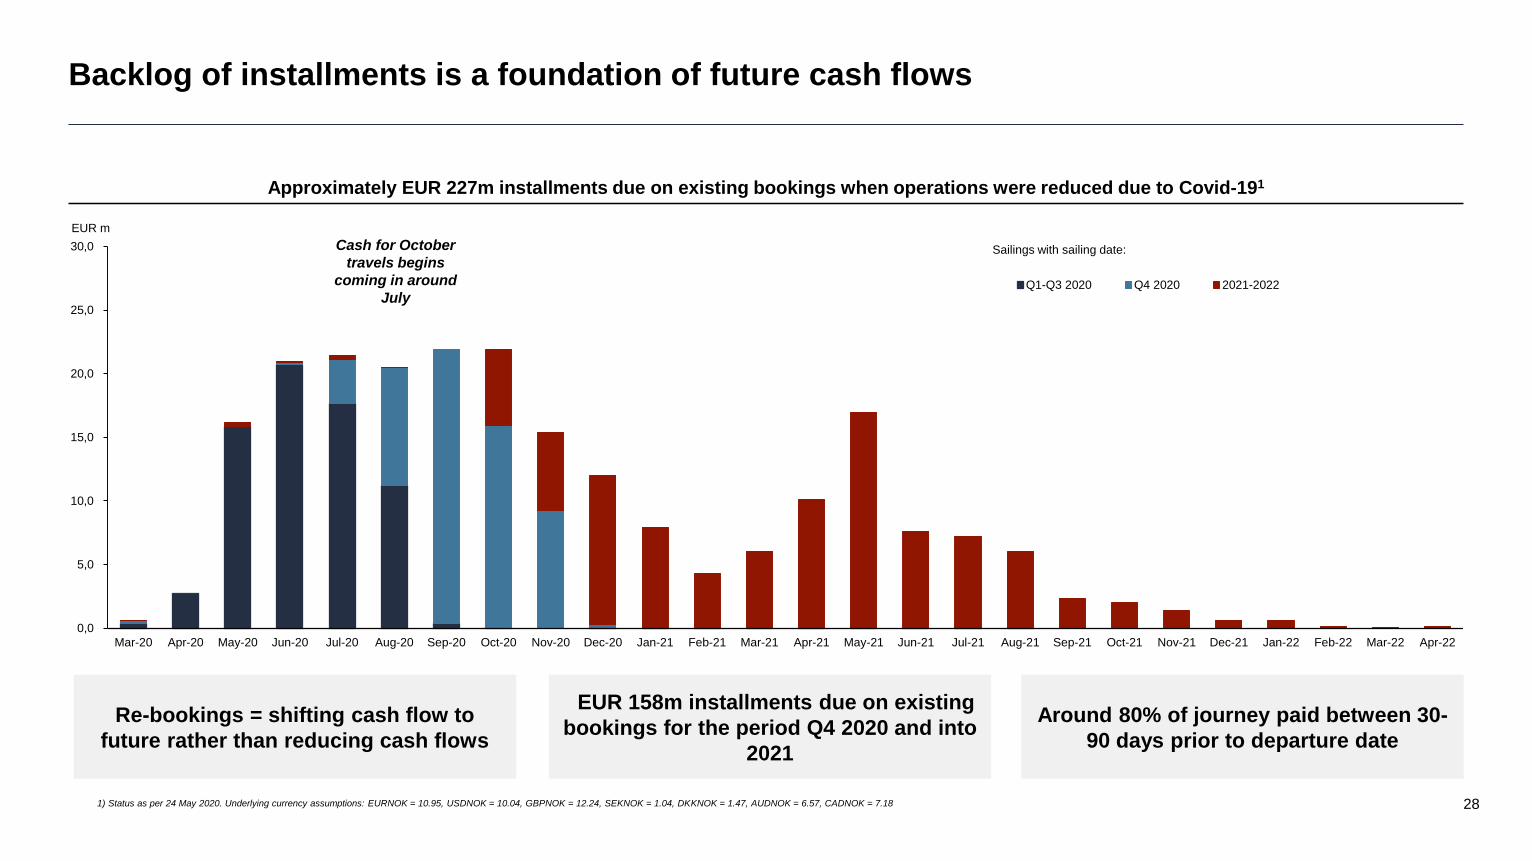
Approximately EUR 227m installments due on existing bookings when operations were reduced due to Covid-191
Backlog of installments is a foundation of future cash flows
1) Status as per 24 May 2020. Underlying currency assumptions: EURNOK = 10.95, USDNOK = 10.04, GBPNOK = 12.24, SEKNOK = 1.04, DKKNOK = 1.47, AUDNOK = 6.57, CADNOK = 7.18
0,0
5,0
10,0
15,0
20,0
25,0
30,0
Mar-20 Apr-20 May-20 Jun-20 Jul-20 Aug-20 Sep-20 Oct-20 Nov-20 Dec-20 Jan-21 Feb-21 Mar-21 Apr-21 May-21 Jun-21 Jul-21 Aug-21 Sep-21 Oct-21 Nov-21 Dec-21 Jan-22 Feb-22 Mar-22 Apr-22
Q1-Q3 2020 Q4 2020 2021-2022
EUR m
Sailings with sailing date:Cash for October
travels begins
coming in around
July
EUR 158m installments due on existing
bookings for the period Q4 2020 and into
2021
Around 80% of journey paid between 30-
90 days prior to departure date
Re-bookings = shifting cash flow to
future rather than reducing cash flows

29
Historical key financials
Note: All numbers presented are based on Hurtigruten Group AS on a consolidated basis.
1) Vessel contribution is defined as EBITDA contribution before SG&A, specifically calculated as revenue – total direct costs – total cruise operating expenses, 2) Refer to detailed breakdown of the adjustment on page [57], 3) Total cash including restricted cash, 4) The bond in the amount of EUR 455m, and the multicurrency
revolving credit Facility in the amount of NOK 779m were refinanced in February 2018, and as such were classified as current liabilities at 31 December 2017, 5) Book value of debt excluding IFRS 16 debt. IFRS 16 debt was EUR 17m at year-end 2019 and EUR 14m at end of Q1 2020, 6) Calculated as (Reported EBITDA –
Maintenance Capex) / Reported EBITDA.
Strong revenue growth in the last years, mainly driven by
- Yield
- Occupancy
- Capacity
Historical positive margin trend driven by economies of scale and increase in average
yield
Currency translation effect and foreign exchange effect on loans (main facilities
denominated in EUR)
Substantial cash generation from low working capital, with pre-bookings supporting the
funding of the operations, capex and debt service
Commentary
Cash conversion6
75%
86%90% 87%
Q1 2020 LTM
When adjusting for difference between market value and book value of fleet, equity ratio
would increase
EURm 2017 2018 2019 Q1 2020 LTM
P&L items
Revenue 527 566 609 620
Growth 11.9 % 7.4 % 7.6 % 1.8 %
Contribution1 188 204 235 237
Contribution % 35.6 % 36.0 % 38.6 % 38.3 %
EBITDA 88 123 123 127
EBITDA margin 16.8 % 21.7 % 20.1 % 20.6 %
Normalised adj. EBITDA2 107 128 145 145
Normalised adj. EBITDA margin 20.3 % 22.6 % 23.8 % 23.4%
EBIT 36 73 68 71
EBIT margin 6.49% 12.8 % 11.1 % 11.5%
Net interests and other financial costs (53) (52) (28) (45)
Net currency gains / losses (37) (15) 10 (22)
Net income (57) 47 (18) 6
Net income margin n.m. 8.3 % -2.9 % 4.8%
BS items
Cash3 45 56 47 129
Total current assets 102 118 113 191
Total assets 838 1,011 1,394 1,448
Total equity 54 69 63 15
Equity ratio 6.3 % 6.8 % 4.7 % 1.0 %
Total current liabilities4 709 189 333 268
NIBD5 543 642 940 1,007
NIBD/Norm adj. EBITDA 5.1x 5.0x 6.5x 6.9x
CF items
Change in NWC (4) (17) 13 3
Operating cash flow 95 105 141 144
Capex (66) (59) (405) (445)
Cash conversion7 75% 86% 90% 87%

30
Norwegian Coast segment – Key financials
1) Vessel contribution is defined as EBITDA contribution before SG&A, specifically calculated as revenue – total direct costs – total cruise operating expenses.
2) Net revenue = Total revenue – Contractual revenues – Goods revenues – Total direct cost.
⚫ All time high revenue and contribution from Norwegian Coast segment in 2019, driven by strong occupancy, stable PCN and
positive yield development
- Revenue growth of 1.1% from 2018 to 2019
- Q1 2020 negatively affected by Covid-19 but higher net revenue per PCN partially offsets the contribution reduction
⚫ Decreased occupancy is mostly driven by decreased focus on local transport passengers (low yield). This gives a drop in
occupancy, but this is offset by the increase in yield
⚫ The increase in net ticket revenue is driven by a combination of passenger mix (less focus on low yielding on-deck passengers),
higher prices, increased sales of excursions
⚫ Improvement in net revenue driven by direct cost trending down in % and gross yield increasing
Norwegian Coast (EURm) 2017 2018 2019 Q1 2020 LTM
PCNs - 000 1,249 1,353 1,314 1,217
Growth 10.8 % 8.3 % -2.9 % -7.4 %
APCNs - 000 1,596 1,613 1,619 1,605
Growth -3.9 % 1.1 % 0.4 % -3.8 %
Occupancy 78.3 % 83.8 % 81.2 % 75.8 %
Total revenues 410 439 444 432
of which contractual and goods revenues 72 73 73 75
Direct costs 102 109 105 98
Cruise operating costs 159 166 164 163
Of which fuel costs 42 50 50 48
Vessel contribution1 150 164 175 170
Vessel contribution – margin 36.5 % 37.3 % 39.4 % 39.4%
Norm. vessel contribution 152 164 176 177
Net revenue2 per PCN – EUR 189 190 202 212

31
Expedition segment – Key financials
1) Vessel contribution is defined as EBITDA contribution before SG&A, specifically calculated as revenue – total direct costs – total cruise operating expenses.
2) Net revenue = Total revenue – Total direct cost.
⚫ Strong performance in the Expedition segment with revenue growth of 12.2% from 2019 to Q1 2020 LTM, driven by both PCN and
yield growth, despite negative Covid-19 effects
⚫ Strong operations with strong customer feedback
⚫ Strong utilisation on the Antarctica sailings and in the segment in general
Expedition (EURm) 2017 2018 2019 Q1 2020 LTM
PCNs - 000 155 167 222 249
Growth 28.0 % 6.9 % 33.1 % 12.2 %
APCNs - 000 238 228 288 337
Growth 51.1 % 1.3 % 24.5 % 12.5 %
Occupancy 65.4 % 73.1 % 77.0 % 74.0%
Total revenues 86 97 135 160
Direct costs 26 34 43 49
Cruise operating costs 32 34 45 56
Of which fuel costs 7 8 11 13
Vessel contribution1 27 30 48 55
Vessel contribution margin 31.4 % 30.4 % 35.2 % 34.4 %
Norm. vessel contribution 27 35 56 64
Net revenue2 per PCN – EUR 381 377 414 446