Germanium quantum dots: Optical properties and synthesis · sealed pressure vessel at 270 “C. The...
9
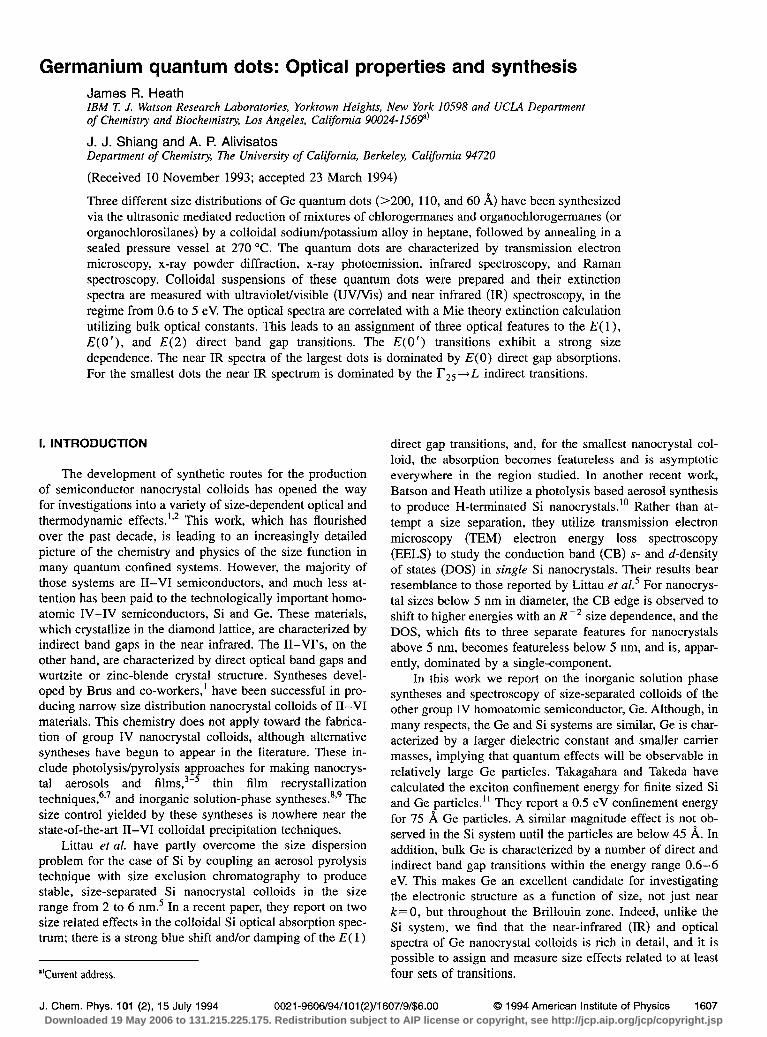
Germanium quantum dots: Optical properties and synthesis James R. Heath IBM ‘ I .I. Watson Research Laboratories, Yorktown Heights, New York 10598 and UCLA Department of Chemistry and Biochemistv, Los Angeles, California 90024-1569”’ J. J. Shiang and A. P. Alivisatos Department of Chemistry, The University of California, Berkeley, California 94720 (Received 10 November 1993; accepted 23 March 1994) Three different size distributions of Ge quantum dots (>200, 110, and 60 A) have been synthesized via the ultrasonic mediated reduction of mixtures of chlorogermanes and organochlorogermanes (or organochlorosilanes) by a colloidal sodium/potassium alloy in heptane, followed by annealing in a sealed pressure vessel at 270 “C. The quantum dots are characterized by transmission electron microscopy, x-ray powder diffraction, x-ray photoemission, infrared spectroscopy, and Raman spectroscopy. Colloidal suspensions of these quantum dots were prepared and their extinction spectra are measured with ultraviolet/visible (UVNis) and near infrared (IR) spectroscopy, in the regime from 0.6 to 5 eV. The optical spectra are correlated with a Mie theory extinction calculation utilizing bulk optical constants. This leads to an assignment of three optical features to the E(l), E( 0 ‘ ), and E( 2) direct band gap transitions. The E(0’ ) transitions exhibit a strong size dependence. The near IR spectra of the largest dots is dominated by E(0) direct gap absorptions. For the smallest dots the near IR spectrum is dominated by the rz5-+L indirect transitions. I. INTRODUCTION The development of synthetic routes for the production of semiconductor nanocrystal colloids has opened the way for investigations into a variety of size-dependent optical and thermodynamic effects.‘ ,2 This work, which has flourished over the past decade, is leading to an increasingly detailed picture of the chemistry and physics of the size function in many quantum confined systems. However, the majority of those systems are II-VI semiconductors, and much less at- tention has been paid to the technologically important homo- atomic IV-IV semiconductors, Si and Ge. These materials, which crystallize in the diamond lattice, are characterized by indirect band gaps in the near infrared. The II-VI’s, on the other hand, are characterized by direct optical band gaps and wurtzite or zinc-blende crystal structure. Syntheses devel- oped by Brus and co-workers,’ have been successful in pro- ducing narrow size distribution nanocrystal colloids of II-VI materials. This chemistry does not apply toward the fabrica- tion of group IV nanocrystal colloids, although alternative syntheses have begun to appear in the literature. These in- clude photolysis/pyrolysis approaches for making nanocrys- tal aerosols and films,3-5 thin film recrystallization techniques,6*7 and inorganic solution-phase syntheses.8*9 The size control yielded by these syntheses is nowhere near the state-of-the-art II-VI colloidal precipitation techniques. Littau et ul. have partly overcome the size dispersion problem for the case of Si by coupling an aerosol pyrolysis technique with size exclusion chromatography to produce stable, size-separated Si nanocrystal colloids in the size range from 2 to 6 nm.5 In a recent paper, they report on two size related effects in the colloidal Si optical absorption spec- trum; there is a strong blue shift and/or damping of the E( 1) *‘Current address. direct gap transitions, and, for the smallest nanocrystal col- loid, the absorption becomes featureless and is asymptotic everywhere in the region studied. In another recent work, Batson and Heath utilize a photolysis based aerosol synthesis to produce H-terminated Si nanocrystals.” Rather than at- tempt a size separation, they utilize transmission electron microscopy (TEM) electron energy loss spectroscopy (EELS) to study the conduction band (CB) s- and d-density of states (DOS) in single Si nanocrystals. Their results bear resemblance to those reported by Littau er ~1.~For nanocrys- tal sizes below 5 nm in diameter, the CB edge is observed to shift to higher energies with an RT2 size dependence, and the DOS, which fits to three separate features for nanocrystals above 5 nm, becomes featureless below 5 nm, and is, appar- ently, dominated by a single-component. In this work we report on the inorganic solution phase syntheses and spectroscopy of size-separated colloids of the other group IV homoatomic semiconductor, Ge. Although, in many respects, the Ge and Si systems are similar, Ge is char- acterized by a larger dielectric constant and smaller carrier masses, implying that quantum effects will be observable in relatively large Ge particles. Takagahara and Takeda have calculated the exciton confinement energy for finite sized Si and Ge particles.” They report a 0.5 eV confinement energy for 75 8, Ge particles. A similar magnitude effect is not ob- served in the Si system until the particles are below 45 A. In addition, bulk Ge is characterized by a number of direct and indirect band gap transitions within the energy range 0.6-6 eV. This makes Ge an excellent candidate for investigating the electronic structure as a function of size, not just near k = 0, but throughout the Brillouin zone. Indeed, unlike the Si system, we find that the near-infrared (IR) and optical spectra of Ge nanocrystal colloids is rich in detail, and it is possible to assign and measure size effects related to at least four sets of transitions. J. Chem. Phys. 101 (2), 15 July 1994 0021-9606/94/l 01(2)/l 607/9/$6.00 0 1994 American Institute of Physics 1607 Downloaded 19 May 2006 to 131.215.225.175. Redistribution subject to AIP license or copyright, see http://jcp.aip.org/jcp/copyright.jsp
Transcript of Germanium quantum dots: Optical properties and synthesis · sealed pressure vessel at 270 “C. The...
Germanium quantum dots: Optical properties and synthesis James R. Heath IBM ‘I .I. Watson Research Laboratories, Yorktown Heights, New York 10598 and UCLA Department of Chemistry and Biochemistv, Los Angeles, California 90024-1569”’
J. J. Shiang and A. P. Alivisatos Department of Chemistry, The University of California, Berkeley, California 94720
(Received 10 November 1993; accepted 23 March 1994)
Three different size distributions of Ge quantum dots (>200, 110, and 60 A) have been synthesized via the ultrasonic mediated reduction of mixtures of chlorogermanes and organochlorogermanes (or organochlorosilanes) by a colloidal sodium/potassium alloy in heptane, followed by annealing in a sealed pressure vessel at 270 “C. The quantum dots are characterized by transmission electron microscopy, x-ray powder diffraction, x-ray photoemission, infrared spectroscopy, and Raman spectroscopy. Colloidal suspensions of these quantum dots were prepared and their extinction spectra are measured with ultraviolet/visible (UVNis) and near infrared (IR) spectroscopy, in the regime from 0.6 to 5 eV. The optical spectra are correlated with a Mie theory extinction calculation utilizing bulk optical constants. This leads to an assignment of three optical features to the E(l), E( 0 ‘), and E( 2) direct band gap transitions. The E(0’) transitions exhibit a strong size dependence. The near IR spectra of the largest dots is dominated by E(0) direct gap absorptions. For the smallest dots the near IR spectrum is dominated by the rz5-+L indirect transitions.
I. INTRODUCTION
The development of synthetic routes for the production of semiconductor nanocrystal colloids has opened the way for investigations into a variety of size-dependent optical and thermodynamic effects.‘,2 This work, which has flourished over the past decade, is leading to an increasingly detailed picture of the chemistry and physics of the size function in many quantum confined systems. However, the majority of those systems are II-VI semiconductors, and much less at- tention has been paid to the technologically important homo- atomic IV-IV semiconductors, Si and Ge. These materials, which crystallize in the diamond lattice, are characterized by indirect band gaps in the near infrared. The II-VI’s, on the other hand, are characterized by direct optical band gaps and wurtzite or zinc-blende crystal structure. Syntheses devel- oped by Brus and co-workers,’ have been successful in pro- ducing narrow size distribution nanocrystal colloids of II-VI materials. This chemistry does not apply toward the fabrica- tion of group IV nanocrystal colloids, although alternative syntheses have begun to appear in the literature. These in- clude photolysis/pyrolysis approaches for making nanocrys- tal aerosols and films,3-5 thin film recrystallization techniques,6*7 and inorganic solution-phase syntheses.8*9 The size control yielded by these syntheses is nowhere near the state-of-the-art II-VI colloidal precipitation techniques.
Littau et ul. have partly overcome the size dispersion problem for the case of Si by coupling an aerosol pyrolysis technique with size exclusion chromatography to produce stable, size-separated Si nanocrystal colloids in the size range from 2 to 6 nm.5 In a recent paper, they report on two size related effects in the colloidal Si optical absorption spec- trum; there is a strong blue shift and/or damping of the E( 1)
*‘Current address.
direct gap transitions, and, for the smallest nanocrystal col- loid, the absorption becomes featureless and is asymptotic everywhere in the region studied. In another recent work, Batson and Heath utilize a photolysis based aerosol synthesis to produce H-terminated Si nanocrystals.” Rather than at- tempt a size separation, they utilize transmission electron microscopy (TEM) electron energy loss spectroscopy (EELS) to study the conduction band (CB) s- and d-density of states (DOS) in single Si nanocrystals. Their results bear resemblance to those reported by Littau er ~1.~ For nanocrys- tal sizes below 5 nm in diameter, the CB edge is observed to shift to higher energies with an RT2 size dependence, and the DOS, which fits to three separate features for nanocrystals above 5 nm, becomes featureless below 5 nm, and is, appar- ently, dominated by a single-component.
In this work we report on the inorganic solution phase syntheses and spectroscopy of size-separated colloids of the other group IV homoatomic semiconductor, Ge. Although, in many respects, the Ge and Si systems are similar, Ge is char- acterized by a larger dielectric constant and smaller carrier masses, implying that quantum effects will be observable in relatively large Ge particles. Takagahara and Takeda have calculated the exciton confinement energy for finite sized Si and Ge particles.” They report a 0.5 eV confinement energy for 75 8, Ge particles. A similar magnitude effect is not ob- served in the Si system until the particles are below 45 A. In addition, bulk Ge is characterized by a number of direct and indirect band gap transitions within the energy range 0.6-6 eV. This makes Ge an excellent candidate for investigating the electronic structure as a function of size, not just near k = 0, but throughout the Brillouin zone. Indeed, unlike the Si system, we find that the near-infrared (IR) and optical spectra of Ge nanocrystal colloids is rich in detail, and it is possible to assign and measure size effects related to at least four sets of transitions.
J. Chem. Phys. 101 (2), 15 July 1994 0021-9606/94/l 01(2)/l 607/9/$6.00 0 1994 American Institute of Physics 1607 Downloaded 19 May 2006 to 131.215.225.175. Redistribution subject to AIP license or copyright, see http://jcp.aip.org/jcp/copyright.jsp
1608 Heath, Shiang, and Alivisatos: Germanium quantum dots
II. EXPERIMENT
A. Particle synthesis Inorganic solution-phase synthetic routes for fabricating
group IV nanostructures have been developed at the IBM laboratory over the past year, and some of that chemistry is described elsewhere.* The reaction utilized here is
-+Ge,i,+NaCl+KCl. (0
In this nomenclature, R is some organic functional group, and M designates either Si or Ge. The function of the R-group is to serve as a crystallite capping group in order to limit the nanocrystal size and to keep the nanocrystals as separate entities. As is discussed below, the success of this scheme is dependent on the R-group. However, for the case in which just GeCl, is reduced, the final product is charac- terized as large grain polyGe, and much of the product ends up as a thick polycrystalline film coating the surface of the reaction vessel. With the addition of the derivatized reagent, some size control and separability is always achieved. The powders are sparingly soluble in polar solvents such as methanol and acetonitrile as well as nonpolar solvents such as carbon disulfide. The present low solubility limits the types of physical measurements which can be performed and we are currently searching for ways to increase the solubility of the nanocrystals.
m/ total volume of initial reagents were measured out, and separated into aliquots of 0.75 m/. One aliquot was reduced with an equivalent amount (based on Cl) of NaK alloy, as described above. After the reduced mixture was added to the pressure vessel, and prior to sealing the vessel, the other aliquot was added. During the crystallization step, the excess reagent adds epitaxially onto the nanocrystals. The product morphologies for this reaction are reasonably well isolated (111) oriented platelets, reflecting the varying solution phase epitaxy rates on different Ge crystal surfaces. Although the s200 s’tructures are platelets, transmission electron micro- scopy (TEM) indicates that they are not quite two- dimensional quantum structures, as they are characterized by a thickness of - 150-200 A. The width/thickness aspect ratio of these particles is in the range from 5 to 10. For the pur- pose of this paper, these are large particles and should not exhibit any quantum size effects in the measured extinction spectra. The ~100 synthesis was carried out in a similar man- ner, except that all the starting material was reduced in the nucleation step. TEM yields an average size distribution cen- tered - 110 A, with no particles observed smaller than 80 A. There is, however, a tail in the size distribution out to large (-150 A) particles.
The syntheses are performed in two steps, nucleation followed by crystallization. For the nucleation step a l/l mo- lar ratio of NaK alloy is weighed out, such that there is one equivalent of reducing agent [eq(Na)+eq(K)] for each Cl equivalent in Eq. (1). After the method of Bianconi et aZ.12 an ultrafine NaK alloy dispersion in heptane is prepared by immersing a 350 W sonication horn into a beaker containing 200 m/ heptane and the liquid NaK alloy. A few minutes of sonication results in a murky blue-green heptane/NaK dis- persion. The reagents are injected into the dispersion and sonication is continued for at least two more minutes. It should be noted that the above chemistry is extremely dan- gerous, and should only be carried out in a glove box and with extreme caution. After reduction is complete, the mate- rial is ready for the crystallization step. The entire mixture is transferred into a sealed pressure bomb which is constructed from the alloy Inconel, and equipped with a magnetically coupled stir drive. The bomb is removed from the glove box and fitted with a heating mantle, the stir drive is engaged, and the bomb is heated to approximately 270 “C for a period of 24-48 h. The bomb is then cooled to room temperature, vented to atmosphere, and, as a precaution, several milliliters of ethanol are added to the mixture to neutralize any remain- ing NaK. The contents of the bomb are then filtered, washed with excess amounts of hexane, ether, and water, and the filtrate is dried on a vacuum line for a period of several hours. A resulting black powder is set aside for further analy- sis.
For the ~60 synthesis, the starting materials were GeC14+CH3SiC13+ (CH3)2SiC12. Methylchlorosilanes are used here because of the strong C-Si bond, and the inability of a methyl group to undergo P-hydride elimination. Such elimination is observed for R-groups with phydrogens. The Si-Ge bond is compatible with maintaining the diamond lat- tice structure up to the methyl capping agents, and, as is discussed below, the XPD profile of these particles fits to the Ge diamond lattice, and the peak positions exhibit no shift at all compared to the ~100 and ~200 products. This argues that the Si does not alloy with the Ge or participate in the internal bonding structure of the particles. The use of both mono- methyl and dimethyl substituents recognizes that a bare dia- mond lattice crystallite will have surface atoms with both one and two dangling bonds. In any event, the surface to volume ratio predicted by the initial R,SiCl,-JGeCl, re- agent ratio is in the range of 50-60 A. TEM lattice imaging reveals particles in the 50-70 A size range, although the particles do not all possess spherical morphologies. A frac- tion of the particles do have one spatial dimension as large as 80-140 A.
Three batches of particles were made for this study, and are labeled ~200, ~100, and ~60 for the rest of this paper. The ~200 and ~100 particles were synthesized from 2/l molar amounts of GeClJphenylGeCl, . For the ~200 synthesis, 1.5
For R=phenyl, as in the ~100 and ~200 syntheses, IR spectroscopy indicates that the nanocrystal surfaces are mostly germanium oxide (GeOz), with some Ge-Cl termination.13 TEM-EELS on particles prepared in a similar manner reveals a surface plasmon energy of -7.1 eV, con- sistent with a GeO, surface passivant.t4 X-ray photoelectron spectroscopy (XPS) was performed on samples that were ex- posed to air for several months and indicated the presence of Cl, and both oxidized and nonoxidized-germanium. For R=CH,, IR spectroscopy indicates the presence of M-O and M-Cl (M=Si or Ge) bonds C-H and CH,-Si bonds.t4 XPS on well oxidized ~60 samples also indicates the presence of Si in a high oxidation state as well as the species observed in the larger samples. The condition of the surface prior to ex- posure to air was not probed.
J. Chem. Phys., Vol. 101, No. 2, 15 July 1994
Downloaded 19 May 2006 to 131.215.225.175. Redistribution subject to AIP license or copyright, see http://jcp.aip.org/jcp/copyright.jsp
20 30 40 50 60 70 80 2Theta
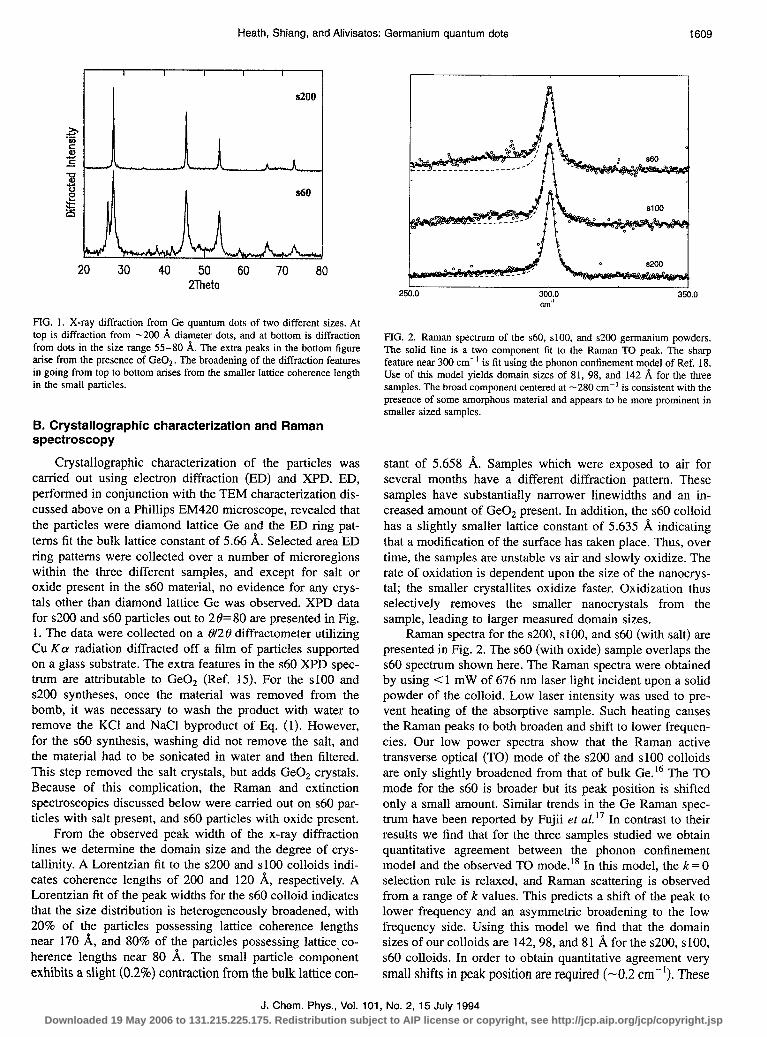
FIG. 1. X-ray diffraction from Ge quantum dots of two different sizes. At top is diffraction from -200 A diameter dots, and at bottom is diffraction from dots in the size range 55-80 A. The extra peaks in the bottom figure arise from the presence of GeO*. The broadening of the diffraction features in going from top to bottom arises from the smaller lattice coherence length in the small particles.
El. Crystallographic characterization and Raman spectroscopy
Crystallographic characterization of the particles was carried out using electron diffraction (ED) and XPD. ED, performed in conjunction with the TEM characterization dis- cussed above on a Phillips EM420 microscope, revealed that the particles were diamond lattice Ge and the ED ring pat- terns fit the bulk lattice constant of 5.66 A. Selected area ED ring patterns were collected over a number of microregions within the three different samples, and except for salt or oxide present in the ~60 material, no evidence for any crys- tals other than diamond lattice Ge was observed. XPD data for $200 and $60 particles out to 28=80 are presented in Fig. 1. The data were collected on a 812 0 diffractometer utilizing Cu Ka radiation diffracted off a film of particles supported on a glass substrate. The extra features in the ~60 XPD spec- trum are attributable to GeO, (Ref. 15). For the ~100 and $200 syntheses, once the material was removed from the bomb, it was necessary to wash the product with water to remove the KC1 and NaCl byproduct of Eq. (1). However, for the ~60 synthesis, washing did not remove the salt, and the material had to be sonicated in water and then filtered. This step removed the salt crystals, but adds GeO, crystals. Because of this complication, the Raman and extinction spectroscopies discussed below were carried out on ~60 par- ticles with salt present, and s60 particles with oxide present.
From the observed peak width of the x-ray diffraction lines we determine the domain size and the degree of crys- tallinity. A Lorentzian fit to the ~200 and ~100 colloids indi- cates coherence lengths of 200 and 120 A, respectively. A Lorentzian fit of the peak widths for the $60 colloid indicates that the size distribution is heterogeneously broadened, with 20% of the particles possessing lattice coherence lengths near 170 1$, and 80% of the particles possessing lattice co- herence lengths near 80 A. The small particle component exhibits a slight (0.2%) contraction from the bulk lattice con-
Heath, Shiang, and Alivisatos: Germanium quantum dots 1609
250.0 300.0 350.0 cm.’
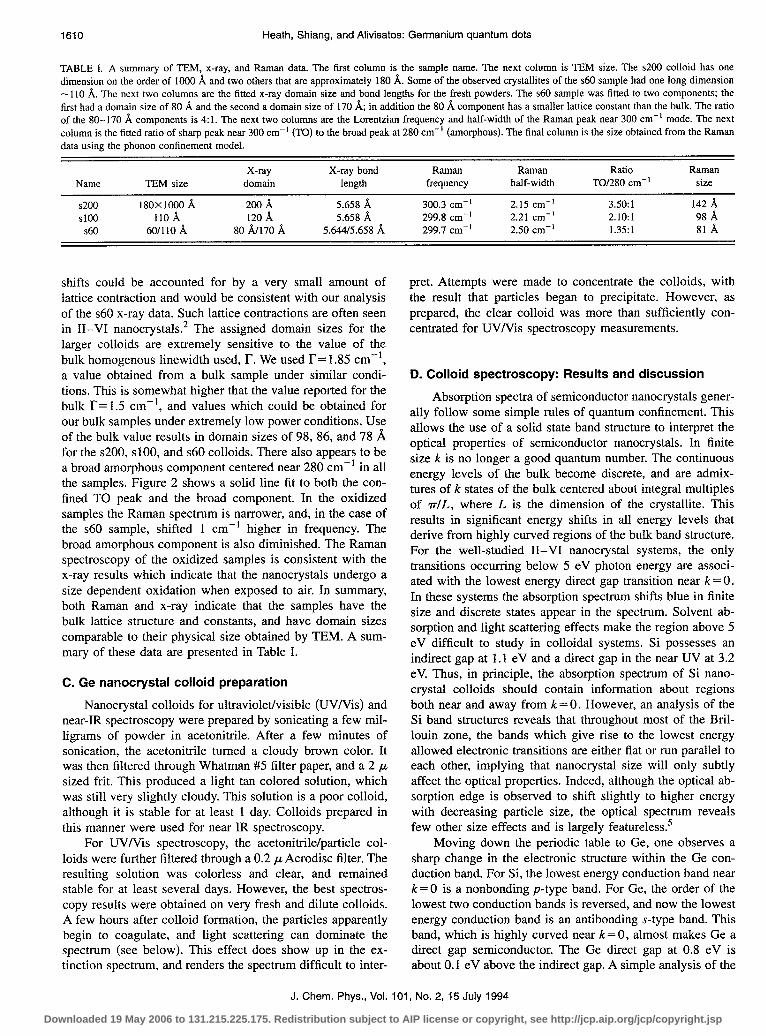
FIG. 2. Raman spectrum of the ~60, ~100, and ~200 germanium powders. The solid line is a two component fit to the Raman TO peak. The sharp feature near 300 cm-’ is fit using the phonon confinement model of Ref. 18. Use of this model yields domain sizes of 81, 98, and 142 8, for the three samples. The broad component centered at -280 cm-’ is consistent with the presence of some amorphous material and appears to be more prominent in smaller sized samples.
stant of 5.658 A. Samples which were exposed to air for several months have a different diffraction pattern. These samples have substantially narrower linewidths and an in- creased amount of Ge02 present. In addition, the s60 colloid has a slightly smaller lattice constant of 5.635 A indicating that a modification of the surface has taken place. Thus, over time, the samples are unstable vs air and slowly oxidize. The rate of oxidation is dependent upon the size of the nanocrys- tal; the smaller crystallites oxidize faster. Oxidization thus selectively removes the smaller nanocrystals from the sample, leading to larger measured domain sizes.
Raman spectra for the ~200, ~100, and ~60 (with salt) are presented in Fig. 2. The ~60 (with oxide) sample overlaps the ~60 spectrum shown here. The Raman spectra were obtained by using <l mW of 676 nm laser light incident upon a solid powder of the colloid. Low laser intensity was used to pre- vent heating of the absorptive sample. Such heating causes the Raman peaks to both broaden and shift to lower frequen- cies. Our low power spectra show that the Raman active transverse optical (TO) mode of the $200 and $100 colloids are only slightly broadened from that of bulk Ge.16 The TO mode for the ~60 is broader but its peak position is shifted only a small amount. Similar trends in the Ge Raman spec- trum have been reported by Fujii et a1.17 In contrast to their results we find that for the three samples studied we obtain quantitative agreement between the phonon confinement model and the observed TO mode.‘* In this model, the k=O selection rule is relaxed, and Raman scattering is observed from a range of k values. This predicts a shift of the peak to lower frequency and an asymmetric broadening to the low frequency side. Using this model we find that the domain sizes of our colloids are 142,98, and 81 A for the $200, $100, $60 colloids. In order to obtain quantitative agreement very small shifts in peak position are required (-0.2 cm-‘). These
J. Chem. Phys., Vol. 101, No. 2, 15 July 1994 Downloaded 19 May 2006 to 131.215.225.175. Redistribution subject to AIP license or copyright, see http://jcp.aip.org/jcp/copyright.jsp
1610 Heath, Shiang, and Alivisatos: Germanium quantum dots
TABLE I. A summary of TEM, x-ray, and Raman data. The first column is the sample name. The next column is TBM size. The ~200 colloid has one dimension on the order of 1000 8, and two others that are approximately 180 A. Some of the observed crystallites of the ~60 sample had one long dimension - 110 A. The next two columns are the fitted x-ray domain size and bond lengths for the fresh powders. The ~60 sample was fitted to two components; the first had a domain size of 80 8, and the second a domain size of 170 A; in addition the 80 8, component has a smaller lattice constant than the bulk. The ratio of the 80-170 k, components is 4:l. The next two columns are the Lorentzian frequency and half-width of the Raman peak near 300 cm-’ mode. The next column is the fitted ratio of sharp peak near 300 cm-’ (TO) to the broad peak at 280 cm-’ (amorphous). The final column is the size obtained from the Raman data using the phonon confinement model.
Name TEM size X-ray
domain X-ray bond
length Raman
frequency RanKIn
half-width Ratio
TO/280 cm-’ Ramall
size
s200 180X 1000 8, 2008, 5.658 8, 300.3 cm-’ 2.15 cm-’ 3.50: 1 142 8, SlOo 110 A 120 8, 5.658 8, 299.8 cm-’ 2.21 cm-’ 2.lO:l 98 %,
~60 60/110 8, 80 &I70 8, 5.64415.658 %, 299.7 cm-’ 2.50 cm-’ 1.35:l 81 8,
shifts could be accounted for by a very small amount of lattice contraction and would be consistent with our analysis of the ~60 x-ray data. Such lattice contractions are often seen in II-VI nanocrystals.* The assigned domain sizes for the larger colloids are extremely sensitive to the value of the bulk homogenous linewidth used, l?. We used r= 1.85 cm-‘, a value obtained from a bulk sample under similar condi- tions. This is somewhat higher that the value reported for the bulk r= 1.5 cm-‘, and values which could be obtained for our bulk samples under extremely low power conditions. Use of the bulk value results in domain sizes of 98, 86, and 78 A for the ~200, ~100, and ~60 colloids. There also appears to be a broad amorphous component centered near 280 cm-’ in all the samples. Figure 2 shows a solid line fit to both the con- fined TO peak and the broad component. In the oxidized samples the Raman spectrum is narrower, and, in the case of the ~60 sample, shifted 1 cm-’ higher in frequency. The broad amorphous component is also diminished. The Raman spectroscopy of the oxidized samples is consistent with the x-ray results which indicate that the nanocrystals undergo a size dependent oxidation when exposed to air. In summary, both Raman and x-ray indicate that the samples have the bulk lattice structure and constants, and have domain sizes comparable to their physical size obtained by TEM. A sum- mary of these data are presented in Table I.
C. Ge nanocrystal colloid preparation
Nanocrystal colloids for ultraviolet/visible (UVNis) and near-IR spectroscopy were prepared by sonicating a few mil- ligrams of powder in acetonitrile. After a few minutes of sonication, the acetonitrile turned a cloudy brown color. It was then filtered through Whatman #5 filter paper, and a 2 /L sized frit. This produced a light tan colored solution, which was still very slightly cloudy. This solution is a poor colloid, although it is stable for at least 1 day. Colloids prepared in this manner were used for near IR spectroscopy.
For UV/Vis spectroscopy, the acetonitrile/particle col- loids were further filtered through a 0.2 ,u Acrodisc filter. The resulting solution was colorless and clear, and remained stable for at least several days. However, the best spectros- copy results were obtained on very fresh and dilute colloids. A few hours after colloid formation, the particles apparently begin to coagulate, and light scattering can dominate the spectrum (see below). This effect does show up in the ex- tinction spectrum, and renders the spectrum difficult to inter-
pret. Attempts were made to concentrate the colloids, with the result that particles began to precipitate. However, as prepared, the clear colloid was more than sufficiently con- centrated for UV/Vis spectroscopy measurements.
D. Colloid spectroscopy: Results and discussion
Absorption spectra of semiconductor nanocrystals gener- ally follow some simple rules of quantum confinement. This allows the use of a solid state band structure to interpret the optical properties of semiconductor nanocrystals. In finite size k is no longer a good quantum number. The continuous energy levels of the bulk become discrete, and are admix- tures of k states of the bulk centered about integral multiples of r/L, where L is the dimension of the crystallite. This results in significant energy shifts in all energy levels that derive from highly curved regions of the bulk band structure. For the well-studied II-VI nanocrystal systems, the only transitions occurring below 5 eV photon energy are associ- ated with the lowest energy direct gap transition near k = 0. In these systems the absorption spectrum shifts blue in finite size and discrete states appear in the spectrum. Solvent ab- sorption and light scattering effects make the region above 5 eV difficult to study in colloidal systems. Si possesses an indirect gap at 1.1 eV and a direct gap in the near UV at 3.2 eV. Thus, in principle, the absorption spectrum of Si nano- crystal colloids should contain information about regions both near and away from k = 0. However, an analysis of the Si band structures reveals that throughout most of the Bril- louin zone, the bands which give rise to the lowest energy allowed electronic transitions are either flat or run parallel to each other, implying that nanocrystal size will only subtly affect the optical properties. Indeed, although the optical ab- sorption edge is observed to shift slightly to higher energy with decreasing particle size, the optical spectrum reveals few other size effects and is largely featureless.5
Moving down the periodic table to Ge, one observes a sharp change in the electronic structure within the Ge con- duction band. For Si, the lowest energy conduction band near k = 0 is a nonbonding p-type band. For Ge, the order of the lowest two conduction bands is reversed, and now the lowest energy conduction band is an antibonding s-type band. This band, which is highly curved near k = 0, almost makes Ge a direct gap semiconductor. The Ge direct gap at 0.8 eV is about 0.1 eV above the indirect gap. A simple analysis of the
J. Chem. Phys., Vol. 101, No. 2, 15 July 1994
Downloaded 19 May 2006 to 131.215.225.175. Redistribution subject to AIP license or copyright, see http://jcp.aip.org/jcp/copyright.jsp
(0 0 0) r/a( l/2 0 0)
Wave Ye&r (k) (Germanium) X
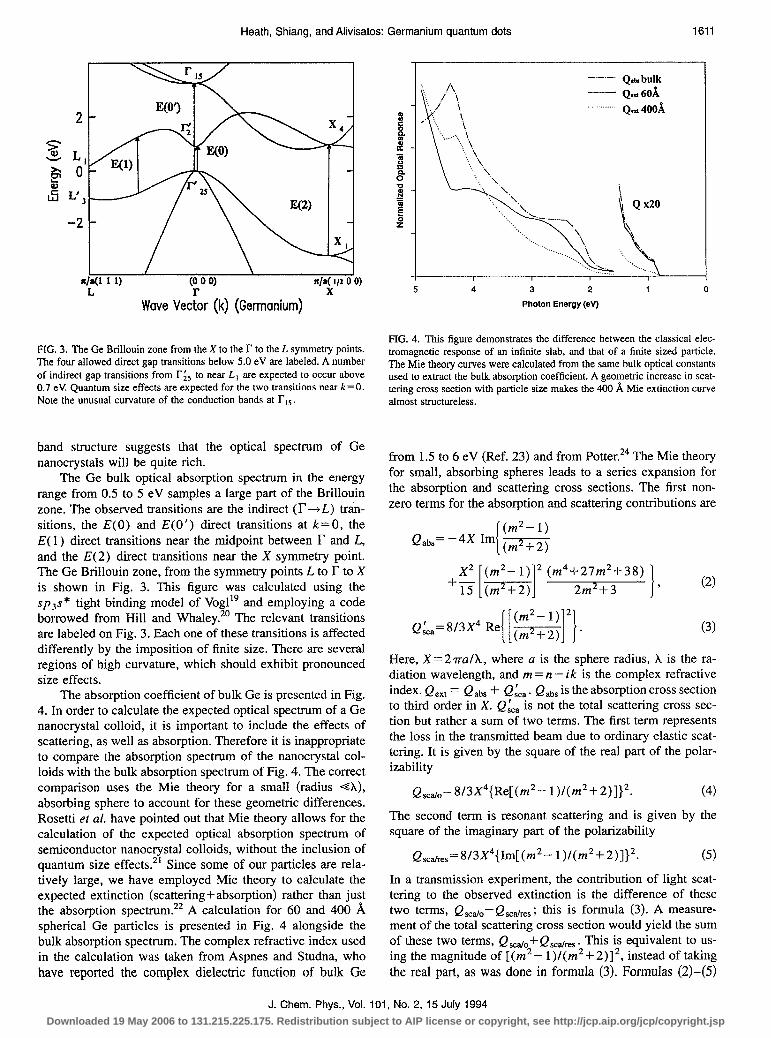
FIG. 3. The Ge Brillouin zone from the X to the r to the L symmetry points. The four allowed direct gap transitions below 5.0 eV are labeled. A number of indirect gap transitions from r;, to near L, are expected to occur above 0.7 eV. Quantum size effects are expected for the two transitions near k = 0. Note the unusual curvature of the conduction bands at rts.
band structure suggests that the optical spectrum of Ge nanocrystals will be quite rich.
The Ge bulk optical absorption spectrum in the energy range from 0.5 to 5 eV samples a large part of the Brillouin zone. The observed transitions are the indirect (F-+L) t&n- sitions, the E(0) and E(0’) direct transitions at k= 0, the E( 1) direct transitions near the midpoint between r and L, and the E(2) direct transitions near the X symmetry point. The Ge Brillouin zone, from the symmetry points L to F to X is shown in Fig. 3. This figure was calculated using the spss* tight binding model of Vogl” and employing a code borrowed from Hill and Whaley.*’ The relevant transitions are labeled on Fig. 3. Each one of these transitions is affected differently by the imposition of finite size. There are several regions of high curvature, which should exhibit pronounced size effects.
The absorption coefficient of bulk Ge is presented in Fig. 4. In order to calculate the expected optical spectrum of a Ge nanocrystal colloid, it is important to include the effects of scattering, as well as absorption. Therefore it is inappropriate to compare the absorption spectrum of the nanocrystal col- loids with the bulk absorption spectrum of Fig. 4. The correct comparison uses the Mie theory for a small (radius GX), absorbing sphere to account for these geometric differences. Rosetti et al. have pointed out that Mie theory allows for the calculation of the expected optical absorption spectrum of semiconductor nanocrystal colloids, without the inclusion of quantum size effects.*’ Since some of our particles are rela- tively large, we have employed Mie theory to calculate the expected extinction (scatteringfabsorption) rather than just the absorption spectrum.** A calculation for 60 and 400 %, spherical Ge particles is presented in Fig. 4 alongside the bulk absorption spectrum. The complex refractive index used in the calculation was taken from Aspnes and Studna, who have reported the complex dielectric function of bulk Ge
-‘-.-’ Q.b. bulk - Qest60%L
Q& 400A
5 4 3 2 1 0
Photon Energy (eV)
Heath, Shiang, and Alivisatos: Germanium quantum dots 1611
FIG. 4. This figure demonstrates the difference between the classical elec- tromagnetic response of an infinite slab, and that of a finite sized particle. The Mie theory curves were calculated from the same bulk optical constants used to extract the bulk absorption coefficient. A geometric increase in scat- tering cross section with particle size makes the 400 8, Mie extinction curve almost structureless.
from 1.5 to 6 eV (Ref. 23) and from Potter.24 The Mie theory for small, absorbing spheres leads to a series expansion for the absorption and scattering cross sections. The first non- zero terms for the absorption and scattering contributions are
&bs=-4x Irn (m2- 1) (m2+2)
X2 (m*- 1) * (m4+27m2+38) +15 (m -1-2) [* 1 (2)
Q&=8/3X4 Re( [ ~~~~~~]‘).
Here, X=2ra/X, where a is the sphere radius, X is the ra- diation wavelength, and m = n - ik is the complex refractive index. Qext = Qabs -!- QL,. Qabs is the absorption cross section to third order in X. Q&, is not the total scattering cross sec- tion but rather a sum of two terms. The first term represents the loss in the transmitted beam due to ordinary elastic scat- tering. It is given by the square of the real part of the polar- izability
Q scdo= 8/3X4{Re[( m*- l)/(m*+2)]}*. (4)
The second term is resonant scattering and is given by the square of the imaginary part of the polarizability
Q scdres= 8/3X4{W( m*- l)l(m*+2)]}*. (5)
In a transmission experiment, the contribution of light scat- tering to the observed extinction is the difference of these two term Qsc~o-Qsc~ms; this is formula (3). A measure- ment of the total scattering cross section would yield the sum of these two terms, Qsca/O+QsCa/res. This is equivalent to us- ing the magnitude of [(m*- l)/(m*+2)]*, instead of taking the real part, as was done in formula (3). Formulas (2)-(5)
J. Chem. Phys., Vol. 101, No. 2, 15 July 1994 Downloaded 19 May 2006 to 131.215.225.175. Redistribution subject to AIP license or copyright, see http://jcp.aip.org/jcp/copyright.jsp
1612 Heath, Shiang, and Alivisatos: Germanium quantum dots
include only the lowest order scattering and absorption ef- fects, but higher order terms do not significantly affect the dielectric response below 5 eV.
There are two major effects in the curves of Fig. 4-the difference between bulk absorption and Mie extinction theory, and the particle size dependence within Mie theory. The Mie theory scattering and the absorption cross sections are both functions of n and k, whereas the bulk absorption coefficient depends only on k. This is why the E(2) feature near 4.25 eV, which is so prominent in the bulk absorption spectrum, appears as a small cusp in the Mie theory calcula- tion. Below about 2.5 eV, the real part of the refractive index remains relatively constant, while the imaginary part contin- ues to exhibit a frequency dependence. Thus, the Mie theory calculation and the bulk absorption spectrum begin to re- semble one another in this energy range. Below 1.5 eV, the Mie theory extinction spectrum and the bulk absorption spectrum are, if normalized, indistinguishable for the case of all three plots. This indicates that near IR spectra for any of the particle colloids discussed here may be compared di- rectly with either of the Mie calculations or the bulk absorp- tion coefficient.
The major particle size effect within the Mie theory is the geometric increase in scattering cross section with in- creasing particle diameter and decreasing photon wave- length. This tends to dampen the structure in the extinction curve, and is why the 400 8, particle calculation shows less structure than the 60 A particle calculation. The Mie theory calculations are valid only for u 4 X, and thus may not be appropriate for describing the ~200 colloid optical spectrum. Recall that those particles are platelets, many of which have at least one dimension approaching 0.1 pm. However, below 1.5 eV, the comparison of Mie theory with the ~200 colloid remains valid.
III. REGION A: E(0) AND INDIRECT TRANSITIONS IN THE NEAR IR
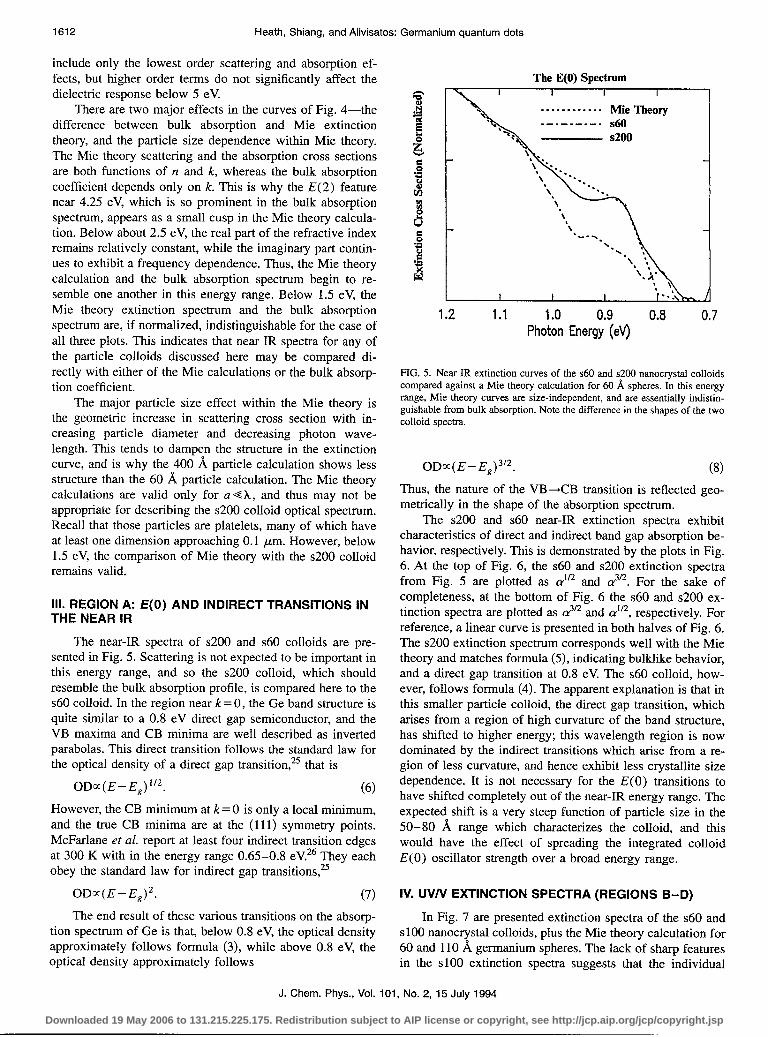
The near-IR spectra of ~200 and ~60 colloids are pre- sented in Fig. 5. Scattering is not expected to be important in this energy range, and so the ~200 colloid, which should resemble the bulk absorption profile, is compared here to the ~60 colloid. In the region near k = 0, the Ge band structure is quite similar to a 0.8 eV direct gap semiconductor, and the VB maxima and CB minima are well described as inverted parabolas. This direct transition follows the standard law for the optical density of a direct gap transition,25 that is
ODK(E-E$‘~. (6) However, the CB minimum at k = 0 is only a local minimum, and the true CB minima are at the (111) symmetry points. McFarlane et al. report at least four indirect transition edges at 300 K with in the energy range 0.65-0.8 eV.26 They each obey the standard law for indirect gap transitions,25
ODm(E- E,)2. (7)
The end result of these various transitions on the absorp- tion spectrum of Ge is that, below 0.8 eV, the optical density approximately follows formula (3), while above 0.8 eV, the optical density approximately follows
The E(O) Spectrum I I I I
I I I
1.2 1.1 Ptltkfl E"f?rg;;e")
0.8 0.7
FIG. 5. Near IR extinction curves of the ~60 and ~200 nanocrystal colloids compared against a Mie theory calculation for 60 8, spheres. In this energy range, Mie theory curves are size-independent, and are essentially indistin- guishable from bulk absorption. Note the difference in the shapes of the two colloid spectra.
ODK(E-E&~‘~. (8) Thus, the nature of the VB-+CB transition is reflected geo- metrically in the shape of the absorption spectrum.
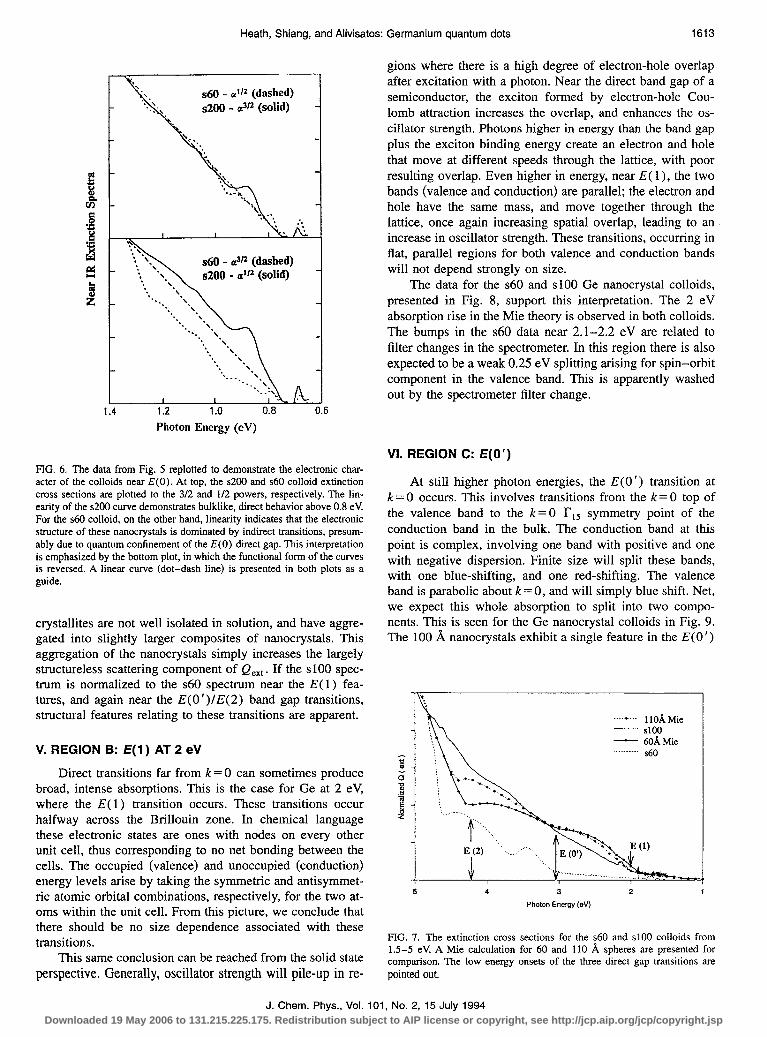
The ~200 and ~60 near-IR extinction spectra exhibit characteristics of direct and indirect band gap absorption be- havior, respectively. This is demonstrated by the plots in Fig. 6. At the top of Fig. 6, the s60 and ~200 extinction spectra from Fig. 5 are plotted as aIn and (3”. For the sake of completeness, at the bottom of Fig. 6 the ~60 and ~200 ex- tinction spectra are plotted as d’2 and crn2, respectively. For reference, a linear curve is presented in both halves of Fig. 6. The ~200 extinction spectrum corresponds well with the Mie theory and matches formula (5), indicating bulklike behavior, and a direct gap transition at 0.8 eV. The ~60 colloid, how- ever, follows formula (4). The apparent explanation is that in this smaller particle colloid, the direct gap transition, which arises from a region of high curvature of the band structure, has shifted to higher energy; this wavelength region is now dominated by the indirect transitions which arise from a re- gion of less curvature, and hence exhibit less crystallite size dependence. It is not necessary for the E(0) transitions to have shifted completely out of the near-IR energy range. The expected shift is a very steep function of particle size in the 50-80 A range which characterizes the colloid, and this would have the effect of spreading the integrated colloid E(0) oscillator strength over a broad energy range.
IV. UV/V EXTINCTION SPECTRA (REGIONS B-D)
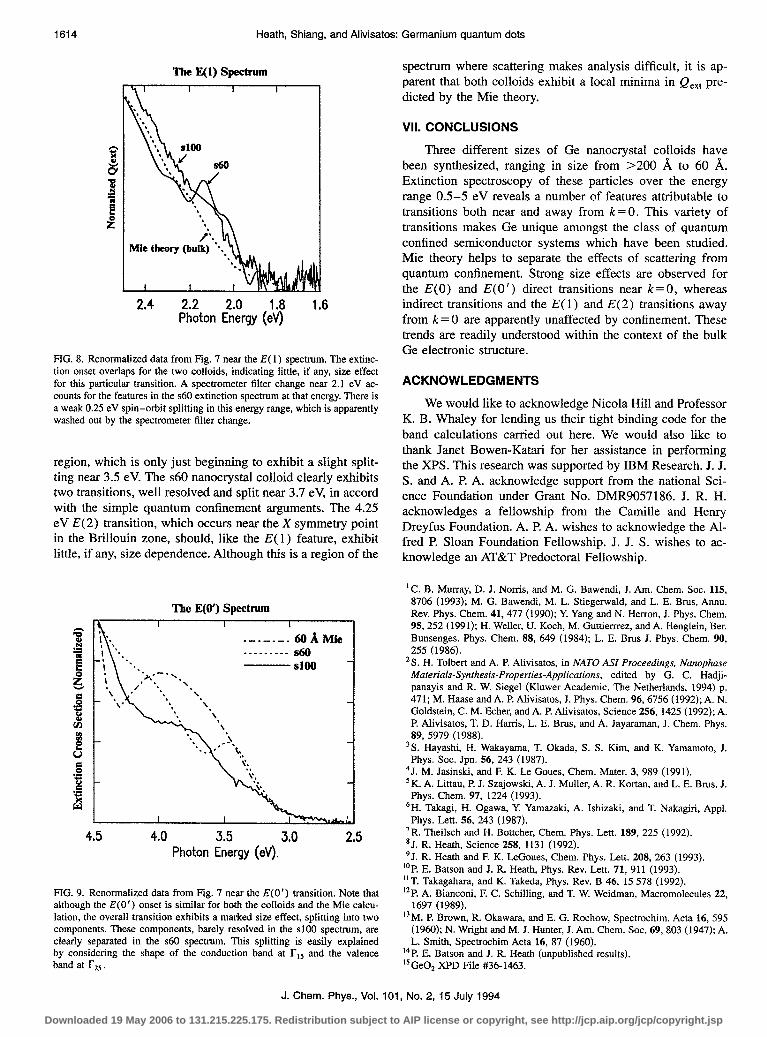
In Fig. 7 are presented extinction spectra of the ~60 and ~100 nanocrystal colloids, plus the Mie theory calculation for 60 and 110 A germanium spheres. The lack of sharp features in the ~100 extinction spectra suggests that the individual
J. Chem. Phys., Vol. 101, No. 2, 15 July 1994
Downloaded 19 May 2006 to 131.215.225.175. Redistribution subject to AIP license or copyright, see http://jcp.aip.org/jcp/copyright.jsp
Heath, Shiang, and Alivisatos: Germanium quantum dots 1613
1.4
~60 - C# (dashed) ~200 - cJ* (solid)
~60 - C$ (dashed) ~60 - C$ (dashed) sZ)O - a’p (solid) sZ)O - a’p (solid)
-.
1 t 1.2 1.0 0.8 0.6 Photon Energy (eV)
FIG. 6. The data from Fig. 5 replotted to demonstrate the electronic char- acter of the colloids near E(0). At top, the ~200 and ~60 colloid extinction cross sections are plotted to the 3/2 and l/2 powers, respectively. The lin- earity of the ~200 curve demonstrates bulklike, direct behavior above 0.8 eV For the ~60 colloid, on the other hand, linearity indicates that the electronic structure of these nanocrystals is dominated by indirect transitions, presum- ably due to quantum confinement of the E(0) direct gap. This interpretation is emphasized by the bottom plot, in which the functional form of the curves is reversed. A linear curve (dot-dash line) is presented in both plots as a guide.
crystallites are not well isolated in solution, and have aggre- gated into slightly larger composites of nanocrystals. This aggregation of the nanocrystals simply increases the largely structureless scattering component of Q,,,. If the ~100 spec- trum is normalized to the ~60 spectrum near the E( 1) fea- tures, and again near the E(O’)lE(2) band gap transitions, structural features relating to these transitions are apparent.
V. REGION B: E(1) AT 2 eV
Direct transitions far from k = 0 can sometimes produce broad, intense absorptions. This is the case for Ge at 2 eV, where the E( 1) transition occurs. These transitions occur halfway across the Brillouin zone. In chemical language these electronic states are ones with nodes on every other unit cell, thus corresponding to no net bonding between the cells. The occupied (valence) and unoccupied (conduction) energy levels arise by taking the symmetric and antisymmet- ric atomic orbital combinations, respectively, for the two at- oms within the unit cell. From this picture, we conclude that there should be no size dependence associated with these transitions.
This same conclusion can be reached from the solid state perspective. Generally, oscillator strength will pile-up in re-
gions where there is a high degree of electron-hole overlap after excitation with a photon. Near the direct band gap of a semiconductor, the exciton formed by electron-hole Cou- lomb attraction increases the overlap, and enhances the os- cillator strength. Photons higher in energy than the band gap plus the exciton binding energy create an electron and hole that move at different speeds through the lattice, with poor resulting overlap. Even higher in energy, near E(l), the two bands (valence and conduction) are parallel; the electron and hole have the same mass, and move together through the lattice, once again increasing spatial overlap, leading to an increase in oscillator strength. These transitions, occurring in flat, parallel regions for both valence and conduction bands will not depend strongly on size.
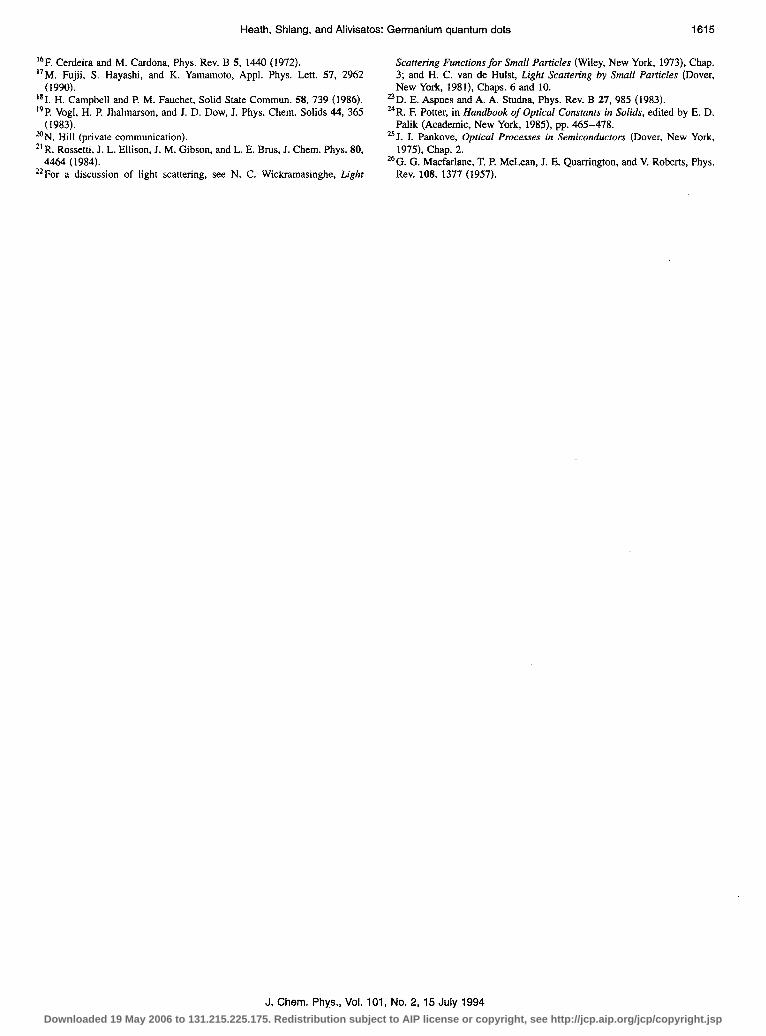
The data for the ~60 and ~100 Ge nanocrystal colloids, presented in Fig. 8, support this interpretation. The 2 eV absorption rise in the Mie theory is observed in both colloids. The bumps in the ~60 data near 2.1-2.2 eV are related to filter changes in the spectrometer. In this region there is also expected to be a weak 0.25 eV splitting arising for spin-orbit component in the valence band. This is apparently washed out by the spectrometer filter change.
VI. REGION C: E(0’)
At still higher photon energies, the E(0’) transition at k = 0 occurs. This involves transitions from the k = 0 top of the valence band to the k= 0 F,s symmetry point of the conduction band in the bulk. The conduction band at this point is complex, involving one band with positive and one with negative dispersion. Finite size will split these bands, with one blue-shifting, and one red-shifting. The valence band is parabolic about k = 0, and will simply blue shift. Net, we expect this whole absorption to split into two compo- nents. This is seen for the Ge nanocrystal colloids in Fig. 9. The 100 8, nanocrystals exhibit a single feature in the E(0’)
1 . . . . . . . . . . . ll&Mie
- SlOo - 60AMie
&)
5 4
4 3 2 1
Photon Energy @A’)
FIG. 7. The extinction cross sections for the ~60 and ~100 colloids from 1.5-5 eV. A Mie calculation for 60 and 110 8, spheres are presented for comparison. The low energy onsets of the three direct gap transitions are pointed out.
J. Chem. Phys., Vol. 101, No. 2, 15 July 1994 Downloaded 19 May 2006 to 131.215.225.175. Redistribution subject to AIP license or copyright, see http://jcp.aip.org/jcp/copyright.jsp
1614 Heath, Shiang, and Alivisatos: Germanium quantum dots
The JC(l) Spectrum I I I
2.4 1.6
FIG. 8. Renormalized data from Fig. 7 near the E( 1) spectrum. The extinc- tion onset overlaps for the two colloids, indicating little, if any, size effect for this particular transition. A spectrometer filter change near 2.1 eV ac- counts for the features in the ~60 extinction spectrum at that energy. There is a weak 0.25 eV spin-orbit splitting in this energy range, which is apparently washed out by the spectrometer filter change.
region, which is only just beginning to exhibit a slight split- ting near 3.5 eV. The s60 nanocrystal colloid clearly exhibits two transitions, well resolved and split near 3.7 eV, in accord with the simple quantum confinement arguments. The 4.25 eV E(2) transition, which occurs near the X symmetry point in the Brillouin zone, should, like the E( 1) feature, exhibit little, if any, size dependence. Although this is a region of the
The E(O’) Spas
ii’
4.5 4.0 3.5 3.0 2.5 Photon Energy (eV).
FIG. 9. Renormalized data from Fig. 7 near the E(0’) transition. Note that although the E(0’) onset is similar for both the colloids and the Mie calcu- lation, the overall transition exhibits a marked size effect, splitting into two components. These components, barely resolved in the ~100 spectrum, are clearly separated in the ~60 spectrum. This splitting is easily explained by considering the shape of the conduction band at Tts and the valence band at FZ.
spectrum where scattering makes analysis difficult, it is ap- parent that both colloids exhibit a local minima in Qext pre- dicted by the Mie theory.
VII. CONCLUSIONS
Three different sizes of Ge nanocrystal colloids have been synthesized, ranging in size from >200 8, to 60 A. Extinction spectroscopy of these particles over the energy range 0.5-5 eV reveals a number of features attributable to transitions both near and away from k= 0. This variety of transitions makes Ge unique amongst the class of quantum confined semiconductor systems which have been studied. Mie theory helps to separate the effects of scattering from quantum confinement. Strong size effects are observed for the E(0) and E(0') direct transitions near k=O, whereas indirect transitions and the E( 1) and E(2) transitions away from k=O are apparently unaffected by confinement. These trends are readily understood within the context of the bulk Ge electronic structure.
ACKNOWLEDGMENTS
We would like to acknowledge Nicola Hill and Professor K. B. Whaley for lending us their tight binding code for the band calculations carried out here. We would also like to thank Janet Bowen-Katari for her assistance in performing the XPS. This research was supported by IBM Research. J. J. S. and A. P. A. acknowledge support from the national Sci- ence Foundation under Grant No. DMR9057186. J. R. H. acknowledges a fellowship from the Camille and Henry Dreyfus Foundation. A. P A. wishes to acknowledge the Al- fred P. Sloan Foundation Fellowship. J. J. S. wishes to ac- knowledge an AT&T Predoctoral Fellowship.
‘C. B. Murray, D. J. Norris, and M. G. Bawendi, J. Am. Chem. Sot. 115, 8706 (1993); M. G. Bawendi. M. L. Stiegerwald, and L. E. Brus, Annu. Rev. Phys. Chem. 41,477 (1990); Y. Yang and N. Henon, J. Phys. Chem. 95, 252 (1991); H. Weller, U. Koch, M. Guttierrrez, and A. Henglein, Ber. Bunsenges. Phys. Chem. 88, 649 (1984); L. E. Brus J. Phys. Chem. 90, 255 (1986).
‘S. H. Tolbert and A. P. Alivisatos, in NATO ASI Proceedings, Nanophase Materials-Synthesis-Properties-Applications, edited by G. C. Hadji- panayis and R. W. Siegel (Kluwer Academic, The Netherlands, 1994) p. 47 1; M. Haase and A. P. Alivisatos, J. Phys. Chem. 96,6756 (1992); A. N. Goldstein, C. M. Ether, and A. P Alivisatos, Science 256, 1425 (1992); A. P. Alivisatos, T. D. Harris, L. E. Brus, and A. Jayaraman, J. Chem. Phys. 89, 5979 (1988).
3S. Hayashi, H. Wakayama, T. Okada, S. S. Kim, and K. Yamamoto, J. Phys. Sot. Jpn. 56, 243 (1987).
4J. M. Jasinski, and F. K. Le Goues, Chem. Mater. 3, 989 (1991). 5K. A. Littau, P. J. Szajowski, A. J. Muller, A. R. Kortan, and L. E. Brus, J.
Phys. Chem. 97, 1224 (1993). 6H. Takagi, H. Ogawa, Y. Yamazaki, A. Ishizaki, and T. Nakagiri, Appl.
Phys. Lea. 56, 243 (1987). ‘R. Theilsch and H. Bottcher, Chem. Phys. Lett. 189, 225 (1992). *J. R. Heath, Science 258, 113 1 (1992). 9J. R. Heath and F. K. LeGoues, Chem. Phys. Lett. 208, 263 (1993).
‘OP. E. Batson and J. R. Heath, Phys. Rev. Len. 71, 911 (1993). “T. Takagahara, and K. Takeda, Phys. Rev. B 46, 15 578 (1992). “P A. Bianconi, F. C. Schilling, and T. W. Weidman, Macromolecules 22,
1697 (1989). 13M P Brown, R. Okawara, and E. G. Rochow, Spectrochim. Acta 16,595
(1960); N. Wright and M. J. Hunter, J. Am. Chem. Sot. 69,803 (1947); A. L. Smith, Spectrochim Acta 16, 87 (1960).
14P. E. Batson and J. R. Heath (unpublished results). 15GeOz XPD File #36-1463.
J. Chem. Phys., Vol. 101, No. 2, 15 July 1994
Downloaded 19 May 2006 to 131.215.225.175. Redistribution subject to AIP license or copyright, see http://jcp.aip.org/jcp/copyright.jsp
Heath, Shiang, and Alivisatos: Germanium quantum dots 1615
16F. Cerdeira and M. Cardona, Phys. Rev. B 5, 1440 (1972). ‘?M Fujii. S. Hayashi, and K. Yamamoto, Appl. Phys. Lett. 57, 2962
(1590). ‘si. H. Campbell and I? M. Fauchet, Solid State Commun. 58, 739 (1986). “P. Vogl, H. P. Jhalmarson, and J. D. Dow, J. Phys. Chem. Solids 44, 365
(1983). “ON. Hill (private communication). *’ R. Rossetti. J. L. Ellison, J. M. Gibson, and L. E. Brus, J. Chem. Phys. 80,
4464 (1984). “For a discussion of light scattering, see N. C. Wickramasinghe, Lighr
Scattering Functions for Small Particles (Wiley, New York, 1973). Chap. 3; and H. C. van de Hulst, Light Stuttering by Small Particles (Dover, New York, 1981), Chaps. 6 and 10.
23D. E. Aspnes and A. A. Smdna, Phys. Rev. B 27, 985 (1983). %R. F. Potter, in Handbook of Optical Constants in Solids, edited by E. D.
Palik (Academic, New York, 1985), pp. 465-478. =J. I. Pankove, Optical Pmcesses in Semiconductors (Dover, New York,
1975). Chap. 2. 26G G. Macfarlane, T. P McLean, J. E. Quarrington, and V. Roberts, Phys.
Rev. 108, 1377 (1957).
J. Chem. Phys., Vol. 101, No. 2, 15 July 1994
Downloaded 19 May 2006 to 131.215.225.175. Redistribution subject to AIP license or copyright, see http://jcp.aip.org/jcp/copyright.jsp