GERLINDE VERBIST JOSEFINE VANHILLE er p a p … · discussion paper 1 including imputed rent in the...
26
DISCUSSION PAPER 1 INCLUDING IMPUTED RENT IN THE INCOME CONCEPT ESTIMATES AND DISTRIBUTION FOR FLANDERS AND BELGIUM GERLINDE VERBIST JOSEFINE VANHILLE September 2010 discussion p a p er
Transcript of GERLINDE VERBIST JOSEFINE VANHILLE er p a p … · discussion paper 1 including imputed rent in the...
DISCUSSION PAPER 1
INCLUDING IMPUTED RENT IN THE INCOME CONCEPT
ESTIMATES AND DISTRIBUTION FOR FLANDERS AND BELGIUM
GERLINDE VERBIST
JOSEFINE VANHILLE
September 2010
dis
cuss
ion
pap
er
F L E M O S I D E L I V E R A B L E D 2 . 1 A : B R O A D E N I N G T H E I N C O M E C O N C E P T – I M P U T E D R E N T
This paper was written as part of the SBO-project “FLEMOSI: A tool for ex ante evaluation of socio-economic policies
in Flanders”, funded by IWT Flanders. The project intends to build ‘FLEmish MOdels of SImulation’ and is joint work
of the Centre for Economic Studies (CES) of the Katholieke Universiteit Leuven – the Centre for Social Policy (CSB)
of the Universiteit Antwerpen– the Interface Demografie of the Vrije Universiteit Brussel – the Centre de Recherche
en Économie Publique et de la population (CREPP) of the Université de Liege and the Institute for Social and Economic
Research (Microsimulation Unit) of the University of Essex.
For more information on the project, see www.flemosi.be.

F L E M O S I D I S C U S S I O N P A P E R D P 1
INCLUDING IMPUTED RENT IN THE INCOME CONCEPT.
ESTIMATES AND DISTRIBUTION EFFECTS FOR FLANDERS AND
BELGIUM
GERLINDE VERBIST (*) JOSEFINE VANHILLE (*)
September 2010
Abstract: In this paper we broaden the definition of economic resources from the narrow
concept of current disposable income (the sum of market income and cash transfers minus direct taxes and social insurance contributions) towards the inclusion of imputed rent. We provide an overview of different techniques to estimate imputed rent for Flanders and Belgium, based on the methodology presented by Frick & Grabka (2003). We then apply the opportunity cost approach. Calculations are performed on the micro-data of the EU-SILC of the survey year 2008 (with income data referring to 2007). These estimates allow us to assess the distribution effect of including imputed rent in the income concept.
* Centrum voor Sociaal Beleid Herman Deleeck, Universiteit Antwerpen

4
1. Introduction
From a welfare perspective, all economic resources that a household commands
determine its welfare levels. This means that also the value of non-cash incomes
should be included. Non-cash incomes can be divided into two broad categories,
namely private non-cash income components and publicly-provided services (such as
free health care and education). The size of both these categories can considerably
affect the welfare levels of households. In this paper we investigate an important
private non-cash income component, namely the value one derives from living in a
home that (s)he owns. Home-ownership has a large impact on a household’s
expenditure structure (Canberra Group, 2001). Firstly, mortgage-free owner-occupiers
are much better off than renters with comparable cash incomes. Secondly, the impact
of mortgage payments can lower a household’s disposable income considerably.
Because of the large proportion of home-owners in Flanders (and Belgium), a serious
attempt to estimate the economic well-being of households should take the non-cash
advantage derived from home-ownership, the so-called ‘imputed rent’ (IR), into
account. As pointed out by the Canberra Group (2001), the way in which is dealt with
the income value of home ownership is crucial for distribution analyses. Also tenants
who benefit from below-market rent or rent-free accommodation can be considered as
beneficiaries of IR; by also considering this group, we also account for a (small)
category of publicly provided non-cash income. Empirical evidence shows that
inequality is reduced when a value for imputed rent is included in the income concept
(see e.g. Smeeding et al., 1993; Cantillon & Meulemans, 1993; Frick & Grabka, 2003;
Frick et al., 2006; Frick et al., 2010). The method used to estimate a value for imputed
rent has an impact on the results and requires careful consideration.
This paper provides an estimate of the monetary value of IR in Flanders and Belgium
for home-owners and tenants who benefit from below-market or free rents, based on
the data of the 2008 wave of the Survey of Income and Living Conditions (SILC). We
use the opportunity cost approach to provide estimates of IR. These estimates are used
to calculate the effects on inequality and poverty of incorporating IR in the income
concept. Our paper is structured as follows. After the introduction, we present a short
5
overview of federal and Flemish housing policies in Belgium, as well as the current
situation on the housing market. Next, we briefly discuss the data and the methods
used to estimate IR. The following section deals with the distribution effects of
including IR in the income concept. We present our results using a range of inequality
and poverty indicators. The last section concludes.
2. The housing market and housing policy instruments in Belgium
2.1 The housing market
Ever since the Second World War, efforts to support families in the acquisition of a
private dwelling have been the core of Belgian housing policies. This resulted in a
housing market where owner-occupied dwellings are dominant. About 68% of
Belgian households live in a private home they own (European Commission 2003).
The impact of social housing on the total market remains limited: only 5.7% of
households are renters of social housing, which is below the European average. The
remaining part of the housing market, about 26%, is a private rental market, which
provides accommodation for many low-income households.
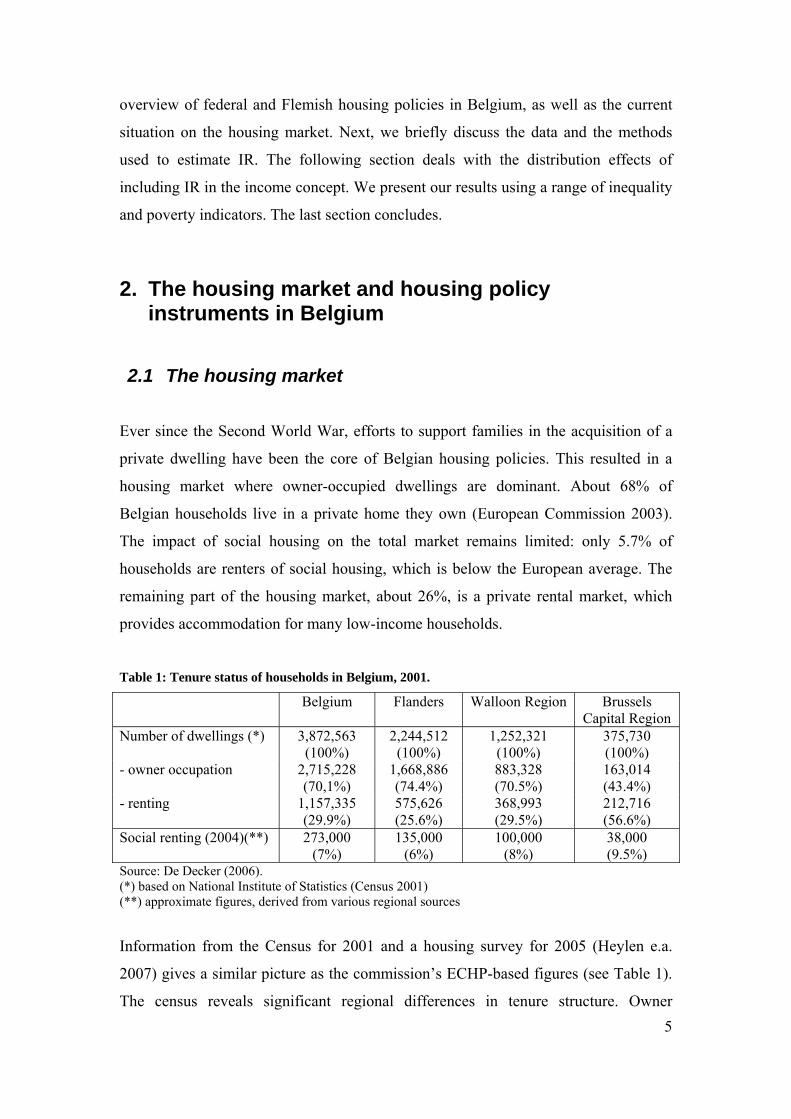
Table 1: Tenure status of households in Belgium, 2001.
Belgium Flanders Walloon Region Brussels Capital Region
Number of dwellings (*) 3,872,563 (100%)
2,244,512 (100%)
1,252,321 (100%)
375,730 (100%)
- owner occupation 2,715,228 (70,1%)
1,668,886 (74.4%)
883,328 (70.5%)
163,014 (43.4%)
- renting 1,157,335 (29.9%)
575,626 (25.6%)
368,993 (29.5%)
212,716 (56.6%)
Social renting (2004)(**) 273,000 (7%)
135,000 (6%)
100,000 (8%)
38,000 (9.5%)
Source: De Decker (2006). (*) based on National Institute of Statistics (Census 2001) (**) approximate figures, derived from various regional sources
Information from the Census for 2001 and a housing survey for 2005 (Heylen e.a.
2007) gives a similar picture as the commission’s ECHP-based figures (see Table 1).
The census reveals significant regional differences in tenure structure. Owner
6
occupation is most frequent in Flanders (74%), against only 43% in Brussels. The
Walloon Region is similar to Flanders with 70% owner occupiers. Regional
differences in social renting are much smaller, despite large differences in the size of
the rental market. The Walloon Region has the largest proportion of social renters
(9%). In Brussels, where the rental market accounts for the shelter of more than half
of all households, only 8% of households are social renters.
During the last decade, prices on the Belgian housing market witnessed a boom
comparable to what happened in most other European countries. The average house
price doubled from 1995 to 2005. As Belgians are said to have a “brick in the
stomach”, this caused concern regarding access to home ownership. Up to the mid-
nineties, most research pointed out that low income groups are facing increased
difficulty in property acquisition (e.g. Meulemans et al., 1996).
2.2 Housing policy
Housing policy is a mixture of federal, regional and local policies. The federal level
provides important tax advantages for home ownership. Following state reforms in the
eighties, part of housing policy has become a responsibility of the regions.
Consequently, Brussels, Flanders and the Walloon Region each have their own
housing policies. Although the support of home acquisition remains the dominant
policy track, the regions are increasingly investing in the provision of social rent
housing (see e.g. Vlaams Minister van Binnenlands Bestuur, Stedenbeleid, Wonen en
Inburgering (2004)).

7
2.2.1 Promotion of home-ownership through the tax system2
From 2005 onwards, the tax treatment of the dwelling one owns has changed
considerably. Before 2005 ‘cadastral income’ was part of taxable income. ‘Cadastral
income’ (CI) is the average normal net income that real estate provides to its owner.
This corresponds to an estimation of the average normal net rent value of the property
for one year (at the reference time, which is 1 January 1975). CI is subject to annual
indexing (the index for tax year 2010 is 1.5461). There were 4 possibilities of tax
relief an owner could apply for:
(a) The normal interest deduction: interest payments on mortgages for purchasing
or renovating a home can be deducted from income from real estate, if the loan
has a term of at least 10 years. This deduction cannot exceed CI.
(b) The dwelling allowance: part of CI is exempt from taxes, which is known as
the dwelling allowance. This amount is increased for each dependent person
(incl. spouses), for disabled heads or partner, and for widow(er)s with
dependent children. Depending on the level of the taxable income, owner-
occupiers can be entitled to a so-called additional dwelling allowance. The
deductible amount of both the dwelling and the additional dwelling allowance
may not exceed income from real estate.
(c) The additional interest deduction: the interest that remains after the normal
deduction of interest may likewise be deducted from total income on condition
that the mortgage was raised in order to build, purchase or renovate a home in
Belgium, and that the loan was contracted after 30 April 1986 for a term of at
least 10 years. This additional interest deduction is restricted in function of the
number of years that the rental value income of the real property in question
has been included in the taxable income. For the first five taxable years, the
2 Apart from the tax treatment in the federal tax system, regional and local taxes also play a role in housing policy in the form of the withholding tax on property income (WTPI). It is calculated on the basis of the CI net of interest payments. It has three components: a regional, a provincial (= surcharge on the regional WTPI) and a municipal (= surcharge on the regional WTPI), and can be considered as an extra tax on the dwelling. Moreover, transaction costs for purchasing a house are considerable in Belgium (even among the highest in Europe) due to registration rights, which belong to regional competences (Catte et al., 2004). Transaction costs are the lowest in Flanders (amounting 10% of the house price, 5% for small houses), plus 1-2% additional transaction costs regardless the region of purchase.

8
deduction amounts to 80%, and for the next seven years it diminishes by 10%
yearly, ending with a deduction of 10% in the seventh year.
(d) The tax credit for capital redemption payments: the capital redemption for a
mortgage loan with a term of at least 10 years entitles an owner-occupier to an
extra tax reduction (in the form of a tax credit). This reduction is calculated on
a maximum limit of the initial loan, which is comparable to that applied for the
additional interest reduction
For mortgage loans that started before 2005, measures (a), (c) and (d) still apply.
From 2005 onwards, the dwelling allowance has been abolished, and the CI of the
only self-occupied dwelling has become tax exempt in the personal income tax
system. For owners with a mortgage loan that is contracted after 1 January 2005, the
three other tax advantages (interest deduction, additional interest deduction, tax credit
for capital redemption payments) have been replaced by the so-called ‘dwelling
bonus’, which is only applicable for mortgages contracted for the own, self-occupied
and only dwelling and that have a term of at least 10 years. When these conditions are
fulfilled, the tax payer can deduct each year a basic amount of 1,500 Euro from his
taxable income (indexed to 2,080 Euro for tax year 2010). The tax advantage is thus
applied at the marginal tax rate. This basic amount can be increased with (a) 500 Euro
(690 for 2010) during the first 10 years of the term of the mortgage and with (b) 50
Euro (70 Euro for 2010) when there are three or more children in the household.
2.2.2 Social housing policies
Social housing policies are entirely part of regional competences. In general, the
regions follow three policy tracks: social renting, social home purchasing and social
loans. Social renting remains the dominant policy for the provision of social housing,
with the annual number of newly constructed houses for social renting amounting to
the three to fourfold of the number of houses built for social home purchasing over the
past decade in Flanders. To stimulate ownership, social loans are available from local
government institutions and municipal social renting organizations. Conditions vary
but, depending on the target group, relate mainly to income, number of children and
value of the purchased dwelling.

9
Rental subsidies are virtually non-existent. In Flanders, a small system of rental
subsidies exists for emergency cases; in practice, this belongs rather to welfare than to
general housing policies. This subsidy is means tested and only applies to occupants
of ‘unhealthy’ homes, renters who are forced out of their home in so-called ‘housing
emergency areas’ or homeless people.
In view of the empirical analysis, we focus here on the social renting system. Policy
strategies are outlined in the regional governments, while the more managerial and
coordinating aspects are delegated to a non-profit public company (one per region).
Between the regions, the main differences relate to generosity and eligibility criteria.
Local authorities have considerable freedom in the implementation of the regional
regulation, to develop a housing policy suited to the needs of the municipality,
including the provision of social housing. Hence, differentiation stems mainly from
local policies. The social housing projects are then carried out by Social Housing
Companies (private companies with municipalities as the main shareholder), that
build, own and sell or let the actual houses. Apart from this system, also social letting
offices operate under the social housing system. They rent dwellings on the private
market and let these to social renters. If necessary, they carry out renovation works in
these dwellings in order to make them in line with the applicable standards.
To be eligible for social renting, one has to fulfill an income condition and a property
condition. For single persons, yearly income should not exceed 18,788 Euro, while for
families (with dependents) the limit is 28,182 Euro, increased with 1,575 Euro for
each dependent. The property condition implies that no person in the household can
already own a dwelling or building land. In Flanders two more conditions were added
as of 2006. The first relates to language skills: one should be able to prove a basic
knowledge of Dutch or be willing to follow a Dutch language course corresponding to
the European reference level A1 (breakthrough). The second stipulates that
newcomers for whom civic integration training is obligatory, should have obtained the
civic integration certificate or prove the intention to do so.

10
According to a study for Flanders on the basis of survey data for 2005, 39% of private
renters (11.6% of all Flemish families) are eligible to rent in the social housing
system. However, only 15.8% of them actually applies (Winters et al. 2007). They are
placed on a waiting list and have to renew their candidacy every two years. In 2007,
75,735 households (3% of all Flemish households) were on the waiting list in
Flanders (statistics VMSW 2008) 25,029 (5% of all households) in Brussels
(Welzijnsbarometer Brussel 2007) and 31,070 (2% of all households) in Wallonia
(SWL 2009). The assignment of the houses takes place on a chronological basis, but
in specific cases exceptions and priorities apply (e.g. for disabled persons in houses
adapted to their needs, for persons from the local community). Yet, the average
waiting period amounted to 2.5 years in 2007 for Flanders (statistics VMSW), and 5
years in 2008 for Wallonia (SWL 2009).
The amount of social rent is determined at the regional level and is calculated on the
basis of a formula which takes into account the tenant’s income, the size of the family
and an indicative measure of the private rental market value of the house, to reflect
the quality of the dwelling. The upper limit of the monthly rent is set by 1/55 of
household’s yearly income, while the lower limit consists of 100 Euro/month for basic
social housing, to 200 Euro/month for more expensive social housing (higher quality /
bigger size). Generally, average rent prices vary between the local entities along with
the average income of its social renters, so large differences exist.
The socio-economic profile of social renters largely corresponds to the society’s most
vulnerable: elderly (65+), lone parents, unemployed, non-EU citizens and lower
educated are overrepresented among the social renters. Half of the social renters
belong to the bottom quintile of the income distribution (Winters et al. 2007).
The regional governments support the provision of social housing via project-
subsidies to the Social Housing Companies. There is no direct relation between the
subsidy and the level of rent. Apart from these subsidies and the social rents, Social
Housing Companies cannot have additional income sources. It is assumed that with
the mix of higher and lower income renters, the subsidy on average reconciles the
bridge between the cost of provision and the rent price. However, some companies do

11
not attain the equilibrium, especially in the cities, where the average income of social
renters is often below average. They are currently additionally supported with more ad
hoc subsidies (Winters et al. 2007).
3. Data
3.1 The dataset: EU-SILC
The most recent available version of EU-SILC (survey year 2008, with income data
referring to 2007) provides the micro data (EUROSTAT). Unfortunately, we have not
yet the Belgian dataset of the corresponding year at our disposal, which apart from the
variables provided to EUROSTAT also contains extra information on some crucial
variables (e.g. more details on housing costs).
The data allow us to distinguish households who own their home outright and those
who are paying off a mortgage. Among tenants we can distinguish three categories: 1)
tenants at the private, non-subsidized market, 2) tenants who rent at a reduced rate,
and 3) those who rent for free. For tenants with reduced rent the data do not allow to
differentiate between beneficiaries from social housing and those whose reduced rent
is granted by their landlord (employer, local authorities, relatives etc.).
Table 2: Tenure status in EU-SILC, Flanders (FLA) and Belgium (BE), 2008.
% of households
% of individuals living in a household of …
N (=number of cases)
FLA BE FLA BE FLA BE Owners - owner outright - owner with mortgage
72.6% 40.1% 32.5%
67.3%36.9%30.4%
77.6% 35.6% 42.0%
73.2% 32.9% 40.2%
6,576 3,062 3,514
11,173 5,044 6,129
Renters 27.4% 32.7% 22.5% 26.8% 1,693 3,902 - private market 17.9% 22.0% 15.0% 18.4% 1,120 2,653 - reduced rent 8.1% 8.7% 6.5% 7.1% 495 1,024 - rent-free 1.4% 1.9% 1.0% 1.4% 78 225 Source: own calculations on EU-SILC 2008.
Table 2 presents tenure status of households and individuals. In line with other
sources (cf. supra), the SILC-data show a high share of home owners: about two
thirds of all households in Belgium live in an owner-occupied house, which
12
corresponds to 73% of all individuals. In Flanders homeownership is on average more
widespread, with 73%, resp. 78% of households, resp. individuals. Somewhat less
than half of these individuals own outright, whereas a majority of owners has an
outstanding mortgage. Around a quarter of households (and 22% of the population)
lives in a dwelling that is rented in the private non-subsidized market. Consequently,
the share of tenants at reduced rate or rent-free is very small in Belgium, and
especially in Flanders (reduced-rent: 7%; rent-free: 1%).
3.2 Data on housing costs in SILC
In order to derive net IR, we need information on housing costs. The variable ‘Total
housing cost’ includes monthly costs connected with the household’s right to live in
the accommodation. According to the EUROSTAT-instructions for the construction
of the EU-SILC variables, this variable should include:
- for owners: mortgage interest payments, structural insurance, mandatory services
and charges (sewage removal, refuse removal etc.), regular maintenance and
repairs, taxes, cost of utilities (water, electricity, gas and heating);
- for tenants at market price: rent payments (including housing benefits), structural
insurance (if paid for), mandatory services and charges (sewage removal, refuse
removal etc.), regular maintenance and repairs, taxes (if paid for the tenants), cost
of utilities (water, electricity, gas and heating);
- for tenants at reduced price or rent free: imputed rent (including housing benefits),
structural insurance (if paid for), mandatory services and charges (sewage
removal, refuse removal etc.)(if paid for), taxes on dwelling (if applicable),
regular maintenance and repairs, cost of utilities (water, electricity, gas and
heating).
The Belgian EU-SILC dataset contains more country-specific variables, which allow
for a further categorization into operating costs and maintenance costs. As we have
not yet this dataset at our disposal, we have taken a rough estimation of maintenance
costs by deducting from the variable ‘Total housing cost’ rent payments, mortgage
interest payments, and divide the remaining amount by two, thus assuming that

13
maintenance and operating costs each make up about half of these remaining costs.
Table 3 gives an overview of these various housing costs.
Interest repayments on mortgage of owners have been calculated by the national data
provider on the basis of the survey data, following EUROSTAT instructions (Federale
Overheidsdienst Economie – Algemene Directie Statistiek en Economische
Informatie 2006). These are, however, gross interest payments and not net (i.e. after
taking account of tax deductions). At present, net interest payments are not available.
Unfortunately, they cannot be calculated due to lack of information on cadastral
income in EU-SILC. The Belgian dataset of 2008 should however provide this
information. Consequently, for this group housing costs will suffer from a certain
degree of overestimation.
Table 3: Housing costs per month per household according to tenure status, 2008.
Rent payments
Operating costs
Maintenance costs & taxes
Interest repayments
Total housing
cost Flanders Owners - owner outright - owner with mortgage
- - -
228 251 201
228 251 201
113 -
252
569 502 654
Tenants 411 66 66 - 530 - tenants (private market) 499 70 70 - 639 - reduced rent 286 67 67 - 420 - rent-free - - - - - Belgium Owners - owner outright - owner with mortgage
- - -
225 238 209
225 238 209
117 -
258
567 476 676
Tenants 404 63 63 - 530 - tenants (private market) 484 69 69 - 622 - reduced rent 286 63 63 - 412 - rent-free - - - - - Source: own calculations on EU-SILC 2008.
4. Methods to calculate net imputed rent
Three groups of potential beneficiaries of IR can be identified, namely owner-
occupiers, rent-free tenants and tenants with below-market rent. For a general
description of the various approaches to calculate IR on the basis of micro data, we

14
refer to Frick & Grabka (2003), Frick et al. (2006, 2007 and 2010). They propose
three methods: 1) the opportunity cost approach; 2) the capital market approach; and
3) the self-assessment approach. In Belgium also the cadastral income can be
considered as a measure for imputed rent. We briefly describe the various methods.
With EU-SILC 2008 only the opportunity cost approach can be applied for Belgium.
4.1 Cadastral income
As we have seen, CI is used for tax purposes as an estimation of the normal net rent
value of a property for one year. Hence, it can also be considered as an indicator for
IR. CI in Belgium is, however, not a good measure for IR as it systematically
underestimates the rental value of the property: normally there should be a
‘perequation’ (i.e. a general re-estimation) of CI every 10 years, but this has not been
done since the seventies. Nevertheless, it would be interesting to compare the
estimates of IR calculated in this paper with current CI, in order to have an idea of the
extent of this underestimation. Unfortunately, this is not possible yet as we need the
Belgian SILC database of 2008 for this purpose.
4.1 The capital market approach
This approach starts from the alternative use of capital on the capital market: a
household’s decision to move into homeownership represents a trade-off with respect
to investing in real estate or in financial assets (Frick et al., 2003). Saunders et al.
(1992) for instance propose to apply a two percent real return on the value of the
home: “Inflation plus two percent was thus multiplied by home equity to estimate
imputed rent” (p.11). Frick et al. (2003), however, argue that this may seriously
overestimate the true return on investment in real estate, as the application of a
nominal interest rate to equity confounds the effect of inflation on returns. In this
paper, we were not able to use the capital market approach due to lack of information
on the market value of the owner-occupied dwelling.
4.2 The self-assessment approach

15
In the SA approach respondents are asked to make an assessment of the rental value
of their home. In SILC the following question is asked to owners and rent-free
tenants: “Can you make an estimate of the monthly rent you would have to pay for
your dwelling if you would have to rent it?”3. The SA approach is only applicable to
owners and rent-free tenants, as the question is not asked to reduced-rent tenants.
Unfortunately, the variable is empty for Belgium in 2008.
4.3 The opportunity cost approach
The OC approach estimates the opportunity cost of housing in a non-subsidized rental
market (see Frick & Grabka, 2003). We apply this approach on the entire Belgian
population, taking account of the regional dimension in the regression. We rely on a
hedonic regression estimation of the logarithm of rent (excluding all costs) actually
paid by main tenants on the private housing market (so excluding social housing and
any reduced rent payments). We apply a two-step Heckmann procedure to predict the
logarithm of rent:
- Step 1: running a semi-logarithmic regression model with log(rent) as dependent
variable based on the population of tenants in the private market. The covariates
used refer to type and size of the dwelling, quality of dwelling and neighbourhood,
occupancy in years, geographical location (region and degree of urbanization) and
household income (see Table 4). Most of the independent variables were recoded
into dummy variables. A Heckman selection correction is applied to correct for
potential selectivity into the owner status.
- Step 2: application of the resulting coefficients to otherwise similar owner-
occupiers as well as rent-free and reduced-rent tenants.
After these two steps a randomly chosen error term from the true distribution of
tenants on the private housing market is added in order to maintain variation in the
resulting estimates of IR. We end up with an annual measure of IR by taking the
antilog of the estimated monthly fictitious rent and by multiplying it by 12. In order to
3 It is not entirely clear whether this monthly rent refers to net or gross amounts (before or after deduction of housing costs). In the question asked to renters, the amount asked however is ‘net’ i.e. excluding all costs. Consequently, we assume that the same applies to self-assessed rent.

16
obtain net IR we deduct maintenance costs and taxes for all owner occupiers and
interest payments for owners with interest payments on mortgage. Negative IR is put
to zero.
Table 4: Covariates used in the two-step Heckmann estimation (opportunity cost approach), Belgium 2008. Variable Mean Std. Dev. Code Detached house 0.344127 0.47512 No=0; yes=1 Semi-detached house 0.401111 0.490162 No=0; yes=1 Apartment/flat in building with <10 dwellings 0.169841 0.375523 No=0; yes=1 Apartment/flat in building with ≥10 dwellings 0.075238 0.263796 No=0; yes=1 1 room in house 0.014127 0.118024 No=0; yes=1 2 rooms 0.050794 0.219594 No=0; yes=1 3 rooms 0.11873 0.323496 No=0; yes=1 4 rooms 0.182064 0.385928 No=0; yes=1 5 rooms 0.233016 0.422786 No=0; yes=1 6 or more rooms 0.36127 0.480407 No=0; yes=1 Moisture free? 0.179365 0.383688 yes=0; no=1 Possible to keep home adequately warm? 0.930952 0.253555 yes=0; no=1 Modern comfort present? (bath / shower / indoor flushing toilet) 0.015556 0.123758
No=0; yes=1
Dwelling too dark? 0.08254 0.275207 yes=0; no=1 Noise from neighbours / street? 0.214286 0.410359 No=0; yes=1 Pollution, grime or other environmental problem? 0.165079 0.371282 No=0; yes=1 Crime, violence or vandalism in the area? 0.169841 0.375523 No=0; yes=1 Brussels capital region 0.130318 0.336679 No=0; yes=1 Flanders - Densely populated area 0.279841 0.448957 No=0; yes=1 Flanders - Intermediate area 0.264127 0.440902 No=0; yes=1 Walloon Region - Densely populated area 0.126032 0.331912 No=0; yes=1 Walloon Region – Intermediate area 0.156191 0.363065 No=0; yes=1 Walloon Region - Thinly populated area 0.043492 0.203978 No=0; yes=1 Occupancy in years 16.76523 14.86008 Continuous Household disposable income 32564.71 30375.2 Continuous Source: Own calculations on the basis of EU-SILC 2008.
Table 5 presents average amounts of imputed rent following from the opportunity cost
approach, both in gross and net terms. When the Belgian SILC becomes available,
these amounts will be compared with the value of CI. We can, however, compare the
amounts with the SILC-variable of imputed rent (IR-SILC) that has been calculated
by the national data provider of SILC4. As becomes apparent from the comparison,
this variable contains only gross variables and does not take account of housing costs.
In this sense, it is less suitable for distributive analyses.
4 According to EUROSTAT-documentation, this variable is also derived on the basis of an opportunity costs approach. Average amounts are in general somewhat higher than our results; especially for reduced rent tenants there are sizable differences. It is not clear to which factors can be attributed.

17
Table 5: Average amount of gross and net imputed rent (IR) per month per household according to the opportunity cost approach, Belgium and Flanders, 2008. Gross IR Net IR (*) IR-SILC BE FLA BE FLA BE FLA Owners outright Owners with mortgage
371 508
375 518
181 146
185 158
408 472
406 472
Tenants reduced rent 464 495 198 228 364 356 Tenants rent-free 417 426 417 426 391 393 (*) Negative net IR is set to zero. Hence, average net IR will not match exactly gross IR minus costs. Source: own calculations on EU-SILC 2008.
5. Results
We now present the impact on income inequality of including net IR in the income
concept. We present results for owners and tenants separately. Owners are further
divided into those who own outright and those who still have a mortgage burden;
tenants are further divided into private market tenants, reduced-rent tenants and rent-
free tenants (with of course no IR measure for private market tenants)5. Results for
rent-free tenants are more of an indicative nature, as the number of cases is relatively
small.
Baseline income is household disposable income on a yearly basis. The income
advantage of IR, using the two approaches, is compared to the baseline in both
absolute and relative terms. Both disposable income and the income advantage from
IR are equivalised in order to take account of family size and composition. The
equivalence scale used is the modified OECD-scale, which attributes a value 1 to the
first adult, 0.5 to each other adult and 0.3 to each child.
5.1 Housing tenure and imputed rent
5 Results for subgroups of rent-free tenants are rather of an indicative nature, as the number of cases is relatively small (cf. Table 2).
18
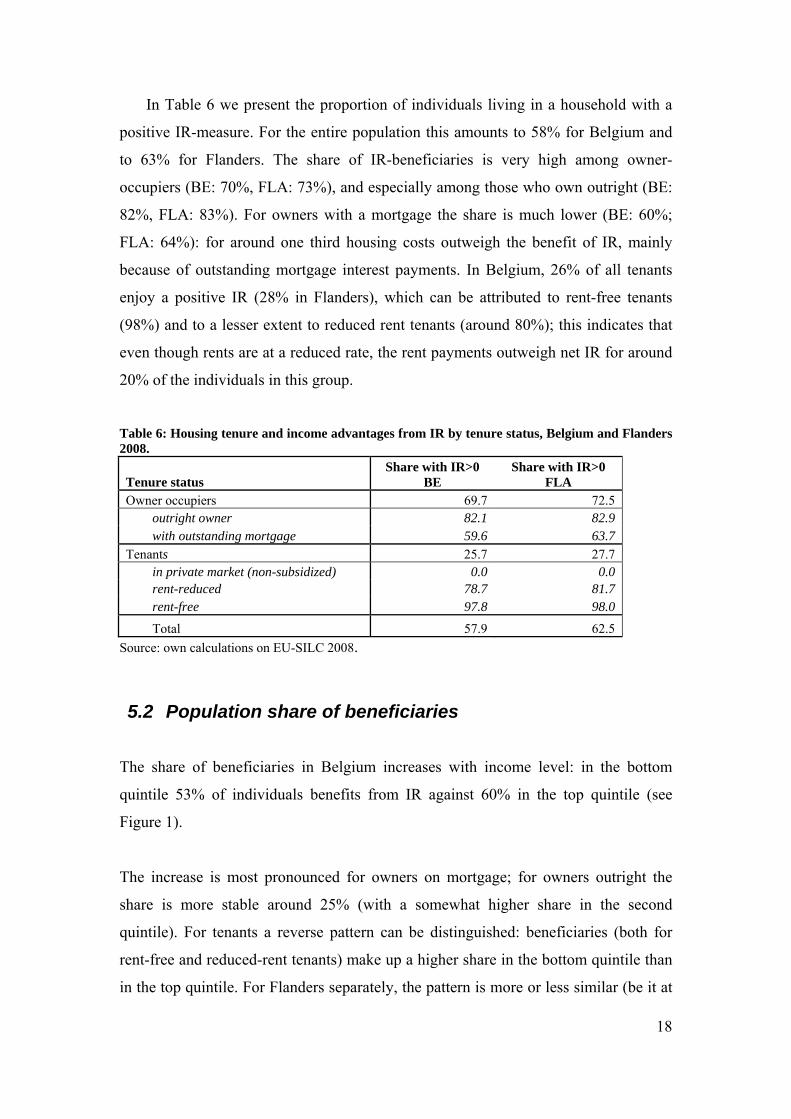
In Table 6 we present the proportion of individuals living in a household with a
positive IR-measure. For the entire population this amounts to 58% for Belgium and
to 63% for Flanders. The share of IR-beneficiaries is very high among owner-
occupiers (BE: 70%, FLA: 73%), and especially among those who own outright (BE:
82%, FLA: 83%). For owners with a mortgage the share is much lower (BE: 60%;
FLA: 64%): for around one third housing costs outweigh the benefit of IR, mainly
because of outstanding mortgage interest payments. In Belgium, 26% of all tenants
enjoy a positive IR (28% in Flanders), which can be attributed to rent-free tenants
(98%) and to a lesser extent to reduced rent tenants (around 80%); this indicates that
even though rents are at a reduced rate, the rent payments outweigh net IR for around
20% of the individuals in this group.
Table 6: Housing tenure and income advantages from IR by tenure status, Belgium and Flanders 2008.
Tenure status Share with IR>0
BE Share with IR>0
FLA Owner occupiers 69.7 72.5
outright owner 82.1 82.9 with outstanding mortgage 59.6 63.7
Tenants 25.7 27.7 in private market (non-subsidized) 0.0 0.0 rent-reduced 78.7 81.7 rent-free 97.8 98.0
Total 57.9 62.5 Source: own calculations on EU-SILC 2008.
5.2 Population share of beneficiaries
The share of beneficiaries in Belgium increases with income level: in the bottom
quintile 53% of individuals benefits from IR against 60% in the top quintile (see
Figure 1).
The increase is most pronounced for owners on mortgage; for owners outright the
share is more stable around 25% (with a somewhat higher share in the second
quintile). For tenants a reverse pattern can be distinguished: beneficiaries (both for
rent-free and reduced-rent tenants) make up a higher share in the bottom quintile than
in the top quintile. For Flanders separately, the pattern is more or less similar (be it at
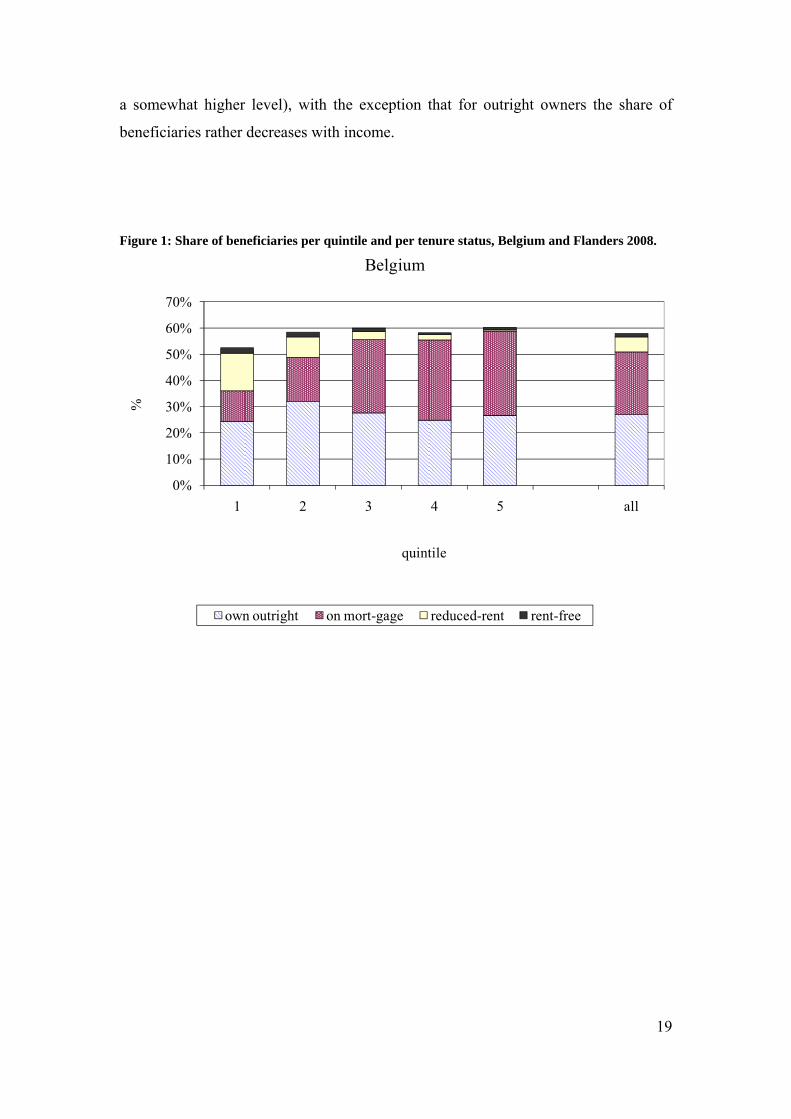
19
a somewhat higher level), with the exception that for outright owners the share of
beneficiaries rather decreases with income.
Figure 1: Share of beneficiaries per quintile and per tenure status, Belgium and Flanders 2008.
0%
10%
20%
30%
40%
50%
60%
70%
1 2 3 4 5 all
%
quintile
Belgium
own outright on mort-gage reduced-rent rent-free

20
0%
10%
20%
30%
40%
50%
60%
70%
1 2 3 4 5 all
%
quintile
Flanders
own outright on mort-gage reduced-rent rent-free
Source: own calculations on EU-SILC 2008.
5.3 Income advantages from imputed rent
Income advantages from IR per quintile and per tenure status are presented in Table 7.
Relative income increases in disposable income are not negligible: disposable income
increases on average with 5%. Income increases are more important at the bottom of
the income distribution: 10.5% for Belgium as a whole, and 12.9% for Flanders in the
bottom quintile, against only 3% in the top quintile. The proportion of IR in
disposable income tends to decrease with income level for all groups, except for
owners on mortgage. This indicates that, even though the amount of IR increases in
general with income, it increases less steeply than cash disposable income. For
owners on mortgage this is not the case, because housing costs, and more particularly
the burden of interest payments, are relatively heavier at the bottom of the income
distribution.
Table 7: Income advantages from IR by tenure status, quintile distribution, Belgium and
Flanders, 2008.

21
BELGIUM Total Owner-occupiers Tenants
Quintile Total own outright on mort-gage Total rent-
free reduced-
rent 1 (bottom) 10.5% 6.2% 4.7% 1.5% 4.3% 1.0% 3.3%
2 7.5% 6.1% 3.8% 2.2% 1.4% 0.4% 1.0% 3 5.0% 4.4% 2.4% 2.1% 0.5% 0.2% 0.3% 4 3.8% 3.5% 1.8% 1.7% 0.3% 0.1% 0.2%
5 (top) 3.0% 2.8% 1.3% 1.5% 0.1% 0.1% 0.0%
All 4.8% 4.0% 2.3% 1.8% 0.8% 0.2% 0.6% FLANDERS Total Owner-occupiers Tenants
Quintile Total own outright on mort-gage Total rent-
free reduced-
rent
1 (bottom) 12.9
% 7.6% 6.1% 1.5% 5.3% 0.9% 4.4% 2 9.0% 7.5% 4.4% 3.0% 1.6% 0.3% 1.3% 3 4.9% 4.5% 2.5% 2.0% 0.4% 0.1% 0.3% 4 4.1% 3.8% 1.9% 1.9% 0.3% 0.1% 0.2%
5 (top) 3.1% 3.0% 1.3% 1.7% 0.1% 0.1% 0.1%
All 5.1% 4.3% 2.4% 2.0% 0.7% 0.2% 0.6% Source: own calculations on EU-SILC 2008.
5.4 Effect on income inequality and poverty
The effect of including IR in the income concept on income inequality and poverty is
measured by calculating a series of commonly used inequality and poverty measures
for both baseline income and baseline income plus IR. The inequality measures used
are the Gini index; the Atkinson index for inequality aversion parameters 0.5 and 1.5;
the mean log deviation (MLD); the half squared coefficient of variation (Half SCV);
and three percentile ratios (90/10; 90/50 and 50/10). The poverty measures are those
from the FGT family with parameters 0 (head count), 1 (normalized poverty gap) and
2 (average squared normalized poverty gap)(see Foster et al., 1984).
As can be expected from our analysis on the basis of quintile distributions,
inclusion of IR in the income concept reduces inequality and poverty in general (see
Table 8). The Gini coefficient decreases with 2.8% (Belgium), resp. 2.7% (Flanders).
Inequality indicators that are more sensitive to changes at the bottom of the
distribution, namely the MLD and especially the Atkinson 1.5, report a markedly
higher decrease in inequality (5.3% and 10.8% respectively in Belgium and 6.5% and

22
12.2% respectively in Flanders). The results of the poverty measures confirm these
results: the decrease in poverty is strongest for FGT2, which attaches more weight to
poverty than the other two poverty measures.
Inequality is reduced when including IR for outright owners and when including IR
for tenants. The strong effect for low-income sensitive measures (MLD, Atkinson 1.5,
FGT2) is apparently to a very large extent due to IR for outright owners. This is
probably due to the fact that these owners are mainly elderly, single individuals that
are found relatively more at the bottom of the income distribution and that are
important beneficiaries of IR. Including IR for owners on mortgage increases
inequality; this is consistent with our previous finding that the share of IR increases
with disposable income.

23
Table 8: Inequality and poverty indices by tenure status, Belgium 2008.
Belgium Flanders Total Owner-occupiers Tenants Total Owner-occupiers Tenant
Inequality and poverty
indices
Baseline Total own outright
on mort-gage
Total rent-free
reduced-rent* Baseline Total own
outright
on mort-gage
Total rent-free
Gini 0.2715 -2.8 -1.3 -1.6 0.5 -1.5 -0.3 -1.2 0.2416 -3.4 -1.8 -2.2 0.6 -1.5 -0.Atkinson 0.5 0.0662 -5.3 -2.6 -2.9 0.5 -2.6 -0.5 -2.0 0.0531 -6.5 -3.6 -3.9 0.6 -2.7 -0.Atkinson 1.5 0.1920 -10.8 -7.1 -5.2 -1.5 -3.3 -0.5 -2.8 0.1478 -12.2 -8.4 -9.2 1.2 -3.4 -0.
MLD 0.1326 -6.4 -3.1 -3.4 0.6 -3.1 -0.6 -2.5 0.1046 -7.7 -4.2 -4.8 1.1 -3.3 -0.Half SCV 0.3006 -6.6 -4.7 -3.6 -1.0 -2.0 -0.5 -1.5 0.2398 -7.8 -6.2 -4.2 -1.9 -1.7 -0.DR: 90/10 3.1553 -2.8 0.1 -1.3 1.7 -3.2 -0.2 -2.8 2.7307 -4.6 -0.9 -1.8 1.9 -1.6 -0.DR: 90/50 1.6964 -1.0 -0.5 -0.7 0.5 -0.7 -0.2 -0.5 1.5992 -0.8 -0.6 -0.3 0.3 0.0 0.DR: 50/10 1.8600 -1.9 0.5 -0.6 1.2 -2.5 0.0 -2.3 1.7076 -3.8 -0.4 -1.5 1.6 -1.6 -0.
FGT0 0.1457 -5.2 1.1 -0.6 4.3 -4.5 0.8 -3.6 0.0892 -9.0 -0.9 -4.3 5.9 -5.7 1.FGT1 0.0320 -6.3 2.3 -1.1 3.7 -7.0 -0.5 -6.1 0.0180 -12.7 0.3 -4.7 5.4 -11.3 -1.FGT2 0.0123 -8.1 0.3 -2.6 3.0 -6.6 -0.9 -5.2 0.0067 -15.4 -1.5 -5.6 4.3 -11.2 -2.
Source: own calculations on SILC-Belgium 2008.
24
The inequality and poverty reducing effect for tenants points into the direction that
social housing may play a role here. Inequality in both Belgium and Flanders decrease
when including imputed rent for reduced-rent tenants. Poverty rates drop with 3.6% in
Belgium and almost 5% in Flanders. If we focus on the group of reduced-rent tenants,
then poverty incidence decreases in Flanders from 30.4% to 22.5% (not shown in
Table).
6. Conclusion
In this paper we broadened the income concept with the value of imputed rent for
home-owners and tenants. For our analysis we used the 2008 wave of the EU-SILC.
Poverty, poverty gap and overall inequality go down after we incorporate IR in the
income concept. These findings are in line with most research on the income value of
housing in other countries (e.g. Frick & Grabka, 2003), independent of the datasets
used6.
The IR causes an increase of disposable income in all quintiles, but the relative
increase is the highest in the bottom quintiles and the lowest in the top quintile. The
interdecile ranges show that accounting for IR lifts the income of the lower deciles
while it has little effect on the higher deciles. The interdecile range between top and
median incomes remains constant, while both the range between top and bottom as
the range between median and bottom drop to the same extent. The drop in inequality
is due to the relation between ownership and age, and income and age. At old age,
when income is lower, many households own their homes outright. At active age,
when income is higher, large mortgage payments are putting a weight on disposable
income.
The post-war housing policies have always emphasized the stimulation of home
ownership. In particular, the acquiring of modest housing has been stimulated. Below
market interest rates for loans, below market prices for social housing and renovation
subsidies - all with means tested eligibility – and major fiscal incentives, made 6 Our analyses are based on EU-SILC; Frick & Grabka used SOEP for Germany, PSID for USA and BHSP for UK.

25
ownership of a small family home possible for many households. Overall inequality
does not rise after controlling for home ownership by including IR– it declines. Since
the positive effect of IR is the largest in lower income households, housing policies
are indirectly achieving its goal of bringing home-ownership in the reach of lower
income groups.
Although the effect of IR on the total income distribution is known by now, the policy
consequences are less clear. It is often claimed that owning a house is a protection
against poverty or financial stress. Our results show that this is true as far as
pensioners are concerned, but it is much harder to examine the exact causality of
home-ownership. Exactly those who are in need of protection against poverty due to
housing costs, are often unable to acquire a house. The increasing policy attention for
social housing seems justified, as the house-poor and the income-poor are often the
same.
7. References Canberra Group (2001). Expert Group on Household Income Statistics: Final Report and
Recommendations. Ottawa.
Cantillon, B. & Meulemans, B. (1993), “De geruisloze kering: de nivellering van de intergenerationele welvaartsverschillen” in Economisch en Sociaal Tijdschrift, 3, 431-448.
De Decker, P. (2006). The institutional study for Belgium, (Origins of security and insecurity: the interplay of housing systems with jobs, household structures, finance, and social security), Universiteit Antwerpen – OASeS: Antwerpen.
European Commission (2003). National Action Plan on Social Inclusion 2003. http://ec.europa.eu/employment_social/news/2001/jun/nap_incl_0305_be_nl.pdf.
Foster J., Greer, J. & Thorbecke, E. (1984). “A class of decomposable poverty measures” in Econometrica, vol. 52, pp. 761-766.
Frick J.R. & Grabka M.M. (2003), Imputed Rent and Income Inequality: A Decomposition Analysis for the UK, West Germany and the USA, The Review of Income and Wealth, 49(4): 513-537.
Frick, J.R., Goebel, J., Grabka, M.M. (2006), Assessing the distributional impact of ‘imputed rent’ and ‘non-cash employee income’ in micro data: Case study based on EU-SILC (2004) and SOEP (2002). Paper presented at the International Conference: “Comparative EU-Statistics on Income and Living Conditions: issues and challenges”, Helsinki, 6-8 November 2006.
Frick, J.R., Grabka, M.M. & Groh-Samberg, O. (2007), Estimates of Imputed rent and Analysis of their Distributional Impact, AIM-AP national Report for Germany, DIW-Berlin.

26
Frick, J.R., Grabka, M.M., Smeeding T.M. & Tsakloglou P. (2010), “Distributional effects of imputed rents in five European countries”, Journal of Housing Economics Volume 19, Issue 3, September 2010, Pages 167-179.
Kain, J. F., & Quigley, J. M. (1972). Note on Owner's Estimate of Housing Value. Journal of the American Statistical Association, 67(340), 803-806.
Heylen, K. Le Roy, M. Vanden Broucke, S., Vandekerckhove, B. & S. Winters (2007), Wonen in Vlaanderen. De resultaten van de woonsurvey 2005 en de woningschouwing 2005. Ministerie van de Vlaamse Gemeenschap, Departement RWO – Woonbeleid, Brussel.
Meulemans B., Geurts, V. & P. De Decker (1996). Het onbereikbare dak. Eigendomsverwerving, wooncomfort, prijsontwikkelingen en betaalbaarheid in dynamisch en geografisch perspectief. CSB Berichten: Antwerpen.
Observatorium voor gezondheid en welzijn Brussel (2007). Welzijnsbarometer – Brussels armoederapport, Brussel.
Saunders et al. (1992), Non-cash Income, Living Standards, Inequality and Poverty : Evidence from the Luxembourg Income Study, Discussion Papers 35, Social Policy Research Centre (SPRC), University of New South Wales.
Société Wallon du Logement (SWL) (2009). Rapport d’activités annuel, Charleroi.
Van Dam, Rudi, Veerle Geurts, and Isabelle Pannecoucke (2003). "Housing tenure, housing cost and poverty in Flanders (Belgium)." Journal of housing and the built Environment, 18:1-23.
Vlaamse Maatschappij voor Sociaal Wonen (VMSW) (2007). Statistieken, Brussel.
Winters, S., Elsinga M., Haffner M., Heylen K., Tratsaert K., Van Daalen G. & Van Damme B. (2007). Op weg naar een nieuw Vlaams sociaal huurstelsel? Ministerie van de Vlaamse Gemeenschap, Departement RWO – Woonbeleid, Brussel.