GEOTHERMAL TRAINING PROGRAMME Reports … · 2012-03-15 · 1993 Zosimo F. Sarmiento Philippines...
43
Transcript of GEOTHERMAL TRAINING PROGRAMME Reports … · 2012-03-15 · 1993 Zosimo F. Sarmiento Philippines...


GEOTHERMAL TRAINING PROGRAMME Reports 2011 Orkustofnun, Grensásvegur 9, Number 4 IS-108 Reykjavík, Iceland
LECTURES ON ENHANCED GEOTHERMAL SYSTEMS
Dr. Ernst Huenges Helmholtz Centre Potsdam
GFZ German Research Centre for Geosciences Head of International Centre for Geothermal Research
Head of Section Reservoir Technologies Telegrafenberg, D-14473 Potsdam
GERMANY e-mail: [email protected]
Lectures given in August/September 2011 United Nations University, Geothermal Training Programme
Reykjavík, Iceland Published in December 2011
ISBN 978-9979-68-305-6
ISSN 1670-7400

Huenges ii Introduction
PREFACE
The UNU Visiting Lecturer in 2011 was Dr. Ernst Huenges, who leads the International Geothermal Research Centre at the Helmholtz-Zentrum Potsdam Deutsches GeoForschungsZentrum (GFZ). He gave a series of lectures on Enhanced Geothermal Systems from 29 August to 2 September. Dr. Ernst Huenges has since 1994 been head of the Reservoir Technologies section of the GFZ German Research Centre for Geosciences. He is a qualified physicist and process engineer. His numerous scientific papers refer to the Earth's transport processes and in recent years he has concentrated on the utilization of underground resources. He is the head of the petrophysical laboratories at the GFZ, and involved in a number of scientific deep drilling projects. He and his co-workers develop stimulation techniques to enhance the fluid productivity of reservoirs (Enhanced Geothermal Systems) and to guarantee a long-term extraction of geothermal energy. The multidisciplinary working group combines basic and applied research focusing on new technologies for an economical exploration and utilization of geothermal energy for power supply, heating and/or cooling. In 2010, he edited a book entitled "Geothermal Energy Systems" which was well received in the geothermal community. He is a contributing author of the IPPC-special report on renewable energies. His lectures at the UNU-GTP were well attended by members of the geothermal community in Iceland as well as the UNU Fellows and UNU-GTP MSc Fellows. Since the foundation of the UNU-GTP in 1979, it has been customary to invite annually one internationally renowned geothermal expert to come to Iceland as the UNU Visiting Lecturer. This has been in addition to various foreign lecturers who have given lectures at the Training Programme from year to year. It is the good fortune of the UNU Geothermal Training Programme that so many distinguished geothermal specialists have found time to visit us. Following is a list of the UNU Visiting Lecturers during 1979-2011: 1979 Donald E. White United States 1996 John Lund United States 1980 Christopher Armstead United Kingdom 1997 Toshihiro Uchida Japan 1981 Derek H. Freeston New Zealand 1998 Agnes G. Reyes Philippines/N.Z. 1982 Stanley H. Ward United States 1999 Philip M. Wright United States 1983 Patrick Browne New Zealand 2000 Trevor M. Hunt New Zealand 1984 Enrico Barbier Italy 2001 HilelLegmann Israel 1985 Bernardo Tolentino Philippines 2002 KarstenPruess United States 1986 C. Russel James New Zealand 2003 BeataKepinska Poland 1987 Robert Harrison United Kingdom 2004 Peter Seibt Germany 1988 Robert O. Fournier United States 2005 Martin N. Mwangi Kenya 1989 Peter Ottlik Hungary 2006 Hagen M. Hole New Zealand 1990 Andre Menjoz France 2007 José Antonio Rodríguez El Salvador 1991 Wang Ji-yang China 2008 Wang Kun China 1992 Patrick Muffler United States 2009 Wilfred A. Elders United States 1993 Zosimo F. Sarmiento Philippines 2010 Roland N. Horne United States 1994 LadislausRybach Switzerland 2011 Ernst Huenges Germany 1995 Gudm.Bödvarsson United States
With warmest wishes from Iceland
Ingvar B. Fridleifsson, director, UNU-GTP

Introduction 1 Huenges
TABLE OF CONTENTS
Page INTRODUCTION ................................................................................................................................... 1 LECTURE 1: RESERVOIR CHARACTERIZATION AND GEOTHERMAL EXPLORATION ....... 3 LECTURE 2: GEOTHERMAL DRILLING ......................................................................................... 10 LECTURE 3: ENGINEERING GEOTHERMAL RESERVOIRS ....................................................... 16 LECTURE 4: ENERGETIC USE OF GEOTHERMAL RESERVOIRS ............................................. 23 LECTURE 5: ECONOMICS AND ENVIRONMENTAL ISSUES ..................................................... 29 CHANCES AND CHALLENGES OF GEOTHERMAL APPLICATIONS ........................................ 33 LITERATURE ...................................................................................................................................... 36 LIST OF FIGURES 1 Stages of the development of a geothermal site .............................................................................2 2 World map with locations of intense seismic activity and geothermal power stations ..................3 3 Velocity and vertical gradient models from tomographic inversion ..............................................4 4 Electrical resistivity model obtained from the tear zones inversion .............................................4 5 Geological model of the Groß Schönebeck area in the North German basin ................................5 6 Temperature vs. depth profiles .......................................................................................................5 7 Heat flow density map of Europe ...................................................................................................6 8 Permeability of rocks and rock systems along the scale of natural manifestations .......................7 9 Fluid pathways in different geological environments ....................................................................7 10 Geometrical relation between stress axes, stress regimes, and fracture planes ..............................8 11 Sketch section showing the variety of reservoirs that can be used for heat extraction ..................9 12 Drill rig INNOVA-RIG of GFZ ................................................................................................... 10 13 Drill rig with main components required at the drill site ............................................................. 11 14 Mud circulation loop of a drilling site .......................................................................................... 12 15 Potential geology related drilling problems ................................................................................. 13 16 Casing completion of a borehole in deep sediments .................................................................... 14 17 The 23"-drill bit used in the Groß Schönebeck well .................................................................... 15 18 Costs break down of a 4 km deep well into a sedimentary geothermal reservoir ........................ 15 19 Sketch of a lift test in a deep borehole ......................................................................................... 16 20 Top view of a fracture propagation due to hydraulic stimulation ................................................ 17 21 Conceptual arrangements of bottom hole positions in relation to fracture propagations ............. 17 22 Instrumentations at the Groß Schönebeck drill site ..................................................................... 18 23 Artificial fracture generated by the waterfrac technique .............................................................. 18 24 Selfpropping: Existing fracture, while injecting, and after pressure release ................................ 19 25 Top view to the geothermal test site and relocated seismic events at Groß Schönebeck ............. 20 26 Artificial fracture generated by the hydraulic proppant frac technique ....................................... 21 27 Downhole pump ........................................................................................................................... 21 28 Probable processes during the circulation of thermal water ........................................................ 22 29 Carbonat scaling after some time of utilisation at a geothermal site............................................ 22 30 Principle for energetic use of EGS reservoirs showing a well doublet ........................................ 23

Huenges iv Introduction
Page 31 Energy provision options for heat source temperature between 20 and 200°C ........................... 23 32 Illustration of a plate heat exchanger and a shell-and-tube heat exchanger ................................. 24 33 Sorted annual heat load duration curves ...................................................................................... 25 34 Scheme of a well doublet with backup/peak-load system feeding a district heating grid ............ 25 35 Schematic setup of an Organic Rankine cycle (ORC) ................................................................. 26 36 Example of a temperature-heat transfer-diagram for a single-stage and a three-stage ORC ....... 26 37 Example of a temperature-heat transfer-diagram for a Kalina cycle ........................................... 26 38 Schematic setup of a Kalina cycle ............................................................................................... 27 39 Chiller solutions for condensing purposes in the conversion plant .............................................. 27 40 Principle of an absorption refrigeration cycle .............................................................................. 28 41 Development of well costs versus well depth .............................................................................. 29 42 Range of specific binary plant cost .............................................................................................. 30 43 Cash flow calculation and net present value of an EGS project .................................................. 31 44 Typical scheme of an inventory analysis within a Life Cycle Assessment .................................. 32 45 CO2-emissions due to electrical power production from different energy carriers as given ....... 32 46 Global technical potential of renewable energy carriers which can be provided per year ........... 33 47 Potential development of the installed capacity and levelized cost of energy for EGS plants over time ............................................................................................................................ 36

Introduction 1 Huenges
INTRODUCTION The lectures are prepared based in most parts on the material given by Huenges (2010) and cover basic knowledge about geothermal technology for the utilization of geothermal resources. The lectures should help to understand the basic geology needed for the utilization of geothermal energy and describes the methods to create access to geothermal reservoirs by drilling and the engineering of the reservoir. The technology available to make use of the earth’s heat for direct use, power, and/or chilling, and give the economic and environmental conditions limiting its utilization will be discussed. Special emphasis is given to enhanced or engineered geothermal systems (EGS), which are based on concepts that bring a priori less productive reservoirs to an economic use. The first lecture addresses the characterization of geothermal reservoirs and the implications of their exploration. A best practice for the exploration of EGS reservoirs is still to be determined and the different methods in geology, geophysics, and geochemistry have a strong local character. Some methods are successful in exploring conventional geothermal reservoirs like the magnetotellurics, whereas for EGS, seismic methods become more and more important. An overall conceptual exploration approach integrating the geophysical measurements into a geological model taking into account the earth’s stress conditions is addressed in this lecture, but it has to be further developed in future contributions. The know-how of EGS drilling given in the second lecture, is based on a case study and therefore, somewhat different from hydrocarbon drilling with reference to issues like large diameter holes, deviated wells, and mitigation of formation damage. The latter is also important for drilling conventional geothermal reservoirs, which to a great extent follow standards in operation and completion. The knowledge of underground physical conditions, especially the magnitude and direction of the local stress, is important for reliable drilling into EGS reservoirs. Awareness of the stress conditions is also a prerequisite for starting hydraulic fracturing treatment which is addressed in a following lecture. Techniques and experiences from several EGS sites are described providing a set of methods available for addressing the goal of increasing well productivity. The case study covers several horizons in deep sediments. Significant progress was made in the last few years in recovering enhancing factors in the order of magnitudes. Chances and risks of companion effects of the treatments, such as induced seismicity, are addressed and will be a subject of forthcoming research. The benefits of using geothermal energy technologies for the direct use and conversion of the earth’s heat into chilling or heating power (as required), are presented in the fourth lecture. Technical solutions for all tasks within the goal of energy provision exist, and approaches for improving the performance of system components are given. Special emphasis is given to techniques that can assure reliable and efficient operation at the interface of underground fluids with technical components. Processes like corrosion and scaling have to be addressed and they are still a subject of future research. The economic learning curve is shown in the last lecture. Environmental aspects are discussed, and results of life cycle assessment with illustrations of greenhouse gas emissions are reported. The summary is referring to the findings of the recently published IPCC report on renewable energy (Goldstein et al., 2010) and covers a list of chances and challenges of using geothermal energy. As requested during the lectures, some material is given for policy consultants, in order to give UNU-GTP fellows some arguments within the political discussion in their country. Investments in research are strongly recommended due to the early stage of EGS development. The main tasks for a site developer cover the underground issues. Figure 1 summarizes the work to be done along the different stages required for a successful EGS-project. The knowledge about the

Huenges 2 Introduction
probability of success of the whole project increases with the progress reaching the distinguished steps. Therefore, one main feature of EGS is to be aware to stop the development if the conditions or the result of the feasibility estimation requires it.
FIGURE 1: Stages of the development of a geothermal site with a list of tasks (upper arrow), which
are addressed in the lectures, the decision points (yellow fields with the red arrow as a potential leaving point of the project), and still existing research demand (green fields)

Huenges 3 Reservoir characterization
LECTURE 1
RESERVOIR CHARACTERIZATION AND GEOTHERMAL EXPLORATION
Existing geothermal knowledge is connected to areas of geological plate boundaries, where increased volcanic and earthquake activity is observed and existing power plants can be found in the vicinity of these structures (Figure 2). Figure 2 shows that most of the world’s geothermal fields exploited today are associated with volcanic and/or recent tectonic activity. They have commonly been discovered through surface expressions, such as hot springs. However, some geothermal fields have been found even though there were no obvious surface manifestations. Therefore, exploration efforts today are commonly focused on hidden (or blind) geothermal systems and unconventional low enthalpy resources, which commonly require enhancement in permeability.
FIGURE 2: World map with locations of intense seismic activity (red) and
geothermal power stations (white triangles) The overall goal of geothermal exploration is to find methods for cost effective imaging of reservoir geometry, getting a resolution of small scale features, and to provide a base for geological modeling of the target and its environment. This is crucial to understand the thermal-hydraulic behavior of the system and helps to optimize the borehole location and path of the borehole. This is the prerequisite for minimizing the risk of dry wells. Exploration is done generally, by using exploration wells which were drilled for some other resource, for example, in a sedimentary basin; or by drilling heat flow holes on a regular grid. Other areas are inferred to have a high geothermal potential on the basis of known heat flow data. To explore such areas and reservoirs in more detail and better establish their potential and extent, both geological and geophysical methods are usually applied. Geophysical methods provide the basic information required to determine optimal sites for the utilization of geothermal energy (Bruhn et al., 2010). Major topics to be addressed in geothermal exploration include (1) the general geological structure and lithostratigraphy, (2) information on the

Reservoir characterization 4 Huenges
temperature field, (3) the location of major faults both around the reservoir and at deeper levels, and (4) the distribution of fluids. Seismic methods are highly developed in hydrocarbon exploration and can be adopted to contribute to these items (Bauer et al., 2010). Refraction seismic profiling and tomographic inversion techniques are well suited to determine the velocity structure. Seismic velocities are sensitive to the lithological structure, major faults with reduced velocity, and fluid-bearing horizons. The combination of velocity tomography with preexisting or new seismic reflection data can significantly improve the knowledge of the structure and composition (see for example Figure 3).
FIGURE 3: Velocity and vertical gradient models from tomographic inversion. The location of
well GrSk 3/90 is indicated by the green triangle (Bauer et al., 2010) In the magnetotelluric (MT) method, the earth’s impedance to the natural electromagnetic (EM) wave field is measured to extract information about variations in the resistivity of the subsurface (Bruhn et al., 2010). The method is very commonly used in geothermal exploration. The main advantage to all other electrical methods is its ability to probe depths of several tens of kilometres. In the MT method natural EM waves are used, generated by thunderstorm activity or at lower frequencies by large-scale ionospheric currents created by the interaction between the solar wind and the magnetosphere. The subsurface structure can be studied by making simultaneous measurements of the strength of the magnetic field variations at the surface of the earth and the strength of the electric field component at right angles in the earth. Figure 4 gives an example for measurements performed at the same area as the shown seismic data in Figure 3.
FIGURE 4: Electrical resistivity model obtained from the tear zones inversion of the magnetotelluric
data. Inverted triangles indicate locations of MT stations (Munoz et al., 2010)

Huenges 5 Reservoir characterization
One of the next steps is to integrate geological information from the surrounding boreholes and a joint interpretation of the all geophysical measurements leading to a model as given in Figure 5.
FIGURE 5: Geological model of the Groß Schönebeck area in the North German basin. The model was derived on data from surrounding wells and geophysical investigations;
both existing wells are plotted (Moeck et al 2009)
Temperature and fluid flow are the basic parameters used to describe the recoverable heat in place in a geothermal energy reservoir. Temperature and its gradient with depths cover a wide range of data depending on the geothermal environment. Figure 6 gives some examples for measured temperature profiles in geothermal wells covering gradients between 25 and 100 K/km found in Europe. Temperature profiles may be disturbed by processes such as a climatic signal in the upper part of the profile. Therefore, a consideration of the heat flow density as described with Equation 1 lead to a better characterization of the thermal structure.
FIGURE 6: Temperature vs. depth profiles

Reservoir characterization 6 Huenges
(1)
with qkond conductive part of heat flow in W/m², λ thermal conductivity in W/(mK), Δz thickness of the layer in m and Δϑ temperature gradient in K/m
The thermal conductivity of the rock type is affected by the mineral composition, porosity and/or fractures with the rocks, and the type of fluid in fluid bearing rocks. Values of thermal conductivity of rock should be measured along the profile. For rough estimation of these values there exist data compilations in literature (e.g. Clauser and Huenges, 1995). Intensive borehole investigations are recommended for a reliable characterization of the thermal structure in the underground as shown by Norden and Förster (2006) or as recently published by Fuchs and Förster (2011). A heat flow density map for Europe for the first estimations of the geothermal situation at the interesting region is given in Figure 7. Using the Darcy equation (2), the interested depth section can be hydraulic-cally characterized. The Darcy equation defines the rock property or the fluid pathways within the rock which enables fluid
flow, the so called permeability. The velocity of the fluid increases with the decreasing viscosity of the fluid.
(2)
FIGURE 7: Heat flow density map of Europe (Hurtig et al., 1992)
zqkond Δ
Δ⋅−= ϑλ
z
pkv
ΔΔ⋅−=
η
Huenges 7 Reservoir characterization
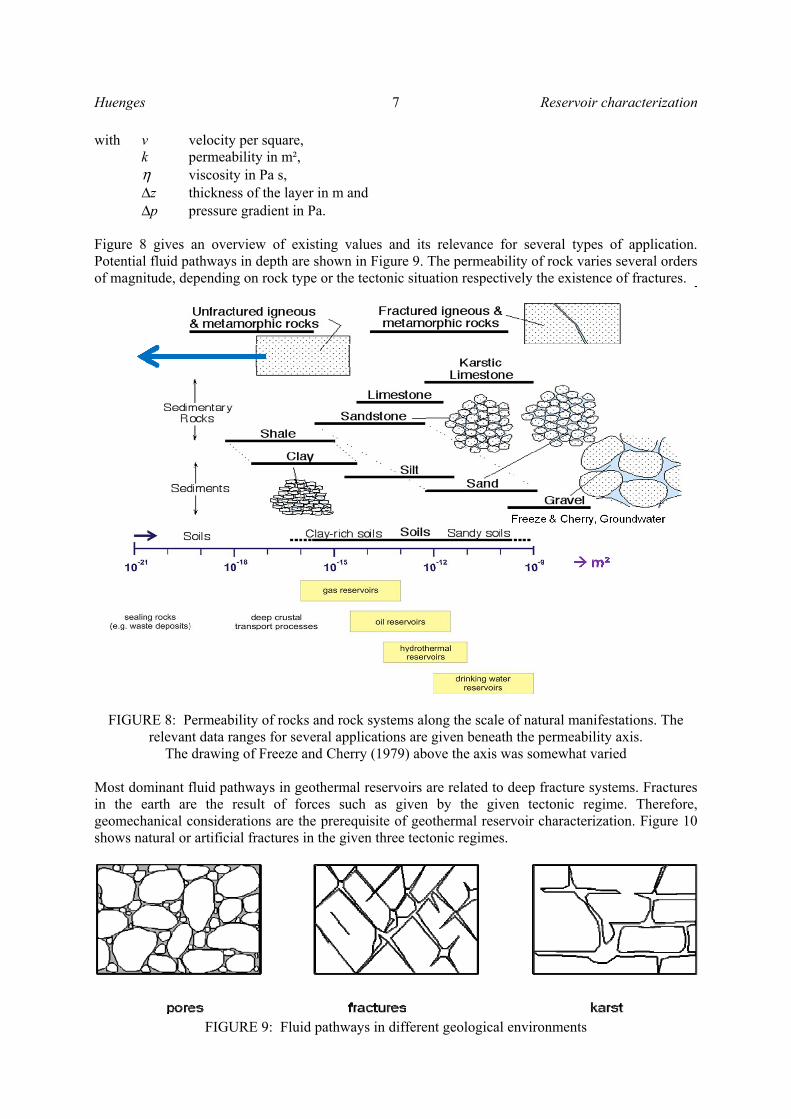
with v velocity per square, k permeability in m², η viscosity in Pa s, Δz thickness of the layer in m and Δp pressure gradient in Pa. Figure 8 gives an overview of existing values and its relevance for several types of application. Potential fluid pathways in depth are shown in Figure 9. The permeability of rock varies several orders of magnitude, depending on rock type or the tectonic situation respectively the existence of fractures.
FIGURE 8: Permeability of rocks and rock systems along the scale of natural manifestations. The relevant data ranges for several applications are given beneath the permeability axis.
The drawing of Freeze and Cherry (1979) above the axis was somewhat varied Most dominant fluid pathways in geothermal reservoirs are related to deep fracture systems. Fractures in the earth are the result of forces such as given by the given tectonic regime. Therefore, geomechanical considerations are the prerequisite of geothermal reservoir characterization. Figure 10 shows natural or artificial fractures in the given three tectonic regimes.
FIGURE 9: Fluid pathways in different geological environments

Reservoir characterization 8 Huenges
FIGURE 10: Geometrical relation between stress axes, stress regimes, and fracture planes. Brown: shear fractures; blue: tensile fractures. Stress regimes from left to right: normal faulting, strike-slip faulting, and reverse faulting. From left to right, orientation of tensile fractures in normal faulting,
strike-slip faulting, and reverse faulting regime. The red drill path is least stable; the green drill path is most stable. In strike-slip regimes, the most stable drill path depends on the stress ratios of SV and SH
(ref. to Inga Moeck in Bruhn et al., 2010) In summary, the exploration goals involve the imaging and characterization of geothermal fields and reservoirs. Methods like structural (field) geology, seismics, seismology, magnetotellurics, other geophysical approaches, temperature determinations, and a number of geochemical methods lead to the geometry and structure of the reservoir, the knowledge about the geomechanics of the system in its stress regime, and the chemistry of the rocks and its bearing fractures and fracture fillings. All this contributes to the basic know how of controlling factors of the system in the natural setting and during its use in a sustainable way. Conventional reservoirs for high enthalpy geothermal energy are located in zones of active volcanism or magmatism while low- to medium enthalpy can be found in various environments. The identification of potential reservoirs for developing an EGS is linked to the coincidence of heat, fluid flow, permeability, and appropriate orientation of the stress field in relation to the permeability network. Among these parameters, only fluid flow and permeability can be enhanced by engineering. These parameters are summarized in Figure 11 which illustrates the variety of reservoirs that can be used for heat extraction and the various uses of the geothermal energy.

Huenges 9 Reservoir characterization
FIGURE 11: Sketch section showing the variety of reservoirs that can be used for heat extraction and the different utilization of the geothermal energy stretched out within the field of temperature vs.
potential production from the field. On the right, three vertical lines scale the temperature of gradients of 100, 50, and 25 °C/km

Geothermal drilling 10 Huenges
LECTURE 2
GEOTHERMAL DRILLING
Drilling is an essential and expensive part of geothermal exploration, development, and utilization. Sperber et al., (2010) brought together the issues to reach the aim of geothermal drilling, which is not only to access the reservoir in the safest way, but also at the lowest cost. Cost reduction of geothermal drilling is therefore a major issue that should be considered for the economic development of geothermal energy. High production rates are required in geothermal wells due to the lower energy content of hot water in comparison with hydro carbons. Therefore, geothermal wells are drilled with larger diameters than HC-wells. They have to reach higher temperatures and fulfil requirements of sometimes eruptive or metamorphic rocks. A special challenge may be given by mineral-bearing, aggressive thermal fluids from the target formation. Preparing the drilling project needs a lot of information and application exchange with the mining authorities. Each country has its own sets of rules to fulfil before starting the drilling. Basics for all are
issues like sufficient financial background, technical competence to perform the project, and the fulfilling of environmental concerns in compliance with safety conditions of the foreseen project. The drilling site is an enclosed surface area of ~ 2,000 m2 for the installation of all the drilling equipment, and storage systems for necessary components. The ground has to be prepared to guarantee an environmentally safe operation without leakage and infiltration of any fluids to the surroundings. A concrete based underground with a foundation has to be prepared for the drill rig set up. Transportation has to be enabled along the neighbourhood roads. At the site, special arrangements have to be made for the mud circulation system with equipment to clean the mud in the mud loop with filters etc. and to organize the disposal of mud components, cement, and rock cuttings. Figure 13 gives an overview of the surface equipment of a drill site, a hoisting system with a drive, a tackle, and a hook to cover the main components to lower and pull the drill string. The rotary table enables the whole drill string and the drill bit to turn. The moment is transferred from the rotary table to the drill string with the Kelly. The mud circulation system is done with pumps, tanks, and the mud entrance. The rig has also the task to safeguard the well against uncontrolled blow out by a blow out preventer.
FIGURE 12: Drill rig INNOVA-RIG of GFZ

Huenges 11 Geothermal drilling
FIGURE 13: Drill rig with main components required at the drill site (Wolff 1999)
The drill string system which is composed starting with the kelly at the surface, drill string and in the bottom hole equipment stabilisers, reamers, drill collars, and jar. In special drilling operations a downhole motor, hydraulically driven by mud circulation, is used. In the case of directional drilling a downhole motor is part of a directional drilling garniture. Drill bits destruct the rocks with several designs like roller cones and diamond bits, and polycrystalline diamond bits (PCD). Their reasonable application depends on the geological settings. The energy needed at the drill site is used for the hoisting system, the mud pumps, the rotary table, and for several further aggregates (e.g. the blow out preventer). The mud has the task to cool the drill bit, to transport the cuttings (drilled solids) in the annulus to the surface by avoiding the settling of cuttings if circulation is stopped. The circulated mud (Figure 14) deposits the cuttings and sets the entranced gases free at surface and reduces friction between the drill string and borehole wall. In the freshly drilled depth sections the mud must stabilise the borehole wall and exert hydraulic pressure via the hydrostatic head of the mud column to prevent gas or fluids from entering the borehole; and the other way around, to prevent mud and filtrate to enter the formation through the borehole wall. As mentioned above the mud has to power downhole motors and to transport information of the formation drilled to surface by gases, cuttings, and fluids. Measuring signals from down hole sensors while drillings are transported by pulses on the mud column.

Geothermal drilling 12 Huenges
FIGURE 14: Mud circulation loop of a drilling site (Wolff, 1999)
The composition of the mud varies with the requirements of the drilling job. Water based muds are composed of sweet water or brine, more or less salt saturated and by demand with additives e.g. marble or barite to increase density, polymers to reduce filtrate and to improve rheology, friction reducer and others. Oil based mud are composed of environmentally friendly oil and several additives such as an emulsifier, weighing material, and polymers. They are mainly used in extremely water-sensitive formations. Foams are needed at a pressure gradient lower than the hydrostatic gradient. They are formed of water, a gas (air, nitrogen) and foaming additives. Air is sometimes used for higher drilling progress and to minimize formation damage, but are not practical in all circumstances (e.g. due to borehole stability reasons). Geological–technical risks cover drilling technical problems during operation that are caused by the reaction of the geological formation to applied drilling technology (Sperber et al, 2010). Problems can arise from unexpected geomechanical behaviour of known or unknown formations or if drilling technology is insufficiently matched to known geological conditions. A modification of drilling parameters – especially mud technology – will commonly solve geological–technical problems. Basically, a rock mechanical understanding and geomechanical modeling will help to identify risk zones and to quantify rock failure under certain circumstances. Figure 15 illustrates probable processes like borehole wall breakouts/cavings/washouts generated by high stress concentrations on the borehole wall or induced by too low mud pressures in weak brittle rock like squeezing or swelling formations such as salt rocks. Creeping is increased by higher temperatures and thick overburden.

Huenges 13 Geothermal drilling
FIGURE 15: Potential geology related drilling problems (Moeck in Sperber et al., 2010). SH and Sh represents the direction of maximum and minimum horizontal stress
Circulation losses with reduced or total absence of fluid can appear e.g. in highly fractured or karstic rocks. This can happen when the bit unexpectedly enters the fault zone. A total circulation loss may cause a catastrophic loss of well control. If geothermal wells of a large diameter are drilled in formations that are prone to lost circulation, or if underbalanced drilling is required, foam drilling might be the most suitable mud technique. Other drilling problems may be raised by key seats, differential sticking, and/or thermally induced stress on the borehole wall and/or casing/cement. Sperber et al., (2010) and other authors give more information on these issues. After finishing a depth section of the borehole especially before entering a new section which requires a different mud weight, casing is required (Figure 16). The annulus between casing and rock wall must be filled and bonded by cement in order to prevent thermal induced elongation while producing thermal water from the deeper part of the hot well. If the casing is not installed up to the surface then this part is called a liner. The casing of each section must fulfil a mechanical strength with respect to formation pressure and other burdens. In the Northeast German Basin, 4000-m-deep Lower Permian sandstones and volcanic rocks have been explored for geothermal energy production near Gross Schönebeck (Huenges and Moeck 2007). The reservoir access strategy consists of re-using a former gas exploration well for logging and hydraulic stimulation campaigns, completing the geothermal doublet system by drilling a second well, and to be ready for following stimulation and testing the new well and installing a thermal water loop using a doublet system, and installing a binary geothermal power plant if sufficient reservoir

Geothermal drilling 14 Huenges
FIGURE 16: Casing completion of a borehole in deep sediments (Huenges and Moeck 2007).
The grey colour indicates the cemented annulus conditions are continued. The experiences gained show that drilling a large hole diameter (23") (see bit in Figure 17) is feasible but challenging especially in clay dominated layers; that directional drilling can be applied as a standard operation; and that a variable mud concept needs to be applied in order to react to unforeseen operational requirements such as formation damage, breakouts, or inflows. In this

Huenges 15 Geothermal drilling
project, technical and scientific challenges were successfully met, and the lessons that were learned provided essential knowledge for developing future drilling strategies in deep sedimentary geothermal systems, especially in the Central European Basin System. The distribution of costs of such a 4 km deep well is given in Figure 18. The graph shows that about half of the cost is for the drill rig and the team incl. services and bit costs, a quarter for cementing and completion, one tenth for mud services and deposits and the rest for logging, coring, and mobilizations.
FIGURE 18: Costs break down of a 4 km deep well into a sedimentary geothermal reservoir
derived from the Groß Schönebeck project Future demand in research and development has to be aimed at the provision of a reliable completion, in solving problems of scaling and corrosion, in ensuring borehole stability, in mitigating formation damage, and in being prepared for high temperature drilling.
FIGURE 17: The 23"-drill bit used in the
Groß Schönebeck well.

Engineering geothermal reservoirs 16 Huenges
LECTURE 3
ENGINEERING GEOTHERMAL RESERVOIRS In many cases, drilling operations will not open up a geothermal reservoir under such conditions that extraction of geothermal energy is economically viable without any further measures. In most conventional areas with artesian conditions the well is tested by opening the borehole valve. In a non-artesian environment, usually the onsite information about productivity is reached by performing a lift test (Figure 19). In case of low productivity, the geothermal wells have to be stimulated in order to increase well productivity. Different stimulation concepts have been applied to enhance the productivity of geothermal wells. Formally, stimulation techniques can be subdivided with respect to their radius of influence. Techniques to improve the near-wellbore region up to a distance of few tens of meters are chemical treatments, and thermal fracturing. The only approved stimulation method with the potential to improve the far field, up to several hundreds of meters away from the borehole, is hydraulic fracturing. An overview is given by Schulte et al., (2010). Chemical stimulations or acid treatment technology from hydrocarbon applications is partially adapted to the geothermal wells, most often to remove the mineral scaling deposited in the wells after several years of exploitation, and also to enhance the fracture network in the reservoir. Thermal stimulation treatments are performed in order to increase the productivity or injectivity of a well by either enhancing the near well permeability, which may have been reduced by drilling operations itself (drill cuttings or mud clogging feed zones), or by opening hydraulic connections to naturally permeable zones, which were not intersected by the well path. This can happen by either the reopening of existing, possibly sealed fractures, or by the creation of new fractures through thermal or additional hydraulic stresses. This technique is promising in high temperature reservoirs by injecting cold water from the surface. Hydraulic fracture stimulations are performed as waterfracs, hydraulic gel-proppant fracs, or a combination of both called hybrid fracs. Common to all these techniques is the injection of large volume of fluids (water or gels) into the target horizon of the well, causing pressure exceeding the rock strength and producing artificial fractures. The procedures are well known in the hydrocarbon industry as well as in the HDR technology. However, the application for geothermal reservoirs requires a technique that is able to produce considerably higher amounts of fluids than the ones required for production of hydrocarbon reservoirs.
FIGURE 19: Sketch of a lift test in a deep borehole.
Due to injected nitrogen into the upper well section, the mean density of the fluid column
is reduced and this drives fluid production from the reservoir

Huenges 17 Engineering geothermal reservoirs
Hydraulic fracturing technology in geothermal reservoirs is still in the trial and error phase and standards for treatments and the required completions of the well such as well heads and frac strings are not yet fixed. The ongoing processes along the artificial fracture have been illustrated by Fokker (2007) (Figure 20). In order to understand processes such as fracture opening, leak off through the fracture surface, and the rock strength at the tip of the fracture, a good knowledge of rock properties is crucial for designing the overall treatment. We still have to bring the single experiences together and to develop a best practice.
FIGURE 20: Top view of a fracture propagation due to hydraulic stimulation (Fokker, 2007) The direction of generated fracture follows the existing stress field (Figure 10). Therefore, it is recommended to clarify the overall setup of the EGSystem before drilling the second well. Directional drilling allows a design within the given options of a parallel or serial orientation of the new fractures to the connection line between both bottom hole positions (Figure 21). The serial option corresponds to the classical HotDryRock approach, where most of the fluid transport takes the pathways of the artificial fracture. There is no relevant permeability in the surrounding rocks. The Soultz-project is an example for this arrangement. The parallel option becomes important in systems with some natural permeability. In this case, the thermal water loop follows the transport paths of the artificial fractures and through the rocks in between. The Groß Schönebeck-project is an example of this arrangement.
FIGURE 21: Conceptual arrangements of bottom hole positions in relation to fracture propagations. Left is a serial arrangement with fractures along the connection line of both wells and right, a parallel
arrangement. Both wells in a thermal loop have in the serial arrangement dominantly artificial pathways whereas in the parallel arrangement, the fluid flow has to pass the rock on natural pathways
The photos in Figure 22 make clear that the operating expenditures required for a hydraulic stimulation treatment as it was done in Groß Schönebeck is enormous. Pumping rates of 150 l/s

Engineering geothermal reservoirs 18 Huenges
against 600 bar can be realised with mobile pumps on tracks. Storage systems for frac-fluids and for proppant material, in this case up to 100 t/treatment are needed and connection lines and valves ensuring that no uncontrolled pressure release happens at the surface. The special treatment design is site dependent and is usually based on expertise about the target sections. In order to get an optimum result from different depth sections in the same well with distinguishable properties it is recommended to treat the sections individually with hydraulic seals in between.
FIGURE 22: Instrumentations at the Groß Schönebeck drill site during the stimulation treatments in GrSk 4/05. From the upper left to the lower right photo: (1) equipment to connect the pipe at the
surface, (2) pumping aggregates to pump 150 l/s against 600 bar, (3) tank volume of more than 1,000 m³, and (4) container to store proppants for the hydraulic proppant frac
The lessons learned applying the waterfrac technique treatment in Groß Schönebeck twice can be summarized as follows: It is recommended that frac fluid water be used – best taken from a shallow
well - with a viscosity of 1 to 10 cP. In order to prevent chemical clogging of the reservoir a pH-value of 5 is a good choice. A small proppant concentration of c = 50 - 200 g/l seems to support the stimulation goals. A fracture length was determined by matching the pressure history using a modelling program which addresses fracture generation. Figure 23
FIGURE 23: Artificial fracture with fracture width wf and fracture length xf generated by the waterfrac technique in a normal faulting or strike-slip faulting tectonic regime (Figure 10)

Huenges 19 Engineering geothermal reservoirs
shows a sketch of the result with the fracture length xf ≤ 250 m and the fracture width wf ~ 1 mm. The costs are significantly lower compared to hydraulic proppant fracs. The application is limited to reservoirs with small permeability. Nevertheless, the success is dependent on the self propping potential of the reservoir rock. Long-term utilisation of a stimulated geothermal reservoir requires sustainable open fractures. Jung (1999) and other authors observed a selfpropping effect occurring in special geological environments (Figure 24), proven by several experiments in Soultz. The irregular roughness of the fracture surface of the granitic rock is responsible for selfpropping after pressure release and setting of the fracture interface after shearing. Other rock types may not show this effect even though they are also sheared. A more regular roughness, like sandstone fracture surfaces have, will have appropriate surface structures after pressure release that closes the fracture. For these rock types artificial proppants are required. That will be reported later.
FIGURE 24: Selfpropping: Existing fracture at (1) initial state within a deviatory stress field with maximum stress magnitude S1 and minimum stress magnitude S2, (2) while injecting water and
increasing the pressure, producing shearing, and seismic emissions, and (3) after pressure release and the self propping by new supporting points as illustrated (Jung 1999)
In this stage we must discuss induced seismicity, which can be caused by water frac treatments or in special cases by the operation of a geothermal plant. Induced seismicity is useful for reservoir characterization as an instrument to image fluid pathways induced by hydraulic stimulation treatments. However, the implication of such treatments to potential seismic hazards has to be controlled. Therefore, a basis understanding of induced seismicity is required. Majer et al., (2007) identified as a mechanism (1) reduction of effective stress on shearing in a deviatory stress field and (2) the volumetric reorganisation in the reservoir. In addition, (3) a thermoelastic strain by temperature-induced friction at a fracture face or chemical alteration on the fracture face may play a role and have an influence on the friction. The size of an earthquake generally depends on how much slip occurs along the fault, how much stress there is on the fault before slipping, how fast it fails, and over how large an area the failure occurs (Brune and Thatcher 2002). This indicates, that the occurrence of induced seismic events to a great deal depends on local conditions, namely, and most importantly, the magnitude and orientation of the

Engineering geothermal reservoirs 20 Huenges
local stress field and the extent and orientation of local faults and fractures in relation to this local stress field. The actual ground motion, on the other hand, which might be induced by a seismic event of a certain magnitude, not only depends on the source distance, but also on the local soil conditions. Concerning any potential structural damage, it is important to notice, that within the frame of a probabilistic seismic hazard analysis for engineering purposes, it is common practice to specify a lower bound with a magnitude of 5.0, on the basis that smaller events are not likely to be of engineering significance (Bommer et al., 2001). Humans, nevertheless, can feel seismic events of lower magnitude. According to the modified Mercalli intensity scale, most people indoors can feel the ground shaking caused by a seismic event with a magnitude of 3. A few people might even feel the movement caused by magnitude 2 events. These felt vibrations, though not causing any structural damage, may give rise to disturbance or distress to the people living close to the source location. Complaints and protests may result, which can ultimately have the potential to jeopardize the entire project. The latter happened with the project in Basel (Häring et al., 2008). A seismic event with a magnitude of 3.4 caused huge complains resulting in a stop of the project. Nevertheless the treatment was successful from the point of imaging the reservoir. Figure 25 (left) shows the textbook like arrangement of relocated seismic events in the granitic underground after stimulation treatment. The pumping rates have been much lower than performed at the waterfrac treatment in Groß Schönebeck, where 150 l/s were used. There, as shown in Figure 25 (right), a seismic event with a maximum magnitude of -1, that is more than 4 orders of magnitude lower than the Basel case, was observed, which could only be measured with an instrument close to the target section in the second well. The reason for the low magnitude should be related to rock type: the volcanic rocks, in which the fracture was generated. The rocks which transport the signal, sandstone, clays, and evaporates, may have also an influence on the measured magnitude. Nevertheless, in spite of this low magnitude, Kwiatec et al., (2010) could relocate the events and the imaged structures fit with prior recovered findings of a vertical fracture in the direction of the maximum horizontal stress (Moeck et al., 2009).
FIGURE 25: (left): Top view to the geothermal test site at Basel with relocated seismic events (Häring et al., 2008) and (right): Relocated seismic events at Groß Schönebeck
after the waterfrac treatment (Kwiatec et al., 2010)

Huenges 21 Engineering geothermal reservoirs
The lessons learnt applying the hydraulic proppant frac technique treatment in Groß Schönebeck several times can be summarized as follows: As frac fluid, a gel with a viscosity of 100 - 1000 cP is recommended. The gel, a cross linked polymer, must have the property to change its high viscosity into transportable conditions in the reservoir after some time. The temperature of the reservoir or injected acids, usually accelerate the destruction of the cross linked polymer. For a sustainable fracture width, a proppant concentration of 200 - 2000 g/l is needed. A fracture length was determined by matching the pressure history using a modelling program which addresses fracture generation. Figure 26 shows a sketch of the result with the fracture length xf = 50 - 150 m and the fracture width wf = 5 - 25 mm. The cost of a hydraulic proppant frac is significantly higher compared to a hydraulic proppant frac. The treatment can be applied in a wide range of formations (permeabilities). A good control of stimulation parameters can be given. A wellbore skin, which may be generated by formation damage during the drilling by infiltrating mud, cutting, etc. can be bypassed. Seismic events could not be monitored with surface monitoring systems. No seismic recorders were installed downhole during the hydraulic proppant frac treatment in Groß Schönebeck. Testing the result of the treatments is done in a non- artesian environment with lift tests as described in the beginning of this chapter. The recovered fluids, starting with a mixture of frac fluids and natural fluids, may not be conducted into the discharge system. Therefore, highly expensive disposal is required. The Groß Schönebeck case study showed an improvement of the initial productivity of 2.4 m³/(h MPa) to a value of 13 - 15 m³/(h MPa) resulting in a factor of about 6. The installation of a down hole pump is required for controlling the long-term behaviour of the EGS. The installation requires the operation of a drill rig to hoist the weights and organize a reliable anchoring of the pump. Figure 27 shows a pump solution with the motor down hole. Another solution uses shaft pumps with the motor at the surface. The advantage is an easier maintenance of the motor. The disadvantage is to keep the shaft from the
FIGURE 26: Artificial fracture generated by the hydraulic proppant frac technique with fracture width wf and fracture length xf in a
normal faulting or strike-slip faulting tectonic regime (Figure 10)
FIGURE 27: Downhole pump

Engineering geothermal reservoirs 22 Huenges
surface to the pump reliable with low friction, the latter demands lubrication. In any case, the shaft pump is restricted to shallow installation of a few hundreds of meters in maximum. The circulation can start now. In the nonartesian case pumping with the down hole pump, the production borehole thermal water is pumped from the reservoir to the surface, leading through the surface equipment, such as a heat exchanger, and re-injecting the cooled fluid into the second well. At this point, a detailed knowledge of the physico-chemistry of the fluids is crucial (Regenspurg et al., 2010). Processes like corrosion, precipitation, and generation of gas phases may occur as shown in Figure 28.
FIGURE 28: Probable processes during the circulation of thermal water
Figure 29 gives an example of carbonate scaling after a period of operation in a thermal water loop. General solutions do not exist for every site. Some may be standard, like preventing the entrance of oxygen into the system by nitrogen control. Others need site specific know how. Therefore, detailed studies of the transported fluids for the sites are essential.
FIGURE 29: Carbonat scaling after some time
of utilisation at a geothermal site

Huenges 23 Energetic use of geothermal reservoirs
LECTURE 4
ENERGETIC USE OF GEOTHERMAL RESERVOIRS The thermal water loop carries the geothermal heat from the production well to a heat exchanger. The heat from the fluid is extracted and the cooled fluid is re-injected into the reservoir in an injection well (Figure 30). Extracted heat can be used to heat, power, or chill (Figure 31). Different technical aspects and constraints which are related to such plants are the subject of this lecture. Typical EGS applications use formation water as the heat carrier, in a temperature range between 100 to about 200°C. More information is given by Saadat et al., (2010).
FIGURE 30: Principle for energetic use of EGS reservoirs showing a well doublet, the geothermal fluid loop and a heat exchanger on the surface (Saadat et al., 2010)
The heat exchanger is designed following Equation (3), a significant construc-tion parameter is the size of interface area. Another relevant parameter is the heat transfer coefficient. The equation uses a logarithmic middle temperature difference which depends on several parameters which are addressed in textbooks.
FIGURE 31: Energy provision options for heat source temperature between
20 and 200°C. (Saadat et al., 2010)

Energetic use of geothermal reservoirs 24 Huenges
(3)
with Q heat transfer in W, k heat transfer coefficient in W/(m²K), F area in m², and ϑM logarithmic middle temperature difference in K. ϑM is defined as: with ΔϑE temperature difference at entrance of heat exchanger, and ΔϑA temperature difference at exit of heat exchanger. Heat exchanger solutions are given in Figure 32. Both realisations have pros and cons in geothermal application. Plate heat exchangers can reach a low temperature difference at interface in a compact design, the surface pattern of the plates can be designed with respect to distinguished flow of fluids and fine particles, and the maintenance and exchange of single plates is very easy. It is important to note that the footprint of the equipment may play an important role in the overall design. Therefore, low volume within the equipment is beneficial.
FIGURE 32: Illustration of (left) a plate heat exchanger and (right) a shell-and-tube heat exchanger
(www.gea-phe.com and www.vahterus.com) Heat supply from deep geothermal reservoirs especially for space heating in houses is related to the costs of the source and the amount of available energy economically viable using district heating systems. Unutilized geothermal capacity as shown in Figure 33 reduces the economics of the plant due to the high amount of unused investment that elongates the return on investment. Therefore, it is recommend to foresee a peak load system heated by other sources in the district heating system to get a better year round characteristic (Figure 34). Alternatively, the EGS capacity can be designed to fulfil the maximum demand of heat and to add a geothermal power plant using unutilized geothermal capacity. This design of a co-generation geothermal plant requires the temperature to drive the conversion machine as described later.
)/(ln AE
AEM ϑϑ
ϑϑϑΔΔ
Δ−Δ=Δ
MFkQ ϑΔ=

Huenges 25 Energetic use of geothermal reservoirs
FIGURE 33: Sorted annual heat load duration curves and (left) fulfilled by 100 % geothermal heat and (right) by geothermal heat plus peak load system
FIGURE 34: Scheme of a well doublet with backup/peak-load system feeding a district heating grid Most EGS plants provide heat with temperatures below 200°C. Their lower temperatures in comparison to heat from high enthalpy fields require binary cycle systems such as Organic Rankine Cycles as shown in Figure 35 to convert the heat into electrical power. The thermal water loop is used to preheat and evaporate the working fluid until it becomes saturated vapour. This is possible because ORC working fluids boil at lower temperatures in comparison to water and its recovered energy enables the working fluid to drive the turbine and to produce mechanical energy and electrical power at the generator. The condensed working fluid is led by a feed pump to the pre-heater. Heat transfer within the evaporator and the evaporation of the working fluid is only possible at a constant temperature due to its thermodynamic characteristic. The efficiency of the heat transfer depends on the closeness of the cooling curve of the thermal water and the heating curve of the working fluid. Therefore, these systems with the constant temperature characteristic as illustrated in Figure 36 (left) are less efficient than solutions shown in the same figure on the right side. The latter requires more technical components. The Kalina cycle also provides a solution, but using multiphase working fluids. The heat transfer induces a desorption and an absorption process with a better heat transfer characteristic as given in Figure 37.

Energetic use of geothermal reservoirs 26 Huenges
FIGURE 35: Schematic setup of an Organic Rankine cycle (ORC) (Saadat et al., 2010)
FIGURE 36: Example of a temperature-heat transfer-diagram for a single-stage and a three-stage ORC
FIGURE 37: Example of a temperature-heat transfer-diagram for a Kalina cycle The Kalina cycle is a binary cycle in which a water-ammonia mixture is used as a zeotropic working fluid. Besides the use of a zeotropic mixture, the setup of a Kalina cycle is characterized by the use of

Huenges 27 Energetic use of geothermal reservoirs
a desorber and absorber which replace the evaporator and the condenser, respectively, briefly described here and illustrated in Figure 38.
FIGURE 38: Schematic setup of a Kalina cycle (Saadat et al., 2010) In the desorber, the heated working fluid is separated in an ammonia-rich vapour and an ammonia-poor dissolution, which increases the usable enthalpy difference in the turbine compared to the use of a vapour-mix in the turbine. The ammonia-poor fluid is used to preheat the working fluid mixture in an internal heat exchanger. The cooled ammonia-poor fluid and the ammonia-rich exhaust vapour are mixed and the released absorption heat is used for internal preheating of the working fluid mixture. The full absorption is realized in the absorber, where the heat is transferred to a cooling medium. The working fluid has to be enabled to reabsorb the geothermal heat after its use in the turbine, the exhaust vapour at the outlet of the turbine must be condensed. Therefore, a suitable heat sink is necessary. Figure 39 shows three solutions. (1) In power plant engineering, surface water, water from groundwater wells or ambient air is used as the heat sink. In conventional power plant engineering, water cooling is usually preferred to air cooling due to the possibility of realizing lower condensation temperatures and therefore, a larger enthalpy difference in the turbine. (2) Recooling systems with wet-cooling towers transfer the waste heat from the conversion process to the air by evaporation and convection. The condenser is thereby fed with water coming from the wet-cooling tower. The used and heated cooling water is re-circulated. (3) In air cooling or dry cooling systems, a cooling medium (water or refrigeration substances) or the working fluid of the binary cycle is circulated through coils and tubes which are cooled by the passing air, typically in cross-flow.
FIGURE 39: Chiller solutions for condensing purposes in the conversion plant (taken from Saadat et al., 2010)

Energetic use of geothermal reservoirs 28 Huenges
Besides the provision of heat for space heating or industrial processes, geothermal energy can also be used for the provision of low temperature heat needed for refrigeration. The heat-driven absorption refrigeration cycle applied in absorption refrigeration systems is the most applicable for this purpose as shown in Figure 40. A mixture consisting of a refrigerant and an absorbent is used as working fluid and consists of an evaporator, a condenser, a generator, an absorber, a solution heat exchanger, a solution pump, and throttling valves. Similar to most refrigeration cycles, absorption refrigeration is based on evaporating the refrigerant at low temperature and pressure, compressing the vapour and condensing it at a higher temperature and pressure level. During evaporation, the refrigerant absorbs the heat from the heat source that has to be chilled. During condensation, this heat is transferred to a heat sink at a higher temperature level, such as a water- or air-driven re-cooling system. The evaporator, i.e. the chiller, condenser, and throttling valve are similar to the ones used in vapour-compression-refrigeration systems. Due to the use of a mixture instead of a pure fluid as working fluid, the absorption refrigerator contains a thermal instead of mechanical compressor. Such a thermal compressor is composed of three main elements: an absorber, a solution pump, and the generator or desorber which can be driven by geothermal heat, e.g. between 80 and 120 °C. In order to obtain a higher efficiency, a solution heat exchanger is used for energy recuperation.
FIGURE 40: Principle of an absorption refrigeration cycle (Saadat et al., 2010) The coefficient of performance COP is calculated using the ratio of chilling energy Qch to heating energy Qh e.g. from geothermal source + power at the solution pump Wp) in Equation (4):
COP = Qch / (Qh+ Wp) (4) The COP increases with the temperature of the heat source. A typical value is 1,2 for a 120°C source providing a 9°C chilling temperature. The required electrical power is low in comparison to the geothermal heat input. The most widely used fluid combinations are ammonia–water and lithium bromide–water. Ammonia–water is appropriate for cooling and freezing to temperatures below 0°C. The lithium bromide–water combination is used for air conditioning and chilling applications with temperatures above 4°C, due to the crystallization of water. Other fluid mixtures that are currently the subject of research include water–lithium, bromide–lithium, iodide–lithium, and nitrate–lithium mixtures, chloride solution, or ammonia–water–sodium hydroxide.

Huenges 29 Economic and environmental issues
LECTURE 5
ECONOMICS AND ENVIRONMENTAL ISSUES The planning of EGS projects and especially the decision to realize a project requires the estimation of the costs and revenues, which are related to a project, as described by Frick et al., (2010). Since EGS projects are characterized by a long planning period, large initial investments, and a long technical lifetime, estimating prospective costs and revenues involves uncertainties and risks. This is true because no reliable statements on market development, detailed geologic site conditions, or technological problems can be made at the beginning of a project. In order to minimize existing risks, cost influences must be known and risks must be analyzed. In order to realize comparable economic data it is common practice to introduce Levelized Cost of Energy (LCOE). The LCOE is calculated based on the total costs throughout the overall economic lifetime of a plant related to the provided energy, and includes the cost:
• of capital related to the investments; • of operation such as for service and personnel; • for consumables such as for supplies and auxiliary power; • for others such as for insurance and taxes; and • revenues for by-products such as heat in case of power and heat supply.
The total costs of an EGS project are dominated by the investments at the beginning of the project. These investments mainly consist of costs for:
• reservoir exploration; • well drilling and completion; • reservoir engineering measures; • installation of the geothermal fluid loop; and • construction of the plant on the surface for power and/or heat provision.
Further investments can include exploration measures, project planning, risk insurances, or replacement purchases during the operational phase. Drilling in the frame of a geothermal project usually causes the highest contributions to the costs. Depending on the site and well design, the composition and the total number of boreholes, costs can significantly vary such as shown in Figure 41. The borehole costs thereby increase
FIGURE 41: Development of well costs versus well depth for the example of different sites at varying geological conditions and borehole designs and typical allocations of well costs at a depth
of 3000 and 5000 m (based on Legarth, 2003)

Economic and environmental issues 30 Huenges
proportionally with the depth. This is mainly related to the decreasing drilling progress with larger depth. The costs increase nearly linearly with increasing time, whereas the drilling progress decreases with larger depths because, particularly, the round trip times increase. The costs for a binary power unit are generally related to the installed capacity, whereby the specific investments decrease with larger capacity due to economy of scale (Figure 42). The main cost factors of a binary plant are the turbine and generator unit, the heat exchangers, and the cooling unit. With regard to EGS projects, the influence of the geothermal fluid temperature and site-specific conditions, which determine the mode of the installed cooling system (water or air cooling), are additional important factors. For installing the same capacity at a site with a low geothermal fluid temperature, for example, will be more expensive due to the larger heat exchange area which is required compared to a site with higher geothermal fluid temperature. Referring to the installation of the cooling system at a specific site, the realization of air cooling is in many cases more expensive than using wet-cooling towers. Furthermore, the complexity of the power conversion cycle (e.g., basic Rankine cycle, Rankine cycle with two pressure levels or Rankine cycle with working fluid mixture) influence the cost. The characteristics of the geothermal fluid need to be considered for determining the material and layout of the respective heat exchangers. According to Köhler 2005, the specific binary plant investment is approximately between 1400 and 2300 Euro/kW for an installed capacity in the range from 500 to 2000 kW. Feasibility estimations based on increasing knowledge during a geothermal project accompany the whole procedure as described in Figure 1. Therefore, uncertainties in a project’s technical and cost specifications also result in uncertainties when estimating LCOE at the beginning of a project as described in detail by Frick et al., (2010). If, as a result of technical uncertainty (e.g., a lower than expected flow rate), LCOE is higher than expected, it is to be considered a risk. However, positive consequences of uncertainty are also observed through a lower LCOE, for example, when the temperature and flow rate is higher than expected. For an economic performance assessment of projects prior to the exploration activity and decision making, the LCOE is usually not convenient. Figure 1 shows that a project may be aborted at an early stage, at certain costs, without having delivered any power or heat. In order to take this effect into account the net present value (NPV) is generally preferred to be used over LCOE in decision making. NPV is defined as the total present value of a series of outgoing and incoming cash flows related to a project. It is a standard method for using the time value of money to appraise long-term projects. Used for capital budgeting, and widely throughout economics, it measures the excess or shortfall of cash flows, in present value terms. To calculate NPV, all cash flows are discounted back to its present value and are summed into the cumulative discounted cash flow (CDF). Assuming that all capital investments are converted in a series of constant annual payments for a realized project, the NPV equals the CDF at the end of the project for t = T. Figure 43 gives an
FIGURE 42: Range of specific binary plant cost (Köhler, 2005)

Huenges 31 Economic and environmental issues
example of the calculation of cash flow and the NPV for an EGS project during its E&P lifetime. From Figure 43 it can also be seen that the NPV of a project which is aborted before it reaches the production stage turns out to be negative.
FIGURE 43: Cash flow calculation and net present value of an EGS project (Frick et al., 2010) For financial risk analysis and decision making, different instruments, which are based on the calculation of the NPV of a project, are used with the general aim to lower the financial risk, and at the same time, increase the expected return. Integrating instruments, such as probabilistic models, sensitivity analysis, decision trees, and portfolio analysis, in the project development, risk mitigating actions, and their staging in the project execution can be optimized and associated decision tollgates and project milestones can be implemented effectively. Environmental issues require a consideration of the impact of the energy provision along the whole lifetime of the specific plant from the first construction to setting the site into the natural conditions after finishing the production. The life cycle assessment (LCA) methodology is based on the fact that the environmental impacts of a product (such as the power generation from geothermal energy) are not limited to the production process itself (i.e., the power plant process). Substantial environmental impacts may also occur within the pre-chains such as the production and transportation of material needed for the production of the analyzed product (i.e., diesel fuel for running the drilling rig, steel for the completion of the well) (Figure 44). Therefore, within an LCA the overall life cycle of a product is investigated from ‘‘cradle to grave.’’ For EGS plants, this is true for all environmental impacts directly and indirectly related to the construction, operation, and deconstruction of the plant.

Economic and environmental issues 32 Huenges
FIGURE 44: Typical scheme of an inventory analysis within
a Life Cycle Assessment (Frick et al., 2010) Figure 45 shows the resulting CO2-emissions of such an assessment based on typical EGS projects in comparison to emissions from other energy carriers. The data show that substituting coal fired electricity power production by EGS implies a reduction of CO2 of more than one order of magnitude specific energy production, that is CO2/kWh. Other environmental issues are addressed by Frick et al., 2010 and other authors.
Figure 45: CO2-emissions due to electrical power production from different energy carriers as given. Coal, oil, and gas data are published by DOE. Geothermal (Bloomfield et al. 2003) plant emissions
with a mean value in US including open systems with natural CO2-release while production. EGS data (Frick et al., 2010) are based on LCA from closed cycles using the methodology given in Figure 44

Huenges 33 Chances and challenges
CHANCES AND CHALLENGES OF GEOTHERMAL APPLICATIONS
The recently published IPCC Special Report on Renewable Energy Sources and Climate Change Mitigation (Edenhofer et al., 2011) showed that geothermal energy has a huge not yet developed potential for sustainable provision for heat or electrical power (Figure 46). The authors of the geothermal chapter (Goldstein et al., 2011) indicate that a significant geothermal contribution in the future is possible with sufficient technological development.
FIGURE 46: Global technical potential of renewable energy carriers which can be provided per year. The global demand of electricity and heat is given in the diagram (Edenhofer et al., 2011)
Geothermal energy can be provided as a decentralized usable local energy carrier which is available independent of daytime and weather. Therefore, it can be used as a base load energy supply. Figure 45 shows that geothermal energy is a CO2-poor heat and power provider. 1 kWhelektr. auxiliary energy in the down hole pump (Figure 30) can provide about 10..50....1000 kWhtherm., i.e. a coefficient of performance COP of 10..50....1000. The factor depends on the hydraulic resistivity within the reservoir. Comparable other solutions such as air driven heat pump systems are combined with a COP of not much more than 2. Underground coupled heat pump systems have a COP in the order of 4 to 5. The aforementioned Groß Schönebeck site has a COP between 10 and 100, whereas a site with high permeable karstic rocks, such as Unterhaching, has a COP between 100 and 1000. Sites with artesian conditions may have still higher COPs. Geothermal energy can be combined with other base load or variable energy carriers such as biomass, coal, solar-thermal, wind, and others. It is appropriate to combine huge amounts of low temperature heat from geothermal with another source of higher temperature by geothermally preheating the interesting process and improving its efficiency. Induced seismicity IS and other environmental risks are an issue in geothermal energy. IS e.g. is used to image an artificially created reservoir (Figure 25), but IS has to be considered with its potentially induced seismicity hazard. Geoscientific and geotechnical based information on potential processes are required in order to get the knowledge of environmental issues about vulnerability, that is probability times potential damage. There exist a task to have adequate tools and methodologies for ensuring that no dangerous events will occur. This requires a new scientific analysis and

Chances and challenges 34 Huenges
understanding, which is to put it into layman's terms that everyone can understand and integrated into a communication strategy. So, public acceptance of EGS can be gained in more populated areas including that the total process of construction and operation of a geothermal plant is comprehensible for everyone. It is advisable to get the public involved with and directly benefiting from the project. Regulations can contribute to mitigate environmental impacts by geo-scientific based boundary conditions for operations and treatments (e.g. if necessary limiting the flow rates of injection, traffic light concepts). In any way, reasonable monitoring instrumentation while treatments and operation is a prerequisite for geothermal development. Other risks are more or less financing risk in advance such as (1) mining risk, because we enter into terra incognita beneath the drill bit, and the (2) technical risk while drilling. Sufficient financial resources and extended geoscientific and geotechnical based information on potential processes but also a free exchange of experiences of all geothermal actors in the area is crucial. Another challenge especially by conducting a thermal water loop from a reservoir with hostile properties is the reliability of the system component during operation such as scaling or corrosion (Figure 28). Overall, it can be concluded that the EGS learning curve is still in the starting phase. Investing in research and development is the base for its acceleration (Figure 47).
FIGURE 47: Potential development of the installed capacity and levelized cost of energy for EGS plants over time for different scenarios indicating the influence of research and development
The policy instruments for a deployment strategy for EGS have to include support for research, to offer incentives, and to improve frame conditions for the market. In the demonstration phase of EGS in a new environment, additional public funding is required, if EGS is to be an energy priority. The reduction of administrative, economic and legal barriers and the improvement of clarity in understanding geothermal including dissemination and information on reliable and efficient

Huenges 35 Chances and challenges
geothermal technologies should be part of the program. Skilled companies and well-trained engineers must be locally available, best supported by specific programs including international synergies. There is a correlation between local availability and awareness of service companies, and technology uptake. Policies set to drive the uptake of geothermal energy work better if local demand and risk factors are taken into account. A guaranteed price for geothermal energy with feed in tariffs, which has been successfully applied in Germany and other countries, result in a significant increase of installations and is an instrument for a market penetration strategy. Geothermal energy, with its chances and risks, has a huge potential to provide sustainably CO2-poor, base load, locally available power and heat. And with sufficient investment in research, geothermal energy can be made possible almost everywhere. That is a vision!

Literature 36 Huenges
LITERATURE
Bauer, K.; Moeck, I.; Norden, B.; Schulze, A.; Weber, M.; and Wirth, H. 2010: Tomographic P-wave velocity and vertical velocity gradient structure across the geothermal site Gross Schoenebeck (NE German Basin): Relationship to lithology, salt tectonics, and thermal structure. Journal of Geophysical Research, 115, B08312. Bloomfield K., Moore J.N., and R. M. Neilson 2003: CO2 emissions from geothermal energy facilities are insignificant compared to power plants burning fossil fuels. Climate Change Research, 77-79. Bommer, J.J., Georgallides, G., and Tromans, I.J. 2001: Is there a near-field for small to moderate magnitude earthquakes? Journal of Earthquake Engineering, 5-3, 395–423. Bruhn D., A. Manzella, F. Vuataz, J. Faulds, I. Moeck, and K. Erbas 2010: Exploration methods; Huenges, E. (ed.): Geothermal energy systems: exploration, development and utilization. Wiley-VCH, Berlin, 37-111. Brune, J. and Thatcher, W. 2002: International handbook of earthquake and engineering seismology, Vol. 81A, International Association of Seismology and Physics of Earth’s Interior, Committee on Education, 569–588. Clauser, C.; Huenges, E. 1995: Thermal conductivity of rocks and minerals. - In: Ahrens, T.J. (ed.), Rock physics & phase relations: a handbook of physical constants. American Geophysical Union, 105-126. Edenhofer O., R. Pichs-Madruga, Y. Sokona, K. Seyboth, P. Matschoss, S. Kadner, T. Zwickel, P. Eickemeier, G. Hansen, S. Schlömer, and C. von Stechow (eds.) 2011: IPCC special report on renewable energy sources and climate change mitigation. Cambridge University Press, Cambridge, United Kingdom and New York, NY, USA. Fokker P. 2007: Hydraulic fracturing in the hydrocarbon industry. Kohl T., Huenges E., and Thorhallsson S. (eds.), Stimulation of reservoirs and induced seismicity. ENGINE-Workshop 3, 27-32. Freeze & Cherry, 1979: Groundwater. ISBN-10: 0133653129. Frick, S.; Kaltschmitt, M.; and Schröder, G. 2010: Life cycle assessment of geothermal binary power plants using enhanced low-temperature reservoirs. Energy, 35-5, 2281-2294. Fuchs, S., and Förster, A. 2011: Rock thermal conductivity of Mesozoic geothermal aquifers in the Northeast German Basin. Geochemistry 70-S3, 13-22. Goldstein, B., G. Hiriart, R. Bertani, C. Bromley, L. Gutiérrez-Negrín, E. Huenges, H. Muraoka, A. Ragnarsson, J. Tester, and V. Zui, 2011: Geothermal energy. In O. Edenhofer, R. Pichs-Madruga, Y. Sokona, K. Seyboth, P. Matschoss, S. Kadner, T. Zwickel, P. Eickemeier, G. Hansen, S. Schlömer, C. von Stechow (eds.), IPCC Special Report on Renewable Energy Sources and Climate Change Mitigation. Cambridge University Press, Cambridge, United Kingdom and New York, NY, USA. Häring, M. O., Schanz, U., Ladner, F., and B. C. Dyer 2008: Characterisation of the Basel 1 enhanced geothermal system. Geothermics, 37-5, 469-495, Huenges, E. (ed.) 2010: Geothermal energy systems: exploration, development and utilization. Wiley-VCH, 1-463.

Huenges 37 Literature
Huenges E., K. Erbas, M. Jaya, and A. Saadat 2011: Conception for deployment of small scale binary power plants in remote geothermal areas of Indonesia. Proceedings, 36th Workshop on Geothermal Reservoir Engineering Stanford University, Stanford, California, 2011. Huenges, E., K. Erbas, I. Moeck, G. Blöcher, W. Brandt, T. Schulte, A. Saadat, G. Kwiatek, and G. Zimmermann 2009). The EGS project Groß Schönebeck – Current status of the large scale research project in Germany. Geothermal Resources Council, Transactions, 39, 403-408. Huenges, E.; and Moeck, I. 2007: Directional drilling and stimulation of a deep sedimentary geothermal reservoir. Scientific Drilling, 5, 47-49. Hurtig E., V. Cermak, R. Haenel, and V. Zui 1992: Geothermal atlas of Europe. Hermann Haack Verlagsgesellschaft mbH. Jung, R. 1999: Erschließung Permeabler Risszonen f¨ur die Gewinnung Geothermischer Energie aus Heißen Tiefengesteinen. Final report, project 0326690A funded by the German Ministry for Education and Research (BMBF), 82 pp. Köhler, S. 2005: Geothermisch angetriebene Dampfkraftprozesse–Analyse und Vergleich binärer Kraftwerke. Technische Universität Berlin, PhD thesis. Kranz S.; Saadat, A.; Frick, S.; Francke, H.; and Thorade, M. 2010: Forschungskraftwerk Groß Schönebeck - Anlagenkonzept und Forschungsziele. Tagungsband, Der Geothermiekongress 2010, Karlsruhe (17.-19.11.2010). Kwiatek, G.; Bohnhoff, M.; Dresen, G.; Schulze, A.; Schulte, T.; Zimmermann, G.; and Huenges, E. 2010: Microseismicity induced during fluid-injection: A case study from the geothermal site at Groß Schönebeck, North German Basin. Acta Geophysica, 58-6, 995-1020. Legarth, B. 2003: Erschließung sedimentärer Speichergesteine für eine geothermische Stromerzeugung. Technische Universität Berlin, PhD thesis. Majer, E.L., Baria, R., Stark, M., Oates, S., Bommer, J., Smith, B., and Asanuama, H. 2007: Induced seismicity associated with enhanced geothermal systems. Geothermics, 36, 185–222. Moeck, I.; Kwiatek, G.; and Zimmermann, G. 2009: Slip tendency analysis, fault reactivation potential and induced seismicity in a deep geothermal reservoir. Journal of Structural Geology, 31-10, 1174-1182. Muñoz, G.; Bauer, K.; Moeck, I.; Schulze, A.; and Ritter, O. 2010: Exploring the Groß Schönebeck (Germany) geothermal site using a statistical joint interpretation of magnetotelluric and seismic tomography models. Geothermics, 39-1, 35-45. Norden, B., and Förster, A. 2006: Thermal conductivity and radiogenic heat production of sedimentary and magmatic rocks in the Northeast German Basin. AAPG Bulletin, 90-6, 939-962. Regenspurg, S.; Wiersberg, T.; Brandt, W.; Huenges, E.; Saadat, A.; Schmidt, K.; and Zimmermann, G. 2010: Geochemical properties of saline geothermal fluids from the in-situ geothermal laboratory Groß Schönebeck (Germany). Geochemistry, 70, Suppl. 3, 3-12. Saadat, A., S. Frick, S. Kranz, and and S. Regenspurg 2010: Energy use of EGS reservoirs. In: E. Huenges (ed.), Geothermal energy systems: exploration, development and utilization. Wiley-VCH, Berlin, 303-372.

Literature 38 Huenges
Schulte T., G. Zimmermann, F. Vuataz, F. Portier, T. Tischner, R. Junker, R. Jatho, and E. Huenges 2010: Enhancing geothermal reservoirs; Huenges, E. (ed.) (2010): Geothermal energy systems: exploration, development and utilization. Wiley-VCH, Berlin, 173-241 Sperber A., I. Moeck, and W. Brandt 2010: Drilling into geothermal reservoirs; Huenges, E. (Ed.) Geothermal energy systems: exploration, development and utilization. Wiley-VCH, Berlin, 113-171. Wolff H. 1999: Nutzung der Energie des tiefen Untergrundes – Herstellen der Fördersonden. In: Kaltschmitt M., Huenges, E. and Wolff, H. (eds.) Energie aus Erdwärme, Deutscher Verlag für Grundstoffindustrie, 109-128. Zimmermann, G.; Blöcher, G.; Reinicke, A.; and Brandt, W. 2011: Rock specific hydraulic fracturing and matrix acidizing to enhance a geothermal system - Concepts and field results. Tectonophysics, 503, 1-2, 146-154. Zimmermann, G.; Moeck, I.; and Blöcher, G. 2010: Cyclic waterfrac stimulation to develop an enhanced geothermal system (EGS): Conceptual design and experimental results. Geothermics, 39-1, 59-69.