Geothermal Study - Charles County, Maryland
293
January 2012 RFP 11-08 Community Geothermal Energy Study, Charles County, Maryland FINAL REPORT Report Number: 10-1151-0408 Distribution: 10 copies: Charles County Government 2 copies: Golder Associates Ltd., Mississauga Submitted to: Charles County Government Department of Planning & Growth Management 200 Baltimore Street, P.O. Box 2160, La Plata, MD 20646
Transcript of Geothermal Study - Charles County, Maryland

January 2012
RFP 11-08
Community Geothermal Energy Study, Charles County, Maryland
FINA
L RE
PORT
Report Number: 10-1151-0408
Distribution:
10 copies: Charles County Government 2 copies: Golder Associates Ltd., Mississauga
Submitted to: Charles County Government Department of Planning & Growth Management 200 Baltimore Street, P.O. Box 2160, La Plata, MD 20646

GEOTHERMAL COMMUNITY ENERGY STUDY
April 2011 Report No. 10-1151-0408
Acknowledgment This material is based upon work supported by the Department of Energy under Award Number DE-SC0003420.
Disclaimer This report was prepared as an account of work sponsored by an agency of the United States Government. Neither the United States Government nor any agency thereof, nor any of their employees, makes any warranty, express or implied, or assumes any legal liability or responsibility for the accuracy, completeness, or usefulness of any information, apparatus, product, or process disclosed, or represents that its use would not infringe privately owned rights. Reference herein to any specific commercial product, process, or service by trade name, trademark, manufacturer, or otherwise does not necessarily constitute or imply its endorsement, recommendation, or favoring by the United States Government or any agency thereof. The views and opinions of authors expressed herein do not necessarily state or reflect those of the United States Government or any agency thereof.

COMMUNITY GEOTHERMAL ENERGY STUDY
January 2012 Report No. 10-1151-0408 i
Table of Contents
1.0 REPORT I – REVIEW OF GEOTHERMAL SYSTEMS FOR CHARLES COUNTY, MARYLAND ................................... 3
2.0 REPORT II - ANALYSIS OF BUILDING THERMAL LOADS AND GEOTHERMAL RESOURCES FOR CHARLES COUNTY MARYLAND ................................................................................................................................... 3
3.0 REPORT III – GEOTHERMAL APPLICATIONS TO BUILDINGS AND DEVELOPMENTS IN CHARLES COUNTY, MARYLAND .................................................................................................................................................... 3
ATTACHMENT Report I - Technology
ATTACHMENT Report II - Assessment
ATTACHMENT Report III - Applications

COMMUNITY GEOTHERMAL ENERGY STUDY
January 2012 Report No. 10-1151-0408 1
EXECUTIVE SUMMARY
Golder Associates Inc. has conducted a Geothermal Community Energy Study for Charles County Maryland, beginning in February 2011 and extending to January 2012. This Study provides Charles County Department of Planning and Growth Management with guidance and direction, to determine the feasibility of geothermal heat pump system design and distribution and how both centralized and decentralized delivery systems can be applied to land uses and developments county wide.
The goals of the Community Geothermal Energy Study are:
1. Reduce owner and operating utility expenses for various types of land developments
2. Document energy and economic impacts and savings
3. Stimulate County wide, economic and energy conservation practices
4. Provide specific guidance that will enable the selection of the most appropriate and effective geothermal heat pump technologies, including equipment, delivery system and ground heat exchange configuration for a potential system installation on the Homefield site in the St. Charles community.
The study area is the entire County of St. Charles and considers both urban and rural sites. Located in Southern Maryland, specific climate, geology, groundwater and water resource information and data has been applied.
This study is designed to also meet the goals of the Energy Efficiency Conservation Block Grant (EECBG) program through the Department of Energy. The goals of this program are:
Reduction of fossil fuel emissions
Reduction of energy consumption
Improvement of energy efficiency in three sectors including the building sector
Charles County selected the St. Charles “Homefield” project as a prototype to demonstrate the implementation of geothermal heat pump system into a new construction, mixed density, residential neighbourhood. In the process of its investigation, Golder suggested that specific attention also be applied to the Waldorf Urban area, where infrastructure upgrades are planned.
Golder began this study with a review of geothermal technology as it applies to the built environment of Charles County Maryland. We then conducted a review of the geology and hydrogeology of the county and applied our findings to derive the geothermal technologies that were most suited. Golder assessed the current building structures in the county to describe and estimate the current and future, building heating and cooling requirements. We then applied the estimated geothermal resources to the estimated thermal demands of various building types and future building developments. Finally we built business cases for these applications, to illustrate the potential energy savings, cost savings and emissions reductions.

COMMUNITY GEOTHERMAL ENERGY STUDY
January 2012 Report No. 10-1151-0408 2
This Final Report is a compilation of three reports submitted during the course of the Study period.
REPORT LIMITATIONS
This report (the “Report”) was prepared for the exclusive use of Charles County Government, Maryland to support its internal discussions and evaluation of the potential feasibility of geothermal systems.
The Report is intended to provide applications of geothermal energy to buildings typical to Charles County, Maryland. The Report is based on publicly available information, on information provided by Charles County government, and on the experience of Golder, and must be considered in its entirety. It is also based on discussions with representatives of Charles County, as reported herein. No rock, soil, water, liquid, gas, product or chemical sampling and analytical testing were conducted as part of this Work.
In preparing the Report, Golder has relied in good faith on information provided by other individuals, companies or government agencies noted in the Report. Golder has assumed that the information provided is factual and accurate and Golder has not independently verified the accuracy or completeness of such information. Golder accepts no responsibility for any deficiency, misstatement or inaccuracy contained in this Report as a result of omissions, misinterpretations or fraudulent acts of others. Golder makes no other representations whatsoever, including those concerning the financial significance of its opinions, or as to legal matters touched on in this Report. With respect to our discussion of regulations and incentives, these are subject to periodic amendment and interpretation and these interpretations may change over time.
The scope of Golder’s review is described in this Report, and is subject to restrictions, assumptions and limitations. Except as noted herein, the work was conducted in accordance with the scope, terms and conditions of Golder’s Proposal P0-1151-0408 dated October 26, 2010, RFP No. 11-08 Community Geothermal Study as accepted by Contract signed by Mr. Brent Waters, Managing Associate, Golder Associates Inc. Richmond, Virginia and Ms. Candice Quinn Kelly, President for Charles County Commissioners, Charles County Maryland on January 21, 2011. Golder’s opinions are based upon information that existed at the time of the writing of the Report. It is understood that the services provided for in the scope of work allowed Golder to form no more than an opinion of the potential feasibility of geothermal energy systems. Any use which a third party makes of this Report, or any reliance on or decisions to be made based on it, are the sole responsibility of the third parties. Should additional parties require reliance on this Report, written authorization from Golder will be required. Golder disclaims responsibility of consequential financial effects on transactions or property values, or requirements for follow-up actions and costs.
Should you have any questions concerning this report, or the limitations set herein, please do not hesitate to contact our office.

COMMUNITY GEOTHERMAL ENERGY STUDY
January 2012 Report No. 10-1151-0408 3
1.0 REPORT I – REVIEW OF GEOTHERMAL SYSTEMS FOR CHARLES COUNTY, MARYLAND
Submitted in April, 2011, a Preliminary Report “Review of Geothermal Systems for Charles County Maryland” (“Report I”) provides a broad overview of geothermal technology and presents a review of fundamental geothermal system designs and configurations, discusses practical project implementation and provides an overview of government regulations and incentives.
2.0 REPORT II - ANALYSIS OF BUILDING THERMAL LOADS AND GEOTHERMAL RESOURCES FOR CHARLES COUNTY MARYLAND
A Second Report “Analysis of Building Thermal Loads and Geothermal Resources for Charles County Maryland” (“Report II”) was prepared by Golder and submitted in October 2011. The second report assesses Charles County, specifically evaluating first the current existing and planned building developments and building structure types to determine the need or demand for thermal energy, and second, evaluates the extent and nature and capacity of the geothermal resources available in Charles County. Specific sites of interest were selected and are evaluated in greater detail to highlight opportunities that could possibly deliver highly favorable technical and financial outcomes with the greatest amount of positive economic and environmental impact.
3.0 REPORT III – GEOTHERMAL APPLICATIONS TO BUILDINGS AND DEVELOPMENTS IN CHARLES COUNTY, MARYLAND
A Third Report “Geothermal Applications to Buildings and Developments in Charles County, Maryland”, applies information developed in Reports I & II to provide the business case for geothermal energy for scenarios including individual buildings, Waldorf Urban Redevelopment Area, and Homefield residential subdivision, including recommendations for each specific scenario. It includes a module on how to economically and financially assess geothermal projects (working Excel model). In summary, this report attempts to develop a high level strategy for geothermal project planning and implementation. It provides an overview of how Charles County Government can move forward to incentive geothermal energy, from strategy, policy and marketing standpoint.

COMMUNITY GEOTHERMAL ENERGY STUDY
January 2012 Report No. 10-1151-0408
ATTACHMENT Report I - Technology

April 2011
TECHNOLOGY REVIEW
Review of Geothermal Energy Systems for Charles County Maryland
PREL
IMIN
ARY
REPO
RT
Report Number: 10-1151-0408-1
Distribution:
2 copies: Charles County Government 2 copies: Golder Associates Ltd., Mississauga, ON
Submitted to: Charles County Government Department of Planning & Growth Management 200 Baltimore Street, P.O. Box 2150, La Plata, MD 20646

GEOTHERMAL COMMUNITY ENERGY STUDY
April 2011 Report No. 10-1151-0408
Executive Summary
This report provides a broad overview of geothermal technology as it exists today. It presents a review of fundamental designs and configurations and discusses the more practical factors of installation and project implementation. It also provides a brief overview of government regulations and incentives.
The report attempts to develop the concept of geothermal technology as it may apply to various size developments up to a large scale District Energy System. Geothermal systems can be designed to deliver many different criteria. They are highly flexible in both below ground infrastructure design and in above ground mechanical and building system designs. This creates both a challenge and an opportunity.
The challenge is to integrate the highest level of professional geothermal design engineering and installation experience and the best possible site specific information with knowledge of geology, hydrogeology, thermal conductivity, fluid thermal dynamics, mechanical engineering, civil engineering, building energy modeling and others.
The opportunity is that geothermal energy is everywhere and it is well understood. The application of principals of collaboration and design integration can produce highly effective and efficient sources of renewable and sustainable thermal energy. Scale is another opportunity. Geothermal technologies, while not new, have been continuously improved and are only now beginning to be broadly implemented with economies of scale not yet fully exploited.
It is only now that the economics of energy, the realization that reduced Green House Gas emissions creates better health and a cleaner living environment, the understanding that our urban cities can achieve sustainability affordably, and the concept that renewable means free, are all converging to create demand and higher value for infrastructure that may cost more now but will return benefits for a very long time, in some cases forever.

GEOTHERMAL COMMUNITY ENERGY STUDY
April 2011 Report No. 10-1151-0408
Report Limitations
This report (the “Report”) was prepared for the exclusive use of Charles County Government, Maryland, to support its internal discussions and evaluation of the potential feasibility of geothermal systems.
The Report is intended to provide a high level overview of geothermal energy technologies, as it might apply to the development of a decentralised or centralised district energy system in Charles County, Maryland. The Report is based on publicly available information, and on the experience of Golder, and must be considered in its entirety. It is also based on discussions with representatives of Charles County, as reported herein. No rock, soil, water, liquid, gas, product or chemical sampling and analytical testing was conducted as part of this Work.
In preparing the Report, Golder has relied in good faith on information provided by other individuals, companies or government agencies noted in the Report. Golder has assumed that the information provided is factual and accurate and Golder has not independently verified the accuracy or completeness of such information. Golder accepts no responsibility for any deficiency, misstatement or inaccuracy contained in this Report as a result of omissions, misinterpretations or fraudulent acts of others. Golder makes no other representations whatsoever, including those concerning the financial significance of its opinions, or as to legal matters touched on in this Report. With respect to our discussion of regulations and incentives, these are subject to periodic amendment and interpretation and these interpretations may change over time.
The scope of Golder’s review is described in this Report, and is subject to restrictions, assumptions and limitations. Except as noted herein, the work was conducted in accordance with the scope, terms and conditions of Golder’s Proposal P0-1151-0408 dated October 26, 2010, RFP No. 11-08 Community Geothermal Study as accepted by Contract signed by Mr. Brent Waters, Managing Associate, Golder Associates Inc. Richmond, Virginia and Ms. Candice Quinn Kelly, President for Charles County Commissioners, Charles County Maryland on January 21, 2011. Golder’s opinions are based upon information that existed at the time of the writing of the Report. It is understood that the services provided for in the scope of work allowed Golder to form no more than an opinion of the potential feasibility of geothermal energy systems. Any use which a third party makes of this Report, or any reliance on or decisions to be made based on it, are the sole responsibility of the third parties. Should additional parties require reliance on this Report, written authorization from Golder will be required. Golder disclaims responsibility of consequential financial effects on transactions or property values, or requirements for follow-up actions and costs.
Should you have any questions concerning this report, or the limitations set herein, please do not hesitate to contact our office.

GEOTHERMAL COMMUNITY ENERGY STUDY
April 2011 Report No. i
Table of Contents
1.0 INTRODUCTION ............................................................................................................................................................... 1
1.1 Context ................................................................................................................................................................ 1
1.2 Objectives of this Report ...................................................................................................................................... 2
1.3 Scope of Work ..................................................................................................................................................... 2
1.4 Glossary and Definition Acronyms ....................................................................................................................... 4
2.0 OVERVIEW OF GEOTHERMAL TECHNOLOGIES ......................................................................................................... 7
3.0 GEOTHERMAL SYSTEM COMPONENTS ...................................................................................................................... 9
3.1 Geothermal Ground Loop Circuit ......................................................................................................................... 9
3.1.1 Open-loop Systems........................................................................................................................................ 9
3.1.1.1 Open-Loop Standing Column Wells .......................................................................................................... 10
3.1.2 Closed-loop Systems ................................................................................................................................... 11
3.1.2.1 Closed-Loop Horizontal Configuration ...................................................................................................... 12
3.1.2.2 Closed-Loop Vertical Borehole Configuration ........................................................................................... 12
3.2 GeoExchange Mechanical Circuit ...................................................................................................................... 14
3.2.1 Coefficient of Performance ........................................................................................................................... 15
3.2.2 Green House Gas Emission Reduction........................................................................................................ 16
3.2.3 Temperature ................................................................................................................................................ 16
3.3 Geothermal Building HVAC Circuit .................................................................................................................... 17
3.3.1 Conventional Heating and Cooling ............................................................................................................... 17
3.4 Building System Design Integration ................................................................................................................... 18
3.5 Geothermal System Building Compatibility ........................................................................................................ 19
3.5.1 New Development ........................................................................................................................................ 20
3.5.2 Existing Building Retrofit .............................................................................................................................. 20
4.0 SCALABILITY OF GEOTHERMAL SYSTEMS .............................................................................................................. 21
5.0 GEOTHERMAL SYSTEM DESIGN ................................................................................................................................ 23
5.1 Thermal Conductivity of the Ground .................................................................................................................. 23
5.2 Borefield Balance and Sustainability .................................................................................................................. 24
5.3 Land Area .......................................................................................................................................................... 24

GEOTHERMAL COMMUNITY ENERGY STUDY
April 2011 Report No. ii
5.4 Geothermal System Design Decisions .............................................................................................................. 25
6.0 GEOTHERMAL SYSTEM PROJECT DEVELOPMENT CYCLE .................................................................................... 26
7.0 GEOTHERMAL SYSTEM PROJECT FINANCIAL CYCLE ............................................................................................ 28
8.0 DESIGN BUILD GEOTHERMAL SYSTEM RESOURCES AND CAPABILITIES REQUIRED ...................................... 29
8.1 Geothermal Design and Engineering ................................................................................................................. 29
8.2 Drilling ................................................................................................................................................................ 30
8.3 Building Science & Mechanical Geothermal System Engineering ..................................................................... 32
8.4 Geothermal Heat Pumps and Mechanical Equipment ....................................................................................... 32
8.5 Controls and Building Automation Systems ....................................................................................................... 33
9.0 GOVERNMENT REGULATIONS, CERTIFICATION AND INCENTIVES ....................................................................... 34
9.1 Standards and Permits ...................................................................................................................................... 34
9.2 Training and Certification ................................................................................................................................... 34
9.3 Incentives for Geothermal System Installation ................................................................................................... 35
9.3.1 Maryland State Incentives ............................................................................................................................ 35
9.3.2 Local Utility Incentives .................................................................................................................................. 36
10.0 GEOTHERMAL DISTRICT ENERGY BUSINESS STRATEGY ..................................................................................... 38
11.0 DISTRICT ENERGY SYSTEMS, CONCEPT TO IMPLEMENTATION ........................................................................... 42
12.0 REFERENCES ................................................................................................................................................................ 43
TABLES Table 1: Examples of Scalability of Geothermal Systems ........................................................................................................ 22
Table 2: GeoExchange System Project Financial Cycle .......................................................................................................... 28
Table 3: Geothermal District Energy System Configurations ................................................................................................... 40
Table 4: Geothermal District Energy System SWOT Analysis ................................................................................................. 41
FIGURES Figure 1: Ground Temperatures ................................................................................................................................................. 7
Figure 2: Thermal Borehole Model ............................................................................................................................................. 8
Figure 3: Open-Loop System with reinjection well ................................................................................................................... 10
Figure 4: Standing Column Well ............................................................................................................................................... 10
Figure 5: Closed-Loop Horizontal System ................................................................................................................................ 12

GEOTHERMAL COMMUNITY ENERGY STUDY
April 2011 Report No. iii
Figure 6: Closed-Loop Vertical Borehole System ..................................................................................................................... 14
Figure 7: Heat Pump Operation ............................................................................................................................................... 14
Figure 8: Building System Design Integration .......................................................................................................................... 19
Figure 9: Community Geothermal District Energy, Gibsons, BC .............................................................................................. 21
Figure 10: Balanced annual cycle of heating and cooling in a borehole ................................................................................... 24
Figure 11: Geothermal Drill Rig in Operation ........................................................................................................................... 31
Figure 12: Geothermal Energy Supply Agreement Comparative Costs ................................................................................... 39
APPENDICES APPENDIX A Maryland Electricity Profile
APPENDIX B Case Studies – Geothermal Systems of Varying Scale
APPENDIX C International Ground Source Heat Pump Association Members, in Charles County, Maryland and in Maryland State

GEOTHERMAL COMMUNITY ENERGY STUDY
April 2011 Report No. 10-1151-0403 1
1.0 INTRODUCTION 1.1 Context Charles County Maryland, with a 2011 population of approximately 146,000 people covers over 294,000 acres of land bordered by the Potomac River to the west, the Wicomico River to the south-east, Saint Mary’s County Maryland to the north-east and Prince Georges County Maryland to the north. According to Countywide population projections developed by the Maryland Department of Planning (MDP) in 2008, Charles County is expected to grow by an average of 1.7 percent per year, or 45 percent overall from 140,764 people in 2008 to a population of approximately 204,200 people by 20301. This represents an increase of approximately 64,436 people requiring an addition of approximately 24,173 residential dwellings. When this growth is added to the 2008 housing stock of 53,327 units, a projected total of 77,500 residential units, is expected to exist by 2030.2
In this context, geothermal energy is available, geothermal system designs are scalable to demand requirements and the rate of development, with varying economic implications.
In 2002 approximately 17% of the land area in the County was “developed”. Population growth projections and development scenarios, described in the Charles County Comprehensive Plan, Water Resources Element July 2010 (Draft) have been adopted for the purposes of this study in order to create consistency and form a basis for comparison.
Geothermal systems (also known as low-temperature geoexchange systems or earth energy systems) are considered to be renewable energy systems and are an alternative to traditional electricity, oil or natural gas fed heating and cooling systems. For the purposes of this study, a geothermal system is defined as a heating and cooling system for buildings that uses liquid to exchange heat with the ground or groundwater.
Charles County is currently engaged in developing heating and cooling solutions for specific sites within the County that have been designated for immediate development, including the Homefield Residential Subdivision. Across the United States, stand alone residential geothermal systems have been increasingly used for heating and cooling single family homes. On a larger scale, as evidenced by an increasing number of projects, geothermal technology is increasingly recognized, as a viable and cost effective source of renewable energy, capable of supplying large scale commercial and multi-residential developments with all the heating and cooling they require.
In addition to consideration of privately owned geothermal systems, Charles County Maryland has expressed an interest in developing its capability to heat and cool buildings in the region, by potentially providing a geothermal energy supply utility service, which could be a source of revenue while supporting a best practice and sustainability business model. Charles County must satisfy its various stakeholders, rate payers as well as tax payers, with services, returns on investment, technical and business risks that are within prescribed parameters.
1 Charles County Comprehensive Plan, Water Resource Element (Draft), July 2010, page 4 (Source: MDP, 2008 Estimates for Maryland’s Jurisdictions) 2 Charles County Comprehensive Plan, Water Resource Element (Draft), July 2010, page 5 (Source: Maryland Property View, 2008)

GEOTHERMAL COMMUNITY ENERGY STUDY
April 2011 Report No. 10-1151-0403 2
1.2 Objectives of this Report The main objective of this report is to provide context and background to assist Charles County MD in considering geothermal technology as a viable, cost effective and market attractive source of energy. This is a preliminary report, intended to provide a summary discussion of possible geothermal technologies and configurations. This report is not intended to be a comprehensive manual or review of geothermal technologies.
As part of the Charles County Community Geothermal Study 11-08 this is only a preliminary report, with further information and reports to follow. It is intended to initiate discussion, and provide basic information about geothermal technologies that will be referenced in future work which will be focused specifically on the local conditions and circumstances of Charles County MD.
Report objectives are:
Describe various geothermal technologies
Describe various scale geothermal systems and applications
Outline the project development cycle of a large scale centralised geothermal system
Indicate the order of magnitude capital and operating costs of a geothermal system, using a project development cycle financial model
Identify resources and capabilities required to install geothermal systems
Outline government regulations and incentives
Analyse the strengths, weaknesses, opportunities and threats of a geothermal business strategy
Anticipate and identify challenges of implementation
List case examples, identifying costs and benefits
1.3 Scope of Work The technology that is considered in this report is limited to technology that has been installed in North America and is applicable to residential, commercial and multi-residential building development. This report does not provide an exhaustive survey of technologies and equipment available or innovations being developed.
The portion of the geothermal system that is considered in this report is limited to the exterior loop component, including the immediate connection to the building that may be housed in a lower interior level of a building. This can be considered the “exterior” or “primary” geothermal system. The interior “HVAC” geothermal system may include water pipe connectors, heat exchangers, water-to-water and/or water-to-air heat pumps, air ducting, electrical connections, sensors and controls, desuperheaters, radiant in-floor or in-wall piping, make up air units, fan coils and many other pieces of equipment that may be connected to the primary geothermal system. Typically, the HVAC system of a building, while specified to be compatible with

GEOTHERMAL COMMUNITY ENERGY STUDY
April 2011 Report No. 10-1151-0403 3
the primary geothermal system, is designed by a mechanical electrical consultant retained by each building developer. This report contains a description of a geothermal system design integration process.
First, a review of the geothermal technologies in use today was conducted.
Second, the metrics of known geothermal projects were analysed to derive observations and indicators of project development processes and costs.
Third, relevant government regulations and incentives were surveyed and identified.
Finally, a SWOT analysis was performed and an assessment of operational and financial implementation was done.
The information produced in this report is for the internal consideration of Charles County MD to determine whether to further pursue, geothermal energy promotion or supply, as a policy or business direction. Further study and development is required for feasibility of any one site or situation, to be determined.

GEOTHERMAL COMMUNITY ENERGY STUDY
April 2011 Report No. 10-1151-0403 4
1.4 Glossary and Definition Acronyms All glossary explanations and definitions are solely for the purposes of this document.
Antifreeze: a modifying agent added to water in closed-loop systems to lower its freezing temperature.
Aquifer: a layer of permeable rock or soil that has the potential to yield groundwater in usable quantities, to springs or wells.
Aquifer thermal energy storage (ATES): underground thermal energy storage in which the beneficial thermal energy potential is carried by the groundwater into the aquifer and later retrieved via groundwater flow back to the surface through water wells, piping, heat exchangers and pumps.
Borehole thermal energy storage (BTES): underground thermal energy storage in which rock or soil is the thermal store and the heat transfer medium is a heat-transfer fluid in a borehole heat exchanger.
Building Code: Charles County Building Code, effective 06-04-2010, adopting the International Building Code 2009 (IBC), the International Residential Code 2009 (IRC), the International Energy Conservation Code, the 2009 International Fuel Gas Code, the 2009 International Existing Building Code, the 2009 International Mechanical Code, published by The International Codes Council, Inc. as amended by periodic supplements and Charles County Bill No. 2010-08
Building Code Act: Charles County Bill 2010-08, Chapter 224, effective 06-04-2010, as amended by periodic supplements
Central pumping station: for purposes of this report, the room inside a building where the geoexchange loop headers accumulate, manifold and terminate, connecting to circulation pumps and possibly other mechanical equipment and delivering tempered water to interior building circulation pipes.
Energy pile: a building pile or structural cement footing into which closed-loop geoexchange pipe work is incorporated, allowing it to be used as a heat exchanger.
GeoExchange: Thermal energy, heating and cooling, collected and processed from low temperature ground source heat, created by the sun’s radiation and stored in the upper levels of the earth’s crust. (also called Earth Energy, Ground Source Energy, Low-temperature geothermal energy, Shallow geothermal energy)
GeoPower: Electricity generated from high temperature water and steam, heated by the earth’s core.
Geothermal Energy: any mechanical system, which taps into the earth’s reservoir of heat, to produce energy, electricity or thermal. (also used to describe GeoPower vs. GeoExchange)
Ground Energy Balance: ground energy balanced geoexchange systems are those where the amount of energy extracted and the amount of heat dispersed during an annual cycle are approximately equal, therefore, such systems, do not induce a gradual increase or decrease of ground temperature over years of use.

GEOTHERMAL COMMUNITY ENERGY STUDY
April 2011 Report No. 10-1151-0403 5
Ground-heat exchanger: a continuous, sealed, underground pipe or loop through which a heat-transfer fluid flows to and returns from a heat pump or other heating and cooling extraction equipment.
Grout: in the context of geoexchange systems, grout is a low permeability material used to create a thermally conductive medium and hydraulic seal throughout a vertical borehole heat exchanger.
Header: a pipe assembly used in a closed-loop geoexchange system that connects multiple parallel pipe loops to supply or return piping.
Heat pump: in the context of geoexchange systems, a mechanical device used to transfer heat from a geoexchange loop system, to a building by means of a heat exchanger system (including a condenser, an evaporator, an expansion valve and a compressor), requiring electrical energy in the process. The device allows the cycle to be reversed so that the heat pump can function as a heater or as a cooling device.
Heat transfer fluid: a solution of water and antifreeze agents in closed-loop systems to lower the freezing temperature. Where applicable and permitted by the authority having jurisdiction, chemical inhibitors to protect the solution’s biological and chemical integrity and to prevent corrosion of system pipes, may be added to the solution.
Horizontal geoexchange system: for the purposes of this report, a geoexchange system constructed using excavated open trenches for closed-loop installation.
Horizontal tie-ins: for the purposes of report, a series of headers connecting parallel loop connectors, laid in trenches, culminating at and connection to the central building pumping station.
Safe Drinking Water Act 1974 (SDWA): amended 1986 and 1996, to protect human health from contaminants in drinking water and to prevent contamination of existing groundwater supplies.
Standing column well (SCW): an open-loop system where groundwater is extracted from the ground, by being pumped from an open vertical pipe that extends to the bottom of a water well; it is then passed through a heat exchanger and finally is returned to the ground by way of a discharge annulus placed between the vertical pipe and the wall of the well.
Underground thermal energy storage (UTES): a subsurface application of thermal energy storage using groundwater and/or the ground for storage of supplied energy.
Vertical geoexchange system: for the purposes of this report, a geoexchange system constructed using vertical bore holes for either closed-loop or open-loop configurations.
Water Resource Element (Draft), July 2010 – part of the Charles County Comprehensive Plan, a policy framework for sustaining public drinking water supplies and protecting the County’s waterways and riparian ecosystems by effectively managing point and nonpoint source water pollution, complies with the requirements of Article 66B of the Annotated Code of Maryland – as modified by Maryland House Bill 1141, passed in 2006.

GEOTHERMAL COMMUNITY ENERGY STUDY
April 2011 Report No. 10-1151-0403 6
Water Taking Regulation: Code of Maryland Regulations 26.04.02 - On-Site Water Supply and Sewage Disposal
Acronyms used in this report:
ASHRAE: American Society of Heating, Refrigeration, Air-Conditioning Engineers
COP: Coefficient of performance: the ratio of heating (or cooling) energy delivered by a heat pump to the electrical energy (or other primary energy) required to power it (also refers to energy in /energy out of a complete system)
DX: Direct Exchange
EWT: Entering Water Temperature
EU: European Union
GHX: Geothermal Heat Exchange or GeoExchange
HDPE: high density polyethylene
HVAC: heating, ventilation and air conditioning
ICI: Industrial, commercial and institutional
IGSHPA: International Ground-Source Heat Pump Association
LWT: Leaving Water Temperature
MEA: Maryland Energy Administration
MCEC: Maryland Clean energy Centre
NA: North America
RESA: Renewable Energy Supply Agreement
SCW: Standing column well
SMECO: Southern Maryland Electric Cooperative
TRT: Thermal Response Test

GEOTHERMAL COMMUNITY ENERGY STUDY
April 2011 Report No. 10-1151-0403 7
2.0 OVERVIEW OF GEOTHERMAL TECHNOLOGIES The terms geothermal energy and geoexchange are often interchanged. More and more, “geothermal” is being used to describe any mechanical system that taps into the earth’s reservoir of heat, to produce energy. The mechanical systems require electricity to operate, for pumping and circulating, water, air and heat. None-the-less, geothermal systems are considered sources of 100% renewable energy, since no other energy source, neither electricity nor fossil fuels, is converted to the energy output. It is simply used as a means to collect and move the energy.
There are two fundamental types of geothermal energy:
GeoPower: Electricity generated from high temperature water and steam, heated by the earth’s core. If hot springs or volcanic heat is not available near the surface, then drilling to a depth of several thousand feet is usually required to access the high temperatures required.
GeoExchange: Thermal energy, heating and cooling, collected and processed from low temperature ground source heat, found in the upper layers of the earth’s crust. Radiation from the sun is absorbed by the earth and stored to depths of approximately 20 feet, where the earth’s temperature tends to normalize, supported by core heat, increasing very gradually to depths ranging from several hundred feet to several thousand feet, where high temperature core heat is found.
For the purposes of considering the delivery of heating and cooling to buildings, it is GeoExchange technology that we are relying on. According to common use, for the purposes of this report and since GeoPower is not being considered here, the term Geothermal is used when describing GeoExchange.
Geothermal system design is based on creating an infrastructure for exchanging heat with the earth, using water, overburden or bedrock, or a combination of all three as a ground source of energy or energy storage. High Density Polyethylene (HDPE) pipe is inserted into the ground in one of several configurations, to conduct a flow of water or refrigerant or a mix of both, in order to conduct thermal energy transfer
Figure 1: Ground Temperatures
GEOTHERMAL COMMUNITY ENERGY STUDY
April 2011 Report No. 10-1151-0403 8
from the ground to the mechanical systems above ground and back again. In other words, thermal energy is collected below ground and delivered above ground, or it can be reversed, to collect energy above ground and deliver it to the ground below.
Ground temperatures in Maryland are approximately 55°F and are constant from levels of approximately 20 feet below ground surface to depths of 600 feet and well beyond. By exposing warmer water or cooler water to this ground temperature, for long enough, the temperature will normalize back to 55°F.
Geothermal heat exchange pipes can be laid horizontally in open trenches, as long as they are deep enough to be below the frost line. Alternatively, geothermal heat exchange pipes can be installed into boreholes drilled hundreds of feet into the ground.
Underground Thermal Energy Storage (UTES): If additional heat is carried into the ground in a concentrated time frame, then the surrounding earth will absorb more heat than its ambient temperature, with the amount controlled by the thermal absorption properties of the type of ground present, and will store this heat for some time. We have all felt the heat of a warm rock, well into a cool evening. With borefield design engineering, the ground can be used for thermal storage, known as Underground Thermal Energy Storage (UTES).
UTES is used in two different ways, depending on how much groundwater movement exists at the site. Water is an excellent conductor of heat and enhances thermal conductivity in borefields. Groundwater exists in most sites. However, it can be relatively stable or it can be moving, sometimes under high pressure. Moving groundwater, present in aquifers, carries significant heat away from the borefield, which is an advantage if cooling is required, but is a disadvantage if heat retention is required. Aquifer Thermal Energy Storage (ATES) systems are designed to use moving groundwater to carry heat away from the boreholes. Borehole Thermal Energy Storage (BTES) systems are designed where little groundwater movement exists and operate by storing energy in the ground and retrieving it up to several months later.
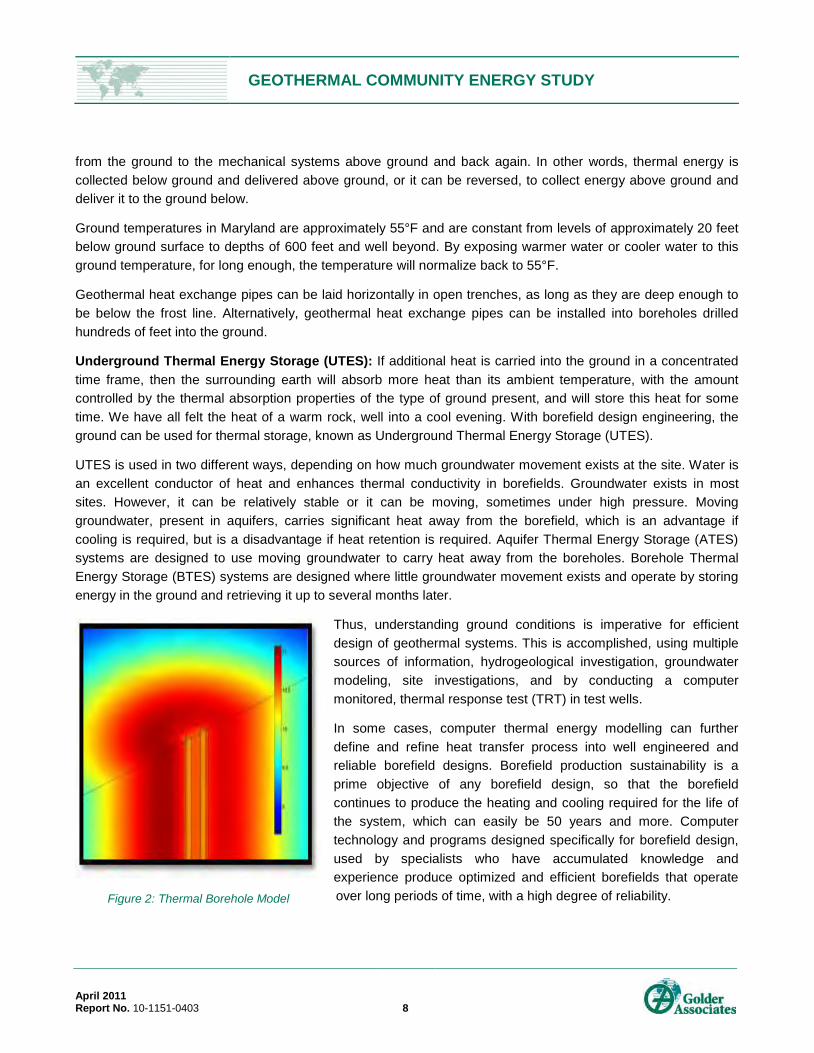
Thus, understanding ground conditions is imperative for efficient design of geothermal systems. This is accomplished, using multiple sources of information, hydrogeological investigation, groundwater modeling, site investigations, and by conducting a computer monitored, thermal response test (TRT) in test wells.
In some cases, computer thermal energy modelling can further define and refine heat transfer process into well engineered and reliable borefield designs. Borefield production sustainability is a prime objective of any borefield design, so that the borefield continues to produce the heating and cooling required for the life of the system, which can easily be 50 years and more. Computer technology and programs designed specifically for borefield design, used by specialists who have accumulated knowledge and experience produce optimized and efficient borefields that operate over long periods of time, with a high degree of reliability.
Figure 2: Thermal Borehole Model

GEOTHERMAL COMMUNITY ENERGY STUDY
April 2011 Report No. 10-1151-0403 9
3.0 GEOTHERMAL SYSTEM COMPONENTS In this section of the report, reference is made to commercial and multi-residential buildings to reduce complexity. This is not intended to eliminate other buildings from discussion, but is rather used as a point of reference to explain principals that apply to all geothermal systems.
A Geothermal system has three distinct circuits: the energy supply or ground loop circuit, the energy processing and delivery or mechanical circuit and the energy use or building HVAC circuit. Each of these three system components has numerous constraints, options and variables. A variety of technical disciplines are routinely integrated to produce complex, optimised solutions. Geothermal system technology and design draws from the following expertise:
Ground loop circuit: geology, hydrogeology, thermal and dynamic flow measurement and modeling, environmental science;
Mechanical circuit: mechanical engineering, civil engineering and for large scale systems, industrial engineering; and
Building HVAC circuit: architecture, mechanical engineering, building science.
3.1 Geothermal Ground Loop Circuit Geothermal systems rely on thermal conductivity. Thermal conductivity is the rate at which media transfers heat. The earth is made of many types of rock and soil that may contain significant quantities of water. Each of these earth media has different properties of thermal conductivity. Geothermal systems are designed to produce a project specific quantity of heat energy and cooling capacity that is dependent on the specific heat of the ground mass, the thermal conductivity of the ground and the properties of the exchange system fluids and piping.
Geothermal ground circuits have two fundamental design types, open-loop and closed-loop. There is also one variation of an open-loop system, called a Standing Column Well system that is worth discussing separately.
3.1.1 Open-loop Systems Two HDPE pipes are inserted into a reservoir of water either surface water such as a lake, or groundwater such as an aquifer. One pipe extracts water from the water reservoir, delivering it to the mechanical equipment above ground, which extracts heat from, or rejects heat to, the flowing water. A second pipe injects the thermally altered water, back into the reservoir.
While open-loop systems do not consume water, they do alter the temperature and potentially change the chemical content of the water they use. Therefore, in most jurisdictions, open-loop systems require Environmental Impact Assessments, Water Extraction Permits and continuous monitoring and verification by government regulation agencies. Open-loop systems are exposed to variations in the water supply they rely on, such as changing temperatures, flow rates, water quality and volume of supply. Thus, reliability of such systems is sometimes influenced by factors beyond the full control of the system design and operation.
Open-loop systems can be significantly cheaper to install than closed-loop systems because they either require no drilling at all or they require much less drilling. Where there are proven resources of good quality water, with

GEOTHERMAL COMMUNITY ENERGY STUDY
April 2011 Report No. 10-1151-0403 10
adequate flow and reliable supply, they can be a very effective and efficient source of geothermal energy. For reasons of supply and environmental uncertainty, open-loop system designs are often rejected.
However, with significant aquifers present under the region and with a larger demand for cooling than for heating, Charles County may want to consider open-loop geothermal systems.
Figure 3: Open-Loop System with reinjection well
3.1.1.1 Open-Loop Standing Column Wells There is an engineered variation of the open-loop Geothermal system that is used for some installations, where ground water flow is not high enough to support a true open-loop system and land area available is not enough to support a closed loop borefield of the size required.
Called a Standing Column Well (SCW) system, a large diameter bore hole is drilled to a depth well below the level of the ground water at that site. The bore hole fills with ground water, which is extracted through an open ended pipe from the bottom of the well and re-injected in the upper part of the same well.
SCW systems do not depend on groundwater flow and aquifer yield in the same way a true open-loop systems do. However they do rely on ground water presence to provide thermal exchange. They can be useful where available land area is not large enough to accommodate a closed-loop system.
Like other open-loop systems, SCW systems require less drilling and can be cheaper to install. However they are still exposed to ground water condition changes, beyond the control of the system design and
Figure 4: Standing Column Well

GEOTHERMAL COMMUNITY ENERGY STUDY
April 2011 Report No. 10-1151-0403 11
operations. In most jurisdictions they are subject to Water Well regulations and permitting.
3.1.2 Closed-loop Systems In a closed-loop system, a single HDPE pipe is manufactured in a continuous loop configuration, designed to carry water or a water/refrigerant solution, into the ground and bring it back out again, all the while exchanging heat with the earth through the walls of the pipe, without depositing or collecting any water from or into the ground. (Note: a different type of closed-loop system is sometimes used for small installations, called Direct Exchange or DX, whereby the pipe is made of copper through which a refrigerant flows. The life of these systems is limited to the life of the copper pipe, which is extended by the application of a moisture control coating, but is nonetheless significantly shorter than that of HDPE loop systems. Refrigerants today are much less toxic than five or more years ago, however they are still refrigerants and more toxic than the water solutions used in HDPE pipe closed-loop systems. For the purposes of this report, DX systems are not considered further.)
Closed-loop systems do not exchange any water with the ground, they only exchange heat energy. They are installed in relatively stable ground and bedrock. To the extent that the ground moves, closed-loop systems can be damaged, though they are built to withstand minor earth tremors and settlement. In most jurisdictions, closed-loop systems do not require Environmental Assessments or special permitting. Most municipalities do require geothermal system design drawings to be submitted to Building Departments, along with architectural drawings for application for building permits.
There are many design configurations of closed-loop systems and new configurations are progressively being developed, in response to new and strengthening drivers such as:
new mechanical equipment with broader input parameters and higher operating efficiency
increasing urban density and the high cost of land
electricity and fossil fuel prices change
increasing cost of finding and harvesting energy, to replace depleting supply sources
higher capability computer modeling and analysis software is available
increasing demand for energy
awareness and desire for renewable energy supplies
better understanding of financial returns of long life renewable energy assets
evolving technology of hybrid and integrated complex systems Closed-loop geothermal systems are extremely flexible. They can be installed in virtually any configuration that allows measured and efficient heat transfer. This includes horizontally in trenches or horizontal bore holes and vertically in drilled boreholes, which can be spread along a perimeter or roadway or clustered in a grid pattern. Ground circuit installations do not need to be on the same site as the building(s) being supplied. Underground water piping can be installed, similar to water and sewer mains, to create a distribution and return conduit with a central plant or building. Some communities are referring to these pipe distribution networks as “the thermal grid” acting like the “electricity grid”.

GEOTHERMAL COMMUNITY ENERGY STUDY
April 2011 Report No. 10-1151-0403 12
Closed-loop Geothermal systems are very scalable. Thermal conductivity can be tested and measured and systems can be designed as large or as small as required although available land area is often a constraint.
3.1.2.1 Closed-Loop Horizontal Configuration Where land area allows, HDPE loops can be installed horizontally, coiled in trenches dug to a depth of as little as 4 ft. interacting in earth that heats and cools with the seasons. Alternatively larger diameter straight pipe can be installed on the bed of a depleted quarry, before backfill is applied to re-contour the site for redevelopment. These ‘Horizontal Systems” require no drilling and are therefore less expensive to install than vertical systems. Depending on the depth of the loops and the amount of seasonal temperature change of the ground, a horizontal system can recharge itself seasonally, with no design requirement to “balance” the geothermal field. Horizontal systems require large tracts of land, relative to the amount of energy produced. They are particularly suitable for schools which require only heating and have large playgrounds. Retail and commercial buildings with large parking lots, or agricultural buildings such as greenhouses surrounded by fields or even golf courses can be ideal for horizontal geothermal system installation. Horizontal loop installations can also play a role in balancing complex vertical borehole Geothermal systems; however land for large horizontal systems is often not available or not affordable.
Figure 5: Closed-Loop Horizontal System
3.1.2.2 Closed-Loop Vertical Borehole Configuration A closed-loop vertical borehole Geothermal system is created by boring holes into the ground and inserting U-shaped HDPE loops, which are then grouted in place, enhancing the heat transfer between the ground and the water flowing through the HDPE loop. Grouting protects the groundwater from contamination by water seeping from the surface and also protects against aquifer cross-contamination. Where there is significant aquifer flow or loose soil or rock conditions, steel casing is often inserted at the same time as the borehole is being drilled to maintain the integrity of the borehole until the grout can be installed. The steel casing is usually extracted to be reused, but is sometimes left in place if extraction is not practical.
Vertical boreholes can be installed beneath a new construction building footprint, in roadways and laneways, in sports fields, parks and school yards, in railway track beds and hydro access rights of way, beneath elevated

GEOTHERMAL COMMUNITY ENERGY STUDY
April 2011 Report No. 10-1151-0403 13
roadways and in transportation tunnels as they are built. They are routinely drilled up to 600 feet deep, and with suitable equipment, can be drilled to 1000 ft. deep and much more. The constraint with depth is not the drilling, but rather the proper and efficient installation of the HDPE pipe into the borehole and the larger pipe diameters required to produce the additional strength needed to withstand the higher pressures at depth.
Vertical borehole systems can be designed to perform differently according to the thermal conductivity of the ground available and the thermal requirements or loads of the buildings to be supplied. A vertical bore field will usually be designed in one of two ways:
1) each borehole interacts independently with the ground, relying on the ground along with any water flow within it, to completely disperse 100% of the energy injected into it in the summer and supply 100% of the energy required in winter. This design relies on either enough ground water movement to move energy away from the borehole or enough space between the boreholes, so that they do not interact with each other.
2) each borehole interacts with the ground and with surrounding boreholes, creating underground thermal energy storage (UTES). In summer, heat is rejected and stored in the ground rather than completely dispersed, and in winter that same heat is collected and reused. This design relies on little groundwater movement so that energy is retained within the bore field and it requires that the boreholes be positioned in a calculated grid pattern so that they interact with each other as designed. This design also relies on the bore field operations being balanced, that is that the consumption of energy for heating is approximately equal to the rejection of energy from cooling. This ensures that over time, the bore field will not heat up or cool down, impacting its performance. Imbalanced building loads can be altered to create more balance by building mechanical design and by choosing to connect some building thermal equipment to the geothermal system while rejecting other thermal equipment to be supplied by other sources of energy. This process of “mechanical design integration” with the borefield design can be very important to overall system efficiency, cost and performance.
Underground thermal energy storage works extremely well for large commercial or multi-residential buildings, where the borefield can be installed in a tight grid underneath the building before it is built. In Maryland, the heating and cooling energy consumption volumes of these buildings may not be balanced and the presence of aquifers may carry energy away from the borefield. Except in areas were borehole depth is designed to not intersect with aquifers, UTES is probably not a good option in Charles County. However, used properly in geothermal system design, the aquifers under Charles County can be a great source of cooling.

GEOTHERMAL COMMUNITY ENERGY STUDY
April 2011 Report No. 10-1151-0403 14
Figure 6: Closed-Loop Vertical Borehole System
3.2 GeoExchange Mechanical Circuit Geothermal systems rely on heat pump technology. A geothermal heat pump exchanges heat from the ground loop circuit, through a mechanical or energy augmentation circuit, to the building HVAC circuit. A heap pump can operate in either a heating mode or in a cooling mode; in winter collecting heat from the ground, adding additional heat from compression to it and delivering it through either water or air, to heat a building or in summer collecting heat from a building, expanding it and delivering it to the ground. Each of the three circuits, the ground, the mechanical and the building are separate and do not exchange fluids between them. Only energy is transferred.
Figure 7: Heat Pump Operation

GEOTHERMAL COMMUNITY ENERGY STUDY
April 2011 Report No. 10-1151-0403 15
Geothermal systems are very efficient, because one borefield and one set of mechanical equipment can supply both heating and cooling. A heat pump does require electricity to operate, but does not consume any natural gas or other fossil fuels. With today’s energy efficient technologies, heat pump systems can consume less electricity to operate annually than conventional boiler and chiller systems, which tend to use more electricity over a year particularly for cooling and they tend to use it in peak times and during hot summer days, when the electrical grid is more likely to be operating near capacity.
Heat pumps and heat pump technology is extremely scalable. Single, off the shelf pieces of equipment tend to range in size from ¾ ton units to 250 ton units (nominal). Larger capacity systems can be designed using multiple heat pumps working together or by custom designing systems that include large industrial size components that accomplish the same work. Heat pump equipment and industrial components are standard and are available from dozens of competitive North American manufacturers.
3.2.1 Coefficient of Performance Heat pump and ground energy system efficiency is defined by its coefficient of performance (COP). Converting electricity to heat requires 1 kW of electricity to produce 1 kW of heat, or a COP of 1. Burning natural gas is never 100% efficient, no matter how well the equipment is designed, with residential furnaces reaching up to 96% efficiency but large boilers averaging about 68%, so the COP is always less than 1.
A geothermal system can reach a COP as high as 7, that is, it can produce seven times the energy output compared to the electricity consumed in the process of heat collection and distribution.
COP = Power used (kW)
Power produced (kW)
Geothermal system COP ≈ COP of heat pump + COP of circulation system + COP of distribution system
Conventional electric heating : 1
COP
Ground energy heating mode : 3 to 4 (Heat Pump)
Ground energy cooling mode : 4 to 5 (Heat Pump)
Ground energy heating/cooling, simultaneous : 5 to 7 (Heat Pump)
Ground energy storage, daily or annual cycle : > 5 (Earth Storage)
With a COP of 3, a $60,000 conventional heating bill is reduced to $20,000 annually
This is because energy is actually being harvested from the ground, or it is moved around, cooling one space while delivering energy to heat another space. Geothermal heating alone, routinely reaches COPs of 3 to 4 and often 5, that is for every 1 kW of electricity required to operate the geoexchange system, 3 to 5 kWs of heat are delivered to the building. Geoexchange cooling is even more efficient with COPs often reaching 5. When these cycles are combined, for example first cooling a space, extracting heat, then moving it to heat another space before returning the geoexchange fluid to the ground, then the COP of cooling is incremental to the COP of heating, compounding the efficiency of the system.

GEOTHERMAL COMMUNITY ENERGY STUDY
April 2011 Report No. 10-1151-0403 16
Understanding the building loads required, analysing energy use, annually and in cyclical stages of daily use, is critical to optimizing a geothermal system. A building uses energy for many different functions including space heating, space cooling, ventilation, domestic hot water, snow melt, swimming pools, ice rinks, ice storage and others. Larger buildings and multi-building systems tend to have more diversified energy use loads, creating greater opportunity for higher efficiency geothermal systems.
3.2.2 Green House Gas Emission Reduction Green House Gasses (GHG) are a by-product of fossil fuel combustion. Geothermal systems do not consume or combust any fossil fuels, therefore, compared to oil, coal or natural gas fed boilers or furnaces, the associated GHG emissions are reduced to zero. Geothermal systems do require electricity to circulate water and air and to operate compressors and are therefore attributed with the GHG emissions associated with their use of electricity.
Electricity in Maryland (2008) is generated mainly from coal (57.5%) and nuclear (31%) and the GHG emissions associated with electricity generation are 620 kg/MWh.3
Geothermal systems do consume some electricity to operate water and heat pumps however, with a system COP of 3 to 5, the GHG emissions associated with geothermal systems are reduced by 60% to 80%, over conventional systems using electricity or natural gas for heating and electricity for cooling. In Maryland, this reduction in GHG emissions is quantitatively significant.
This GHG emission level is relatively high among US states, as Maryland ranks 29th. Independent Power Producers and Combined Heat and Power producers supply 99.4% of the electricity generation in the state. Maryland consumes approximately 32% more electricity than it generates, relying on interstate supply for about one third of its consumption. Please see Appendix A, Maryland Electricity Profile.
Geothermal systems are considered to be a renewable source of energy, since no fossil fuel is consumed and the electricity used is not converted to thermal energy, but rather is used to collect and distribute the renewable geothermal energy.
3.2.3 Temperature Temperature is another major factor to be considered in geothermal system design and operations. The whole point of geothermal energy is to use the temperatures present in the ground to create the temperatures required for comfort in a building or end use. Geothermal system design should be governed by the temperatures required and volume and use of the space to be tempered.
In a closed-loop system, heat pumps accept a flow of geothermal loop fluid, usually a weak solution of water and environmentally approved ethanol or glycol, at the temperature at which it returns from the borefield, which in southern Maryland is approximately 55°F. This heat is transferred, through a heat exchanger inside the heat pump, to a separate closed loop containing a flow of refrigerant, which vaporizes at a lower temperature than water. The refrigerant vapour is then compressed to liberate more heat. Dictated by the type of refrigerant used and its vaporization properties, heat pumps operate very efficiently, to output heat in the form of either heated water or heated air at temperatures up to 120°F. Some heat pump equipment can achieve higher temperatures; however the efficiency of the system quickly deteriorates as the temperature outputs are increased above 120°F.
3 US Department of Energy, Energy Information Administration, 2008, released 2010, Maryland Electricity Profile (DOE/EIA-0348(01)/2)

GEOTHERMAL COMMUNITY ENERGY STUDY
April 2011 Report No. 10-1151-0403 17
For new buildings, built with equipment designed to accept geothermal heating and cooling, 120°F is ideal. However, older buildings originally built with conventional boilers and chillers, have piping systems and in-suite heating and cooling distribution systems designed for 180°F and warmer. Therefore retrofitting older buildings by removing boilers and chillers and installing geothermal systems requires either the equipment and pipe systems inside the building to be replaced with geothermal compatible equipment or the temperature of the geothermal heat supply to be increased. To maintain high efficiency in the geothermal system, a natural gas boiler can be used to “top up” the geothermal system from the low grade 120°F heat level to the high grade 180°F heat required by older buildings. While residential homes are routinely retrofitted with geothermal systems, retrofitting large multi-residential or commercial buildings is considered expensive and is much less common.
3.3 Geothermal Building HVAC Circuit Geothermal building heating, ventilation and air conditioning (HVAC) circuits (inside one single building) can be designed as central building systems or dispersed apartment or suite systems.
In a central system, geothermal fluid is delivered to large central water-to-water (W/W) heat pumps located in the basement or lower levels of the building. These central heat pumps are connected to a return water pipe system that runs through the walls of the building to each suite. The water-to-water heat pumps operate in heating mode in winter and cooling mode in summer. In heating mode, warm water, typically 120°F, is delivered to fan coils, hydronic baseboard heaters or in-floor radiant heating systems located throughout the building. This heat distribution equipment is designed to be “geothermal system compatible”, accepting water at 120°F and efficiently and effectively heating the space. In cooling mode, cool water, typically 40°F is delivered to the fan coils or other cooling equipment, also designed to geothermal system standards. If the building has a two-pipe system of thermal water distribution, then the whole building is switched from heating mode to cooling mode and back again in the spring and fall. Individual suite occupants can control their temperatures within a range of heating or a range of cooling but cannot induce heating in the cooling season or vice versa. If the building has a four pipe system, then the suite occupants can have complete control of heating or cooling temperatures at any time during the year.
A dispersed geothermal building circuit system consists of a return water pipe system (two pipe system) installed in the walls of the building, which delivers water to water-to-air (W/A) heat pumps located in each suite throughout the building. Geothermal fluid from the geothermal ground circuit is either directly circulated through the building pipes or a central heat exchanger is installed to isolate the geothermal ground loop circuit from the building geothermal water circuit. In either case the temperature of the water circulating throughout the building is the ambient temperature that the geothermal system delivers directly from the ground. The heat pumps in each suite are controlled independently to deliver the amount of heating or cooling desired by each occupant. Heating can be delivered to one suite, and cooling to another, simultaneously.
Geothermal building circuit systems are designed specifically to operate at low temperature system standards. This means that pipe diameters, pipe insulation, fan coil and heat pump equipment are all specified to work effectively with geothermal system low grade temperatures, typically 120°F.
3.3.1 Conventional Heating and Cooling Conventional HVAC systems, installed in commercial and multi-residential buildings, consist of heating equipment, often a natural gas fed boiler and cooling equipment, often electrically driven chillers, or in some cases cooling towers. Make up air and ventilation systems require heat to warm the fresh air being drawn into

GEOTHERMAL COMMUNITY ENERGY STUDY
April 2011 Report No. 10-1151-0403 18
the building. This central building HVAC equipment is bulky and requires space in the basement of the building and on the roof top, where noise can be a major issue. Domestic hot water requires a second boiler.
Water pipes often run through the walls of large buildings, delivering hot or cold water to fan coils or other types of thermal distribution equipment, strategically located throughout the building. Two pipe HVAC systems are switched seasonally from heating to cooling with limited in-suite temperature controls. Four pipe HVAC systems deliver hot water and cold water simultaneously to each suite, all year round, offering complete in-suite temperature control.
Conventional heating systems are typically designed to operate with input temperatures of 180°F. They cannot be operated effectively with lower input temperatures. Therefore to retrofit a building that has a conventional heating and cooling system to convert it to using geothermal heat includes the added expense of replacing interior building pipes and distribution equipment, central and dispersed, in addition to the expense of installing a bore field and converting central equipment. Alternatively, the geothermal system heat level needs to be increased from the efficient heat production level of 120°F to the building compatible level of 180°F. This can be achieved by “topping up” the geothermal system, using an electric, oil or natural gas fed boiler, to deliver the high grade heat required.
Many buildings built in the 1970’s when electricity was plentiful and inexpensive, were equipped with electric base board heaters and have no central HVAC system. In older buildings, air conditioning is often not present, or it is supplied by portable sleeve or window units, which plug into an electrical wall socket and are set in an open window or slid into a fitted opening through a wall. These units are usually very inefficient, noisy, create hot or cold drafts where sealing is not tight and are often not very effective.
3.4 Building System Design Integration The cost of a geothermal system is dependent on three main factors: the site, the geology and the building loads. The site and the geology cannot be controlled, however, investigating and analyzing their characteristics completely and accurately contribute to a geothermal design that maximizes the use of the resources available in the most efficient and effective way. Knowledge of the presence of groundwater and groundwater movement are critical to geothermal design.
Building energy load reductions, particularly peak load reductions, through energy efficient architectural design, are usually more cost effective than installing a larger geothermal system. Building envelope design and material choices which may or may not add capital cost, are now offset by additional geothermal system capital cost rather than the traditional higher operating costs that builders in the past, paid little attention to. Geothermal system designers may influence the approach of traditional architects and mechanical engineers, until they understand in detail the various options and costs and the cost implication to the geothermal system. Building site orientation, percentage of glazing, reduced wall penetrations; roof top space commercialization and vertical building conduits are only some of the building features that can greatly influence the heating and cooling loads of a building. Building energy computer simulation modeling4
4 U.S. Department of Energy provides free building energy modeling software called EE4 that can be downloaded and used by knowledgeable practitioners. EQuest is another commonly used building energy modeling tool. These modeling software analyses are accepted by the US Green Building Council supporting applications from building owners for LEED® Certification.
can help determine energy consumption and cost comparisons, between a reference building built to current standards, with a traditional energy supply and the
GEOTHERMAL COMMUNITY ENERGY STUDY
April 2011 Report No. 10-1151-0403 19
same building built to the same standards, with geothermal energy supply. By running multiple iterations of the model we can determine the magnitude of energy saving and cost implications of various options, seeking cost and energy efficiency optimization.
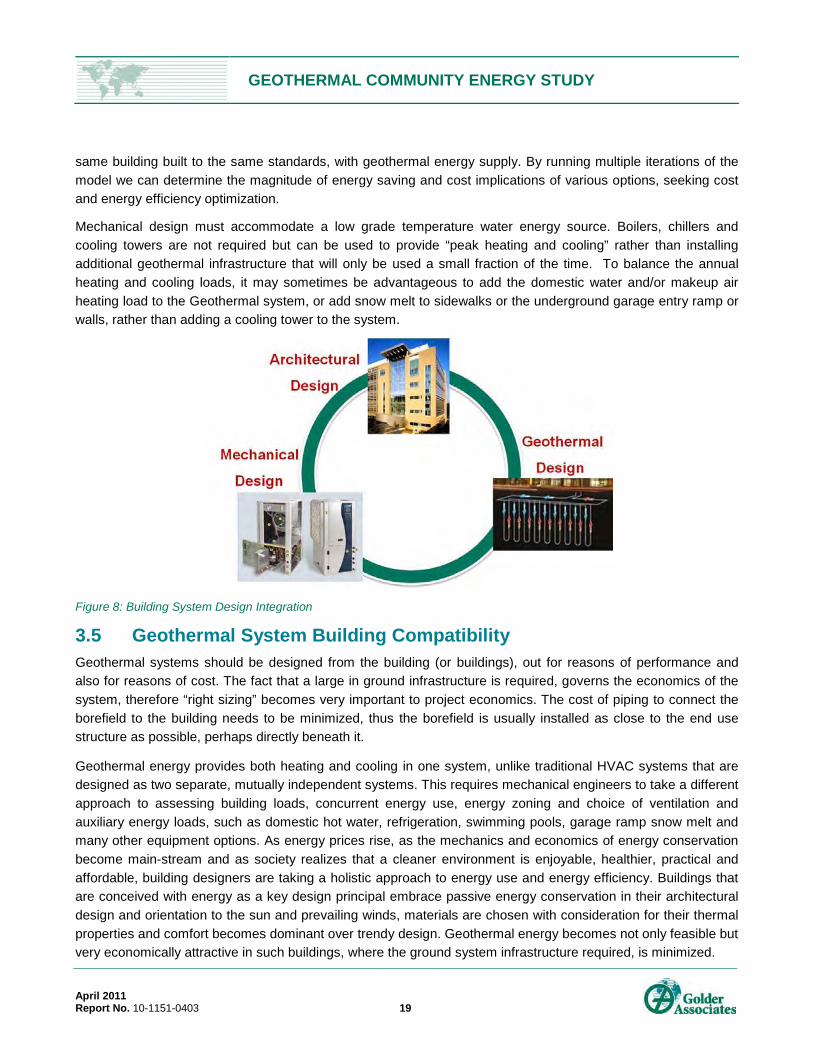
Mechanical design must accommodate a low grade temperature water energy source. Boilers, chillers and cooling towers are not required but can be used to provide “peak heating and cooling” rather than installing additional geothermal infrastructure that will only be used a small fraction of the time. To balance the annual heating and cooling loads, it may sometimes be advantageous to add the domestic water and/or makeup air heating load to the Geothermal system, or add snow melt to sidewalks or the underground garage entry ramp or walls, rather than adding a cooling tower to the system.
Figure 8: Building System Design Integration
3.5 Geothermal System Building Compatibility Geothermal systems should be designed from the building (or buildings), out for reasons of performance and also for reasons of cost. The fact that a large in ground infrastructure is required, governs the economics of the system, therefore “right sizing” becomes very important to project economics. The cost of piping to connect the borefield to the building needs to be minimized, thus the borefield is usually installed as close to the end use structure as possible, perhaps directly beneath it.
Geothermal energy provides both heating and cooling in one system, unlike traditional HVAC systems that are designed as two separate, mutually independent systems. This requires mechanical engineers to take a different approach to assessing building loads, concurrent energy use, energy zoning and choice of ventilation and auxiliary energy loads, such as domestic hot water, refrigeration, swimming pools, garage ramp snow melt and many other equipment options. As energy prices rise, as the mechanics and economics of energy conservation become main-stream and as society realizes that a cleaner environment is enjoyable, healthier, practical and affordable, building designers are taking a holistic approach to energy use and energy efficiency. Buildings that are conceived with energy as a key design principal embrace passive energy conservation in their architectural design and orientation to the sun and prevailing winds, materials are chosen with consideration for their thermal properties and comfort becomes dominant over trendy design. Geothermal energy becomes not only feasible but very economically attractive in such buildings, where the ground system infrastructure required, is minimized.

GEOTHERMAL COMMUNITY ENERGY STUDY
April 2011 Report No. 10-1151-0403 20
3.5.1 New Development Geothermal systems are ideal for new development. Land is not yet covered, surfaces are not landscaped or used and the best opportunity to access the ground exists. Original HVAC equipment can be specified without consideration for residual life, compatibility or vested financial interests that may not accept disproportionate capital vs. operating costs. In the early stages of architectural design, a discussion of geothermal energy can lead to accommodation for borefield installation, a room in the basement for the geothermal headers to be brought into the building and central pumping and heat exchange equipment to be housed, space for over-sized ductwork can be allowed in ceilings and floors and rooftops, no longer needed to hold heavy and noisy HVAC equipment can be redesigned as premium amenity or penthouse space. Permitting and construction schedules can be planned to include geothermal system design and installation and the developer/owner and project architects can select and direct design team members to accept, cooperate and accommodate the inclusion of geothermal energy as an integral part of the design and build process.
3.5.2 Existing Building Retrofit Retrofitting existing buildings to accept geothermal energy is often more difficult and more expensive, compared to installations in new development. Building Codes as they are amended have increased the required levels of energy efficiency over the past 15 years, which means that buildings built 20, 30 or more years ago, require much more energy to be comfortable. Older buildings usually require larger geothermal systems, increasing the capital cost per square foot of occupied space, by as much as 50% more than buildings built today.
On existing building sites, land is often not available in which to install a geothermal borefield. In many cases, subterranean garages lie beneath what small landscaped green space there is. Real estate is increasingly expensive and surface land that does exist is often being held for future development. Intensive drilling is intrusive and will destroy landscaping. Trees are valued and not to be damaged or disturbed. In some urban neighbourhoods, school playgrounds, parks, laneways and other designated open spaces are being used as surrogates for geothermal borefields that serve adjacent existing buildings, while providing a new source of income from rental of the property.
If a building does not have a set of return hydronic pipes running though its walls or if the pipe system that does exist is corroded and unserviceable, it is very difficult to install new pipes in an old building. Either walls have to be opened up for pipe installation or in some cases, “skinning the building” or installing an energy efficient outer shell over the existing building, provides a weather tempered cavity in which pipes can be installed outside the original building envelope. Both options are expensive, however if the building requires this remediation in any case, then the incremental cost cannot be attributed to the cost of a geothermal system.
Conventional building boiler systems run at high grade temperatures, circulating hot water to fan coils designed to run on water at 180°F. If the boiler is replaced by geothermal water to water heat pumps, water can only be produced efficiently to about 120°F, which means that the boiler is still required to boost the temperature or the fan coils in each suite must be replaced with new low-grade heat compatible units.
Electrically heated and cooled buildings can be impossible to retrofit with geothermal energy. These buildings have no hydronic pipe system, no ductwork and the wall and ceiling cavity space is not large enough to retrofit.
Each building must be considered individually for its architectural, mechanical, site and condition. Where buildings are to be remediated anyway, geothermal energy may be a good option.

GEOTHERMAL COMMUNITY ENERGY STUDY
April 2011 Report No. 10-1151-0403 21
4.0 SCALABILITY OF GEOTHERMAL SYSTEMS Geothermal systems are highly scalable. The ground everywhere on the earth contains heat below the frost line that can be retrieved and used to heat and cool buildings built on the surface. Limitations are thermal conductivity of the ground, surface land area available, system design and equipment and economical feasibility.
Geothermal systems can be designed to extract small amounts of energy from the ground or can be configured in large and sometimes complex pipe networks. They can be designed to provide all the heating and cooling a building needs or they can be designed to provide only a portion, with other sources of energy, renewable or fossil fuel, providing the balance.
In its smallest and perhaps simplest form a stand-alone geothermal system can supply a single residential home. It will be comprised of only one or two boreholes or a horizontal piping system laid in a trench approximately 4 to 8 ft. deep, in a back yard connected to a residential “geothermal furnace” or water to air heat pump located in the basement or utility room which blows warm or cool air through ductwork into the house as required.
Several houses may be connected to a network of several boreholes placed near each other in a common plot of land, such as a park or green space. Or a larger central plant, fed by a commercial sized borefield, can supply worm and cool water through a “thermal grid” installed under the streets and connected to several hundreds of houses in a neighbourhood.
Commercial, institutional and multi-residential buildings, whether low, medium or high rise, can be served by geothermal systems, with tempered water circulating directly from the borefield to heat pumps located in each individual townhouse or suite or alternatively, there may be a central pumping and heat exchange mechanical station installed which heats or cools the geothermal fluid and sends it to each unit at the desired temperatures.
Whole campuses or downtown corridors of commercial and multi-residential buildings can be connected to one central energy plant, usually located in a separate building for better access and control. Multi-building energy systems are often referred to as a District Energy Systems (DES). DES can use any fuel as their source of energy, including natural gas, oil, propane, biomass, wind and solar energy as well as geothermal and can be configured as hybrid systems, to achieve the desired energy production at the least cost.
The basic physical principals of geothermal energy and ground thermal conductivity apply to all geothermal systems, to be adapted to the ground conditions and the needs of the buildings to be served. The more complex a system, the more engineering and detail design that is required. The following cases are examples of geothermal system designs of various sizes, which produce both heating and cooling.
Figure 9: Community Geothermal District Energy, Gibsons, BC

GEOTHERMAL COMMUNITY ENERGY STUDY
April 2011 Report No. 10-1151-0403 22
Table 1: Examples of Scalability of Geothermal Systems
Capacity Use & Location
Occupied Space Geothermal System Design
3 tons
Single family home, Guelph, ON (2004)
1,990 ft2
2 boreholes – 320 ft. deep, connected to a single water-to-air geothermal heat pump which circulates heated and cooled air through an air ductwork system.
65 tons
Walden Public School, Lively, ON (2009)
46,286 ft2
40 boreholes – 320 ft. deep, connected to 5 - 15 ton water-to-water geothermal heat pumps which circulate heated water to a hydronic in-floor heating system. Heat from solar thermal panels installed on the exterior gymnasium wall is deposited into the geoexchange borefield to balance it, ensuring sustainable borefield heat production.
235 tons
Strata Condominium, Burlington, ON (2010)
194,000 ft2
78 boreholes - 580 ft. deep, connected to central water to water heat pumps which extract (deposit) heat from (to) the geothermal ground loop circuit and exchange it to the building mechanical circuit connected to in-suite water to air heat pumps, which in turn temper the in-suite air according to individual temperature controls.
2000 tons
University of Ontario Institute of Technology, Oshawa, ON (2004)
1,000,000 ft2
384 boreholes drilled 700 ft. deep, connected to a central energy plant with hybrid natural gas fed boilers. District energy supplies 8 university buildings, including library, residences, lecture buildings and administration.

GEOTHERMAL COMMUNITY ENERGY STUDY
April 2011 Report No. 10-1151-0403 23
Capacity Use & Location
Occupied Space Geothermal System Design
4780 tons
Waterfront, Louisville, Kentucky (1976, 1986)
1,614,640 ft2
City Core commercial and multi-residential buildings, 4 open-loop bore holes drilled 132 ft. deep, tap into the Louisville aquifer extracting 10.4 cu. meters of water per minute which, after extracting heat, is released into the adjacent Ohio River.
13368 tons (geo only)
Municipal District Energy System, Lund, Sweden (1986)
5,005,000 ft2
1 borehole, 2625 ft. deep, extracts natural hot 70°F underground water which supplies 40% of the city’s heat demand from 2 central geothermal plants. Heat pumps increase the water temperature to 180°F before distribution. District cooling is supplied from a separate geothermal borehole, heat pumps and distribution pipes, delivering cold water at 40°F, with waste heat fed into the geothermal heating system. The additional 60% of the city’s heat demand is met by a combination of biomass and gas turbine co-generation, gas, oil and electrical boilers and hot and cold water storage tanks.
For more information, refer to Appendix B: Case Studies.
5.0 GEOTHERMAL SYSTEM DESIGN 5.1 Thermal Conductivity of the Ground Geothermal boreholes interact with the surrounding earth and bedrock, exchanging heat according to the thermal conductivity of the ground into which they are installed. Boreholes penetrate several layers of different types of rock and encounter ground water and sometimes aquifers that can have a very low or a very high flow rate. The overall thermal conductivity of a borehole can be tested and measured by drilling and installing a test borehole to the expected depth and at the expected borefield site, and by injecting pre-heated water to flow through the constructed borehole for a period of 48 to 72 hours. Instrumentation and computer software is used to precisely measure and record the entering and exiting water temperatures, to determine the amount of heat dispersed by the borehole into the ground and to calculate the thermal properties of the ground. Ground

GEOTHERMAL COMMUNITY ENERGY STUDY
April 2011 Report No. 10-1151-0403 24
conditions can be consistent over large areas or can differ only a few feet apart. Test boreholes and thermal conductivity tests are necessary to measure the specific ground condition.
A borefield must be designed to either allow each bore hole to interact with the ground independently or to force each borehole to interact with the thermal conductivity of the surrounding boreholes. In either case the space allowed between the boreholes is critical. Boreholes interacting with each other can be placed in a grid formation, as close as 12 feet apart and boreholes acting independently can be placed as much as 30 feet apart either in a grid or in a line. The surface land area available for installation of a borefield can only sustain as many boreholes as can be installed without exhausting the thermal resources at the site.
5.2 Borefield Balance and Sustainability If heat is held in the ground and not dispersed by flowing ground water, then on an annual basis, the same amount of heat can be extracted from the ground, as is rejected back into the ground, without “cooling down the ground” over time. The ground acts like a rechargeable battery. This is also true, for cooling. A geothermal system can inject heat into the ground, to the extent that it is extracted again, on an annual basis, without “heating up the ground” over time. This is called Balancing the Borefield. Systems that are not balanced over years of operation will gradually lose their capacity to heat or cool.
Figure 10: Balanced annual cycle of heating and cooling in a borehole
5.3 Land Area Modern equipment can drill to depths of thousands of feet. Inserting geothermal loops to great depths is more limited both physically and mechanically.
To a depth of 600 feet, 1 ¼ inch diameter (OD) HDPE pipe with a diameter to side thickness ratio of 11:1 (SDR11) has enough strength to resist the fluid pressure. Loops certified to geothermal standards are pressure tested to levels that are 5 times higher than the system is designed to run at. Beyond depths of 600 feet, thicker

GEOTHERMAL COMMUNITY ENERGY STUDY
April 2011 Report No. 10-1151-0403 25
walled and larger diameter pipe and larger diameter boreholes which take larger volumes of grout, are required. So there is an incremental cost increase per vertical foot, for boreholes installed to depths greater than 600 feet. If greater volumes of thermal energy are required, than the optimal spacing of 600 foot deep boreholes will allow, this added incremental cost of drilling deeper needs to be evaluated against the cost of additional land.
As the depth of the borehole and the diameter of HDPE pipe increases, the pipes become more rigid. Boreholes are usually drilled relatively straight, though the cut rock walls can be rough and jagged. Boreholes can be drilled on an angle to purposely disperse the borehole bottoms. New drilling equipment can drill multi-directionally, turning corners and prescribing arcs. In these cases, inserting the ‘u-bend’ loop and grouting, becomes mechanically very difficult if not impossible.
Common practice for geothermal system installations is to drill up to 600 feet deep with average borehole spacing of 15 to 25 feet depending on bedrock geology, hydrogeology and thermal design of the borefield.
5.4 Geothermal System Design Decisions Building heating and cooling loads are rarely balanced. Commercial buildings tend to be cooling dominant, even in northern US climates, requiring more cooling consumption on an annual basis than heating consumption. Multi-residential buildings designed to updated building codes, are often more balanced though in the Charles County area they are also cooling dominant.
The peak loads, that is, the amount of heat required in the coldest hour of the coldest day of the year compared to the amount of air conditioning required in the hottest hour of the hottest day of the year, are also not often similar. In geothermal system design, energy consumption capacity is controlled by balancing the loads of the buildings and by balancing the bore field thermal volume capacity through bore field design. Peak capacity is usually controlled with mechanical equipment design and configuration.
District energy systems, serving a variety of building types are often easier to balance because of the variety of heating and cooling needs. For example, when a cooling load, such as an ice rink is near a heating load, such as a swimming pool the heat can be used twice before returning to the ground significantly increasing the coefficient of performance of the aggregate system.
Geothermal systems can be integrated with other sources of thermal energy, such as natural gas or oil boilers, electrical chillers, cooling towers, biomass digesters and others to form hybrid geothermal systems. The capital cost of the infrastructure of a geothermal system is much larger than the variable operating cost. Conversely, the capital cost of equipment for other thermal energy sources is much smaller than the variable operating cost, which includes the cost of fuel and feedstock that is consumed. However, if peak capacity is only used a fraction of the time, it often does not make economic sense to install costly geothermal system infrastructure, which will not be used to full capacity. In this case, a relatively cheap natural gas boiler can be installed to be operated only on extreme heating days. Or a chiller can be installed, similarly operated only on extreme cooling days. Geothermal energy satisfies the base loads, in order to keep the aggregate operating costs of a hybrid geo system as low as possible.
Analysis of typical commercial and multi-residential buildings, indicate that a geothermal heating and cooling system, designed to supply only 40% of the peak capacities required, delivers approximately 67% of the total thermal energy consumption required. This ratio of capacity to consumption can be analyzed in detail for each

GEOTHERMAL COMMUNITY ENERGY STUDY
April 2011 Report No. 10-1151-0403 26
specific system being designed to determine the optimal energy source mix that will produce the best economic life cycle cost (LCC) outcome.
The following cases are examples of geothermal system designs of various sizes, which produce both heating and cooling.
6.0 GEOTHERMAL SYSTEM PROJECT DEVELOPMENT CYCLE A Geothermal project development cycle is similar for new construction buildings and for retrofitting existing buildings.
Stage 1: Early Concept Project identification – property ownership, developer, architect, consultants – environmental,
geotechnical, mechanical, structural, landscaping, etc.
Project concept and objectives – architectural renderings, defined uses (occupied floor space and use designation: commercial/institutional/residential/recreational/industrial), site layouts, hierarchy of energy objectives, level of redundancy required, hierarchy environmental objectives, LEED® certification
Site survey review – Scaled site plan: location, access, site parameters, boundaries, uses, services, etc.
Stage 2: Geothermal System Feasibility Study Pre-feasibility to detail feasibility, depending on project scale and owners preference
Site assessment – geotechnical report, geology maps and reports, hydrogeology and surface water investigation, existing and planned infrastructure (mines, quarries, transportation tunnels, pipes, other). Geoexchange system strategy formed (open-loop, closed-loop, etc.)
Test borehole(s) drilled and installed, Thermal Response Test (TRT) and report (can be delayed to confirm before final design, if reliable and complete information exists)
Building design assessment – for new construction, computer building energy simulation model performed, energy efficiency analysed – for existing buildings, design drawings, utility bills, and equipment specifications are used, energy efficiency improvement opportunities analysed.
Order of magnitude sketch of potential geoexchange strategy and system design parameters
High level budget cost, cash flow, energy and cost savings, building space savings and enhanced use, life-cycle cost analysis, government incentives, payback, noise reduction, comfort control flexibility, construction schedule impact, GHG emission reduction
Go/No Go decision
Stage 3: Project Design Integration & Engineering Architectural design, Mechanical system design, Geothermal system design

GEOTHERMAL COMMUNITY ENERGY STUDY
April 2011 Report No. 10-1151-0403 27
Cost benefit analysis of building energy efficiency and design options (% glazing, space between floors, vertical risers, economic and environmental use of roof top space, basement geo pumping station placement and space allocation vs. mechanical boiler room)
Cost benefit analysis of HVAC/geo system options (100% geo vs. hybrid, elimination of boilers, chillers, cooling towers, ventilation alternatives i.e. HRV, MUA, ERU, minimizing ductwork, etc.)
For existing buildings, existing design drawings are used and design integration involves deciding which building HVAC equipment to keep and which to replace.
Detail mechanical and geo engineering and design drawings, permitting
Detail project costing and detail geothermal system cost/benefit report
Stage 4: Construction Drilling prior to excavation or after, least public disruption considered
Horizontal tie-in to building
Installation of central pumping station, control system (connected to building automation, central remote control, etc.)
Start-up testing, adjustments, commissioning
Stage 5: Operations Monitor and verify operations
Regular maintenance schedule
Repair and replace mechanical equipment as required

GEOTHERMAL COMMUNITY ENERGY STUDY
April 2011 Report No. 10-1151-0403 28
7.0 GEOTHERMAL SYSTEM PROJECT FINANCIAL CYCLE Geothermal systems are similar to other construction projects in that they require concept and project development, feasibility analysis, and a Go/NoGo decision. However design integration is an extra critical step that takes coordination and the willing collaboration of the design team. Geothermal system efficiency and effectiveness is dependent on the ground conditions and on the energy consumption of the buildings it supplies, and must be designed with consideration for not only the large capital cost, but also for capacity and consumption that will balance and sustain the system’s performance for its useful life.
The borefield infrastructure which accounts for approximately 80% of the capital cost of the system is considered to have a life of 50 years and beyond. Artificial and computer aging tests of HDPE pipe suggests that it will last hundreds of years before it eventually breaks down. The loops are grouted into the boreholes and carry a continuous flow of a weak ethanol and water solution, so there is no abrasion, no corrosion, no mechanical movement or exposure to weather or extreme temperatures to cause pipe damage or deterioration. The grout remains viscose and will absorb weak earth tremors.
Table 2: GeoExchange System Project Financial Cycle
Project Development Pre-Construction Construction Operations
Early Concept Feasibility Study Go/No Go Design Integration Engineering Sub-contracting Construction Own & OperateProject identification
Site Assessment Test borehole (s) TRT
Information & recommendation preparation and presentation
Architectural, mechanical, geo design integration
Architectural detail drawings, permitting
Construction scheduling, geo process integration
Project management, construction site integration
M&V - monitor and verify
Project concept and objectives
Building Design Assessment - computer builidng energy simulation
Board, committee, owner approval
Cost benefit analysis building energy efficiency, system options
Mechanical detail drawings for builidng permitting
Drilling, Horizontal tie-ins, Pumping station installation
Drilling, horizontal tie-in
O&M - operations (electricity) and maintenance (minimal for geo-circuit)
Site Survey Review Geoexchange strategy development - borefiled sized
Final borefield sizing, balancing and design
Geothermal system design, drawings for building permit submission
Geo equipment contracting
Central pumping equipment installation
Capital Reserve (95% CC - 50 year life, 5% CC - 20 year life, 3% inflation)
High level budget & cost benefit analysis
Architectural, mechanical, geothermal equipment specified
Pressure testing Startup, testing Commissioning
P&I (t,%) RESA Fee - Renewable Enery Supply Agreement
PersonnelStaff Staff & Geo
ConsultantManagement (staff, geo consultant)
Architect, mechanical & geo design consultants
Project manager, architect, mechanical & geo design consultants
Project & Construction manager, mechanical & geo design consultants
Project & Construction manager, mechanical & geo project managers
Staff
Typical 200T Geo Project Cost:Internal $50K $10K $20K $100K $15K $800K $105K/yr
(electricity, COP 3.5)$60K $80K $180K $195K $995K $20K/yr (maintenance)
$50K (capital reserve)Project Capital Cost Allocation:0% 5% 6% 8% 18% 20% 100% 10%/yr
2%/yr5%/yr

GEOTHERMAL COMMUNITY ENERGY STUDY
April 2011 Report No. 10-1151-0403 29
Energy savings and energy cost savings are considered offsets, to the capital cost. Financial value should also be given to real estate space that becomes commercially available with the installation of a geoexchange system, such as roof tops and additional parking spaces, where conventional HVAC equipment is no longer required. The following is a list of values created by installation of a geoexchange system:
Significantly lower operating costs; no fossil fuels, less electricity, lower maintenance, free or cheap hot water;
Reduced environmental impact, no combustion;
Quicker sales and higher rental rates;
Lower vacancy rates;
Higher real estate value;
More saleable real estate space with the same building cost and structure;
Durable; 80% of the capital cost is infrastructure that has a useful life of 50+ years;
Mechanical equipment is non-combustive and not exposed to weather, has a useful life of 20+ years;
Non-depleting resource - ground energy is never depleted; even if a building is demolished, the ground energy still exists and continues to supply the next generation structure;
Design flexibility and scalability – installation configurations available are widely variable and can be built out as required; and
Increased comfort and control.
8.0 DESIGN BUILD GEOTHERMAL SYSTEM RESOURCES AND CAPABILITIES REQUIRED
Geothermal system installations have evolved into standard technology. Geo engineering, both below ground and above, is a growing area of specialization. A large number of highly competitive manufacturers offer a wide variety of equipment that carries standard manufacturer warranties. The challenge is keeping up with the demand, which is moving to ever broader applications.
8.1 Geothermal Design and Engineering There are few geothermal theory or design courses taught in most university engineering programs today though there are a few notable exceptions. Several principals of geothermal system design are contrary to conventional engineering principals taught in standard mechanical engineering classes. Understanding building zoning, various types of energy load factors, concurrent heating and cooling processes, heat pump and desuperheater equipment types and operations, static and dynamic thermal conductivity and numerous other topics, are not
GEOTHERMAL COMMUNITY ENERGY STUDY
April 2011 Report No. 10-1151-0403 30
standard engineering subjects. Geothermal energy is a growing field in which universities are showing a growing interest. In Canada, two professors, Dr. Marc Rosen5, University of Ontario Technology Institute, Oshawa and Dr. Philippe Pasquier6
In the United States, Oklahoma State University is among the leaders in researching and developing the geothermal industry and has been at it since 1974. International Ground Source Heat Pump Association, IGSHPA , is a non-profit organization established in 1987 to help advance ground source heat pump technology. IGSHPA is headquartered at Oklahoma State University where they can take advantage of the incredible state-of-the-art facilities the campus has created for research and installation training. Please see Appendix C for a list of IGSHPA members located in Charles County and also in the State of Maryland.
, École Polytechnique, Montreal are pre-eminent, studying thermal conductivity of geothermal boreholes of different designs. Working independently, their published research books and papers are furthering the science of ground thermal conductivity and borehole design.
Some engineering firms, or in some cases individual practitioners, specialize in geothermal design. These firms and individuals are often known by reputation and by equipment suppliers and manufacturers, who are in touch with them regularly. Many mechanical engineering firms that have not designed in ground systems previously take the approach that engineering a geo system is basic and does not require previous experience. ASHRAE standards prescribe system installation however; no system is standard and as with any highly technical area of expertise, only experience can provide the knowledge required to adapt designs with reliability. Software used, industry best practices and the principals of geothermal system design integration are usually learned from others with geothermal project experience. Geo system design components are highly dependent, so that one less than optimal ground design specification can add significantly to overall capital cost and impairment of system performance. Seeking out reputable, proven and experienced geothermal system designers will reduce design and installation risk significantly.
There are a large number of applicable geothermal system and installation standards and published case studies highlighting best practices. (Refer to Section 9.1, Standards and Permits)
8.2 Drilling Geothermal drilling is highly specialized. New geothermal drill rigs of the type commonly used to drill 600 feet deep and more, cost approximately $500,000 each and there is up to a six month lead time for delivery. They are highly automated and are operated by one trained operator, controlling several functions at one time from wireless remote controllers mounted on a tripod or on a waist belt.
Drill rigs are operated all year around. Extreme cold can hinder mechanical and human operations, but frozen ground is usually not an issue. Drill rigs, well maintained and operated competently, can drill one 600 foot borehole per day. Crews should be able to immediately insert a loop and grout it the same day.
Boreholes to depths beyond 600 feet are possible, with more sophisticated drilling equipment, which is available in the US. These machines cost approximately $750K to $1 mill. each. Depths up to 1200 feet are feasible but would require larger diameter and stronger (higher pressure rating) HDPE piping, which by nature is more rigid.
5 Marc A. Rosen, Ph.D., P.Eng. Professor, Faculty of Engineering and Applied Science University of Ontario Institute of Technology 6 Philippe Pasquier, Ph.D.,ing., Professeur adjoint, Département des génies civil, géologique et des mines, École Polytechnique de Montréal

GEOTHERMAL COMMUNITY ENERGY STUDY
April 2011 Report No. 10-1151-0403 31
Figure 11: Geothermal Drill Rig in Operation
Borehole diameters need to increase to accommodate the larger loop diameters. Loop installation techniques and equipment required to install this different pipe, is also different. However the energy production of the longer, larger boreholes may offset the added costs, making a scaled up system more cost effective. Large diameter boreholes exist in many installations around the world, and engineering knowledge of these systems is a specialty, but it does exist.
Older drill rigs are like any older machinery; they are temperamental and require maintenance. They require a crew of 3 to 4 people to operate continuously. Equipment breakdowns can be costly to drilling firms and to project construction schedules. It is critical to have drilling equipment on each project which is designed to drill the existing overburden and rock formation. A rig designed to drill granite is not easily converted to drill shale and vice versa. If casing is required, some machines install and extract casing as a continuous part of the borehole installation.

GEOTHERMAL COMMUNITY ENERGY STUDY
April 2011 Report No. 10-1151-0403 32
Drillers tend to work within a local region, unless the job is large enough and pays additional mobilization and accommodation fees. In some markets, drillers are plentiful and highly competitive. In others, they are scarce or booked solidly for months to come. When work demand is high some drillers will lease rigs from out of state or will subcontract to smaller drilling firms, however, leasing a drill rig is one thing but finding experienced skilled drillers or managing less experienced drillers is very difficult and can become a constraint to expanding operations. Each drill rig requires significant support equipment and skilled personnel to install the loops and mix and install grout. This is further constraint for expanding operations.
Drillers, particularly in northern climates, work in harsh conditions. Health and Safety Plans are essential for drilling operations. Loud noise, water and mud are constant daily working conditions. Drillers need integrity and a sense of responsibility for the performance of the systems they install.. It takes experience to develop a high degree of sensitivity to widely varied ground conditions and anomalies. Managing ground water and site surface conditions can be difficult, particularly in cold or wet weather. Working as a trade on a complex construction site, requires safety training and vigilance, supervision by the construction manager and integration with the other trades on the site which can create tight deadlines for work that is sometimes unpredictable. Water well drillers will often take on geothermal drilling jobs assuming that there are few differences. However, successful installation of a commercial geothermal system requires specialized equipment, training and supervision.
8.3 Building Science & Mechanical Geothermal System Engineering Knowledge and understanding building energy efficiency has grown significantly over the past 10 years. LEED and Energy Star building standards have been developed and the science of “green buildings” has become main stream for new building design. The Charles County Building Code is continually improving, with incremental steps occurring from time to time. Government and utility incentive programs are often designed to accomplish very specific objectives over very specific time periods, often related to political terms of office and budget periods. Engineers learn techniques to achieve these goals while making the project economically feasible within the specific government rebate program.
All of these activities have influenced change and engineers must constantly engage in learning to stay current. Traditional mechanical engineering still comprises the majority of the work and not every engineering firm or individual is willing to invest in change. However, those that do tend to build practices around these new sciences, gaining experience and leveraging industry contacts.
Increasingly mechanical firms are accepting these changes. However that is only the first step. Understanding new concepts of building energy management requires new assumptions and calculations, learning and acceptance of new mechanical equipment and systems, new software programs and new approaches to design.
Mechanical engineering firms with geothermal heat pump system design experience exist but they are currently a minority and should be qualified by third party references and referrals.
8.4 Geothermal Heat Pumps and Mechanical Equipment Geothermal heat pumps are manufactured by numerous competitive firms based in Canada, the US, China and Europe. Some of the more common manufacturers are:
WFI – Water Furnace Inc.
Climatemaster

GEOTHERMAL COMMUNITY ENERGY STUDY
April 2011 Report No. 10-1151-0403 33
Whelan;
Trane;
McQuay; and
Comfort Solution Systems Inc. (CGC patented, hybrid, low electricity heat pumps).
As larger and more dedicated use geothermal systems are designed, configurations incorporating multiple equipment technologies are becoming increasingly common. Industry experience is still growing rapidly in North America and integration of other renewable energy sources, such as solar thermal, solar PV and micro wind makes more sense as energy prices increase.
Tapping into heat sources other than ground source heat is also becoming more attractive economically and technically. “Slim Jim” heat exchange fins can be installed in lake beds or rivers. Waste heat can be recovered from sewer pipe systems or industrial processes. Geothermal loops can be embedded in concrete slabs or installed below asphalt to melt snow, or dump heat into underground parking garages, or conversely to extract heat from the ground, through concrete pillars installed for structural support.
Tunnels make excellent conduits for geothermal piping and the environmentally friendly trend to densification of urban development is creating numerous new underground transportation tunnel opportunities. We are learning to use any heat resource available to us in creative and economical ways, often in combinations designed to augment or better balance borefields, or to cut costs.
HDPE geothermal loops and piping are manufactured by several suppliers which usually drop ship directly to the job site. Loops, as they are referred to are usually prefabricated to the length desired, u-bends are factory fused, and the loops are factory pressure tested to 200 psi before shipping. Finished loops are coiled onto wooden spools, ready for installation at the site. ISCO Industries, LLC7 in Louisville KY is one geothermal loop manufacturer and they have two sales representatives located in Maryland. Blue Diamond Industries, LLC8
8.5 Controls and Building Automation Systems
in Lexington, KY is another geothermal pipe manufacturer.
Sophisticated information technology (IT) is available off-the-shelf or custom designed, to sense, monitor and report the complete operations of any geothermal system through web based data transmission. No personnel is required other than, from a remote location, to respond to signals of system irregularity or fault. Local technical service companies can provide quick response service on site, 24 hours a day, if required.
Geothermal systems operate continuously, night and day to create the desired thermal condition in the building. When connected to a building automation system, they can work in sync with other building systems. Ancillary equipment, such as domestic hot water heating and swimming pools can also be controlled automatically. As time-of-use electricity billing becomes more common, automated controls can cycle heating and cooling to take advantage of off peak pricing. In turn this also helps reduce the peak load demand on the provincial and local hydro grid.
7 ISCO Industries LLC, http://www.isco-pipe.com/home.aspx 8 Blue Diamond Industries LLC, http://www.bdiky.com/index.php

GEOTHERMAL COMMUNITY ENERGY STUDY
April 2011 Report No. 10-1151-0403 34
9.0 GOVERNMENT REGULATIONS, CERTIFICATION AND INCENTIVES 9.1 Standards and Permits Extensive, very specific engineering standards exist to prescribe best practices for installation of heat pump equipment and systems in various configurations. The Air Conditioning and Refrigeration Institute (ARI), the American Society of Heating, Refrigeration, Air-conditioning Engineers, Inc. (ASHRAE) and the International Organization for Standardization (ISO) all publish standards and best practices guidelines, handbooks, articles and training, which are used by professional engineers and cited in various Building Codes.
Two of the most widely used sources of detail design standards are published by ASHRAE and most other standards refer to these:
• (ASHRAE, 1997) Ground-Source Heat Pumps – Design of Geothermal Systems for Commercial and Institutional Buildings – Chapter 5. In ASHRAE Handbook-Fundamentals, Atlanta: American Society of Heating, Refrigerating and Air-Conditioning Engineers, Inc, 1997.
• (ASHRAE, 2003), Geothermal Energy- Chapter 32. In 2003 ASHRAE HVAC Applications Handbook, SI Edition, American Society of Heating, Refrigerating and Air-Conditioning Engineers, Inc., 2003.
The Charles County Building Code Act (BCA) and the Charles County Building Code (CCBC) which govern the construction of new buildings and the renovation and maintenance of existing buildings is administered by the Codes, Permits and Inspection Services Division of the Planning and Growth Management Department. Charles County has adopted the International Building Code/2009, International Mechanical Code/2009 and the International Energy Conservation Code/2009 as amended by periodic supplements and Charles County Bill No. 2010-08 and the International Residential Code/2009 as amended by periodic supplements and Charles County Bill No. 2010-08.
Two municipalities exist within Charles County, La Plata and Indian Head and each have their own separate Building Code and building permitting procedure.
It is through Building Codes and Municipal Building Permits and Inspections that geothermal system installation standards and practices can be regulated. In many Municipalities, geothermal system engineering drawings (G-0 series) are required to be submitted with applications for building permits whether for new construction or for retrofitting an existing building.
9.2 Training and Certification The International Ground Source Heat Pump Association (IGSHPA)9
Several Geothermal Installation Standards Manuals are available for purchase online. IGSHPA offers certification, however it is voluntary. IGSHPA members are listed in a searchable online directory. Please see Appendix C for a list of IGSHPA members in based in Charles County MD and also for Maryland State.
is one of the primary training and certification organizations in the US. IGSHPA is a non-profit, member-driven organization established in 1987 to advance ground source heat pump (GSHP) technology on local, state, national and international levels. Headquartered on the campus of Oklahoma State University in Stillwater, Oklahoma, IGSHPA utilizes state-of-the-art facilities for conducting GSHP system installation training and geothermal research.
9 International Ground Source Heat Pump Association (IGSHPA), http://www.igshpa.okstate.edu/index.htm

GEOTHERMAL COMMUNITY ENERGY STUDY
April 2011 Report No. 10-1151-0403 35
9.3 Incentives for Geothermal System Installation The State of Maryland has several financial incentives available for the installation of geothermal heat pump systems. In general they include a tax exemption for equipment, a grant rebate program, a property tax exemption on increased property values and a loan program. The electrical utility (SMECO) offers a rebate program for heating and cooling energy efficiency upgrades. Specific terms and conditions, dates for application and maximum program budgets are subject to change and should be reviewed regularly. Following are brief descriptions of the programs as stated on the Maryland State and SMECO websites.
9.3.1 Maryland State Incentives Maryland: Sales and Use Tax Exemption for Renewable Energy Equipment
Geothermal, wind and solar energy systems used to heat/cool a structure or provide hot water or electricity are exempt from Maryland state sales and use tax. Sales tax exemption for solar space/water heaters, solar thermal electric, solar panels, wind systems, and geothermal heat pumps.
Maryland: Clean Energy Grant Program - Geothermal Heat Pumps
The Maryland Energy Administration (MEA) offers rebates of up to $2,000 for residential geothermal heat pump systems and $7,000 for non-residential geothermal heat pump systems. Grants for both are provided at a rate of $500 per ton of refrigeration capacity, equivalent to 12,000 BTUs. Funding for the program is provided annually from the Maryland Strategic Energy Investment Fund (SEIF), which receives income from greenhouse gas emission auctions under the Regional Greenhouse Gas Initiative (RGGI). The total FY 2011 budget for all renewable energy programs (geothermal heat pumps, wind, and solar) is expected to be roughly $3.2 million. A substantial component of total FY 2011 funding is expected to come from federal economic stimulus funds under the American Recovery and Reinvestment Act (ARRA). As of February 2011, ARRA funds are no longer used for geothermal projects.
The definition of geothermal heat pump property does not include swimming pools, hot tubs, or any other energy storage device that has a primary function other than storage. In addition, systems should have a minimum Energy Efficiency Ratio (EER) of 14.0 and a minimum Coefficient of Performance (COP) of 3.0 according to the testing standards of the Air Conditioning and Refrigeration Institute (ARI) or other nationally recognized agency. As of February 22, 2011, MEA is using new applications. Rebate applications must include information on the type of system being installed, the installer, and contain copies of any necessary permits. Not all systems are guaranteed rebates and the MEA may elect to award an amount different than the one requested in the application. If a project is approved the applicant then has 270 days to install the system, assemble the necessary supporting documentation, and submit a completion certificate to the MEA claiming their rebate, or they risk losing their rebate. If a system has already been installed prior to submitting an application to MEA, the project is still eligible for a grant, as long as the system meets the program requirements and was placed in service during the same fiscal year (e.g., July 1, 2010 – June 30, 2011) that the application was submitted. Persons with previously installed systems should contact the MEA for further information.
Maryland Energy Administration: Geothermal

GEOTHERMAL COMMUNITY ENERGY STUDY
April 2011 Report No. 10-1151-0403 36
Geothermal heat pumps are used for space heating and cooling, as well as water heating. Their greatest advantage is that this technology works by concentrating naturally existing heat, rather than by producing heat through combustion of fossil fuels.
Benefits of Installing a Geothermal Heat Pump:
Use 25%–50% less electricity than conventional heating or cooling systems: up to 44% compared to air-source heat pumps and up to 72% compared to electric resistance heating with standard air-conditioning equipment. This translates to saving you money on energy bills each month.
Improve humidity control by maintaining about 50% relative indoor humidity, making GHPs very effective in humid areas
To Apply for a Clean Energy Grant:
Residential Clean Energy Grant Program – http://energy.maryland.gov/residential/cleanenergygrants/index.html
Commercial Clean Energy Grant Program -
Contact: Maryland Energy Administration, 60 West Street, Suite 300, Annapolis, MD 21401 | (410) 260-7655 | (800) 72-ENERG,
http://energy.maryland.gov/business/cleanenergygrants/index.html
http://energy.maryland.gov/renewable/geothermal.html
Maryland: Special Property Assessment for Renewable Heating and Cooling Systems
If a solar or geothermal heating and cooling system is installed on your property, the additional value added to your property from the system will not be included in your property taxes, according to title 8 of Maryland’s property tax code.
Maryland: Maryland Clean Energy Center - Home Energy Loan Program
The Maryland Energy Administration (MEA) joins the Maryland Clean Energy Center (MCEC) in offering low interest loans for projects which increase the energy efficiency of participating residences. Loans are available for up to $20,000, at a 6.99% interest rate. Measures typically include insulation and HVAC equipment upgrades but are not necessarily limited to these improvements. Property must be a primary residence and located in the state of Maryland in order to be eligible. Single-family detached homes and townhouses are eligible for loans while condominiums and coops are unable to participate. Homeowners must have a complete home energy audit to determine the scope and cost of potential projects. Auditors must be MCEC approved and certified. Based upon the audit findings, homeowners may determine the most effective energy efficient measures to pursue. Participants must then enter a contract with an approved contractor indicating the measures and costs included. After the completion of a contract, participants may register and apply for loans through MCEC. Interested homeowners may register and apply at MCEC web site listed above. Contact MCEC for any other information on this program.
9.3.2 Local Utility Incentives SMECO: Residential Energy Efficiency Rebate Program
Southern Maryland electricity Coopertive (SMECO) provides rebates up to $1412 for home efficiency upgrades like insulation and air sealing and upgrading heating and cooling systems. SMECO’s Residential Energy Efficiency Program helps residential customers save energy by providing rebates for home weatherization and

GEOTHERMAL COMMUNITY ENERGY STUDY
April 2011 Report No. 10-1151-0403 37
the installation of energy efficient equipment. Eligible measures include insulation, system tune-ups, lighting, water heating, proper installation and central heating and cooling
To learn more about the state Home Performance program, visit:
. Some rebates vary by size and type of measure employed. Equipment must meet program guidelines listed on the web site above. Customers should check the website to ensure eligibility and to fill out the application form.
www.mdhomeperformance.org/index.html
For more information visit the SEMCO website:
https://www.semco.coop/save/

GEOTHERMAL COMMUNITY ENERGY STUDY
April 2011 Report No. 10-1151-0403 38
10.0 GEOTHERMAL DISTRICT ENERGY BUSINESS STRATEGY District Energy Systems (DES) are simply thermal energy networks or “thermal grids” that create and process thermal energy in a central energy plant and distribute it to multiple buildings, which may or may not have secondary thermal processing equipment in each building. A District Energy System can be fuelled by a variety of energy sources, alone or in combination some of which are natural gas, oil, coal, waste heat, biomass, solar and geothermal. Once a central energy plant is built and the distribution pipes installed connecting the end use buildings, the system becomes very flexible as new energy sources and technologies emerge; only the central supply system is upgraded, while each individual building enjoys the environmental and economic benefits without having to invest or alter individual building systems.
Geothermal systems, very similar in physical system structure, are very easy to configure as standalone DES or to provide a source of energy to a hybrid DES. The ground infrastructure requires additional capital investment, however the operating costs are very low, since no fuel is consumed, and the electricity required to operate the system, is much less than the energy output. (Please refer to the previous section “Coefficient of Performance”.)
The economic and operating efficiencies of DES are becoming more attractive for high density developments, where the ratio of infrastructure capital cost to end use consumption and revenue is lowest. As the buildings connected to the system are located further apart and are smaller in size or are used less intensely, then the economics of the system tend to become less attractive. Countering this effect, are new mechanical technologies that allow higher operating efficiencies over an ever broadening range of scale and lower equipment and service costs derived from increasing industry efficiencies of scale, the economics of critical mass and increased choice and competition. Each scenario is unique and needs to be evaluated considering a number of distinct and local variables.
The environmental benefits of DES are increasing sought by municipalities facing growth and urban densification. The benefits of clean air are no longer considered non-essential, as the costs of healthcare and the value of real estate now include an assessment of air quality, sometimes expressed in terms of real dollars or sometimes expressed as desirability and increased consumer demand. DES in general, reduce green house gas (GHG) emissions, however combustion free geothermal systems, reduce GHG emissions to zero.
Commercially DES operators, seeking convention, continue to sell energy in “commoditized” units, usually measured in British Thermal Units (BTU’s). Fees charged usually have two components, a fixed fee that contributes to the initial capital cost of the infrastructure and a variable fee that reflects the operating and fuel consumption costs. However, this convention is not necessary and particularly so when the variable costs of operating the system becomes extremely low compared to the initial fixed cost such as when geothermal energy is the source. Consider that a service is being delivered to consumers, rather than a commodity. That is, “interior comfort” is the service delivered rather than a tangible fuel, measured by physical dimensions. If this is the premise, then an annual fixed fee with a small fixed annual increase over a long term can create a valuable financial benefit to customers; that is certainty of future costs. For businesses and consumers alike, financial certainty for an essential service that in the past has experienced extreme price volatility and rising costs that have outpaced incomes, may be worth a premium. In any case, DES and geothermal systems offer a variety of financial structures that can be configured to deliver appropriate risk, rates of return and cash flows to suit different DES owner/operators and consumers alike.

GEOTHERMAL COMMUNITY ENERGY STUDY
April 2011 Report No. 10-1151-0403 39
Figure 12: Geothermal Energy Supply Agreement Comparative Costs
For a geothermal DES, many configurations of piping can be used depending on the scale and layout of the buildings to be connected. Geothermal borefields, water pumps and heat pumps (HP) can be physically dispersed or centrally located, while being owned and operated by one entity.
Temperatures of the water to be supplied to end users are critical to a DES system design and performance. If the buildings being supplied are new construction, then they can be specified and built to use low grade temperature heat pump or fan coil HVAC systems. If the buildings already exist, then they probably use electric heating and cooling or they have traditional boilers that heat water to a high grade temperature (180°F) connected to HVAC equipment that is designed to accept only that temperature. Retrofitting the interior HVAC systems of building that may not have ductwork or a hydronic pipe system built into the walls or to change them from high grade temperature systems to low grade temperature systems, is not usually feasible, even if the existing HVAC equipment is at life. Electric buildings are particularly costly and invasive to retrofit, unless significant building envelope improvements are being undertaken at the same time. For high grade heat buildings, it is likely simpler, less expensive and certainly more convenient for customer buildings, to centrally upgrade the low grade geothermal temperatures to high grade temperatures, by installing a central hybrid geothermal natural gas DES which delivers high grade heat which is compatible with existing customer systems.
Each District Energy System requires a detail Feasibility Study, to determine the best strategy and options. The following is a sample selection of geoexchange utility system configurations.

GEOTHERMAL COMMUNITY ENERGY STUDY
April 2011 Report No. 10-1151-0403 40
Table 3: Geothermal District Energy System Configurations
Buildings Connected Borefield Location
Pumping Station / Central Plant Supply Temperatures (H/C)
District Energy Supplier Assets and Revenue
New construction: 1 commercial podium with 2 multi-residential towers
Under the footprint of the building prior to construction (strata, condo unit or easement)
Lower level of the building - secure room, exclusive access, direct connection to building HVAC system (55°F/55°F)
Owns and operates borefield, pumping station – 30 year Renewable Energy Supply Agreement (RESA), fixed fee + 2.5%/yr.
New construction: campus of buildings, i.e. university, athletes village, retail centre
Under the central parking or green space, under 1 or more buildings if required (easement)
Central subterranean room, underground parking area or building space, central W/W HPs, 4 pipe distribution network to each building sub-station (120°F/40°F)
Owns and operates borefield, central plant, distribution pipes – one 30 year RESA per building or owner, fixed fee + 2.5%/yr. or consumption metering and billing.
New Construction: residential subdivision, single family homes and townhouses (housing association or condominium)
Community green space (park, school yard) – easement or leased land.
Central subterranean room or above ground utility building. Distribution pipes in roadways/driveways connect to customer owned (or utility supplied or leased) HP in each basement. (55°F/55°F)
Housing Association structure offers, simplicity of one bill per month, which becomes part of unit owner association fees. Fixed fee + 2.5%/yr. With no association structure, can be “utility fee” however requires individual household consumption metering and billing.
Retrofit: commercial or multi-residential tower – must have existing central HVAC cooling (2 pipe or 4 pipe)
Building property (easement), if available, or local third party site such as municipal park or school ground (leased)
Lower level of the building - secure room, exclusive access. Geo headers/mains connect to central W/W HPs and NG boiler owned either by building or utility. NG is required to raise HP temperatures to allow connection to existing building HVAC system (180°F/40°F)
30 year RESA, fixed fee + 2.5%/yr. or consumption metering and billing.
Retrofit: multiple commercial and multi-residential towers
Municipal roadways, and or local municipal parks, schools (easements) Privately owned property (leased)
Geo headers/mains collect into Central Energy Plant. Hybrid Geo HP/NG boiler thermal generation. 4 pipe distribution network laid under roads, connect to basement sub-station of each building (180°F/40°F)
Consumption metering and billing

GEOTHERMAL COMMUNITY ENERGY STUDY
April 2011 Report No. 10-1151-0403 41
Table 4: Geothermal District Energy System SWOT Analysis Analysis of geothermal energy alone vs. natural gas generated heating
Strengths:
a) Free energy, supplies both heating and cooling b) Produces abundant heat energy, low grade c) New construction buildings save HVAC capital cost
if designed and built for geothermal energy d) Replaces NG combustion: reduces GHG
emissions e) Sustainable resource, if designed correctly f) Long life infrastructure assets g) Requires little surface land area, once built h) Reliable, durable, low maintenance i) Installation area is flexible and can be dispersed j) Uses known technology
Weaknesses:
a) Cost of installing geoexchange infrastructure b) Most existing buildings require high grade heat c) Existing buildings have high HVAC retrofit costs,
often require extensive system replacement d) Uses electricity: creates some associated GHG
emissions e) Design and operation of borefield must balance
heat extraction with heat injection f) Initial capital cost g) Construction is disruptive to a large area of land h) Not all contractors are qualified i) Installation area required is significant j) Large closed-loop systems are not common
Opportunities:
a) Collect and sell free energy b) Accumulate Renewable Energy Credits (REC) c) Grow business revenue base, competitively d) Long term secure revenue stream e) Monopoly once a building is connected f) Cost structure is relatively fixed g) Revenues can be increased over time h) Create example that can be replicated i) Compatible with other renewable technologies j) Compatible with other conventional technologies k) Technical design on large scale, could create
additional efficiencies and benefits
Threats:
a) Long term business commitment b) Renewable Energy Credits may not be valuable c) Competitive energy prices may decline d) Building may become vacant e) Utility regulatory control, future uncertainty f) Cost of electricity consumed could rise g) Economy may not support price increases h) Competitors replicate and bid for future projects i) Cost of technology integration may be high j) Conventional HVAC are cheaper to install k) Technical design on large scale could be
complex

GEOTHERMAL COMMUNITY ENERGY STUDY
April 2011 Report No. 10-1151-0403 42
11.0 DISTRICT ENERGY SYSTEMS, CONCEPT TO IMPLEMENTATION Any Energy Plan, whether for one building, a subdivision, a commercial core redevelopment project or a community, begins with an assessment of the energy need. To be economical, supply should be designed to serve demand, both now and as planned for the future. Does existing demand support the threshold required to economically justify a DES? Geothermal systems are more scalable and can be added to as new consumers arrive, as long as preplanning has allowed for infrastructure installation and operating equipment expansion. Therefore a detailed demand assessment is an essential first step.
To aid early planning, building types and community densities can be generalized. However the more detailed and accurate the representation, the more relevant the assessment study.
Patterns, trends and clusters of buildings should be considered for logical interconnection. Are there large individual or special purpose users? Are there any significant sources of waste heat? Should more than one system be created for developments that are dispersed?
Assumptions are critical to any analysis and should be identified, defined and agreed to by all stakeholders early in the planning process.
A desktop assessment of ground conditions, including surface, quaternary, bedrock geology and hydrogeology, should be carried out. A high level estimate of thermal conductivity can be derived from this information and a theoretical geothermal system concept can be developed based on expected ground energy supply.
Stakeholder objectives should be considered and measured against physical demand and supply conditions, to assess opportunities and limitations. Financial and economic parameters and constraints should be identified and time lines for demand should be scheduled against a time line for implementation. Stakeholder interests should be identified along with various options for investment and ownership. Go/NoGo decision criteria should be described, along with any flexibility or potential options that may exist.
Central plant mechanical system schematics should be developed, and critical equipment identified.
A network of distribution piping should be laid out and mapped, with alternatives evaluated. Working from the borefield back to the central plant, pipe sizes and flow rates can be determined.
Individual user mechanical systems should be evaluated, whether being specified or whether existing systems are being connected.
From these and many more points of information, a concept should emerge and be developed enough to be described in functional terms. This Concept Plan will provide a basis for discussion and further investigation.
At this point a Concept Feasibility Study could be performed to test actual ground conditions and to evaluate the concept against actual economic market conditions and design and financial parameters. A national or local Business As Usual (BAU) case is sometimes used as a reference. Computer modelling can be useful to incorporate large amounts of data and explore options that can optimize and further refine the concept. The Feasibility Study could be broken down into components, and could consider systems of different scale and scope. Scale would refer to identified scenarios of demand and different physical and geographic locations. Scope would refer to the proportions of energy supplied by each energy source, which needs to be qualified by associated constraints, capabilities and efficiencies.

GEOTHERMAL COMMUNITY ENERGY STUDY
April 2011 Report No. 10-1151-0403 43
A favourable Feasibility Study is often followed by an Implementation Plan that flushes out most of the details and identifies key resources including the expertise required on the detail design team as well as a potential schedule for construction and operations.
If the Implementation Plan is favourable, an Investment Analysis may be performed to assist with funding and stakeholder confidence.
Technology risk is low. Geothermal technology is not new or different and existing examples of operational systems range from single building systems to huge complex DES, found all across the United States, in Canada and in Europe.
Financial risk can be well managed. Time and a detailed investigation can provide known information about stable ground conditions that will provide supply with more certainty than most projects.
A geothermal DE system is scalable. A small system can be installed even in one building that would replicate the hybrid system design being considered. The central energy plant can be housed in the basement of the building without constructing stand alone energy plant.
There is huge opportunity. A Geothermal District Energy System can be configured to fit many sites and development opportunities. Pre-planned subdivisions, large scale commercial and institutional developments, municipal and community energy plans, urban redevelopment plans, municipal transportation artery and tunnel projects all present huge opportunities for Geothermal DE.
12.0 REFERENCES 1. Air-Conditioning and Refrigeration Institute (ARI), 4301 North Fairfax Drive, Suite 425, Arlington, VA,
22203, USA
2. ASHRAE HVAC Applications Handbook, American Society of Heating, Refrigeration, Air-conditioning Engineers, Inc. (ASHRAE), 1791Tullie Circle NE, Atlanta, GA, 30329, USA www.ashrae.org
3. (ASHRAE, 1997) Ground-Source Heat Pumps – Design of Geothermal Systems for Commercial and Institutional Buildings – Chapter 5. In ASHRAE Handbook-Fundamentals, Atlanta: American Society of Heating, Refrigerating and Air-Conditioning Engineers, Inc, 1997.
4. (ASHRAE, 2003), Geothermal Energy - Chapter 32. In 2003 ASHRAE HVAC Applications Handbook, SI Edition, American Society of Heating, Refrigerating and Air-Conditioning Engineers, Inc., 2003.
5. Blue Diamond Industries, LLC, Geothermal HDPE pipe manufacturer, 3399 Tates Creek Road #110 Lexington, KY 40502 Tel: (859) 224-0415
6. Canadian GeoExchange Coalition (CGC), 1030 Cherrier Street, Suite 501, Montreal, PQ H2L 1H9 phone: (514) 807-7559
http://www.bdiky.com/index.php
www.geo-exchange.ca
7. Canadian Standards Association (CSA), 178 Rexdale Blvd., Toronto, ON M9W 1R3 phone: (416) 747-4044
- Installers’ Course
www.csa.org - CAN/CSA-C448-02

GEOTHERMAL COMMUNITY ENERGY STUDY
April 2011 Report No. 10-1151-0403 44
8. Central Geothermal Systems, Applications Engineering Manual, April 2010, Trane, SYS-APM009-EN www.trane.com
9. Criteria and Initial Screening Maps for Identifying Potential Underground Thermal Energy Storage Sites in the Toronto Area, April 2010, Toronto Regional Conservation Authority, 5 Shoreham Drive, Downsview, ON M3N 1S4
10. Geothermal District Heating, 2009, John W. Lund and Paul J. Lienau, Geo-Heat Centre, Oregon Institute of Technology
11. International Ground Source Heat Pump Association (IGSHPA), 374 Cordell South Stillwater, OK 74078, Phone: (405) 744-5175, Fax: (405) 744-5283,
12. International Organization for Standardization (ISO),Case Postale 56, CH-1121, Geneva 21, Switzerland
www.igshpa.okstate.edu
13. ISCO Industires LLC, Geothermal HDPE pipe manufacturer, P.O. Box 4545 Louisville, KY 40204 Tel: 800-345-ISCO (4726) In Maryland, contact David Klecan 443-721-7691 [email protected] or Justin Grabarczyk 302-250-7211 [email protected]
14. Maryland Electricity Profile, Annual Energy Generator Report, Department of Energy, Energy Information Administration, 2008, Released March 2010, (DOE/EIA-0348(01)/2)
15. Optimization of Heat Exchangers for Geothermal District Heating, 2009, P. Bahadorani, G.F. Naterer, S.B. Nokleby, Faculty of Engineering and Applied Science, University of Ontario Institute of Technology, Oshawa, ON (No. 08-CSME-31, E.I.C. Accession 3069)
http://www.eia.gov/cneaf/electricity/st_profiles/maryland.html
16. University of Ontario Institute of Technology, Borehole Thermal Storage System, http://www.engineering.uoit.ca/facilities/borehole

GEOTHERMAL COMMUNITY ENERGY STUDY
April 2011 Report No. 10-1151-0403
Report Signature Page
GOLDER ASSOCIATES INC.
Suzanne Wiltshire, MBA Brent Waters, C.P.G. Sr. Consultant, Geothermal Associate
SW/BW/am
Golder, Golder Associates and the GA globe design are trademarks of Golder Associates Corporation.
n:\active\2010\1151\10-1151-0408 charles county - geothermal study - md\reports\final\report i - geothermal technology review (v2 - client revisions)_28apr 2011.docx

GEOTHERMAL COMMUNITY ENERGY STUDY
April 2011 Report No. 10-1151-0403
APPENDIX A Maryland Electricity Profile

State Electricity Profiles 2008 121
Table 1. 2008 Summary Statistics Item Value U.S. Rank
Maryland
NERC Region(s)....................................................................................................... RFC
Primary Energy Source........................................................................................... Coal
Net Summer Capacity (megawatts) ....................................................................... 12,585 31
Electric Utilities ...................................................................................................... 80 47
Independent Power Producers & Combined Heat and Power................................ 12,505 9
Net Generation (megawatthours)........................................................................... 47,360,953 31
Electric Utilities ...................................................................................................... 5,856 48
Independent Power Producers & Combined Heat and Power................................ 47,355,097 9
Emissions (thousand metric tons) ..........................................................................
Sulfur Dioxide ........................................................................................................ 226 14
Nitrogen Oxide ....................................................................................................... 41 32
Carbon Dioxide....................................................................................................... 29,121 32
Sulfur Dioxide (lbs/MWh) ..................................................................................... 10.5 1
Nitrogen Oxide (lbs/MWh) .................................................................................... 1.9 27
Carbon Dioxide (lbs/MWh).................................................................................... 1,356 26
Total Retail Sales (megawatthours) ....................................................................... 63,325,777 24
Full Service Provider Sales (megawatthours) ........................................................ 36,765,861 31
Deregulated Sales (megawatthours) ....................................................................... 26,559,916 3
Direct Use (megawatthours) ................................................................................... 1,204,206 27
Average Retail Price (cents/kWh).......................................................................... 13.00 11 MWh = Megawatthours. kWh = Kilowatthours. Sources: U.S. Energy Information Administration, Form EIA-860, "Annual Electric Generator Report." U.S. Energy Information Administration, Form EIA-861, "Annual Electric Power Industry Report." U.S. Energy Information Administration, Form EIA-923, "Power Plant Operations Report" and predecessor forms.
Table 2. Ten Largest Plants by Generating Capacity, 2008
Plant Primary Energy Source or
Technology Operating Company
Net Summer
Capacity
(MW) Maryland
1. Chalk Point LLC.................................................................................. Coal Mirant Chalk Point LLC 2,413
2. Calvert Cliffs Nuclear Power Plant ..................................................... Nuclear Calvert Cliffs Nuclear PP Inc 1,735
3. Morgantown Generating Plant ............................................................ Coal Mirant Mid-Atlantic LLC 1,486
4. Brandon Shores.................................................................................... Coal Constellation Power Source Gen 1,286
5. Herbert A Wagner ............................................................................... Coal Constellation Power Source Gen 996
6. Dickerson............................................................................................. Coal Mirant Mid-Atlantic LLC 849
7. NAEA Rock Springs LLC................................................................... Gas NAEA Rock Springs LLC 632
8. Conowingo........................................................................................... Hydroelectric Exelon Power 572
9. C P Crane............................................................................................. Coal Constellation Power Source Gen 399
10. Perryman............................................................................................. Gas Constellation Power Source Gen 355 MW = Megawatt. Source: U.S. Energy Information Administration, Form EIA-860, "Annual Electric Generator Report."

State Electricity Profiles 2008 122
Table 3. Top Five Retailers of Electricity, with End Use Sectors, 2008 (Megawatthours)
Entity Type of
Provider All Sectors Residential Commercial Industrial Transportation
Maryland
1. Baltimore Gas & Electric Co...................................... Investor-Owned 16,868,824 12,669,823 3,957,182 241,819 -
2. Potomac Electric Power Co........................................ Investor-Owned 7,595,917 5,428,727 2,167,190 - -
3. PEPCO Energy Services............................................. Other Provider 7,453,960 17,313 7,316,131 - 120,516
4. The Potomac Edison Co ............................................. Investor-Owned 4,481,014 3,202,917 925,459 352,638 -
5. Constellation NewEnergy, Inc.................................... Other Provider 4,427,517 - 3,377,512 651,447 398,558
Total Sales, Top Five Providers ..................................... 40,827,232 21,318,780 17,743,474 1,245,904 519,074
Percent of Total State Sales ............................................ 64 79 59 22 98 - (dash) = Data not available. Source: U.S. Energy Information Administration, Form EIA-861, "Annual Electric Power Industry Report."
Table 4. Electric Power Net Summer Capacity by Primary Energy Source and Industry Sector, 1998 and 2002 Through 2008
(Megawatts) Percentage Share
Energy Source 1998 2002 2003 2004 2005 2006 2007 2008 1998 2008
Maryland
Electric Utilities.......................................................................... 10,970 69 70 79 79 79 80 80 94.7 0.6
Coal............................................................................................ 4,647 - - - - - - - 40.1 -
Petroleum................................................................................... 2,516 69 70 79 79 79 80 80 21.7 0.6
Natural Gas ................................................................................ 1,602 - - - - - - - 13.8 -
Nuclear....................................................................................... 1,675 - - - - - - - 14.5 -
Hydroelectric ............................................................................. 530 - - - - - - - 4.6 -
Independent Power Producers and Combined Heat and Power ..........................................................................................
612 11,790 12,401 12,419 12,423 12,421 12,406 12,505 5.3 99.4
Coal............................................................................................ 60 4,897 4,957 4,958 4,958 4,958 4,958 4,944 0.5 39.3
Petroleum................................................................................... 2 2,853 2,752 3,343 3,343 3,061 2,885 2,911 * 23.1
Natural Gas ................................................................................ 421 1,490 2,144 1,538 1,542 1,821 1,953 2,038 3.6 16.2
Other Gases................................................................................ - 152 152 152 152 152 152 152 - 1.2
Nuclear....................................................................................... - 1,685 1,703 1,735 1,735 1,735 1,735 1,735 - 13.8
Hydroelectric ............................................................................. - 530 566 566 566 566 590 590 - 4.7
Other Renewables...................................................................... 128 183 127 127 127 127 133 135 1.1 1.1
Total Electric Industry.............................................................. 11,582 11,859 12,472 12,499 12,503 12,500 12,486 12,585 100.0 100.0
Coal............................................................................................ 4,707 4,897 4,957 4,958 4,958 4,958 4,958 4,944 40.6 39.3
Petroleum................................................................................... 2,518 2,922 2,822 3,422 3,422 3,140 2,965 2,991 21.7 23.8
Natural Gas ................................................................................ 2,024 1,490 2,144 1,538 1,542 1,821 1,953 2,038 17.5 16.2
Other Gases................................................................................ - 152 152 152 152 152 152 152 - 1.2
Nuclear....................................................................................... 1,675 1,685 1,703 1,735 1,735 1,735 1,735 1,735 14.5 13.8
Hydroelectric ............................................................................. 530 530 566 566 566 566 590 590 4.6 4.7
Other Renewables...................................................................... 128 183 127 127 127 127 133 135 1.1 1.1 * = Value is less than half of the smallest unit of measure (e.g., for values with no decimals, the smallest unit is 1 and values under 0.5 are shown as *). - (dash) = Data not available. Source: U.S. Energy Information Administration, Form EIA-860, "Annual Electric Generator Report."
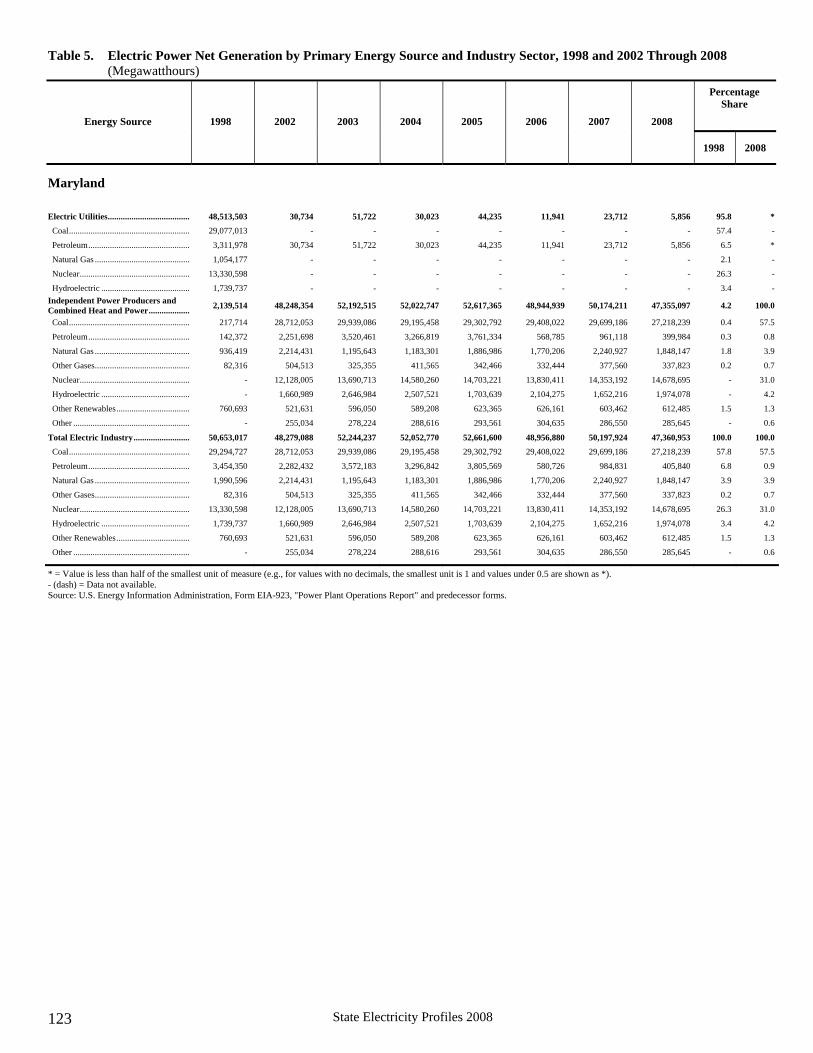
State Electricity Profiles 2008 123
Table 5. Electric Power Net Generation by Primary Energy Source and Industry Sector, 1998 and 2002 Through 2008 (Megawatthours)
Percentage Share
Energy Source 1998 2002 2003 2004 2005 2006 2007 2008
1998 2008 Maryland
Electric Utilities...................................... 48,513,503 30,734 51,722 30,023 44,235 11,941 23,712 5,856 95.8 *
Coal........................................................ 29,077,013 - - - - - - - 57.4 -
Petroleum............................................... 3,311,978 30,734 51,722 30,023 44,235 11,941 23,712 5,856 6.5 *
Natural Gas ............................................ 1,054,177 - - - - - - - 2.1 -
Nuclear................................................... 13,330,598 - - - - - - - 26.3 -
Hydroelectric ......................................... 1,739,737 - - - - - - - 3.4 -
Independent Power Producers and Combined Heat and Power...................
2,139,514 48,248,354 52,192,515 52,022,747 52,617,365 48,944,939 50,174,211 47,355,097 4.2 100.0
Coal........................................................ 217,714 28,712,053 29,939,086 29,195,458 29,302,792 29,408,022 29,699,186 27,218,239 0.4 57.5
Petroleum............................................... 142,372 2,251,698 3,520,461 3,266,819 3,761,334 568,785 961,118 399,984 0.3 0.8
Natural Gas ............................................ 936,419 2,214,431 1,195,643 1,183,301 1,886,986 1,770,206 2,240,927 1,848,147 1.8 3.9
Other Gases............................................ 82,316 504,513 325,355 411,565 342,466 332,444 377,560 337,823 0.2 0.7
Nuclear................................................... - 12,128,005 13,690,713 14,580,260 14,703,221 13,830,411 14,353,192 14,678,695 - 31.0
Hydroelectric ......................................... - 1,660,989 2,646,984 2,507,521 1,703,639 2,104,275 1,652,216 1,974,078 - 4.2
Other Renewables.................................. 760,693 521,631 596,050 589,208 623,365 626,161 603,462 612,485 1.5 1.3
Other ...................................................... - 255,034 278,224 288,616 293,561 304,635 286,550 285,645 - 0.6
Total Electric Industry.......................... 50,653,017 48,279,088 52,244,237 52,052,770 52,661,600 48,956,880 50,197,924 47,360,953 100.0 100.0
Coal........................................................ 29,294,727 28,712,053 29,939,086 29,195,458 29,302,792 29,408,022 29,699,186 27,218,239 57.8 57.5
Petroleum............................................... 3,454,350 2,282,432 3,572,183 3,296,842 3,805,569 580,726 984,831 405,840 6.8 0.9
Natural Gas ............................................ 1,990,596 2,214,431 1,195,643 1,183,301 1,886,986 1,770,206 2,240,927 1,848,147 3.9 3.9
Other Gases............................................ 82,316 504,513 325,355 411,565 342,466 332,444 377,560 337,823 0.2 0.7
Nuclear................................................... 13,330,598 12,128,005 13,690,713 14,580,260 14,703,221 13,830,411 14,353,192 14,678,695 26.3 31.0
Hydroelectric ......................................... 1,739,737 1,660,989 2,646,984 2,507,521 1,703,639 2,104,275 1,652,216 1,974,078 3.4 4.2
Other Renewables.................................. 760,693 521,631 596,050 589,208 623,365 626,161 603,462 612,485 1.5 1.3
Other ...................................................... - 255,034 278,224 288,616 293,561 304,635 286,550 285,645 - 0.6 * = Value is less than half of the smallest unit of measure (e.g., for values with no decimals, the smallest unit is 1 and values under 0.5 are shown as *). - (dash) = Data not available. Source: U.S. Energy Information Administration, Form EIA-923, "Power Plant Operations Report" and predecessor forms.

State Electricity Profiles 2008 124
Table 6. Electric Power Delivered Fuel Prices and Quality for Coal, Petroleum, and Natural Gas, 1998 and 2002 Through 2008
Fuel, Quality 1998 2002 2003 2004 2005 2006 2007 2008
Maryland
Coal (cents per million Btu) ........................................... 146 163 163 174 192 227 212 366
Average heat value (Btu per pound)............................. 12,914 12,799 12,708 12,653 12,638 12,504 12,501 12,361
Average sulfur Content (percent) ................................. 1.17 1.13 1.07 1.25 1.32 1.28 1.26 1.20
Petroleum (cents per million Btu)1 ................................. 211 375 534 552 788 1,013 1,060 1,721
Average heat value (Btu per gallon)............................. 150,776 150,717 148,564 149,417 148,498 146,088 145,614 142,967
Average sulfur Content (percent) ................................. 0.96 0.65 0.61 0.54 0.64 0.48 0.53 0.38
Natural Gas (cents per million Btu)................................ 263 416 537 553 991 748 757 1,051
Average heat value (Btu per cubic foot)....................... 1,047 1,035 1,047 1,048 1,046 1,043 1,042 1,050 1 Petroleum includes petroleum liquids and petroleum coke. Btu = British thermal unit. Note: Due to different reporting requirements between the Form EIA-923 and historical FERC Form 423, the receipts data from 2008 and on are not directly comparable to prior years. There may be a notable increase in fuel receipts beginning with 2008. For more information, please see the Technical Notes in the Electric Power Annual. Sources: U.S. Energy Information Administration, Form EIA-423, " Monthly Cost and Quality of Fuels for Electric Plants Report." Federal Energy Regulatory Commission, FERC Form 423, "Monthly Cost and Quality of Fuels for Electric Plants." U.S. Energy Information Administration, Form EIA-923, "Power Plant Operations Report."
Table 7. Electric Power Industry Emissions Estimates, 1998 and 2002 Through 2008
(Thousand Metric Tons)
Emission Type 1998 2002 2003 2004 2005 2006 2007 2008
Maryland
Sulfur Dioxide ...................................................................
Coal................................................................................. 247 241 248 261 258 256 252 222
Petroleum........................................................................ 24 8 14 13 16 12 12 1
Natural Gas ..................................................................... * *R * *R *R *R *R *
Other Gases..................................................................... * * * * * * * *
Other Renewables........................................................... 3R 2 2 2 2 2 2 2
Other ............................................................................... * * * * * * * *
Total................................................................................ 274 251 264 277 276 271 267 226
Nitrogen Oxide..................................................................
Coal................................................................................. 99 62 57 51 50 47 43 33
Petroleum........................................................................ 11 5 8 7 8 5 5 2
Natural Gas ..................................................................... 3 3 1 3 2 7 2 2
Other Gases..................................................................... * 1 1 1 1 1 1 1
Other Renewables........................................................... 4R 2 2 3 2 2 2 3
Other ............................................................................... * 1 1 1 1 1 1 *
Total................................................................................ 116 73 70 65 64 62 55 41
Carbon Dioxide .................................................................
Coal................................................................................. 27,292R 27,513R 28,653R 28,149R 28,509R 28,325R 28,628R 26,928
Petroleum........................................................................ 3,204R 2,004R 2,998R 2,839R 3,315R 553R 893R 380
Natural Gas ..................................................................... 1,269R 1,367R 677R 743R 1,245R 1,308R 1,373R 1,226
Other Renewables........................................................... 541R - - - - - - -
Other ............................................................................... 11R 593R 601R 599R 587R 612R 580R 587
Total................................................................................ 32,317R 31,477R 32,930R 32,330R 33,656R 30,798R 31,473R 29,121 R = Revised. * = Value is less than half of the smallest unit of measure (e.g., for values with no decimals, the smallest unit is 1 and values under 0.5 are shown as *). - (dash) = Data not available. Source: Calculations made by the Electric Power Division, U. S. Energy Information Administration.

State Electricity Profiles 2008 125
Table 8. Retail Sales, Revenue, and Average Retail Prices by Sector, 1998 and 2002 Through 2008 Percentage Share
Sector 1998 2002 2003 2004 2005 2006 2007 2008
1998 2008 Maryland
Retail Sales (thousand megawatthours) .....................
Residential .................................................................. 22,407 25,489 26,671 27,952 28,440 26,905 28,195 27,144 38.7 42.9
Commercial ................................................................ 24,284 21,044 16,950 17,264 17,932 29,729 30,691 30,003 42.0 47.4
Industrial ..................................................................... 10,344 20,875 27,176 21,195 21,517 6,057 5,980 5,650 17.9 8.9
Other ........................................................................... 799 972 NA NA NA NA NA NA 1.4 --
Transportation............................................................. NA NA 461 481 477 482 524 529 -- 0.8
All Sectors .................................................................. 57,834 68,380 71,259 66,892 68,365 63,173 65,391 63,326 100.0 100.0
Retail Revenue (million dollars)..................................
Residential .................................................................. 1,890 1,973 2,060 2,181 2,405 2,614 3,353 3,757 46.7 45.6
Commercial ................................................................ 1,656 1,328 1,178 1,304 1,608 3,141 3,553 3,828 40.9 46.5
Industrial ..................................................................... 429 836 1,329 1,269 1,509 493 563 586 10.6 7.1
Other ........................................................................... 70 92 NA NA NA NA NA NA 1.7 --
Transportation............................................................. NA NA 27 31 37 41 53 61 -- 0.7
All Sectors .................................................................. 4,045 4,229 4,594 4,785 5,559 6,288 7,523 8,232 100.0 100.0
Average Retail Prices (cents/kWh) .............................
Residential .................................................................. 8.44 7.74 7.73 7.80 8.46 9.71 11.89 13.84 -- --
Commercial ................................................................ 6.82 6.31 6.95 7.56 8.97 10.56 11.58 12.76 -- --
Industrial ..................................................................... 4.14 4.01 4.89 5.99 7.01 8.14 9.41 10.37 -- --
Other ........................................................................... 8.82 9.42 NA NA NA NA NA NA -- --
Transportation............................................................. NA NA 5.78 6.46 7.73 8.43 10.15 11.52 -- --
All Sectors .................................................................. 6.99 6.18 6.45 7.15 8.13 9.95 11.50 13.00 -- -- kWh = Kilowatthours. NA = Not available. -- = Not applicable. Source: U.S. Energy Information Administration, Form EIA-861, "Annual Electric Power Industry Report."
Table 9. Retail Electricity Sales Statistics, 2008
Full Service Providers Other Providers
Item Investor-Owned
Public Federal Cooperative Facility Energy Delivery
Total
Maryland
Number of Entities.......................................................... 4 5 NA 3 NA 21 4 37
Number of Retail Customers .......................................... 2,082,815 34,113 NA 198,220 NA 113,541 NA 2,428,689
Retail Sales (thousand megawatthours).......................... 31,720 756 NA 4,290 NA 26,560 NA 63,326
Percentage of Retail Sales ............................................ 50.09 1.19 -- 6.77 -- 41.94 -- 100.00
Revenue from Retail Sales (million dollars) .................. 4,415 86 NA 579 NA 2,638 514 8,232
Percentage of Revenue ................................................. 53.63 1.05 -- 7.03 -- 32.05 6.24 100.00
Average Retail Price (cents/kWh) .................................. 13.92 11.38 NA 13.49 NA 9.93 1.93 13.00 kWh = Kilowatthours. NA = Not available. -- = Not applicable. Notes: Totals may not equal sum of components because of independent rounding. Data are shown for All Sectors. Full Service Providers sell bundled electricity services (e.g., both energy and delivery) to end users. Full Service Providers may purchase electricity from others (such as independent Power Producers or other full service providers) prior to delivery. Other Providers sell either the energy or the delivery services, but not both. Sales volumes and customer counts shown for Other Providers refer to delivered electricity, which is a joint activity of both energy and delivery providers; for clarity, they are reported only in the Energy column in this table. The revenue shown under Other Providers represents the revenue realized from the sale of the energy and the delivery services distinctly. "Public" entities include municipalities, State power agencies, and municipal marketing authorities. Federal entities are either owned or financed by the Federal Government. "Cooperatives" are electric utilities legally established to be owned by and operated for the benefit of those using its services. The cooperative will generate, transmit and/or distribute supplies of electric energy to a specified area not being serviced by another utility. "Facility" sales represent direct electricity transactions from independent generators to end use consumers. Source: U.S. Energy Information Administration, Form EIA-861, "Annual Electric Power Industry Report."

State Electricity Profiles 2008 126
Table 10. Supply and Disposition of Electricity, 1998 and 2002 Through 2008 (Million Kilowatthours)
Category 1998 2002 2003 2004 2005 2006 2007 2008
Maryland
Supply ....................................................................................
Generation.............................................................................
Electric Utilities .................................................................. 48,514 31 52 30 44 12 24 6
Independent Power Producers ............................................ 305 44,828 48,824 48,457 48,780 45,406 46,274 43,748
Combined Heat and Power, Electric .................................. 1,405 2,835 2,813 2,926 3,196 2,902 3,275 3,086
Electric Power Sector Generation Subtotal ....................... 50,223 47,695 51,689 51,413 52,020 48,320 49,573 46,840
Combined Heat and Power, Commercial ........................... 30 10 31 49 54 32 28 40
Combined Heat and Power, Industrial................................ 400 575 524 591 588 605 597 481
Industrial and Commercial Generation Subtotal.............. 430 584 555 640 641 637 625 521
Total Net Generation............................................................ 50,653 48,279 52,244 52,053 52,662 48,957 50,198 47,361
Total Supply .......................................................................... 50,653 48,279 52,244 52,053 52,662 48,957 50,198 47,361
................................................................................................
Disposition .............................................................................
Retail Sales ............................................................................
Full Service Providers ........................................................ 57,834 59,271 59,675 53,240 49,145 41,666 38,442 36,766
Energy-Only Providers ....................................................... - 9,108 11,566 13,652 19,202 21,507 26,924 26,560
Facility Direct Retail Sales1................................................ - - 18 - 18 - 25 -
Total Electric Industry Retail Sales .................................... 57,834 68,380 71,259 66,892 68,365 63,173 65,391 63,326
Direct Use .............................................................................. 1,066 1,182 1,197 1,198 1,095 1,323 1,345 1,204
Estimated Losses................................................................... 3,917 3,948 3,610R 4,689R 5,308R 4,734 5,392 4,985
Total Disposition ................................................................... 62,816 73,510 76,065R 72,779R 74,768R 69,230 72,128 69,515
................................................................................................
Net Interstate Trade2............................................................ -12,163 -25,231 -23,821R -20,727R -22,107R -20,274 -21,930 -22,154
Net Trade Index (ratio)3....................................................... 0.81 0.66 0.69 0.72 0.70 0.71 0.70 0.68 1 Facility Direct Retail Sales are electricity sales from non utility power producers which reported electricity sales to a retail customer. 2 Net Interstate Trade is the difference between Total Supply and Total Disposition. 3 Net Trade Index is the ratio of Total Supply to Total Disposition. R = Revised. - (dash) = Data not available. Notes: Totals may not equal sum of components because of independent rounding. Estimated Losses are reported at the utility level, and then allocated to States based on the utility`s retail sales by State. Reported losses may include electricity unaccounted for by the utility. Direct use is commercial or industrial use of electricity that (1) is self-generated (2) is produced by either the same entity that consumes the power or an affiliate, and (3) is used in direct support of a service or industrial process located within the same facility or group of facilities that houses the generating equipment. Direct use is exclusive of station use. Sources: U.S. Energy Information Administration, Form EIA-923, "Power Plant Operations Report" and predecessor forms. U.S. Energy Information Administration, Form EIA-860, "Annual Electric Generator Report." U.S. Energy Information Administration, Form EIA-861, "Annual Electric Power Industry Report." DOE, Office of Electricity Delivery and Energy Reliability, Form OE-781R, "Annual Report of International Electric Export/Import Data," predecessor forms, and National Energy Borad of Canada.

GEOTHERMAL COMMUNITY ENERGY STUDY
April 2011 Report No. 10-1151-0403
APPENDIX B Case Studies – Geothermal Systems of Varying Scale

Geothermal District Energy System | University of Ontario Institute of Technology
1
University of Ontario Institute of Technology
Borehole Thermal Energy Storage System
A virtual view of the borehole thermal energy storage (BTES) system at the University of Ontario Institute of Technology (UOIT) showing the grid of boreholes and the buildings that will be around them including the new OPG Engineering Building and Automotive Centre of Excellence.
UOIT is quickly on the road to becoming an innovator in engineering, driven by the strength of its programming and research. A major thrust has been established at UOIT in the area of energy engineering, and is aimed at addressing many of the present and future energy challenges facing society.
One particular area of energy research is on thermal energy storage and this work is being greatly facilitated by the availability of a leading edge, on-site thermal energy storage facility.
“The thermal storage system is a critical component of the university’s heating and cooling system, and will help keep costs down and efficiency up,” says Dr. Marc Rosen, Dean of UOIT's Faculty of Engineering and Applied Science. “In addition, the thermal storage system will be used for research and to educate students in thermal energy storage.”
Dr. Rosen has carried out extensive research for over two decades on thermal energy storage, and is expanding his research in this area at UOIT.
Located in Oshawa, Ontario, Canada’s newest university is currently undergoing one of the largest expansion projects in the province. Amidst the hub of all the construction activities lies the infrastructure for one of the largest geothermal well fields in North America. The geothermal well field is the central component in the borehole thermal energy storage system. Drilling was completed in November 2003 and involved three rigs, each drilling one hole per day over a span of over 100 days.
Three hundred and eighty-four holes, each 213 metres (700 feet) deep, will provide the basis for a highly efficient and environmentally friendly heating and cooling system, capable of regulating eight of the university's new buildings.

Geothermal District Energy System | University of Ontario Institute of Technology
2
A glycol solution, encased in polyethylene tubing, circulates through an interconnected, underground network. During the winter, fluid circulating through tubing extended into the wells collects heat from the earth and carries it into the buildings. In summer, the system will reverse to pull heat from the building and place it in the ground.
Although there are some underground thermal energy storage applications in Canada, such as those at Scarborough Centre in Toronto, Carleton University in Ottawa, the Sussex Hospital in New Brunswick, and Pacific Agricultural Centre in Agassiz, BC, the UOIT borehole thermal energy storage project is unique in Canada in terms of the number of holes, capacity, surface area, technology, etc. Borehole thermal energy storage, which is similar to the borehole geothermal system, involves storage and provides for both heating and cooling on a seasonal basis. Large-scale storage systems, comparable to the UOIT one, have been implemented at Stockton College in New Jersey and in Sweden.
The UOIT borehole thermal energy storage system was completed in 2004.
The geothermal site provides the distinct opportunity for use by the university’s engineering faculty as an invaluable research and teaching lab. The facility will not only help to significantly reduce energy consumption, but will also provide extensive research opportunities and enhance the educational experience for students in energy-related programs.
Students will have the rich opportunity of on-site education in one of North America’s biggest geothermal fields, exclusive to UOIT Engineering programs, and will also benefit from the expert knowledge of UOIT faculty. Faculty of Engineering and Applied Science professor Ibrahim Dincer has collaborated with Dr. Rosen on thermal storage research for several years, and the team recently co-authored a book entitled, Thermal Energy Storage: Systems and Applications, which focuses on new and leading edge uses of thermal storage.
According to Dr. Rosen, who is a past president of the Canadian Society for Mechanical Engineering, “UOIT’s borehole thermal storage system demonstrates the benefits of the technology better than the over 25 case studies presented in our book, and constitutes one of the most important geothermal storage sites in the world.”
The geothermal project is only one area of UOIT's innovative learning ensemble.
One of the main thrusts of the university is to provide energy education. The emphasis on energy issues in many industries has necessitated the creation of several unique energy-related engineering programs, including Mechanical Engineering with an Energy Engineering option, Energy Systems Engineering and Nuclear Engineering. Together, these programs make UOIT’s energy engineering programming one of the largest in Canada.
http://www.engineering.uoit.ca/facilities/borehole

Copyright © 1997 Geothermal Heat Pump Consortium, Inc., 701 Pennsylvania Ave., NW, Washington, DC 20004-2696Phone: 202-508-5500 Fax: 202-508-5222 Toll Free: 1-888-ALL-4-GEO
Internet:http://www.geoexchange.org/ E-mail: [email protected] GHPC #CS-010 6/97
Waterfront Office BuildingLouisville, Kentucky
The Waterfront Office Building in Louisville,
Kentucky, completed in 1994, is probably the largest
GeoExchange system in the world, but it builds on over
a decade of success with GeoExchange systems in the
adjoining 750,000 square foot Galt House East Hotel
complex, with 600 hotel rooms, 100 apartments, and
120,000 square feet of public areas all served by small
distributed heat pumps.
The entire complex has over 4,700 tons of
GeoExchange (geothermal) capacity for heating and air
conditioning. The Galt House East hotel was
completed in 1984 with a 1,700-ton GeoExchange
system; the success of this project led owner and
designer Al Schneider to use GeoExchange systems in
the new Waterfront Office Building. The million
square foot Waterfront Office Building is sized for
2,700 tons of GeoExchange equipment when fully
fitted out. The project developers point to the system's
economy of installation and operation, ease of
maintenance, and environmental benefits as keys to the
appeal of this technology for large, multi-use building
complexes.
System Description
Four 130-foot deep wells each provide up to
700 gallons per minute from the Louisville aquifer.
Ground water at 58 F. is pumped into a 150,000-gallono
reservoir under the mechanical room, and water from
the reservoir flows into the adjacent Ohio River. Water
from the reservoir is circulated through plate-and-frame
heat exchangers that separate the ground water from
closed loop circulation systems in the buildings. A total
of 65,000 gallons of water flows through the entire
loop system, with 40,000 gallons circulating in the
office building loops. The closed interior loops are
connected to water source heat pumps which can
extract heat from the loop water or inject heat into it,
depending on zone requirements. Each room or suite
can have heating or cooling at any time.
During a typical summer, the system stores
water at about 80 F.; in winter, an average temperatureo
of about 55 is maintained. In spring and fall energyo
can be removed from the buildings during the day and
put into the reservoir; the heat can be removed from the
reservoir to be used at night. The use of thermal storage
allows the controls to shut down the well pumps,
sometimes for as long as a week, when there is little net
call for heat or heat rejection for the complex as a
whole.
While boiler standby heat can be injected into
the system from a boiler recirculation loop connected to
the four main loops, it is seldom required. The cost of

operating backup boilers for the hotel in December
1989, the coldest December on record in Louisville,
was only $500.
Major Capital Cost Savings This has real advantages for maintenance: Fewer
The cost of the GeoExchange system was spares are required, it is possible to move units needing
$1,500 per ton. By comparison, a conventional system repairs to the shop, and service technicians can be
with centrifugal chillers, cooling towers, and insulated effectively utilized. Maintenance costs for the
pipes for a comparable building complex could cost Waterfront Office Complex are less than five cents per
from $2,000 to $3,000 a ton. For the office complex, square foot per year. This is low even by the high
there is an additional advantage: The heat pumps do standards of GeoExchange systems, where work by
not have to be bought or installed until space is leased. Caneta Research finds median maintenance costs with
This both conserves capital until needed and gives in-house service to be 7.5 cents/square foot per year.
ultimate flexibility for tenant fit-out.
Dramatic Energy Cost Savings The GeoExchange system has shown distinct
A systematic study of the savings in the office advantages over conventional HVAC systems in
complex has not yet been attempted, as approximately providing a comfortable and productive environment.
one third is not yet occupied. However, there are good According to Tom O'Hearn of the Galt House,
records for the adjacent hotel complex, for more than a complaints about the heating and cooling system “have
decade: In the hotel, operating costs for the well pump virtually been nonexistent, whereas before we had
and heat exchanger pump are estimated at $1.50 to frequent comments about lack of adequate comfort.”
provide the same energy service as $15 to $20 with a
conventional system. Over the long run, energy cost
savings in the hotel complex have been dramatic ---
about $25,000 a month. Energy costs for the Galt
House East Hotel are about 53 percent of those of the
adjacent original Galt House, which has GeoExchange
systems only on the first three floors. Hotel utility
costs have been reduced by $272,700 a year, with total
energy savings approximately 5.6 million KWh a year.
Though the energy management system and better
insulation in the Galt House East contribute to the
energy savings, the all-GeoExchange system is
responsible for most of the savings. Use of
GeoExchange technology has freed up approximately
25,000 square feet of additional commercial space that
would otherwise have been used for equipment rooms
for a conventional system. For the much larger office
complex, these benefits will be even greater.
Operations and Maintenance Benefits
The entire high efficiency system is built up
from large numbers of a few types (approximately 15
models of various sizes) of distributed heat pumps.
Comfort and Convenience
Obtaining More Information
The Geothermal Heat Pump Consortium, Inc.
(GHPC) is a non-profit organization with participation
and support from the U.S. Department of Energy, the
U.S. Environmental Protection Agency, and the
Nation’s utilities. GHPC can provide a wide variety of
information to help you get started in applying
GeoExchange. GHPC may also be able to provide
design assistance for large or multi-site projects. Call
us toll free at 1-888-ALL-4-GEO (1-888-255-4436).
And visit our web site at http://www.geoexchange.org.

GEOTHERMALENERGY
LUND(Sweden)
Geothermal energy rather takes a subordinate position among renewable energy sources. There aretwo possible sources for it: the radioactive decay of natural radio nuclides which causes the spreadingof heat onto the earth surface, and the storage of solar energy in the top earth layers. For this reason,geothermal energy is available in many places and independent from the different seasons of theyear, even if some regions do have a higher potential than others. In the city of Lund in SouthernSweden the potential is present and is exploited by the Municipality-owned utility.
GENERAL ASPECTS
Lund is a city with 75,000 inhabitants. It is situatedin the Southwest of Sweden in the region ofSkåne. Its history goes back more than 1,000years and the city has an impressive cathedralbuilt in the 12th century. The major neighbouringcity, Malmö, is quite close and due to the buildingof a new bridge crossing Øresund, the Danishcapital Copenhagen will be only 20 kilometresaway by the summer 2000. This makes the cityquite attractive for future businesses. The ancientcity centre and the presence of a big universitymakes the city quite charming.Climatic data:Degree Days (Basis 17 °C): 3154Annual Mean Temperature: 7.5 °C
SWEDEN
StockholmVästeras
GöteborgNorrköping
Umeå
Malmö
Lund
CONTEXT
Already in 1963, the Municipality-owned utility, Lunds Energi AB, started implementingdistrict heating (DH) in the Municipality and today the entire city centre's heat demand iscovered in this way. The aim in the future is to further expand the district heating network tothe housing areas around central Lund. The heat demand in these areas is currently coveredeither by electric heating, by oil furnaces or by natural gas furnaces. Due to the presence ofhot water in the soil under Lund, two geothermal power plants were commissioned in 1985and 1986. The hot water (21 °C) is pumped from 800 metres underground. At present, thegeothermal system supplies 40% of the heat demand in the district heating network. Theremaining part of the heat demand is covered by a combination of oil, biomass and naturalgas combustion.
Apart from the geothermal application, the utility is also active in biomass, using wood chipsin a combined heat and power implementation (CHP). The erection of three wind turbines(with a total installed capacity of 950 kW) and utilisation of district cooling as well, completesthe picture of Lunds Energi and the Municipality as green minded and forward-looking actorsin the energy market. The variety of different energy technologies makes it easy for LundsEnergi to fit the heat and power production to the current price level of the future liberalisedenergy market.

Energie-Cités 2000
EXPERIENCE OF LUND
The basis for the supply of heat in Lund is the pipes used for distributing energy. – Onenetwork is used for distributing hot water (district heating) and one for cold water (districtcooling) The production facilities within Lunds Energi include:• Base load capacity: geothermal heat pumps,• Biomass co-generation plant,• Modern gas and oil boilers,• Electrical boilers,• Extensively extended district heating network,• Gas turbine co-generation,• Hot and cold water accumulator tanks.
The geothermal plants
Due to the presence of the hotwater in the ground below Lund,two geothermal plants with amaximum heat output ofrespectively 20 and 27 MW werecommissioned in 1985 and 1986.The project involved close co-operation between Lunds Energiand the University of Lund. Theprinciple is to pump the 21 °C hotunderground water from a 800metre deep well. This amount ofenergy (flow of water) is thenenriched by a heat pump usingelectricity. This means that thetemperature of the undergroundwater increases to about 80 °C1.The water then passes a heatexchanger that cools the water to4 °C. After cooling, theunderground water is re-injected into the ground. The water for district heating, heated by theheat exchanging system, is now at 77 °C and is used for the heat demand in the city. In idealworking conditions, the heat pump has an overall coefficient of performance (COP) ofapproximately 3.3, meaning that an input of one kWh electricity gives an output of 3.3 kWhheat. This is quite high and is due to the use of the hot water from the underground. Normalheat pumps installed for example in dwellings work with a COP of around 2.7
Maximum heat capacity 47 (20 + 27) MWCoefficient Of Performance 3.3 -Flow of source water 120 L/sTemperature of source water (in – out) 21 – 4 °CCoolant R134a -Heat produced in 1998 313 GWhElectricity consumed in 1998 102 GWh
Technical specifications for the geothermal plants 1 It is possible to increase the temperature to 84 °C, but for technical reasons only 80 °C is used.

Energie-Cités 2000
The temperature gradient in the underground is approximately 3 °C per 100 metres. Thismeans that with a deeper well it would be possible to achieve higher temperatures. This isnot done because of technical problems. Already at 800 metres the water contains largeamounts of salt (6 % volume) and gasses (2.5 litres of gas per 100 litres of water, the gasconsists of 92 % NOx, 3 % methane and 3 % helium). To keep these elements in theunderground water, it is pressurised to 3 Bar. With a deeper well, a higher amount of gassesand salt would be present and therefore higher pressure would be necessary. The methodconsisting in only pumping water from 800 metre deep is cheaper and more secure thandrilling deeper, even though the water would then be at a higher temperature with a higherCOP-figure as a natural result.
The implementation of the geothermal plants has led to a remarkable decrease in the use offossil fuels and associated emissions. It has been calculated that in the first 5 years ofrunning the environmental figures can be shortened to:
Amount of fossil oil fuel saved 200,000 m3
CO2-emission saved 580,000 tonsSO2-emission saved 4,000 tonsNOX-emission saved 1,400 tons
The coolant has until recently been Freon – which, if emitted into the atmosphere,contributes to depleting the ozone layer. In 1995 this was changed to the less aggressiveR134a. This technique, supplying Lund with inexpensive and independently produced heat isnow called "the Lund Model" and is viewed as a good example by experts both in Swedenand on an international level.
Finance
The total investment in the geothermal installations amounts to € 11,7 million2 (nominalvalue). The investment was spread over three years with € 5,480,000 in 1984, € 4,850,000 in1985 and € 1,050,000 in 1986. Later on, an additional € 320,000 was invested. Part of themoney was cheap loans from the government – at that time investments with the objective ofminimising the dependency on oil received support.
District cooling
A district cooling network has been built over the last few years. The network has its ownpipes where cold water is distributed. Water at a temperature of 4 °C is delivered toconsumers and when the water returns, the temperature has risen to 12-15 °C. The districtcooling production plants have their own heat pumps. - The geothermal heat pumps are notused to produce district cooling due to the long distance from the heat pumps to the coolingdemand. On the warmest summer days, the surplus heat from the district cooling heatpumps – fed into the district heating network - is almost as high as the total heat load in theentire district heating network. This means that in the summer, the geothermal heat pumpsproduce less heat than before the installation of district cooling. However on a yearly basis,the geothermal heat pumps produce much more heat than the district cooling heat pumps.
Biomass plant
Lunds Energi has recently invested in the neighbouring utility giving them access to a newbiomass combined heat and power plant. This is situated 7 kilometres from the city of Lund,but with a new connection pipe, the citizens of Lund are now also supplied with biomass-based heat. The investment in the neighbouring utility is another step in the effort to prepare 2 One € equals here 9.49 Swedish Kroner

Energie-Cités 2000
Lunds Energi for the liberalised energy market and to make the utility more independent ofprice fluctuations and other factors that Lunds Energy does not have the possibility ofinfluencing.
The future liberalisation and Lunds Energi
Lunds Energi has recently invested in a huge accumulator tank for storing surplus heatproduction. A new accumulator for cold water for district cooling was also installed justbefore Christmas 1999. This is a very good example of flexibility strategy that they are aimingat in Lund. The combination of heat pumps and electrical boilers that consume electricity, co-generation capacity – partly based on biomass - that produces electricity, and large scalepossibilities for accumulating cold and warm water, makes Lunds Energi's business profitablefor the company and the consumers regardless of the fluctuations in the electricity-, oil,- andgas markets. The new accumulator option gives an additional short-term flexibility, and theco-operation with the neighbouring utility, Eastern Group, as well as investments inNorwegian Hydro Power, complete the picture of an independent energy supplier ready forthe full liberalisation of the energy market.
EVALUATION AND PERSPECTIVES
Lunds Energi AB and its partners have been forward-looking in their energy planning. Theuse of a wide range of different energy technologies makes the utility very flexible andprepared for the free energy market. The advantages in using the local source – theunderground hot water – are remarkable. Independence in foreign markets, use of localknowledge and thereby local employment, improved environment due to less use of fossilfuel and the fact that Lunds Energi is now able to sell the know-how to other countries are allfactors that stress the profitable investment – for the region as a whole. Further progress inchanging from electricity based heat pumps to natural gas based heat pumps has so farbeen postponed due to low electricity prices and possible plans for a future CHP plant. Ifsuch a plant is implemented, the geothermal heat pumps will produce far less energy thantoday. In this case, there will probably be no new investments in the geothermal systems. Ifand when the CHP plant is implemented depends on electricity prices which at present arequite low in Sweden.
FOR FURTHER INFORMATION
Lunds Energi ABTomas NilssonBox 25S – 22100 LUNDTel: +46 46 35 61 53Fax: +46 46 18 92 62E-mail: [email protected]://www.lundsenergi.se
This case study was prepared by Energie-Cités in co-operation with the utility Lunds Energi AB andthe City of Lund. It received funding from the ALTENER Programme of DG Energy and Transport ofthe European Commission.

GEOTHERMAL COMMUNITY ENERGY STUDY
April 2011 Report No. 10-1151-0403
APPENDIX C International Ground Source Heat Pump Association Members, in Charles County, Maryland and in Maryland State

International Ground Source Heat Pump Association
Members List as of April 15, 2011http://www.igshpa.okstate.edu/directory/location_result.asp
State/
Province
Charles County Maryland Members
Cody P. Burch 14263 Burnt Store Rd. Hughesville MD 20637 301-274-0408 [email protected]
Kenneth M. Frank Frank's Well Drilling, Inc. 8260 Crain Hwy. LaPlata MD 20646 301-934-4240 [email protected]
Kevin M. Frank Frank's Well Drilling, Inc. 8260 Crain Hwy. LaPlata MD 20646 301-934-4240 [email protected]
James C. Ikner B & B Heating & Cooling, Inc. 4475 Printers Ct. White Plains MD 20695 301-645-2201
Brooke Matthews B's Plumbing PO Box 2422 Waldorf MD 20604 301-399-0640 [email protected]
Maryland State Members
Joseph C. Ferdinando Thos Somerville Co. 1300 Continental Dr. Abingdon MD 21009 410-698-5569 [email protected]
Doug A. Brenneman Brenneman Well Drilling, Inc. PO Box 245 Accident MD 21520 301-746-8666 [email protected] www.brennemanwelldrilling.com
Mike Brenneman Brenneman Well Drilling, Inc. PO Box 245 Accident MD 21520 301-746-8666 [email protected] www.brennemanwelldrilling.com
Mike Bennaman Bay Heating & Cooling Ltd. 37 Hudson St. Annapolis MD 21401 410-647-1233 [email protected] www.bayheatcool.com
Mac Dahill 987 Chesterfield Rd. Annapolis MD 21401 410-490-7135 [email protected]
Joshua J. Kiffer 1568 Lodge Pole Ct. Annapolis MD 21409 301-249-2142 [email protected]
Mark Schultz Earth River Geothermal 1202 West St. Annapolis MD 21401 410-263-8538 [email protected] www.earthrivergeo.com
Donald O. Zindorf S. J. Johnson, Inc. 14 N. Cherry Grove Ave. Annapolis MD 21401 410- 295-9660 [email protected]
Andrew Cardwell Comfortably Geen LLC 17516 Aquasco Farm Rd. Aquasco MD 20608 301-758-1693 [email protected]
Brock G. Linderman 816 Windsor Rd. Arnold MD 21012 443-336-5890 [email protected]
Michael B. Scott Scott Geothermal, LLC 39125 Cobrums Wharf Rd. Avenue MD 20609 301-908-7039 [email protected] www.scottgeothermal.com
Brian Daniel Comfort Air/B. Daniel HVAC 157 N. Haven St. Baltimore MD 21224 410-984-1977
James Fromm Comfort Air/B. Daniel HVAC 157 N. Haven St. Baltimore MD 21224 410-984-1977
Rich Goetzinger General Heating & Cooling, Inc. PO Box 7819 Baltimore MD 21221 410-574-6586 [email protected] www.generalhc.com
Gary A. Goetzinger General Heating & Cooling, Inc. PO Box 7819 Baltimore MD 21221 410-574-6586 [email protected] www.generalhc.com
Thomas Hartsel Smart Air Mechanical 6410 Landay Ave. Baltimore MD 21237 410-488-0701 [email protected]
Michael W. Huber Chesapeake Geosystems, Inc. 6720 Fort Smallwood Rd. Baltimore MD 21226 410-789-5020 [email protected]
Eric Huffman Chesapeake Geosystems, Inc. 6720 Fort Smallwood Rd. Baltimore MD 21226 410-789-5020 [email protected] www.chesapeakegeosystems.com
Mark R. Huntley General Heating & Cooling, Inc. 111 Eyring Ave. Baltimore MD 21221 410-574-6586 [email protected] www.generalhc.com
Denny Kougianos Supreme Air, LLC. 6203 Collinswat Rd. Baltimore MD 21228 410-788-1114 [email protected] www.supremeairllc.com
Jamie Larson Chesapeake Geosystems, Inc. 6720 Fort Smallwood Rd. Baltimore MD 21226 410-789-5020 [email protected]
Dionisio J. Martinez Allied Environmental Services, Inc. 1536 E. Clement St. Baltimore MD 21230 410-365-2195 [email protected]
Kevin Montgomery Chesapeake Geosystems, Inc. 6720 Fort Smallwood Rd. Baltimore MD 21226 410-789-5020 [email protected]
Chris Montgomery Chesapeake Geosystems, Inc. 6720 Fort Smallwood Rd. Baltimore MD 21226 410-789-5020 [email protected]
Michael O. Onyeje 5450 Reisterstown Rd., # 101 Baltimore MD 21215 410- 448-1713 [email protected]
Daniel Patton Patton Well Drilling 6810 Cornell Rd. Baltimore MD 21220 410-592-8662 [email protected] www.pattonwelldrilling.com
Fred Reinthaler Aire-Craft Heating & Cooling PO Box 35210 Baltimore MD 21222 410-433-7079 [email protected]
Phone Email WebName Company Address City Zip

International Ground Source Heat Pump Association
Members List as of April 15, 2011http://www.igshpa.okstate.edu/directory/location_result.asp
State/
Province Phone Email WebName Company Address City Zip
Patrick E. Smith America's Best HVAC, Inc. 4401 Eastern Ave. Box #3 Baltimore MD 21224 443-250-0346 america'sbesthvac1Wverizon.net
Matthew Spencer EBL Engineers LLC 8005 Harford Rd. Baltimore MD 21234 410-668-8000 [email protected] www.eblengineers.com
John Stoltzfus Chesapeake Geosystems, Inc. 6720 Fort Smallwood Rd. Baltimore MD 21126 410-913-9583 [email protected]
William S. Streeter Scott's A/C & Heating, Inc. 2 Right Elevator Dr. Baltimore MD 21220 410-391-9398 [email protected]
David Tartaglia American Mechanical 3042 Edgewood Ave. Baltimore MD 21234 410-668-4872 [email protected]
Michael Barlow Michael Barlow Well Drilling Service, Inc. 522 Underwood Lane Bel Air MD 21014 410-838-6910 [email protected] www.michaelbarlowwelldrilling.com
Daniel Barlow Michael Barlow Well Drilling 522 Underwood Lane Bel Air MD 21014 410-838-6910 [email protected] www.mbwd.us
Kenneth N. Blevins Blevins Heating & Cooling 2005 Churchville Rd. Bel Air MD 21015 410-838-3636 [email protected]
Carroll J. Hess Michael Barlow Well Drilling Service, Inc. 522 Underwood Lane Bel Air MD 21014 410-838-6910
Chris Hiser Michael Barlow Well Drilling Service, Inc. 522 Underwood Lane Bel Air MD 21014 410-838-6910
Michael Isom Michael Barlow Well Drilling Service, Inc. 522 Underwood Lane Bel Air MD 21014 410-688-0261 [email protected] www.michaelbarlowwelldrilling.com
David Klecan I S C O Industries LLC 1216 Kirby Circle Bel Air MD 21015 800-345-4726-5365 [email protected] www.isco-pipe.com
Charles Lawyer Barlow Well Drilling Services 522 Underwood Lane Bel Air MD 21014 410-838-6910
Joe Williamson Michael Barlow Well Drilling 718 Flintlook Dr. Bel Air MD 21015 443-504-3300
Diane P. Douglas 4519 Elmwood Rd. Beltsville MD 20705 301-595-7369 [email protected]
Gary P. Frank Gary P. Frank, Inc. 8918 Ridge Pl. Bethesda MD 20817 301-493-5766 [email protected]
James M. Gigeous Proficient Air 21175 San Mar Rd. Boonsboro MD 21713 301-714-0279 [email protected]
Phillip A. Grove 13041 Marquette Lane Bowie MD 20715 301-262-7213 [email protected]
Sabir M. Manteen 12901 Woodmore Rd. Bowie MD 20721 301-523-7256 [email protected]
Dustyn Owens Owens Comfort Systems 2001 Hideout Lane Bowie MD 20716 410-741-9340 [email protected] www.thomasrowens.com
Thomas R. Owens 2001 Hideout Lane Bowie MD 20716 410-414-5878 [email protected]
David M. Thomas 329 Haviland Mill Rd. Brookeville MD 20833 301-787-2151
Richard Winslow Aqua Well Drilling, LLC 20378 Killdeer Lane Callaway MD 20620 301-994-3755 [email protected] www.aquawelldrilling.com
Paul D. Gill, Sr. Inviron Systems LLC 209 Tilghman Neck Rd. Centreville MD 21617 410-758-4999 [email protected]
Gary S. Harkins, Jr. 8995 St. Andrews Dr. Chesapeake Beach MD 20732 443-532-0332
Terry L. Artman Total Energy Concepts, Inc. PO Box 605 Churchville MD 21028 410-399-5667 [email protected] www.totalenergyonline.com
Mauricio Rodriguez 12421 Fountain Dr. Clarksburg MD 20871 240- 449-9741 [email protected]
Ben Silverstein Maryland Energy Saver 7418 Oak Crest Lane Clarksville MD 21029 301-604-4170 [email protected] www.marylandenergysaver.com
Joshua L. Barnhart H & H Well Drilling PO Box 318 Clear Spring MD 21722 301-842-3563 [email protected] www.handhwelldrilling.com
Glenn S. Rager 43 S. Martin St., PO Box 472 Clear Spring MD 21722 301- 573-5094 [email protected]
Jon G. Towns H & H Well Drilling PO Box 318 Clear Spring MD 21722 301-842-3563 [email protected] HandHwelldrilling.com
Tom Le S C W, Inc. 7365 Old Alexandria Ferry Rd. Clinton MD 20735 301-856-4000 [email protected]
Maurice Dixon III G. Edgar Harr Sons 12047 Falls Rd. Cockeysville MD 21030 410-252-4588
George Gardes Allen & Shariff Corp. 7061 Deepage Dr. Columbia MD 21045 410-381-7100 [email protected] www.allenshariff.com

International Ground Source Heat Pump Association
Members List as of April 15, 2011http://www.igshpa.okstate.edu/directory/location_result.asp
State/
Province Phone Email WebName Company Address City Zip
Zack H. Shariff Allen & Shariff Corp. 7061 Deepage Dr. Columbia MD 21045 410-381-7100 [email protected]
Tatyana N. Shine Shine, Allen & Shariff LLC 7061 Deepage Dr., Ste, 103A Columbia MD 21045 443-545-1501 [email protected]
George Fritz Horizon Builders 2131 Espey Ct. Crofton MD 21114 410-721-4877 [email protected] www.horizonbuilders.net
Mike Hirschbock Matrix Mechanical, Inc. 2406 Crofton Blvd. Crofton MD 21114 410-451-2665 [email protected]
Steven L. Ward Matrix Mechanical, Inc. 2406 Crofton Blvd. Crofton MD 21114 410-451-2665 [email protected]
Stephen C. Watson Matrix Mechanical, Inc. 2406 Crofton Blvd. Crofton MD 21114 410-451-2665 [email protected] www.matrixmechanical.org
James D. Johnson J. D. Johnson Well Drilling & Pumps 13425 Bedford Rd., NE Cumberland MD 21502-6918 301-77-9355 [email protected]
Kim Keller Aircon Engineering, Inc. 7 Williams St. Cumberland MD 21502 301-722-7269 [email protected] www.airconeng.com
Robert D. Webber Webbers Heating & A/C Co. PO Box 37 Damascus MD 20872 301-253-3557 [email protected] www.webbershvac.com
Gary W. Baldwin Ground Loop Heating & A/C 1701 A Whiteford Rd. Darlington MD 21034 410-836-1706
Stephen Barbieri Ground Loop Inc., Heating & Air 1701-A Whiteford Rd. Darlington MD 21034 410-836-1706 www.groundloop.com
Keith L. Barney Ground Loop Heating & A/C 1701 A Whiteford Rd. Darlington MD 21034 410-836-1706 [email protected]
Ray A. Butler Ground Loop Heating & A/C 1701 A Whiteford Rd. Darlington MD 21034 410-836-1706
Marc Callahan Ground Loop Inc., Heating & Air 1701-A Whiteford Rd. Darlington MD 21034 410-836-1706 www.groundloop.com
Michael B. Chapline Ground Loop Heating & A/C 1701 A Whiteford Rd. Darlington MD 21034 410-836-1706
Carl J. Cochran, Jr. Ground Loop Inc., Heating & Air 1701-A Whiteford Rd. Darlington MD 21034 410-836-1706 www.groundloop.com
Joe Cochran, Jr. Ground Loop Heating & A/C 1701 A Whiteford Rd. Darlington MD 21034 410-836-1706
Matthew F. Cochran, Sr. Ground Loop Heating & A/C 1701 A Whiteford Rd. Darlington MD 21034 410-836-1706 [email protected]
Brian P. Creaney Ground Loop Heating & A/C 1701 A Whiteford Rd. Darlington MD 21034 410-836-1706 [email protected]
Michael E. Cullum Ground Loop Heating & A/C 1701 A Whiteford Rd. Darlington MD 21034 410-836-1706 [email protected]
Gary Cullum Ground Loop Inc., Heating & Air 1701-A Whiteford Rd. Darlington MD 21034 410-836-1706 www.groundloop.com
Jason P. Cullum Ground Loop Heating & A/C 1701 A Whiteford Rd. Darlington MD 21034 410-836-1706
Ted J. Evans Ground Loop Heating & A/C 1701 A Whiteford Rd. Darlington MD 21034 410-836-1706
Dan F. Everett Ground Loop Heating & A/C 1701 A Whiteford Rd. Darlington MD 21034 410-836-1706
Walter W. Findley, III Ground Loop Inc., Heating & Air 1701-A Whiteford Rd. Darlington MD 21304 410-836-1706 www.groundloop.com
Joseph A. Heads Ground Loop Heating & A/C 1701 A Whiteford Rd. Darlington MD 21034 410-836-1706
Joe A. Heaps Ground Loop Inc., Heating & Air 1701-A Whiteford Rd. Darlington MD 21034 410-836-1706
Mark D. Kivinski Ground Loop Heating & A/C 1701 A Whiteford Rd. Darlington MD 21034 410-836-1706
Scott P. Lawrence Ground Loop Inc., Heating & Air 1701-A Whiteford Rd. Darlington MD 21034 410-836-1706 www.groundloop.com
Brandon Lawrence Ground Loop Inc., Heating & Air 1701-A Whiteford Rd. Darlington MD 21034 410-836-1706 www.groundloop.com
George A. Lawrence, Jr. Ground Loop Inc., Heating & Air 1701-A Whiteford Rd. Darlington MD 21034 410-836-1706 www.groundloop.com
Allen E. Mays Ground Loop Heating & A/C 1701 A Whiteford Rd. Darlington MD 21034 410-836-1706 [email protected]
Warren W. Perger Ground Loop Inc., Heating & Air 1701-A Whiteford Rd. Darlington MD 21034 410-836-1706 www.groundloop.com
William S. Pickle Ground Loop Inc., Heating & Air 1701-A Whiteford Rd. Darlington MD 21034 410-836-1706 www.groundloop.com

International Ground Source Heat Pump Association
Members List as of April 15, 2011http://www.igshpa.okstate.edu/directory/location_result.asp
State/
Province Phone Email WebName Company Address City Zip
Adam N. Presberry Ground Loop Heating & A/C 1701 A Whiteford Rd. Darlington MD 21034 410-836-1706 [email protected]
Roy W. Reed Ground Loop Inc., Heating & Air 1701-A Whiteford Rd. Darlington MD 21034 410-836-1706 www.groundloop.com
Robert J. Sams Ground Loop Heating & A/C 1701 A Whiteford Rd. Darlington MD 21034 410-836-1706 [email protected]
Nicholas A. Schaeffer Ground Loop Heating & A/C 1701 A Whiteford Rd. Darlington MD 21034 410-836-1706 [email protected] www.groundloop.com
Darren L. Short Ground Loop Heating & A/C 1701 A Whiteford Rd. Darlington MD 21034 410-836-1706
Paul T. Tipton Ground Loop Inc., Heating & Air 1701-A Whiteford Rd. Darlington MD 21034 410-836-1706 [email protected] www.groundloop.com
Daniel True Ground Loop Inc., Heating & Air 1701-A Whiteford Rd. Darlington MD 21034 410-836-1706 www.groundloop.com
Brandon Owens Owens Comfort Systems PO Box 348 Davidsonville MD 21035 888-776-9367 [email protected] www.owenscomfortsystems.com
Dustin T. Wood Lifetime Well Drilling 22726 Deep Branch Dr. Denton MD 21629 410-829-7482 [email protected]
Matt Gubisch 17225 Founders Mill Dr. Derwood MD 20855 301-370-5340 [email protected]
Pierre M. Lefever BST Design 15801 Avery Rd. Derwood MD 20855 240-893-7546 [email protected]
Brian Olsen Michael Barlow Well Drilling 7531 Westfield Rd. Dundalk MD 21222 410-207-0465
Lloyd A. Kinch 4310 Landing Lane Dunkirk MD 20754 301-855-8442 [email protected]
Eric A. Zink PO Box 311 East New Market MD 21631 410-943-0247 [email protected]
Joshua T. Arquiett C. Albert Mattews 500 S. St. Ext. Easton MD 21601 410-822-0900 [email protected]
Ernie M. Brice C. Albert Mathews, Inc. PO Box 190 Easton MD 21601 410-770-3368
Huey J. Erskine 29315 Will St. Easton MD 21601 410-924-8185
John M. Pritchett C. Albert Matthews, Inc. 500 S. Street Easton MD 21601 410-822-0900 [email protected] www.matthewshvac.com
David Tull PO Box 806 Easton MD 21601 410- 820-2080
Ryan R. Butler 3673 Bay Dr. Edgewater MD 21037 410- 798-6134 [email protected]
Adam Santry Slater Well Drilling PO Box 176 Edgewater MD 21037 410-956-5334 [email protected] www.slaterwells.com
Steven Draper Advanced Environmental Concepts 5292 Enterprise St., Ste. C Eldersburg MD 21784 410-795-5955 [email protected] www.aecenviro.com
Burnet Chalmers Milby Company 6201 S. Hanover Rd. Elk Ridge MD 21227 410-796-7700 [email protected] www.milbyco.com
Ricardo D. Adams 6217 Greenleaf Lane Elkridge MD 21075 410-379-2595 [email protected]
Dan Latta Milby Co. 6201 S. Hanover Rd. Elkridge MD 21075 410-796-7700 [email protected] www.milbyco.com
Neil Granger Air-Care Services, Inc. 2380 Singerly Rd. Elkton MD 21921 410-392-0550 [email protected]
Terry Weaver Dream Weaver Mechanical 237 Sycamore Rd. Elkton MD 21921 410-920-6235 [email protected]
Shana Opdyke 10130 Rt. 99 Ellicott City MD 21042 410-4580289 [email protected]
Robert H. Ross 5858 Donovan Lane Ellicott City MD 21043 410-409-7453 [email protected]
Eric G. Chaney 9120 Jordan Rd. Fairplay MD 21733 301- 223-5592 [email protected]
Joseph F. Opdyke Watervale Heating & A/C, Inc. 2116 Watervale Rd. Fallston MD 21047 410-879-0292
Henry B. Snyder IV Watervale Heating & A/C 2116 Watervale Rd. Fallston MD 21047 410-879-0292
Bryan S Vaughan Watervale Heating & A/C 2116 Watervale Rd. Fallston MD 21047 410-879-0292
Jim Haselman Haselman Quality Air, Inc. 27791 Bullock Rd. Federalsburg MD 21632 410-479-0631 [email protected]

International Ground Source Heat Pump Association
Members List as of April 15, 2011http://www.igshpa.okstate.edu/directory/location_result.asp
State/
Province Phone Email WebName Company Address City Zip
Rick C. Barber Rick Barber Well Service 2928 Grier Nursery Rd. Forest Hill MD 21050 443-807-9032
James C. Corso 6397 Kelly Ct. Frederick MD 21703 240- 629-8123 [email protected]
Michael T. Dietrich 6739A S. Clifton Rd. Frederick MD 21703 301-471-0573 [email protected]
George Dodson US Silica Co. 8490 Progress Dr., Ste. 300 Frederick MD 21701 304-258-8235 [email protected]
Gerald G. Lease Lease Brothers Sheetmetal, Inc. 4580B Mack Ave. Frederick MD 21703 301-695-1254
Stephen W. Saul B L Myers Bros. of MD LLC 5112 Pegasus Ct., Ste. 5 Frederick MD 21704 301-668-1044 [email protected] www.blmeyers.com
Michael Shanaberger Hilles-Carnes Engineering 49559 New Design Rd., Ste. 107 Frederick MD 21703 301-662-2522
Jon Tucker Connelly & Assoc. 567 Lancaster Pl. Frederick MD 17303 240-577-2321 [email protected]>[email protected]
Richard W. Hottel Hottel Energy Group 18900 Woodfield Rd. Gaithersburg MD 20879 301-921-9599 [email protected] www.harveyhottel.com
Mark R. Hottel Hottel Energy Group 18900 Woodfield Rd. Gaithersburg MD 20879 301-921-9599 [email protected] www.harveyhottel.com
Lee C. Marsteller 9 Welland Ct. Gaithersburg MD 20878 301-610-9191 [email protected]
Jeff Wheat James A. Wheat & Sons, Inc. 7834 Beechcraft Ave. Gaithersburg MD 20879-1543 301-670-1944 [email protected] www.wheatandsons.com
Erik Deklau E & M Plumbing Heating & Cooling Services LLC 907 Echo Bay Ct. Gambrills MD 21054 410-721-9827 [email protected]
Jeff Amateau Vika, Inc. 20251 Century Blvd., Ste. 400 Germantown MD 20874 301-916-4100 [email protected]
Duniesky J. Garcia 11217 Old Carriage Rd. Glen Arm MD 21057 443-629-4771 [email protected]
Thomas L. Brown T. L. B. Associates, Inc. 7280 Baltimore Annapolis Blvd. Glen Burnie MD 21061 443-871-3648 [email protected] et
Thomas N. Johannes R. E. Michel Co., Inc. 1 R. E. Michel Dr. Glen Burnie MD 21060 410-760-4000 [email protected] www.remichel.com
Mike Michel, Jr. R. E. Michel Co., Inc. One RE Michel Dr. Glen Burnie MD 21060 410-760-4000 [email protected] www.remichel.com
Frank Schneider R. E. Michel Co., Inc. One RE Michel Dr. Glen Burnie MD 21060 410-760-4000 [email protected] www.remichel.com
John Trancucci Unique Indoor Comfort, Inc. 152 Blades Lane Glen Burnie MD 21060 410-760-2121 [email protected] www.baltimoreunique.com
Floyd B. Wilson R. E. Michel Co., Inc. 1 R. E. Michel Dr. Glen Burnie MD 21060 410-553-3835 [email protected] www.remichel.com
Scott York Rock & Dirt Construction 12220 Grandview Rd. Grandview MD 64078 816-763-3671 [email protected]
Kirk E. Kuginskie Great Mills HVAC PO Box 96 Great Mills MD 20634 301-994-0522
Joseph C. Barnes 11005 Bower Ave. Hagerstown MD 21740 301- 573-5093 [email protected]
Robert J. Hill H & H Well Drilling, LLC 10236 Sharpsburg Pike Hagerstown MD 21740 301-842-3563 [email protected] www.handhwelldrilling.com
Michael S. Johnston M. S. Johnston Co. 13261 Pennsylvania Ave. Hagerstown MD 21742 301-733-1066 [email protected] www.msjohnston, com
Michael K. Yeakle Mike Yeakle's Heating & A/C 635 Summit Ave. Hagerstown MD 21740 301-573-0968 [email protected]
Philip Casagrande Earth & Air Technologies LLC 445 Hand Ct. Hampstead MD 21074 717-514-5528 [email protected]
Thomas W. Hoffmaster II Carrier Mid-Atlantic 7010 Dorsey Rd. Hanover MD 21076 410-981-4480 [email protected]
Thomas P. Windmiller Carrier Mid-Atlantic 7010 Dorsey Rd. Hanover MD 21076 410-981-4480 [email protected]
George R. Pennington III Accurate Air Mechanical 1101 Revolution St. Havre de Grace MD 21078 410-939-1731 [email protected]
Martin Harrison Wilfre Co., Inc. 8161 Memory Gardens Lane Hebron MD 21830 410-749-0496 [email protected]
Bill Harrison Wilfre Co., Inc. 8161 Memory Gardens Lane Hebron MD 21830 410-749-0496 [email protected]
William R. Harrison, Jr. Wilfre Co., Inc. 8161 Memory Gardens Lane Hebron MD 21830 410-749-0496 [email protected]

International Ground Source Heat Pump Association
Members List as of April 15, 2011http://www.igshpa.okstate.edu/directory/location_result.asp
State/
Province Phone Email WebName Company Address City Zip
Jason T. Fridley 43346 Johnson Rd. Hollywood MD 20636 301- 481-3696 [email protected]
Frank Simmons Simmons Heating & A/C, Inc. 23906 Mervell Dean Rd. Hollywood MD 20636 301-373-4780 [email protected] www.simmons-hvac.com
Buddy Winslow Winslow Pump & Well, Inc. PO Box 521 Hollywood MD 20636 301-373-2200 [email protected] www.winslowpumpandwell.com
Curtis Winslow Winslow Pump & Well, Inc. PO Box 521 Hollywood MD 20636 301-373-2200 [email protected] www.winslowpumpandwell.com
Larry Murray R & R HVAC 3101 Holland Cliff Rd. Huntingtown MD 20639 410-320-3616 [email protected] [email protected]
Norman C. Perry 960 Grace Rd. Huntingtown MD 20639 443-550-3724 [email protected]
Kelly M. Krick, Sr. Jiffy Plumbing & Heating, Inc. 4623 Baltimore Ave. Hyattsville MD 20781 301-277-9111 [email protected]
Pete Kristiansen Jiffy Plumbing & Heating, Inc. 4623 Baltimore Ave. Hyattsville MD 20781 301-277-9111 [email protected]
Scott A. Dufour Jones Well Drilling, Inc. 3700 Rush Rd. Jarrettsville MD 21084 410-557-8123 [email protected]
Mark R. Grubb C & D Sheet Metal, Inc. PO Box 71 Jarrettsville MD 21084 410-557-9927
Josh R. Holmes Jones Well Drilling, Inc. 3700 Rush Rd. Jarrettsville MD 21084 410-692-6981 [email protected]
David Kelly Jones Well Drilling, Inc. 3700 Rush Rd. Jarrettsville MD 21084 410-692-6981 [email protected]
Harvey W. Knopp, Jr. Jones Well Drilling, Inc. 3700 Rush Rd. Jarrettsville MD 21084 410-692-6981 [email protected]
Matthew Moffitt Jones Well Drilling, Inc. 3700 Rush Rd. Jarrettsville MD 21084 410-692-6981 [email protected]
Jeff A. Molen Jones Well Drilling, Inc. 3700 Rush Rd. Jarrettsville MD 21084 410-692-6981 [email protected]
Jason D. Morrison Jones Well Drilling, Inc. 3700 Rush Rd. Jarrettsville MD 21084 410-692-6981 [email protected]
Robert Pickle Sr. C & D Sheet Metal, Inc. PO Box 71 Jarrettsville MD 21084 410-557-9927 [email protected]
Mark S. Rutherford Jones Well Drilling, Inc. 3700 Rush Rd. Jarrettsville MD 21084 410-692-6981 [email protected]
Richard L. Spitznogle PO Box 26 Jessup MD 20794 410- 299-9097
Stephen P. Delosh 5521 Woodbury Walk Keedysville MD 21756 301-432-0693 [email protected]
Brian E. Lind Lind Heating & Cooling, Inc. 11720 Good Intent Rd. Keymar MD 21757 301-898-7754 [email protected]
Brian McCully McCully Mechanical Services 4331 St. Marks Rd. Knoxville MD 21758 888-799-9557 [email protected]
Roger Hinkle Minnick's, Inc. 5200 Minnick Rd. Laurel MD 20707 301-953-2820 [email protected] www.minnicks.net
Randy Minnick Minnick's Inc. 5200 Minnick Rd. Laurel MD 20707 301-953-2820 [email protected] www.minnicks.net
David Dickmyer W & S Green Service PO Box 77 Lineboro MD 21088 410-984-0569 [email protected]
James F. Johnson JFJ Energy Services LLC 5480 Southern Maryland Blvd. Lothian MD 20711 443-684-3954 [email protected]
David E. Stith 4822 Barn Pl. Lothian MD 20711 410-867-8647 [email protected]
Terry A. Briggs 3044 Lighthouse Blvd. Lusby MD 20657 410-394-1067 [email protected]
Ben L. Logan 489 Pecos Circle Lusby MD 20657 443-532-0148
Keith A. Wivell PO Box 519 Maugansville MD 21767 301- 733-8534 [email protected]
Josh Rush Rush Services PO Box 577 McHenry MD 21541 301-387-6481 [email protected]
Raymond T. Docherty 1643 Bowly's Quarter Rd. Middle River MD 21220
Lydia C. Patton Patton Well Drilling 6810 Cornell Rd. Middle River MD 21220 410-592-8662 [email protected] www.pattonwelldrilling.com
William J. Guizzardi Allied Environmental Services, Inc. PO Box 1242 Millersville MD 21108 410-789-2711 [email protected] www.alliedwells.com

International Ground Source Heat Pump Association
Members List as of April 15, 2011http://www.igshpa.okstate.edu/directory/location_result.asp
State/
Province Phone Email WebName Company Address City Zip
Brett Sweeney Allied Environmental Services PO Box 1242 Millersville MD 21108 410-789-2711 [email protected] www.alliedwells.com
Larry Collins One Hour A/C & Heating 2702 Back Acre Circle Mount Airy MD 21771 301-515-1001 [email protected] www.onehourair.com
Richard Crummitt L. F. Easterday, Inc. 9265 Brown Church Rd. Mount Airy MD 21771 301-829-1640
David Easterday L F Easterday, Inc. 9265 Brown Church Rd. Mount Airy MD 21771 301-829-1640 [email protected] easterdaywells.com
Luke R. Mark 8301 Mapleville Rd. Mount Airy MD 21771 410-795-5528
Larry A. Miller Easterday Well & Pump 9265 Brown Church Rd. Mount Airy MD 21771 301-831-5170 [email protected]
Jessie R. Stewart 12773 Barnett Dr. Mount Airy MD 21771 301-685-6565 [email protected]
Louis F. Easterday, Jr. Easterday Well & Pump, Inc. 9265 Brown Church Rd. Mt. Airy MD 21771 301-831-5170 [email protected] www.easterdaywells.com
Travis Kirby L. F. Easterday Well & Pump 9265 Brown Church Rd. Mt. Airy MD 21771 301-829-1640 [email protected]
Lester C. Simmons, Jr. Easterday Well & Pump, Inc. 9265 Brownchurch Rd. Mt. Airy MD 21771 301-831-5170
Lester Simmons, Sr. Easterday Well & Pump, Inc. 9265 Brown Church Rd. Mt. Airy MD 21771 301-831-5170 [email protected]
Marc DeLaMidiere 6109 Poindexter Lane North Bethesda MD 28852 301-503-2655 [email protected]
Andrew Bissett Long Green Drilling 70 Bethel Church Rd. North East MD 21901 410-713-6941 [email protected] www.longgreendrilling.com
Skyler Bolden Wayne's Water 'n' Wells, Inc. 19139 Garrett Hwy. Oakland MD 21550 301-387-7181 [email protected] www.wayneswells.com
Wayne T. Bolden Wayne's Water 'n Wells, Inc. 19139 Garrett Hwy. Oakland MD 21550 301-387-7181 [email protected]
Jesika L. Bolden Wayne's Water 'n' Wells, Inc. 19139 Garrett Hwy. Oakland MD 21550 301-387-7181 www.wayneswells.com
Cobenn Bolden Wayne's Water 'n' Wells, Inc. 19139 Garrett Hwy. Oakland MD 21550 301-387-7181 [email protected] www.wayneswells.com
Brian P. Bystry Progressive Contracting Co., Inc. 10 N. Riggers Lane Owings Mills MD 21117 410-356-9096 X101 [email protected] www.progressivecontracting.com
Bill Kelly Ambassador Services, Inc. 8 Music Fair Rd., Ste. K Owings Mills MD 21117 410-833-1575 [email protected]
Daren E. Harbaugh 12 Patricks Ct. Parkton MD 21120 443-255-4527 [email protected]
Robert Copsey Wolford's Well & Pump Service, Inc. 4429 Mountain Rd. Pasadena MD 21122 410-437-3957 [email protected] www.wolfordswellnandpump.com
John B. McKinnon, Jr. Wolford's Well & Pump Service, Inc. 4429 Mountain Rd. Pasadena MD 21122 410-437-3957 [email protected] www.wolfordswellandpump.com
Charles A. Youngbar, Jr. Allied Environmental Services, Inc. 116 Brookfield Rd. Pasadena MD 21122 410-458-9086
John T. Youngbar, Sr. Able Well & Pump Service 8156 Solley Rd. Pasadena MD 21122 410-437-3386 [email protected]
Brian B. Misler 113 Ruth Eager Ct. Pikesville MD 21208 410-667-6336 [email protected]
David Cahoon Affordable Geo-Thermal Systems 16615 Budd Rd. Poolesville MD 20837 301-972-7650 [email protected] affordablegeo.com
William A. Kinney Trinity Ice and Waterworks 3935 Dogwood Rd. Port Republic MD 20676 410-586-3338 [email protected] www.trinityice.com
Frank Jackson Continental Services PO Box 1129 Prince Frederick MD 20678 410-535-0091 [email protected] www.continentalservices.net
Brandon T. Owens 334 Cambridge Pl. Prince Frederick MD 20678 540-727-8102 [email protected]
Ajai Viswambharan 1070 Westfield Dr. Prince Frederick MD 20678 410-878-7036 [email protected]
Rick Gilmore Advanced Heating & Cooling LLC 212 Business Center Dr. Reisterstown MD 21136 410-833-9445 [email protected] www.advancedhc.com
Luis A. Villafania Advanced Heating & Cooling LLC 212 Business Center Dr. Reisterstown MD 21136 410-833-9445 [email protected] www.advancedhc.com
Tracy Dove Energy Industry Today 164 Moore Dr Rockville MD 20850 443-695-1013 [email protected]
David E. Gordon 6109 Poindexter Lane Rockville MD 20852 301-556-7262 [email protected]

International Ground Source Heat Pump Association
Members List as of April 15, 2011http://www.igshpa.okstate.edu/directory/location_result.asp
State/
Province Phone Email WebName Company Address City Zip
Andy J. Trewhitt 100 1st St. 152 Rockville MD 20851 941-806-7864 [email protected]
Victor L. Disharoon Wicomico Heating & Air, Inc. PO Box 1883 Salisbury MD 21802 410-742-5542 [email protected] www.wicomicoheatingandair.com
David Van der Vossen, PE Allen & Shariff Corp. 205 East Market St. Salisbury MD 21801 410-341-0200 [email protected] www.allenshariff.com
Joseph Zimmer, Jr. Joseph M. Zimmer, Inc. 2225 Northwood Dr. Salisbury MD 21801 410-546-5700 [email protected]
John Davidson Loves Heating & Air PO Box 396 Severn MD 21144 410-551-1376 [email protected]
Samuel A. Connelly 5000 Brigets Ct. Sharpsburg MD 21782 301-416-2557
William H. Johansen 18100 Horseshoe Bend Rd. Sharpsburg MD 21782 301-432-4827 [email protected]
Mark Carpenter Dynatemp, Inc. 12059 Tech Rd. Silver Spring MD 20904 301-625-6500 [email protected] www.dynatemphvac.com
John M. Clower BMC/Clower Heating & A/C, Inc. 9160 B Brookville Rd. Silver Spring MD 20910 301-562-9001 [email protected] www.bmcclowerhvac.com
Chip Hackshaw Dynatemp, Inc. 12059 Tech Rd. Silver Spring MD 20904 301-625-6500 [email protected] www.dynatemphvac.com
Thomas G. Hackshaw Dynatemp, Inc. 12059 Tech Rd. Silver Spring MD 20904 301-625-6500 [email protected] www.dynatemphvac.com
Mark J. Myers BMC Installation Heating & A/C 8854 Monard Dr., Bldg. 5 Silver Spring MD 20910 301-562-9008 [email protected] www.bmcmyers.com
Jason M. Welch Thomas E. Clark 9325 Fraser Ave. Silver Spring MD 20910 202-438-1669 [email protected]
Robert P. Aaron Total Comfort Heating & A/C, Inc. PO Box 643 Smithburg MD 21783 301-824-3700 [email protected] www.TCHVAC.net
James E. Aaron Total Comfort Heating & A/C, Inc. PO Box 643 Smithsburg MD 21783 301-824-3700 [email protected] www.TCHVAC.net
Troy Jernigan Jernigan's Environmental Services, Inc. 22725 Stevenson Rd. Smithsburg MD 21783 301-790-0450 [email protected]
John Peach Fidelity Engineering Corp. 25 Loveton Circle Sparks MD 21152 410-771-9400
Carl E. Woods Fidelity Engineering Corp. 25 Loveton Circle Sparks MD 21152 410-771-9400
Sean Hunt Shaw's A/C, Inc. PO Box Y St. Michaels MD 21663 410-745-9338 [email protected] www.shawsair.com
Allan Sharkey Artistic Design Consulting & Supply, Inc. 100A Island Professional Park Stevensville MD 21666 410-607-3883 [email protected] www.allan-sharkey.com
Edward T. Grierson III S J Johnson, Inc. PO Box 66 Sunderland MD 20689 410-257-2515 [email protected]
Justin E. Rock 1606 Otter Dale Mill Rd. Taneytown MD 21787 443-398-1242 [email protected]
Michael T. Grissom Cornerstone Heating & A/C, Inc. 101 Radio Lane Thurmont MD 21788 240-674-3100 [email protected]
Dennis Norris, PE 11717 Green Valley Rd. Union Bridge MD 21791 301-524-3430 [email protected]
Steven Selander S & S Geothermal Drilling, Inc. 9808 Stephen Decatur Hwy., Unit 7C West Ocean City MD 21842 410-213-8884 [email protected] www.ssgeodrill.com
Neil R. Boger Modern Comfort Systems 100 Airport Dr. Westminster MD 21157 410-848-2200 [email protected] www.moderncomfortsystems.com
Joshua Dietz A-Quality HVAC 1824 Ridge Rd. Westminster MD 21157 410-984-7776
Mark E. Eppig 314 Bishop Ct. Westminster MD 21157 443- 340-6123 [email protected]
Nathan E. Fuhrman Hydro-Terra Group 198 Pennyslvania Ave. Westminster MD 21157 443-974-2527 [email protected]
Ronald Kyker Westminster Well Drilling, Inc. PO Box 861 Westminster MD 21157 410-848-4190 [email protected]
Dana Kyker, III Westminster Well Drilling, Inc. PO Box 861 Westminster MD 21157 410-876-1911 [email protected]
Earl V. Post Energy Savers America 310 Woodward Road, Ste. 3 Westminster MD 21157 410-751-9700 [email protected] www.aqualityhvac.com
James L. Simons Modern Comfort Systems 100 Airport Dr. Westminster MD 21157 410-848-2200
Mark A. Utz Mark A. Utz & Co., Inc. 55 Aileron Ct., Ste. 1 Westminster MD 21157 410-848-5712 [email protected] www.utzheatingandcooling.com

International Ground Source Heat Pump Association
Members List as of April 15, 2011http://www.igshpa.okstate.edu/directory/location_result.asp
State/
Province Phone Email WebName Company Address City Zip
Michael T. Hall Somerset Well Drilling Co., Inc. PO Box 67 Westover MD 21871 410-651-3721
Douglas Layne Somerset Well Drilling Co., Inc. PO Box 67 Westover MD 21871 410-651-3721 [email protected]
Andrew M. Price Somerset Well Drilling Co., Inc. PO Box 67 Westover MD 21871 410-651-3721
R. Steven Bird Absolute Zero Heating & A/C, LLLP 15504 Fallin Waters Rd. Williamsport MD 21795 301-223-4040 [email protected] www.abzerocooling.com
Michael Wathen Care Services, Inc. PO Box 248 Williamsport MD 21795 301-223-5749 [email protected] www.careservices.inc.com
Fred Chandler Mid Atlantic Contracting, Inc. 7749 Woodbine Rd. Woodbine MD 21797 410-795-4800 [email protected] www.midatlanticcontracting.com
Andrew Parks Mid Atlantic Contracting, Inc. 7749 Woodbine Rd. Woodbine MD 21797 410-795-4800 [email protected]
Jarrod N. Matlock 1701 Woodstock Rd. Woodstock MD 21163 410-480-9701 [email protected]

COMMUNITY GEOTHERMAL ENERGY STUDY
January 2012 Report No. 10-1151-0408
ATTACHMENT Report II - Assessment

October 2011
LOAD AND CAPACITY ANALYSIS
Analysis of Building Thermal Loads and Geothermal Resources for Charles County Maryland
REPO
RT II
Report Number: 10-1151-0408 - 2
Distribution:
2 copies: Charles County Government 2 copies: Golder Associates Ltd., Mississauga
Submitted to: Charles County Government Department of Planning & Growth Management 200 Baltimore Street, P.O. Box 2160, La Plata, MD 20646

THERMAL LOAD AND GEOTHERMAL RESOURCE ANALYSIS
October 2011 Report No. 10-1151-0408 - 2 i
Table of Contents
1.0 INTRODUCTION ............................................................................................................................................................... 1
1.1 Context ................................................................................................................................................................ 1
1.2 Objectives of this Report ...................................................................................................................................... 2
1.3 Scope of Work ..................................................................................................................................................... 2
2.0 ASSESSMENT OF BUILDING STRUCTURES TYPICAL TO CHARLES COUNTY, MD ................................................ 4
2.1.1 Residential Energy Consumption Survey (RECS) ......................................................................................... 6
2.2 Commercial and Institutional Sector .................................................................................................................... 7
2.2.1 Commercial Buildings Energy Consumption Survey (CBECS) ...................................................................... 8
3.0 THERMAL LOAD ASSESSMENT .................................................................................................................................. 11
3.1 Thermal Load Assessment of the Residential Sector in Charles County, MD ................................................... 11
3.1.1 Methodology for Estimating Thermal Loads ................................................................................................. 11
3.1.2 Estimated Thermal Loads for the Residential Sector in Charles County, MD .............................................. 12
3.1.3 Projected Thermal Loads in 2010 – 2035 for Residential Sector in Charles County MD ............................. 13
3.2 Thermal Load Assessment of Commercial and Institutional Sectors in Charles County, MD ............................ 13
3.2.1 Methodology for Estimating the Thermal Loads ........................................................................................... 13
3.2.2 Estimated Thermal Loads for Commercial & Institutional Sectors in Charles County MD............................ 14
3.2.3 Projected Thermal Loads in 2010 – 2035 for Commercial & Institutional Sectors in Charles County, MD ............................................................................................................................................................... 15
3.2.4 Total Estimated and Projected Thermal Loads for Charles County, MD ...................................................... 15
3.3 Thermal Load Assessment Applied to Waldorf, MD .......................................................................................... 16
3.3.1 Waldorf ......................................................................................................................................................... 17
3.3.2 Estimated Thermal Loads for the Residential Sector in Waldorf, MD .......................................................... 19
3.3.3 Projected Thermal Loads, 2010 – 2035 for Residential Sector in Waldorf, MD ........................................... 19
3.3.4 Estimated Thermal Loads for the Commercial & Institutional Sectors in Waldorf, MD ................................. 20
3.3.5 Projected Thermal Loads in 2010 – 2035 for Commercial & Institutional Sectors in Waldorf, MD ............... 21
3.3.6 Total Estimated and Projected Thermal Loads for Waldorf, MD .................................................................. 22
3.4 Thermal Load Assessment Applied to Homefield Residential Subdivision ........................................................ 23
3.4.1 Homefield Subdivision .................................................................................................................................. 23

THERMAL LOAD AND GEOTHERMAL RESOURCE ANALYSIS
October 2011 Report No. 10-1151-0408 - 2 ii
3.4.2 Estimated Thermal Loads for the Residential Sector in Homefield Subdivision ........................................... 24
3.4.3 Projected Thermal Loads for 2010 – 2035 for the Residential Sector in Homefield Subdivision .................. 24
3.4.4 Estimated Thermal Loads for the ICI Sector in Homefield Subdivision ........................................................ 25
3.4.5 Projected Thermal Loads for 2012 – 2035 for the ICI Sector in Homefield Subdivision ............................... 25
3.4.6 Total Estimated and Projected Thermal Loads in Homefield Subdivision .................................................... 26
4.0 REVIEW OF GEOLOGY, HYDROGEOLOGY AND THERMAL GROUND PROPERTIES OF CHARLES COUNTY, MD ................................................................................................................................................................. 27
4.1 Geological Overview .......................................................................................................................................... 27
4.2 Hydrogeologic Framework ................................................................................................................................. 27
4.2.1 Surficial Aquifer ............................................................................................................................................ 28
4.2.2 Aquia Aquifer ............................................................................................................................................... 29
4.2.3 Magothy Aquifer ........................................................................................................................................... 29
4.2.4 Patapsco Aquifer .......................................................................................................................................... 30
4.2.4.1 Upper Patapsco Aquifer ............................................................................................................................ 30
4.2.4.2 Lower Patapsco Aquifer ............................................................................................................................ 30
4.2.5 Patuxent Aquifer .......................................................................................................................................... 31
4.3 Area Water Use and Well Yields ........................................................................................................................ 31
5.0 ASSESSMENT OF POTENTIAL USE OF GEOTHERMAL OPEN LOOP SYSTEMS IN CHARLES COUNTY, MD .................................................................................................................................................................................. 37
5.1 Groundwater Permitting Requirements .............................................................................................................. 37
5.2 Specific Permits for Geothermal Systems ......................................................................................................... 37
5.3 Feasibility of Geothermal Open Loop Systems in Charles County, MD ............................................................. 38
6.0 ASSESSMENT OF POTENTIAL USE OF GEOTHERMAL CLOSED LOOP SYSTEMS IN CHARLES COUNTY, MD .................................................................................................................................................................................. 40
6.1 Assessment of Ground Thermal Conductivity and Diffusivity in Charles County, MD ........................................ 40
6.1.1 Local Test Drilling and Testing of Thermal Conductivity .............................................................................. 41
7.1.1 Thermal Conductivity Applied to Design ...................................................................................................... 42
7.2 Permitting Requirements for Closed Loop Geothermal Systems ....................................................................... 44
7.3 Geothermal Energy Building Load / Capacity Analysis ...................................................................................... 45
8.0 ENERGY OVERVIEW 2011 WITH PROJECTIONS TO 2035 ........................................................................................ 47
8.1 US Energy Use and Projected Growth .............................................................................................................. 47
8.2 US Energy Prices Projected to 2035 ................................................................................................................. 50

THERMAL LOAD AND GEOTHERMAL RESOURCE ANALYSIS
October 2011 Report No. 10-1151-0408 - 2 iii
8.3 Maryland Energy Prices Projected to 2035 ........................................................................................................ 52
8.4 Geothermal Energy Use Projected to 2035 ....................................................................................................... 53
9.0 LIST OF REFERENCES ................................................................................................................................................. 54
9.1 Geothermal Industry and Technology References: ............................................................................................ 54
9.2 Geology and Hydrogeology References: ........................................................................................................... 55
9.3 Charles County Maryland References: .............................................................................................................. 56
TABLES Table 1: Housing units in structures in Charles County, Maryland. ............................................................................................ 6
Table 2: Residential Buildings Categories, as per RECS ........................................................................................................... 7
Table 3: Number of Establishments that represent ICI sector in Charles County. ...................................................................... 7
Table 4: Commercial Buildings Categories, as per CBECS ....................................................................................................... 9
Table 5: Climate Zone Average Annual Cooling and Heating Degree Days ............................................................................ 11
Table 6: Climate Averages ....................................................................................................................................................... 12
Table 7: Estimated Annual Thermal Loads by End-Use in Residential Sector in Charles County, MD .................................... 12
Table 8: Projected Annual Thermal Loads in 2010-2035 for Residential Sector in Charles County, MD ................................. 13
Table 9: Estimated Annual Thermal Loads, Commercial & Institutional Buildings in Charles County MD ............................... 14
Table 10: Projected Annual Thermal Loads in 2010-2035 for ICI Sector in Charles County, MD ............................................ 15
Table 11: Total Estimated Annual Thermal Loads for all Sectors in Charles County MD ......................................................... 16
Table 12: Total Projected Annual Energy Loads in 2010–2035 for all Sectors in Charles County MD ..................................... 16
Table 13: Residential Housing Units, Types and Area in Waldorf, MD ................................................................................... 19
Table 14: Estimated Annual Thermal Loads for Residential Sector in Waldorf, MD ................................................................. 19
Table 15: Projected Annual Thermal Loads in 2010-2035 for Residential Sector in Waldorf, MD............................................ 20
Table 16: Commercial and Institutional Buildings in Waldorf, MD ............................................................................................ 20
Table 17: Estimated Annual Thermal Loads for Commercial & Institutional Buildings in Waldorf, MD ..................................... 21
Table 18: Projected Annual Thermal Loads in 2010-2035 for ICI Sectors in Waldorf, MD ....................................................... 21
Table 19: Estimated Annual Thermal Loads for all Sectors in Waldorf, MD ............................................................................. 22
Table 20: Projected Annual Thermal Loads in 2010-2035 for all Sectors in Waldorf, MD ........................................................ 22
Table 21: Housing Units by Type in Homefield Subdivision ..................................................................................................... 23
Table 22: Commercial and Institutional Buildings in Homefield Subdivision ............................................................................. 23
Table 23: Estimated Annual Thermal Load for Residential Sector in Homefield Subdivision ................................................... 24
Table 24: Projected Annual Thermal Loads in 2012-2035 for Residential Sector in Homefield Subdivision ............................ 25
Table 25: Estimated Annual Thermal Load for ICI Sector in Homefield Subdivision ................................................................ 25

THERMAL LOAD AND GEOTHERMAL RESOURCE ANALYSIS
October 2011 Report No. 10-1151-0408 - 2 iv
Table 26: Projected Annual Thermal Loads in 2012-2035 for ICI Sector in Homefield Subdivision ......................................... 25
Table 27: Estimated Annual Thermal Loads for all Sectors in Homefield Subdivision ............................................................. 26
Table 28: Projected Annual Thermal Loads in 2012-2035 for all Sectors in Homefield Subdivision ........................................ 26
Table 29: Statistics Analysis on Area Well Yield and Specific Capacity, Charles County, MD ................................................. 32
Table 30: Summary of Three Local Thermal Conductivity Tests, 2009 .................................................................................... 41
FIGURES Figure 1: Charles County, Maryland borders. ............................................................................................................................. 1
Figure 2: Housing Unit Structure Type Distribution in Charles County ....................................................................................... 4
Figure 3: Charles County Land Use Map ................................................................................................................................... 5
Source: Charles County 2006 Comprehensive Plan. Figure 3-2. ............................................................................................... 5
Figure 4: Charles County Proportional Land Use ....................................................................................................................... 5
Figure 5: Charles County Land Use. Residential Sector ............................................................................................................ 6
Figure 6: Number of Establishments in Charles County. ............................................................................................................ 8
Figure 7: Map of Waldorf urban area ....................................................................................................................................... 17
Figure 8: Downtown Waldorf Study Area ................................................................................................................................. 18
Figure 9: Waldorf Central Zone (WC) and Action Urban Center (AUC) ................................................................................... 18
Figure 10: Homefield Subdivision Map ..................................................................................................................................... 23
Figure 11: Coastal Plain Sediment Wedge, Southern Maryland .............................................................................................. 28
Figure 12: Hydrogeologic Cross-section of Southern Maryland (A) ......................................................................................... 33
Figure 13: Hydrogeologic Cross-section of Southern Maryland (B) ......................................................................................... 34
Figure 14: Potentiometric Surface Maps .................................................................................................................................. 35
Figure 15: Modeled Aquifer Hydraulic Conductivity .................................................................................................................. 36
Figure 16: Sample of Ground Material Thermal Conductivity Ratings and Estimated Geothermal Loop Length ..................... 43
Figure 17: Geothermal Energy Load Capacity analysis for Charles County MD, Waldorf and Homefield ................................ 46
Figure 18: Primary energy use by end use sector, 2009 - 2035 (quadrillion BTU). .................................................................. 47
Figure 19: Average Annual Growth Rates for selected electricity end uses in the commercial sector, 2009-2035 (percent per year) .................................................................................................................................................... 48
Figure 20: Change in residential electricity consumption for selected end uses in the Reference case, 2009 - 2035 (billion kWh)............................................................................................................................................................. 48
Figure 21: Projected Estimates for Commercial Floorspace and Energy Consumption Annual Growth in US, 2008-2035. ....................................................................................................................................................................... 49
Figure 22: Projected Estimates for Residential Households and Energy Consumption Annual Growth in US, 2008-2035. ....................................................................................................................................................................... 49
Figure 23: Nominal Average Electricity Price Projections for US, 2008-2035. ......................................................................... 50

THERMAL LOAD AND GEOTHERMAL RESOURCE ANALYSIS
October 2011 Report No. 10-1151-0408 - 2 v
Figure 24: Nominal Average Natural Gas Prices Projections for US, 2008-2035. .................................................................... 51
Figure 25: US Energy Price Projections By Sector and Source, 2008 –2035. ......................................................................... 51
Figure 26: Annual Retail Price for Electricity in Residential Sector in South Atlantic region. .................................................... 52
Figure 27: Annual Retail Price of Electricity in Commercial Sector in South Atlantic region..................................................... 52
Figure 28: Residential market saturation by renewable technologies in two cases, 2009, 2020, and 2035 (percent share of single-family homes).................................................................................................................................. 53

THERMAL LOAD AND GEOTHERMAL RESOURCE ANALYSIS
October 2011 Report No. 10-1151-0408 - 2 1
EXECUTIVE SUMMARY
This report provides a review of the built environment of Charles County as it exists today and as it is visioned to grow and change over the period 2012 to 2035. This built environment is the basis of the demand for thermal energy in the County and is essential to understanding the physical size and scale for consideration of geothermal energy supply and also in being able to assess the resources required to meet the demand.
The report attempts to assess Charles County as a whole, Waldorf as a potential site of the majority of growth forecast for the near future and Homefield subdivision, as a new planned community ready for immediate development. By assessing the potential thermal loads of these areas of study focus, we set the stage for development of an effective and efficient source of renewable energy, geothermal.
The report then presents a detailed analysis of the geology and hydrogeology of Charles County, which develops insight into the energy that can potentially be found and extracted from the ground. With a ground structure laced with several layers of aquifers, special attention is paid to consideration of Open Loop Geothermal Systems, including the regulatory environment surrounding this technology application.
The report considers the feasibility of Closed Loop Geothermal Systems, as they apply to the County. This includes an assessment of the thermal conductivity of the area, and specifically the Homefield site. Closed loop systems are technically feasible in almost every continental US location, however, the metrics and therefore economics can vary widely from one location to another and for various applications. The regulatory environment surrounding this technology application is also presented.
Energy prices in the US and in Charles County MD will impact the development of the business case. A review of Energy supply, demand and prices is presented with an outlook into the future, at potential prices to 2035.
This report presents the underlying information and data assessment that will be used in the third and final segment of this study, Community Geothermal Energy Review for Charles County MD - Economic and Environmental Business Case.

THERMAL LOAD AND GEOTHERMAL RESOURCE ANALYSIS
October 2011 Report No. 10-1151-0408 - 2 2
REPORT LIMITATIONS
This report (the “Report”) was prepared for the exclusive use of Charles County Government, Maryland, to support its internal discussions and evaluation of the potential feasibility of geothermal systems.
The Report is intended to provide an overview and analysis of geothermal energy resources and building load requirements, as it might apply to the development of decentralized and centralized district energy systems in Charles County, Maryland. The Report is based on publicly available information, on information provided by Charles County government, and on the experience of Golder, and must be considered in its entirety. It is also based on discussions with representatives of Charles County, as reported herein. No rock, soil, water, liquid, gas, product or chemical sampling and analytical testing was conducted as part of this Work.
In preparing the Report, Golder has relied in good faith on information provided by other individuals, companies or government agencies noted in the Report. Golder has assumed that the information provided is factual and accurate and Golder has not independently verified the accuracy or completeness of such information. Golder accepts no responsibility for any deficiency, misstatement or inaccuracy contained in this Report as a result of omissions, misinterpretations or fraudulent acts of others. Golder makes no other representations whatsoever, including those concerning the financial significance of its opinions, or as to legal matters touched on in this Report. With respect to our discussion of regulations and incentives, these are subject to periodic amendment and interpretation and these interpretations may change over time.
The scope of Golder’s review is described in this Report, and is subject to restrictions, assumptions and limitations. Except as noted herein, the work was conducted in accordance with the scope, terms and conditions of Golder’s Proposal P0-1151-0408 dated October 26, 2010, RFP No. 11-08 Community Geothermal Study as accepted by Contract signed by Mr. Brent Waters, Managing Associate, Golder Associates Inc. Richmond, Virginia and Ms. Candice Quinn Kelly, President for Charles County Commissioners, Charles County Maryland on January 21, 2011. Golder’s opinions are based upon information that existed at the time of the writing of the Report. It is understood that the services provided for in the scope of work allowed Golder to form no more than an opinion of the potential feasibility of geothermal energy systems. Any use which a third party makes of this Report, or any reliance on or decisions to be made based on it, are the sole responsibility of the third parties. Should additional parties require reliance on this Report, written authorization from Golder will be required. Golder disclaims responsibility of consequential financial effects on transactions or property values, or requirements for follow-up actions and costs.
Should you have any questions concerning this report, or the limitations set herein, please do not hesitate to contact our office.

THERMAL LOAD AND GEOTHERMAL RESOURCE ANALYSIS
October 2011 Report No. 10-1151-0408 - 2 1
1.0 INTRODUCTION 1.1 Context Charles County Maryland, with a 2011 population of approximately 146,000 people covers over 294,000 acres of land bordered by the Potomac River to the west, the Wicomico River and Saint Mary’s County Maryland to the south-east and Prince George’s County Maryland to the north. According to countywide population projections developed by the Maryland Department of Planning (MDP) in 2008, Charles County is expected to grow by an average of 1.7 percent per year, or 45 percent overall from 140,764 people in 2008 to a population of approximately 204,200 people by 20301. This represents an increase of approximately 64,436 people requiring an addition of approximately 24,173 residential dwellings. When this growth is added to the 2008 housing stock of 53,327 units, a projected total of 77,500 residential units are expected to exist by 2030.2
In the course of conducting the ongoing Charles County Community Geothermal Study 11-08, a Preliminary Report “Review of Geothermal Systems for Charles County Maryland” (“RGS Report”) was prepared by Golder and submitted, in April 2011. That report provided a broad overview of geothermal technology and presented a review of fundamental geothermal system designs and configurations, discussed practical project implementation and provided an overview of government regulations and incentives.
In 2002 approximately 17% of the land area in the County was “developed”. Population growth projections and development scenarios, described in the Charles County Comprehensive Plan, Water Resources Element July 2010 (Draft) have been adopted for the purposes of this study in order to create consistency and form a basis for comparison.
This Second Report “Analysis of Building Thermal Loads and Geothermal Resources for Charles County Maryland”, assesses Charles County MD specifically, evaluating first the current existing and planned building developments and building structure types to determine the need or demand for thermal energy, and second, evaluating the structure of the ground on which Charles County is situated to determine the extent and nature of the geothermal resource or geothermal capacity available. Specific sites of interest will be selected and will be evaluated in greater detail to highlight opportunities that could possibly deliver highly favorable technical and financial outcomes, with the greatest amount of positive economic and environmental impact.
1 Charles County Comprehensive Plan, Water Resource Element (Draft), July 2010, page 4 (Original Source: MDP, 2008 Estimates for Maryland’s Jurisdictions) 2 Charles County Comprehensive Plan, Water Resource Element (Draft), July 2010, page 5 (Original Source: Maryland Property View, 2008)
Figure 1: Charles County, Maryland borders.

THERMAL LOAD AND GEOTHERMAL RESOURCE ANALYSIS
October 2011 Report No. 10-1151-0408 - 2 2
A Final Report will incorporate these two preliminary reports, and will attempt to draw conclusions, make recommendations, and develop a high level strategy for geothermal project planning and implementation.
1.2 Objectives of this Report The main objective of this report is to provide site specific information and data to assist Charles County MD in applying geothermal energy technology to strategic development and growth planning, thereby introducing an environmentally and economically beneficial alternative source of energy to the people of Charles County MD.
Report objectives are:
Describe various building structure types, as applicable to Charles County MD
Describe various building uses and applications, as applicable to Charles County MD
Assess and quantify various building thermal loads, typical to Charles County MD
Assess various development densities and building location distribution, as they apply to geothermal energy technology
Identify, qualify, and select special sites of interest for geothermal energy technology application
Analyze and quantify thermal loads for special sites of interest
Assess and develop hydrogeologic framework of Charles County MD
Develop prognosis of probable ground temperatures and thermal conductivity, applicable to Charles County MD
Assess the current regulatory framework for geothermal systems in Charles County MD
Comment on the feasibility of various geothermal system technologies, as they apply to Charles County MD
Assess geothermal resource as estimated, against building thermal loads, to develop high level scenarios for geothermal energy project development
Develop geothermal project cost benefit analysis based on life cycle cost methodology
Evaluate other local energy sources and other local thermal energy capacities, their availability, proximity and magnitude, and their accessibility considering distance from the load, additional equipment and infrastructure required to connect, legal title to the energy source and the land required for connection, useful life of the energy source, life cycle cost and other cost/benefit factors.
1.3 Scope of Work The geothermal technology applications that are considered in this report are limited to those that have been installed in North America and are applicable to residential, commercial and multi-residential building development, typically found in Charles County MD. This report does not provide an exhaustive survey of hybrid technology configurations that may be possible or innovations being developed.

THERMAL LOAD AND GEOTHERMAL RESOURCE ANALYSIS
October 2011 Report No. 10-1151-0408 - 2 3
The portion of the geothermal system that is considered in this report is limited to the exterior loop component, including the immediate connection to the building that may be housed in a lower interior level of a building. This can be considered the “exterior” or “primary” geothermal system. The interior “HVAC” geothermal system may include water pipe connectors, heat exchangers, water-to-water and/or water-to-air heat pumps, air ducting, electrical connections, sensors and controls, desuperheaters, radiant in-floor or in-wall piping, make up air units, fan coils and many other pieces of equipment that may be connected to the primary geothermal system. Typically, the HVAC system of a building, while specified to be compatible with the primary geothermal system, is custom designed for each building by a mechanical electrical consultant as directed by each building developer. This report contains a description of some of the geothermal system compatible HVAC equipment available with comments about the geothermal system design integration process.
First, a review of the typical building structures in use in Charles County MD today was conducted.
Second, the metrics of these building types were analyzed to derive high level assessment of building thermal loads and overall thermal energy demand.
Third, a review of the ground geology and hydrogeology was conducted.
Fourth, a building load/geothermal capacity analysis was performed
Finally, a cost benefit analysis was performed
The information produced in this report is for the internal consideration of Charles County MD to determine whether to further pursue, geothermal energy promotion or supply, as a policy or business direction. Further study and development is required for feasibility of any one site or situation, to be determined.
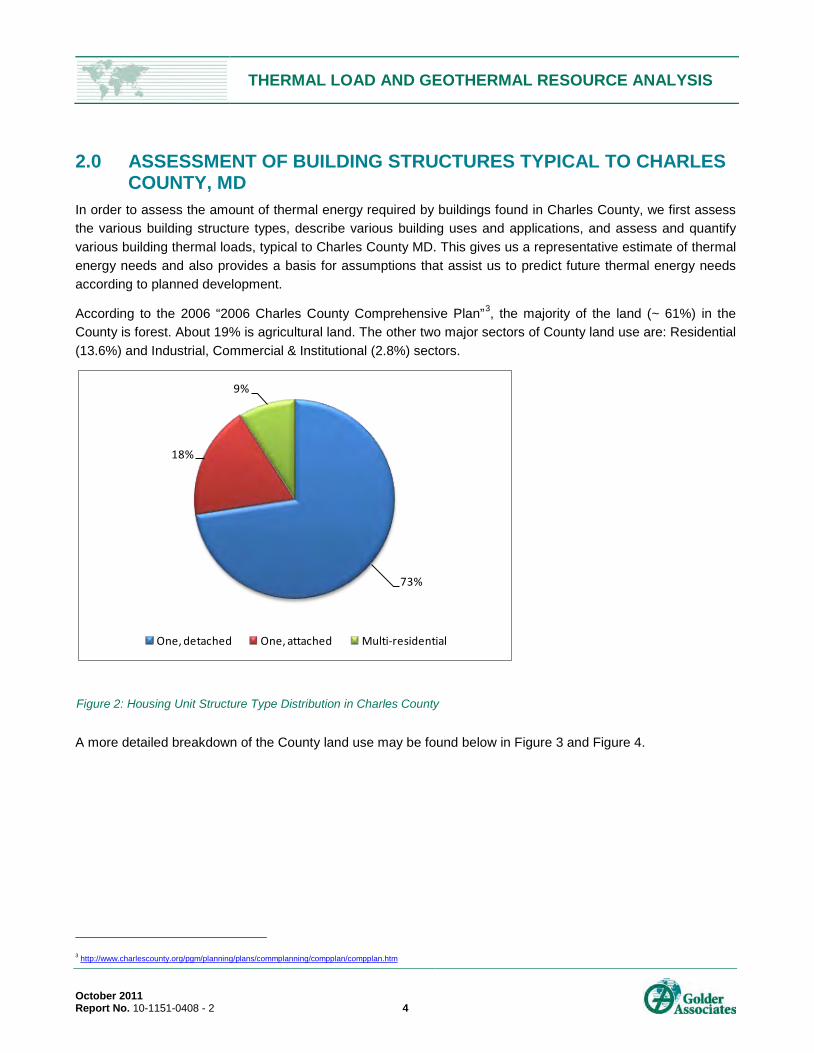
THERMAL LOAD AND GEOTHERMAL RESOURCE ANALYSIS
October 2011 Report No. 10-1151-0408 - 2 4
2.0 ASSESSMENT OF BUILDING STRUCTURES TYPICAL TO CHARLES COUNTY, MD
In order to assess the amount of thermal energy required by buildings found in Charles County, we first assess the various building structure types, describe various building uses and applications, and assess and quantify various building thermal loads, typical to Charles County MD. This gives us a representative estimate of thermal energy needs and also provides a basis for assumptions that assist us to predict future thermal energy needs according to planned development.
According to the 2006 “2006 Charles County Comprehensive Plan”3
, the majority of the land (~ 61%) in the County is forest. About 19% is agricultural land. The other two major sectors of County land use are: Residential (13.6%) and Industrial, Commercial & Institutional (2.8%) sectors.
A more detailed breakdown of the County land use may be found below in Figure 3 and Figure 4.
3 http://www.charlescounty.org/pgm/planning/plans/commplanning/compplan/compplan.htm
73%
18%
9%
One, detached One, attached Multi-residential
Figure 2: Housing Unit Structure Type Distribution in Charles County

THERMAL LOAD AND GEOTHERMAL RESOURCE ANALYSIS
October 2011 Report No. 10-1151-0408 - 2 5
Figure 3: Charles County Land Use Map
Source: Charles County 2006 Comprehensive Plan. Figure 3-2.
Source: Charles County 2006 Comprehensive Plan, Chapter 3, Growth Management and Land Use, Table 301.
Residential13.6%
Commercial & Institutional &
Industrial2.8%
Other developed land0.8%
Agriculture19.5%
Forest60.6%
Extractive & Barren0.3%
Wetland2.3%
Figure 4: Charles County Proportional Land Use

THERMAL LOAD AND GEOTHERMAL RESOURCE ANALYSIS
October 2011 Report No. 10-1151-0408 - 2 6
Residential properties in Charles County occupy approximately 40,089 acres (13.6%) of land. Residential is the third largest land use in the County and it consists of multiple structure types including single-family homes, as well as multi-residential units.
According to the latest U.S. Census Bureau4 statistics (released in September 2010), the estimated number of households in Charles County as of July 2009 was 53,971 with multi-residential units comprising ~9.7% of the units. The 2006 Charles County Comprehensive Plan projected the total number of households in the county in 2010 to be 53,532. The Comprehensive Plan was accepted as the most relevant information for this study and was used for thermal load estimates, presented later in this report. However, neither the Census Bureau data nor the Comprehensive Plan gives a detailed breakdown of residential housing structural types. Therefore, the relative distribution of housing types found on a population data website, Citydata.com5
Table 1: Housing units in structures in Charles County, Maryland.
was applied to arrive at the following table of estimated housing units by structure type in Charles County.
Housing Unit Type Number of Housing Units
Single-family Detached 38,853
Single-family Attached 9,872
Apartments in 2-4 Unit Buildings 1,278
Apartments in 5 or More Unit Buildings 3,620
Total 53,532
*Mobile homes, boats, RVs, vans, etc. were excluded from the analysis as non-applicable structure types for geo-exchange installations.
2.1.1 Residential Energy Consumption Survey (RECS) In order to estimate thermal loads (refer to Section 3.0) occurring in housing units, the Residential Energy Consumption Survey (RECS)6
, a public survey provided by the US Energy Information Administration (EIA) was used.
4 US Census Bureau, http://www.census.gov/popest/housing/HU-EST2009-4.html 5 City Data.com, Advameg Inc., http://www.city-data.com/county/Charles_County-MD.html 6 US Energy Information Administration, Consumption and Efficiency Data, Residential Energy Consumption Survey, http://www.eia.gov/consumption/data.cfm#rec
Figure 5: Charles County Land Use. Residential Sector

THERMAL LOAD AND GEOTHERMAL RESOURCE ANALYSIS
October 2011 Report No. 10-1151-0408 - 2 7
Table 2: Residential Buildings Categories, as per RECS7
Building Type
Definition Includes These
Sub-Categories from 2003 CBECS Questionnaire
Residential Single-Family Units
Free-standing residential building that is occupied by one household (family) Detached
Residential buildings that share common walls and that are occupied by more than one household, including semi-detached units.
Attached
Residential Apartment Buildings
Multi-family residential buildings, including townhouses, duplexes, triplexes, and fourplexes. 2 to 4 units
Multi-residential apartment buildings, including condominiums. 5 or more units
2.2 Commercial and Institutional Sector Out of all land use, Industrial, Commercial & Institutional (ICI) buildings occupy only 2.8% of all County land. These 2.8% percent are represented by the following building uses in Table 3:
Table 3: Number of Establishments that represent ICI sector in Charles County.
Establishment Type Number of Establishments
Percentage ICI buildings, %
Retail trade 518 27% Health care & social assistance 266 14% Professional, scientific & technical services 238 13% Other services (except public administration) 224 12% Accommodation & food services 203 11%
Administrative & support & waste management & remediation service 114 6%
Real estate & rental & leasing 101 5% Wholesale trade 75 4% Manufacturing 63 3% Information 31 2% Educational services 42 2% Arts, entertainment & recreation 25 1% Total 1,900 100%
7 The information presented in the survey is based on 2005 collected data from 4,381 households in housing units statistically selected to represent the 111.1 million housing units in the United States. Data were obtained from residential energy suppliers for each unit in the sample.

THERMAL LOAD AND GEOTHERMAL RESOURCE ANALYSIS
October 2011 Report No. 10-1151-0408 - 2 8
Figure 6: Number of Establishments in Charles County.
Source: Citydata.com - http://www.city-data.com/business2/econ-Charles_County-MD.html
2.2.1 Commercial Buildings Energy Consumption Survey (CBECS) Estimation of building thermal loads (refer to Section 3.0) for the ICI sector was done based on 2003 Commercial Buildings Energy Consumption Survey (CBECS)8
The Commercial Buildings Energy Consumption Survey (CBECS) is a national-level sample survey of commercial buildings and their energy suppliers conducted by the Energy Information Administration (EIA). The most recent survey available to the public is dated back to 2003. The survey holds information on the stock of U.S. commercial buildings, their energy-related building characteristics, and their energy consumption and expenditures. The commercial sector encompasses a vast range of building types and it includes buildings in which at least half of the floorspace is used for a purpose that is not residential, industrial, or agricultural. In the Commercial Buildings Energy Consumption Survey (CBECS), buildings are classified according to principal activity, which is the primary business, commerce, or function carried on within each building. Buildings used for more than one of the activities described below are assigned to the activity occupying the most floorspace at the time of the interview.
. The overview of Charles County building types was done in the context of this survey.
The survey provides estimates9
8
of commercial sector energy consumption and energy intensities, which were adjusted for the effect of weather on heating, cooling, and ventilation energy use. These values were further used for identifying thermal loads of commercial sector in Charles County.
http://www.eia.gov/emeu/cbecs/cbecs2003/detailed_tables_2003/detailed_tables_2003.html#consumexpen03 9 CBECS is a sample survey, therefore there is error associated with every point estimate. 95% confidence interval.
Retail trade27%
Health care & Social Assistance
14%
Professional, scientific &
technical services13%Other services
(except public administration)
12%
Accomodation & Food services
11%
Administrative & support& waste management &
remidiation services
6%
Real estate & rental & leasing
5%
Wholesale trade
4%
Manufacturing3%
Information2%
Educational services
2%
Arts, entertainement
& recreation1%

THERMAL LOAD AND GEOTHERMAL RESOURCE ANALYSIS
October 2011 Report No. 10-1151-0408 - 2 9
The following categories of commercial buildings, as defined by the US Energy Information Administration10
Table 4: Commercial Buildings Categories, as per CBECS
, were used in this study:
Building Type Definition
Education
Buildings used for academic or technical classroom instruction, such as elementary, middle, or high schools, and classroom buildings on college or university campuses. Buildings on education campuses for which the main use is not classroom are included in the category relating to their use. For example, administration buildings are part of "Office," dormitories are "Lodging," and libraries are "Public Assembly."
Food Sales Buildings used for retail or wholesale of food.
Food Service Buildings used for preparation and sale of food and beverages for consumption.
Health Care (Inpatient) Buildings used as diagnostic and treatment facilities for inpatient care.
Health Care (Outpatient)
Buildings used as diagnostic and treatment facilities for outpatient care. Medical offices are included here if they use any type of diagnostic medical equipment (if they do not, they are categorized as an office building).
Lodging Buildings used to offer multiple accommodations for short-term or long-term residents, including skilled nursing and other residential care buildings.
Mercantile (Retail Other Than Mall) Buildings used for the sale and display of goods other than food.
Mercantile (Enclosed and Strip Malls) Shopping malls comprised of multiple connected establishments.
Office
Buildings used for general office space, professional office, or administrative offices. Medical offices are included here if they do not use any type of diagnostic medical equipment (if they do, they are categorized as an outpatient health care building).
Public Assembly Buildings in which people gather for social or recreational activities, whether in private or non-private meeting halls.
Public Order and Safety Buildings used for the preservation of law and order or public safety.
Religious Worship Buildings in which people gather for religious activities, (such as chapels, churches, mosques, synagogues, and temples).
10UA Energy Information Administration, Consumption and Efficiency, Description of CBECS Building Types, http://www.eia.doe.gov/emeu/cbecs/building_types.html

THERMAL LOAD AND GEOTHERMAL RESOURCE ANALYSIS
October 2011 Report No. 10-1151-0408 - 2 10
Building Type Definition
Service Buildings in which some type of service is provided, other than food service or retail sales of goods
Warehouse and Storage Buildings used to store goods, manufactured products, merchandise, raw materials, or personal belongings (such as self-storage).
Other
Buildings that are industrial or agricultural with some retail space; buildings having several different commercial activities that, together, comprise 50 percent or more of the floorspace, but whose largest single activity is agricultural, industrial/ manufacturing, or residential; and all other miscellaneous buildings that do not fit into any other category.
Vacant Buildings in which more floorspace was vacant than was used for any single commercial activity at the time of interview. Therefore, a vacant building may have some occupied floorspace.

THERMAL LOAD AND GEOTHERMAL RESOURCE ANALYSIS
October 2011 Report No. 10-1151-0408 - 2 11
3.0 THERMAL LOAD ASSESSMENT 3.1 Thermal Load Assessment of the Residential Sector in Charles
County, MD 3.1.1 Methodology for Estimating Thermal Loads For the purpose of this study energy consumption used for space heating, space cooling, and water heating in residential buildings was estimated based on energy intensity values (BTU/household). Energy intensities, expressed in million of BTU/household, were obtained from RECS database, specifically Table US1411
Energy uses were estimated based on the following formula:
𝐸𝑠𝑡𝑖𝑚𝑎𝑡𝑒𝑑 𝐸𝑛𝑒𝑟𝑔𝑦 𝑈𝑠𝑒,𝐵𝑇𝑈 = 𝐸𝑛𝑒𝑟𝑔𝑦 𝐼𝑛𝑡𝑒𝑛𝑠𝑖𝑡𝑦,𝐵𝑇𝑈
ℎ𝑜𝑢𝑠𝑒ℎ𝑜𝑙𝑑× 𝑁𝑢𝑚𝑏𝑒𝑟 𝑜𝑓 𝐻𝑜𝑢𝑠𝑒ℎ𝑜𝑙𝑑𝑠
:
The RECS table provides energy intensities ( 𝐵𝑇𝑈ℎ𝑜𝑢𝑠𝑒ℎ𝑜𝑙𝑑
) for different building energy end-uses, including space
heating, space cooling, and water heating. Such information is further divided into groups that represent various categories, some of the examples are: rural/urban location, geographic region, household size, annual heating and cooling degree days, etc.
In order to take into account regional specifics that affect buildings energy consumption related to space heating and cooling, energy intensities, found in Table US14, were adjusted by the following ratio:
𝑅𝑎𝑡𝑖𝑜 = 𝐸𝑛𝑒𝑟𝑔𝑦 𝐼𝑛𝑡𝑒𝑛𝑠𝑖𝑡𝑦 𝑎𝑐𝑟𝑜𝑠𝑠 𝑡ℎ𝑒 𝑈𝑆
𝐸𝑛𝑒𝑟𝑔𝑦 𝐼𝑛𝑡𝑒𝑛𝑠𝑖𝑡𝑦 𝑓𝑜𝑟 𝑆𝑝𝑒𝑐𝑖𝑓𝑖𝑐 𝐶𝑙𝑖𝑚𝑎𝑡𝑒 𝑍𝑜𝑛𝑒
According to the definitions used by EIA, climate zone is defined as: “One of five climatically distinct areas, defined by long-term weather conditions which affect the heating and cooling loads in buildings. The zones were determined according to the 45-year average (1931-1975) of the annual heating and cooling degree-days (base 65 degrees Fahrenheit). An individual building was assigned to a climate zone according to the 45-year average annual degree-days for its National Oceanic and Atmospheric Administration (NOAA) Division.” The climate zones are defined as follows:
Table 5: Climate Zone Average Annual Cooling and Heating Degree Days
Climate Zone Average Annual Cooling Degree-Days Average Annual Heating Degree-Days
1 Fewer than 2,000 More than 7,000
2 Fewer than 2,000 5,500 to 7,000
3 Fewer than 2,000 4,000 to 5,499
4 Fewer than 2,000 Fewer than 4,000
5 2,000 or more Fewer than 4,000
11 US Energy Information Administration, 2005 Residential Energy Consumption Survey: Household Energy Consumption and Expenditures Tables, Table US 14, http://www.eia.gov/emeu/recs/recs2005/c&e/summary/pdf/tableus14.pdf

THERMAL LOAD AND GEOTHERMAL RESOURCE ANALYSIS
October 2011 Report No. 10-1151-0408 - 2 12
For the purpose of identifying specific climate zone, heating degree days (HDD) and cooling degree days (CDD) were determined for La Plata, Maryland. Average CDD and HDD are presented below.
Table 6: Climate Averages
La Plata, Maryland12
Heating Degree Days (HDD) per year
4,339
Cooling Degree Days (CDD) per year 1,040
Climate Zone 3 was selected as the most appropriate for Charles County MD, however, the energy intensity for the climate zone, was adjusted to reflect the actual degree days per year for heating. Ratios were calculated for each specific energy end-use category and applied to each housing unit type.
𝐴𝑑𝑗𝑢𝑠𝑡𝑒𝑑 𝐸𝑛𝑒𝑟𝑔𝑦 𝐼𝑛𝑡𝑒𝑛𝑠𝑖𝑡𝑦,𝐵𝑇𝑈
ℎ𝑜𝑢𝑠𝑒ℎ𝑜𝑙𝑑= 𝐸𝑛𝑒𝑟𝑔𝑦 𝐼𝑛𝑡𝑒𝑛𝑠𝑖𝑡𝑦,
𝐵𝑇𝑈ℎ𝑜𝑢𝑠𝑒ℎ𝑜𝑙𝑑
× 𝑅𝑎𝑡𝑖𝑜
Adjusted energy intensity values were later multiplied by the number of households of each type of the residential property.
Using adjusted energy intensity values, energy consumption of housing units by end use, were estimated by using the following formula:
𝐸𝑠𝑡𝑖𝑚𝑎𝑡𝑒𝑑 𝐸𝑛𝑒𝑟𝑔𝑦 𝑈𝑠𝑒,𝐵𝑇𝑈 = 𝐴𝑑𝑗𝑢𝑠𝑡𝑒𝑑 𝐸𝑛𝑒𝑟𝑔𝑦 𝐼𝑛𝑡𝑒𝑛𝑠𝑖𝑡𝑦,𝐵𝑇𝑈
ℎ𝑜𝑢𝑠𝑒ℎ𝑜𝑙𝑑× 𝑁𝑢𝑚𝑏𝑒𝑟 𝑜𝑓 𝐻𝑜𝑢𝑠𝑒ℎ𝑜𝑙𝑑𝑠
3.1.2 Estimated Thermal Loads for the Residential Sector in Charles County, MD Based on the methodology described above and the data in Table 1, the resulting estimated thermal loads are presented in the following table:
Table 7: Estimated Annual Thermal Loads by End-Use in Residential Sector in Charles County, MD
Housing Unit Type
Energy End Use (Million BTU/year consumption per building type)
Space Heating Air-Conditioning Water Heating
Single-family Detached 1,276,320 405,125 891,416
Single-family Attached 303,155 62,124 196,501
Apartments in 2-4 Unit Buildings 46,049 7,629 21,071
12 http://www.weatherreports.com/United_States/MD/La_Plata

THERMAL LOAD AND GEOTHERMAL RESOURCE ANALYSIS
October 2011 Report No. 10-1151-0408 - 2 13
Housing Unit Type
Energy End Use (Million BTU/year consumption per building type)
Space Heating Air-Conditioning Water Heating
Apartments in 5 or More Unit Buildings 67,253 22,645 46,689
Total Energy Consumption per End-Use, million BTU/year
1,692,777 497,523 1,155,678
Total Heating Load, million BTU/year 2,848,455
Total Cooling Load, million BTU/year 497,523
Grand Total, Million BTU/year 3,345,978
3.1.3 Projected Thermal Loads in 2010 – 2035 for Residential Sector in Charles County MD
Thermal load projections were made based on the growth projections established for the number of housing units in Charles County in the 2006 Charles County Comprehensive Plan, Table 2-4, Projected Number of Housing Units by Election District. The following table presents the projected thermal loads for the Residential sector to 2035:
Table 8: Projected Annual Thermal Loads in 2010-2035 for Residential Sector in Charles County, MD
Sector/Projection Growth 2010 2015 2020 2025 2030 2035
Projected Growth, % 0% 11% 10% 10% 10% 10%
Number of Households 53,532 59,338 65,245 72,754 80,590 89,269
Estimated Thermal Loads, million BTU/year
3,345,978 3,708,878 4,078,091 4,547,435 5,037,188 5,579,687
3.2 Thermal Load Assessment of Commercial and Institutional Sectors in Charles County, MD
3.2.1 Methodology for Estimating the Thermal Loads Estimated energy end-uses for the purpose of space heating, space cooling, and water heating in commercial and institutional buildings were assessed based on energy intensity values (BTU/ft2) following the same methodology as for residential properties:

THERMAL LOAD AND GEOTHERMAL RESOURCE ANALYSIS
October 2011 Report No. 10-1151-0408 - 2 14
𝐸𝑠𝑡𝑖𝑚𝑎𝑡𝑒𝑑 𝐸𝑛𝑒𝑟𝑔𝑦 𝑈𝑠𝑒,𝐵𝑇𝑈 = 𝐴𝑑𝑗𝑢𝑠𝑡𝑒𝑑 𝐸𝑛𝑒𝑟𝑔𝑦 𝐼𝑛𝑡𝑒𝑛𝑠𝑖𝑡𝑦,𝐵𝑇𝑈𝑓𝑡2
× 𝐺𝑟𝑜𝑠𝑠 𝐹𝑙𝑜𝑜𝑟 𝐴𝑟𝑒𝑎, 𝑓𝑡2
Energy intensities for each type of commercial buildings were obtained from 2003 “Commercial Buildings Energy Consumption Survey” (CBECS): Energy End-Use Consumption Tables, specifically “Table E2A. Major Fuel Consumption (BTU) Intensities by End Use for All Buildings, 2003” (last adjusted in 2008)13
The Table E2A provides energy intensities (𝐵𝑇𝑈𝑓𝑡2
) for different buildings energy end uses, including space heating,
space cooling, and water heating. Such information is further divided into groups that represent various categories, some of the examples are: principal building activity, geographic region, building floor space, year of building construction, etc.
.
Energy intensities will be adjusted for the proper climate zone, following the same methodology as in case with residential buildings.
3.2.2 Estimated Thermal Loads for Commercial & Institutional Sectors in Charles County MD
According to the information provided by the staff of the Charles County government, the following buildings were included in the analysis:
Retail space (8,759,744 ft2);
Industrial space (2,963,021 ft2);
Office space (2,094,530 ft2);
Flexspace (702,245 ft2)
Table 9: Estimated Annual Thermal Loads, Commercial & Institutional Buildings in Charles County MD
Building Type
Energy End Uses (thousand BTU/year of consumption per building type)
Space Heating Air-Conditioning Water Heating
Mercantile (Food and non-food retail) 235,716,748 75,881,282 48,503,954
Office 77,027,928 16,311,152 4,548,122
Industrial (Warehouse and Storage)* 64,117,979 3,370,436 1,930,197
Flex Space (Other) 62,516,829 6,451,876 1,601,119
13US Energy Information Administration, Consumption and Efficiency, Major Fuel Consumption (BTU) Intensities by end Use for all Buildings, 2003, Table E2A,
http://www.eia.gov/emeu/cbecs/cbecs2003/detailed_tables_2003/2003set19/2003html/e02a.html

THERMAL LOAD AND GEOTHERMAL RESOURCE ANALYSIS
October 2011 Report No. 10-1151-0408 - 2 15
Building Type
Energy End Uses (thousand BTU/year of consumption per building type)
Space Heating Air-Conditioning Water Heating
Total Energy Consumption per End-Use, thousand BTU/year 439,379,483 102,014,747 56,583,391
Total Heating Load, thousand BTU/year 495,962,874
Total Cooling Load, thousand BTU/year 102,014,747
Grand Total, thousand BTU/year 597,977,621
*It was assumed that space cooling, space heating and DHW heating requirements for Industrial buildings are the same as for Warehouse and Storage facilities.
3.2.3 Projected Thermal Loads in 2010 – 2035 for Commercial & Institutional Sectors in Charles County, MD
Thermal load projections were made based on the projected population growth for the whole of Charles County between years 2010 and 2025. Projected growth percentages were obtained from Table 2-3, Projected Population Distribution by Election District, 2006 Charles County Comprehensive Plan, page 2-7. The results are presented in the Table below:
Table 10: Projected Annual Thermal Loads in 2010-2035 for ICI Sector in Charles County, MD
Sector/Projection Growth 2010 2015 2020 2025 2030 2035
Projected Growth, % 0% 10% 9% 7% 7% 7%
C&I Sector Total Area, ft2 14,519,540 15,954,971 17,390,211 18,586,021 19,864,059 21,229,979
Estimated Thermal Loads, million BTU/year 597,978 657,095 716,204 765,453 818,088 874,343
3.2.4 Total Estimated and Projected Thermal Loads for Charles County, MD Thermal loads for the Residential, Commercial and Institutional Sectors of Charles County MD were combined to produce total thermal loads for the County, as follows:

THERMAL LOAD AND GEOTHERMAL RESOURCE ANALYSIS
October 2011 Report No. 10-1151-0408 - 2 16
Table 11: Total Estimated Annual Thermal Loads for all Sectors in Charles County MD
Building Type Energy End Uses
(million BTU/year of consumption per household type)
Space Heating Air-Conditioning Water Heating Total Residential Energy Consumption, million BTU/year 1,692,777 497,523 1,155,678
Total Commercial Energy Consumption, million BTU/year 439,379 102,015 56,583
Heating Load, million BTU/year 3,344,418
Cooling Load, million BTU/year 599,538
Grand Total, million BTU/year 3,943,956
Projected growth rates for all sectors, as described in the description for each above, have been applied to estimated energy consumptions to produce the following projected energy consumption to 2035:
Table 12: Total Projected Annual Energy Loads in 2010–2035 for all Sectors in Charles County MD Sector/Projection Growth 2010 2015 2020 2025 2030 2035
Portion to be Built, % 9.5% 8.8% 10.2% 9.7% 9.7% 9.7%
Residential Estimated Thermal Loads, million BTU/year
3,943,538 3,708,878 4,078,091 4,547,435 5,037,188 5,579,687
Commercial Estimated Thermal Loads, million BTU/year
597,978 608,263 618,725 629,367 640,192 651,203
Grand Total, million BTU/year 3,943,956 4,317,141 4,696,815 5,176,802 5,677,380 6,230,890
3.3 Thermal Load Assessment Applied to Waldorf, MD The assessment of building types can now be applied to various development densities and building location distribution, as they apply to geothermal energy technology.
As discussed previously, geothermal systems can be scaled and installed to serve one building. In order to make a central geothermal system more economical than a disbursed system of individual bore fields, the cost of installation of transmission and distribution pipeworks must be offset by economies of scale of a central geothermal ground system. In addition, factors of legal ownership of both the land in which the geothermal connecting pipes and geothermal bore fields, or horizontal loops are installed, operational responsibility and

THERMAL LOAD AND GEOTHERMAL RESOURCE ANALYSIS
October 2011 Report No. 10-1151-0408 - 2 17
cash flows including expenses and revenues need to be considered. These and other factors of consideration will be discussed in more detail later.
Two specific sites of interest, Waldorf and Homefield Residential subdivision, have been identified and selected as special sites of interest for geothermal energy technology application. Waldorf is an existing urban are identified for redevelopment where by many buildings would remain among new buildings built to specific density standards. Homefield is a Greenfield of residential new construction.
3.3.1 Waldorf Waldorf is the most intensely developed urban area, with one of the most concentrated population densities, in Charles County. It has several locations with mixed use lands, including commercial and business, industrial and high density residential land uses. According to the 2006 Charles County Comprehensive Plan (page 3-11), Waldorf “has been indicated as one of the core locations for future commercial developments”. The Vision Plan14
In 2008 the Waldorf Urban Design Study was initiated. The primary project goals were to create a plan for designing “an attractive and functional urban centre in Waldorf, where a well balanced mix of uses, including commercial residential, institutional, and recreational areas, will be established” and to “incorporate a transit-oriented development approach with higher density mixed-use development”.
indicated that “by its geographic location, rail access and existing transit systems, downtown Waldorf has a promising future as a regional, transit-oriented development node that will sustain the economic viability and growth of Charles County”.
The area that is designated as Downtown Waldorf encompasses areas north of Action Lane to south Leonardtown Road, and between Route 301 and the railroad tracks.
14 Downtown Waldorf. Vision Plan and Design Guidelines. Department of Planning and Growth Management, Charles County, MD. Adopted April 13, 2010, by County Commissioners’. Resolution No. 2010-09.
Figure 7: Map of Waldorf urban area

THERMAL LOAD AND GEOTHERMAL RESOURCE ANALYSIS
October 2011 Report No. 10-1151-0408 - 2 18
Figure 8: Downtown Waldorf Study Area
The Vision Plan recommends creation of two zoning districts within the study area: the Action Urban Center Zone and the Waldorf Central Zone (see Figure 9, below) The northern activity center, the Action Urban Center, is planned as a higher density development node, transitioning to the southern activity center, the Waldorf Central, which will be a medium-density, commercial and civic district.
Waldorf Central Zone (WC): expected to be high-quality, medium-density (2 to 5 storey buildings), district mix of uses, including townhouse, apartment, loft and condominium residences, retail stores and services, offices and civic or institutional uses, including areas for a library, youth center, arts center, senior center.
Action Urban Center Zone (AUC): 3 to 10 story buildings (2 stories permitted for townhouses), mixed-use commercial, offices (including larger employment uses), with smaller residential emphasis: apartments, lofts, and condominiums.
Required domestic unit (DU) density for WC and AUC Zones: Townhouses: Minimum 12 DUs/acre - Maximum 36 DU/acre Apartment/Multifamily: Minimum 15 DUs/acre - No maximum Mixed-use buildings: No minimum or maximum density for apartments
Figure 9: Waldorf Central Zone (WC) and Action Urban Center (AUC)

THERMAL LOAD AND GEOTHERMAL RESOURCE ANALYSIS
October 2011 Report No. 10-1151-0408 - 2 19
3.3.2 Estimated Thermal Loads for the Residential Sector in Waldorf, MD According to the 2006 Charles County Comprehensive Plan, Table 2-4, the total number of households in Waldorf in 2010 was 27,573. As the detailed breakdown by housing unit type was not available, the same distribution was applied to Waldorf residential sector as to the Charles County. Below are the summarized values used for thermal loads estimation.
Table 13: Residential Housing Units, Types15
Housing Unit Type
and Area in Waldorf, MD Average Area by
Type ft2
Number of Housing Units
Total Occupied Area by Type
ft2
Single-family Detached 1900 20,128 38,243,751
Single-family Attached 1800 4,963 8,933,652
Apartments in 2-4 Unit Buildings 2100 551 1,158,066
Apartments in 5 or More Unit Buildings 1000 1,930 1,930,110
Total 27,573 50,265,579
Table 14: Estimated Annual Thermal Loads for Residential Sector in Waldorf, MD
Housing Unit Type
Energy End Uses (million BTU/year of consumption per housing unit type)
Space Heating Air-Conditioning Water Heating
Single-family Detached 661,212 209,879 461,808 Single-family Attached 153,857 31,521 99,702 Apartments in 2-4 Unit Buildings 19,878 3,293 9,096 Apartments in 5 or More Unit Buildings 35,862 12,075 24,896 Total Energy Consumption per End-Use, million BTU/year 870,768 256,769 595,502
Grand Total, million BTU/year 1,723,040
3.3.3 Projected Thermal Loads, 2010 – 2035 for Residential Sector in Waldorf, MD Thermal load projections were done based on the projections established for the number of housing units in Waldorf in 2006 Charles County Comprehensive Plan, Table 2-4, Projected Number of Housing Units by Election District. The growth percentages presented in the Table 2-4 are only available for the period of 2005 – 2025. For the purpose of this study it was assumed that the growth in number of households will be maintained on the same levels as in 2025. 15 Source: Charles County Comprehensive Plan 2006, Table 2-4. Projected Number of Housing Units by Election District.

THERMAL LOAD AND GEOTHERMAL RESOURCE ANALYSIS
October 2011 Report No. 10-1151-0408 - 2 20
Table 15: Projected Annual Thermal Loads in 2010-2035 for Residential Sector in Waldorf, MD
Sector/Projection Growth 2010 2015 2020 2025 2030 2035
Projected Growth, % 0% 11% 10% 10% 10% 10%
Number of Households 27,573 30,505 33,480 36,834 40,567 44,678
Estimated Thermal Loads, million BTU/year 1,723,040 1,906,261 2,092,969 2,301,761 2,535,036 2,791,954
3.3.4 Estimated Thermal Loads for the Commercial & Institutional Sectors in Waldorf, MD
Based on the information provided by the Charles County Department of Planning & Growth management16, the following Table 14 provides the actual17
Table 16: Commercial and Institutional Buildings in Waldorf, MD
area sizes for commercial and institutional buildings in Waldorf.
Building Principal Activity Area, ft2
Education 2,443 Food Sales 53,809 Food Services 118,485 Health Care 305,700 Mercantile 536,542 Office 759,130 Other 167,204 Public Assembly 40,027 Public Order & Safety 21,107 Religious Worship 15,812 Service 235,626 Vacant 6,647 Warehouse and Storage 305,595
Grand Total 2,568,126 Based on the building areas, the annual thermal loads for commercial & institutional building were estimated following the methodology described in Section 3.0 of this Report.
16 As of September 2011. 17 Source: Charles County Government. Department of Planning & Growth Management.

THERMAL LOAD AND GEOTHERMAL RESOURCE ANALYSIS
October 2011 Report No. 10-1151-0408 - 2 21
Table 17: Estimated Annual Thermal Loads for Commercial & Institutional Buildings in Waldorf, MD
Building Type
Energy End Uses (thousand BTU/year per building type)
Space Heating Air-Conditioning Water Heating
Education 107,906 17,099 15,382 Food Sales 1,743,576 461,4129 169,422 Food Services 5,725,704 1,803,9369 5,197,096 Health Care (In- and Outpatient) 24,129,942 3,771,5779 10,023,475 Mercantile 14,437,866 4,647,798 2,970,912 Office 27,917,568 5,911,722 1,648,396 Public Assembly 2,230,443 336,222 43,457 Public Order and Safety 1,180,878 164,367 320,819 Religious Worship 464,484 40,123 13,734 Service 9,484,313 783,457 255,823 Warehouse and Storage 6,612,882 347,614 199,073 Other 14,885,243 1,536,190 381,226 Vacant 107,326 3,490 722 Heating Load, thousand BTU/year 130,267,669 Cooling Load, thousand BTU/year 19,825,007 Grand Total, thousand BTU/year 150,092,676
3.3.5 Projected Thermal Loads in 2010 – 2035 for Commercial & Institutional Sectors in Waldorf, MD
Thermal loads projections were done based on the projected population growth Waldorf between years 2010 and 2025. Projected growth percentages were obtained from Table 2-3, Projected Population Distribution by Election District (2006 Charles County Comprehensive Plan, page 2-7). Results are presented in the Table below.
Table 18: Projected Annual Thermal Loads in 2010-2035 for ICI Sectors in Waldorf, MD
Sector/Projection Growth 2010 2015 2020 2025 2030 2035
Projected Growth, % 0% 10% 9% 7% 7% 7%
ICI Sector Total Area, ft2
2,568,127 2,822,017 3,075,873 3,287,381 3,513,432 3,755,028
Estimated Thermal Loads, million BTU/year
150,093 164,931 179,768 192,129 205,341 219,460
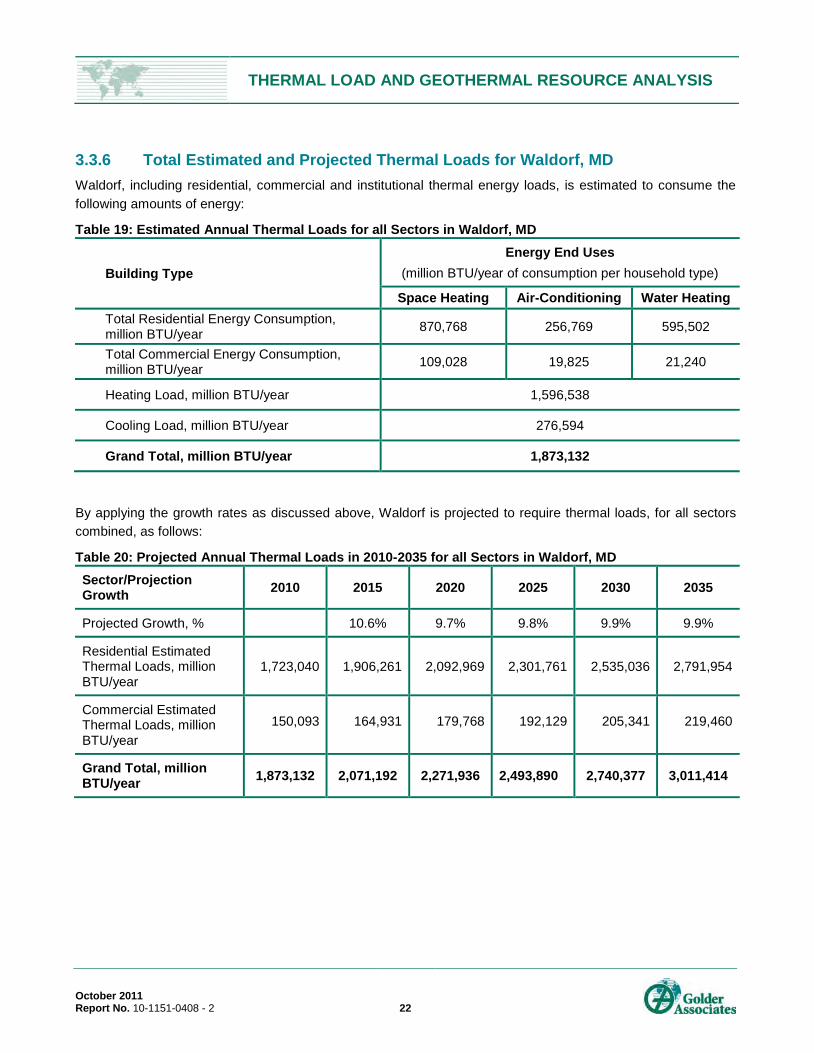
THERMAL LOAD AND GEOTHERMAL RESOURCE ANALYSIS
October 2011 Report No. 10-1151-0408 - 2 22
3.3.6 Total Estimated and Projected Thermal Loads for Waldorf, MD Waldorf, including residential, commercial and institutional thermal energy loads, is estimated to consume the following amounts of energy:
Table 19: Estimated Annual Thermal Loads for all Sectors in Waldorf, MD
Building Type Energy End Uses
(million BTU/year of consumption per household type)
Space Heating Air-Conditioning Water Heating Total Residential Energy Consumption, million BTU/year 870,768 256,769 595,502
Total Commercial Energy Consumption, million BTU/year 109,028 19,825 21,240
Heating Load, million BTU/year 1,596,538
Cooling Load, million BTU/year 276,594
Grand Total, million BTU/year 1,873,132
By applying the growth rates as discussed above, Waldorf is projected to require thermal loads, for all sectors combined, as follows:
Table 20: Projected Annual Thermal Loads in 2010-2035 for all Sectors in Waldorf, MD Sector/Projection Growth 2010 2015 2020 2025 2030 2035
Projected Growth, %
10.6% 9.7% 9.8% 9.9% 9.9%
Residential Estimated Thermal Loads, million BTU/year
1,723,040 1,906,261 2,092,969 2,301,761 2,535,036 2,791,954
Commercial Estimated Thermal Loads, million BTU/year
150,093 164,931 179,768 192,129 205,341 219,460
Grand Total, million BTU/year 1,873,132 2,071,192 2,271,936 2,493,890 2,740,377 3,011,414

THERMAL LOAD AND GEOTHERMAL RESOURCE ANALYSIS
October 2011 Report No. 10-1151-0408 - 2 23
3.4 Thermal Load Assessment Applied to Homefield Residential Subdivision
3.4.1 Homefield Subdivision Homefield subdivision, a mixed density residential neighborhood, is to be completed under St. Charles new Green City plan and is expected to incorporate sustainable building practices in energy savings, water conservation, and transportation into its design.
It has been identified that the future community will house single-family attached and detached housing units, as well as multi-residential buildings. The Homefield neighborhood will share one community center.
Table 21: Housing Units by Type in Homefield Subdivision
Housing Unit Type Area Per
Household ft2
Number of Households
Total Area ft2
Single-family Detached 2500 201 502,500
Single-family Attached 2000 232 464,000
Apartments in 2-4 Unit Buildings - - -
Apartments in 5 or More Unit Buildings 1200 192 230,400
Total 625 1,196,900
Table 22: Commercial and Institutional Buildings in Homefield Subdivision
Building Type Gross Floor Area, ft2
Community Center (Public Assembly) 3,000
Figure 10: Homefield Subdivision Map

THERMAL LOAD AND GEOTHERMAL RESOURCE ANALYSIS
October 2011 Report No. 10-1151-0408 - 2 24
Homefield is to be built to the latest energy efficiency and water conservation standards. For discussion purposes only, the following assumptions of energy efficiency improvement were applied to national energy efficiency ratings for existing homes of the same types, to derive energy end use consumption estimates.
Average space heating and cooling consumption per household of 22,000 BTU/sf/year was reduced to 20,000 BTU/sf/yr.
Water savings for purposes of calculating Domestic Hot Water energy loads, was reduced by 20%.
Household sizes were adjusted from the average to the sizes specified for Homefield construction according to type
3.4.2 Estimated Thermal Loads for the Residential Sector in Homefield Subdivision
The Table below indicates the estimated energy consumption, with improved energy efficiency, for buildings to be built at Homefield.
Table 23: Estimated Annual Thermal Load for Residential Sector in Homefield Subdivision
Building Type Energy End Uses
(million BTU/year of consumption per household type)
Space Heating Air-Conditioning Water Heating
Single-family Detached 4,890 1,509 3,387
Single-family Attached 4,515 1,393 3,127
Apartments in 2-4 Unit Buildings - - -
Apartments in 5 or More Unit Buildings 2,242 692 1,553
Total Energy Consumption per End-Use, million BTU/year 11,647 3,593 8,067
Heating Load, million BTU/year 19,713
Cooling Load, million BTU/year 3,593
Grand Total, million BTU/year 23,307
3.4.3 Projected Thermal Loads for 2010 – 2035 for the Residential Sector in Homefield Subdivision
For the purpose of estimating future thermal loads in Homefield subdivision, it was assumed that the construction of residential units will be occurring in phases. The resulting annual thermal loads are presented in the Table below.

THERMAL LOAD AND GEOTHERMAL RESOURCE ANALYSIS
October 2011 Report No. 10-1151-0408 - 2 25
Table 24: Projected Annual Thermal Loads in 2012-2035 for Residential Sector in Homefield Subdivision
Sector/Projection Growth 2012 2013 2014 2015 2020 2025 2030 2035
Portion to be Built, % 48% 16% 16% 0% 20% 0% 0% 0%
Number of Households 300 400 500 500 625 625 625 625
Estimated Thermal Loads, million BTU/year
11,187 14,916 18,645 18,645 23,307 23,307 23,307 23,307
3.4.4 Estimated Thermal Loads for the ICI Sector in Homefield Subdivision The Table below presents the estimated annual thermal load for one commercial building (community center).
Table 25: Estimated Annual Thermal Load for ICI Sector in Homefield Subdivision
Building Type
Energy End Uses (thousand BTU/year of consumption per building type)
Space Heating Air-Conditioning Water Heating
Community Center (Public Assembly) 108,662 25,200 3,257
Heating Load, thousand BTU/year 111,919
Cooling Load, thousand BTU/year 25,200
Grand Total, thousand BTU/year 137,119
3.4.5 Projected Thermal Loads for 2012 – 2035 for the ICI Sector in Homefield Subdivision
With only one community center, there are no additional commercial buildings projected to be built in the Homefield Subdivision before 2035.
Table 26: Projected Annual Thermal Loads in 2012-2035 for ICI Sector in Homefield Subdivision
Sector/Projection Growth 2012 2013 2014 2015 2020 2025 2030 2035
Portion to be Built, % 100% 0% 0% 0% 0% 0% 0% 0%
C&I Sector Total Area, ft2 3,000 3,000 3,000 3,000 3,000 3,000 3,000 3,000
Estimated Thermal Loads, million BTU/year 137 137 137 137 137 137 137 137

THERMAL LOAD AND GEOTHERMAL RESOURCE ANALYSIS
October 2011 Report No. 10-1151-0408 - 2 26
3.4.6 Total Estimated and Projected Thermal Loads in Homefield Subdivision The Homefield planned residential and commercial construction together, when completed is projected to consume energy as follows:
Table 27: Estimated Annual Thermal Loads for all Sectors in Homefield Subdivision
Building Type Energy End Uses
(million BTU/year of consumption per household type)
Space Heating Air-Conditioning Water Heating Total Residential Energy Consumption, million BTU/year 11,647 3,593 8,067
Total Commercial Energy Consumption, million BTU/year 108.7 25.2 3.3
Heating Load, million BTU/year 19,825
Cooling Load, million BTU/year 3,619
Grand Total, million BTU/year 23,444
Homefield, if built out over five years, could be expected to require thermal energy for residential and commercial space as follows:
Table 28: Projected Annual Thermal Loads in 2012-2035 for all Sectors in Homefield Subdivision Sector/Projection Growth 2012 2013 2014 2015 2020 2025 2030 2035
Portion to be Built, % 48% 16% 16% 0% 20% 0% 0% 0%
Residential Estimated Thermal Loads, million BTU/year
11,187 14,916 18,645 18,645 23,307 23,307 23,307 23,307
Commercial Estimated Thermal Loads, million BTU/year
137 137 137 137 137 137 137 137
Grand Total, million BTU/year 11,324 15,053 18,782 18,782 23,444 23,444 23,444 23,444

THERMAL LOAD AND GEOTHERMAL RESOURCE ANALYSIS
October 2011 Report No. 10-1151-0408 - 2 27
4.0 REVIEW OF GEOLOGY, HYDROGEOLOGY AND THERMAL GROUND PROPERTIES OF CHARLES COUNTY, MD
In this section of the report, we review the geology, hydrogeology and thermal ground properties of Charles County MD in order to develop a prognosis of probable ground temperatures and thermal conductivity, applicable to Charles County MD and further, to consider the various geothermal technologies that may apply and to identify which are most likely to be technically and economically feasible.
Closed loop geothermal systems can be installed almost everywhere, with very high degrees of success, low levels of risk and predictable returns on investment. They require extensive drilling which is costly however they are governed by the local Building Code in most jurisdictions and do not require Federal or State permits. Water well drilling in Maryland requires a State Permit (MDE-local Health Department), and State authorities should be consulted before drilling closed loop geothermal boreholes. The information and data presented below, along with the data provided in the recent Thermal Response Tests conducted near the Homefield site, will be used to develop the technical and business case for closed loop system.
Open loop geothermal systems, on the other hand require access to large flows of water, and must comply with State regulations which govern the extraction and reinjection of groundwater and water in lakes and rivers. They require much less drilling and so are often more economical from a construction point of view, however they involve higher levels of risk, since the water flows they depend on cannot be controlled and may vary according to future geological movement, levels of use by others and climate factors which can influence levels of groundwater and lakes as well as river flows.
Charles County is situated on land permeated by extensive aquifer activity. Therefore we have reviewed these aquifer resources in order to qualify or disqualify their use, as a feasible option for open loop geothermal systems, worthy of further investigation.
4.1 Geological Overview Charles County is located within the Atlantic Coastal Plain physiographic province of Maryland. The Coastal Plain is comprised of a seaward-thickening, wedge-shaped accumulation of unconsolidated sedimentary deposits that overlie crystalline basement rocks. The depth to basement ranges from approximately 600 feet below sea level in northwestern Charles County to over 1,700 ft below sea level in southeastern Charles County. The Coastal Plain sediments were deposited during a series of marine transgressions and regressions separated by intervals of non-deposition and erosion. The resulting geology has formed a layered series of aquifers, composed primarily of sand and gravel, and confining units composed primarily of silt and clay. There are five principle aquifers in Charles County including from youngest to oldest: the Surficial (water table) aquifer, Aquia aquifer, Magothy aquifer, Patapsco aquifer, and Patuxent aquifer. The remaining formations, including the Chesapeake, Nanjemoy, Brightseat, Upper Patapsco, Middle Patapsco and Arundel Clay, serve as confining units or secondary aquifers. The inset below and Figure 1 present a west to east hydrogeologic cross section from Charles County to Calvert County illustrating the eastward dipping and thickening trend of the Coastal Plain wedge.
4.2 Hydrogeologic Framework The individual aquifers are described in more detail below based on review of numerous hydrogeologic reports published by the U.S. Geological Survey (USGS) and the Maryland Geologic Survey (MGS) including Mack

THERMAL LOAD AND GEOTHERMAL RESOURCE ANALYSIS
October 2011 Report No. 10-1151-0408 - 2 28
(1976, 1988), Vroblesky and others (1991), and Drummond (2007). The distribution of aquifers and confining units (i.e., the hydrogeologic framework) of Charles County and the surrounding Coastal Plain counties in southern Maryland are graphically illustrated in the hydrogeologic cross section presented in Figure 12 and 13. Groundwater flow directions and hydraulic gradients are shown as contour maps of the potentiometric surfaces (i.e., groundwater levels or pressure within the aquifers) in Figure 14. The hydraulic conductivity of the aquifers, which along with the hydraulic gradient can be used to estimate groundwater flow velocities are shown in Figure 15.
Figure 11: Coastal Plain Sediment Wedge, Southern Maryland
4.2.1 Surficial Aquifer The Surficial aquifer is exposed at the land surface and is recharged directly from precipitation, providing base flow to nearby streams. It also provides recharge to deeper aquifers, either as leakage through intervening confining units or as direct infiltration where it directly contacts an underlying aquifer. The Surficial aquifer consists of Holocene and Pleistocene sand, gravel, sandy clay and clay up to 150 feet thick overlying Pliocene cobbles, gravel, sand and clay lenses up to 85 feet thick. The Surficial aquifer is generally unconfined and the water table potentiometric surface is controlled by surface drainage features and topography. Water levels fluctuate seasonally in response to evapotranspiration. The Surficial aquifer is tapped by some irrigation wells and domestic wells, but is not widely used for potable water supply because of its vulnerability to contamination and reduced dependability during droughts.

THERMAL LOAD AND GEOTHERMAL RESOURCE ANALYSIS
October 2011 Report No. 10-1151-0408 - 2 29
4.2.2 Aquia Aquifer The Aquia aquifer is present throughout Charles County and outcrops along the western margin of the County, but is confined in the eastern portions of the County. The Aquia Formation is separated from the Surficial aquifer by the Chesapeake Group, lower, clayey parts of the Nanjemoy Formation, referred to as the Nanjemoy confining unit and the Marlboro Clay. These confining units thicken eastward and are approximately 380 feet thick in eastern Charles County (MGS Well # CH Cg 24). The Aquia aquifer is separated from the underlying Magothy aquifer (where it exists) by clayey and silty sediments of the Brightseat Confining unit and clayey units of the upper part of the Magothy Formation. The Aquia aquifer consists of glauconitic sand and sandy clay with beds of fine- to medium-grained sands separated by thin discontinuous layers of silt and clay. The Aquia aquifer is approximately 100 ft thick east of the outcrop area and thickens to approximately 140 feet near Hughesville to the east. The Aquia aquifer is laterally extensive throughout southern Maryland and is used extensively for self-supplied domestic and commercial groundwater users in southern Maryland, as well as in Virginia and the Eastern Shore of Maryland. It is not generally used as a water supply aquifer west of U.S. Route 301 in Charles County. Pumping from the Aquia aquifer has locally depressed groundwater levels and increased hydraulic gradients around the pumping centers near Lexington Park in St Mary’s County to the east (Figure 14). Groundwater elevations in the Aquia aquifer decrease eastwards from above sea level in the outcrop area to approximately 70 feet below sea level (-70 ft msl) in eastern Charles County. The average hydraulic gradient (i.e., slope of the potentiometric surface) across the county in 2009 is approximately 5 ft/mile to the southeast.
The transmissivity of the Aquia aquifer across southern Maryland ranges from 400 to 2,000 square feet per day (ft2/d) (Drummond, 2007). The aquifer hydraulic conductivity in Charles County ranges from 1 to 10 feet per day (ft/d) based on the aquifer transmissivity and modeled aquifer parameters developed by Drummond (2007) presented in Figure 3. Water quality in the Aquia aquifer is generally good and suitable for potable water supply.
4.2.3 Magothy Aquifer The Magothy aquifer is relatively thin and is only present across the northern and eastern portions of Charles County. The Magothy aquifer is absent south of La Plata. The aquifer consists of cross-bedded, fine-grained sands grading downward into coarser-grained sand deposits. Locally, the fine-grained sand unit is separated from the coarse-grained sand unit by clay. In the vicinity of Waldorf, the Magothy aquifer occurs at approximately -300 ft msl and is approximately 50 ft thick. The Magothy aquifer is confined by the overlying Brightseat confining unit which is up to 100 feet thick. The Magothy aquifer is used extensively in the Waldorf area such that a cone of depression has formed around Waldorf and groundwater levels in the aquifer have declined to over -70 ft msl (Curtin, 2010). They hydraulic gradient in the aquifer within this cone of depression are therefore quite steep, approaching 7 ft/mile near Waldorf (Figure 14; Curtin, 2010).
The transmissivity of the Magothy aquifer is variable, decreasing to the south where the aquifer thins and pinches out and increasing towards the east where the aquifer thickens. The aquifer reaches a maximum transmissivity of 7,000 ft2/d in northern Calvert County (Mack, 1986). The hydraulic conductivity of the Magothy aquifer in the Waldorf area is estimated to be approximately 30 ft/d based on a calibrated groundwater flow model (Drummond, 2007) and increases to the east to 50 ft/d (Figure 15). Water quality in the Magothy aquifer is generally good and suitable for potable water supply.

THERMAL LOAD AND GEOTHERMAL RESOURCE ANALYSIS
October 2011 Report No. 10-1151-0408 - 2 30
4.2.4 Patapsco Aquifer The Patapsco formation is divided into four hydrogeologic units: the Upper Patapsco confining unit, the Upper Patapsco aquifer, the Middle Patapsco confining unit, and the Lower Patapsco aquifer. The Upper Patapsco aquifer subcrops beneath the Aquia aquifer in the western portion of Charles County and is overlain by the Brightseat confining unit and the Upper Patapsco confining unit in the central and eastern portions of the County. The Upper and Lower Patapsco aquifers are hydraulically separated by clayey units of the Middle Patapsco confining unit. The aquifers consist predominantly of locally discontinuous coarse-grained sand beds of fluvial-deltaic origin which act regionally as aquifer units. The Patapsco aquifer is an important water source in southern Maryland with yields of more than 600 gpm in Charles County.
4.2.4.1 Upper Patapsco Aquifer The thickness of the Upper Patapsco aquifer ranges from approximately 120 feet east in the outcrop area to 300 feet near La Plata, and from 80 to 150 feet elsewhere in the County as is illustrated in cross section A-A’ shown in Figure 1 and cross section B-B’ provided in Drummond (2007). The top of the Upper Patapsco aquifer ranges from 50 feet above sea level in the outcrop area to approximately 700 below sea level in the eastern portion of the County. Pumping centers in the Upper Patapsco aquifer are mostly centered on La Plata and Waldorf (Figure 14). The hydraulic gradients in these areas are approximately 7 feet/mile (Curtin, 2010).
The transmissivity of the upper Patapsco aquifer in the County ranges from less than 500 ft2/d in western Charles County to more than 4,000 ft2/d near La Plata (Drummond, 2007). The modeled aquifer hydraulic conductivity of the Upper Patapsco aquifer ranges from 1 to 5 ft/d in the west, increasing to 10 ft/d in the eastern portion of the County as shown in Figure 15. Water quality in the upper Patapsco aquifer is generally good and suitable for potable water supply.
4.2.4.2 Lower Patapsco Aquifer The Lower Patapsco aquifer is confined by the overlying Middle Patapsco confining unit which is up to 330 feet thick in eastern Charles County. The total thickness of the Lower Patapsco aquifer in the County ranges from approximately 250 feet in the western part of the County to 320 to 350 feet elsewhere in the County (Cross Sections A-A’ and B-B’ in Drummond, 2007). The top of the Lower Patapsco aquifer ranges from 200 feet below sea level in the western area to approximately 1,000 below sea level in the northeast of the County. Pumping centers in the Lower Patapsco aquifer are mostly centered on La Plata, Waldorf and Morgantown (Figure 14). The development of the Lower Patapsco aquifer in the Indian Head, Waldorf and Morgantown areas has resulted in cones of depression surrounding these areas (Figure 14). Water levels have declined to about 130 ft below sea level in the Indian Head region and more than 200 feet below sea level in the Waldorf area (Curtin, 2010). The hydraulic gradients in this cone of depression exceed 10 feet/mile towards Waldorf in the northwest of the County, and decrease to approximately 6 ft/d in the south and east of the County (Figure 15).
The transmissivity of the Lower Patapsco aquifer in the County ranges from less than 500 ft2/d in western Charles County to more than 3,000 ft2/d near La Plata and Waldorf (Drummond, 2007). The modeled aquifer hydraulic conductivity of the Lower Patapsco aquifer ranges from 1 ft/d in the southeast portion of the County to 10 ft/d in the south and near La Plata. To the west and north of the county, modeled hydraulic conductivity decrease to 4 ft/d (Drummond, 2007) as shown in Figure 15. Water quality in the lower Patapsco aquifer is generally good. Regionally the TDS ranges from 122 to 768 mg/L (Drummond 1988).

THERMAL LOAD AND GEOTHERMAL RESOURCE ANALYSIS
October 2011 Report No. 10-1151-0408 - 2 31
4.2.5 Patuxent Aquifer The Patuxent aquifer underlies the Lower Patapsco aquifer and separated by the Arundel Formation confining unit which is over 100 ft thick. The Patuxent aquifer consists of variably colored sands interbedded with clays. The Patuxent aquifer is over 450 feet thick near La Plata (Drummond, 2007). The top of the Patuxent aquifer is approximately 400 feet below sea level in northwestern Charles County and approximately 1,800 feet below sea level in the eastern portion of the County. The aquifer is an important groundwater source in Charles County, particularly in the northwest, and will be further developed to reduce overpumping in the Patapsco and Aquia aquifers. A cone of depression has formed in the Patuxent aquifer due to pumping in the Indian Head area and Bryans Road area due to development of the as a water supply source. Here, water levels have declined to approximately 50 feet below sea level (Curtin, 2010). The hydraulic gradients in this cone of depression exceed 6 feet/mile near Indian Head. East of this cone of depression, the groundwater gradients appear to be 1-2 ft/d in the south and east of the County (Figure 15).
Regionally the transmissivity of the Patuxent aquifer ranges from 80 to 4,400 ft2/d (Andreasen, 1999). In the Waldorf area, the average aquifer transmissivity measured from two wells was 1,070 ft2/d (Andreasen, 2004). The estimated aquifer hydraulic conductivity in this area, assuming an aquifer thickness of 400 feet, is 2.7 ft/d. Well yields measured in the Bryans Road area range from 620 to 750 gpm. The water quality is generally good. Total dissolved solid (TDS) concentrations increase with depth in the coastal plain aquifers. TDS concentrations in the Patuxent aquifer in Charles County range from 214 to 602 mg/L and iron and manganese concentrations may exceed secondary drinking water standards (Drummond, 2007).
4.3 Area Water Use and Well Yields Groundwater is the primary source of potable water for Charles County’s public water systems. There are 54 public water systems which supply drinking water service to approximately two-thirds of the County housing units (Charles County Comprehensive Water and Sewer Plan, 2006). Of these systems, 20 are operated by the County. The Towns of Indian Head and La Plata each operate their own water system and non-community water systems are operated by the Naval Surface Warfare Center and Mirant Morgantown power station.
The Waldorf water system is the County’s largest water system. The Waldorf system is supplied by 16 production wells, 9 of which are completed in the Magothy aquifer and 7 are completed in the Patapsco aquifers (Charles County Comprehensive Plan – Water Resource Element, 2011). Cumulatively, there are 47 production wells supplying groundwater to the 11 largest water systems that are operated in the County. These production wells are completed in the following aquifers: Aquia (2 wells), Magothy (9 wells), Patapsco (31 wells), and Patuxent (5 wells).
Data on well yields, specific capacity, and groundwater temperature has been compiled and is summarized in Table 1 on 108 water supply wells in Charles County from published reports (Drummond, 1997; Andreasen, 2004; and Charles County Comprehensive Water and Sewer Plan, 2006). The full listing of permitted water supply wells in Charles County is presented as Table 2 and provided as an attachment to this memo. As indicated, well yield in the Aquia aquifer ranges up to 150 gpm with a median yield of approximately 50 gpm. The yield of wells in the Magothy aquifer ranges up to 650 gpm with a median yield of approximately 190 gpm. Well yields in the Upper Patapsco aquifer ranges up to 340 gpm with a median yield of approximately 150 gpm. Well yields in the Lower Patapsco aquifer ranges up to 610 gpm with a median yield of 134 gpm. The yield of wells in the Patuxent aquifer ranges up to 750 gpm with a median yield of approximately 200 gpm. The average

THERMAL LOAD AND GEOTHERMAL RESOURCE ANALYSIS
October 2011 Report No. 10-1151-0408 - 2 32
specific capacity of the well, which is a reflection of the well’s productivity, ranges from 2 to 3.5 for the Patapsco and Patuxent aquifers. The groundwater temperature measurements collected from 65 wells averages between 68 and 69 degrees Fahrenheit.
Table 29: Statistics Analysis on Area Well Yield and Specific Capacity, Charles County, MD
Aquifer Well Yield (gpm)
Specific Capacity (gpm/ft)
Temperature (oC / oF)
Aquia Aquifer Minimum 5 - - Maximum 147 - - Average 47 - - Median 60 - - # of Wells 8 - - Magothy Aquifer Minimum 17 - - Maximum 650 - - Average 189 - - Median 59 - - # of Wells 27 - - Upper Patapsco Aquifer Minimum 8 0.2 16.5 / 61.7 Maximum 340 1.9 21 / 69.8 Average 56 0.7 17.5 / 63.5 Median 150 1.95 - # of Wells 14 14 14 Lower Patapsco Aquifer Minimum 17 0.4 14.5 / 58.1 Maximum 610 19.2 26 / 78.8 Average 257 3.55 20.1 / 68.2 Median 134 2.1 - # of Wells 47 47 46 Patuxent Aquifer Minimum 36 0.3 19.1 / 66.4 Maximum 750 5.9 23 / 73.4 Average 283 2.0 20.7 / 69.3 Median 200 2.2 - # of Wells 12 12 5
Notes: Statistical analysis of well yield and specific capacity is based on review and analysis of well yield tests
from 108 area wells (Drummond, 1997; Andreasen, 2004; and Charles County Comprehensive Water and
Sewer Plan, 2006). Estimated well yield is based on the reported pump capacity.

33
Figure 12: Hydrogeologic Cross-section of Southern Maryland (A)

34
Figure 13: Hydrogeologic Cross-section of Southern Maryland (B)

35
Figure 14: Potentiometric Surface Maps

36
Figure 15: Modeled Aquifer Hydraulic Conductivity

THERMAL LOAD AND GEOTHERMAL RESOURCE ANALYSIS
October 2011 Report No. 10-1151-0408 - 2 37
5.0 ASSESSMENT OF POTENTIAL USE OF GEOTHERMAL OPEN LOOP SYSTEMS IN CHARLES COUNTY, MD
5.1 Groundwater Permitting Requirements Groundwater withdrawal and use are regulated by Maryland Department of the Environment (MDE) Water Management Administration. A permit is required for any activity that withdraws water from the State's surface and/or underground waters of more than 10,000 gpd. The water appropriation permit approval requirements include:
Obtain local land use zoning approvals and check for consistency with county water and sewer plan.
A Well Construction Permit is required before installing any well pursuant to COMAR 26.04.04 (MD Well Const. Regulations). The final selection of a production well site will also require a Water and Sewerage Construction Permit.
Submit Water Appropriation permit application for technical review and include:
Explanation of water use;
Average daily use calculated on an annual basis;
Average daily use during the month of highest use;
Submit plans and specifications for any facility or structure or conduct and submit special evaluations as requested. Appropriation requests for an annual average withdrawal of more than 10,000 gpd may require aquifer testing, geophysical well logging, or other technical analysis as determined by MDE. Certified notification of contiguous property owners and certification of compliance with Business Occupations and Professions, Article 12, §205, Annotated Code of Maryland.
Requests for an annual average withdrawal of more than 10,000 gpd are advertised for a public information hearing.
The MDE regulates groundwater appropriation permits and may deny issuance of appropriation permits if the predicted drawdown of the proposed withdrawal lowers the potentiometric surface in the aquifer below 80 percent management level. The MDE defines this level at a given location as 80 percent of total available drawdown measured from the prepumping water level to the top of the aquifer (Code of Maryland Regulations [COMAR] 26.17.06.D(4)). MDE regulates groundwater withdrawals to prevent the regional potentiometric surface from declining below this level. The 80-percent management level is not applied in the outcrop area of an aquifer. Also, the cumulative effect of several production wells on groundwater levels in the shallow portions of confined aquifers is not considered in application of the 80-percent management level.
5.2 Specific Permits for Geothermal Systems An open-loop geothermal well system would require a well construction permit and a groundwater appropriation permit if the annual average withdrawal is greater than 10,000 gpd, regardless of the fact that the water may be re-injected back into the same aquifer. The following additional permits may be required as part of developing an open-loop geothermal system:

THERMAL LOAD AND GEOTHERMAL RESOURCE ANALYSIS
October 2011 Report No. 10-1151-0408 - 2 38
Geothermal exploratory and appropriation permits subject to Maryland’s Geothermal Resources Act 5-601 to 605
The application shall include a description of what is planned to be constructed, its purpose, use, location, estimated cost, and size
The methods of construction, construction schedule, and operation procedure
A list of licenses, permits, or other approvals required by any government unit
Detailed information as to the need for the use and facts concerning alternate site locations as may be requested by MDE
Information providing proof of the discovery of a geothermal resource and an evaluation of the resource
A public notice and hearing
An Underground Injection Control (UIC) permit may be required to return the water to aquifer. Maryland has primacy for the UIC Program and MDE has the authority to require a permit for any Class V well that has the potential to endanger underground sources of drinking water
A National Pollution Discharge Elimination System (NPDES) permit may be required to discharge the to a nearby surface water body
Following public notice and opportunity for public hearing, MDE may issue a permit for the appropriation or use of geothermal resources if the Department finds that the applicant has demonstrated that the use:
Conforms with and meets all applicable air, water, and noise laws of the State;
Conforms with all applicable State and local plans;
Would have no material adverse effect upon the natural environment of the area, its scenic or natural beauty, rare or irreplaceable resources, or unique historic site;
Would not be so located, constructed, or operated as to have a material adverse effect upon the public health, safety, or welfare;
Would not be a potential or immediate undue burden on the water supply of the site or region; and
Would not cause an unreasonable rate of resource exhaustion
5.3 Feasibility of Geothermal Open Loop Systems in Charles County, MD Using the Building Load assessment data presented in Sections 2 and 3 of this Report, Golder has completed a preliminary analysis on the amount of water required for an open-loop geothermal system installation for the Homefield development and a portion of Waldorf consisting of mixed commercial and multi-family residential units. Open-loop geothermal systems use water from a surface water source such as a lake, river or bay, or more typically, a groundwater source. Open-loop systems can be less expensive than closed-loop systems provided that there is a sufficient supply of clean water that can be extracted and discharged back into the original source or into a return well.

THERMAL LOAD AND GEOTHERMAL RESOURCE ANALYSIS
October 2011 Report No. 10-1151-0408 - 2 39
The water demand calculations for an open-loop system are provided as Attachment 1 to this memo. For the Homefield development, it is assumed that each residential unit requires 3 tons of capacity per town home. For the 625 units, a total capacity of 1,875 tons would be required. The estimated water flow rate to support an open-loop geothermal system for the Homefield development is estimated at 4,085 gallons per minute (gpm). This is equivalent to approximately 6.5 gpm per residential unit. A typical detached residential home requires up to 10 to 15 gpm.
For Waldorf, it is assumed that the redevelopment area will be 300 acres, or approximately 12 city blocks (6 blocks long by 2 blocks wide) with new commercial and high density residential. It is assumed that a centralized direct exchange system would be installed and would require an exchange capacity of 3,000 tons. The calculated water demand for this system would be 6,600 gpm.
The hydrogeological review presented above, indicates the presence of productive coastal plain aquifers beneath Charles County. It is possible that a series of groundwater wells could be developed to support an open-loop geothermal system; however, the costs and environmental issues associated with such a scheme would be prohibitive. A minimum of 6 to 8 high capacity production wells would have to be drilled to depths of more than 1,200 feet deep into the Lower Patapsco aquifer or preferably the underlying Patuxent aquifer, which is not used for drinking water supplies in down dip portions of the County. Permitting such large withdrawals even if the water is recharged back into the aquifer would be difficult if not impossible because such large withdrawals may impact the 80 percent groundwater management level and because these aquifers support regional public drinking water needs. As a rule of thumb, it will take up to twice as many wells to re-inject the amount of water that is withdrawn from a confined aquifer, so it could take 12 to 16 recharge wells in addition to the production wells. Lastly, possible elevated corrosivity and total dissolved solids in the groundwater may cause maintenance problems with the geothermal heat exchange system, possibly to the point of requiring expensive water treatment. Also, the recharge water from the heat exchanger will have altered temperature and may have altered pH and metal concentrations from contact with the pipe and addition of corrosion inhibitors. No further consideration of an open-loop geothermal exchange system is recommended at this time.

THERMAL LOAD AND GEOTHERMAL RESOURCE ANALYSIS
October 2011 Report No. 10-1151-0408 - 2 40
6.0 ASSESSMENT OF POTENTIAL USE OF GEOTHERMAL CLOSED LOOP SYSTEMS IN CHARLES COUNTY, MD
Closed loop Geothermal systems are described in the Charles County Community Geothermal Study (Golder, 2011), Report I: Geothermal Technology Review, 3.1.2 Closed Loop Systems.
As discussed there, horizontal closed loop geothermal systems require access to a large amount of unused land, approximately 1000 square feet per ton of geothermal energy required. Vertical closed loop systems on the other hand, require only 75 to 110 square feet per ton of geothermal energy, depending on the depth drilled. Horizontal loop fields can be under parking lots or sports fields, but cannot be covered by buildings or other insulating structures. Vertical bore fields, on the other hand can be installed under buildings before they are built or can be placed in tight areas such as laneways or perimeters, where surface exposure is minimal, perhaps only enough for drilling, with the thermal exposure taking place below ground, reaching under existing buildings and roads. Therefore for the purposes of assessing large projects, closed loop vertical bore fields are only considered. Closed loop horizontal systems will be discussed briefly, as they apply to circumstances such as schools and sports fields, shopping mall parking lots and other open land situations.
This Section 6.0 deals only with the influences of the ground on the feasibility and economics of considering geothermal energy. This “energy supply” component is only one of three components of a geothermal system, the other two being the central energy processing plant (whether a single heat-pump or a central district energy plant) and the building HVAC system. The latter two components of a geothermal system will be discussed further in Report III of this study, yet to be written.
6.1 Assessment of Ground Thermal Conductivity and Diffusivity in Charles County, MD
Can the ground available provide the energy required to satisfy the building loads proposed for geothermal energy supply? This is the first question that needs to be answered when considering the installation of closed loop geothermal energy systems.
In the Charles County Community Geothermal Study (Golder, 2011), Report I: Geothermal Technology Review, 5.1 Thermal Conductivity of the Ground, the principles of ground thermal conductivity are discussed. This section addresses the application of the science of thermal conductivity specifically to the sites of interest, to derive a high level assessment of the ability of the ground to produce energy to supply building loads under consideration.
Horizontal Closed Loop Systems The feasibility of the ground to supply energy to closed loop horizontal geothermal systems is very much a function of space that is to land that can be excavated and backfilled, with minimal surface obstruction to radiation from the sun. The loops need to be installed below the frost line, with a typical single family house requiring up to 3000 sq. ft. of land in which to install enough loop to supply it with heating and cooling. While feasible for large residential properties where landscaping can be destroyed and remediated, or for schools where sports fields can easily be accessed, for areas of dense occupancy, they are not practical and in many cases, not cheaper than vertical bore fields, when excavation and site remediation costs are factored in. Thermal conductivity is not tested for horizontal closed loop systems, since they are installed in soil or sand or other loose material or in some cases water, such as a pond or lake bottom, and the thermal conductivity of

THERMAL LOAD AND GEOTHERMAL RESOURCE ANALYSIS
October 2011 Report No. 10-1151-0408 - 2 41
these materials is well known. The ground temperature into which horizontal loops are installed varies seasonally, tempered by the covering soil so that freezing does not occur, but often changing by 30°F or more from summer to winter. Horizontal closed loop geothermal systems will not be dealt with further in this section.
Vertical Closed Loop Systems The feasibility of the ground to supply energy to closed loop vertical geothermal systems is primarily dependant on two factors: a) the ability of drill rigs to penetrate the ground to depths of up to 600 feet without encountering obstructions such as caverns or tunnels, high pressure aquifers, thick wet clay-like sediment pockets, pockets of oil, methane or natural gas, or any of several other hindering geological or man-made formations, and b) the economics of installing a geo-exchange groundworks to collect and dissipate energy. One factor influencing the economics of the ground component of a vertical geothermal project is the amount of thermal energy contained in the ground and the rate at which it can be captured and transferred to and from the connected buildings, a function of the thermal conductivity of the ground and the thermal properties of an installed bore hole.
Other factors influencing the economics of the ground component of a geothermal system include the cost of drilling as influenced by geological materials and conditions encountered, the local competitive market for experienced geothermal system drillers and installers, and the size, balance and concentration of the building thermal loads to be supplied. These factors are discussed in general in the Charles County Community Geothermal Study (Golder, 2011), Report I: Geothermal Technology Review, Section 5.2 to 5.4 and will be discussed further in the third Report of this study, yet to be written, which will deal in more detail with the costs and business case of installing geothermal systems.
To assess the thermal properties of the ground that will impact geothermal system design and energy supply, two methods are used, usually in conjunction with each other: a) the geology and hydrogeology of the subject property is profiled, as in Section 4.0 above and b) test boreholes are drilled and thermal conductivity tests performed, to obtain real time data which is analyzed and reported.
6.1.1 Local Test Drilling and Testing of Thermal Conductivity In September 2009, a local geothermal services company, Chesapeake GeoSystems Inc. of Baltimore MD, conducted three thermal conductivity (TC) tests on boreholes drilled at the new Charles County High School, within one mile of the Homefield residential subdivision. The data collected from the tests was analyzed by Geothermal Resource Technologies Inc., Bowie, Texas.
The applicable national recommended procedures for thermal conductivity testing of geothermal bore holes is published by the American Society of Heating, Refrigeration, and Air-Conditioning Engineers, ASHRAE 2007 HVAC Applications Handbook, pages 32.12-32.13. The minimum standard was adhered to for these tests.
The data collected in the three tests is summarized in the following Table:
Table 30: Summary of Three Local Thermal Conductivity Tests, 2009
NGEO1 NGEO2 NGEO3
Test Dates September 2 - 4 August 31 – September 2 October 7 - 9 Diameter / Depth 6 in / 310 ft 6 in / 308 ft 6 in / 400 ft Grout Mixture 0.75 BTU/hr - ft - °F 0.75 BTU/hr - ft - °F 0.75 BTU/hr - ft - °F Drill Log Geology 0”-1” topsoil 0”-1” topsoil 0’-20’ brown sand
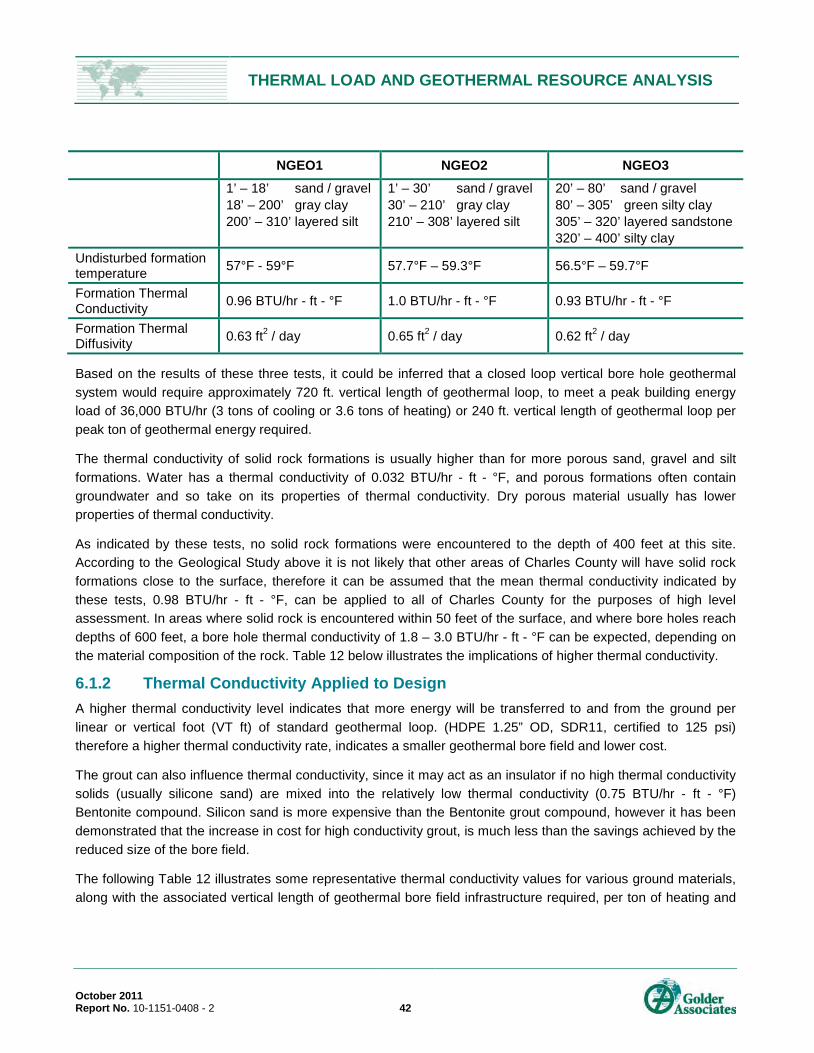
THERMAL LOAD AND GEOTHERMAL RESOURCE ANALYSIS
October 2011 Report No. 10-1151-0408 - 2 42
NGEO1 NGEO2 NGEO3 1’ – 18’ sand / gravel 18’ – 200’ gray clay 200’ – 310’ layered silt
1’ – 30’ sand / gravel 30’ – 210’ gray clay 210’ – 308’ layered silt
20’ – 80’ sand / gravel 80’ – 305’ green silty clay 305’ – 320’ layered sandstone 320’ – 400’ silty clay
Undisturbed formation temperature 57°F - 59°F 57.7°F – 59.3°F 56.5°F – 59.7°F
Formation Thermal Conductivity 0.96 BTU/hr - ft - °F 1.0 BTU/hr - ft - °F 0.93 BTU/hr - ft - °F
Formation Thermal Diffusivity 0.63 ft2 / day 0.65 ft2 / day 0.62 ft2 / day
Based on the results of these three tests, it could be inferred that a closed loop vertical bore hole geothermal system would require approximately 720 ft. vertical length of geothermal loop, to meet a peak building energy load of 36,000 BTU/hr (3 tons of cooling or 3.6 tons of heating) or 240 ft. vertical length of geothermal loop per peak ton of geothermal energy required.
The thermal conductivity of solid rock formations is usually higher than for more porous sand, gravel and silt formations. Water has a thermal conductivity of 0.032 BTU/hr - ft - °F, and porous formations often contain groundwater and so take on its properties of thermal conductivity. Dry porous material usually has lower properties of thermal conductivity.
As indicated by these tests, no solid rock formations were encountered to the depth of 400 feet at this site. According to the Geological Study above it is not likely that other areas of Charles County will have solid rock formations close to the surface, therefore it can be assumed that the mean thermal conductivity indicated by these tests, 0.98 BTU/hr - ft - °F, can be applied to all of Charles County for the purposes of high level assessment. In areas where solid rock is encountered within 50 feet of the surface, and where bore holes reach depths of 600 feet, a bore hole thermal conductivity of 1.8 – 3.0 BTU/hr - ft - °F can be expected, depending on the material composition of the rock. Table 12 below illustrates the implications of higher thermal conductivity.
6.1.2 Thermal Conductivity Applied to Design A higher thermal conductivity level indicates that more energy will be transferred to and from the ground per linear or vertical foot (VT ft) of standard geothermal loop. (HDPE 1.25” OD, SDR11, certified to 125 psi) therefore a higher thermal conductivity rate, indicates a smaller geothermal bore field and lower cost.
The grout can also influence thermal conductivity, since it may act as an insulator if no high thermal conductivity solids (usually silicone sand) are mixed into the relatively low thermal conductivity (0.75 BTU/hr - ft - °F) Bentonite compound. Silicon sand is more expensive than the Bentonite grout compound, however it has been demonstrated that the increase in cost for high conductivity grout, is much less than the savings achieved by the reduced size of the bore field.
The following Table 12 illustrates some representative thermal conductivity values for various ground materials, along with the associated vertical length of geothermal bore field infrastructure required, per ton of heating and

THERMAL LOAD AND GEOTHERMAL RESOURCE ANALYSIS
October 2011 Report No. 10-1151-0408 - 2 43
cooling produced18. With a thermal conductivity rating of 0.98 BTU/hr - ft - °F, using grout with a thermal conductivity rating of 0.75 BTU/hr - ft - °F, The Charles County High School could expect to need, approximately 240 vertical feet19
of geothermal loop for each ton of peak capacity required to meet the peak heating/cooling load of the building. Perhaps, if the grout was mixed to yield a thermal conductivity of 1.0 BTU/hr - ft - °F to match that of the ground as indicated by the TC tests, slightly higher thermal conductivity might be achieved for production bore holes at the High School site.
Figure 16: Sample of Ground Material Thermal Conductivity Ratings and Estimated Geothermal Loop Length
In the design of the geothermal bore field there are some incremental factors that can take advantage of known geological conditions to increase the thermal conductivity of a particular bore hole. For example, drilling to a depth that will reach higher thermal conductivity producing ground materials or where material is dry drilling to a depth that will reach groundwater. Flowing groundwater can carry heat away from a borehole, much faster than waiting for heat to be absorbed into still ground. Grout mixed to the same thermal conductivity level as the ground it is installed into, will reduce the insulating effect, though to reach TC levels higher than 1.1 BTU/hr - ft - °F requires too much silicon sand, thereby thickening the grout so that it will not flow and cannot be effectively installed. Smaller diameter boreholes can also reduce the effect of insulation, if the grout has a lower TC than the ground and smaller diameters have the added benefit of reducing the volume of grout required, therefore reducing cost.
18 US Dept of Energy, Virginia Department of Mines, Minerals and Energy, http://www.geo4va.vt.edu/A1/A1.htm#A1sec3b
19 Various software is available for calculating bore field sizes. GLD 2010, Gaia Geothermal, LLC is a leading software suite for designing geothermal heat pump and ground heat exchanger systems, used in 55 countries, http://www.gaiageo.com/?gclid=CJ-Z9orD7asCFY4UKgodEhaQKQ
Geothermal Ground Thermal Conductivity Btu/hr-ft-°F LoopsMaterial 0.01 0.03 0.14 0.17 0.40 0.46 0.52 0.55 0.64 0.70 0.84 1.00 1.10 1.20 1.35 1.50 1.70 2.00 3.20 VT ft/ton
AirWaterPeat Soil, dryClay Soil, dry Sandy Soil, dryCrushed stoneConcreteLoamGravel 318Sand, dry 296Limestone 282Sand, wet 262Silt clay, wet 242Sandstone 232Shale 226Granite 216Dolomite 200

THERMAL LOAD AND GEOTHERMAL RESOURCE ANALYSIS
October 2011 Report No. 10-1151-0408 - 2 44
6.2 Permitting Requirements for Closed Loop Geothermal Systems As the number of systems increases, environmental concerns are also coming to the forefront. Responsibility for groundwater quality can come under the purview of Federal, state, and local or regional governmental entities20
The primary concern of the states is protection of groundwater quality, and all are at least concerned about the potential for groundwater contamination due to these systems. However, the reaction of the various states to this concern has varied greatly. The resulting action ranges from benign neglect to proscriptive policies which dictate materials and methods of design and installation very precisely. The recent increase in the number of installed systems has improved awareness, but has not necessarily increased understanding and knowledge among those who are responsible for promulgating and enforcing environmental regulations and has not promoted consensus.
. The Federal UIC and NPDES regulations were designed to prevent contamination of groundwater, aquifer, and surface water. However, the UIC portion of the Safe Water Drinking Act (40 CFR, Parts 144-147) precludes a closed-loop geothermal system from being defined as an injection well as it is not used for the emplacement of fluids underground. Similarly, the NPDES portion of the Clean Water Act (40 CFR, Parts 122-124) which covers surface discharge of fluids, does not include geothermal (ground-coupled heat pump) systems under the definition it uses for “waters of the United States”, which specifically limits its influence to such water bodies as wetlands, ponds, streams, sloughs, and navigable waterways. However, nothing in either the UIC or NPDES regulations precludes any state, county, parish, water district, municipality, etc. from adopting more stringent regulations. The majority of regulatory activity concerning closed loop geothermal (ground-coupled heat pump) systems has occurred at the state level.
In some cases, regulators have consulted with the practitioners in a particular state or region, and have worked out acceptable statutes which the industry accepts as sensible. In other cases, regulators have been hostile to concerns from industry practitioners, and have enacted debilitating legislation despite technical and scientific arguments to the contrary. Yet again, others have acted out of a sense of protective duty, but with ignorance of the technology and a lack of understanding of various options and their environmental impact.
Apart from groundwater protection concerns, there are construction standards embedded in most national, state and municipal Building Codes, that refer to the American Society of Heating, Refrigeration, and Air-Conditioning Engineers, ASHRAE 2007 HVAC Applications Handbook, Geothermal Energy21
horizontal loop construction,
. In this document, engineering formulas, calculations, material requirements, performance standards and installation methods are described in detail. Existing regulations for closed-loop systems tend to fall into the following categories:
vertical borehole and loop construction,
grouting or backfill methods and materials,
antifreeze specifications, and
20 SURVEY OF GEOTHERMAL HEAT PUMP REGULATIONS IN THE UNITED STATES, Karen Den Braven, University of Idaho, Mechanical Engineering Department, Moscow, ID 83844-0902 21 (ASHRAE, 2007), Geothermal Energy - Chapter 32. In 2003 ASHRAE HVAC Applications Handbook, SI Edition, American Society of Heating, Refrigerating and Air-Conditioning Engineers, Inc., 2007.

THERMAL LOAD AND GEOTHERMAL RESOURCE ANALYSIS
October 2011 Report No. 10-1151-0408 - 2 45
direct expansion specifications.
(A very few will mention such lesser used systems as mains-connected systems, and standing columns wells.)
6.3 Geothermal Energy Building Load / Capacity Analysis The analysis presented in this report, indicates that installation of closed loop geothermal systems in Charles County MD, is technically feasible. However geothermal systems need to be scaled to the thermal demand for heating and cooling. Further, that thermal demand needs to be carefully assessed for its balance between the annual heating energy volumes required and the annual cooling energy volumes required. This balancing, discussed in Report I, Geothermal Technology Review, 5.2 Borefield Balance and Sustainability, page 24, can affect the overall size of a borefield, which is first assessed for peak capacity, then adjusted if necessary for balancing of the loads. This applies to designing a geothermal system for one house or for a subdivision such as Homefield or for an urban development such as Waldorf.
It is important to clarify two concepts that are very often confused. One is energy consumption, which is the overall amount of energy required by a building usually over the period of a year. The other is the peak loads of the building, which is the maximum amount of heat energy the building will require to maintain its winter operating design temperature, on the coldest day of the winter and it is also the maximum amount of cooling energy the building will require to maintain its summer operating design temperature, on the hottest day of the summer. These concepts seem clear enough when discussing projects, however they are very different in design calculation since they are dependent on different factors, and so cannot be converted one to the other without the input of independent weather and building use data. One reason this can be difficult is that energy intensity data that is available from Department of Energy data bases, refers to annual consumption, not peak loads. For the purposes of estimating the sizes and scales of various geothermal systems, Golder has applied data and reasonable assumptions, to derive system scenarios to the best of their ability. However, the data presented here should only be used for purposes of concept discussion, and are to be considered ‘order of magnitude’ estimations. Specialized software and specific data analysis is required in order to estimate any individual project, with a higher level of accuracy.
Presented in the Figure below, are the order of magnitude calculations, for geothermal systems, if they were installed in Charles County MD, to serve the loads estimated in;
1) The whole of Charles County, 201022
2) Waldorf Urban Development area, 2006, projections for 2010
23
3) Homefield Subdivision, when entirely built, 2011 plans
While no one would consider supplying all of Charles County with geothermal energy, this analysis is used to establish assumptions, consider the scale of the thermal loads in Charles County and provide a quantitative base line for measurement of improvements, if projects proceed in the future. Comparative information may include percentage reduction in thermal loads and energy consumed, percentage reduction in Green House Gas (GHG) emissions produced from thermal energy, and others.
22 2006 Charles County Comprehensive Plan 23 2006 Charles County Comprehensive Plan, Table 2-4, Projected Number of Housing Units by Election District.

46
Project: Charles County MD - Estimate of Building Heating and Cooling Loads for Geothermal Energy SupplySites: Charles County 43563 ft2/acre
WaldorfHomefield Building Occupied Space Energy Peak Loads Geothermal Heating and Cooling Loads Borefield Area Required (600 ft. depth) Borefield Area Required (1000 ft. depth)Charles County GFA GFA Total Spc Heating Cooling DHW Spc Heating Cooling DHW Bore Holes (A) Bore Holes (B) Borefield (A) Borefield (B) Bore Holes (A) Bore Holes (B) Borefield (A) Borefield (B)
total total total number number acres acres number number acres acresnumber unit size commercial residential Peak Peak Peak 600' deep 600' deep 15' centres 15' centres 1000' deep 1000' deep 15' centres 15' centres
units sq.ft. sq.ft. sq.ft. sq.ft. Res t/unit Res t/unit Res t/unit tonnes tonnes tonnes T/BH T/BH ft2 ft2 T/BH T/BH ft2 ft2
Comm t/sf Comm t/sf Comm t/sf 2.5 3 225 225 4.2 5.0 225 225
Res Single-family Detached 38,853 1900 73,820,700 73,820,700 3.2 1.9 2.1 123,035 73,821 82,925 65,799 54,832 340 283 39,479 32,899 203.9 169.9 Single-family Attached 9,872 1800 17,769,600 17,769,600 3.0 1.8 2.0 29,616 17,770 19,961 15,839 13,199 82 68 9,503 7,919 49.1 40.9 Apartments in 2-4 Unit Buildings 1,278 2100 2,683,800 2,683,800 3.5 2.1 2.4 4,473 2,684 3,015 2,392 1,993 12 10 1,435 1,196 7.4 6.2 Apartments in 5 or More Unit Buildings 3,620 1000 3,620,000 3,620,000 1.7 1.0 1.1 6,033 3,620 4,066 3,227 2,689 17 14 1,936 1,613 10.0 8.3
Comm Mercantile (Food and non-food retail) 8,759,744 8,759,744 0.00100 0.00032 0.00021 8730 2810 1796 3,851 3,209 20 17 2,311 1,926 11.9 9.9 Office 2,963,021 2,963,021 0.00096 0.00020 0.00006 2853 604 168 1,175 979 6 5 705 587 3.6 3.0 Industrial (Warehouse and Storage)* 2,094,530 2,094,530 0.00113 0.00006 0.00003 2375 125 71 964 803 5 4 579 482 3.0 2.5 Flex Space (Other) 702,245 702,245 0.00330 0.00034 0.00008 2315 239 59 938 782 5 4 563 469 2.9 2.4
Total Charles County Building 53,623 14,519,540 97,894,100 112,413,640 179,430 101,672 112,063 Total Heating Load (includes space heating peak load + 50% of DHW peak load, 50% free bi-product from geo system) 235,462 tons 94,185 78,487 486 405 56,511 47,092 292 243 Total Cooling Load (no additional capacity required) 101,672 tons
Building Occupied Space Energy Peak Loads Geothermal Heating and Cooling Loads Borefield Area Required (600 ft. depth) Borefield Area Required (1000 ft. depth)Waldorf GFA GFA Total Spc Heating Cooling DHW Spc Heating Cooling DHW Bore Holes (A) Bore Holes (B) Borefield (A) Borefield (B) Bore Holes (A) Bore Holes (B) Borefield (A) Borefield (B)
total total total number number acres acres number number acres acresnumber unit size commercial residential Peak Peak Peak 600' deep 600' deep 15' centres 15' centres 1000' deep 1000' deep 15' centres 15' centres
units sq.ft. sq.ft. sq.ft. sq.ft. Res t/unit Res t/unit Res t/unit tonnes tonnes tonnes T/BH T/BH ft2 ft2 T/BH T/BH ft2 ft2
Comm t/sf Comm t/sf Comm t/sf 2.5 3 225 225 4.2 5.0 225 225
Res Single-family Detached 20,128 1900 38,243,200 38,243,200 3.2 1.9 2.1 63,739 38,243 42,960 34,087 28,406 176.1 146.7 20,452 17,044 105.6 88.0 Single-family Attached 4,963 1800 8,933,400 8,933,400 3.0 1.8 2.0 14,889 8,933 10,035 7,963 6,636 41.1 34.3 4,778 3,981 24.7 20.6 Apartments in 2-4 Unit Buildings 551 2100 1,157,100 1,157,100 3.5 2.1 2.4 1,929 1,157 1,300 1,031 859 5.3 4.4 619 516 3.2 2.7 Apartments in 5 or More Unit Building 1930 1000 1,930,000 1,930,000 1.7 1.0 1.1 3,217 1,930 2,168 1,720 1,434 8.9 7.4 1,032 860 5.3 4.4
Comm Education 2,443 2,443 0.00164 0.00026 0.00023 4 1 1 2 1 0.0 0.0 1 1 0.0 0.0 Food Sales 53,809 53,809 0.00120 0.00032 0.00012 65 17 6 27 23 0.1 0.1 16 14 0.1 0.1 Food Services 118,485 118,485 0.00179 0.00056 0.00162 212 67 192 123 103 0.6 0.5 74 62 0.4 0.3 Health Care (In- and Outpatient) 305,700 305,700 0.00292 0.00046 0.00121 894 140 371 432 360 2.2 1.9 259 216 1.3 1.1 Mercantile 536,542 536,542 0.00100 0.00032 0.00021 535 172 110 236 197 1.2 1.0 142 118 0.7 0.6 Office 759,130 759,130 0.00136 0.00029 0.00008 1034 219 61 426 355 2.2 1.8 255 213 1.3 1.1 Public Assembly 167,204 167,204 0.00206 0.00031 0.00004 345 52 7 139 116 0.7 0.6 84 70 0.4 0.4 Public Order and Safety 40,026 40,026 0.00207 0.00029 0.00056 83 12 23 38 31 0.2 0.2 23 19 0.1 0.1 Religious Worship 21,107 21,107 0.00109 0.00009 0.00003 23 2 1 9 8 0.0 0.0 6 5 0.0 0.0 Service 15,812 15,812 0.00149 0.00012 0.00004 24 2 1 10 8 0.0 0.0 6 5 0.0 0.0 Warehouse and Storage 235,626 235,626 0.00080 0.00004 0.00002 189 10 6 77 64 0.4 0.3 46 38 0.2 0.2 Other 6,647 6,647 0.00330 0.00034 0.00008 22 2 1 9 7 0.0 0.0 5 4 0.0 0.0 Vacant 305,595 305,595 0.00060 0.00002 0.00000 183 6 1 73 61 0.4 0.3 44 37 0.2 0.2
Total Waldorf Building 2,568,127 50,263,700 52,831,827 87,384 50,965 57,243 Total Heating Load (includes space heating peak load + 50% of DHW peak load, 50% free bi-product from geo system) 116,005 tons 46,402 38,668 240 200 27,841 23,201 144 120 Total Cooling Load (no additional capacity required) 50,965 tons
Building Occupied Space Energy Peak Loads Geothermal Heating and Cooling Loads Borefield Area Required (600 ft. depth) Borefield Area Required (1000 ft. depth)Homefield GFA GFA Total Spc Heating Cooling DHW Spc Heating Cooling DHW Bore Holes (A) Bore Holes (B) Borefield (A) Borefield (B) Bore Holes (A) Bore Holes (B) Borefield (A) Borefield (B)
+30% EE +30% EE +30% EE number number acres acres number number acres acresnumber unit size commercial residential Peak Peak Peak 600' deep 600' deep 15' centres 15' centres 1000' deep 1000' deep 15' centres 15' centres
units sq.ft. sq.ft. sq.ft. sq.ft. Res t/unit Res t/unit Res t/unit tonnes tonnes tonnes T/BH T/BH ft2 ft2 T/BH T/BH ft2 ft2
Comm t/sf Comm t/sf Comm t/sf 2.5 3 225 225 4.2 5.0 225 225
Res Single-family Detached 201 2500 502,500 502,500 2.9 1.8 2.0 586 352 395 314 261 1.6 1.3 188 157 1.0 0.8 Single-family Attached 232 2000 464,000 464,000 2.3 1.4 1.6 541 325 365 290 241 1.5 1.2 174 145 0.9 0.7 Apartments in 2-4 Unit Buildings - - - - - - - - - - - - Apartments in 5 or More Unit Buildings 192 1200 230,400 230,400 1.4 0.8 0.9 269 161 181 144 120 0.7 0.6 86 72 0.4 0.4
Comm Community Center (Public Assembly) 3,000 3,000 0.00206 0.00031 0.00004 6.2 0.9 0.1 3 2 0.0 0.0 2 1 0.0 0.0
Total Homefield Building 3,000 1,196,900 1,199,900 1,403 839 941 Total Heating Load (includes space heating peak load + 50% of DHW peak load, 50% free bi-product from geo system) 1,873 tons 749 624 3.9 3.2 450 375 2.3 1.9 Total Cooling Load (no additional capacity required) 839 tons
Figure 17: Geothermal Energy Load Capacity analysis for Charles County MD, Waldorf and Homefield

THERMAL LOAD AND GEOTHERMAL RESOURCE ANALYSIS
October 2011 Report No. 10-1151-0408 - 2 47
7.0 ENERGY OVERVIEW 2011 WITH PROJECTIONS TO 2035 In this section we consider the outlook for energy supply and demand in the US over the next 25 years. This brief overview, allows us to establish reasonable estimations for future energy prices. This is particularly important when considering alternative energy sources.
Energy considered from a national point of view, forms the foundation for energy to be considered from a state specific point of view.
Natural gas is often the business as usual (BAU) source of thermal energy for heating and electricity for cooling. In some areas including Maryland, electricity is often the BAU energy for heating as well. Electricity is used to drive the water circulation pumps, heap pump compressors and air circulation fans, all HVAC components of a geothermal system. So while natural gas and electricity used in conventional cooling systems are eliminated by geothermal energy systems, electricity in smaller measure is required for different, but essential, operations.
The following sections, establish baseline energy price estimations, with future projections to 2035, for natural gas and electricity, in the US and in Maryland specifically. These estimates will be applied during the third phase of the Geothermal Community Energy Study for Charles County MD.
7.1 US Energy Use and Projected Growth According to the 2011 Annual Energy Outlook, issued by the U.S. Energy Information Administration (EIA) in April 2011, growth in energy use is linked to population growth through increases in housing, commercial floorspace, transportation, goods and services, as well as rising disposable income. It has been projected that total primary energy consumption, including fuels used for electricity generation, grows by 0.7 percent per year from 2009 to 2035, to 114.2 quadrillion BTU in 2035 in the AEO2011 Reference24 Figure 18 case ( ). Electricity use increases 1.4 percent per year, from 53 percent of total commercial delivered energy consumption in 2009 to 58 percent in 2035, in the AEO2011 Reference case. However, while growth in commercial floorspace (1.2 percent per year) is faster than growth in population (0.9 percent per year), energy use per capita remains relatively steady. It has been estimated that after 2013, due to significant improvements in efficiency standards in equipment and building shells, the energy end use per capita would start declining by 0.3% per year on average.
24 The Reference case assumes a continuation of current trends in terms of economic access to resources outside the Organization of the Petroleum Exporting Countries (OPEC), the OPEC market share of world production, and global economic growth.
Figure 18: Primary energy use by end use sector, 2009 - 2035 (quadrillion BTU).
Source: US EIA. 2011 Annual Energy Outlook.

THERMAL LOAD AND GEOTHERMAL RESOURCE ANALYSIS
October 2011 Report No. 10-1151-0408 - 2 48
Based on the EIA’s projections, after industrial sector the second-largest increase in total primary energy consumption from 2009 to 2035 (5.8 quadrillion BTU) is in the commercial sector. Even as standards for building shells and energy efficiency are being tightened in the commercial sector, the growth rate for commercial energy use, at 1.1 percent per year, is the fastest rate among the end-use sectors.
In residential sector, according to the 2011 Annual Energy Outlook, electricity use grows 0.7 percent per year, from 42 percent of total residential delivered energy consumption in 2009 to 47 percent in 2035 in the AEO2011 Reference case. Growing service demand is only partially offset by technological improvements that lead to increased efficiency of electric devices and appliances.
Source: US 2011 Annual Energy Outlook
Figure 19: Average Annual Growth Rates for selected electricity end uses in the commercial sector, 2009-2035 (percent per year)
Figure 20: Change in residential electricity consumption for selected end uses in the Reference case, 2009 - 2035 (billion kWh).

THERMAL LOAD AND GEOTHERMAL RESOURCE ANALYSIS
October 2011 Report No. 10-1151-0408 - 2 49
Figure 21: Projected Estimates for Commercial Floorspace and Energy Consumption Annual Growth in US, 2008-2035.
Source: U.S. Energy Information Administration | Annual Energy Outlook 2011. Table A5.
Figure 22: Projected Estimates for Residential Households and Energy Consumption Annual Growth in US, 2008-2035.
Source: U.S. Energy Information Administration | Annual Energy Outlook 2011. Table A4.
0
5
10
15
20
25
30
0
20
40
60
80
100
120
2008 2009 2015 2020 2025 2030 2035
Tota
l Ene
rgy
Cons
umpt
ion
Tota
l Flo
orsp
ace
Projected Estimates for Commercial Floorspace and Energy Consumption Annual Growth, 2008 - 2035
Total Floorspace (billion ft2) Total Energy Consumption (quadrillion BTU per year)
19
19.5
20
20.5
21
21.5
22
22.5
23
0
20
40
60
80
100
120
140
160
2008 2009 2015 2020 2025 2030 2035
Tota
l Ene
rgy
Cons
umpt
ion
Tota
l Flo
orsp
ace
Projected Estimates for Residential Households and Energy Consumption Annual Growth, 2008 - 2035
Total Number of Households (million)
Total Energy Consumption (quadrillion BTU per year)

THERMAL LOAD AND GEOTHERMAL RESOURCE ANALYSIS
October 2011 Report No. 10-1151-0408 - 2 50
7.2 US Energy Prices Projected to 2035 US Electricity Price Growth Based on the 2011 Annual Energy Outlook, the average annual electricity prices (2009 dollars) fell 6 percent from 2009 to 2011. Through 2021 prices remail low in response to lower coal and natural gas prices, and the phase-out of competitive transition and system upgrade charges included in transmission and distribution costs. After 2021, rising fuel costs more than offset the lower transmission and distribution costs. Economic growth leads to more demand for electricity and the fuels used for generation, raising the prices of both. Overall US average elecricity prices rise from 2010 to 2035 at a rate of 2% per year.
Figure 23: Nominal Average Electricity Price Projections for US, 2008-2035. Source: US Energy Information Administration. September 2011.
US Natural Gas Price Growth Unlike crude oil prices, natural gas prices do not return to the higher levels recorded before the 2007-2009 recession. To satisfy consumption levels in the Reference case, the number of lower 48 natural gas wells completed increases by 2.3 percent per year from 2009 to 2035. As a result, the average wellhead price for natural gas increases by an average of 2.1 percent per year, to $6.26 per million Btu in 2035 (2009 dollars). Henry Hub prices increase by 2.3 percent per year, to $7.07 per million Btu in 2035. Nonetheless, the Henry Hub price and average wellhead prices do not pass $5.00 per million Btu until 2020 and 2024, respectively.

THERMAL LOAD AND GEOTHERMAL RESOURCE ANALYSIS
October 2011 Report No. 10-1151-0408 - 2 51
Figure 24: Nominal Average Natural Gas Prices Projections for US, 2008-2035. Source: US Energy Information Administration. September 2011.
Figure 25: US Energy Price Projections By Sector and Source, 2008 –2035. Source: U.S. Energy Information Administration | Annual Energy Outlook 2011. Table 3A.
0.00
10.00
20.00
30.00
40.00
50.00
60.00
2008 2009 2015 2020 2025 2030 2035
US Energy Price Projections By Sector and Source 2008 - 2035
(Nominal dollars per million BTU) Residential Natural Gas Residential Electricity Commercial Natural Gas Commercial Electricity Industrial Natural Gas Industrial Electricity

THERMAL LOAD AND GEOTHERMAL RESOURCE ANALYSIS
October 2011 Report No. 10-1151-0408 - 2 52
7.3 Maryland Energy Prices Projected to 2035 EIA projects regional electricity and natural gas prices through 2035. The current 25-year forecast predicts that the cost of conventional electricity will be relatively flat over the next 25 years (-0.1% annual growth rate). Predictions of natural gas prices indicate a minor increase over the next 25 years, with the average annual growth of 0.4%. This estimate assumes increased use of renewable energy and moderate growth in consumption.
Figure 26: Annual Retail Price for Electricity in Residential Sector in South Atlantic region. Source: 2011 Annual Energy Outlook Supplemental tables.
Figure 27: Annual Retail Price of Electricity in Commercial Sector in South Atlantic region. Source: 2011 Annual Energy Outlook Supplemental tables.
0.00 5.00
10.00 15.00 20.00 25.00 30.00 35.00 40.00
2008
20
09
2010
20
11
2012
20
13
2014
20
15
2016
20
17
2018
20
19
2020
20
21
2022
20
23
2024
20
25
2026
20
27
2028
20
29
2030
20
31
2032
20
33
2034
20
35 20
09 d
olla
rs p
er m
illio
n Bt
u
Energy Prices in Residential Sector in South Atlantic Region, 2008 - 2035
Electricity Natural Gas
0.00
5.00
10.00
15.00
20.00
25.00
30.00
2008
20
09
2010
20
11
2012
20
13
2014
20
15
2016
20
17
2018
20
19
2020
20
21
2022
20
23
2024
20
25
2026
20
27
2028
20
29
2030
20
31
2032
20
33
2034
20
35 20
09 d
olla
rs p
er m
illio
n Bt
u
Energy Prices in Commercial Sector in South Atlantic Region, 2008 - 2035
Electricity Natural Gas

THERMAL LOAD AND GEOTHERMAL RESOURCE ANALYSIS
October 2011 Report No. 10-1151-0408 - 2 53
7.4 Geothermal Energy Use Projected to 2035 In accordance with the 2011 Annual Energy Outlook25
Figure 28
, the number of homes heated by ground-source heat pumps (GSHPs) increases by more than 19 percent per year from 2009 to 2016 in the Reference case, then slows to 3 percent per year after the Federal investment tax credit (ITC) expires. In 2035, GSHPs account for 2.3 percent of all heating systems installed in single-family homes ( ). In the Extended Policies case, however, sustained tax credits lead to a continued 8.8-percent average annual increase in total installations, from 389,000 units in 2009 to 3,504,000 units in 2035, when GSHPs make up 3.4 percent of all residential heating systems.
Figure 28: Residential market saturation by renewable technologies in two cases, 2009, 2020, and 2035 (percent share of single-family homes). Source: U.S. Energy Information Administration | Annual Energy Outlook 2011
25 U.S. Energy Information Administration | Annual Energy Outlook 2011

THERMAL LOAD AND GEOTHERMAL RESOURCE ANALYSIS
October 2011 Report No. 10-1151-0408 - 2 54
8.0 LIST OF REFERENCES 8.1 Geothermal Industry and Technology References: 1) Air-Conditioning and Refrigeration Institute (ARI), 4301 North Fairfax Drive, Suite 425, Arlington, VA,
22203, USA
4) ASHRAE HVAC Applications Handbook, American Society of Heating, Refrigeration, Air-conditioning Engineers, Inc. (ASHRAE), 1791Tullie Circle NE, Atlanta, GA, 30329, USA www.ashrae.org
5) (ASHRAE, 1997) Ground-Source Heat Pumps – Design of Geothermal Systems for Commercial and Institutional Buildings – Chapter 5. In ASHRAE Handbook-Fundamentals, Atlanta: American Society of Heating, Refrigerating and Air-Conditioning Engineers, Inc, 1997.
6) (ASHRAE, 2003), Geothermal Energy - Chapter 32. In 2003 ASHRAE HVAC Applications Handbook, SI Edition, American Society of Heating, Refrigerating and Air-Conditioning Engineers, Inc., 2003.
7) Blue Diamond Industries, LLC, Geothermal HDPE pipe manufacturer, 3399 Tates Creek Road #110 Lexington, KY 40502 Tel: (859) 224-0415
8) Canadian GeoExchange Coalition (CGC), 1030 Cherrier Street, Suite 501, Montreal, PQ H2L 1H9 phone: (514) 807-7559
http://www.bdiky.com/index.php
www.geo-exchange.ca
9) Canadian Standards Association (CSA), 178 Rexdale Blvd., Toronto, ON M9W 1R3 phone: (416) 747-4044
- Installers’ Course
www.csa.org
10) Central Geothermal Systems, Applications Engineering Manual, April 2010, Trane, SYS-APM009-EN
- CAN/CSA-C448-02
www.trane.com
11) Criteria and Initial Screening Maps for Identifying Potential Underground Thermal Energy Storage Sites in the Toronto Area, April 2010, Toronto Regional Conservation Authority, 5 Shoreham Drive, Downsview, ON M3N 1S4
12) Closed Loop Geothermal Heat Pump Systems, Design and Installation Standards, 2009, International Ground Source Heat Pump Association (IGSHPA), 374 Cordell South Stillwater, OK 74078, Phone: (405) 744-5175, Fax: (405) 744-5283,
13) Geothermal District Heating, 2009, John W. Lund and Paul J. Lienau, Geo-Heat Centre, Oregon Institute of Technology
www.igshpa.okstate.edu
14) GLD 2010, Gaia Geothermal LLC, software suite for designing geothermal heat pump and ground heat exchanger systems, http://www.gaiageo.com/?gclid=CJ-Z9orD7asCFY4UKgodEhaQKQ
15) International Organization for Standardization (ISO),Case Postale 56, CH-1121, Geneva 21, Switzerland
16) ISCO Industires LLC, Geothermal HDPE pipe manufacturer, P.O. Box 4545 Louisville, KY 40204 Tel: 800-345-ISCO (4726) In Maryland, contact David Klecan 443-721-7691 [email protected] or Justin Grabarczyk 302-250-7211 [email protected]

THERMAL LOAD AND GEOTHERMAL RESOURCE ANALYSIS
October 2011 Report No. 10-1151-0408 - 2 55
17) Optimization of Heat Exchangers for Geothermal District Heating, 2009, P. Bahadorani, G.F. Naterer, S.B. Nokleby, Faculty of Engineering and Applied Science, University of Ontario Institute of Technology, Oshawa, ON (No. 08-CSME-31, E.I.C. Accession 3069)
18) Survey of Geothermal Heat Pump Regulations in the United States, Karen Den Braven, University of Idaho, Mechanical Engineering Department, Moscow, ID 83844-0902
19) University of Ontario Institute of Technology, Borehole Thermal Storage System, http://www.engineering.uoit.ca/facilities/borehole
8.2 Geology and Hydrogeology References: 1) Andreasen, D.C., 1999, The geohydrology and water-supply potential of the lower Patapsco and Patuxent
aquifers in the Indian Head-Bryans Road area, Charles County, Maryland: Maryland Geological Survey Report of Investigations No. 69, 119 p.
2) Andreasen, David C., 2007, Optimization of ground-water withdrawals in Anne Arundel County, Maryland, from the Upper Patapsco, Lower Patapsco, and Patuxent Aquifers projected through 2044. Maryland Geologic Survey Report of Investigations No. 77, 107 p.
3) Drummond, David D., 2007, Water-supply potential of the coastal plain aquifers in Calvert, Charles, and St. Mary’s Counties, Maryland, with emphasis on the Upper Patapsco and Lower Patapsco Aquifers. Maryland Geologic Survey Report of Investigations No. 76, 235 p.
4) Fleck, William B. and Vroblesky, Don A., 1996, Simulation of ground-water flow of the coastal plain aquifers in parts of Maryland, Delaware, and the District of Columbia. U.S. Geological Survey Professional Paper 1404-J, 41 p.
5) Hiortdahl, S.N., 1997, Geologic framework, hydrogeology, and ground-water quality of the Potomac Group aquifer system, northwestern Charles County, Maryland: U.S. Geological Survey Water-Resources Investigations Report 91–4059, 111 p.
6) Mack, F.K. 1976. Preliminary Analysis of Geohydrologic data from test wells drilled near Chalk Point, Prince George's County, Maryland. Maryland Geological Survey and Maryland Power Plant Siting Program. Open File Report 76-322.
7) Mack, F.K. 1988. Selected Geohydrologic characteristics of the Patapsco Aquifers at Chalk Point, Prince George's County, Maryland. U.S. Geological Survey Open File Report No. 88-02-4.
8) Mack, F.K., Wheeler, J.C., and Curtin, S.E. 1983. Water level declines in the Magothy Aquifer in Southern Maryland Electric Cooperative's proposed combustion turbine generating facility of Chalk Point. Maryland Geologic Survey
9) McCartan, L., 1989, Geologic map of Charles County: Maryland Geological Survey, 1 sheet, scale 1:62,500.

THERMAL LOAD AND GEOTHERMAL RESOURCE ANALYSIS
October 2011 Report No. 10-1151-0408 - 2 56
10) Soeder, D.J., Raffensperger, J.P., and Nardi, M.R., 2007, Effects of withdrawals on ground-water levels in Southern Maryland and the adjacent Eastern Shore, 1980–2005: U.S. Geological Survey Scientific Investigations Report 2007–5249, 82 p.
11) Vroblesky, Don A and Fleck, William B., 1991, Hydrogeologic framework of the coastal plain in Maryland, Delaware, and the District of Columbia. U.S. Geological Survey Professional Paper 1404-E, 45 p.
12) Wilson, J.M., and Fleck, W.B., 1990, Geology and hydrogeologic assessment of Coastal Plain aquifers in the Waldorf area, Charles County, Maryland: Maryland Geological Survey Report of Investigations No. 53, 138 p.
8.3 Charles County Maryland References: 1) Charles County, MD Land Use Map, 1 page.
13) Charles County Building Code, Amendment Effective June 4, 2010, Bill 2010-08 http://www.charlescounty.org/webdocs/pgm/publications/permits/buildingcodeupdate2010-08.pdf
14) Charles County Comprehensive Plan, 2006, Charles County Government, Department of Planning and Growth Management http://www.charlescounty.org/pgm/planning/plans/commplanning/compplan/compplan.html
15) Charles County Surface Mines Map, Copyright © 2006 ADC The Map People and GIS Integrated Solutions, LLC. http://www.mde.state.md.us/programs/Land/mining/Mapping/Documents/www.mde.state.md.us/assets/document/mining/surfaceminelocations/Charles_co.pdf
16) Demographic Trends Newsletter, Volume XIV, No. 2 • August 2010, Charles County Department of Planning & Growth Management http://www.charlescounty.org/apps/workgroups/publicview/viewPDF.jsp?IDvalue=1726
17) Energy Action Plan for County Facilities 2010, Charles County Department of Public Facilities, http://www.charlescounty.org/green/plan.pdf
18) Energy Efficiency and Renewable Energy Tax Incentives, Federal and State Energy Tax Programs, Karl P. Fryzel and Jerome L. Garciano, July 2011 (http://thinkgeoenergy.com/wp-content/uploads/2011/09/EAPD_US_GeothermalTaxIncentives_July2011.pdf)
19) Generalized Geological Map of Maryland1967, Maryland Geological Survey, Baltimore Maryland, 21218 http://www.mgs.md.gov/esic/brochures/mdgeology.html
20) Going Green in Charles County, http://www.charlescounty.org/green/
21) Homefield Development Plan, site drawing, 1 page.
22) Hydrogeologic Data From Six Test Wells in the Upper Patapsco and Lower Patapsco Aquifers in Southern Maryland 2008, Basic Data Report No. 22, Nadine Calis and David D. Drummond, Maryland Department of Natural Resources, Maryland Geological Survey, Resource Assessment Service, 2300 St. Paul Street,
THERMAL LOAD AND GEOTHERMAL RESOURCE ANALYSIS
October 2011 Report No. 10-1151-0408 - 2 57
Baltimore, Maryland 21218-5210, (410) 554-5500 http://www.mgs.md.gov/esic/publications/download/BDR22.pdf
23) Maryland Electricity Profile, Annual Energy Generator Report, Department of Energy, Energy Information Administration, 2008, Released March 2010, (DOE/EIA-0348(01)/2)
24) Maryland Geological Survey,
http://www.eia.gov/cneaf/electricity/st_profiles/maryland.html
http://www.mgs.md.gov/esic/brochures/mdgeology.html
25) National Climatic Data Centre, http://www7.ncdc.noaa.gov/CDO/cdodivisionalselect.cmd
26) St. Charles, Maryland, Southern Villages Master Plan, November 17, 2009, Parker Rodriguez Inc., master planner, 1 page
27) Single Family Guidelines Latest Revision, August 29, 2005 and Commercial and Industrial Guidelines adopted May 2005, Charles County Site And architectural Review Board, http://www.charlescounty.org/webdocs/pgm/publications/planning/sdarbguidelines.pdf
28) Southern Maryland Electric Cooperative, Inc. Retail Electric Service Tariff, Issued: January 28, 2011 Effective: February 9, 2011, P.S.C. Md. No. 3, https://www.smeco.coop/pdfs/tariff.pdf
29) Vision Plan - Department of Planning and Growth Management, Charles County, MD, adopted April 13, 2010 by County Commissioners’ Resolution No. 2010-09, including signed copy, 29 pages.
30) Vision Plan Design Guidelines - Department of Planning and Growth Management, Charles County, MD, adopted April 13, 2010 by County Commissioners’ Resolution No. 2010-09, 64 pages.
31) Waldorf Urban Design Study, PGM Seminar Series - April 29, 2010 WUDS seminar slide show.pptx, author Xpuser, 34 slides.
32) Waldorf Urban Design Study, Project Summary, April 2010, 4 pages.
33) Waldorf Urban Transportation Improvement Plan, Martin/Alexiou/Bryson, June 2010 DRAFT REPORT, 103 pages.
34) Waldorf Vision Plan 4-10.doc, author Clive Graham

THERMAL LOAD AND GEOTHERMAL RESOURCE ANALYSIS
October 2011 Report No. 10-1151-0408 - 2
Report Signature Page
GOLDER ASSOCIATES LTD.
Suzanne Wiltshire, MBA Brent Waters, C.P.G. Senior consultant, Geothermal Associate and Senior Consultant
SW/BW/sa
Golder, Golder Associates and the GA globe design are trademarks of Golder Associates Corporation.
n:\active\2010\1151\10-1151-0408 charles county - geothermal study - md\reports\final\report ii - building loads and geothermal resources analysis (v2)-oct26-11.docx

COMMUNITY GEOTHERMAL ENERGY STUDY
January 2012 Report No. 10-1151-0408
ATTACHMENT Report III - Applications

January 2012
APPLICATIONS OF GEOTHERMAL ENERGY
Application of Geothermal Energy to Buildings and Developments in Charles County Maryland
REPO
RT III
Report Number: 10-1151-0408 - 3
Distribution:
2 copies: Charles County Government 2 copies: Golder Associates Ltd., Mississauga
Submitted to: Charles County Government Department of Planning & Growth Management 200 Baltimore Street, P.O. Box 2160, La Plata, MD 20646

APPLICATIONS OF GEOTHERMAL ENERGY
January 2012 Report No. 10-1151-0408 - 3
Table of Contents
1.0 INTRODUCTION ............................................................................................................................................................... 1
1.1 Context ................................................................................................................................................................ 1
1.2 Objectives of this Report ...................................................................................................................................... 2
1.3 Scope of Work ..................................................................................................................................................... 2
2.0 ESTIMATING GEOTHERMAL SYSTEM COSTS AND SAVINGS ................................................................................... 3
2.1 Traditional Building HVAC Systems .................................................................................................................... 3
2.2 Geothermal HVAC Systems ................................................................................................................................ 4
2.3 Decision Factors – Traditional vs. Geothermal HVAC Systems .......................................................................... 5
2.4 Economic Logic and Assumptions ....................................................................................................................... 8
2.4.1 Measurement of Energy Input and Output ..................................................................................................... 9
2.4.2 Measurement of Natural Gas Volume ............................................................................................................ 9
2.4.3 Measurement of Building Energy Use Intensity ............................................................................................. 9
2.4.4 Building Code Standards ............................................................................................................................. 10
2.4.5 Energy Intensity Applied to Building Energy System Estimates ................................................................... 11
2.4.6 Real Cost of Energy Relative to Equipment Efficiency ................................................................................. 13
2.4.7 Estimation of Operating Costs associated with HVAC Operations ............................................................... 13
2.5 Economic Model – Geothermal Systems ........................................................................................................... 14
3.0 RETSCREEN® CLEAN ENERGY ANALYSIS SOFTWARE .......................................................................................... 15
4.0 ELECTRICITY DISTRIBUTION SERVICE IN CHARLES COUNTY ............................................................................... 17
4.1 Electricity Rates in Charles County, MD ............................................................................................................ 17
4.2 SMECO New Building has Geothermal ............................................................................................................. 18
4.3 Local Green House Gas Emissions from Electricity Generation ........................................................................ 19
5.0 GEOTHERMAL SYSTEMS FOR INDIVIDUAL BUILDING TYPES ................................................................................ 19
5.1 Residential Buildings ......................................................................................................................................... 21
5.1.1 Single Family Homes ................................................................................................................................... 21
5.1.2 Attached Townhouses ................................................................................................................................. 23
5.1.3 Multi-Residential Buildings ........................................................................................................................... 24
5.1.4 Observations and Conclusions for Residential Buildings ............................................................................. 24

APPLICATIONS OF GEOTHERMAL ENERGY
January 2012 Report No. 10-1151-0408 - 3
5.2 Industrial, Commercial and Institutional Buildings ............................................................................................. 25
5.2.1 Industrial Buildings ....................................................................................................................................... 26
5.2.2 Commercial Buildings .................................................................................................................................. 26
5.2.2.1 Homefield Community Center ................................................................................................................... 26
5.2.2.2 Springdale Professional Center ................................................................................................................ 27
5.2.3 Institutional Buildings ................................................................................................................................... 29
5.2.4 Observations and Conclusions for Industrial, Commercial and Institutional Buildings ................................. 29
6.0 GEOTHERMAL DISTRICT ENERGY SYSTEMS ........................................................................................................... 31
6.1 District Energy Systems in General ................................................................................................................... 31
6.2 Geothermal District Energy Systems ................................................................................................................. 33
6.2.1 Distributed Geothermal System Configuration ............................................................................................. 33
6.2.2 Central Geothermal System Configuration................................................................................................... 34
6.2.2.1 Central Geothermal District Energy – Ball State University ...................................................................... 36
6.2.2.2 Central Geothermal District Energy - Enwave Energy Corporation .......................................................... 40
7.0 GEOTHERMAL DISTRICT ENERGY SYSTEMS FOR CHARLES COUNTY, MD......................................................... 41
7.1 Waldorf Geothermal District Energy System ..................................................................................................... 41
7.1.1 Observations and Conclusions for Waldorf Geothermal District Energy System ......................................... 43
7.2 Homefield Geothermal District Energy System .................................................................................................. 45
7.2.1 Observations and Conclusions for Homefield Geothermal District Energy System ..................................... 48
8.0 GEOTHERMAL CONTRIBUTION TO EMISSIONS REDUCTION ................................................................................. 49
9.0 LIST OF REFERENCES ................................................................................................................................................. 51
9.1 Geothermal Industry and Technology References: ........................................................................................... 51
9.2 Geology and Hydrogeology References: ........................................................................................................... 52
9.3 Charles County Maryland References: .............................................................................................................. 53
TABLES Table 1: Decision Factors for the Three Components of an HVAC System – Traditional Electric or Natural Gas
System vs. Geothermal System ................................................................................................................................ 6
Table 2: RETScreen Geothermal System Scenarios Developed ............................................................................................. 16
Table 3: Estimated Land Area and Cost of Geothermal Ground Heat Exchange Systems, Charles County, MD .................... 19
Table 4: Geothermal System Cost Factors, New Construction vs. Retrofit .............................................................................. 20
Table 5: Vertical Geothermal System - Single Family House, 2500 sq. ft. area ....................................................................... 22

APPLICATIONS OF GEOTHERMAL ENERGY
January 2012 Report No. 10-1151-0408 - 3
Table 6: Horizontal Geothermal System - Single Family House, 2500 sq. ft. area ................................................................... 22
Table 7: Vertical Geothermal System - Attached Townhouse, 1700 sq. ft. area ...................................................................... 23
Table 8: Horizontal Geothermal System - Attached Townhouse, 1700 sq. ft. area .................................................................. 23
Table 9: Vertical Geothermal System - Multi-residential Building, 60,000 sq. ft. area, 54 suites .............................................. 24
Table 10: Vertical Geothermal System - Homefield Community Center, 3,000 sq. ft. area ...................................................... 26
Table 11: Horizontal Geothermal System - Homefield Community Center, 3,000 sq. ft. area .................................................. 27
Table 12: Homefield Subdivision Buildings Planned ................................................................................................................ 45
Table 13: Homefield Phase I - Central Geothermal District Energy System ............................................................................ 47
Table 14: Homefield Phase II - Central Geothermal District Energy System ........................................................................... 47
Table 15: Expected Annual Emission Reductions Created by Substituting Geothermal Energy – Individual Building Types (lbs.) ................................................................................................................................................ 49
Table 16: Expected Annual Emission Reductions Created by Substituting Geothermal Energy – Homefield Subdivision (tons) .................................................................................................................................................... 50
FIGURES Figure 1: Three Components of a Building HVAC System ......................................................................................................... 3
Figure 2: Components of a Traditional Commercial Building Natural Gas HVAC System ......................................................... 4
Figure 3: Components of a Commercial Building Geothermal HVAC System ........................................................................... 5
Figure 4: Estimated Percent Energy Savings with Standard 90.1-2010 vs. Standard 90.1-2007, by building type ......................................................................................................................................................................... 11
Figure 5: Energy Profile of a Reference Building vs. a Proposed Energy Efficiency Improved Building .................................. 12
Figure 6: Energy Profiles of Typical Commercial Office Buildings............................................................................................ 12
Figure 7: Energy Efficiency and Annual Operating Cost Comparison for Air Conditioning Equipment including Heat Pumps in Cooling Mode .................................................................................................................................. 13
Figure 8: Business-as-Usual Reference Office Buildings, Energy Profiles and Operating Costs ............................................. 14
Figure 9: Model of Estimated Performance and Costs - Geothermal In-Ground Vertical Closed Loop Installation ............................................................................................................................................................... 15
Figure 10: Southern Maryland Electricity Cooperative (SMECO) Electricity Rates .................................................................. 17
Figure 11: SMECO New Building, Hughesville, Charles County MD, has Geothermal Energy ................................................ 18
Figure 12: Springdale - Geothermal Loop Installation in the Walls of the Underground Parking Garage. ................................ 28
Figure 13: Springdale Professional Center, Geothermal Installation on the P1 Slab. .............................................................. 28
Figure 14: US District Energy Systems, 2009 .......................................................................................................................... 32
Figure 15: US District Energy Systems by Market, 2009 ......................................................................................................... 32
Figure 16: Distributed Geothermal System - Residential Subdivision ...................................................................................... 34
Figure 17: Centralized Geothermal System - Residential Subdivision ..................................................................................... 35
Figure 18: RETScreen Community System Building Cluster Layout ........................................................................................ 36

APPLICATIONS OF GEOTHERMAL ENERGY
January 2012 Report No. 10-1151-0408 - 3
Figure 19: Ball State University Geothermal System - North Borefield Installation .................................................................. 37
Figure 20: Ball State University Geothermal System Model ..................................................................................................... 38
Figure 21: Ball State University Geothermal System Map with Photo of North District Energy Station Equipment ............................................................................................................................................................... 39
Figure 22: Enwave Deep Lake Water Cooling System Plate Heat Exchanger, Distribution Pipe Tunnel and Tunnel Borer being lowered into the ground ........................................................................................................... 40
Figure 23: Waldorf Urban Redevelopment Area ...................................................................................................................... 41
Figure 24: Waldorf Geothermal District Energy System Design Concept ................................................................................ 42
Figure 25: Homefield Geothermal District Energy System Design Concept ............................................................................. 46
APPENDICES APPENDIX A RETScreen Analysis Software Models
APPENDIX B Institutional Building Geothermal Case Studies
APPENDIX C Geothermal District Energy System Case Study - Ball State University
APPENDIX D Community Horizontal Geothermal District Energy Case Study
APPENDIX E Energy Efficiency and Renewable Energy Tax Incentives Federal and State Energy Tax Programs

APPLICATIONS OF GEOTHERMAL ENERGY
January 2012 Report No. 10-1151-0408 - 3
EXECUTIVE SUMMARY
To date two reports have been presented to the government of Charles County, Maryland: “Review of Geothermal Systems for Charles County Maryland” (April 2011) and “Analysis of Building Thermal Loads and Geothermal Resources for Charles County, Maryland” (November 2011). This third and final report “Applications of Geothermal Energy to Buildings and Developments in Charles County, Maryland” (January 2012) applies the information gathered in the first two reports to develop concepts and scenarios of community geothermal energy systems for Charles County to consider implementing in the types of buildings typical to the area. The report also develops high level design concepts for installation of Geothermal District Energy Systems in Waldorf Urban Area and in Homefield planned subdivision.
This report contains a section on estimating geothermal system costs and savings and starts to build a framework for assessing building suitability and compatibility for conversion to geothermal energy or for original design as a geothermal building. The report explains the significance of adopting the principal of integrated design and the importance of design team collaboration in order to fully capture opportunities for increased energy efficiency and optimize geothermal system and overall building performance. The economics of a geothermal system are discussed and a working model is developed for use in assessing the energy and cost savings of a geothermal project. A CD containing the Excel file for this model is included with this report.
RETScreen Clean Energy Analysis software is used to develop seven (7) scenarios for installation of geothermal systems. Individual buildings are considered and modeled for both vertical and horizontal closed-loop geothermal systems, and under financial conditions of no debt and moderate debt leverage. Analysis for Homefield Geothermal District Energy System Phase I and Phase II is also presented. The business cases are presented in this report. Printouts of the RETScreen analysis reports for all scenarios are included in Appendix I and live RETScreen files are included on the CD included with this report.
Several case studies are included both in the body of the report and in the Appendix to illustrate examples of various applications of geothermal energy.
Finally, observations and conclusions are presented for each of the segments of this report.

APPLICATIONS OF GEOTHERMAL ENERGY
January 2012 Report No. 10-1151-0408 - 3
REPORT LIMITATIONS
This report (the “Report”) was prepared for the exclusive use of Charles County Government, Maryland to support its internal discussions and evaluation of the potential feasibility of geothermal systems.
The Report is intended to provide applications of geothermal energy to buildings typical to Charles County, Maryland. The Report is based on publicly available information, on information provided by Charles County government, and on the experience of Golder, and must be considered in its entirety. It is also based on discussions with representatives of Charles County, as reported herein. No rock, soil, water, liquid, gas, product or chemical sampling and analytical testing were conducted as part of this Work.
In preparing the Report, Golder has relied in good faith on information provided by other individuals, companies or government agencies noted in the Report. Golder has assumed that the information provided is factual and accurate and Golder has not independently verified the accuracy or completeness of such information. Golder accepts no responsibility for any deficiency, misstatement or inaccuracy contained in this Report as a result of omissions, misinterpretations or fraudulent acts of others. Golder makes no other representations whatsoever, including those concerning the financial significance of its opinions, or as to legal matters touched on in this Report. With respect to our discussion of regulations and incentives, these are subject to periodic amendment and interpretation and these interpretations may change over time.
The scope of Golder’s review is described in this Report, and is subject to restrictions, assumptions and limitations. Except as noted herein, the work was conducted in accordance with the scope, terms and conditions of Golder’s Proposal P0-1151-0408 dated October 26, 2010, RFP No. 11-08 Community Geothermal Study as accepted by Contract signed by Mr. Brent Waters, Managing Associate, Golder Associates Inc. Richmond, Virginia and Ms. Candice Quinn Kelly, President for Charles County Commissioners, Charles County Maryland on January 21, 2011. Golder’s opinions are based upon information that existed at the time of the writing of the Report. It is understood that the services provided for in the scope of work allowed Golder to form no more than an opinion of the potential feasibility of geothermal energy systems. Any use which a third party makes of this Report, or any reliance on or decisions to be made based on it, are the sole responsibility of the third parties. Should additional parties require reliance on this Report, written authorization from Golder will be required. Golder disclaims responsibility of consequential financial effects on transactions or property values, or requirements for follow-up actions and costs.
Should you have any questions concerning this report, or the limitations set herein, please do not hesitate to contact our office.

APPLICATIONS OF GEOTHERMAL ENERGY
January 2012 Report No. 10-1151-0408 - 3 1
1.0 INTRODUCTION 1.1 Context Charles County, Maryland has a 2011 population of approximately 146,000 people and covers over 294,000 acres of land bordered by the Potomac River to the west, the Wicomico River and Saint Mary’s County Maryland to the southeast, and Prince George’s County Maryland to the north. According to Countywide population projections developed by the Maryland Department of Planning (MDP) in 2008, St. Charles County is expected to grow by an average of 1.7 percent per year, or 45 percent overall from 140,764 people in 2008 to a population of approximately 204,200 people by 20301. This represents an increase of approximately 64,436 people requiring an addition of approximately 24,173 residential dwellings. When this growth is added to the 2008 housing stock of 53,327 units, a projected total of 77,500 residential units will be needed by 2030.2
Golder has conducted a Charles County Community Geothermal Study (11-08) beginning in February 2011. A Preliminary Report “Review of Geothermal Systems for Charles County Maryland” (“Report I”) was prepared by Golder and submitted, in April 2011. That report provided a broad overview of geothermal technology and presented a review of fundamental geothermal system designs and configurations, discussed practical project implementation and provided an overview of government regulations and incentives.
In 2002, approximately 17% of the land area in the County was “developed”. Population growth projections and development scenarios, described in the Charles County Comprehensive Plan Water Resources Element dated July 2010 (Draft WRE), have been adopted for the purposes of this study in order to create consistency and form a basis for comparison.
A Second Report “Analysis of Building Thermal Loads and Geothermal Resources for Charles County Maryland” (“Report II”) was prepared by Golder and submitted in October 2011. The second report assessed Charles County, specifically evaluating first the current existing and planned building developments and building structure types to determine the need or demand for thermal energy, and second, evaluated the extent and nature and capacity of the geothermal resources available in Charles County. Specific sites of interest were selected and were evaluated in greater detail to highlight opportunities that could possibly deliver highly favorable technical and financial outcomes with the greatest amount of positive economic and environmental impact.
This Third Report applies information developed in Reports I & II to provide the business case for geothermal energy for scenarios including individual buildings, Waldorf Urban Redevelopment Area, and Homefield residential subdivision, including recommendations for each specific scenario. It includes a module on how to economically and financially assess geothermal projects (working Excel model). In summary, this report attempts to develop a high level strategy for geothermal project planning and implementation. It provides an overview of how Charles County Government can move forward to incentive geothermal energy, from strategy, policy and marketing standpoint. A Final Report will incorporate the three reports to form a Comprehensive Study Report.
1 Charles County Comprehensive Plan, Water Resource Element (Draft), July 2010, page 4 (Source: MDP, 2008 Estimates for Maryland’s Jurisdictions) 2 Charles County Comprehensive Plan, Water Resource Element (Draft), July 2010, page 5 (Source: Maryland Property View, 2008)

APPLICATIONS OF GEOTHERMAL ENERGY
January 2012 Report No. 10-1151-0408 - 3 2
1.2 Objectives of this Report The main objective of this report is to build the business case for geothermal energy in Charles County, Maryland. Specific building types will be addressed first, with technical, implementation, economic and policy recommendations. The planned new construction of Homefield subdivision is addressed with the development of concept plans for both distributed and central geothermal systems using internationally accepted energy simulation software. These concepts are then further developed into business cases with implementation, economic and policy recommendations. The redevelopment of the Waldorf Urban area is also addressed with the development of a concept plan for a central geothermal system, installed as a retrofit to existing buildings and extended to new construction planned within the area. Together these segments are summarized to provide Charles County with a working template that will assist the implementation of a county wide strategy for geothermal energy installation. Benefits to the County from geothermal energy implementation include: reduced energy cost, reduced dependence on coal fired electricity, increased energy security, cleaner air, reduced green house gas emissions, higher property values, more attractive (while controlled) development opportunities, new local sources of revenue, increased local skilled job opportunities, and national leadership in community sustainability development.
Report objectives are:
Prescribe geothermal system technologies for various building structure types, as applicable to Charles County
Develop and support implementation, economic and policy recommendations for each structure type
Develop geothermal system concept plans, distributed and central for Homefield subdivision
Develop business cases for each Homefield concept plan
Recommend implementation strategies, economic and ownership options, and incentive policies
Develop geothermal concept plan and central plant configuration for Waldorf Urban area
Discuss implementation for redevelopment and retrofit circumstances
Develop the business case for Waldorf Urban area concept plan
Summarize recommendations for a County-wide strategy for implementation of geothermal energy systems
Develop the supporting case for the benefits of geothermal energy implementation in Charles County
1.3 Scope of Work Golder has performed this study on a high level in order to provide a broad overview that can assist the government of Charles County with strategic planning of population growth and urban development as it relates to energy supply. Examples of building types were drawn from national and local information data bases and no site work was performed in the course of this study. Homefield subdivision and Waldorf Urban area were identified and used as examples of district energy system opportunities: Homefield as a

APPLICATIONS OF GEOTHERMAL ENERGY
January 2012 Report No. 10-1151-0408 - 3 3
new construction with low density residential use and Waldorf Urban area as a redevelopment with mid density commercial and residential mixed use.
None of the design concepts are intended to be used for detailed development planning. They are representative and should be used as strategic indicators to identify areas that are attractive to the government of Charles County; areas which can become the subjects of further investigation and more detailed study.
The geothermal technology applications that are considered in this report are limited to those that have been installed in North America and are applicable to residential, commercial and multi-residential building development, typically found in Charles County. This report does not provide an exhaustive survey of hybrid technology configurations that may be possible or innovations being developed.
2.0 ESTIMATING GEOTHERMAL SYSTEM COSTS AND SAVINGS In all building heating ventilation and air conditioning (HVAC) systems, there are always three components: one or more sources of energy, a central thermal energy processing plant, and in-building heating and cooling distribution equipment. This generalization is true for traditional systems which use electricity and/or natural gas and also for renewable energy systems, whether solar, geothermal or any other source of energy. The relative size of each of the three components can be very different for different types of systems, but the same three processes are required to heat and cool an interior space. While there are many variations of both old and new systems, in all cases, the three components must be compatible. This means that temperature ranges produced by the central processing plant must be suitable for the building heating and cooling equipment to operate effectively. It also means that parts and fittings are standard and that the three components are configured to be as efficient as possible. Energy efficiency has increased significantly over the past ten years, so that equipment older than ten years is costlier to operate than new equipment.
2.1 Traditional Building HVAC Systems Traditional building HVAC systems need to be considered for three reasons:
1. Provide a business-as-usual reference scenario 2. Existing traditional HVAC buildings are being considered for retrofit 3. Default scenario, if geothermal system is not available or feasible
Traditional building HVAC systems consist of two separate systems, one for heating and one for cooling. Each has separate energy sources, separate processing plants and separate distribution equipment,
Energy Source
Central Processing Plant
Building heating and cooling equipment
Figure 1: Three Components of a Building HVAC System

APPLICATIONS OF GEOTHERMAL ENERGY
January 2012 Report No. 10-1151-0408 - 3 4
except for ductwork which they use in common. Heating distribution equipment accepts only high-grade heat, about 160°F, which is typically produced by an electric or natural gas fed boiler. When mechanical engineers design these systems, since the heating and cooling are completely independent of each other, each is sized separately, with no correlation. In fact, many buildings have only heating and no cooling at all. The sizes of the processing plants are often much larger than the loads of the building require, because engineers want to be “on the safe side” and larger equipment cost very little more. With most of the life cycle cost of a traditional HVAC system spent on variable cost energy input, the added fixed cost of larger equipment makes little difference to the total lifecycle cost.
Figure 2: Components of a Traditional Commercial Building Natural Gas HVAC System
In a traditional building HVAC system, on a lifecycle analysis basis, the capital cost of the Energy Source is zero, the capital cost of the Central Processing Plant is perhaps 5%, the building HVAC equipment is perhaps 15% and the variable cost of fuel and maintenance is perhaps 80% of the total lifecycle costs.
2.2 Geothermal HVAC Systems Every geothermal system consists of the same three components called the ground loop heat exchanger or geothermal ground system (energy source), a central pumping plant usually housed in the basement of the building and the in-building heating and cooling distribution equipment, usually heat pumps that produce both heating and cooling on demand. Alternatively, the building heating and cooling distribution equipment can be fan coils that produce heat when the central plant is set to heating (winter) and cooling when the central plant is set to cooling (summer). In this case, individual suites have control of temperature within either the heating range or the cooling range, but not both at the same time. In all cases, the heat distribution equipment accepts only low-grade heat, usually about 120°F.
NG Boiler
Heat Distribution Equipment
(high-grade temp)
0.6 kWh out
Cooling Distribution Equipment
0.8 kWh out
Electric Chiller
Electricity 1 kWh In
Natural Gas
1 kWh In

APPLICATIONS OF GEOTHERMAL ENERGY
January 2012 Report No. 10-1151-0408 - 3 5
If a geothermal system is designed and constructed from scratch, then all three components are integrated and should be optimized to the right sizes, without excess in any part of the system. Heating and cooling loads of the building are balanced by adding or subtracting discretionary loads in the building’s mechanical system design. This balance of annual heating consumption with annual cooling consumption is important from two points of view, first to ensure the ground geothermal system charges and discharges completely so that heat is not either built up or depleted, year over year resulting in a gradual change the performance of the system over time and secondly, so that the total amount of energy produced by the geothermal system is used to economic benefit, and not wasted thereby offsetting the cost of the system sooner.
With the fixed cost of a geothermal system being the largest portion of the lifecycle cost, it is very important to not oversize the system. It therefore follows that building envelope improvements to increase energy efficiency should be measured against the cost of an increased size geothermal system. Buildings built to the current U.S. national building code standard (refer to Section 2.4.4, Building Code Standards) usually require geothermal systems of a size that will payback in energy savings within 7 to 9 years. Older buildings that may or may not even meet the 1989 national building code standard are likely to require much larger geothermal systems and will have paybacks that are much longer, perhaps 10 to 15 years.
In a geothermal system building, on a lifecycle analysis basis, the capital cost of the energy source or in this case ground infrastructure, is perhaps 45%, the capital cost of the central processing plant is perhaps 5%, the building HVAC equipment is perhaps 18%, and the variable cost of fuel and maintenance is perhaps 32% of the total lifecycle costs. Over 20 years, the total lifecycle cost of a geothermal system could be approximately 15% to 20% less than a traditional HVAC system. Over longer terms, such as 30 years, the total lifecycle cost of a geothermal system will be approximately 35% less than a traditional system and continue to save more every year thereafter, as the geothermal ground infrastructure is expected to have a useful life equal to that of the building.
2.3 Decision Factors – Traditional vs. Geothermal HVAC Systems In order to estimate the cost of any HVAC system, each of the three components of the system must be considered separately because the costs of each component are determined by different factors. The
Ground
Loop Heat Exchanger
Central Pumping
Plant
Building HVAC
System
(low-grade temp heat
and cooling)
5 kWh out
Electricity 1 kWh In
Figure 3: Components of a Commercial Building Geothermal HVAC System

APPLICATIONS OF GEOTHERMAL ENERGY
January 2012 Report No. 10-1151-0408 - 3 6
table below identifies some of the most critical considerations, whether considering a new construction project or the retrofit of an existing facility. The shaded areas are factors that must exist for geothermal to be considered.
Table 1: Decision Factors for the Three Components of an HVAC System – Traditional Electric or Natural Gas System vs. Geothermal System
Traditional HVAC System Geothermal System
Energy Source No land required – electricity or natural gas delivered to building.
Land required to construct ground loop heat exchanger ~ 90 sq. ft. / ton, vertical (600’) ~1000 sq. ft. / ton, horizontal
No capital cost > no cash required, cost of capital is not a factor
High capital cost for ground loop heat exchanger > cash availability & cost of capital are important, system useful life = building useful life, government incentives and preferential tax treatments may be significant,
High volumes of fossil fuels and electricity > variable price, variable volume, dependant on weather
Low volume of electricity > variable price, constant volume, not dependant on weather
High peak loads can add demand charges and high cost
No peak loads, lower demand charges and lower cost
Price of propane, oil, natural gas can be volatile
No fossil fuel price volatility
All additional loads require additional fossil fuel / electricity consumption
Additional loads may be satisfied free i.e. excess heat can provide snow melt, heated parking, swimming pool heat, etc. Excess cooling can cool corridors, common areas, skating rinks
Domestic Hot Water produced separately, additional cost
25% to 50% of Domestic Hot Water is free, a by-product of cooling and super heating in normal cycle, full load can be satisfied with additional ground loop heat exchange
Central thermal energy processing plant
Produces high grade heat - 160°F Requires low-grade heat - 120°F
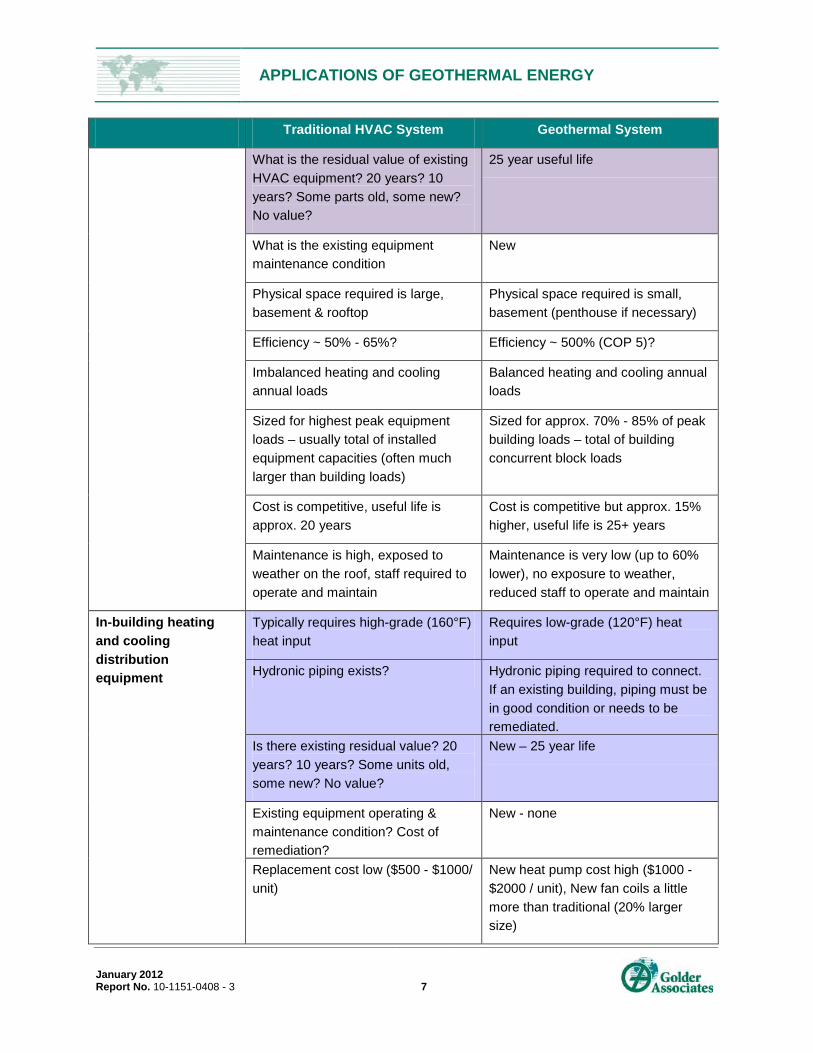
APPLICATIONS OF GEOTHERMAL ENERGY
January 2012 Report No. 10-1151-0408 - 3 7
Traditional HVAC System Geothermal System
What is the residual value of existing HVAC equipment? 20 years? 10 years? Some parts old, some new? No value?
25 year useful life
What is the existing equipment maintenance condition
New
Physical space required is large, basement & rooftop
Physical space required is small, basement (penthouse if necessary)
Efficiency ~ 50% - 65%? Efficiency ~ 500% (COP 5)?
Imbalanced heating and cooling annual loads
Balanced heating and cooling annual loads
Sized for highest peak equipment loads – usually total of installed equipment capacities (often much larger than building loads)
Sized for approx. 70% - 85% of peak building loads – total of building concurrent block loads
Cost is competitive, useful life is approx. 20 years
Cost is competitive but approx. 15% higher, useful life is 25+ years
Maintenance is high, exposed to weather on the roof, staff required to operate and maintain
Maintenance is very low (up to 60% lower), no exposure to weather, reduced staff to operate and maintain
In-building heating and cooling distribution equipment
Typically requires high-grade (160°F) heat input
Requires low-grade (120°F) heat input
Hydronic piping exists? Hydronic piping required to connect. If an existing building, piping must be in good condition or needs to be remediated.
Is there existing residual value? 20 years? 10 years? Some units old, some new? No value?
New – 25 year life
Existing equipment operating & maintenance condition? Cost of remediation?
New - none
Replacement cost low ($500 - $1000/ unit)
New heat pump cost high ($1000 - $2000 / unit), New fan coils a little more than traditional (20% larger size)

APPLICATIONS OF GEOTHERMAL ENERGY
January 2012 Report No. 10-1151-0408 - 3 8
Traditional HVAC System Geothermal System
Ongoing maintenance high Ongoing maintenance minimal, heat pumps require very little
Independent air conditioning system may or may not exist
Air conditioning is provided by same equipment as heating
Window air conditioners are noisy, inefficient, ineffective, create air leaks often in summer and winter if not removed and building penetration sealed and insulated
No window air conditioners allowed
Is the space occupied or vacant? Short term disruption to install
Can a geothermal system be retrofitted to a traditional HVAC system? In most cases it is very difficult. In the simplest of circumstances, where a traditional fossil fuel fed boiler is connected to in-suite fan coils, and it is switched from winter heating mode to summer cooling mode, then a ground loop heat exchanger can be connected to the boiler to provide it with 55°F water all year around, which relative to the outside air temperature, is warm in the winter and cool in the summer. This relative temperature can be increased to 85°F and decreased to 34°F seasonally by installing additional central processing equipment in the form of water-to-water heat pumps. But the fan coils throughout the building require 160°F in winter to effectively heat the building and so fossil fuel is still required to boost the highest efficient temperature of the water-to-water heat pumps, to the set design temperature of the building equipment. The cost of installing a ground loop heat exchanger and adding central water-to-water heat pumps is offset by the savings from only a portion of the total energy the building requires. The geothermal system is only as large as required by the load it is satisfying, so the cost is relative to its size.
In other buildings that have only electric heat, and no HVAC connected hydronic pipe system built into the building structure, retrofitting a geothermal system is usually not feasible. There are cases where piping has been installed on the exterior of the building or run through elevator shafts and through false ceilings, but generally the cost of installing such systems is prohibitive. There simply is no space available into which heat pumps or fan coils can be installed, not to mention the disruption to occupants during construction. If the building is being vacated and completely gutted, then geothermal systems do make sense, and are considered as though they were being installed into new construction.
2.4 Economic Logic and Assumptions The economics of evaluating a geothermal system are dependent on many complex variables that keep mechanical engineers well employed. The task involves translation of measurements into common denominators that can then be used mathematically to produce logical metrics for sizing systems and equipment and for decision making. This is where many hours of discussion often ensue, because there is no standard of logic, each consultant and each engineering design team may argue a different logic. To complicate the discussion further, widely varying assumptions are applied making comparison of one

APPLICATIONS OF GEOTHERMAL ENERGY
January 2012 Report No. 10-1151-0408 - 3 9
project analysis to another often meaningless. Below are some of the logic and assumptions that influence the economic analysis of the business case for (and against) geothermal systems.
2.4.1 Measurement of Energy Input and Output Electricity is expressed as a kilowatt hour (kWh).
In order to express the total energy input and output of an energy system, propane, oil and other fossil fuels are converted to watts and kilowatt hour equivalent, expressed as kWhe, using the following factors:
1 kWh = 3412.142 BTU (British Thermal Units)
3.412 kWh = 1 MBTU (thousand BTU, per hour is implied)
2.4.2 Measurement of Natural Gas Volume Natural gas (NG) is purchased in cubic feet which is a fixed volume metric. However the amount of energy measured in British Thermal Units (BTUs) contained in a cubic foot of natural gas changes with barometric pressure, as the gas expands and contracts. Natural gas is purchased at the well head in Gigajoules (GJs) and converted to cubic feet by applying the barometric pressure as a heat factor, literally every 15 minutes, causing the price of natural gas to be in constant flux (apart from price fluctuation from supply and demand) with significant changes between summer and winter.
NG 1000 ft3 = 1.055 GJs (at 59°F) = 1.000 MBTU
NG 1 kWhe = 3.412 MBTU x 1000 ft3/MBTU = 3412 ft3
Similarly, oil and propane are also sold by volume and must be converted to energy (BTUs).
2.4.3 Measurement of Building Energy Use Intensity Buildings, depending on materials used and the properties of energy efficient construction (or lack thereof), can require widely different volumes of energy to maintain a the same level of interior thermal comfort, arguably at approximately 72°F in the winter and 75°F in the summer. Building Codes and construction materials and techniques have drastically improved in the past twenty years. Therefore older buildings tend to have higher rates of energy use intensity (EUI) or energy use per floor area, expressed as kWh/ft2, if all electricity or kWhe/ft2, if other fossil fuels. Note that the term “equivalent” indicates that a mathematical conversion calculation has occurred, signaling users to investigate the assumptions and calculations applied.
EUI is a measured absolute value. It is the average amount of energy the building consumes per square foot of occupied space. It reflects all the energy attributes of a building collectively, the building envelope, its HVAC system, lighting, etc. Improvement or deterioration of any one building factor will affect the overall building energy use intensity measurement sometimes calculated by the sum of all energy consumed (all utility bills, natural gas and electricity, common and sub-metered).
EUI is very important when evaluating building energy systems and sources. If buildings are built to older standards, then they will require more energy and larger energy systems. If buildings are yet to be built to future standards, then less energy and smaller energy systems should be considered.
Building EUI is regulated by state Building Codes, which are enforced by local municipal building

APPLICATIONS OF GEOTHERMAL ENERGY
January 2012 Report No. 10-1151-0408 - 3 10
departments. Some states and some municipalities set local Building Code requirements to exceed the federal and state Building Code standard requirements.
2.4.4 Building Code Standards Since the late 1980’s, national Building Code Standards have increasingly required better building insulation and reduced energy consumption resulting in declining building EUI factors. In the US, building code standards for commercial buildings are recommended by the American National Standards Institute (ANSI) / American Society of Heating, Refrigerating and Air-Conditioning Engineers (ASHRAE) / Illuminating Engineering Society (IES) Standard 90.1. In its role established by the Energy Policy and Conservation Act (EPCA, 42 USC 6833), the Department of Energy (DOE) determines whether revisions to the ANSI/ASHRAE/IES Standard 90.1 would improve energy efficiency in commercial buildings.
The determination is based on analysis by the Building Energy Codes Program and is required by Section 304 of the Energy Policy and Conservation Act (EPCA, Public Law 94-163), as modified by the Energy Policy Act of 1992 (EPAct 1992). DOE has one year to publish the determination after the newest edition of the code is approved. Determination results are published in the Federal Register. If DOE finds that the newest version of Standard 90.1 is more energy efficient than the previous version, states are required by the Energy Policy Act to certify that their building energy codes meet the requirements of the new Standard within two years. (EPCA requirements for State building codes do not explicitly require adoption of Standard 90.1 or specific addenda, rather the overall updated building code efficiency must be equivalent to that of the latest edition of Standard 90.1 for which DOE issued a positive determination). State building codes will be required to be at least equivalent to the Standard 90.1-2010, beginning in October 2013.
On September 3, 2010, DOE issued a final positive determination of energy savings for Standard 90.1-2007, which concluded that Standard 90.1-2007 “would achieve greater energy efficiency in buildings subject to the code, than the 2004 edition (Standard 90.1-2004 or the 2004 edition)” (75 FR 54117). Consequently, DOE has determined that Standard 90.1-2007 represents the baseline to which Standard 90.1-2010 requirements are compared for the purpose of a determination of energy savings for Standard 90.1-2010. Citing research performed by the Pacific Northwest National Laboratory3, DOE has determined that buildings built to Standard 90.1-2010 will be on average, 18.2% more energy efficient than if built to Standard 90.1-2007. This is a construction volume weighted average of 16 building types in 15 climate zones. The following table4
3 ANSI/ASHRAE/IES Standard 90.1-2010 Final Determination Quantitative Analysis, Pacific Northwest National Laboratory for the U.S. Department of Energy, PNNL-20882, October 2011
illustrates the U.S. national estimated percent energy savings with 2010 standard edition, vs. the 2007 edition, by building type:
4 ANSI/ASHRAE/IES Standard 90.1-2010 Final Determination Quantitative Analysis, Pacific Northwest National Laboratory for the U.S. Department of Energy, PNNL-20882, October 2011, Section 11 Results, page 29, Table 7.

APPLICATIONS OF GEOTHERMAL ENERGY
January 2012 Report No. 10-1151-0408 - 3 11
Figure 4: Estimated Percent Energy Savings with Standard 90.1-2010 vs. Standard 90.1-2007, by building type
For residential buildings, the applicable standard, the International Energy Conservation Code® (IECC)5
The US Green Building Council uses this same reference for measuring the energy efficiency of buildings under consideration for LEED® certification. Energy building modeling software EE4 (US DOE) and the internationally recognized RETScreen, both use the Standard 90.1 and IECC as U.S. references for business-as-usual (BAU) cases. Therefore it is critical in comparing building energy efficiencies that the Reference Building be established decisively for meaningful results to be produced.
is analyzed by the DOE against the previous version. Results are published in the Federal Register. If the analysis shows that the revised code is more energy efficient than the earlier code, each state is required to certify that it has reviewed its residential building energy code regarding energy efficiency and made a decision as to whether it is appropriate for that state to revise its residential building code to meet or exceed the revised code.
2.4.5 Energy Intensity Applied to Building Energy System Estimates By looking at the amount of energy consumed for various purposes, we can estimate that energy consumed by heating and cooling in a high energy intensity building accounts for approximately 66% of the total energy consumed. Buildings with lower energy intensities are often improved by reducing energy consumption for lighting, somewhat increasing the overall percentage of the energy consumed for this purpose to approximately 68% mid energy intensity buildings and approximately 70% for low energy
5 Early residential energy code was referred to as the Model Energy Code (MEC)

APPLICATIONS OF GEOTHERMAL ENERGY
January 2012 Report No. 10-1151-0408 - 3 12
intensity buildings. The following graph illustrates this concept. It also demonstrates the concept of comparing a study or Proposed building to a Reference building (ASHRAE Standard 90.1), deemed to be the same size and use, with different energy consumption and efficiency characteristics.
Figure 5: Energy Profile of a Reference Building vs. a Proposed Energy Efficiency Improved Building
Studies of energy intensities of buildings in certain areas are sometimes done by municipal building departments or by engineering firms for clients. The intensities used below are by example only.
Figure 6: Energy Profiles of Typical Commercial Office Buildings
Small Building Description Reference or Existing Building Performance
Type Energy Intensity Structure Total Energy HVAC HVAC Energy
kWhe/sf sf kWhe % total energy kWhe
Old Bldg/no upgrades Highest 58.5 50,000 2,925,000 66% 1,930,500
20 yr Bldg / upgrades Mean 33.8 1,690,000 68% 1,149,200
New Bldg/full upgrades Lowest 21.4 1,070,000 70% 749,000
Large Building Description Reference or Existing Building Performance
Type Energy Intensity Structure Total Energy HVAC HVAC Energy
kWhe/sf sf kWhe % total energy kWhe
Old Bldg/no upgrades Highest 58.5 100,000 5,850,000 66% 3,861,000
20 yr Bldg / upgrades Mean 33.8 3,380,000 68% 2,298,400
New Bldg/full upgrades Lowest 21.4 2,140,000 70% 1,498,000

APPLICATIONS OF GEOTHERMAL ENERGY
January 2012 Report No. 10-1151-0408 - 3 13
2.4.6 Real Cost of Energy Relative to Equipment Efficiency Price of Energy Input Assumptions:
Electricity = $0.1434 /kWh (SMECO, 2011)
Natural Gas = $1.91 / 100 ft.3 = $0.0191 / ft.3
Large building central energy conversion plants, commonly natural gas boilers, differ widely in energy efficiency, meaning that the volume of natural gas required to deliver the same amount of energy to the building varies greatly. Therefore, at a price for natural gas of $0.0191/ft3, the cost to produce 1 kWhe of energy from a hypothetically 100% efficient natural gas boiler, is $0.065 however to produce 1 kWhe of energy from an inefficient natural gas boiler operating at 50%, the real cost is $0.1305.
Real cost of NG at $0.0191 / ft.3, at 80% efficiency = $0.0815 / kWhe
Real cost of NG at $0.0191 / ft.3, at 65% efficiency = $0.10 / kWhe
Real cost of NG at $0.0191 / ft.3, at 50% efficiency = $0.1305 / kWhe
Electricity is also used for both heating and cooling. Some electricity in an HVAC system is used purely to drive fans and pumps; however most of it is used for cooling. Chillers and air conditioning equipment including heat pumps improved in efficiency expressed as the SEER (Seasonal Energy Efficient Ratio) by law in 2006 from a minimum SEER 10 to SEER 13. High efficiency equipment, though more expensive, can be as high as SEER 26. However, a lot of old cooling equipment still exists in older buildings, with SEER as low as 6. Office buildings use a lot more cooling than residential buildings with high occupancy during the hottest part of the day creating additional heat and comfort for productivity requiring more cooling. Where time-of-use hydro rates apply, these occupancy characteristics make the cost of cooling in office buildings higher than for other types of buildings. In the past, cooling has sometimes been considered optional and was not installed in some buildings, so the ductwork required for cooling may not exist. Where it does exist, it is important to know the SEER of the existing equipment, to determine the potential savings of installing a geothermal system.
Figure 7: Energy Efficiency and Annual Operating Cost Comparison for Air Conditioning Equipment including Heat
Pumps in Cooling Mode
2.4.7 Estimation of Operating Costs associated with HVAC Operations Following is an estimation of HVAC system operating costs for BAU buildings either built or proposed, with electric cooling and natural gas heating. An Excel Workbook containing the model is provided on a CD, with this report, so that assumptions can be changed to produce various results.
Capacity tons BTU/ton BTU/hr SEER kWh $/kWh
Cost $/ton/hr
cooling hours
Annual cost
1 12000 12000 6 2.00 0.1434 0.287$ 2000 573.60$
1 12000 12000 10 1.20 0.1434 0.172$ 2000 344.16$
1 12000 12000 13 0.92 0.1434 0.132$ 2000 264.74$
1 12000 12000 20 0.60 0.1434 0.086$ 2000 172.08$

APPLICATIONS OF GEOTHERMAL ENERGY
January 2012 Report No. 10-1151-0408 - 3 14
Figure 8: Business-as-Usual Reference Office Buildings, Energy Profiles and Operating Costs
2.5 Economic Model – Geothermal Systems As discussed in Section 2.0 above, HVAC Systems consist of three components: the energy source, the central processing plant and the building heating and cooling equipment. To replace a traditional HVAC system with a Geothermal system, all three components must be considered and substitution made.
Using the Reference Building HVAC model developed above in Section 2.4, a geothermal ground infrastructure becomes the energy source. The capital investment in the ground source heat exchanger or in this case, the closed-loop vertical bore field, includes all engineering, drilling, installation, horizontal tie-ins to headers inside the building and basic water circulation pumps. It does not include the central processing plant (water pumps, mechanical heat exchangers or water to water heat pumps, electrical connections and controls, manifolds, etc.) and nor does it include any site remediation or re-landscaping. The ground infrastructure is always an incremental cost however other mechanical equipment is often offset by the need to purchase new mechanical equipment, regardless of the energy source. The cost of the ground infra-structure is relatively constant and competitive, while the cost of mechanical equipment can vary widely with energy efficiency and design configuration options available.
In new construction, or in cases where the HVAC equipment of an existing building are being totally replaced, this economic model can often be accepted, without additional costs to be figured in, as the cost of central processing plant equipment and in-building mechanical heating and cooling equipment are comparable (5% to 15% more or less), even though the equipment and installation specified is entirely different. It will always costs more to retrofit equipment into an existing building than to install it into new
Small Building Description Reference or Existing Building Performance Reference or Existing Building Cost for HVAC
Type Energy Intensity Structure Total Energy HVAC HVAC Energy EL (30%)* NG NG (70%) HVAC
kWhe/sf sf kWhe % total energy kWhe $/kWh efficiency $/kWhe** $ per year
Old Bldg/ no upgrades Highest 58.5 50,000 2,925,000 66% 1,930,500 0.143$ 50% 0.131$ 259,401$
20 yr Bldg / upgrades Mean 33.8 1,690,000 68% 1,149,200 0.143$ 65% 0.100$ 129,883$
New Bldg/ full upgrades Lowest 21.4 1,070,000 70% 749,000 0.143$ 80% 0.082$ 74,952$
*30% x kWhe (SEER 10)= 670 sf/t** NG price = $0.0191/ft3
Large Building Description Reference or Existing Building Performance Reference or Existing Building Cost for HVAC
Type Energy Intensity Structure Total Energy HVAC HVAC Energy EL (30%)* NG NG (70%) HVAC
kWhe/sf sf kWhe % total energy kWhe $/kWh efficiency $/kWhe** $ per year
Old Bldg/ no upgrades Highest 58.5 100,000 5,850,000 66% 3,861,000 0.143$ 50% 0.098$ 430,965$
20 yr Bldg / upgrades Mean 33.8 3,380,000 68% 2,298,400 0.143$ 65% 0.075$ 219,543$
New Bldg/ full upgrades Lowest 21.4 2,140,000 70% 1,498,000 0.143$ 80% 0.061$ 128,409$
*30% x kWhe (SEER 10)= 670 sf/t
** NG price = $0.0191/ft3

APPLICATIONS OF GEOTHERMAL ENERGY
January 2012 Report No. 10-1151-0408 - 3 15
construction, unless the building is being entirely gutted or rebuilt, in which case it can be considered new construction, and as discussed above, in many cases a geothermal system simply cannot be installed physically.
Following is a table of comparative costs for the energy source, or the ground infrastructure of a geothermal system designed to meet the load requirements of buildings illustrated in the BAU case above. An Excel Workbook file titled “Energy Savings from Geothermal (NG41)” containing this file has been provided on a CD accompanying this report.
Figure 9: Model of Estimated Performance and Costs - Geothermal In-Ground Vertical Closed Loop Installation
Please Refer to Figure 8: Business-as-Usual Reference Office Buildings, Energy Profiles and Operating Costs for the input data used for this model.
3.0 RETSCREEN® CLEAN ENERGY ANALYSIS SOFTWARE The RETScreen® Clean Energy Project Analysis Software6
RETScreen allows decision-makers and professionals to determine whether or not a proposed renewable energy, energy efficiency, or cogeneration project makes financial sense. If a project is viable—or if it is
is the world’s leading clean energy decision-making software. It is provided free-of-charge by the Government of Canada as part of Canada’s recognition of the need to take an integrated approach in addressing climate change and reducing pollution. RETScreen contains databases from around the world, creating a tool that can compare projects regardless of location.
6 RETScreen® International, www.retscreen.net
Small Building Description
Type Energy Intensity Structure EL (Geo) EL EL peak load t geo cost t total Cost payback
kWhe/sf sf COPs kWhe $/kWh $ per year kWhe % $ per year % sf/ton tons $/ton $ years
Old Bldg/ no upgrades Highest 58.5 50,000 4.5 429,000 0.143$ 61,519$ 1,501,500 78% 197,883$ 76% 400 125 5,600$ 700,000$ 3.5
20 yr Bldg / upgrades Mean 33.8 4.5 255,378 0.143$ 36,621$ 893,822 78% 93,261$ 72% 670 75 5,700$ 425,373$ 4.6
New Bldg/ full upgrades Lowest 21.4 4.5 166,444 0.143$ 23,868$ 582,556 78% 51,084$ 68% 1026 49 5,800$ 282,651$ 5.5
s ASHRAE requires HPs to have min. full capacity EER 13, heating COP 3.5. t example only, avg. Golder commercial projects, 2011Many VSD HPs today exceed this level, up to COP 4.5 mechanical equipment replacement is required, so not incremental
Large Building Description
Type Energy Intensity Structure EL (Geo) EL EL peak load t geo cost t total Cost payback
kWhe/sf sf COPs kWhe $/kWh $ per year kWhe % $ per year % sf/ton tons $/ton $ years
Old Bldg/ no upgrades Highest 58.5 100,000 5.0 772,200 0.143$ 110,733$ 3,088,800 80% 320,231$ 74% 400 250 5,400$ 1,350,000$ 4.2
20 yr Bldg / upgrades Mean 33.8 5.0 459,680 0.143$ 65,918$ 1,838,720 80% 153,625$ 70% 670 149 5,600$ 835,821$ 5.4
New Bldg/ full upgrades Lowest 21.4 5.0 299,600 0.143$ 42,963$ 1,198,400 80% 85,446$ 67% 1026 97 5,800$ 565,302$ 6.6
s ASHRAE requires HPs to have min. full capacity EER 13, heating COP 3.5. t example only, avg. Golder commercial projects, 2011Many VSD HPs today exceed this level, up to COP 4.5 mechanical equipment replacement is required, so not incremental
Geo-exchange Ground System
Proposed Geo-exchange Performance Savings Geo-exchange Ground System
Energy Cost
Energy Cost
Proposed Geo-exchange Performance Savings

APPLICATIONS OF GEOTHERMAL ENERGY
January 2012 Report No. 10-1151-0408 - 3 16
not—RETScreen will help the decision-maker understand this: quickly, unequivocally, and at relatively minimal cost.
RETScreen is:
Used by more than 315,000 people in 222 countries and territories
Available in 35+ languages covering more than 2/3rds of the world’s population
Part of the curriculum in more than 400 universities and colleges worldwide
RETScreen has been directly responsible for over $7 billion in user savings globally, a number expected to grow to well over $8 billion by 2013. By virtue of enabling clean energy, RETScreen indirectly contributes to a substantial reduction in greenhouse gas emissions—a reduction conservatively estimated at 20 million tonnes per annum by 2013. And by 2013, it is estimated that RETScreen will have helped spur the installation of at least 24 GW of installed clean energy capacity worldwide with a value of approximately $41 billion.
Golder employs personnel trained in the use of RETScreen, to develop energy project models and to interpret the information. For the Charles County MD study, RETScreen models were developed for the following scenarios:
Table 2: RETScreen Geothermal System Scenarios Developed
Central District Energy System Distributed System
Scenario 1 Single Family Home - Vertical
Scenario 1B Single Family Home - Horizontal
Scenario 2 Single Family Attached Townhouses - Vertical
Scenario 2B Single Family Attached Townhouses - Horizontal
Scenario 3 Multi-residential Building - Vertical
Scenario 4 Homefield – Community Center - Vertical
Scenario 4B Homefield Community Center - Horizontal
Scenario 5 Homefield – Single Family Homes and Attached Townhouses
Scenario 6 Homefield – Multi-residential Buildings
The results of these scenarios are presented in the following sections of this report, as they apply. Printouts of the RETScreen Scenarios are included in Appendix A. The live RETScreen active database file (*.ret) and Excel files (*.xlsm) for each Scenario are included on a CD accompanying this Report. The full RETScreen program, along with instructions and support tools, can be downloaded from the website, http://www.retscreen.net/ang/home.php.

APPLICATIONS OF GEOTHERMAL ENERGY
January 2012 Report No. 10-1151-0408 - 3 17
4.0 ELECTRICITY DISTRIBUTION SERVICE IN CHARLES COUNTY Southern Maryland Electricity Cooperative (SMECO)7
4.1 Electricity Rates in Charles County, MD
provides electricity to Charles County, MD. SMECO is a customer-owned electric cooperative providing electricity to over 150,000 services in southern Prince George’s County, and in Charles County, St. Mary’s County, and all but the northeast portion of Calvert County. SMECO headquarters are located at 15035 Burnt Store Road P.O. Box 1937, Hughesville, MD 20637-1937.
According to SMECO’s Retail Electric Service Tariff for the Supply and Use of Electric Distribution Service, effective November 1, 20118
SMECO
, the following rates apply:
Effective: January 5, 2011
Residential Rates Source: https://www.smeco.coop/pdfs/tariff.pdf
Blended Rate (weighted average by monthly consumption)
Standard Offer Service $0.0975 per kWh (Summer) $0.0911 per kWh (Winter)
$0.0933 per kWh
Power Cost Adjustment Adjustment for actual cost of power each month (unknown)
$0.00 per kWh
Distribution Charge All kilowatt-hours $ 0.03606 per kWh
Facilities Charge $ 8.60 per month (avg. 1000 kWh/m)
$0.0086 per kWh
Other Adjustments & Credits
All kilowatt-hours $0.0031 per kWh
Regulatory, State & Local Taxes
All kilowatt-hours $0.0022185 per kWh
Public Service Company Franchise Tax*
All kilowatt-hours 0.00062 cents per kWh
Maryland Public Service Commission – Environmental Surcharge
Not in effect yet $0.00 per kWh
Total Average Annual Rate $0.1434 per kWh
*The SMECO Retail Electric Service Tariff for Supply and Use of Electric Distribution Service, November 2011, page 62, states, “A charge each month of 0.062 cents per kWh shall be applied to all kWh sales”. However the sample customer bill provided on the SMECO website, applies the lower rate used here.
Figure 10: Southern Maryland Electricity Cooperative (SMECO) Electricity Rates
7 Southern Maryland Electricity Cooperative, www.smeco.coop 8Southern Maryland Electricity Cooperative, Retail Electric Service Tariff for the Supply and Use of Electric Distribution Service, November 1, 2011 P.S.C. Md. No.3, https://www.smeco.coop/pdfs/tariff.pdf

APPLICATIONS OF GEOTHERMAL ENERGY
January 2012 Report No. 10-1151-0408 - 3 18
While national energy data indicates an expected rise for electricity rates over the next 25 years of approximately 1.8% per year, Maryland State information is indicating an expected rise of only 0.4% per year for the same period of time. Please refer to Report II, Section 7.3 for energy rate projections for the South Atlantic Region of the US.
4.2 SMECO New Building has Geothermal As a point of interest, SMECO’s new 165,000 sq. ft. building located in Hughesville, Charles County, MD has a significant geothermal energy system installation. According to an article in the SMECO 2010 Annual Report9
, 285 vertical closed-loop boreholes, 300 ft. deep are planned, with a total installation of 171,000 feet of geothermal piping. Using the thermal conductivity of 0.98 BTUh/ft.°F, (Report II, Section 6.1.1) this indicates approximately 356 tons of energy, or an average of 463 sq. ft. of building space per ton of installed geothermal energy capacity.
Figure 11: SMECO New Building, Hughesville, Charles County MD, has Geothermal Energy
9 Southern Maryland Electricity Cooperative 2010 Annual Report, Volume 61, Issue 5, May 2011, “Construction of New Building Under Way”, page 7. https://www.smeco.coop/coopreview/201105/linked_images/May%202011%20coop%20review%20annual%20report_web.pdf

APPLICATIONS OF GEOTHERMAL ENERGY
January 2012 Report No. 10-1151-0408 - 3 19
4.3 Local Green House Gas Emissions from Electricity Generation SMECO reports10
The amount of air pollution associated with the generation of electricity production for this region, given in pounds emitted per megawatt hour of electricity generated, as follows: Nitrogen Oxides (NOX): 1.32, Sulfur Dioxide (SO2): 5.24, and Carbon Dioxide (CO2): 1,167.56 (0.58378 tCO2/MWh).
that the electricity generation mix for this region has values represented by 2010 averages: 49.8% coal, 35.0% nuclear, 11.41% natural gas, and 0.49% oil. Renewable energy: 0.28% methane gas, 0% geothermal, 0.97% hydroelectric, less than 0.01% solar, 0.57% solid waste, 1.28% wind, and 0.19% wood/other biomass.
Note: These emission values, specific to Charles county MD, have been used all in the RETScreen analysis models associated with this study, despite the definition of “United States of America, all fuel types” which cannot be changed, appearing beside the correct value in the model worksheets.
CO2 is a greenhouse gas, which may contribute to global climate change. SO2 and NOx released into the atmosphere react to form acid rain. NOx also react to form ground level ozone, an unhealthful component of smog.
5.0 GEOTHERMAL SYSTEMS FOR INDIVIDUAL BUILDING TYPES In Report II of this study, Building Loads and Geothermal Resources Analysis, we established the ground conditions, expected thermal conductivity and sizing parameters of closed-loop geothermal systems that might be installed in the area11
Generally, considering the climate of Charles County MD, a horizontal geothermal system would require approximately 1000 sq. ft. of land area to install enough piping in trenches dug to a depth of 4 ft. to 8 ft., to produce 1 ton of geothermal heating and cooling. Comparatively, a vertical geothermal system would require approximately 225 sq. ft. of land area to install one vertical geothermal loop to a depth of approximately 240 ft. to produce 1 ton of geothermal heating and cooling. The following table outlines some of the general parameters that can be applied for the purposed of estimating, on a high level, the land area and cost of installing geothermal ground heat exchange systems in Charles County, MD:
. Open-loop systems were discussed, but are not considered further in this report, due to the high probability that permit applications would not be successful under current State regulations governing ground water protection. All geothermal systems discussed in this section are to be considered closed-loop systems.
Table 3: Estimated Land Area and Cost of Geothermal Ground Heat Exchange Systems, Charles County, MD Surface Area Depth $/ton* Site Capacity
Vertical - 1 ton 225 sq. ft. 240 ft. $5500. 484 tons / acre
Horizontal - 1 ton 1000 sq. ft. 4 – 8 ft. $3960. 40 tons / acre
*Cost includes installation of ground heat exchange pipe system only, including horizontal connections to
10 SMECO website: https://www.smeco.coop/energy/environ.html 11 Report II, Building Loads and Geothermal Resources Analysis Section 6.0, page 40.

APPLICATIONS OF GEOTHERMAL ENERGY
January 2012 Report No. 10-1151-0408 - 3 20
headers inside a building. Costs do not include any mechanical equipment, such as circulation pumps or heat pumps, connecting hydronic pipes or ductwork.
Prices for installation of geothermal systems can vary widely from one area to another. Only trained (ASHRAE or IGSHPA certified) teams of dedicated geothermal system installers using geothermal drill rigs and installation equipment, should be used for geothermal system installations, particularly for commercial systems, sized for any building over 35,000 sq. ft. in floor area. In some areas, water well drillers have acquired geothermal loop installation equipment and expertise, though it should be noted that some water well drillers represent that they are capable geothermal loop installers, when in fact they lack experience and training. Bid prices should be considered only after firms have been pre-qualified for equipment, training and experience.
Economies of scale can be captured in larger commercial building installations. Depending on the size and complexity of the installation, the price per ton, for the ground heat exchange pipe system can be 5% to 15% less than the prices indicated in the table above.
Distributed geothermal systems can technically be installed almost anywhere. The question is usually not whether it can be done, but rather, at what cost. Costs tend to be cheapest for new construction vs. building retrofit, for the following reasons:
Table 4: Geothermal System Cost Factors, New Construction vs. Retrofit
New Construction Building Retrofit
Land area Can use area under the building Restricted to land surrounding building
Land use Site will be landscaped regardless Cost to re-landscape is incremental
Mechanical system design
Original design for geothermal May require significant remediation or complete replacement
Mechanical equipment Original equipment is geothermal Equipment may have residual value
Size of geothermal system
New Building Codes require buildings to be more energy efficient, therefore require less energy. (Approximately 30% reduction in energy use, since 1980)
Building may not be energy efficient, therefore may require more energy. Alternatively, the cost of building energy efficient improvements need to be weighed against the savings realized by the associated reduction in size of a geothermal system.
Inconvenience No disruption to use Some inconvenience and possible disruption to occupant use during installation
Heating Original design comfort & control May increase comfort and control
Cooling Original design comfort & control May add cooling where not previously provided
Operating Cost/sq. ft. Original budget; low electricity, low maintenance
Potential 60% reduction in electricity, 60% reduction in maintenance
Future Energy Prices 60% protected vs. all electric Added 60% protection vs. previous

APPLICATIONS OF GEOTHERMAL ENERGY
January 2012 Report No. 10-1151-0408 - 3 21
In cases where existing buildings need energy system replacement regardless, then geothermal energy may be a good option, despite the additional capital costs. Financial payback is related to the savings in operating costs, however, increased comfort, particularly if air conditioning is added, should also be considered a value to the project. With reduced dependence on electricity, increased protection from future energy price increases is particularly of value to those on fixed incomes.
Central geothermal systems may be considered where there is building and occupancy density. The cost of a central system is highly influenced by the length of the pipe required to connect the individual buildings to the central plant and central bore field. This cost is mitigated by the reduced capacity required to service the diversified energy demand loads.
The following subsections of Section 5.0 refer only to distributed closed-loop geothermal systems. Central geothermal district energy systems are discussed in Section 7.1, Waldorf Geothermal District Energy System and 7.2 Homefield Geothermal District Energy System.
5.1 Residential Buildings In Report II of this study, Building Loads and Geothermal Resources Analysis, Section 2.0, the various residential building types found in Charles County, MD are discussed. In summary, 13.6% of the land area in Charles County MD is used for residential homes. Single family homes represent 73% (by number of units) of the County’s residential structures, 18% are attached units and 9% are units contained in multi-residential buildings. Greater density is proposed for future development, in keeping with national sustainability and energy policies. Accordingly, planned communities, such as Homefield can be assumed to be part of this trend. Growth plans in Charles County MD call for residential units to increase by about 2% per year for the next 25 years, with proportionately more attached and multi-residential units being built. Approximately 35,500 additional residential units are expected to be built by 2035.
Installing geothermal systems into single family residences is generally the easiest application of the technology. A single family home has some property dedicated to it, usually owned by a single owner. Therefore geothermal systems can be installed by drilling vertically or trenching horizontally, depending on the amount of land available and whether or not the surface is available to be disrupted or is paved or landscaped for other uses.
5.1.1 Single Family Homes Golder used the RETScreen Analysis Software, to analyse the energy used by a typical single family home in Charles County, MD. For Scenario 1, a base case was created assuming that 100% electricity was the energy source for both heating and cooling. A proposed case was then created assuming that a geothermal vertical, closed-loop ground heat exchanger and ground source heat pumps could provide 100% of the heating and cooling including heating for the domestic hot water. Climate data used was specific to Maryland, at Andrews Air Force Base. The value for CO2 emissions produced from electricity generation was taken from the SMECO website (refer to Section 4.3, above) as was the rate for electricity distribution service (refer to Section 4.1, above).
The scenario considered a 2500 sq. ft. single family home, as new construction. The results indicated that 942 sq. ft. of land area would be required for installation of a vertical ground heat exchanger, however, this area includes the thermal plume or area of land from which the vertical wells exchange heat. 1114 feet of vertical loop are required, so if two 600 ft. depth bore holes were drilled, with 15 foot separation,

APPLICATIONS OF GEOTHERMAL ENERGY
January 2012 Report No. 10-1151-0408 - 3 22
then only 250 sq. ft. of surface land would be required. If four, 300 ft. deep bore holes were drilled, then approximately 300 sq. ft. of surface land would be required. It is possible to place vertical bore holes under buildings, if they can be drilled prior to building construction.
The only government incentives used in the model were the Maryland State Clean Energy Grant Program of $500 per Refrigeration Ton (2.7 x $500 = $1350.) of renewable energy, and the Green Energy Loan rate of 6.9%. (refer to Report I, Section 9.3, Incentives for Geothermal System Installations, which has been revised since first reported in April 2011).
The model produced the following results, for a vertical geothermal system:
Table 5: Vertical Geothermal System - Single Family House, 2500 sq. ft. area
Annual Heating
Annual Cooling
Geothermal Vertical System Cost*
Loan Monthly
Cash Flow
Equity Payback
Simple Payback
Pretax IRR (assets)
81 MBTU 6,063 RTh $23,326 75% @
6.9%, 20 yrs $1347
2.9 yrs 7.4 yrs 11.4% 39.2% ROE
81 MBTU 6,063 RTh $23,326 N/A $2986 6.5 yrs 7.4 yrs 17.2%
*Before rebates, grants, tax incentives and taxes
For comparison, the proposed case was changed to the assumption that a geothermal horizontal, closed-loop ground heat exchanger and ground source heat pumps could provide 100% of the heating and cooling including heating for the domestic hot water. All other assumptions were unchanged. The results indicated that 5,854 sq. ft. of land area would be required for a “standard” installation of the ground heat exchanger, which would require a residential property to have an area with no trees, service installations or buildings and available for excavation, of approximately 60 feet by 100 feet. Horizontal loops cannot be placed under building structures, since they require the seasonal ground temperature changes produced by surface exposure to the sun. The cost for the horizontal system was $13,225. or 43% less than for a vertical system. This cost did not include any surface remediation or re-landscaping costs.
The model produced the following results, for a horizontal geothermal system:
Table 6: Horizontal Geothermal System - Single Family House, 2500 sq. ft. area
Annual Heating
Annual Cooling
Geothermal Horizontal
System Cost*
Loan Monthly
Cash Flow
Equity Payback
Simple Payback
Pretax IRR (assets)
81 MBTU 6,063 RTh $13,225 75% @
6.9%, 20 yrs $2057 0.9 yrs 4.0 yrs
22.9% 115% ROE
81 MBTU 6,063 RTh $13,225 N/A $2986 3.7 yrs 4.0 yrs 29.5%
*Before rebates, grants not specified above, tax incentives and taxes

APPLICATIONS OF GEOTHERMAL ENERGY
January 2012 Report No. 10-1151-0408 - 3 23
5.1.2 Attached Townhouses Golder used the RETScreen Analysis Software, to analyse the energy used by a typical attached townhouse in Charles County, MD. All assumptions described above for single family homes were also used for the townhouse models. The only government incentives used in the model were the Maryland State Clean Energy Grant Program of $500 per Refrigeration Ton (1.4 x $500 = $700.) For each attached townhouse, a single borehole would be required, installed to a depth of 275 ft.
The model produced the following results for a vertical geothermal system:
Table 7: Vertical Geothermal System - Attached Townhouse, 1700 sq. ft. area
Annual Heating
Annual Cooling
Geothermal Vertical System Cost*
Loan Monthly
Cash Flow
Equity Payback
Simple Payback
Pretax IRR (assets)
39 MBTU 3,171 RTh $9,293 75% @
6.9%, 20 yrs $1339 1.1 yrs 4.3 yrs
21.1% 98.8% ROE
39 MBTU 3,171 RTh $9,293 N/A $1991 4.0 yrs 4.3 yrs 27.4%
*Before rebates, grants not specified above, tax incentives and taxes
For comparison, the townhouse scenario was changed to the assumption that a geothermal horizontal, closed-loop ground heat exchanger would be installed. All other assumptions were unchanged. The results indicated that 1,491 sq. ft. of land area would be required for a “standard” installation of the ground heat exchanger, which would require a residential property to have an area with no trees, service installations or buildings and available for excavation, of approximately 30 feet by 50 feet. A compact installation design would only require 950 sq. ft. of land are. The cost for the horizontal system was $6,918. or 26% less than for a vertical system. This cost did not include any surface remediation or re-landscaping costs.
The model produced the following results for a horizontal geothermal system:
Table 8: Horizontal Geothermal System - Attached Townhouse, 1700 sq. ft. area
Annual Heating
Annual Cooling
Geothermal Vertical System Cost*
Loan Monthly
Cash Flow
Equity Payback
Simple Payback
Pretax IRR (assets)
39 MBTU 3,171 RTh $6,918 75% @
6.9%, 20 yrs $1505 0.7 yrs 3.1 yrs
29.7% 157.5%
ROE
39 MBTU 3,171 RTh $6,918 N/A $1991 2.9 yrs 3.1 yrs 36.6%
*Before rebates, grants not specified above, tax incentives and taxes

APPLICATIONS OF GEOTHERMAL ENERGY
January 2012 Report No. 10-1151-0408 - 3 24
5.1.3 Multi-Residential Buildings Golder used the RETScreen Analysis Software, to analyse the energy used by a typical midrise multi-residential building in Charles County, MD. A base case was created assuming that 100% electricity was the energy source for both heating and cooling. A proposed case was then created assuming that a geothermal vertical, closed-loop ground heat exchanger and ground source heat pumps could provide 100% of the heating and cooling including heating for the domestic hot water. Climate data used was specific to Maryland, at Andrews Air Force Base. The value for CO2 emissions produced from electricity generation was taken from the SMECO website (refer to Section 4.3, above) as was the rate for electricity distribution service (refer to Section 4.1, above).
The scenario considered a 60,000 sq. ft., 54 suite building, as new construction. The results indicated that 18,850 sq. ft. of land area would be required for “standard” installation of a vertical ground heat exchanger, however, this area includes the thermal plume or area of land from which the vertical wells exchange heat. 19,850 feet of vertical loop are required, indicating that if a more compact design were used whereby thirty-three, 600 ft. deep bore holes were drilled, with 15 foot separation, then only 7,500 sq. ft. of surface land would be required. If sixty, 300 ft. deep bore holes were drilled then approximately 15,000 sq. ft. of surface land would be required. It is possible to place vertical bore holes under buildings, if they can be drilled prior to building construction and this works particularly well for multi-residential buildings, where land outside the building footprint may be too small an area, and where the cost of horizontal headers and tie-ins can be minimized.
No government or utility rebates or incentives were considered for this scenario.
The model produced the following results, for a vertical geothermal system:
Table 9: Vertical Geothermal System - Multi-residential Building, 60,000 sq. ft. area, 54 suites
Annual Heating MBTU
Annual Cooling
RTh
Geothermal Vertical System Cost*
Loan Monthly
Cash Flow
Equity Payback
Simple Payback
Pretax IRR (assets)
1,956 136,177 $445,582 75% @
6.9%, 20 yrs $46,364 2.9 yrs 5.7 yrs
15.7% 49.6% ROE
1,956 136,177 $445,582 N/A $77,664 5.2 yrs 5.7 yrs 21.4%
*Before rebates, grants, tax incentives and taxes
5.1.4 Observations and Conclusions for Residential Buildings From the detailed information provided by the models for these residential scenarios, the following observations and conclusions can be drawn:
Maryland State Tax incentives appear to be substantial, and may reimburse 100% or more of the initial capital cash required to install geothermal systems, in the state. Expert tax advice should be obtained to determine the real effects of these tax incentives that can be expected. (refer to Report I, Section 9.3, Incentives for Geothermal System Installations, which has been revised since first reported in April 2011)

APPLICATIONS OF GEOTHERMAL ENERGY
January 2012 Report No. 10-1151-0408 - 3 25
Single family homes in Charles County MD appear to be significantly heating dominant, on an annual basis. When the heating load of domestic hot water is added to this load, the size of the geothermal system required is larger. Using the RETScreen model, we see that the additional capital cost is approximately $1000. If a household uses 300 kWh per month to heat hot water, at $0.1434/kWh, costing $43.02 per month, then the payback on spending the extra $1000 to heat hot water is just under 2 years.
Rural residential properties and large urban residential lots (over 8,000 sq. ft.) may be able to take advantage of the lower cost of installing a horizontal geothermal system.
Retrofitting geothermal systems to existing buildings requires enough land in which to install either vertical or horizontal ground heat exchangers. Often trees, landscaping, buildings, installed services and other ground obstructions make geothermal system installation costly or impractical.
Retrofitting geothermal systems to existing residential buildings is technically easy if the building structure includes heating and cooling air ductwork. In this case, an existing furnace can be replaced by a water-to-air ground source heat pump, and a ground heat exchanger installed adjacent to the building, often in a driveway. If the building has no ductwork, then it most likely does not have the structural space between floors and walls to install ductwork and therefore is either very costly or simply not possible to convert to geothermal energy. Alternatively, if hydronic water pipes are installed through the building structure, then possibly a water-to-water ground source heat pump can be installed and connected, replacing an existing boiler.
RETScreen Analysis software, while useful, is very simplistic and can only be used for high level study purposes. It is not a design tool. It operates on databases that are updated regularly but they are never complete. For example, the choice of heat pumps was appropriate for this study, however for design, different heat pumps would likely be selected.
The process of detail design offers many opportunities to optimize energy use and energy efficiency through a process of building/mechanical/energy integration. Project managers should seek to find and incorporate these advantages into projects.
5.2 Industrial, Commercial and Institutional Buildings In Report II of this study, Building Loads and Geothermal Resources Analysis, Section 2.2, the various industrial, commercial and institutional (ICI) building types found in Charles County, MD are discussed. In summary, 2.8% of the land area in Charles County MD is used for ICI buildings. Of the 1900 existing buildings, 27% are used for retailing, 14% for health care and social assistance (presumably some are assisted living residential units), 25% are professional and other services. Only 3% are used for manufacturing, and 2% are educational, representing 42 buildings, most of which are assumed to be schools.
ASHRAE provides two sets of guidelines for designing geothermal systems, for only two categories of buildings, Residential and Commercial. ASHRAE guidelines define a geothermal system as “Commercial”, if it is to provide energy to a building larger than 38,000 sq. ft. ASHRAE recommends using “Residential” guidelines for designing geothermal systems for buildings smaller than this size. However, regardless of size, the different use characteristics of a commercial building must underlie the design parameters.

APPLICATIONS OF GEOTHERMAL ENERGY
January 2012 Report No. 10-1151-0408 - 3 26
5.2.1 Industrial Buildings Industrial buildings must each be considered individually. If the space is used for manufacturing or processing, then the costs for heating and cooling may be significant inputs to the costs of operations. If the space is used for warehousing, where office space usually occupies approximately 5% of the total space, then heating and cooling costs may be insignificant. Industrial companies are often looking for cost cutting measures with very short 1 to 2 year paybacks and geothermal will not likely fit this economic profile unless refrigeration or other significant process heating or cooling loads are present.
Geothermal systems can be very effective for process loads, particularly refrigeration. Geothermal has been used for food processing, wine making, climate controlled storage, vehicle maintenance shops and other industrial activities.
5.2.2 Commercial Buildings Commercial buildings are usually densely occupied during the day and relatively vacant at night. This causes them to be significantly cooling dominant. Geothermal systems are designed to peak cooling loads rather than peak heating loads generally used for residential buildings. This means that commercial building geothermal systems have excess heating capacity. Commercial buildings tend to have significant auxiliary HVAC equipment such as Make-Up- Air units and parking garage ramp heating. These auxiliary heating loads can be served by the geothermal system, providing better balance in the bore field and improving the economics of the project significantly by offsetting other sources of heat that would otherwise e required.
Commercial buildings are often located near each other or in more dense areas of development. Therefore close proximity to buildings that may require additional heat can sometimes provide an economical solution for both, if excess geothermal energy can be distributed and sold.
5.2.2.1 Homefield Community Center The Homefield Community Center planned for Homefield Subdivision is an example of a small Commercial building, though at 3,000 sq. ft. it is very small. A RETScreen model, again using local climate data and the same assumptions as used for previous models, for a vertical closed-loop geothermal system for the proposed community center, indicates that using a compact borefield design, 5 boreholes drilled 600 ft. deep would be required, using an area of land of approximately 339 sq. ft.
The model produced the following results for a vertical geothermal system:
Table 10: Vertical Geothermal System - Homefield Community Center, 3,000 sq. ft. area
Annual Heating MBTU
Annual Cooling
RTh
Geothermal Vertical System Cost*
Loan Monthly
Cash Flow
Equity Payback
Simple Payback
Pretax IRR (assets)
82 5 $26,982 75% @
6.9%, 20 yrs $46,364 3.6 yrs 5.7 yrs
11.0% 32.0% ROE
82 5 $26,982 N/A $3,486 6.8 yrs 7.7 yrs 16.5%
*Before rebates, grants, tax incentives and taxes

APPLICATIONS OF GEOTHERMAL ENERGY
January 2012 Report No. 10-1151-0408 - 3 27
For comparison, the Homefield Community Center model was changed to the assumption that a geothermal horizontal, closed-loop ground heat exchanger and ground source heat pumps could provide 100% of the heating and cooling including heating for the domestic hot water. All other assumptions were unchanged. The results indicated that 5,725 sq. ft. of land area would be required for a “standard” installation of the ground heat exchanger, which would require a residential property to have an area with no trees, service installations or buildings and available for excavation, of approximately 60 feet by 100 feet. A more “compact” design would only require approximately 3,800 sq. ft. of land area. The cost for the horizontal system was $17,073. or 58% less than for a vertical system. This cost did not include any surface remediation or re-landscaping costs.
The model produced the following results, for a horizontal geothermal system:
Table 11: Horizontal Geothermal System - Homefield Community Center, 3,000 sq. ft. area
Annual Heating MBTU
Annual Cooling
RTh
Geothermal Vertical System Cost*
Loan Monthly
Cash Flow
Equity Payback
Simple Payback
Pretax IRR (assets)
82 5 $17,073 75% @
6.9%, 20 yrs $46,364 1.7 yrs 4.9 yrs
18.8% 61.5% ROE
82 5 $17,073 N/A $3,486 4.5 yrs 4.9 yrs 24.6%
*Before rebates, grants, tax incentives and taxes
5.2.2.2 Springdale Professional Center Springdale Professional Center, located in Brampton, Ontario, is presented here as a reference case study only. A RETScreen model was not prepared for this building.
Springdale Professional Center is an example of a larger Commercial building with 100% of its heating and cooling produced by a vertical closed-loop geothermal system. Springdale is a professional medical building located across the street from a major hospital. It is built on top of a massive two level, underground parking garage that provides parking for not only this building, but also for the hospital. Since the building is cooling dominant, a 356 ton geothermal system is sized to provide peak cooling to the 120,000 sq. ft. building. The heat by-produced by the geothermal system not only heats the building, but produces enough excess heat to keep the surrounding sidewalks and parking garage ramp free of snow and ice, and to heat the entire parking garage, with geothermal loops embedded in the walls and floors of the underground structure. The borefield is entirely below the garage underground structure, which extends from lot line to lot line of the 1.5 acre site.

APPLICATIONS OF GEOTHERMAL ENERGY
January 2012 Report No. 10-1151-0408 - 3 28
Figure 12: Springdale - Geothermal Loop Installation in the Walls of the Underground Parking Garage.
Figure 13: Springdale Professional Center, Geothermal Installation on the P1 Slab.

APPLICATIONS OF GEOTHERMAL ENERGY
January 2012 Report No. 10-1151-0408 - 3 29
5.2.3 Institutional Buildings Institutional buildings can be either used intensely twenty-four hours a day, all year around, such as nursing homes, or they can be used only ten hours a day for ten months of the year, such as schools. The heat loads used by design engineers for these buildings varies widely, by use, with the size of the building offering little indication of the actual energy required. For these reasons, RETScreen models were not run for institutional buildings in Charles County MD. Alternatively, case examples are presented.
Examples of geothermal systems, installed in institutional buildings include the following:
Diversicare Residences (5 locations in Southern Ontario): Diversicare owns and operates a chain of nursing homes. Since 2008, seven new homes have been built, all using geothermal energy. The owners indicate that the advantages of geothermal energy are increased comfort and control, with intense energy use significantly lower operating costs, protection from future energy price increases and lower GHG emissions, which differentiates them from competition and enhances their brand. For at least one building, local municipal authorities approved a larger building design with geothermal energy than it would otherwise approve, with a natural gas system.
Brantford Collegiate Institute (Brantford, Ontario): The century old high school needed complete renovation and in fact the oldest part of the building was demolished and rebuilt on the same site, while preserving the historic facade. This building was not designed for geothermal energy, but shortly after, the renovation of a large wing of the school, built in 1963, was retrofitted with a geothermal system. Because the building was undergoing complete architectural and HVAC renovation, there was no residual value placed on old equipment and systems. The cost of the geothermal system was only $1,350,000, after considering an Energy Recovery Ventilation (ERV) system, which reduced the building energy requirement by over 45%. The simple payback on the project was 3.9 years. Please refer to Appendix B for a complete case study.
Walden Public School (Sudbury, Ontario): Walden Public School was built to be the first “carbon neutral” public school in North America. However the school required only heating and no cooling, since students do not attend classes in the summer months. The school was first designed to require the least possible amount of electricity, the heating was provided by a vertical closed-loop geothermal system which was tied to thermal solar panels mounted on the south-west facing wall of the gymnasium, to replenish the ground with heat. Electricity was generated by solar PV collectors on the roof and by a micro wind turbine in the school yard. Please refer to Appendix B for a more detailed case study.
5.2.4 Observations and Conclusions for Industrial, Commercial and Institutional Buildings
From the detailed information provided by the models and example cases for ICI building scenarios, the following observations and conclusions can be drawn:
Maryland State Tax incentives appear to be substantial, and may reimburse 100% or more of the initial capital cash required to install geothermal systems, in the state. Expert tax advice should be obtained to determine the real effects of these tax incentives that can be expected. (refer to Report I, Section 9.3, Incentives for Geothermal System Installations, which has been revised since first reported in April 2011)

APPLICATIONS OF GEOTHERMAL ENERGY
January 2012 Report No. 10-1151-0408 - 3 30
ICI buildings in Charles County MD may be heating dominant or cooling dominant, on an annual basis, depending on use. If the building is used for hospital or nursing care, the building will require much higher energy loads and will also use very high amounts of domestic hot water. If the buildings are industrial and to a lesser extent commercial, then the amounts of domestic hot water used will likely be quite low. Building loads should be assessed carefully using building hourly energy load analysis software such as Carrier HAP or Trane Trace 2000. This detail analysis is not usually performed for traditional energy systems, but is essential for the proper design of a “Commercial” geothermal system.
ICI building properties may be able to take advantage of the lower cost of installing a horizontal geothermal system. Many retail plazas, warehouses and industrial buildings are low density use buildings located on large lots, often with large parking lots, that may serve additionally as horizontal geothermal ground heat exchangers. School yards can be ideal locations for horizontal ground heat exchangers.
Retrofitting geothermal systems to existing buildings requires enough land in which to install either vertical or horizontal ground heat exchangers. Often trees, landscaping, buildings, installed services and other ground obstructions make geothermal system installation costly or impractical.
Retrofitting geothermal systems which produce low grade heat, to existing ICI buildings may be technically difficult and/or expensive if the building HVAC infrastructure is designed for high grade heat. Architectural building interior space may be an issue as is the design and state of repair of existing hydronic piping.
Process loads and auxiliary heating and cool loads can be incorporated into a geothermal system and can often significantly improve the economics of a project. Project managers should take a holistic approach to energy management to capture “free” excess heating and cooling produced as a result of single load dominance.
ICI buildings are large enough that they usually benefit significantly from the installation of central Energy Return Ventilation (ERV) units that can save 30% to 60% of the energy otherwise expelled to the atmosphere, thereby significantly reducing the size (capacity) and cost of a geothermal system. Paybacks on ERVs are often under 2 years and therefore improve the overall economics of a project.
RETScreen Analysis software, while useful, is very simplistic and can only be used for high level study purposes. It is not a design tool. It operates on databases that are updated regularly but they are never complete. For example, the choice of heat pumps was appropriate for this study, however for design, different heat pumps would likely be selected.
The process of detail design offers many opportunities to optimize energy use and energy efficiency through a process of building/mechanical/energy integration. Project managers should seek to find and incorporate these advantages into projects.

APPLICATIONS OF GEOTHERMAL ENERGY
January 2012 Report No. 10-1151-0408 - 3 31
6.0 GEOTHERMAL DISTRICT ENERGY SYSTEMS 6.1 District Energy Systems in General District energy systems (usually coal or natural gas boilers for heating and electricity for cooling) may be installed at large, multi-building sites such as universities, hospitals, and government complexes. District energy systems can also serve as merchant thermal systems providing heating (and often cooling) to multiple buildings in urban areas.
District energy in general, has a major added benefit of reducing the requirement for size and capital investment in ground infrastructure and in production equipment due to the "diversity" of consumer loads. In addition, they tend to use larger and more efficient equipment and can take advantage of such things as thermal energy storage that aren't economically effective on a small scale. Moreover, district energy systems aggregate thermal loads, enabling more cost-effective installations.
According to the International District Energy Association (IDEA)12
colleges and universities,
, primary district energy markets are:
downtowns, and
airports.
Colleges and universities are the most attractive market. They are installing district energy systems in response to campus load growth, asset replacement of aging boiler capacity, and favorable economics. Major urban centers are also a growing market for creating or adding to existing district energy systems. Many district energy steam plants were originally Combined Heat and Power (CHP) facilities that generated both power and steam when owned by the local electric utility. With a growing need for local grid support and in light of utility divestiture of generating capacity coupled with solid market growth in downtown urban areas, district energy systems are now more attractive than ever. IDEA reports 839 district energy systems currently operating in the US (2009) 13 of which are in Maryland: Baltimore (5), Chestertown, College Park, Fort Howard, Green Belt, Indian Head, Joppa, Laplata and Towson.
12 International District Energy Association website, http://www.districtenergy.org

APPLICATIONS OF GEOTHERMAL ENERGY
January 2012 Report No. 10-1151-0408 - 3 32
Figure 14: US District Energy Systems, 2009
Figure 15: US District Energy Systems by Market, 2009
48%
30%
1%
14%
5%
2%0%
District Energy Systems in the US by Market - 2009
College & Universities Healthcare Installations Airports
Community Utilities Military/Gov Installations Industrial
Others

APPLICATIONS OF GEOTHERMAL ENERGY
January 2012 Report No. 10-1151-0408 - 3 33
6.2 Geothermal District Energy Systems Geothermal technology can be applied to district energy systems in two basic design configurations, a central bore field and pumping station connected to individual buildings by an in-ground thermal pipe network or thermal grid, installed along with other municipal services, or alternatively, individual boreholes installed on each property. In both cases, the geothermal piping is connected to individual heat pumps located in each connected building or in the case of residential subdivisions, each individual house. Both configurations function equally well though with different economics. Commercial size buildings may have central geothermal water-to-water heat pumps which connect to smaller heat pumps or fan coils distributed throughout the building or for residential subdivisions, individual homeowners have stand alone water-to-air heat pumps.
Issues to be considered when assessing which configuration best suits a particular development may include:
Comparative cost (property development design specific)
Land availability and proximity to use, for ground heat exchange installation
Land ownership (free hold, apartment or coop, municipal, etc)
Proposed service business model (equipment rental, energy supply agreement, others)
Operations and maintenance
Scope, liability and cost of services to be provided
Municipal zoning and bylaws, building permits
Customer choice, legal and practical consumer considerations
Comparative price, consumer price elasticity
6.2.1 Distributed Geothermal System Configuration A distributed geothermal system is suitable for residential subdivisions. In this configuration individual boreholes are each dedicated to one residential unit, installed on individual sites either beneath or near each building structure. Each residence has a standalone geothermal system. The systems can therefore be sold to property buyers as part of the real estate purchase, or ownership can be retained by a third party owner in return for an energy supply fee.

APPLICATIONS OF GEOTHERMAL ENERGY
January 2012 Report No. 10-1151-0408 - 3 34
Figure 16: Distributed Geothermal System - Residential Subdivision
6.2.2 Central Geothermal System Configuration A central geothermal system configuration is one where a central borefield, operated from a central pumping station, is connected to a distribution pipe network or thermal grid, as it is sometimes called, which delivers geothermal fluid to each connected building. The central geothermal system is owned and operated by an energy supply enterprise, such as a municipality, a university or a third party service provider which will charge each connected building for its energy supply services.
In a central geothermal system, the boreholes are drilled in a central location, usually in a grid formation, with the boreholes all drilled to the same depth. The boreholes are grouped into zones with each zone connected by a sub-header. Sub-headers are then connected to primary headers that terminate in a central geothermal pumping station, which can be in the form of a small building above ground or a subterranean vault, built specially for the purpose.
Central borefields can be installed into any open area of land. School yards, parks, parking lots and sports fields are ideal for borefield installations. Efficiencies can be gained by making use of thermal interference, creating a battery effect of stored energy in the borefield. Further efficiencies are gained by

APPLICATIONS OF GEOTHERMAL ENERGY
January 2012 Report No. 10-1151-0408 - 3 35
the diversity of the building loads and the aggregate peak load which is less than the sum of the individual peak building unit loads. However, efficiencies in the central borefield are offset by the need for the installation of a thermal grid, which in the case of a residential subdivision or urban core redevelopment can be installed along with water and sewer services in the roadways.
Detailed consideration of a central geothermal system would require a scaled site plan indicating the street configurations and distances, size of the properties, and other spatial metrics. These distances determine the length and cost of the insulated thermal distribution piping that would be required to connect the central pumping station to headers and sub-headers and eventually to each building.
Figure 17: Centralized Geothermal System - Residential Subdivision
A central pumping station could be designed in two basic ways. One method of design supplies water at the peak temperatures required, that is approximately 140°F for heating and 45°F for cooling. This design requires large industrial sized central heat pump equipment and incurs some thermal losses in the distribution pipe network. In this case, HVAC distribution equipment in each building may be reduced in size and cost.
A second method of design supplies water to the distribution pipe network and ultimately to each residence at the ambient ground temperature of approximately 55°F all year around. Each building has its own geothermal heat pump equipment, and full control of temperature settings at any time of year. This is similar to the Distributed Geothermal System configuration, except that the borefield is centralized. Because the fluid temperature is similar to the surrounding ground, there are no significant thermal losses in the distribution pipes and if installed below the frost line, the pipes would not need to be insulated.

APPLICATIONS OF GEOTHERMAL ENERGY
January 2012 Report No. 10-1151-0408 - 3 36
Computer modelling could be used to prescribe concept design configurations along with associated order of magnitude costs. The following diagram illustrates how RETScreen organizes information for analysis of central geothermal district energy systems.
Figure 18: RETScreen Community System Building Cluster Layout
6.2.2.1 Central Geothermal District Energy – Ball State University On May 11, 2009, Ball State University in Munice, Indiana broke ground on the largest vertical closed-loop geothermal system to be installed in the United States13
Some of the notable characteristics of the system include:
. Phase one is now complete and is undergoing final testing for full operations expected early in 2012. Construction of Phase II has begun.
13 Ball State University website, Geothermal Energy, http://cms.bsu.edu/About/Geothermal/FAQ.aspx

APPLICATIONS OF GEOTHERMAL ENERGY
January 2012 Report No. 10-1151-0408 - 3 37
Elimination of 85,000 tons of CO2 emissions annually (50% of all emissions for the campus), by shutting down a coal fired heating system
Three borefields, under sports fields, parking lots and green spaces
4100 boreholes (originally 3600 were planned), 450 feet deep, 5 inches in diameter
Two Central Energy Stations will supply 45 campus buildings spread across 731 acres
Over 10 miles of distribution pipes are being installed 5 feet below the surface
Building clusters are connected to disbursed subterranean vaults, where pipe networks connect to central energy stations. This provides redundancy in the system and allows buildings to share loads.
Heating provided by water at constant 140°F and chilling provided by water at constant 45°F
Total cost is $65 - $70 million, annual savings are $2 million, useful life of the system is 50 years
Figure 19: Ball State University Geothermal System - North Borefield Installation

APPLICATIONS OF GEOTHERMAL ENERGY
January 2012 Report No. 10-1151-0408 - 3 38
Figure 20: Ball State University Geothermal System Model

APPLICATIONS OF GEOTHERMAL ENERGY
January 2012 Report No. 10-1151-0408 - 3 39
Figure 21: Ball State University Geothermal System Map with Photo of North District Energy Station Equipment

APPLICATIONS OF GEOTHERMAL ENERGY
January 2012 Report No. 10-1151-0408 - 3 40
6.2.2.2 Central Geothermal District Energy - Enwave Energy Corporation A second example of geothermal district energy is Enwave Energy Corp.14
In a search for the most economical and renewable sources of energy that can provide large scale energy capacity to expand its system, Enwave has turned to geothermal energy, and is studying several geothermal ground heat exchange installations of 12,000 tons and more.
Enwave, a District Energy System operator, owns 522 MWs of installed steam generation capacity providing heat to more than 140 commercial, government, institutional (hospitals and universities) and multi-residential buildings representing approximately 40 million square feet of building space in downtown Toronto. Enwave also owns the world’s largest Deep Lake Water Cooling (DLWC) system, which provides over 59,000 tons of chilled water to more than 100 high rise buildings. In many ways, the DLWC system can be considered a large open-loop geothermal system, though water drawn from the lake is first used for cooling and then processed for use as potable water and is not reinjected into the lake.
Figure 22: Enwave Deep Lake Water Cooling System Plate Heat Exchanger, Distribution Pipe Tunnel and Tunnel
Borer being lowered into the ground
14 Enwave Energy Corporation website, www.enwave.com

APPLICATIONS OF GEOTHERMAL ENERGY
January 2012 Report No. 10-1151-0408 - 3 41
7.0 GEOTHERMAL DISTRICT ENERGY SYSTEMS FOR CHARLES COUNTY, MD
The population of Charles County MD is projected to grow by an average of 1.7 percent per year, or 45 percent overall from 140,764 people in 2008 to a population of approximately 204,200 people by 203015
Greater residential (and commercial) density is proposed by the County for future development, in keeping with state and national sustainability and energy policies. Accordingly, planned communities, such as Homefield can be assumed to be part of this trend. Density and new construction offer the greatest opportunity for the development and installation of highly energy efficient, district energy systems and particularly geothermal district energy systems where the installation of borefields, is essential.
. This population increase of approximately 64,436 will require an additional 24,173 residential dwellings.
Growth plans call for commercial and institutional space in Charles County MD to increase by about 2% per year for the next 25 years, from over 14.5 million sq. ft. in 2010 to over 21.2 million sq. ft. in 2035. Accordingly the thermal energy required by this space is estimated to increase by approximately 46%, an increase of an additional 276,000 MBTU/year. This energy increase represents approximately 49,500 tons of geothermal energy. To put this in perspective, it would take 19,800 boreholes drilled 600 feet deep, to produce this amount of heating and cooling, in Charles County, MD. A borefield installation of that size would require approximately 100 acres of land. Obviously not every new building in Charles County is going to be connected to a central geothermal district energy system. However, where growth is concentrated and where infrastructure is being replaced regardless, such as Waldorf Urban Redevelopment Area, a central geothermal district energy system may be very feasible.
7.1 Waldorf Geothermal District Energy System The Waldorf Urban Redevelopment Area includes an area of land approximately 9100 feet by 1500 feet, or 13.65 million square feet (313 acres).16
If buildings eventually were built to cover 10% of the land area, with a height of 2 stories, the building floor area would contain approximately 2.7 million sq. ft. of occupied space. At an energy intensity of 500 sq. ft. of occupied space per ton of geothermal energy, the capacity of a geothermal district energy system to serve Waldorf would be approximately 5400 tons.
Leonardtown Rd. Old Washington Rd. Action Lane
Figure 23: Waldorf Urban Redevelopment Area
15 Charles County Comprehensive Plan, Water Resource Element (Draft), July 2010, page 4 (Original Source: MDP, 2008 Estimates for Maryland’s Jurisdictions) 16 Waldorf Urban Design Study, Project summary, April 2010, Page 1.
Hwy 301

APPLICATIONS OF GEOTHERMAL ENERGY
January 2012 Report No. 10-1151-0408 - 3 42
Applying the assumptions developed earlier for Charles County MD, 5400 tons of geothermal energy would require approximately 2160 boreholes, drilled 600 feet deep, requiring 486,000 sq. ft. of surface area for borefield installation or 3.56% of the land area to be redeveloped. Borefields could be drilled into parking lots, roadways, green spaces and drainage ponds, under buildings before construction, or alternatively in brownfield sites in close proximity to the area.
The following figure illustrates a central district energy system concept that may be considered for Waldorf. Three potential borefield locations are suggested. Three central energy station locations are also suggested. Several secondary connection spurs are included. This concept suggests:
Main Distribution pipe length 7965 ft.
Secondary connection pipe spurs, total length 11,667 ft.
Distance to connect Borefield A - 287 ft., Borefield B - 2351 ft. and Borefield C - 3100 ft.
Figure 24: Waldorf Geothermal District Energy System Design Concept
From this simple concept it is impossible to create a reasonable RETScreen model or to estimate costs. For an order of magnitude level of assessment, by applying a simple assumed cost of $4800. per ton to install a geothermal borefield, 5400 tons indicates a cost of approximately $25 million. Add to this the cost of the pipe network, and building connections and equipment; it seems that it would not be unreasonable to estimate the cost of this system to be between $40 and $50 million. This seems reasonable, when compared to the cost given for the Ball State University Geothermal District Energy System (approximately $8500 per ton, total project cost) (Section 6.2.2.1).
Geothermal borefields and mechanical systems are very scalable and can be designed to closely match

APPLICATIONS OF GEOTHERMAL ENERGY
January 2012 Report No. 10-1151-0408 - 3 43
capacities required. However the length of the distribution piping is fixed, depending on building locations. Therefore building density is key to the economic feasibility of a district energy system. Sophisticated computer modeling tools exist, to help developers map energy intensity of proposed district energy systems. For simple estimations, RETScreen can be used. For more detailed and accurate estimations “Community and Emission Mapping and Planning Tool” (CEEMAP)17 can be used. For detail design and definitive costing, software called TERMIS18
7.1.1 Observations and Conclusions for Waldorf Geothermal District Energy System
is appropriate.
Maryland State Tax incentives appear to be substantial, and may reimburse 100% or more of the initial capital cash required to install geothermal systems, in the state. Expert tax advice should be obtained to determine the real effects of these tax incentives that can be expected. (refer to Report I, Section 9.3, Incentives for Geothermal System Installations, which has been revised since first reported in April 2011)
For a complex system such as this, more detailed planning and feasibility analysis is required to determine estimated building loads, borefield locations and lengths of distribution and connections piping required.
Stakeholder engagement is an important part of any infrastructure project that influences individual private property and business owners. Professional planners can assist governments and developers to plan information content and publication and presentation mediums. Budgets should reflect the cost of this essential activity. Failure to gain “social license” could result in challenges that preclude the project form proceeding at any cost.
Installing infrastructure into built environments creates disruption to businesses and inconvenience for local residents. Redevelopment and renewal projects should be planned to take advantage of “one time” construction to minimize costs, both money and inconvenience.
Retrofitting geothermal systems which produce low grade heat, to existing Industrial, Commercial and Institutional (ICI) buildings may be technically difficult and/or expensive if the building HVAC infrastructure is designed for high grade heat. Architectural building interior space may be an issue as is the design and state of repair of existing hydronic piping. Each building in the area and each new building to be built, needs to be assessed for low-grade heat and geothermal system compatibility, state of repair of existing HVAC equipment, building energy efficiency, size and seasonal variation of building energy loads, current cost of energy, future expansion plans, and many other factors that could affect the suitability of connecting to district energy system.
Process loads and auxiliary heating and cool loads can be incorporated into a geothermal system and can often significantly improve the economics of a project. Buildings should be assessed for the opportunity to share loads. For example, waste heat from a local manufacturer or heat from a skating arena can be used to heat a community swimming pool, with Coefficients of Performance (COPs) as high as 7 to 10.
17 CEEMAP is a proprietary software program owned by H.B. Lanarc Inc., a Golder company. 18 TERMIS is a proprietary software program owned by COWI, and licensed by Golder Associates Ltd.

APPLICATIONS OF GEOTHERMAL ENERGY
January 2012 Report No. 10-1151-0408 - 3 44
ICI buildings are large enough that they usually benefit significantly from the installation of central Energy Return Ventilation (ERV) units that can save 30% to 60% of the energy otherwise expelled to the atmosphere, thereby significantly reducing the size (capacity) and cost of a geothermal system. Paybacks on ERVs are often under 2 years and therefore improve the overall economics of a project. Installation of ERVs could be considered as a possible companion offering, to businesses interested in connecting to a geothermal system.
Opportunistically, open excavations, such as gravel pits, roadways under construction, stormwater drainage pond excavations, and others can be used to install low cost horizontal geothermal loops, prior to backfill and landscaping. Vertical geothermal ground heat exchangers can be installed under buildings, for example, a big box store can cover 50,000 sq. ft. of land, enough to install 225 boreholes which could produce over 550 tons of energy, enough to heat almost 500,000 sq. ft. of occupied space.
RETScreen Analysis software, while useful, is very simplistic and can only be used for high level study purposes. It is not a design tool. It operates on databases that are updated regularly but they are never complete. For example, the choice of heat pumps was appropriate for this study, however for design, different heat pumps would likely be selected.
The process of detail design offers many opportunities to optimize energy use and energy efficiency through a process of building/mechanical/energy integration. Project managers should seek to find and incorporate these advantages into projects.

APPLICATIONS OF GEOTHERMAL ENERGY
January 2012 Report No. 10-1151-0408 - 3 45
7.2 Homefield Geothermal District Energy System Homefield Subdivision is a planned residential community, located just south of LaPlata, MD. According to a rough site plan of Homefield provided by the consultant, Meridian Ventures, Inc.19
Table 12: Homefield Subdivision Buildings Planned
, the following buildings were indicated:
Type of Residential Structure Number Avg. Area /
Bldg, ft2 Frontage, ft
Phase I
Single Family Detached House 201 2,100 50
Single-Family Attached (Townhouse) 200 1,700 50
Phase II
Multi-family Residential Buildings
8 buildings (192 units total) 1,000 N/A
Community Building 1 3,000 N/A
Homefield DE System Total 594 957,100 28,125
Note: Data is not exact, but derived from a rough site plan for the purposes of this study only.
Golder developed Scenarios and applied RETScreen Analysis, first to each building type (results are given in previous sections of this report) and then developed a design concept for central geothermal district energy systems that might be applied to Homefield. In an attempt to reduce the fixed cost of distribution piping required, the concept divided the subdivision into two phases, Phase I connecting the single family homes and townhouses south of the Community Center and Phase II connecting the multi-residential buildings to the north of the Community Center. The results of the RETScreen Analysis for this two phase concept, indicates that it may be more economical to consider a single phase concept, however this study limits the investigation to one concept for Homefield, Phase I: Multi-buildings and Phase II: Multi- residential.
The following sketch illustrates the Homefield Geothermal District Energy System (HGDES) design concept developed by Golder. The black lines indicate distribution pipes installed under streets connecting to two Central Geothermal Plants. Building Clusters were each defined for space and energy loads and used in the development of the RETScreen analysis models. Pipes connecting each residential unit to the distribution pipe system were not included in calculations. Each residence would have its own individual heat pump with individual controls for setting indoor temperatures. The cost of this equipment was not included in the cost of the HGDES.
19 Meridian Ventures Inc. 3261 Old Washington Road, Suite 1040, Waldorf, MD 20602, James Lynn, President, http://www.mviservices.us/

APPLICATIONS OF GEOTHERMAL ENERGY
January 2012 Report No. 10-1151-0408 - 3 46
Figure 25: Homefield Geothermal District Energy System Design Concept

APPLICATIONS OF GEOTHERMAL ENERGY
January 2012 Report No. 10-1151-0408 - 3 47
The full RETScreen Analysis reports for the Homefield Geothermal District Energy System, Phase I and Phase II are included in Appendix A. The following tables summarize the business case results for the design concepts developed.
Table 13: Homefield Phase I - Central Geothermal District Energy System
Annual Heating
Annual Cooling
Geothermal DE System
Cost* Loan
Monthly Cash Flow
Equity Payback
Simple Payback
Pretax IRR
(assets)
22,353 MBTU
1,602,412 RTh
$10.9 million 75% @
6.9%, 20 yrs $87,619 16.5 yrs 12.8 yrs
1.3% 8.9% ROE
22,353 MBTU
1,602,412 RTh
$10.9 million N/A $852,754 12.0 yrs 12.8 yrs 7.8%
*Before rebates, grants, tax incentives and taxes
Table 14: Homefield Phase II - Central Geothermal District Energy System
Annual Heating
Annual Cooling
Geothermal DE System
Cost* Loan
Monthly Cash Flow
Equity Payback
Simple Payback
Pretax IRR
(assets)
5.9 MBTU
413,680 RTh
$1.9 million 75% @
6.9%, 20 yrs $2,496 20.8 yrs 14 yrs
0.4% 6.9% ROE
5.9 MBTU
413,680 RTh
$1.9 million N/A $135,270 13.1 yrs 14 yrs 6.9%
*Before rebates, grants, tax incentives and taxes
The financial portion of this concept did not include any revenues from the sale of energy. Rather we relied on the energy cost savings to provide indicators for the projected paybacks and financial returns. This would be the most conservative assumption possible.
Other assumptions that could be refined with more detailed analysis would include:
Optimization of building concurrent and diversified energy loads would likely reduce the size of the system by 10% to 30%
Detail design engineering would likely improve the efficiency of the layout of the distribution piping
Building energy efficiency improvements may be more cost effective than the added cost of providing geothermal energy to satisfy current building loads
Costs of equipment and installation may be reduced by a competitive tender process

APPLICATIONS OF GEOTHERMAL ENERGY
January 2012 Report No. 10-1151-0408 - 3 48
7.2.1 Observations and Conclusions for Homefield Geothermal District Energy System
From the detailed information provided by the models for the Homefield Geothermal District Energy Systems, the following observations and conclusions can be drawn:
For a subdivision the size of Homefield, only one central geothermal district energy system is required. The concept of two phases produces systems that are relatively small for central systems with low economies of scale.
For a subdivision the size of Homefield, a distributed geothermal district energy system design should be considered. The economics appear to be much better, and distributed systems can be installed as each residential unit is built, with no infrastructure required. Please refer to Section 6.2.1 for a description and to the RETScreen models for single family homes, attached townhouses and multi-residential buildings, Section 5.1.
Maryland State Tax incentives appear to be substantial, and may reduce the initial capital cash required to install geothermal systems in the state. Expert tax advice should be obtained to determine the real effects of these tax incentives that can be expected. (refer to Report I, Section 9.3, Incentives for Geothermal System Installations, which has been revised since first reported in April 2011)
Residential buildings in Charles County MD appear to be heating dominant, on an annual basis Building loads should be assessed carefully using building hourly energy load analysis software such as Carrier HAP or Trane Trace 2000. This detail analysis is not usually performed for traditional energy systems, but is essential for the proper design of a geothermal district energy system.
Subdivision scale geothermal ground heat exchangers are not likely to be able to take advantage of the lower cost of installing a horizontal geothermal system, due to the space required. However, where land is available, whole communities have installed large horizontal systems, that perform extremely well to design specifications. Gibson’s, BC is one such community. For a summary description of the Gibsons BC system, please refer to Appendix D.
Auxiliary heating and cool loads can be incorporated into a geothermal system and can often significantly improve the economics of a project. For example, a community swimming pool or individual private home swimming pools could be heated by the geothermal system, in the shoulder months when the demand for space heating is low.
Building energy efficient design and materials can significantly reduce the demand for energy, thereby reducing the size and cost of the geothermal ground heat exchanger. Municipal building codes, regulations such as building density and financial incentives can promote more energy efficient building structures and therefore the installation of geothermal systems.
RETScreen Analysis software, while useful, is very simplistic and can only be used for high level study purposes. It is not a design tool. It operates on databases that are updated regularly but they are never complete. For example, the choice of heat pumps was appropriate for this study, however for design, more optimal heat pumps would likely be selected.

APPLICATIONS OF GEOTHERMAL ENERGY
January 2012 Report No. 10-1151-0408 - 3 49
The process of detail design offers many opportunities to optimize energy use and energy efficiency through a process of building/mechanical/energy integration. Project managers should seek to find and incorporate these advantages into projects.
8.0 GEOTHERMAL CONTRIBUTION TO EMISSIONS REDUCTION As noted in Section 4.3 above, SMECO reports20
The amount of air pollution associated with the generation of electricity production for this region, given in pounds emitted per megawatt hour of electricity generated, as follows: Nitrogen Oxides (NOx): 1.32, Sulphur Dioxide (SO2): 5.24, and Carbon Dioxide (CO2): 1,167.56 (0.58378 tCO2/MWh).
that the electricity generation mix for this region has values represented by 2010 averages: 49.8% coal, 35.0% nuclear, 11.41% natural gas, and 0.49% oil. Renewable energy: 0.28% methane gas, 0% geothermal, 0.97% hydroelectric, less than 0.01% solar, 0.57% solid waste, 1.28% wind, and 0.19% wood/other biomass.
Applying this data to the RETScreen analysis scenarios, the following estimated emission reductions were calculated for each of the individual building types considered:
Table 15: Expected Annual Emission Reductions Created by Substituting Geothermal Energy – Individual Building Types (lbs.)
Building (s) Reference Proposed Emission Reduction Emission Reduction Equivalent
Scenario Area
Sq. Ft. Electricity
lb. CO2
Geothermal Energy lb. CO2
CO2
lb. NOx lb.
SO2 lb.
Cars Barrels, crude oil
Single Family Home
3,200 17.9 6.6 11.3 .0128 .0507 2.1 26.4
Attached Townhouse 1,700 10.5 2.8 7.7 .0087 .0346 1.4 17.8
Multi-residential 60,000 454.8 155.1 299.8 .3389 1.346 54.9 697
Commercial Community Center (Homefield)
3,000 19.7 6.3 13.4 ,0148 .0588 2.4 31.1
Applying the SMECO emissions data to the RETScreen analysis scenarios, the following estimated emission reductions were calculated for Homefield subdivision:
20 SMECO website: https://www.smeco.coop/energy/environ.html

APPLICATIONS OF GEOTHERMAL ENERGY
January 2012 Report No. 10-1151-0408 - 3 50
Table 16: Expected Annual Emission Reductions Created by Substituting Geothermal Energy – Homefield Subdivision (tons)
Building (s) Reference Proposed Emission Reduction Emission Reduction Equivalent
Scenario Area
Sq. Ft. Electricity tons CO2
Geothermal Energy
tons CO2
CO2
tons NOx tons
SO2 tons
Cars Barrels, crude oil
Homefield Community Center
3,000 .00985 .00315 .00665 .0000074 .0000294 2.4 31.1
Homefield Phase I (SFH-TH)
762,000
5,289.8
1,543.0
3,746.8
4.236
16.816
686 8,714
Homefield Phase II (Multi-Res)
246,400
1385.0
422.6
962
1.088
4.317
176 2,237
Total Homefield
1,011,400 6,674.8 1,965.6 4,708.8 5.32 21.13 864.4 10,982.1

APPLICATIONS OF GEOTHERMAL ENERGY
January 2012 Report No. 10-1151-0408 - 3 51
9.0 LIST OF REFERENCES 9.1 Geothermal Industry and Technology References: 1) Air-Conditioning and Refrigeration Institute (ARI), 4301 North Fairfax Drive, Suite 425, Arlington, VA,
22203, USA
2) ANSI/ASHRAE/IES Standard 90.1-2010 Final Determination Quantitative Analysis, Pacific Northwest National Laboratory for the U.S. Department of Energy, PNNL-20882, October 2011
3) ASHRAE HVAC Applications Handbook, American Society of Heating, Refrigeration, Air-conditioning Engineers, Inc. (ASHRAE), 1791Tullie Circle NE, Atlanta, GA, 30329, USA www.ashrae.org
4) (ASHRAE, 1997) Ground-Source Heat Pumps – Design of Geothermal Systems for Commercial and Institutional Buildings – Chapter 5. In ASHRAE Handbook-Fundamentals, Atlanta: American Society of Heating, Refrigerating and Air-Conditioning Engineers, Inc, 1997.
5) (ASHRAE, 2003), Geothermal Energy - Chapter 32. In 2003 ASHRAE HVAC Applications Handbook, SI Edition, American Society of Heating, Refrigerating and Air-Conditioning Engineers, Inc., 2003.
6) Blue Diamond Industries, LLC, Geothermal HDPE pipe manufacturer, 3399 Tates Creek Road #110 Lexington, KY 40502 Tel: (859) 224-0415
7) Canadian GeoExchange Coalition (CGC), 1030 Cherrier Street, Suite 501, Montreal, PQ H2L 1H9 phone: (514) 807-7559
http://www.bdiky.com/index.php
www.geo-exchange.ca
8) Canadian Standards Association (CSA), 178 Rexdale Blvd., Toronto, ON M9W 1R3 phone: (416) 747-4044
- Installers’ Course
www.csa.org
9) Central Geothermal Systems, Applications Engineering Manual, April 2010, Trane, SYS-APM009-EN
- CAN/CSA-C448-02
www.trane.com
10) Criteria and Initial Screening Maps for Identifying Potential Underground Thermal Energy Storage Sites in the Toronto Area, April 2010, Toronto Regional Conservation Authority, 5 Shoreham Drive, Downsview, ON M3N 1S4
11) Closed Loop Geothermal Heat Pump Systems, Design and Installation Standards, 2009, International Ground Source Heat Pump Association (IGSHPA), 374 Cordell South Stillwater, OK 74078, Phone: (405) 744-5175, Fax: (405) 744-5283,
12) Enwave Energy Corporation website,
www.igshpa.okstate.edu
13) Geothermal District Heating, 2009, John W. Lund and Paul J. Lienau, Geo-Heat Center, Oregon Institute of Technology
www.enwave.com
14) GLD 2010, Gaia Geothermal LLC, software suite for designing geothermal heat pump and ground heat exchanger systems, http://www.gaiageo.com/?gclid=CJ-Z9orD7asCFY4UKgodEhaQKQ
15) International District Energy Association website,
http://www.districtenergy.org

APPLICATIONS OF GEOTHERMAL ENERGY
January 2012 Report No. 10-1151-0408 - 3 52
16) International Organization for Standardization (ISO),Case Postale 56, CH-1121, Geneva 21, Switzerland
17) ISCO Industires LLC, Geothermal HDPE pipe manufacturer, P.O. Box 4545 Louisville, KY 40204 Tel: 800-345-ISCO (4726) In Maryland, contact David Klecan 443-721-7691 [email protected] or Justin Grabarczyk 302-250-7211 [email protected]
18) Optimization of Heat Exchangers for Geothermal District Heating, 2009, P. Bahadorani, G.F. Naterer, S.B. Nokleby, Faculty of Engineering and Applied Science, University of Ontario Institute of Technology, Oshawa, ON (No. 08-CSME-31, E.I.C. Accession 3069)
19) RETScreen® International, Natural Resources Canada, http://www.retscreen.net
20) Survey of Geothermal Heat Pump Regulations in the United States, Karen Den Braven, University of Idaho, Mechanical Engineering Department, Moscow, ID 83844-0902
21) University of Ontario Institute of Technology, Borehole Thermal Storage System, http://www.engineering.uoit.ca/facilities/borehole
9.2 Geology and Hydrogeology References: Andreasen, D.C., 1999, The geohydrology and water-supply potential of the lower Patapsco and Patuxent
aquifers in the Indian Head-Bryans Road area, Charles County, Maryland: Maryland Geological Survey Report of Investigations No. 69, 119 p.
Andreasen, David C., 2007, Optimization of ground-water withdrawals in Anne Arundel County, Maryland, from the Upper Patapsco, Lower Patapsco, and Patuxent Aquifers projected through 2044. Maryland Geologic Survey Report of Investigations No. 77, 107 p.
Drummond, David D., 2007, Water-supply potential of the coastal plain aquifers in Calvert, Charles, and St. Mary’s Counties, Maryland, with emphasis on the Upper Patapsco and Lower Patapsco Aquifers. Maryland Geologic Survey Report of Investigations No. 76, 235 p.
Fleck, William B. and Vroblesky, Don A., 1996, Simulation of ground-water flow of the coastal plain aquifers in parts of Maryland, Delaware, and the District of Columbia. U.S. Geological Survey Professional Paper 1404-J, 41 p.
Hiortdahl, S.N., 1997, Geologic framework, hydrogeology, and ground-water quality of the Potomac Group aquifer system, northwestern Charles County, Maryland: U.S. Geological Survey Water-Resources Investigations Report 91–4059, 111 p.
Mack, F.K. 1976. Preliminary Analysis of Geohydrologic data from test wells drilled near Chalk Point, Prince George's County, Maryland. Maryland Geological Survey and Maryland Power Plant Siting Program. Open File Report 76-322.
Mack, F.K. 1988. Selected Geohydrologic characteristics of the Patapsco Aquifers at Chalk Point, Prince George's County, Maryland. U.S. Geological Survey Open File Report No. 88-02-4.

APPLICATIONS OF GEOTHERMAL ENERGY
January 2012 Report No. 10-1151-0408 - 3 53
Mack, F.K., Wheeler, J.C., and Curtin, S.E. 1983. Water level declines in the Magothy Aquifer in Southern Maryland Electric Cooperative's proposed combustion turbine generating facility of Chalk Point. Maryland Geologic Survey
McCartan, L., 1989, Geologic map of Charles County: Maryland Geological Survey, 1 sheet, scale 1:62,500.
Soeder, D.J., Raffensperger, J.P., and Nardi, M.R., 2007, Effects of withdrawals on ground-water levels in Southern Maryland and the adjacent Eastern Shore, 1980–2005: U.S. Geological Survey Scientific Investigations Report 2007–5249, 82 p.
Vroblesky, Don A and Fleck, William B., 1991, Hydrogeologic framework of the coastal plain in Maryland, Delaware, and the District of Columbia. U.S. Geological Survey Professional Paper 1404-E, 45 p.
Wilson, J.M., and Fleck, W.B., 1990, Geology and hydrogeologic assessment of Coastal Plain aquifers in the Waldorf area, Charles County, Maryland: Maryland Geological Survey Report of Investigations No. 53, 138 p.
9.3 Charles County Maryland References: 1) Charles County, MD Land Use Map, 1 page.
2) Charles County Building Code, Amendment Effective June 4, 2010, Bill 2010-08 http://www.charlescounty.org/webdocs/pgm/publications/permits/buildingcodeupdate2010-08.pdf
3) Charles County Comprehensive Plan, 2006, Charles County Government, Department of Planning and Growth Management http://www.charlescounty.org/pgm/planning/plans/commplanning/compplan/compplan.html
4) Charles County Surface Mines Map, Copyright © 2006 ADC The Map People and GIS Integrated Solutions, LLC. http://www.mde.state.md.us/programs/Land/mining/Mapping/Documents/www.mde.state.md.us/assets/document/mining/surfaceminelocations/Charles_co.pdf
5) Demographic Trends Newsletter, Volume XIV, No. 2 • August 2010, Charles County Department of Planning & Growth Management http://www.charlescounty.org/apps/workgroups/publicview/viewPDF.jsp?IDvalue=1726
6) Energy Action Plan for County Facilities 2010, Charles County Department of Public Facilities, http://www.charlescounty.org/green/plan.pdf
7) Energy Efficiency and Renewable Energy Tax Incentives, Federal and State Energy Tax Programs, Karl P. Fryzel and Jerome L. Garciano, July 2011 (http://thinkgeoenergy.com/wp-content/uploads/2011/09/EAPD_US_GeothermalTaxIncentives_July2011.pdf)
8) Generalized Geological Map of Maryland1967, Maryland Geological Survey, Baltimore Maryland, 21218 http://www.mgs.md.gov/esic/brochures/mdgeology.html
9) Going Green in Charles County, http://www.charlescounty.org/green/

APPLICATIONS OF GEOTHERMAL ENERGY
January 2012 Report No. 10-1151-0408 - 3 54
10) Homefield Development Plan, site drawing, 1 page.
11) Hydrogeologic Data From Six Test Wells in the Upper Patapsco and Lower Patapsco Aquifers in Southern Maryland 2008, Basic Data Report No. 22, Nadine Calis and David D. Drummond, Maryland Department of Natural Resources, Maryland Geological Survey, Resource Assessment Service, 2300 St. Paul Street, Baltimore, Maryland 21218-5210, (410) 554-5500 http://www.mgs.md.gov/esic/publications/download/BDR22.pdf
12) Maryland Electricity Profile, Annual Energy Generator Report, Department of Energy, Energy Information Administration, 2008, Released March 2010, (DOE/EIA-0348(01)/2)
13) Maryland Geological Survey,
http://www.eia.gov/cneaf/electricity/st_profiles/maryland.html
http://www.mgs.md.gov/esic/brochures/mdgeology.html
14) Meridian Ventures Inc. 3261 Old Washington Road, Suite 1040, Waldorf, MD 20602, James Lynn, President,
15) National Climatic Data Center,
http://www.mviservices.us
http://www7.ncdc.noaa.gov/CDO/cdodivisionalselect.cmd
16) St. Charles, Maryland, Southern Villages Master Plan, November 17, 2009, Parker Rodriguez Inc., master planner, 1 page
17) Single Family Guidelines Latest Revision, August 29, 2005 and Commercial and Industrial Guidelines adopted May 2005, Charles County Site And architectural Review Board, http://www.charlescounty.org/webdocs/pgm/publications/planning/sdarbguidelines.pdf
18) Southern Maryland Electricity Cooperative 2010 Annual Report, Volume 61, Issue 5, May 2011, “Construction of New Building Under Way”, page 7.
19) Southern Maryland Electric Cooperative, Inc. Retail Electric Service Tariff, Effective November 11, 2011, P.S.C. Md. No. 3,
https://www.smeco.coop/coopreview/201105/linked_images/May%202011%20coop%20review%20annual%20report_web.pdf
20) Vision Plan - Department of Planning and Growth Management, Charles County, MD, adopted April 13, 2010 by County Commissioners’ Resolution No. 2010-09, including signed copy, 29 pages.
https://www.smeco.coop/pdfs/tariff.pdf
21) Vision Plan Design Guidelines - Department of Planning and Growth Management, Charles County, MD, adopted April 13, 2010 by County Commissioners’ Resolution No. 2010-09, 64 pages.
22) Waldorf Urban Design Study, PGM Seminar Series - April 29, 2010 WUDS seminar slide show.pptx, author Xpuser, 34 slides.
23) Waldorf Urban Design Study, Project Summary, April 2010, 4 pages.
24) Waldorf Urban Transportation Improvement Plan, Martin/Alexiou/Bryson, June 2010 DRAFT REPORT, 103 pages.
25) Waldorf Vision Plan 4-10.doc, author Clive Graham

APPLICATIONS OF GEOTHERMAL ENERGY
January 2012 Report No. 10-1151-0408 - 3 55
GOLDER ASSOCIATES INC.
Suzanne Wiltshire, MBA Brent Waters, C.P.G. Senior Consultant, Geothermal Associate
SW/BW/sa
Golder, Golder Associates and the GA globe design are trademarks of Golder Associates Corporation.
n:\active\2010\1151\10-1151-0408 charles county - geothermal study - md\reports\final\report iii - geothermal applications to buildings and developments(v3).docx
APPLICATIONS OF GEOTHERMAL ENERGY
January 2012 Report No. 10-1151-0408 - 3 56
APPENDIX A RETScreen Analysis Software Models

APPLICATIONS OF GEOTHERMAL ENERGY
January 2012 Report No. 10-1151-0408 - 3 57
RETScreen Analysis Software Modeling Assumptions Used:
1. The following scenarios were considered:
Scenario Buildings District Energy System
Stand-alone System
Scenario 1 Single house – Vertical x
Scenario 1B Single house - Horizontal x
Scenario 2 Attached Townhouse - Vertical x
Scenario 2B Attached Townhouse - Horizontal x
Scenario 3 Multi-res building - Vertical x
Scenario 4 Homefield Community Center - Vertical x
Scenario 4 Homefield Community Center - Horizontal x
Scenario 5
Homefield Geothermal District Energy System – Phase I
- Single Family Homes and Townhouses
x
Scenario 6 Homefield Geothermal District Energy System – Phase II
- Multi-residential Buildings x
1. All models were created with 2 cases: Base Case (heat and cold are supplied by conventional
systems, electric boilers and conventional chiller, respectively); Proposed Case (heat and cold are supplied by the geothermal system).
2. Electricity cost: an average cost of electricity of $0.1434/kWh was used ($0.0975/kWh (June to October) and $0.0911/kWh (November to May)) to estimate annual utility costs.
3. In case of district energy system, all residential structures are serviced by direct buried pre-insulated piping. Heat transfer medium is water, which circulates between central heat pumps, located within the community’s central plant, and individual heat pumps, located in every housing unit
4. Climate data location: Andrews Air Force Base (Andrews AFB), Maryland, US.
5. Design supply temperature for district heating network: 100 °F Design return temperature for district heating network: 90 °F
6. Design supply temperature for district cooling network: 45 °F Design return temperature for district heating network: 55 °F

APPLICATIONS OF GEOTHERMAL ENERGY
January 2012 Report No. 10-1151-0408 - 3 58
7. Heating load was estimated to be 17 BTUH/ft2 (or 55 W/m2) based on heating design temperature for Andrews AFB, which is 18.3 °F (or -7.6 °C). Medium insulation level for all type of construction was assumed.
8. Domestic hot water heating base demand is assumed to be 10-15% of total heating load.
9. Cooling load was estimated to be 13 BTUH/ft2 (or 42 W/m2) based on cooling design temperatures for Andrews AFB, which is 91.0 °F (or 32.8 °C). Medium insulation level for all type of construction was assumed.
10. For townhouses and multi-residential buildings heating and cooling loads were assumed to be
70% of the loads of the detached houses.
11. Community center assumed to have 85% heating load of a single-family detached house, and 110% cooling load of a single-family detached house.

APPLICATIONS OF GEOTHERMAL ENERGY
January 2012 Report No. 10-1151-0408 - 3 59
12. The following seasonal efficiencies were used in the model:
System Type Base Case (conventional boilers and chillers)
Proposed Case (ground-source heat-pumps)
Seasonal Efficiency for Heating System 85% 5.2
Seasonal Efficiency for Cooling System (COP) 3.5 4.7
13. HDPE Geothermal loop installation (PE3810, 1 ¼” OD, SDR11), including drilling a 4 5/8” diameter BH, pressure testing, and grouting; cost is approximately $14 per vertical foot. Horizontal tie-ins including horizontal headers, manifolds and joints, fusing, excavation (no backfill) to headers inside the building (commercial systems), including purging and flushing of the system on startup; cost is approximately $2000/BH. (Cost is approx. $500 per single family home) Therefore a 300 ft. BH complete to tie-in will cost approximately $6200, while a 600 ft. deep BH, complete to tie-in, will cost approximately $10,400.
14. Inflation rate was assumed to be 3.5% based on US’ October 2011 inflation rate. Source: http://www.usinflationcalculator.com/inflation/current-inflation-rates/
15. Transmission and distribution losses in US were assumed to be 7%, according to US EIA. http://205.254.135.7/tools/faqs/faq.cfm?id=105&t=3
16. Electricity escalation rate: 1% as per Projected fuel price indices, Census Region 3. Source: http://www1.eere.energy.gov/femp/pdfs/ashb11.pdf

Project information
Project nameProject location
Prepared forPrepared by
Project type
Analysis type
Heating value reference
Show settings
Language - LangueUser manual
CurrencySymbol
Units
Climate data location
Show data
UnitClimate data
location Project locationLatitude ˚N 38.8 38.8Longitude ˚E -76.9 -76.9Elevation ft 282 282H ti d i t t °F 18 3
See project database
Select climate data location
English - Anglais
$
Imperial units
Andrews AFB
US, MD, Charles County
government of Charles County MDGolder Associates Inc.
Method 1
Site reference conditions
Higher heating value (HHV)
English - Anglais
Clean Energy Project Analysis Software
Combined heating & cooling
Single Family House - Vertical
Heating design temperature °F 18.3Cooling design temperature °F 91.0Earth temperature amplitude °F 35.2
Month Air temperatureRelative humidity
Daily solar radiation - horizontal
Atmospheric pressure Wind speed
Earth temperature
Heatingdegree-days
Coolingdegree-days
°F % kWh/m²/d Inch Hg mph °F °F-d °F-dJanuary 34.5 64.9% 1.96 29.9 9.0 33.5 926 0February 37.6 62.3% 2.79 29.9 9.0 37.1 751 0March 45.0 60.6% 3.76 29.8 9.8 45.1 603 0April 54.9 61.4% 4.86 29.8 9.0 56.8 286 146May 63.9 68.4% 5.38 29.8 7.4 67.1 17 430June 72.5 70.6% 5.72 29.8 6.7 75.6 0 675July 77.4 70.5% 5.64 29.8 6.5 78.9 0 848August 75.2 72.7% 5.15 29.8 6.3 76.6 0 781September 68.2 73.4% 4.23 29.9 6.5 69.9 0 545October 57.0 72.0% 3.19 29.9 6.7 58.5 229 218November 48.0 67.5% 2.19 29.9 7.8 47.7 491 0December 38.7 66.0% 1.81 29.9 8.3 37.2 798 0Annual 56.2 67.6% 3.90 29.8 7.7 57.1 4,101 3,643Measured at ft 32.8 0.0
RETScreen4 2011-09-01 © Minister of Natural Resources Canada 1997-2011. NRCan/CanmetENERGY
Complete Load & Network sheet
Single Family House - VerticalUS, MD, Charles County
1/4/2012Single Family House - Vertical.xlsm

Unit
Heated floor area for building ft² 2,500Fuel type ElectricitySeasonal efficiency % 100%Heating load calculationHeating load for building (Btu/h)/ft² 17.0Domestic hot water heating base demand % 10%Total heating million Btu 81Total peak heating load million Btu/h 0.0Fuel consumption - annual MWh 24Fuel rate $/kWh 0.143Fuel cost 3,384$
End-use energy efficiency measures %Net peak heating load million Btu/h 0.0Net heating million Btu 81
RETScreen Load & Network Design - Combined heating & cooling project
Single building - space heating
Heating project
Base case heating system
Proposed case energy efficiency measures
Single Family House - VerticalUS, MD, Charles County
1/4/2012Single Family House - Vertical.xlsm

RETScreen Load & Network Design - Combined heating & cooling projectUnit
Cooled floor area for building ft² 2,500Fuel type ElectricityCoefficient of performance - seasonal 3.00Cooling load calculationCooling load for building (Btu/h)/ft² 13.0Non-weather dependant cooling % 0%Total cooling RTh 6,063Total peak cooling load RT 2.7Fuel consumption - annual MWh 7Fuel rate $/kWh 0.143Fuel cost 1,019$
End-use energy efficiency measures % 0%Net peak cooling load RT 2.7Net cooling RTh 6,063
Single building - space cooling
Cooling project
Base case cooling system
Proposed case energy efficiency measures
Single Family House - VerticalUS, MD, Charles County
1/4/2012Single Family House - Vertical.xlsm

RETScreen Load & Network Design - Combined heating & cooling project
End-use energy efficiency measures % Power Heating CoolingNet peak electricity load kW 0 0 million Btu/h 0 RT 3Net electricity MWh 0 0 million Btu 81 RTh 6,063
Proposed case energy efficiency measuresProposed case load and energySystem peak loadSystem energy
0
1
2
3
4
5
6
7
8
Jan Feb Mar Apr May Jun Jul Aug Sep Oct Nov Dec
kW
Proposed case system load characteristics graph
Heating
Cooling
0
1
2
3
4
5
6
7
8
Jan Feb Mar Apr May Jun Jul Aug Sep Oct Nov Dec
kW
Base case system load characteristics graph
Heating
Cooling
Single Family House - VerticalUS, MD, Charles County
1/4/2012Single Family House - Vertical.xlsm

Base load cooling systemTechnology Show figureFuel typeFuel rate $/MWh 143.400Capacity kW 18.3 192.1% 6,000$ Coefficient of performance - seasonal 4.70ManufacturerModel 1 unit(s)Cooling delivered RTh 6,063 100.0%Peak load cooling systemTechnology
Incremental initial costsSystem selectionBase load heating systemTechnology
Fuel selection methodFuel type Complete Tools sheetFuel rate $/MWh 143.400
Heat pump
Capacity kW 14.7 118.0% -$ Heating delivered million Btu 81 100.0%ManufacturerModel 1 unit(s)Seasonal efficiency % 350%Fuel required million Btu/h 0.0
Unit Estimate % Incremental initial costs
Base load heating systemTechnology Heat pumpCapacity million Btu/h 0.1 118.0%Heating delivered million Btu 81 100.0%Peak load heating systemTechnology Not requiredBack-up heating system (optional)TechnologyCapacity kW
Base load cooling systemTechnology Heat pumpFuel type ElectricityCapacity RT 5 192.1%Cooling delivered RTh 6,063 100.0%Back-up cooling system (optional)TechnologyCapacity kW
Fuel type
Fuel consumption -
unitFuel
consumptionCapacity
(kW)
Energy delivered
(MWh)HeatingBase load Electricity MWh 7 15 24
Total 15 24Cooling
Electricity
RETScreen Energy Model - Combined heating & cooling project
Heat pumpElectricity
McQuayWCCH/WCCW-060-E
Not required
Heat pump
Single fuel
Base load system
System design graph
Proposed case heating system
Proposed case system characteristicsHeating
Cooling
Proposed case system summary
Show alternative units
See product database
Incremental initial costsProposed case cooling system
See product database
McQuayWCCH/WCCW-060-E
0%
100%
200%
300%
Capacity Energy delivered
Base
0%
100%
200%
Capacity Energy delivered
Base
Base load Electricity MWh 5 18 21Total 18 21
Single Family House - VerticalUS, MD, Charles County
1/4/2012Single Family House - Vertical.xlsm

Emission Analysis
Base case electricity system (Baseline)
GHG emissionfactor
(excl. T&D)T&D
lossesGHG emission
factorCountry - region Fuel type tCO2/MWh % tCO2/MWhUnited States of America All types 0.584 0.584
Electricity exported to grid MWh 0 T&D losses
GHG emissionBase case tCO2 17.9Proposed case tCO2 6.6Gross annual GHG emission reduction tCO2 11.3GHG credits transaction fee %Net annual GHG emission reduction tCO2 11.3 is equivalent to 2.1
GHG reduction incomeGHG reduction credit rate $/tCO2
Financial parametersInflation rate % 3.5%Project life yr 30Debt ratio % 0%
Initial costsHeating system $ 0 0.0%Cooling system $ 6,000 25.7%Ground Heat Exchanger $ 17,326 74.3%Total initial costs $ 23,326 100.0%
Incentives and grants $ 1,350 0.0%
Annual costs and debt paymentsO&M (savings) costs $ -200Fuel cost - proposed case $ 1,617
$Total annual costs $ 1,417
Annual savings and incomeFuel cost - base case $ 4,403
$Total annual savings and income $ 4,403
Financial viabilityPre-tax IRR - assets % 17.2%Simple payback yr 7.4Equity payback yr 6.5
Cumulative cash flows graph
Cum
ulat
ive
cash
flow
s ($
)
Year
Cars & light trucks not used
Financial Analysis
-40,000
-20,000
0
20,000
40,000
60,000
80,000
100,000
120,000
140,000
160,000
0 1 2 3 4 5 6 7 8 9 10 11 12 13 14 15 16 17 18 19 20 21 22 23 24 25 26 27 28 29 30
Single Family House - VerticalUS, MD, Charles County
1/4/2012Single Family House - Vertical.xlsm

As fired fuel Biogas Building envelope properties Appliances & equipment Electricity rate - monthly Electricity rate - time of use GHG equivalence
Heat pump Unit Heating CoolingCapacity kW 14.7 18.3Average load kW 3.0 2.0ManufacturerModel 1 unit(s)Efficiency HighCoefficient of performance - design 4.0 5.5Coefficient of performance - design 3.5 4.7
Site conditions Unit Project locationClimate data
locationSoil type Light soil - dampEarth temperature °F 57.1 57.1Earth temperature amplitude °F 23.1 35.2Measured at ft 10.0 0.0
Ground heat exchangerTypeDesign criteria HeatingLand area ft² 3,000 942Layout StandardBorehole length ft 1,114
Unit cost AmountSpecific project costs Quantity $ $Circulating pump kW 0.3 1,000$ 311$ Circulating fluid US gal 15.85 25$ 396$ Drilling & grouting ft 1,114 12$ 13,650$ Loop pipe ft 2,229 1$ 2,786$ Fittings & valves kW 18.3 10$ 183$ Total 17,326$
Vertical closed-loop
RETScreen Tools - Combined heating & cooling project
See product database
Ground heat exchanger
User-defined fuel - gasUser-defined fuel - solid
Custom 2
McQuay
Water & steamWater pumpingWindow propertiesCustom 1
Settings
Ground heat exchangerHeat rateHeating value & fuel rateHydro formula costing methodLandfill gasUnit conversionUser-defined fuel
WCCH/WCCW-060-E
Single Family House - VerticalUS, MD, Charles County
1/4/2012Single Family House - Vertical.xlsm

Project information
Project nameProject location
Prepared forPrepared by
Project type
Analysis type
Heating value reference
Show settings
Language - LangueUser manual
CurrencySymbol
Units
Climate data location
Show data
UnitClimate data
location Project locationLatitude ˚N 38.8 38.8Longitude ˚E -76.9 -76.9Elevation ft 282 282H ti d i t t °F 18 3
See project database
Select climate data location
English - Anglais
$
Imperial units
Andrews AFB
US, Maryland, Charles County
Charles County GovernmentGolder Associates Ltd.
Method 1
Site reference conditions
Higher heating value (HHV)
English - Anglais
Clean Energy Project Analysis Software
Combined heating & cooling
Single-family townhouse (One unit)
Heating design temperature °F 18.3Cooling design temperature °F 91.0Earth temperature amplitude °F 35.2
Month Air temperatureRelative humidity
Daily solar radiation - horizontal
Atmospheric pressure Wind speed
Earth temperature
Heatingdegree-days
Coolingdegree-days
°F % kWh/m²/d kPa mph °F °F-d °F-dJanuary 34.5 64.9% 1.96 101.2 9.0 33.5 926 0February 37.6 62.3% 2.79 101.2 9.0 37.1 751 0March 45.0 60.6% 3.76 101.0 9.8 45.1 603 0April 54.9 61.4% 4.86 100.8 9.0 56.8 286 146May 63.9 68.4% 5.38 100.9 7.4 67.1 17 430June 72.5 70.6% 5.72 100.8 6.7 75.6 0 675July 77.4 70.5% 5.64 100.8 6.5 78.9 0 848August 75.2 72.7% 5.15 101.0 6.3 76.6 0 781September 68.2 73.4% 4.23 101.1 6.5 69.9 0 545October 57.0 72.0% 3.19 101.2 6.7 58.5 229 218November 48.0 67.5% 2.19 101.2 7.8 47.7 491 0December 38.7 66.0% 1.81 101.3 8.3 37.2 798 0Annual 56.2 67.6% 3.90 101.0 7.7 57.1 4,101 3,643Measured at ft 32.8 0.0
RETScreen4 2010-09-22 © Minister of Natural Resources Canada 1997-2010. NRCan/CanmetENERGY
Complete Load & Network sheet
11/02/2008RETScreen4-v183-58.xls

Unit
Heated floor area for building ft² 1,700Fuel type ElectricitySeasonal efficiency % 85%Heating load calculationHeating load for building (Btu/h)/ft² 12.0Domestic hot water heating base demand % 10%Total heating million Btu 39Total peak heating load million Btu/h 0.0Fuel consumption - annual MWh 13Fuel rate $/kWh 0.143Fuel cost 1,911$
End-use energy efficiency measures % 0%Net peak heating load million Btu/h 0.0Net heating million Btu 39
RETScreen Load & Network Design - Combined heating & cooling project
Single building - space heating
Heating project
Base case heating system
Proposed case energy efficiency measures
2007-09-27RETScreen4-v182-45.xls

RETScreen Load & Network Design - Combined heating & cooling projectUnit
Cooled floor area for building ft² 1,700Fuel type ElectricityCoefficient of performance - seasonal 3.00Cooling load calculationCooling load for building (Btu/h)/ft² 10.0Non-weather dependant cooling % 0%Total cooling RTh 3,171Total peak cooling load RT 1.4Fuel consumption - annual MWh 4Fuel rate $/kWh 0.143Fuel cost 533$
End-use energy efficiency measures % 0%Net peak cooling load RT 1.4Net cooling RTh 3,171
Single building - space cooling
Cooling project
Base case cooling system
Proposed case energy efficiency measures
2007-09-27RETScreen4-v182-45.xls

RETScreen Load & Network Design - Combined heating & cooling project
End-use energy efficiency measures % Power Heating CoolingNet peak electricity load kW 0 0 million Btu/h 0 RT 1Net electricity MWh 0 0 million Btu 39 RTh 3,171
Complete Energy Model sheetComplete Energy Model sheet
System energy
Proposed case load and energySystem peak load
Proposed case energy efficiency measures
0
1
1
2
2
3
3
4
4
Jan Feb Mar Apr May Jun Jul Aug Sep Oct Nov Dec
kW
Proposed case system load characteristics graph
Heating
Cooling
0
1
1
2
2
3
3
4
4
Jan Feb Mar Apr May Jun Jul Aug Sep Oct Nov Dec
kW
Base case system load characteristics graph
Heating
Cooling
2007-09-27RETScreen4-v182-45.xls

Base load cooling systemTechnology Show figureFuel typeFuel rate $/MWh 143.400Capacity kW 8.9 178.6%Coefficient of performance - seasonal 4.70ManufacturerModel 1 unit(s)Cooling delivered RTh 3,171 100.0%Peak load cooling systemTechnology
Incremental initial costsSystem selectionBase load heating systemTechnology
Fuel selection methodFuel type Complete Tools sheetFuel rate $/MWh 143.400
Heat pump
Capacity kW 7.0 117.1% 5,000$ Heating delivered million Btu 39 100.0%ManufacturerModel 1 unit(s)Seasonal efficiency % 520%Fuel required million Btu/h 0.0
Unit Estimate % Incremental initial costs
Base load heating systemTechnology Heat pumpCapacity million Btu/h 0.0 117.1%Heating delivered million Btu 39 100.0%Peak load heating systemTechnology Not requiredBack-up heating system (optional)TechnologyCapacity kW
Base load cooling systemTechnology Heat pumpFuel type ElectricityCapacity RT 3 178.6%Cooling delivered RTh 3,171 100.0%Back-up cooling system (optional)TechnologyCapacity kW
Fuel type
Fuel consumption -
unitFuel
consumptionCapacity
(kW)
Energy delivered
(MWh)HeatingBase load Electricity MWh 2 7 11
Total 7 11CoolingBase load Electricity MWh 2 9 11
Total 9 11
Electricity
RETScreen Energy Model - Combined heating & cooling project
Heat pumpElectricity
McQuayWCCH/WCCW-030-E
Not required
Heat pump
Single fuel
Base load system
System design graph
Proposed case heating system
Proposed case system characteristicsHeating
Cooling
Proposed case system summary
Show alternative units
See product database
Incremental initial costsProposed case cooling system
See product database
McQuayWCCH/WCCW-030-E
0%
100%
200%
Capacity Energy delivered
Base
0%
100%
200%
Capacity Energy delivered
Base
Emission Analysis
Base case electricity system (Baseline)
GHG emissionfactor
(excl. T&D)T&D
lossesGHG emission
factorCountry - region Fuel type tCO2/MWh % tCO2/MWhUnited States of America All types 0.584 5.0% 0.614
Electricity exported to grid MWh 0 T&D losses
GHG emissionBase case tCO2 10.5Proposed case tCO2 2.8Gross annual GHG emission reduction tCO2 7.7GHG credits transaction fee %Net annual GHG emission reduction tCO2 7.7 is equivalent to 1.4
GHG reduction incomeGHG reduction credit rate $/tCO2
Financial parametersInflation rate % 3.5%Project life yr 30Debt ratio % 75%Debt interest rate % 6.90%Debt term yr 20
Initial costsHeating system $ 5,000 53.8%Cooling system $ 0 0.0%Ground heat exchanger $ 4,293 46.2%Total initial costs $ 9,293 100.0%
Incentives and grants $ 700 0.0%
Annual costs and debt paymentsO&M (savings) costs $ -200Fuel cost - proposed case $ 653Debt payments - 20 yrs $ 653
$Total annual costs $ 1,105
Annual savings and incomeFuel cost - base case $ 2,444
$Total annual savings and income $ 2,444
Financial viabilityPre-tax IRR - equity % 91.8%Pre-tax IRR - assets % 21.1%Simple payback yr 4.3Equity payback yr 1.1
Cumulative cash flows graph
Cum
ulat
ive
cash
flow
s ($
)
Year
Cars & light trucks not used
Financial Analysis
-20,000
0
20,000
40,000
60,000
80,000
100,000
0 1 2 3 4 5 6 7 8 9 10 11 12 13 14 15 16 17 18 19 20 21 22 23 24 25 26 27 28 29 30
2007-09-27RETScreen4-v182-45.xls

As fired fuel Biogas Building envelope properties Appliances & equipment Electricity rate - monthly Electricity rate - time of use GHG equivalence
Heat pump Unit Heating CoolingCapacity kW 7.0 8.9Average load kW 1.0 1.0ManufacturerModel 1 unit(s)Efficiency HighCoefficient of performance - design 4.0 5.5Coefficient of performance - design 3.7 5.1
Site conditions Unit Project locationClimate data
locationSoil type Light rockEarth temperature °F 9.0 57.1Earth temperature amplitude °F 14.0 35.2Measured at ft 10.0 0.0
Ground heat exchangerTypeDesign criteria CoolingLand area ft² 2,000 314Layout StandardBorehole length ft 275
Unit cost AmountSpecific project costs Quantity $ $Circulating pump kW 0.1 1,000$ 130$ Circulating fluid US gal 3.91 25$ 98$ Drilling & grouting ft 275 12$ 3,302$ Loop pipe ft 550 1$ 688$ Fittings & valves kW 7.6 10$ 76$ Total 4,293$
Vertical closed-loop
RETScreen Tools - Combined heating & cooling project
See product database
Ground heat exchanger
User-defined fuel - gasUser-defined fuel - solid
Custom 2
McQuay
Water & steamWater pumpingWindow propertiesCustom 1
Settings
Ground heat exchangerHeat rateHeating value & fuel rateHydro formula costing methodLandfill gasUnit conversionUser-defined fuel
WCCH/WCCW-030-E
11/02/2008RETScreen4-v183-58.xls

Project information
Project nameProject location
Prepared forPrepared by
Project type
Analysis type
Heating value reference
Show settings
Language - LangueUser manual
CurrencySymbol
Units
Climate data location
Show data
UnitClimate data
location Project locationLatitude ˚N 38.8 38.8Longitude ˚E -76.9 -76.9Elevation ft 282 282H ti d i t t °F 18 3
Clean Energy Project Analysis Software
Combined heating & cooling
Multi-Residential - Vertical
Site reference conditions
Higher heating value (HHV)
English - Anglais
US, MD, Charles County
government of Charles County MDGolder Associates Inc.
Method 1
See project database
Select climate data location
English - Anglais
$
Imperial units
Andrews AFB
Heating design temperature °F 18.3Cooling design temperature °F 91.0Earth temperature amplitude °F 35.2
Month Air temperatureRelative humidity
Daily solar radiation - horizontal
Atmospheric pressure Wind speed
Earth temperature
Heatingdegree-days
Coolingdegree-days
°F % kWh/m²/d Inch Hg mph °F °F-d °F-dJanuary 34.5 64.9% 1.96 29.9 9.0 33.5 926 0February 37.6 62.3% 2.79 29.9 9.0 37.1 751 0March 45.0 60.6% 3.76 29.8 9.8 45.1 603 0April 54.9 61.4% 4.86 29.8 9.0 56.8 286 146May 63.9 68.4% 5.38 29.8 7.4 67.1 17 430June 72.5 70.6% 5.72 29.8 6.7 75.6 0 675July 77.4 70.5% 5.64 29.8 6.5 78.9 0 848August 75.2 72.7% 5.15 29.8 6.3 76.6 0 781September 68.2 73.4% 4.23 29.9 6.5 69.9 0 545October 57.0 72.0% 3.19 29.9 6.7 58.5 229 218November 48.0 67.5% 2.19 29.9 7.8 47.7 491 0December 38.7 66.0% 1.81 29.9 8.3 37.2 798 0Annual 56.2 67.6% 3.90 29.8 7.7 57.1 4,101 3,643Measured at ft 32.8 0.0
RETScreen4 2011-09-01 © Minister of Natural Resources Canada 1997-2011. NRCan/CanmetENERGY
Complete Load & Network sheet
11/02/2008RETScreen4-v183-58.xls

Unit
Building zones1 2 3 4 5 6 7 8 9 10 11 12 13 14
Heated floor area per building zone ft² 60,000 35,000 15,000 10,000Fuel type Electricity Electricity Electricity Natural gas - m³ Natural gas - m³ Natural gas - m³ Natural gas - m³ Natural gas - m³ Natural gas - m³ Natural gas - m³ Natural gas - m³ Natural gas - m³ Natural gas - m³ Natural gas - m³Seasonal efficiency % - 100% 90% 80%Heating load calculationHeating load for building zone (Btu/h)/ft² - 14 17 19Domestic hot water heating base demand % 20%Total heating million Btu 1,956 1,025 533 397 - - - - - - - - - - -Total peak heating load million Btu/h 1 0 0 0 - - - - - - - - - - -Fuel consumption - unit - MWh MWh MWh - - - - - - - - - - -Fuel consumption - annual - 300 174 146 0 0 0 0 0 0 0 0 0 0 0Fuel rate - unit - $/kWh $/kWh $/kWh - - - - - - - - - - -Fuel rate - 0.143 0.143 0.143Fuel cost 88,871$ 43,080$ 24,910$ 20,881$ - - - - - - - - - - -
End-use energy efficiency measures % 0% 0% 0% 0%Net peak heating load million Btu/h 1 0 0 0 - - - - - - - - - - -Net heating million Btu 1,956 1,025 533 397 - - - - - - - - - - -
RETScreen Load & Network Design - Combined heating & cooling project
Single building - multiple zones - space heating
Heating project
Base case heating system
Proposed case energy efficiency measures
2007-09-27RETScreen4-v182-45.xls

RETScreen Load & Network Design - Combined heating & cooling project
Unit
Building zones1 2 3 4 5 6 7 8 9 10 11 12 13 14
Cooled floor area per building zone ft² 60,000 35,000 15,000 10,000Fuel type Electricity Electricity Electricity Electricity Electricity Electricity Electricity Electricity Electricity Electricity Electricity Electricity Electricity ElectricityCoefficient of performance - seasonal - 3.00 3.00 3.00Cooling load calculationCooling load for building zone (Btu/h)/ft² - 11 13 15Non-weather dependant cooling % 0%Total cooling RTh 136,177 71,819 36,376 27,982 - - - - - - - - - - -Total peak cooling load RT 61 32 16 13 - - - - - - - - - - -Fuel consumption - unit - MWh MWh MWh - - - - - - - - - - -Fuel consumption - annual - 84 43 33 0 0 0 0 0 0 0 0 0 0 0Fuel rate - unit - $/kWh $/kWh $/kWh - - - - - - - - - - -Fuel rate - 0.143 0.143 0.143Fuel cost 22,892$ 12,073$ 6,115$ 4,704$ - - - - - - - - - - -
End-use energy efficiency measures % 0.0% 0% 0% 0%Net peak cooling load RT 61 32 16 13 - - - - - - - - - - -Net cooling RTh 136,177 71,819 36,376 27,982
Cooling project
Base case cooling system
Proposed case energy efficiency measures
Single building - multiple zones - space cooling
2007-09-27RETScreen4-v182-45.xls

RETScreen Load & Network Design - Combined heating & cooling project
End-use energy efficiency measures % Power Heating CoolingNet peak electricity load kW 0 0 million Btu/h 1 RT 61Net electricity MWh 0 0 million Btu 1,956 RTh 136,177
System peak loadSystem energy
Proposed case energy efficiency measuresProposed case load and energy
0
20
40
60
80
100
120
140
160
180
200
Jan Feb Mar Apr May Jun Jul Aug Sep Oct Nov Dec
kW
Proposed case system load characteristics graph
Heating
Cooling
0
20
40
60
80
100
120
140
160
180
200
Jan Feb Mar Apr May Jun Jul Aug Sep Oct Nov Dec
kW
Base case system load characteristics graph
Heating
Cooling
2007-09-27RETScreen4-v182-45.xls

Base load cooling systemTechnology Show figureFuel typeFuel rate $/MWh 143.400Capacity kW 396.9 185.5% 135,000$ Coefficient of performance - seasonal 4.70ManufacturerModel 54 unit(s)Cooling delivered RTh 136,177 100.0%Peak load cooling systemTechnology
Incremental initial costsSystem selectionBase load heating systemTechnology
Fuel selection methodFuel type Complete Tools sheetFuel rate $/MWh 143.400
Heat pump
Capacity kW 289.4 105.6% -$ Heating delivered million Btu 1,956 100.0%ManufacturerModel 54 unit(s)Seasonal efficiency % 350%Fuel required million Btu/h 0.3
Unit Estimate % Incremental initial costs
Base load heating systemTechnology Heat pumpCapacity million Btu/h 1.0 105.6%Heating delivered million Btu 1,956 100.0%Peak load heating systemTechnology Not requiredBack-up heating system (optional)TechnologyCapacity kW
Base load cooling systemTechnology Heat pumpFuel type ElectricityCapacity RT 113 185.5%Cooling delivered RTh 136,177 100.0%Back-up cooling system (optional)TechnologyCapacity kW
Fuel type
Fuel consumption -
unitFuel
consumptionCapacity
(kW)
Energy delivered
(MWh)HeatingBase load Electricity MWh 164 289 573
Total 289 573CoolingBase load Electricity MWh 102 397 479
Total 397 479
Proposed case cooling system
See product database
McQuayWCCH/WCCW-024-E
Show alternative units
See product database
Incremental initial costs
Proposed case heating system
Proposed case system characteristicsHeating
Cooling
Proposed case system summary
System design graph
RETScreen Energy Model - Combined heating & cooling project
Heat pumpElectricity
McQuayWCCH/WCCW-024-E
Not required
Heat pump
Single fuel
Base load system
Electricity
0%
100%
200%
Capacity Energy delivered
Base
0%
100%
200%
Capacity Energy delivered
Base
Emission Analysis
Base case electricity system (Baseline)
GHG emissionfactor
(excl. T&D)T&D
lossesGHG emission
factorCountry - region Fuel type tCO2/MWh % tCO2/MWhUnited States of America All types 0.584 0.584
Electricity exported to grid MWh 0 T&D losses
GHG emissionBase case tCO2 454.8Proposed case tCO2 155.1Gross annual GHG emission reduction tCO2 299.8GHG credits transaction fee %Net annual GHG emission reduction tCO2 299.8 is equivalent to 54.9
GHG reduction incomeGHG reduction credit rate $/tCO2
Financial parametersInflation rate % 3.5%Project life yr 30Debt ratio % 75%Debt interest rate % 6.90%Debt term yr 20
Initial costsHeating system $ 0 0.0%Cooling system $ 135,000 30.3%Ground Heat Exchanger $ 310,582 69.7%Total initial costs $ 445,582 100.0%
Incentives and grants $ 0.0%
Annual costs and debt paymentsO&M (savings) costs $ 4,000Fuel cost - proposed case $ 38,099Debt payments - 20 yrs $ 31,300
$Total annual costs $ 73,399
Annual savings and incomeFuel cost - base case $ 111,763O&M (savings) costs $ 8,000Total annual savings and income $ 119,763
Financial viabilityPre-tax IRR - equity % 49.6%Pre-tax IRR - assets % 15.7%Simple payback yr 5.7Equity payback yr 2.2
Financial Analysis
Cars & light trucks not used
Cumulative cash flows graph
Cum
ulat
ive
cash
flow
s ($
)
Year
-500,000
0
500,000
1,000,000
1,500,000
2,000,000
2,500,000
3,000,000
3,500,000
4,000,000
0 1 2 3 4 5 6 7 8 9 10 11 12 13 14 15 16 17 18 19 20 21 22 23 24 25 26 27 28 29 30
2007-09-27RETScreen4-v182-45.xls
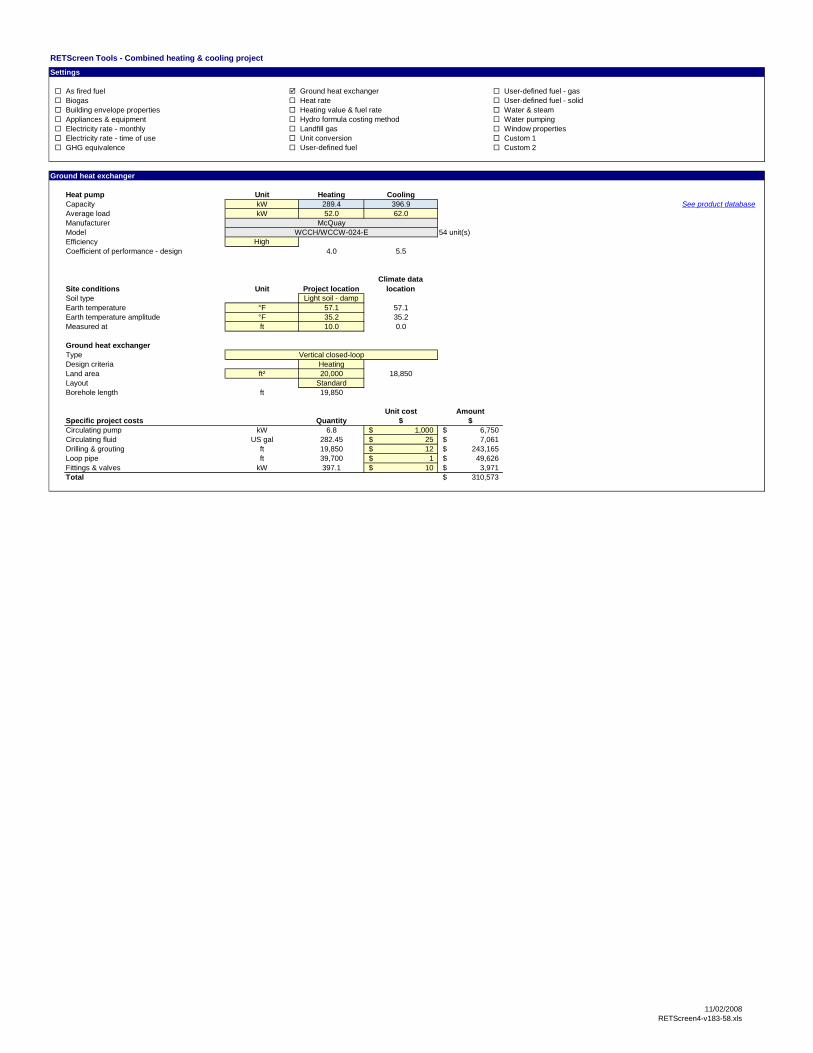
As fired fuel Biogas Building envelope properties Appliances & equipment Electricity rate - monthly Electricity rate - time of use GHG equivalence
Heat pump Unit Heating CoolingCapacity kW 289.4 396.9Average load kW 52.0 62.0ManufacturerModel 54 unit(s)Efficiency HighCoefficient of performance - design 4.0 5.5Coefficient of performance - design 3.7 4.9
Site conditions Unit Project locationClimate data
locationSoil type Light soil - dampEarth temperature °F 57.1 57.1Earth temperature amplitude °F 35.2 35.2Measured at ft 10.0 0.0
Ground heat exchangerTypeDesign criteria HeatingLand area ft² 20,000 18,850Layout StandardBorehole length ft 19,850
Unit cost AmountSpecific project costs Quantity $ $Circulating pump kW 6.8 1,000$ 6,750$ Circulating fluid US gal 282.45 25$ 7,061$ Drilling & grouting ft 19,850 12$ 243,165$ Loop pipe ft 39,700 1$ 49,626$ Fittings & valves kW 397.1 10$ 3,971$ Total 310,573$
Landfill gasUnit conversionUser-defined fuel
Settings
Ground heat exchangerHeat rateHeating value & fuel rateHydro formula costing method
Water & steamWater pumpingWindow propertiesCustom 1
WCCH/WCCW-024-E
User-defined fuel - gasUser-defined fuel - solid
Custom 2
McQuay
RETScreen Tools - Combined heating & cooling project
See product database
Ground heat exchanger
Vertical closed-loop
11/02/2008RETScreen4-v183-58.xls

Project information
Project nameProject location
Prepared forPrepared by
Project type
Analysis type
Heating value reference
Show settings
Language - LangueUser manual
CurrencySymbol
Units
Climate data location
Show data
UnitClimate data
location Project locationLatitude ˚N 38.8 38.8Longitude ˚E -76.9 -76.9Elevation ft 282 282H ti d i t t °F 18 3
Clean Energy Project Analysis Software
Combined heating & cooling
Homefield Community Center - Vertical
Site reference conditions
Higher heating value (HHV)
English - Anglais
US, Maryland, Charles County
Charles County GovernmentGolder Associates Inc.
Method 1
See project database
Select climate data location
English - Anglais
$
Imperial units
Andrews AFB
Heating design temperature °F 18.3Cooling design temperature °F 91.0Earth temperature amplitude °F 35.2
Month Air temperatureRelative humidity
Daily solar radiation - horizontal
Atmospheric pressure Wind speed
Earth temperature
Heatingdegree-days
Coolingdegree-days
°F % kWh/m²/d kPa mph °F °F-d °F-dJanuary 34.5 64.9% 1.96 101.2 9.0 33.5 926 0February 37.6 62.3% 2.79 101.2 9.0 37.1 751 0March 45.0 60.6% 3.76 101.0 9.8 45.1 603 0April 54.9 61.4% 4.86 100.8 9.0 56.8 286 146May 63.9 68.4% 5.38 100.9 7.4 67.1 17 430June 72.5 70.6% 5.72 100.8 6.7 75.6 0 675July 77.4 70.5% 5.64 100.8 6.5 78.9 0 848August 75.2 72.7% 5.15 101.0 6.3 76.6 0 781September 68.2 73.4% 4.23 101.1 6.5 69.9 0 545October 57.0 72.0% 3.19 101.2 6.7 58.5 229 218November 48.0 67.5% 2.19 101.2 7.8 47.7 491 0December 38.7 66.0% 1.81 101.3 8.3 37.2 798 0Annual 56.2 67.6% 3.90 101.0 7.7 57.1 4,101 3,643Measured at ft 32.8 0.0
RETScreen4 2011-09-01 © Minister of Natural Resources Canada 1997-2011. NRCan/CanmetENERGY
Complete Load & Network sheet
11/02/2008RETScreen4-v183-58.xls

Unit
Heated floor area for building ft² 3,000Fuel type ElectricitySeasonal efficiency % 100%Heating load calculationHeating load for building (Btu/h)/ft² 15.0Domestic hot water heating base demand % 5%Total heating million Btu 82Total peak heating load million Btu/h 0.0Fuel consumption - annual MWh 24Fuel rate $/kWh 0.143Fuel cost 3,425$
End-use energy efficiency measures % 0%Net peak heating load million Btu/h 0.0Net heating million Btu 82
RETScreen Load & Network Design - Combined heating & cooling project
Single building - space heating
Heating project
Base case heating system
Proposed case energy efficiency measures
2007-09-27RETScreen4-v182-45.xls

RETScreen Load & Network Design - Combined heating & cooling projectUnit
Cooled floor area for building ft² 3,000Fuel type ElectricityCoefficient of performance - seasonal 3.00Cooling load calculationCooling load for building (Btu/h)/ft² 15.0Non-weather dependant cooling % 0%Total cooling RTh 8,394Total peak cooling load RT 3.8Fuel consumption - annual MWh 10Fuel rate $/kWh 0.143Fuel cost 1,411$
End-use energy efficiency measures % 0%Net peak cooling load RT 3.8Net cooling RTh 8,394
Cooling project
Base case cooling system
Proposed case energy efficiency measures
Single building - space cooling
2007-09-27RETScreen4-v182-45.xls

RETScreen Load & Network Design - Combined heating & cooling project
End-use energy efficiency measures % Power Heating CoolingNet peak electricity load kW 0 0 million Btu/h 0 RT 4Net electricity MWh 0 0 million Btu 82 RTh 8,394
System peak loadSystem energy
Proposed case energy efficiency measuresProposed case load and energy
0
1
2
3
4
5
6
7
8
9
10
Jan Feb Mar Apr May Jun Jul Aug Sep Oct Nov Dec
kW
Proposed case system load characteristics graph
Heating
Cooling
0
1
2
3
4
5
6
7
8
9
10
Jan Feb Mar Apr May Jun Jul Aug Sep Oct Nov Dec
kW
Base case system load characteristics graph
Heating
Cooling
2007-09-27RETScreen4-v182-45.xls

Base load cooling systemTechnology Show figureFuel typeFuel rate $/MWh 143.400Capacity kW 17.7 134.2%Coefficient of performance - seasonal 4.75ManufacturerModel 2 unit(s)Cooling delivered RTh 8,394 100.0%Peak load cooling systemTechnology
Incremental initial costsSystem selectionBase load heating systemTechnology
Fuel selection methodFuel type Complete Tools sheetFuel rate $/MWh 143.400
Heat pump
Capacity kW 14.1 106.9% 10,000$ Heating delivered million Btu 82 100.0%ManufacturerModel 2 unit(s)Seasonal efficiency % 520%Fuel required million Btu/h 0.0
Unit Estimate % Incremental initial costs
Base load heating systemTechnology Heat pumpCapacity million Btu/h 0.0 106.9%Heating delivered million Btu 82 100.0%Peak load heating systemTechnology Not requiredBack-up heating system (optional)TechnologyCapacity kW
Base load cooling systemTechnology Heat pumpFuel type ElectricityCapacity RT 5 134.2%Cooling delivered RTh 8,394 100.0%Back-up cooling system (optional)TechnologyCapacity kW
Fuel type
Fuel consumption -
unitFuel
consumptionCapacity
(kW)
Energy delivered
(MWh)HeatingBase load Electricity MWh 5 14 24
Total 14 24CoolingBase load Electricity MWh 6 18 30
Total 18 30
Proposed case cooling system
See product database
McQuayWCCH/WCCW-030-E
Show alternative units
See product database
Incremental initial costs
Proposed case heating system
Proposed case system characteristicsHeating
Cooling
Proposed case system summary
System design graph
RETScreen Energy Model - Combined heating & cooling project
Heat pumpElectricity
McQuayWCCH/WCCW-030-E
Not required
Heat pump
Single fuel
Base load system
Electricity
0%
50%
100%
150%
Capacity Energy delivered
Base
0%
100%
200%
Capacity Energy delivered
Base
Emission Analysis
Base case electricity system (Baseline)
GHG emissionfactor
(excl. T&D)T&D
lossesGHG emission
factorCountry - region Fuel type tCO2/MWh % tCO2/MWhUnited States of America All types 0.584 0.584
Electricity exported to grid MWh 0 T&D losses
GHG emissionBase case tCO2 19.7Proposed case tCO2 6.3Gross annual GHG emission reduction tCO2 13.4GHG credits transaction fee %Net annual GHG emission reduction tCO2 13.4 is equivalent to 2.4
GHG reduction incomeGHG reduction credit rate $/tCO2
Financial parametersInflation rate % 3.5%Project life yr 30Debt ratio % 75%Debt interest rate % 6.90%Debt term yr 20
Initial costsHeating system $ 10,000 37.1%Cooling system $ 0 0.0%Ground Heat Exchanger $ 16,982 62.9%Total initial costs $ 26,982 100.0%
Incentives and grants $ 0.0%
Annual costs and debt paymentsO&M (savings) costs $ -200Fuel cost - proposed case $ 1,550Debt payments - 20 yrs $ 1,895
$Total annual costs $ 3,245
Annual savings and incomeFuel cost - base case $ 4,836
$Total annual savings and income $ 4,836
Financial viabilityPre-tax IRR - equity % 32.0%Pre-tax IRR - assets % 11.0%Simple payback yr 7.7Equity payback yr 3.6
Financial Analysis
Cars & light trucks not used
Cumulative cash flows graph
Cum
ulat
ive
cash
flow
s ($
)
Year
-20,000
0
20,000
40,000
60,000
80,000
100,000
120,000
140,000
160,000
0 1 2 3 4 5 6 7 8 9 10 11 12 13 14 15 16 17 18 19 20 21 22 23 24 25 26 27 28 29 30
2007-09-27RETScreen4-v182-45.xls

As fired fuel Biogas Building envelope properties Appliances & equipment Electricity rate - monthly Electricity rate - time of use GHG equivalence
Heat pump Unit Heating CoolingCapacity RT 4.0 5.0Average load kW 3.0 3.0ManufacturerModel 2 unit(s)Efficiency HighCoefficient of performance - design 4.0 5.5Coefficient of performance - design 3.7 5.1
Site conditions Unit Project locationClimate data
locationSoil type Light soil - dampEarth temperature °F 57.1 57.1Earth temperature amplitude °F 35.2 35.2Measured at ft 10.0 0.0
Ground heat exchangerTypeDesign criteria HeatingLand area ft² 2,000 339Layout CompactBorehole length ft 1,111
Unit cost AmountSpecific project costs Quantity $ $Circulating pump kW 0.3 1,000$ 301$ Circulating fluid US gal 15.81 25$ 395$ Drilling & grouting ft 1,111 12$ 13,332$ Loop pipe ft 2,222 1$ 2,777$ Fittings & valves kW 17.7 10$ 177$ Total 16,982$
Landfill gasUnit conversionUser-defined fuel
WCCH/WCCW-030-E
Settings
Ground heat exchangerHeat rateHeating value & fuel rateHydro formula costing method
Water & steamWater pumpingWindow propertiesCustom 1
User-defined fuel - gasUser-defined fuel - solid
Custom 2
McQuay
RETScreen Tools - Combined heating & cooling project
See product database
Ground heat exchanger
Vertical closed-loop
11/02/2008RETScreen4-v183-58.xls

Project information
Project nameProject location
Prepared forPrepared by
Project type
Analysis type
Heating value reference
Show settings
Language - LangueUser manual
CurrencySymbol
Units
Climate data location
Show data
UnitClimate data
location Project locationLatitude ˚N 38.8 38.8Longitude ˚E -76.9 -76.9Elevation ft 282 282H ti d i t t °F 18 3
See project database
Select climate data location
English - Anglais
$
Imperial units
Andrews AFB
Charles County, Maryland
Charles County GovernmentGolder Associates Inc.
Method 2
Site reference conditions
Higher heating value (HHV)
English - Anglais
Clean Energy Project Analysis Software
Combined heating & cooling
Homefield Phase 1 - Multiple Buildings
Heating design temperature °F 18.3Cooling design temperature °F 91.0Earth temperature amplitude °F 35.2
Month Air temperatureRelative humidity
Daily solar radiation - horizontal
Atmospheric pressure Wind speed
Earth temperature
Heatingdegree-days
Coolingdegree-days
°F % kWh/m²/d kPa mph °F °F-d °F-dJanuary 34.5 64.9% 1.96 101.2 9.0 33.5 926 0February 37.6 62.3% 2.79 101.2 9.0 37.1 751 0March 45.0 60.6% 3.76 101.0 9.8 45.1 603 0April 54.9 61.4% 4.86 100.8 9.0 56.8 286 146May 63.9 68.4% 5.38 100.9 7.4 67.1 17 430June 72.5 70.6% 5.72 100.8 6.7 75.6 0 675July 77.4 70.5% 5.64 100.8 6.5 78.9 0 848August 75.2 72.7% 5.15 101.0 6.3 76.6 0 781September 68.2 73.4% 4.23 101.1 6.5 69.9 0 545October 57.0 72.0% 3.19 101.2 6.7 58.5 229 218November 48.0 67.5% 2.19 101.2 7.8 47.7 491 0December 38.7 66.0% 1.81 101.3 8.3 37.2 798 0Annual 56.2 67.6% 3.90 101.0 7.7 57.1 4,101 3,643Measured at ft 32.8 0.0
RETScreen4 2011-09-01 © Minister of Natural Resources Canada 1997-2011. NRCan/CanmetENERGY
Complete Load & Network sheet
11/02/2008RETScreen4-v183-58.xls

Unit
See technical note on heating network design Building clusters1 2 3 4 5 6 7 8 9 10 11 12 13 14
Heated floor area per building cluster ft² 762,000 122,000 78,000 59,400 12,600 99,200 8,400 87,700 81,700 39,900 66,000 44,100 63,000Number of buildings in building cluster building 401 61 40 34 6 56 4 49 45 19 36 21 30 31Fuel type Electricity Electricity Electricity Electricity Electricity Electricity Electricity Electricity Electricity Electricity Electricity Electricity Electricity ElectricitySeasonal efficiency % - 100% 100% 100% 100% 100% 100% 100% 100% 100% 100% 100% 100% 350% 350%Heating load calculationHeating load for building cluster (Btu/h)/ft² - 16 15 13 17 13 17 13 14 17 14 17 17 586 672Domestic hot water heating base demand % 15%Total heating million Btu 22,353 3,879 2,325 1,535 426 2,563 284 2,266 2,273 1,348 1,836 1,490 2,128 - -Total peak heating load million Btu/h 11 2 1 1 0 1 0 1 1 1 1 1 1 - -Fuel consumption - unit - MWh MWh MWh MWh MWh MWh MWh MWh MWh MWh MWh MWh - -Fuel consumption - annual - 1,137 681 450 125 751 83 664 666 395 538 437 624 0 0Fuel rate - unit - $/kWh $/kWh $/kWh $/kWh $/kWh $/kWh $/kWh $/kWh $/kWh $/kWh $/kWh $/kWh - -Fuel rate - 0.143 0.143 0.143 0.143 0.143 0.143 0.143 0.143 0.143 0.143 0.143 0.143 0.100 0.100Fuel cost 939,430$ 163,035$ 97,721$ 64,496$ 17,890$ 107,710$ 11,927$ 95,223$ 95,532$ 56,653$ 77,174$ 62,616$ 89,452$ - -
End-use energy efficiency measures % 0%Net peak heating load million Btu/h 11 2 1 1 0 1 0 1 1 1 1 1 1 - -Net heating million Btu 22,353 3,879 2,325 1,535 426 2,563 284 2,266 2,273 1,348 1,836 1,490 2,128 - -
Estimate/TotalHeating pipe design criteriaDesign supply temperature °F 100Design return temperature °F 90Differential temperature °F 10Main heating distribution lineMain pipe network oversizing % 0%Pipe sections Load Length Pipe size Is the building cluster supplied by this pipe section? (yes/no)
million Btu/h ft mm 1 2 3 4 5 6 7 8 9 10 11 12 13 14Section 1 11.2 110 DN 300 Yes Yes Yes Yes Yes Yes Yes Yes Yes Yes Yes YesSection 2 4.1 330 DN 200 Yes Yes Yes Yes No No No No No No No NoSection 3 3.1 3,737 DN 175 Yes Yes No No No No No No No No No NoSection 4 0.8 1,099 DN 100 No No Yes No No No No No No No No NoSection 5 1.3 1,011 DN 125 No No No No Yes No No No No No No NoSection 6 7.4 330 DN 250 No No No Yes Yes Yes Yes Yes Yes Yes Yes YesSection 7 2.3 1,539 DN 150 No No No No No No Yes Yes No No No NoSection 8 1.1 1,649 DN 125 No No No No No No No Yes No No No NoSection 9 3.4 550 DN 175 No No No No No No No No Yes Yes Yes YesSection 10 1.7 1,099 DN 150 No No No No No No No No No Yes Yes NoSection 11 0.7 1,099 DN 100 No No No No No No No No No No Yes NoSection 12 1.1 1,539 DN 125 No No No No No No No No No No No YesSection 13 0.0Total pipe length for main distribution line ft 14,090Secondary heating distribution linesSecondary pipe network oversizing % 0% Secondary distribution pipes length per building clusterLength of pipe section ft 14,035 ft 2,135 1,400 1,190 210 1,960 140 1,715 1,575 665 1,260 735 1,050Pipe size mm DN 32 DN 32 DN 32 DN 32 DN 32 DN 32 DN 32 DN 32 DN 32 DN 32 DN 32 DN 32 - -District heating network cost
RETScreen Load & Network Design - Combined heating & cooling project
Multiple buildings - space heating
Heating project
Base case heating system
Proposed case energy efficiency measures
Proposed case district heating network
Total pipe length ft 28,125Costing method FormulaEnergy transfer station(s) connection type DirectEnergy transfer station(s) cost factor 0.00Main distribution line pipe cost factor 1.00Secondary distribution line pipe cost factor 0.90Exchange rate $/CAD 1.02
ETS and secondary distribution pipes costs per building clusterEnergy transfer station(s) cost -$ -$ -$ -$ -$ -$ -$ -$ -$ -$ -$ -$ -$ - -Secondary distribution line pipe cost 2,082,524$ 359,647$ 210,107$ 156,723$ 22,254$ 294,150$ 14,836$ 257,381$ 236,370$ 87,580$ 189,096$ 96,799$ 157,580$ - -Total building cluster connection cost 2,082,524$ 359,647$ 210,107$ 156,723$ 22,254$ 294,150$ 14,836$ 257,381$ 236,370$ 87,580$ 189,096$ 96,799$ 157,580$ - -
Main distribution line pipe cost by pipe size categoriesSummary of main distribution line pipe size mm DN 32 DN 40 DN 50 DN 65 DN 80 DN 100 DN 125 DN 150 DN 175 DN 200 DN 250 DN 300 DN 350 DN 400 +Summary of main distribution line pipe length ft - - - - - 2,198 4,198 2,638 4,286 330 330 110 - -Summary of main distribution line pipe cost 2,603,157$ - - - - - 321,664$ 700,105$ 493,716$ 889,811$ 75,180$ 88,645$ 34,037$ - -
Total district heating network cost 4,685,680$
2007-09-27RETScreen4-v182-45.xls

RETScreen Load & Network Design - Combined heating & cooling projectUnit
See technical note on cooling network design Building clusters1 2 3 4 5 6 7 8 9 10 11 12 13 14
Cooled floor area per building cluster ft² 762,000 122,000 78,000 59,400 12,600 99,200 8,400 87,700 81,700 39,900 66,000 44,100 63,000Number of buildings in building cluster building 401 61 40 34 6 56 4 49 45 19 36 21 30Fuel type Electricity Electricity Electricity Electricity Electricity Electricity Electricity Electricity Electricity Electricity Electricity Electricity Electricity ElectricityCoefficient of performance - seasonal - 3.00 3.00 3.00 3.00 3.00 3.00 3.00 3.00 3.00 3.00 3.00 3.00Cooling load calculationCooling load for building cluster (Btu/h)/ft² - 12 12 10 13 10 13 10 10 13 11 13 13Non-weather dependant cooling % 0%Total cooling RTh 1,602,412 273,100 174,605 110,807 30,556 185,052 20,371 163,599 152,406 96,760 135,431 106,946 152,779 - -Total peak cooling load RT 716 122 78 50 14 83 9 73 68 43 61 48 68 - -Fuel consumption - unit - MWh MWh MWh MWh MWh MWh MWh MWh MWh MWh MWh MWh - -Fuel consumption - annual - 320 205 130 36 217 24 192 179 113 159 125 179 0 0Fuel rate - unit - $/kWh $/kWh $/kWh $/kWh $/kWh $/kWh $/kWh $/kWh $/kWh $/kWh $/kWh $/kWh - -Fuel rate - 0.143 0.143 0.143 0.143 0.143 0.143 0.143 0.143 0.143 0.143 0.143 0.143Fuel cost 269,374$ 45,910$ 29,352$ 18,627$ 5,137$ 31,108$ 3,424$ 27,502$ 25,620$ 16,266$ 22,767$ 17,978$ 25,683$ - -
End-use energy efficiency measures % 0.0%Net peak cooling load RT 716 122 78 50 14 83 9 73 68 43 61 48 68 - -Net cooling RTh 1,602,412 273,100 174,605 110,807 30,556 185,052 20,371 163,599 152,406 96,760 135,431 106,946 152,779
Estimate/TotalCooling pipe design criteriaDesign supply temperature °F 45Design return temperature °F 55Differential temperature °F 10Main cooling distribution lineMain pipe network oversizing % 1%Pipe sections Load Length Pipe size Is the building cluster supplied by this pipe section? (yes/no)
RT ft mm 1 2 3 4 5 6 7 8 9 10 11 12 13 14Section 1 0 220 No No No No No No No No No No No NoSection 2 0 659 No No NoSection 3 0 7,474 No NoSection 4 0 2,198 NoSection 5 0 2,022 NoSection 6 0 659 No No No No No No No No NoSection 7 0 3,077 No NoSection 8 0 3,297 NoSection 9 0 1,099 No No No NoSection 10 0 2,198 No NoSection 11 0 2,198 NoSection 12 0 3,077 NoSection 13 0Total pipe length for main distribution line ft 28,178Secondary cooling distribution linesSecondary pipe network oversizing % 0% Secondary distribution pipes length per building clusterLength of pipe section ft 0 ftPipe size mm DN 32 DN 32 DN 32 DN 32 DN 32 DN 32 DN 32 DN 32 DN 32 DN 32 DN 32 DN 32 - -District cooling network cost
Multiple buildings - space cooling
Cooling project
Base case cooling system
Proposed case energy efficiency measures
Proposed case district cooling network
Total pipe length ft 28,178Costing method FormulaEnergy transfer station(s) connection type DirectEnergy transfer station(s) cost factorMain distribution line pipe cost factor 1.00Secondary distribution line pipe cost factor 0.90Exchange rate $/CAD 1.02
ETS and secondary distribution pipes costs per building clusterEnergy transfer station(s) cost -$ -$ -$ -$ -$ -$ -$ -$ -$ -$ -$ -$ -$ -$ -$ Secondary distribution line pipe cost -$ -$ -$ -$ -$ -$ -$ -$ -$ -$ -$ -$ -$ - -Total building cluster connection cost -$ -$ -$ -$ -$ -$ -$ -$ -$ -$ -$ -$ -$ - -
Main distribution line pipe cost by pipe size categoriesSummary of main distribution line pipe size mm DN 32 DN 40 DN 50 DN 65 DN 80 DN 100 DN 125 DN 150 DN 175 DN 200 DN 250 DN 300 DN 350 DN 400 +Summary of main distribution line pipe length ft - - - - - - - - - - - - - -Summary of main distribution line pipe cost -$ - - - - - - - - - - - - - -
Total district cooling network cost -$
2007-09-27RETScreen4-v182-45.xls

RETScreen Load & Network Design - Combined heating & cooling project
End-use energy efficiency measures % Power Heating CoolingNet peak electricity load kW 0 0 million Btu/h 11 RT 716Net electricity MWh 0 0 million Btu 22,353 RTh 1,602,412
Proposed case energy efficiency measuresProposed case load and energySystem peak loadSystem energy
0
500
1,000
1,500
2,000
2,500
Jan Feb Mar Apr May Jun Jul Aug Sep Oct Nov Dec
kW
Proposed case system load characteristics graph
Heating
Cooling
0
500
1,000
1,500
2,000
2,500
Jan Feb Mar Apr May Jun Jul Aug Sep Oct Nov Dec
kW
Base case system load characteristics graph
Heating
Cooling
2007-09-27RETScreen4-v182-45.xls

Unit Estimate % Incremental initial costs
Fuel type
Fuel consumption -
unitFuel
consumptionCapacity
(kW)
Energy delivered
(MWh)Peak load Natural gas 0 0
Emission Analysis
GHG emissionBase case tCO2 5,289.8Proposed case tCO2 1,543.0Gross annual GHG emission reduction tCO2 3,746.8GHG credits transaction fee %Net annual GHG emission reduction tCO2 3,746.8 is equivalent to 686
GHG reduction incomeGHG reduction credit rate $/tCO2
Financial parametersInflation rate % 1.8%Project life yr 35Debt ratio % 50%
Initial costsOther $Total initial costs $ 0
Incentives and grants $ 0.0%
Annual costs and debt paymentsO&M (savings) costs $Fuel cost - proposed case $ 352,601
$Total annual costs $ 1,121,186
Annual savings and incomeFuel cost - base case $ 1,208,805
$Total annual savings and income $ 1,208,805
Financial viabilityPre-tax IRR - assets % 1.3%Simple payback yr 12.8Equity payback yr 16.5
RETScreen Energy Model - Combined heating & cooling project
Cumulative cash flows graph
Cum
ulat
ive
cash
flow
s ($
)
Year
System design graph
Cars & light trucks not used
Financial Analysis
Proposed case system characteristics
Proposed case system summary
Show alternative units
-3,000,000
-2,500,000
-2,000,000
-1,500,000
-1,000,000
-500,000
00 1
2007-09-27RETScreen4-v182-45.xls

Method 1 Notes/Range Second currencyMethod 2 Second currency Notes/Range None
Cost allocation
Unit Quantity Unit cost Amount Relative costs
Feasibility study cost 1 60,000$ 60,000$ Sub-total: 60,000$ 0.6%
Development cost 1 60,000$ 60,000$ Sub-total: 60,000$ 0.6%
Engineering cost 1 300,000$ 300,000$ Sub-total: 300,000$ 2.8%
Spare parts % 1.0% 350,000$ 3,500$ Transportation project 4 3,000$ 12,000$ Training & commissioning p-d 4 500$ 2,000$ User-defined cost -$ Contingencies % 15.0% 9,471,580$ 1,420,737$ Interest during construction 6 month(s) 10,892,318$ -$ Sub-total: 1,438,237$ 13.2%
10,892,318$ 100.0%
Unit Quantity Unit cost Amount
O&M (savings) costs project -$ Parts & labour project 1 3,000$ 3,000$ User-defined cost -$ Contingencies % 15.0% 3,000$ 450$
Sub-total: 3,450$
Unit Year Unit cost AmountUser-defined cost -$
-$ End of project life cost -$
RETScreen Cost Analysis - Combined heating & cooling projectSettings
Initial costs (credits)Feasibility study
Development
Engineering
Periodic costs (credits)
Annual costs (credits)
Balance of system & miscellaneous
Total initial costs
O&M
2007-09-27RETScreen4-v182-45.xls

Emission Analysis
Method 1 Global warming potential of GHGMethod 2 25 tonnes CO2 = 1 tonne CH4 (IPCC 2007)
Method 3 298 tonnes CO2 = 1 tonne N2O (IPCC 2007)
Base case system GHG summary (Baseline)
Fuel mixCO2 emission
factorCH4 emission
factorN2O emission
factorFuel
consumptionGHG emission
factor GHG emissionFuel type % kg/GJ kg/GJ kg/GJ MWh tCO2/MWh tCO2Total 100.0% 8,430 0.628 5,289.8
Proposed case system GHG summary (Combined heating & cooling project)
Fuel mixCO2 emission
factorCH4 emission
factorN2O emission
factorFuel
consumptionGHG emission
factor GHG emissionFuel type % kg/GJ kg/GJ kg/GJ MWh tCO2/MWh tCO2
Total 100.0% 2,459 0.628 1,543.0Total 1,543.0
GHG emission reduction summary
Years of occurrence
Base caseGHG emission
Proposed caseGHG emission
Gross annualGHG emission
reductionGHG credits
transaction fee
Net annualGHG emission
reductionyr tCO2 tCO2 tCO2 % tCO2
1 to -1 5,289.8 1,543.0 3,746.8 3,746.8
Net annual GHG emission reduction 3,747 tCO2 is equivalent to 8,714 Barrels of crude oil not consumed
T&D losses
Combined heating & cooling project
RETScreen Emission Reduction Analysis - Combined heating & cooling project
2007-09-27RETScreen4-v182-45.xls

Financial parameters Project costs and savings/income summary Yearly cash flowsGeneral Year Pre-tax After-tax Cumulative
Fuel cost escalation rate % 1.0% 0.6% $ 60,000 # $ $ $Inflation rate % 3.5% 0.6% $ 60,000 0 -2,723,079 -2,723,079 -2,723,079Discount rate % 12.0% 2.8% $ 300,000 1 96,060 96,060 -2,627,019Project life yr 30 0.0% $ 0 2 104,583 104,583 -2,522,437
82.9% $ 9,034,080 3 113,188 113,188 -2,409,249Finance 0.0% $ 0 4 121,875 121,875 -2,287,374
Incentives and grants $ 0.0% $ 0 5 130,646 130,646 -2,156,728Debt ratio % 75.0% 0.0% $ 0 6 139,502 139,502 -2,017,226Debt $ 8,169,238 13.2% $ 1,438,237 7 148,442 148,442 -1,868,784Equity $ 2,723,079 100.0% $ 10,892,318 8 157,468 157,468 -1,711,316Debt interest rate % 6.90% 9 166,580 166,580 -1,544,736Debt term yr 20 $ 0 10 175,780 175,780 -1,368,956Debt payments $/yr 765,135 11 185,068 185,068 -1,183,888
12 194,444 194,444 -989,444$ 3,450 13 203,909 203,909 -785,535
Income tax analysis $ 352,601 14 213,465 213,465 -572,070Effective income tax rate % $ 765,135 15 223,111 223,111 -348,959Loss carryforward? $ 1,121,186 16 232,849 232,849 -116,110Depreciation method 17 242,679 242,679 126,569Half-year rule - year 1 yes/no Yes 18 252,603 252,603 379,172Depreciation tax basis % $ 0 19 262,620 262,620 641,792Depreciation rate % $ 0 20 272,732 272,732 914,523Depreciation period yr 15 $ 0 21 1,048,074 1,048,074 1,962,597Tax holiday available? yes/no Yes 22 1,058,377 1,058,377 3,020,974Tax holiday duration yr 23 1,068,777 1,068,777 4,089,751
$ 1,208,805 24 1,079,274 1,079,274 5,169,025Annual income $ 0 25 1,089,870 1,089,870 6,258,896Electricity export income $ 0 26 1,100,565 1,100,565 7,359,461
Electricity exported to grid MWh 0 $ 0 27 1,111,360 1,111,360 8,470,820Electricity export rate $/MWh 0.00 $ 0 28 1,122,255 1,122,255 9,593,075Electricity export income $ 0 $ 0 29 1,133,252 1,133,252 10,726,327Electricity export escalation rate % $ 1,208,805 30 1,144,350 1,144,350 11,870,677
31 0 0 11,870,677GHG reduction income 32 0 0 11,870,677
tCO2/yr 0 33 0 0 11,870,677Net GHG reduction tCO2/yr 3,747 Financial viability 34 0 0 11,870,677Net GHG reduction - 30 yrs tCO2 112,404 % 8.9% 35 0 0 11,870,677GHG reduction credit rate $/tCO2 % 1.3% 36 0 0 11,870,677GHG reduction income $ 0 37 0 0 11,870,677GHG reduction credit duration yr % 8.9% 38 0 0 11,870,677Net GHG reduction - 0 yrs tCO2 0 % 1.3% 39 0 0 11,870,677GHG reduction credit escalation rate % 40 0 0 11,870,677
yr 12.8 41 0 0 11,870,677Customer premium income (rebate) yr 16.5 42 0 0 11,870,677
Electricity premium (rebate) % 43 0 0 11,870,677Electricity premium income (rebate) $ 0 $ -968,454 44 0 0 11,870,677Heating premium (rebate) % $/yr -120,227 45 0 0 11,870,677Heating premium income (rebate) $ 0 46 0 0 11,870,677Cooling premium (rebate) % 0.64 47 0 0 11,870,677Cooling premium income (rebate) $ 0 1.13 48 0 0 11,870,677Customer premium income (rebate) $ 0 $/MWh 49 0 0 11,870,677
$/tCO2 32 50 0 0 11 870 677
Power system
Pre-tax IRR - equityPre-tax IRR - assets
Electricity export incomeGHG reduction income - 0 yrs
GHG reduction cost
Net Present Value (NPV)Annual life cycle savings
Benefit-Cost (B-C) ratioDebt service coverageEnergy production cost
Simple paybackEquity payback
Total annual costsDeclining balance
O&MFuel cost - proposed case
RETScreen Financial Analysis - Combined heating & cooling project
No
Annual costs and debt payments
Cooling system
Energy efficiency measuresUser-defined
Balance of system & misc.
Incentives and grants
Initial costsFeasibility studyDevelopmentEngineering
Periodic costs (credits)
Heating system
After-tax IRR - equityAfter-tax IRR - assets
Total initial costs
Customer premium income (rebate)Other income (cost) - yrsCE production income - yrsTotal annual savings and income
Annual savings and incomeFuel cost - base case
Debt payments - 20 yrs
End of project life - cost
$/tCO2 32 50 0 0 11,870,677Other income (cost)
Energy MWh Cumulative cash flows graphRate $/MWhOther income (cost) $ 0Duration yrEscalation rate %
Clean Energy (CE) production income CE production MWh 6,551CE production credit rate $/kWhCE production income $ 0CE production credit duration yrCE production credit escalation rate %
Fuel type
Energy delivered
(MWh) Clean energy1 Electricity 6,551 Yes2 Electricity 5,635 No3 No4 No5 No6 No7 No8 No9 No# No# No# No# No# No# No# No# No# No Year
Cum
ulat
ive
cash
flow
s ($
)
GHG reduction cost
-4,000,000
-2,000,000
0
2,000,000
4,000,000
6,000,000
8,000,000
10,000,000
12,000,000
14,000,000
0 1 2 3 4 5 6 7 8 9 10 11 12 13 14 15 16 17 18 19 20 21 22 23 24 25 26 27 28 29 30
2007-09-27RETScreen4-v182-45.xls

Project information
Project nameProject location
Prepared forPrepared by
Project type
Analysis type
Heating value reference
Show settings
Language - LangueUser manual
CurrencySymbol
Units
Climate data location
Show data
UnitClimate data
location Project locationLatitude ˚N 38.8 38.8Longitude ˚E -76.9 -76.9Elevation ft 282 282H ti d i t t °F 18 3
See project database
Select climate data location
English - Anglais
$
Imperial units
Andrews AFB
Charles County, MD
Charles County Dep-t of PlanningGolder Associates Ltd.
Method 2
Site reference conditions
Higher heating value (HHV)
English - Anglais
Clean Energy Project Analysis Software
Combined heating & cooling
Homefield Phase II - Multi-res Buildings
Heating design temperature °F 18.3Cooling design temperature °F 91.0Earth temperature amplitude °F 35.2
Month Air temperatureRelative humidity
Daily solar radiation - horizontal
Atmospheric pressure Wind speed
Earth temperature
Heatingdegree-days
Coolingdegree-days
°F % kWh/m²/d kPa mph °F °F-d °F-dJanuary 34.5 64.9% 1.96 101.2 9.0 33.5 926 0February 37.6 62.3% 2.79 101.2 9.0 37.1 751 0March 45.0 60.6% 3.76 101.0 9.8 45.1 603 0April 54.9 61.4% 4.86 100.8 9.0 56.8 286 146May 63.9 68.4% 5.38 100.9 7.4 67.1 17 430June 72.5 70.6% 5.72 100.8 6.7 75.6 0 675July 77.4 70.5% 5.64 100.8 6.5 78.9 0 848August 75.2 72.7% 5.15 101.0 6.3 76.6 0 781September 68.2 73.4% 4.23 101.1 6.5 69.9 0 545October 57.0 72.0% 3.19 101.2 6.7 58.5 229 218November 48.0 67.5% 2.19 101.2 7.8 47.7 491 0December 38.7 66.0% 1.81 101.3 8.3 37.2 798 0Annual 56.2 67.6% 3.90 101.0 7.7 57.1 4,101 3,643Measured at ft 32.8 0.0
RETScreen4 2010-09-22 © Minister of Natural Resources Canada 1997-2010. NRCan/CanmetENERGY
Complete Load & Network sheet
Homefield Phase II - Multi-res BuildingsCharles County, MD
1/4/2012Homefield Phase II - Multi-res Buildings.xlsm

Unit
See technical note on heating network design Building clusters1 2 3 4 5 6 7 8 9 10 11 12 13 14
Heated floor area per building cluster ft² 246,400 96,000 34,000 48,000 20,400 48,000Number of buildings in building cluster building 16 4 5 2 3 2Fuel type Electricity Electricity Electricity Electricity Electricity Natural gas - m³ Natural gas - m³ Natural gas - m³ Natural gas - m³ Natural gas - m³ Natural gas - m³ Natural gas - m³ Natural gas - m³ Natural gas - m³Seasonal efficiency % - 100% 100% 100% 100% 100%Heating load calculationHeating load for building cluster (Btu/h)/ft² - 12 12 12 12 12Domestic hot water heating base demand % 15%Total heating million Btu 5,876 2,289 811 1,145 487 1,145 - - - - - - - - -Total peak heating load million Btu/h 3 1 0 1 0 1 - - - - - - - - -Fuel consumption - unit - MWh MWh MWh MWh MWh - - - - - - - - -Fuel consumption - annual - 671 238 335 143 335 0 0 0 0 0 0 0 0 0Fuel rate - unit - $/kWh $/kWh $/kWh $/kWh $/kWh - - - - - - - - -Fuel rate - 0.096 0.096 0.096 0.096 0.096Fuel cost 165,758$ 64,581$ 22,872$ 32,291$ 13,723$ 32,291$ - - - - - - - - -
End-use energy efficiency measures % 0%Net peak heating load million Btu/h 3 1 0 1 0 1 - - - - - - - - -Net heating million Btu 5,876 2,289 811 1,145 487 1,145 - - - - - - - - -
Estimate/TotalHeating pipe design criteriaDesign supply temperature °F 100Design return temperature °F 90Differential temperature °F 10Main heating distribution lineMain pipe network oversizing %Pipe sections Load Length Pipe size Is the building cluster supplied by this pipe section? (yes/no)
million Btu/h ft mm 1 2 3 4 5 6 7 8 9 10 11 12 13 14Section 1 3.0 110 DN 175 Yes Yes Yes Yes Yes YesSection 2 1.2 440 DN 125 YesSection 3 1.8 1,539 DN 150 Yes Yes Yes YesSection 4 0.6 330 DN 100 YesSection 5 0.2 220 DN 65 YesSection 6 0.6 550 DN 100 YesSection 7 0.0Section 8 0.0Section 9 0.0Section 10 0.0Section 11 0.0Section 12 0.0Section 13 0.0Total pipe length for main distribution line ft 3,189Secondary heating distribution linesSecondary pipe network oversizing % Secondary distribution pipes length per building clusterLength of pipe section ft 810 ft 240 165 120 165 120Pipe size mm DN 80 DN 50 DN 80 DN 50 DN 80 - - - - - - - - -District heating network cost
RETScreen Load & Network Design - Combined heating & cooling project
Multiple buildings - space heating
Heating project
Base case heating system
Proposed case energy efficiency measures
Proposed case district heating network
Total pipe length ft 3,999Costing method FormulaEnergy transfer station(s) connection type DirectEnergy transfer station(s) cost factorMain distribution line pipe cost factor 0.90Secondary distribution line pipe cost factor 0.80Exchange rate $/CAD 1.02
ETS and secondary distribution pipes costs per building clusterEnergy transfer station(s) cost -$ -$ -$ -$ -$ -$ - - - - - - - - -Secondary distribution line pipe cost 93,272$ 32,174$ 17,244$ 14,117$ 15,619$ 14,117$ - - - - - - - - -Total building cluster connection cost 93,272$ 32,174$ 17,244$ 14,117$ 15,619$ 14,117$ - - - - - - - - -
Main distribution line pipe cost by pipe size categoriesSummary of main distribution line pipe size mm DN 32 DN 40 DN 50 DN 65 DN 80 DN 100 DN 125 DN 150 DN 175 DN 200 DN 250 DN 300 DN 350 DN 400 +Summary of main distribution line pipe length ft - - - 220 - 880 440 1,539 110 - - - - -Summary of main distribution line pipe cost 487,433$ - - - 23,429$ - 116,467$ 66,359$ 260,526$ 20,653$ - - - - -
Total district heating network cost 580,705$
Homefield Phase II - Multi-res BuildingsCharles County, MD
1/4/2012Homefield Phase II - Multi-res Buildings.xlsm

RETScreen Load & Network Design - Combined heating & cooling projectUnit
See technical note on cooling network design Building clusters1 2 3 4 5 6 7 8 9 10 11 12 13 14
Cooled floor area per building cluster ft² 246,400 96,000 34,000 48,000 20,400 48,000Number of buildings in building cluster building 16 4 5 2 3 2Fuel type Electricity Electricity Electricity Electricity Electricity Electricity Electricity Electricity Electricity Electricity Electricity Electricity Electricity ElectricityCoefficient of performance - seasonal - 3.00 3.00 3.00 3.00 3.00Cooling load calculationCooling load for building cluster (Btu/h)/ft² - 9 9 9 9 9Non-weather dependant cooling % 0%Total cooling RTh 413,680 161,174 57,082 80,587 34,249 80,587 - - - - - - - - -Total peak cooling load RT 185 72 26 36 15 36 - - - - - - - - -Fuel consumption - unit - MWh MWh MWh MWh MWh - - - - - - - - -Fuel consumption - annual - 189 67 94 40 94 0 0 0 0 0 0 0 0 0Fuel rate - unit - $/kWh $/kWh $/kWh $/kWh $/kWh - - - - - - - - -Fuel rate - 0.143 0.143 0.143 0.143 0.143Fuel cost 69,542$ 27,094$ 9,596$ 13,547$ 5,758$ 13,547$ - - - - - - - - -
End-use energy efficiency measures % 0.0%Net peak cooling load RT 185 72 26 36 15 36 - - - - - - - - -Net cooling RTh 413,680 161,174 57,082 80,587 34,249 80,587
Estimate/TotalCooling pipe design criteriaDesign supply temperature °F 45Design return temperature °F 55Differential temperature °F 10Main cooling distribution lineMain pipe network oversizing %Pipe sections Load Length Pipe size Is the building cluster supplied by this pipe section? (yes/no)
RT ft mm 1 2 3 4 5 6 7 8 9 10 11 12 13 14Section 1 0 110 No No No No NoSection 2 0 440 NoSection 3 0 1,539 No No No NoSection 4 0 330 NoSection 5 0 220 NoSection 6 0 550 NoSection 7 0Section 8 0Section 9 0Section 10 0Section 11 0Section 12 0Section 13 0Total pipe length for main distribution line ft 3,189Secondary cooling distribution linesSecondary pipe network oversizing % Secondary distribution pipes length per building clusterLength of pipe section ft 0 ftPipe size mm DN 65 DN 50 DN 65 DN 50 DN 65 - - - - - - - - -District cooling network cost
Multiple buildings - space cooling
Proposed case energy efficiency measures
Proposed case district cooling network
Cooling project
Base case cooling system
Total pipe length ft 3,189Costing method FormulaEnergy transfer station(s) connection type IndirectEnergy transfer station(s) cost factorMain distribution line pipe cost factorSecondary distribution line pipe cost factorExchange rate $/CAD
ETS and secondary distribution pipes costs per building clusterEnergy transfer station(s) cost -$ -$ -$ -$ -$ -$ -$ -$ -$ -$ -$ -$ -$ -$ -$ Secondary distribution line pipe cost -$ -$ -$ -$ -$ -$ - - - - - - - - -Total building cluster connection cost -$ -$ -$ -$ -$ -$ - - - - - - - - -
Main distribution line pipe cost by pipe size categoriesSummary of main distribution line pipe size mm DN 32 DN 40 DN 50 DN 65 DN 80 DN 100 DN 125 DN 150 DN 175 DN 200 DN 250 DN 300 DN 350 DN 400 +Summary of main distribution line pipe length ft - - - - - - - - - - - - - -Summary of main distribution line pipe cost -$ - - - - - - - - - - - - - -
Total district cooling network cost -$
Homefield Phase II - Multi-res BuildingsCharles County, MD
1/4/2012Homefield Phase II - Multi-res Buildings.xlsm

RETScreen Load & Network Design - Combined heating & cooling project
End-use energy efficiency measures % Power Heating CoolingNet peak electricity load kW 0 0 million Btu/h 3 RT 185Net electricity MWh 0 0 million Btu 5,876 RTh 413,680System energy
Proposed case load and energySystem peak load
Proposed case energy efficiency measures
0
100
200
300
400
500
600
Jan Feb Mar Apr May Jun Jul Aug Sep Oct Nov Dec
kW
Proposed case system load characteristics graph
Heating
Cooling
0
100
200
300
400
500
600
Jan Feb Mar Apr May Jun Jul Aug Sep Oct Nov Dec
kW
Base case system load characteristics graph
Heating
Cooling
Homefield Phase II - Multi-res BuildingsCharles County, MD
1/4/2012Homefield Phase II - Multi-res Buildings.xlsm

Base load cooling systemTechnology Show figureFuel typeFuel rate $/MWh 143.400Capacity kW 650.0 100.0% 800,000$ Coefficient of performance - seasonal 4.25ManufacturerModel 1 unit(s)Cooling delivered RTh 413,680 100.0%Peak load cooling systemTechnology
Incremental initial costsSystem selectionBase load heating systemTechnology
Fuel selection methodFuel type Complete Tools sheetFuel rate $/MWh 143.400
Heat pump
Capacity kW 900.0 103.9% -$ Heating delivered million Btu 5,876 100.0%ManufacturerModel 1 unit(s)Seasonal efficiency % 520%Fuel required million Btu/h 0.6
Unit Estimate % Incremental initial costs
Base load heating systemTechnology Heat pumpCapacity million Btu/h 3.1 103.9%Heating delivered million Btu 5,876 100.0%Peak load heating systemTechnology Not requiredBack-up heating system (optional)TechnologyCapacity kW
Base load cooling systemTechnology Heat pumpFuel type ElectricityCapacity RT 185 100.0%Cooling delivered RTh 413,680 100.0%Back-up cooling system (optional)TechnologyCapacity kW
Fuel type
Fuel consumption -
unitFuel
consumptionCapacity
(kW)
Energy delivered
(MWh)HeatingBase load Electricity MWh 331 900 1,722
Total 900 1,722Cooling
Electricity
RETScreen Energy Model - Combined heating & cooling project
Heat pumpElectricity
Not required
Heat pump
Single fuel
Base load system
System design graph
Proposed case heating system
Proposed case system characteristicsHeating
Cooling
Proposed case system summary
Show alternative units
See product database
Incremental initial costsProposed case cooling system
See product database
0%
50%
100%
150%
Capacity Energy delivered
Base
0%
100%
200%
Capacity Energy delivered
Base
Base load Electricity MWh 342 650 1,455Total 650 1,455
Homefield Phase II - Multi-res BuildingsCharles County, MD
1/4/2012Homefield Phase II - Multi-res Buildings.xlsm

Method 1 Notes/Range Second currencyMethod 2 Second currency Notes/Range None
Cost allocation
Unit Quantity Unit cost Amount Relative costs
Feasibility study cost 1 15,000$ 15,000$ Sub-total: 15,000$ 0.8%
Development cost 1 45,000$ 45,000$ Sub-total: 45,000$ 2.4%
Engineering cost 1 65,000$ 65,000$ Sub-total: 65,000$ 3.4%
Base load - Heat pump kW 900.0 100$ 90,000$ Energy transfer station(s) building 16 - -$ Main heating distribution line pipe ft 3,189 - 487,433$ Secondary heating distribution line pipe ft 810 - 93,272$ Energy efficiency measures project -$ Drilling & grouting cost 100 8,400$ 840,000$
-$ Sub-total: 1,510,705$ 79.9%
Base load - Heat pump kW 650.0 -$ Energy transfer station(s) building 16 - -$ Main cooling distribution line pipe ft 3,189 - -$ Secondary cooling distribution line pipe ft 0 - -$ Energy efficiency measures project -$ User-defined cost -$
-$ Sub-total: -$ 0.0%
Spare parts % 1.0% 90,000$ 900$ Transportation project 2 3,000$ 6,000$ Training & commissioning p-d 2 500$ 1,000$ User-defined cost -$ Contingencies % 15.0% 1,643,605$ 246,541$ Interest during construction 6 month(s) 1,890,146$ -$ Sub-total: 254,441$ 13.5%
1,890,146$ 100.0%
Unit Quantity Unit cost Amount
Parts & labour project 1 3,000$ 3,000$ User-defined cost -$ Contingencies % 15.0% 3,000$ 450$
Sub-total: 3,450$
Electricity MWh 674 143.400$ 96,580$
Sub-total: 96,580$
Unit Quantity Unit cost Amount
Electricity MWh 2,207 106.610$ 235,300$
Sub-total: 235,300$
Unit Year Unit cost AmountUser-defined cost -$
-$ End of project life cost -$
RETScreen Cost Analysis - Combined heating & cooling projectSettings
Initial costs (credits)Feasibility study
Development
Engineering
Fuel cost - base case
Heating system
Periodic costs (credits)
Annual costs (credits)
Annual savings
Cooling system
Balance of system & miscellaneous
Total initial costs
O&M
Fuel cost - proposed case
Homefield Phase II - Multi-res BuildingsCharles County, MD
1/4/2012Homefield Phase II - Multi-res Buildings.xlsm

Emission Analysis
Method 1 Global warming potential of GHGMethod 2 25 tonnes CO2 = 1 tonne CH4 (IPCC 2007)
Method 3 298 tonnes CO2 = 1 tonne N2O (IPCC 2007)
Base case electricity system (Baseline)
GHG emissionfactor
(excl. T&D)T&D
lossesGHG emission
factortCO2/MWh % tCO2/MWh
All types 0.584 7.0% 0.628
Baseline changes during project life Change in GHG emission factor % -10.0%
Base case system GHG summary (Baseline)
Fuel mixCO2 emission
factorCH4 emission
factorN2O emission
factorFuel
consumptionGHG emission
factor GHG emissionFuel type % kg/GJ kg/GJ kg/GJ MWh tCO2/MWh tCO2Electricity 100.0% 2,207 0.628 1,385.0Total 100.0% 2,207 0.628 1,385.0
Proposed case system GHG summary (Combined heating & cooling project)
Fuel mixCO2 emission
factorCH4 emission
factorN2O emission
factorFuel
consumptionGHG emission
factor GHG emissionFuel type % kg/GJ kg/GJ kg/GJ MWh tCO2/MWh tCO2Electricity 100.0% 674 0.628 422.6Total 100.0% 674 0.628 422.6
Total 422.6
GHG emission reduction summary
Years of occurrence
Base caseGHG emission
Proposed caseGHG emission
Gross annualGHG emission
reductionGHG credits
transaction fee
Net annualGHG emission
reductionyr tCO2 tCO2 tCO2 % tCO2
1 to -1 1,385.0 422.6 962.4 962.4
Net annual GHG emission reduction 962 tCO2 is equivalent to 176 Cars & light trucks not used
Country - region Fuel typeUnited States of America
T&D losses
Combined heating & cooling project
RETScreen Emission Reduction Analysis - Combined heating & cooling project
Homefield Phase II - Multi-res BuildingsCharles County, MD
1/4/2012Homefield Phase II - Multi-res Buildings.xlsm

Financial parameters Project costs and savings/income summary Yearly cash flowsGeneral Year Pre-tax After-tax Cumulative
Fuel cost escalation rate % 1.0% 0.8% $ 15,000 # $ $ $Inflation rate % 2.0% 2.4% $ 45,000 0 -1,890,146 -1,890,146 -1,890,146Discount rate % 12.0% 3.4% $ 65,000 1 136,574 136,574 -1,753,572Project life yr 30 0.0% $ 0 2 137,890 137,890 -1,615,681
79.9% $ 1,510,705 3 139,219 139,219 -1,476,462Finance 0.0% $ 0 4 140,561 140,561 -1,335,901
Incentives and grants $ 0.0% $ 0 5 141,914 141,914 -1,193,987Debt ratio % 0.0% 0.0% $ 0 6 143,281 143,281 -1,050,706Debt $ 0 13.5% $ 254,441 7 144,660 144,660 -906,046Equity $ 1,890,146 100.0% $ 1,890,146 8 146,052 146,052 -759,994Debt interest rate % 6.90% 9 147,457 147,457 -612,536Debt term yr 20 $ 0 10 148,876 148,876 -463,661Debt payments $/yr 0 11 150,307 150,307 -313,354
12 151,752 151,752 -161,602$ 3,450 13 153,210 153,210 -8,393
Income tax analysis $ 96,580 14 154,681 154,681 146,289Effective income tax rate % $ 0 15 156,167 156,167 302,456Loss carryforward? $ 100,030 16 157,666 157,666 460,122Depreciation method 17 159,179 159,179 619,301Half-year rule - year 1 yes/no Yes 18 160,706 160,706 780,007Depreciation tax basis % $ 0 19 162,247 162,247 942,254Depreciation rate % $ 0 20 163,803 163,803 1,106,057Depreciation period yr 15 $ 0 21 165,373 165,373 1,271,430Tax holiday available? yes/no No 22 166,957 166,957 1,438,387Tax holiday duration yr 23 168,556 168,556 1,606,943
$ 235,300 24 170,170 170,170 1,777,113Annual income $ 0 25 171,799 171,799 1,948,912Electricity export income $ 0 26 173,442 173,442 2,122,354
Electricity exported to grid MWh 0 $ 0 27 175,101 175,101 2,297,455Electricity export rate $/MWh 0.00 $ 0 28 176,775 176,775 2,474,230Electricity export income $ 0 $ 0 29 178,464 178,464 2,652,694Electricity export escalation rate % $ 235,300 30 180,169 180,169 2,832,863
31 0 0 2,832,863GHG reduction income 32 0 0 2,832,863
tCO2/yr 0 33 0 0 2,832,863Net GHG reduction tCO2/yr 962 Financial viability 34 0 0 2,832,863Net GHG reduction - 30 yrs tCO2 28,871 % 6.9% 35 0 0 2,832,863GHG reduction credit rate $/tCO2 % 6.9% 36 0 0 2,832,863GHG reduction income $ 0 37 0 0 2,832,863GHG reduction credit duration yr % 6.9% 38 0 0 2,832,863Net GHG reduction - 0 yrs tCO2 0 % 6.9% 39 0 0 2,832,863GHG reduction credit escalation rate % 40 0 0 2,832,863
yr 14.0 41 0 0 2,832,863Customer premium income (rebate) yr 13.1 42 0 0 2,832,863
Electricity premium (rebate) % 43 0 0 2,832,863Electricity premium income (rebate) $ 0 $ -707,867 44 0 0 2,832,863Heating premium (rebate) % $/yr -87,877 45 0 0 2,832,863Heating premium income (rebate) $ 0 46 0 0 2,832,863Cooling premium (rebate) % 0.63 47 0 0 2,832,863Cooling premium income (rebate) $ 0 No debt 48 0 0 2,832,863Customer premium income (rebate) $ 0 $/MWh 49 0 0 2,832,863
$/tCO2 91 50 0 0 2 832 863
Power system
Pre-tax IRR - equityPre-tax IRR - assets
Electricity export incomeGHG reduction income - 0 yrs
GHG reduction cost
Net Present Value (NPV)Annual life cycle savings
Benefit-Cost (B-C) ratioDebt service coverageEnergy production cost
Debt payments - 20 yrs
Equity payback
Total annual costsDeclining balance
After-tax IRR - assets
Simple payback
Periodic costs (credits)
After-tax IRR - equity
Customer premium income (rebate)Other income (cost) - yrsCE production income - yrsTotal annual savings and income
Annual savings and incomeFuel cost - base case
End of project life - cost
RETScreen Financial Analysis - Combined heating & cooling project
No
Annual costs and debt payments
Cooling system
Energy efficiency measuresUser-defined
Balance of system & misc.
Incentives and grants
Initial costsFeasibility studyDevelopmentEngineering
Heating system
Total initial costs
O&MFuel cost - proposed case
$/tCO2 91 50 0 0 2,832,863Other income (cost)
Energy MWh Cumulative cash flows graphRate $/MWhOther income (cost) $ 0Duration yrEscalation rate %
Clean Energy (CE) production income CE production MWh 1,722CE production credit rate $/kWhCE production income $ 0CE production credit duration yrCE production credit escalation rate %
Fuel type
Energy delivered
(MWh) Clean energy1 Electricity 1,722 Yes2 Electricity 1,455 No3 No4 No5 No6 No7 No8 No9 No# No# No# No# No# No# No# No# No# No Year
Cum
ulat
ive
cash
flow
s ($
)
GHG reduction cost
-3,000,000
-2,000,000
-1,000,000
0
1,000,000
2,000,000
3,000,000
4,000,000
0 1 2 3 4 5 6 7 8 9 10 11 12 13 14 15 16 17 18 19 20 21 22 23 24 25 26 27 28 29 30
Homefield Phase II - Multi-res BuildingsCharles County, MD
1/4/2012Homefield Phase II - Multi-res Buildings.xlsm

APPLICATIONS OF GEOTHERMAL ENERGY
January 2012 Report No. 10-1151-0408 - 3 60
APPENDIX B Institutional Building Geothermal Case Studies

APPLICATIONS OF GEOTHERMAL ENERGY
January 2012 Report No. 10-1151-0408 - 3 61
Institutional Building - Geothermal Retrofit Case Brantford Collegiate Institute, 2010-2011 In 2007, Brantford Collegiate Institute, Brantford, Ontario was demolished except for the historic front facade and structure immediately behind it and a separate wing of the school built in 1963. A completely new building was built behind the beautiful old facade. Geothermal was not used in this rebuild. However, in turn, the 1963 wing of the school was refurbished, the HVAC system was completely removed, the structure remediated and a 150 ton closed-loop vertical geothermal system was installed in the sports field behind the building and brought in to a new central energy plant in the basement of the school. New heat pumps were installed throughout the building and new ductwork was installed as was a connecting hydronic water pipe system. In September 2011, the refurbished wing of the school opened to students.
Figure 6: Brantford Collegiate Institute, 1963 wing and 1901 facade
Economic summary of the project:
Life cycle costing of a geothermal system does not include renewal costs for the bore field, which represents over 60% of the total geothermal investment, since the life expectancy is theoretically well over 50 years, as long as the building remains. Therefore lifecycle costs of a geothermal system are substantially lower when compared to a conventional heating system.
Combining geothermal with high efficiency energy recovery yielded a simple payback of less than 4 years.
Environmentally, carbon dioxide emissions were reduced by at least 74%, over those of a fuel based system.
Some of the geothermal system specifications included:
A closed loop vertical borehole geothermal system
A geothermal bore field, tied into a water-to-water heat pump plant capable of providing low temperature heating water and chilled water

APPLICATIONS OF GEOTHERMAL ENERGY
January 2012 Report No. 10-1151-0408 - 3 62
Information provided by the project mechanical engineers of record: peak design load parameters, expressed in peak heating output (Btu/hr), peak cooling output (Btu/hr), supply water temperatures for heating and cooling and design flow rates
Recommended Energy Recovery Ventilation (ERV) equipment was installed decreasing the heating capacity required by 55% and the cooling capacity required by 33%.
Plant capacity with ERV was 1,700,000 btu/hr heating or approximately 150-ton capacity heat pump system
Warranty was 1-year parts and labour for entire system; 10-year against ground loop leaks, equipment manufacturer parts warranty after the first year
Ground loop installation cost did not included surface remediation
Project Cost: $1,523,600 before taxes
Financial options included outright purchase and an offer from a private energy supply and service firm to own and operate the geothermal system – BCI opted to purchase outright.
Figure 7: Brantford Collegiate Institute, Drilling the School Yard
Figure 8: Headers ready for building tie-in Figure 9: BCI Drilling Operations

APPLICATIONS OF GEOTHERMAL ENERGY
January 2012 Report No. 10-1151-0408 - 3 63
Table 6: Summary Economic Analysis – BCI Geothermal System
Table 7: Summary Financial Analysis – BCI Geothermal System
Engineering Analysis: Conventional Geothermal Geothermal w/ERV
Heating Plant Cap. (kbtu/hr) 4000 4000 1700Heating Plant Eff. 85% 490% 490%Cooling Plant Cap. (tons) 200 200 133Cooling Plant Eff. COP 4.4 COP 6.7 COP 6.7Heating Annual Energy (MMBTU) 4800 4800 2500Cooling Annual Energy (MMBTU) 1800 1800 1200
Heating energy 160000 m3 NG 287000 kWh 150000 kWhCooling energy 120000 kWh 78700 kWh 52500 kWh
Annual Energy Costs $.45/m3, $.10/kWh $84,000 36,570$ 20,250$ Savings (comp. to conv.) 47,430$ 63,750$
Capital Cost $1,100,000 2,100,000$ 1,350,000$ Incremental Costs (comp. to conv.) 1,000,000$ 250,000$
Simple Payback (yrs) 21 3.9
CO2 emissions from elec (tonnes) 304CO2 emissions from NG (tonnes) 28.8 87.8 48.6Total CO2 emissions (tonnes) 332.8 87.8 48.6CO2 Emission Reduction (tonnes) 245 284.2
Financial Analysis: Conventional Geothermal Geothermal w/ERVAssumptions
Geothermal System InputsHeating Capacity Required (tons) 52.1% GwERV/G 240 125Cooling Capacity Required (tons) 66.7% GwERV/G 200 133Capacity of Geo Field (tons) assume max. cool ing i s not required 240 125Boreholes (3 tons/ bore (540' deep) 80 42Drilling - vertical feet 43200 22500Cost/vertical foot (incl. geo engineering, TCT, controls, water pumps, valves) 29.58$ 34.41$
CostsGeo System (incl. geo engineering, TCT, controls, water pumps, valves) 1,277,640$ 774,281$ W/W HPs (18% MU) 622,200$ 311,100$ ERV (18% MU) -$ 362,950$ Contingency 0.05 91,760$ 75,171$ Total 1,100,000$ 1,991,600$ 1,523,503$ Incremental Cost to Client (comp. to conv.) 891,600$ 423,503$
Cost OffsetsEnergy Cost Savings 47,430$ 63,750$ Simple Payback, years 18.8 6.6Reduced Maintenance 15,000$ 15,000$ Total Cash Offset 62,430$ 78,750$ Payback incl. Maint., years 14.3 5.4Avoid Equipment Replacement at life (2.5% inflation, 15 year life) 104,000$ 104,000$ Total Cost Offsets 166,430$ 182,750$ Payback incl. maint and equip lifecycle costs, years 5.4 2.3

APPLICATIONS OF GEOTHERMAL ENERGY
January 2012 Report No. 10-1151-0408 - 3 64
Table 8: Summary of Financial Options – BCI Geothermal System

APPLICATIONS OF GEOTHERMAL ENERGY
January 2012 Report No. 10-1151-0408 - 3 65
Institutional Building – Geothermal Carbon Neutral Case Study Walden Public School, 2009 Walden Public School, in Lively, Ontario (near Sudbury) was built in 2009 by Rainbow District School Board, to be North America’s first Carbon Neutral School.
Prior Experience Rainbow District School Board built its first geothermal energy school, Valley View Public School in Sudbury Ontario, in 2006. The school teaches French immersion, K-8. The geothermal system is a large horizontal system installed under the extended playground, that feeds a hybrid geothermal water-to-water heat pump and natural gas fired boiler HVAC system. An automated building comfort control system, senses heating needs and controls the operation of the hybrid system, to maximize the energy efficiency. A hybrid geo/natural gas system was chosen because the school uses heating only and a hybrid system offered a way to balance the energy use in the geothermal system.
Learned Design Principles To be truly carbon neutral, Walden PS needed to generate its own electricity as well as its own heat energy. Since the school is not open in the summer, cooling was not a design criterion. Geothermal energy was a natural for heating, however a geo system uses some electricity and electricity was also required for lights, computers, air handlers, etc.
So the first principle of design became, reduce the electricity load wherever possible, including in the geo system. Walden used natural light, in-floor radiant heating, instant water heaters, daylight and motion sensors on lighting controls and numerous other techniques to reduce the electricity intensity of the building from the average 30kW/sq. ft. to 5kW/sq. ft.
In order to minimize the energy consumption of the building, waste heat from one system needed to be captured and sent to another system. Architectural materials needed to be chosen for their heating or cooling properties and electricity use had to be rationed, in favour of manual or window R-value choices. So the second principal of design became design integration.
The third design principal became innovation. For Walden this meant, “It can’t cost more.” So a fixed stage became a retractable one, floors became polished cement but smart boards in every classroom remained.
Renewable Energy System

APPLICATIONS OF GEOTHERMAL ENERGY
January 2012 Report No. 10-1151-0408 - 3 66
The energy system at Walden consist of a 58 ton geothermal vertical borefield connected to five water-to-water heat pumps which feed warm water through an in-floor radiant heat system, throughout the school. Because the school only requires heating and the geothermal borefield must be replenished to ensure sustainability, solar thermal panels were installed on the south facing exterior wall of the gymnasium, collecting heat when the sun shines, and sending it into the geothermal borefield to replace the heat extracted, over the winter.
The school needed 235,000 kWh of electricity annually. A small wind turbine with a capacity to generate 35,000 kWh of electricity was installed in the playground. The roof structure has been reinforced to hold photovoltaic solar panels which have a capacity of 200,000 kWh. The roof was not quite large enough to hold panels need to generate the total electricity load, so the wind turbine was required.
Walden Public School opened to 435 students, in November 2009. Teachers, staff, students and parents all take pride in their accomplishments and a culture of “ownership” has taken root.
The fourth principle of design became respect – respect for themselves, respect for each other, respect for the environment and respect for the future that they will leave to others.
2011 Update Rainbow District School Board received funding from the Northern Heritage Fund in 2010 and was able to install 100,000 kWh PV solar panels on the roof, half the amount required to make the school carbon neutral. They are still raising funds and intend to install the remainder of the PV solar panels required sometime in the next two years.

APPLICATIONS OF GEOTHERMAL ENERGY
January 2012 Report No. 10-1151-0408 - 3 67
APPENDIX C Geothermal District Energy System Case Study - Ball State University

12/4/09 7:36 PMUniversity To Use Earth's Temps To Heat Its Buildings : NPR
Page 1 of 2http://www.npr.org/templates/story/story.php?storyId=121021935&ft=1&f=1007
text size A A A
University To Use Earth's Temps To Heat Its Buildingsby DANIEL ROBISON
December 4, 2009 from WFIU
In northeastern Indiana, environmentalists areclosely watching a project on a scale that hasn'tbeen attempted before in the United States. BallState University is constructing the largestgeothermal heating and cooling system of itskind — and promises to cut its carbon emissionsin half.
Here's how it works: A few dozen feet below theEarth's surface, the temperature is between 52and 55 degrees Fahrenheit. Depending on thetime of year, geothermal systems use theEarth's temperature as a heat source — or sink
— by sending water through miles of pipes and concentrating it to meet the temperature thethermostat calls for.
Ball State is attempting to use more than 660 acres to heat and cool nearly 50 buildings.
'This Is A Major, Major Change'
Drills the size of tree trunks punch through dirt, clay and limestone to create a polka-dot patternthat stretches over land equal to a half-dozen football fields. One of the 400-foot-deep holes couldheat and cool a house. But 4,100 of the holes will take care of the entire campus.
Project engineer Jim Lowe says there's still a gee-whiz reaction to geothermal in a state wheremore than 95 percent of energy needs are met through coal and natural gas.
"They still think of it as technology that'sstrange, but it's not," he says. "This is a major,major change. Instead of thinking about buildingboilers and using coal and natural gas, we'reshifting that paradigm to where we're relying ona renewable energy source here."
When the Muncie, Ind., school originally tried toreplace its four Eisenhower-era coal boilers,Ball State President Jo Ann Gora says a $50million estimate led to sticker shock — andthat's before factoring in the cost of coal. So theschool started to think outside the smokestack.
"It really shows that America has renewableenergy sources if you just have the will to use
them," she says. "We're using the renewable energy that the ground represents. Buildings rest onthe ground. The ground is the source of renewable energy. Why don't we use it?"
Unlike wind and solar, which don't operate efficiently 24/7, geothermal systems are on all the time.But each one must be installed on-site, meaning it would take thousands of these projects to equalthe heating and cooling power of just one coal plant.
Financial Hurdles
Jim Huddleston manages the project he says will keep 80,000 tons of carbon emissions from theskies above Muncie. But he says the initial cost of geothermal is steep and that keeps many fromdigging deep into their pockets to pay for it.
"Problem is, when you and I go to buy a houseand I need every penny I have to get that down
Enlarge Georgia Perry
Machinery and pipes cover the muddy ground at Ball StateUniversity's geothermal heating/cooling construction site.
Enlarge Georgia Perry
Jo Ann Gora, president of Ball State University, says whenthe school tried to replace its four coal boilers, the $50million estimate led to sticker shock. So university officialsstarted thinking creatively.

12/4/09 7:36 PMUniversity To Use Earth's Temps To Heat Its Buildings : NPR
Page 2 of 2http://www.npr.org/templates/story/story.php?storyId=121021935&ft=1&f=1007
and I need every penny I have to get that downpayment and to get the fixtures that my wifewants and put these curtains up — and we don'tspend the extra 30 percent," Huddleston says.
It could cost Ball State as much as $80 millionto build the system. But officials estimate energysavings of up to $2 million a year. And rightnow, even with $40 million from the state and$5 million in federal stimulus funds, Ball Statehas raised just over half the money it needs.Despite the financial hurdles, Oregon Institute ofTechnology professor John Lund says BallState will show that large-scale geothermal is aviable resource.
"There are probably over 50 schools that have heat pumps, but this would be the largest," Lundsays. "It does show that it can be done on a large scale — i.e., this can be done all over thecountry, from North Dakota down to Florida, from Maine down to Texas.:
Across Ball State's campus, Mark Tucker dumps coal into an enormous boiler, which rages at1,800 degrees Fahrenheit. He says they go through 130 tons of coal a day among the four boilers.
It could take five to 10 years for Ball State to complete this project as the school moves forward totap the Earth for its heating and cooling needs.
Enlarge Georgia Perry
Mark Tucker releases steam from a coal-burning furnace inthe Ball State University coal plant. In coal-fired boilers likethese, steam is used to turn turbines, which produceelectricity.
Post this comment to Facebook, too?
commentsPlease note that all comments must adhere to the NPR.org discussion rules and terms of use. See also theCommunity FAQ.
You must be logged in to leave a comment. Login | Register
NPR reserves the right to read on the air and/or publish on its Web site or in any medium now known or unknownthe e-mails and letters that we receive. We may edit them for clarity or brevity and identify authors by name andlocation. For additional information, please consult our Terms of Use.

APPLICATIONS OF GEOTHERMAL ENERGY
January 2012 Report No. 10-1151-0408 - 3 68
APPENDIX D Community Horizontal Geothermal District Energy Case Study
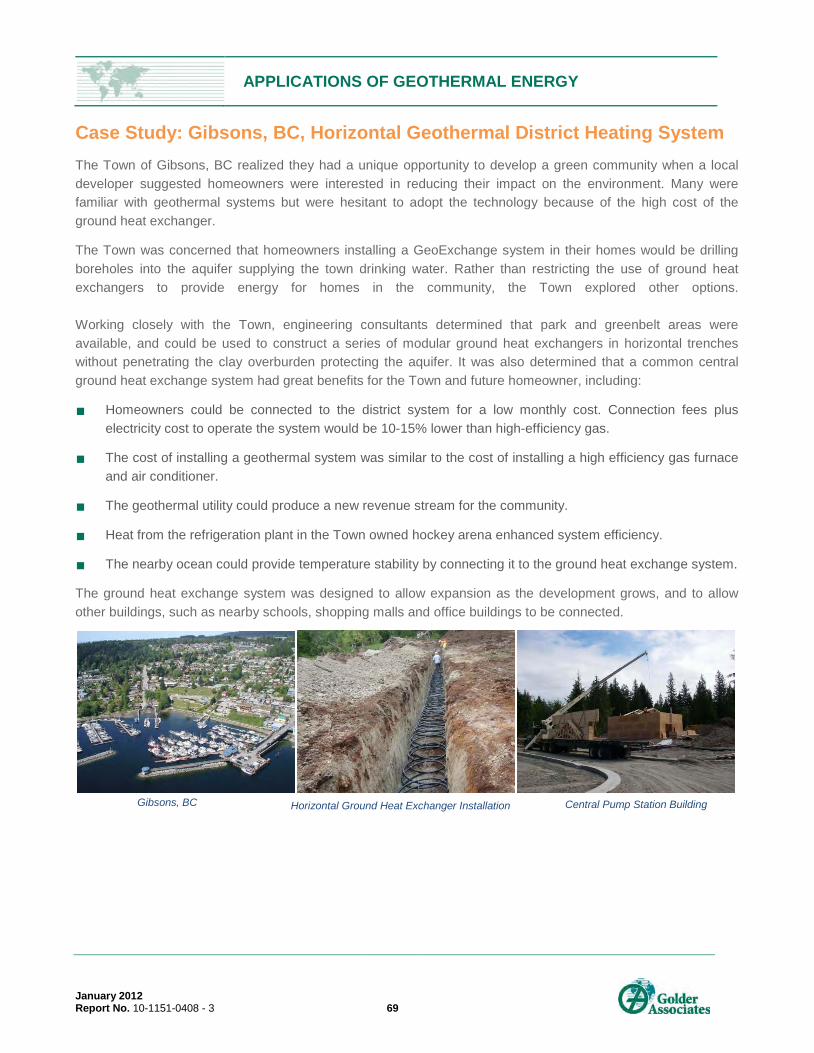
APPLICATIONS OF GEOTHERMAL ENERGY
January 2012 Report No. 10-1151-0408 - 3 69
Case Study: Gibsons, BC, Horizontal Geothermal District Heating System The Town of Gibsons, BC realized they had a unique opportunity to develop a green community when a local developer suggested homeowners were interested in reducing their impact on the environment. Many were familiar with geothermal systems but were hesitant to adopt the technology because of the high cost of the ground heat exchanger.
The Town was concerned that homeowners installing a GeoExchange system in their homes would be drilling boreholes into the aquifer supplying the town drinking water. Rather than restricting the use of ground heat exchangers to provide energy for homes in the community, the Town explored other options. Working closely with the Town, engineering consultants determined that park and greenbelt areas were available, and could be used to construct a series of modular ground heat exchangers in horizontal trenches without penetrating the clay overburden protecting the aquifer. It was also determined that a common central ground heat exchange system had great benefits for the Town and future homeowner, including:
Homeowners could be connected to the district system for a low monthly cost. Connection fees plus electricity cost to operate the system would be 10-15% lower than high-efficiency gas.
The cost of installing a geothermal system was similar to the cost of installing a high efficiency gas furnace and air conditioner.
The geothermal utility could produce a new revenue stream for the community.
Heat from the refrigeration plant in the Town owned hockey arena enhanced system efficiency.
The nearby ocean could provide temperature stability by connecting it to the ground heat exchange system.
The ground heat exchange system was designed to allow expansion as the development grows, and to allow other buildings, such as nearby schools, shopping malls and office buildings to be connected.
Gibsons, BC Horizontal Ground Heat Exchanger Installation
Central Pump Station Building

APPLICATIONS OF GEOTHERMAL ENERGY
January 2012 Report No. 10-1151-0408 - 3 70
APPENDIX E Energy Efficiency and Renewable Energy Tax Incentives Federal and State Energy Tax Programs

real green.
eapdlaw.comeapdGreen.com
EnErgy EfficiEncy and rEnEwablE EnErgy Tax incEnTivEs
fEdEral and sTaTE EnErgy Tax Programs
Karl P. Fryzel and Jerome L. Garciano
July 2011
EAPD Hartford, a USGBC Silver LEED Certified Office

Summary Chart of Federal and State Renewable and Efficient Energy Tax Incentives - July 2011 (Geothermal)
Sec Jurisdiction Statute Incentive Title Technology Tax Type Taxpayer Period (yrs) Amount Maximum Expiration00.00 Federal Tax Incentives for Renewable Energy and Energy Efficiency00.01 Federal §45 Renewable Electricity Production Geothermal Income Credit Producer 10 $0.022/Kwh - 201300.03 Federal §48C Investment In Advanced Energy Property Geothermal Income Credit Investor - 30% - 200900.13 Federal §168(e)(3) Certain Energy Property Geothermal Income Deduction Owner 5 200% DB - 201600.16 Federal §54C New Clean Renewable Energy Bonds Geothermal Income Credit Holder - 0 interest - Limit00.19 Federal §25D Residential Energy Efficient Property Geothermal Income Credit Owner - 30% $2,000 201601.00 Alabama State Tax Incentives for Renewable Energy and Energy Efficiency01.01 Alabama §40-18-190 Alternative Energy Electricity Production FacilitiesGeothermal Income Credit Utility 20 5% - 201501.02 Alabama §40-9B-4 Alternative Energy Production Facilities Geothermal Property Abatement Utility - 100% - 201804.00 Arizona State Tax Incentives for Renewable Energy and Energy Efficiency04.01 Arizona §41-1511 Renewable Energy Operations Geothermal Income Credit Manufacturer 5 10% 201404.02 Arizona §42-12006 Renewable Energy Operations Geothermal Property Abatement Manufacturer 10-15 75% 201404.14 Arizona §41-1514.2 Fuels Sold to Environmental Technology FacilitiesGeothermal Sales Exemption Purchaser 20 100% - -04.16 Arizona §42-5061.D Environmental Technology Facilities Geothermal Sales Exemption Manufacturer - 100% - -06.00 California State Tax Incentives for Renewable Energy and Energy Efficiency06.05 California §6010.8 Green Manufacturing Equipment Geothermal Sales Exemption Purchaser - 100% - 202008.00 Colorado State Tax Incentives for Renewable Energy and Energy Efficiency08.01 Colorado §31-20-101.3 Renewable Energy Systems Geothermal Property Credit Owner - Varies - -08.02 Colorado §39-26-403 Qualifying Clean Technology Geothermal Sales Refund Purchaser - 100% $50,000 201408.04 Colorado §30-11-107.3 Clean Energy Finance Districts Geothermal Property Financing Owner - Varies - -09.00 Connecticut State Tax Incentives for Renewable Energy and Energy Efficiency09.01 Connecticut §12-412 (117) Solar And Geothermal Systems Geothermal Sales Exemption Purchaser - 100% - -10.00 Delaware State Tax Incentives for Renewable Energy and Energy Efficiency10.01 Delaware §2040 Clean Energy Manufacturing Jobs Geothermal Income Credit Manufacturer - $750/Job & $100k $500,000 -12.00 Florida State Tax Incentives for Renewable Energy and Energy Efficiency12.01 Florida §196.175 Renewable Energy Source Devices Geothermal Property Exemption Owner 10 100% - -12.02 Florida §220.193 Renewable Energy Production Geothermal Income Credit Producer - $0.01/kWh - 201013.00 Georgia State Tax Incentives for Renewable Energy and Energy Efficiency13.01 Georgia §48-7-29.14 Clean Energy Property Geothermal Income Credit Owner - 35% $100,000 / $2,000 201215.00 Hawaii State Tax Incentives for Renewable Energy and Energy Efficiency15.01 Hawaii §235-110.9 High Technology Business Investment Geothermal Income Credit Investor 5 100% $1.5 million 201016.00 Idaho State Tax Incentives for Renewable Energy and Energy Efficiency16.01 Idaho §63-3502B Wind And Geothermal Energy Producers Geothermal Property Abatement Producer - 3% - -16.02 Idaho §63-3622QQ Renewable Energy Equipment Geothermal Sales Refund Purchaser - 100% - 201116.05 Idaho §63-3022C Residential Alternative Energy Devices Geothermal Income Deduction Owner 4 100% $5,000 -18.00 Indiana State Tax Incentives for Renewable Energy and Energy Efficiency18.01 Indiana §6-1.1-12-26 Renewable Energy Property Geothermal Property Exemption Owner - 100% - -20.00 Kansas State Tax Incentives for Renewable Energy and Energy Efficiency20.01 Kansas §79-32,246 New Renewable Electric Cogeneration Facilities Geothermal Income Credit Investor 10 5-10% - 201120.02 Kansas §79-201 Renewable Energy Equipment Geothermal Property Exemption Owner - 100% - -21.00 Kentucky State Tax Incentives for Renewable Energy and Energy Efficiency21.02 Kentucky §141.435 Renewable Energy Systems Geothermal Income Credit Owner - 30% $250 201524.00 Maryland State Tax Incentives for Renewable Energy and Energy Efficiency24.01 Maryland §10-720 Renewable Energy Production Geothermal Income Credit Producer 5 $0.0085/kWh $2.5 million 201524.02 Maryland §9-203 Solar, Geothermal, And Energy Conservation DevicesGeothermal Property Credit Owner - 100% - -24.03 Maryland §7-242 Renewable Energy Systems Geothermal Property Exemption Owner - 100% - -24.05 Maryland §11-230 Geothermal, Solar And Wind Energy Equipment Geothermal Sales Exemption Purchaser - 100% - -24.06 Maryland §8-240 Solar And Geothermal Heating And Cooling SystemsGeothermal Property Exemption Owner - 100% - -25.00 Massachusetts State Tax Incentives for Renewable Energy and Energy Efficiency25.05 Massachusetts 64H §6(dd) Renewable Energy Equipment In Primary ResidencesGeothermal Sales Exemption Purchaser - 100% - -27.00 Minnesota State Tax Incentives for Renewable Energy and Energy Efficiency27.04 Minnesota H.B. 2695 (2010) Renewable Energy and Energy-Efficiency SystemsGeothermal Property Financing Owner 20 Varies 10% of assessed value -

Sec Jurisdiction Statute Incentive Title Technology Tax Type Taxpayer Period (yrs) Amount Maximum Expiration29.00 Missouri State Tax Incentives for Renewable Energy and Energy Efficiency29.01 Missouri §620.1875 Technology Business Projects Geothermal Income Credit Producer 5 5% - -30.00 Montana State Tax Incentives for Renewable Energy and Energy Efficiency30.02 Montana §15-24-3111 Renewable Energy Production And Manufacturing FacilitiesGeothermal Property Abatement Owner 19 50% $1 million of value -30.03 Montana §15-31-124 Alternative Renewable Energy Industries Geothermal Income Credit Employer 3 1% - -30.05 Montana §15-24-1402 Alternative Renewable Energy Generating FacilitiesGeothermal Property Assessment Owner 10 50% - -30.07 Montana §15-6-224 Renewable Energy Systems Geothermal Property Exemption Owner 10 100% $100,000 / $20,000 -30.12 Montana §15-32-201 Residential Non-Fossil Form Energy Systems Geothermal Income Credit Owner - 100% $500 -30.13 Montana §15-32-115 Residential Geothermal Heating Or Cooling SystemGeothermal Income Credit Owner - 100% $1,500 -31.00 Nebraska State Tax Incentives for Renewable Energy and Energy Efficiency31.01 Nebraska §77-27,235 Renewable Energy Production Geothermal Income Credit Producer 10 $0.001/kwh - 201732.00 Nevada State Tax Incentives for Renewable Energy and Energy Efficiency32.01 Nevada §701A.360 Renewable Energy Technologies Geothermal Sales Abatement Purchaser 3 100% 0.60% 204932.02 Nevada §701A.220 Renewable Energy Production Facilities Geothermal Property Abatement Owner 20 55% - 204932.03 Nevada §701A.200 Renewable Energy Systems Geothermal Property Exemption Owner - 100% - -33.00 New Hampshire State Tax Incentives for Renewable Energy and Energy Efficiency33.01 New Hampshire 72 §73 Renewable Generation Facilities Geothermal Property Abatement Owner 5 Varies - -34.00 New Jersey State Tax Incentives for Renewable Energy and Energy Efficiency34.02 New Jersey §54:4-3.113 Renewable Energy Systems Geothermal Property Exemption Owner - 100% - -35.00 New Mexico State Tax Incentives for Renewable Energy and Energy Efficiency35.01 New Mexico §7-2A-25 Advanced Energy Systems Geothermal Income Credit Owner - 6% - 201535.04 New Mexico S.B. 647 (2009) Renewable-Energy Technologies Geothermal Property Financing Owner - Varies 40% -35.08 New Mexico §7-2A-24 Geothermal Systems Geothermal Income Credit Owner - 30% $9,000 202035.13 New Mexico §7-9-114 Clean Energy Facilities Geothermal Gross ReceiptsDeduction Seller 10 100% $60m 201536.00 New York State Tax Incentives for Renewable Energy and Energy Efficiency36.01 New York §14 Clean Energy Enterprises Geothermal Income Credit Manufacturer 10 Formula - 201036.02 New York §14 Clean Energy Enterprises Geothermal Property Credit Manufacturer 10 Formula - 201037.00 North Carolina State Tax Incentives for Renewable Energy and Energy Efficiency37.01 North Carolina §105-129.15 Renewable Energy Systems Geothermal Income Credit Owner 5 35% $8,400 201538.00 North Dakota State Tax Incentives for Renewable Energy and Energy Efficiency38.01 North Dakota §57-38-01.8 Renewable Energy Systems Geothermal Income Credit Owner 5 15% - 201438.02 North Dakota §57-02-08(27) Geothermal, Solar And Wind Property Geothermal Property Abatement Owner 5 100% - -38.08 North Dakota §57-38-01.8 Geothermal Energy Device Installation Geothermal Income Credit Owner 5 3% - 201439.00 Ohio State Tax Incentives for Renewable Energy and Energy Efficiency39.03 Ohio §5709.53 Solar, Wind, And Hydrothermal Energy Systems Geothermal Property Exemption Owner - 100% - -39.07 Ohio §5727.75 Qualified Energy Projects Geothermal Property Exemption Owner - 100% - 201140.00 Oklahoma State Tax Incentives for Renewable Energy and Energy Efficiency40.01 Oklahoma 68 §2357.32A Zero-Emission Electricity Production Geothermal Income Credit Producer 10 $0.0050/kWh - -41.00 Oregon State Tax Incentives for Renewable Energy and Energy Efficiency41.01 Oregon §315.354 Energy Improvements Geothermal Income Credit Owner 5 35-50% $20 million 201341.02 Oregon §315.354 Renewable Energy Equipment Manufacturing FacilityGeothermal Income Credit Manufacturer 5 50% $20 million 201341.03 Oregon §307.175 Renewable Energy Systems Geothermal Property Exemption Owner - 100% - 201241.07 Oregon §469.185 Residential Renewable Energy Property Geothermal Income Credit Owner - $300-$900 $900 201542.00 Pennsylvania State Tax Incentives for Renewable Energy and Energy Efficiency42.01 Pennsylvania 73 §1649.70 Alternative Energy Production Geothermal Income Credit Producer - 15% $1 million 201644.00 Rhode Island State Tax Incentives for Renewable Energy and Energy Efficiency44.01 Rhode Island §44-18-30(57) Renewable Energy Systems And Equipment Geothermal Sales Exemption Purchaser - 100% - -44.02 Rhode Island §44-3-21 Renewable-Energy Systems Geothermal Property Exemption Owner - 100% - -44.04 Rhode Island §44-57-1 Residential Renewable Energy Systems Geothermal Income Credit Owner - [Repealed] [Repealed] [Repealed]45.00 South Carolina State Tax Incentives for Renewable Energy and Energy Efficiency45.10 South Carolina §12-6-3588 Plant And Equipment For Renewable Energy Manufacturing OperationsGeothermal Income Credit Owner - 10% $500,000 201546.00 South Dakota State Tax Incentives for Renewable Energy and Energy Efficiency46.01 South Dakota §10-6-35.8 Renewable Energy Systems Geothermal Property Assessment Owner 6 50-100% - -46.05 South Dakota S.B. 58 (2010) Small Renewable Energy Facilities Geothermal Property Exemption Owner - 70% - -46.07 South Dakota §49-34A Renewable Resource Electric Production FacilitiesGeothermal Excise Refund Builder - 100% - 201247.00 Tennessee State Tax Incentives for Renewable Energy and Energy Efficiency

Sec Jurisdiction Statute Incentive Title Technology Tax Type Taxpayer Period (yrs) Amount Maximum Expiration47.01 Tennessee §67-6-232 Manufacturers Of Clean Energy Technologies Geothermal Sales Credit Manufacturer 8 99.50% - -49.00 Utah State Tax Incentives for Renewable Energy and Energy Efficiency49.01 Utah §59-7-614 Renewable Energy Systems Geothermal Income Credit Owner - 10-25% - -49.02 Utah §59-7-614 Renewable Energy Systems Geothermal Income Credit Owner 4 $0.0035/kWh $50,000 201249.03 Utah §59-12-104(55) Renewable Resource Electricity Generation EquipmentGeothermal Sales Exemption Purchaser - 100% - 201949.07 Utah §10-1-304 Renewable Resource Electricity Geothermal Sales Exemption Purchaser - 100% - 201950.00 Vermont State Tax Incentives for Renewable Energy and Energy Efficiency50.02 Vermont H.B. 446 (2009). Clean Energy Assessment Districts Geothermal Property Financing Owner - Varies - -51.00 Virginia State Tax Incentives for Renewable Energy and Energy Efficiency51.09 Virginia §58.1-3221.4 Renewable Energy Manufacturing Geothermal Property Assessment Manufacturer - Varies - -51.10 Virginia §58.1-439.12:03 Green Job Creation Geothermal Income Credit Employer 5 $500/job $175,000 201453.00 Washington State Tax Incentives for Renewable Energy and Energy Efficiency53.02 Washington §82.08.962 Renewable Energy Equipment Geothermal Sales Exemption Purchaser - 75-100% - 201156.00 Wyoming State Tax Incentives for Renewable Energy and Energy Efficiency56.01 Wyoming §39-15-105(a)(viii)(NRenewable Energy Equipment Geothermal Sales Exemption Purchaser - 100% - 2011

00. Federal Tax Incentives for Renewable Energy and Energy Efficiency

00.01 Federal business income tax credit for renewable electricity production
GENERAL DESCRIPTION. The Federal Internal Revenue Code provides a businessincome tax credit in the amount of $0.021 (2009) per kilowatt hour of electricityproduced from qualifying renewable resources during a ten-year period. IRC §45; Notice98-27, 1998-18 IRB 14; Notice 97-30, 1997-1 CB 416; Notice 96-25, 1996-1 CB 375;Rev. Proc. 2007-65; Announcement 2009-69; INFO 2010-0025; INFO 2010-0037;Notice 2010-37; Notice 2011-40.
ELIGIBLE TAXPAYERS. The tax credit is available to Taxpayers producing electricityfrom qualifying renewable resources and selling the electricity produced to an unrelatedperson.
QUALIFYING ACTIVITY. Taxpayer must produce electricity from qualifying renewableresources and sell the electricity produced to an unrelated person. Qualifying energyresources are wind, closed-loop biomass, open-loop biomass, geothermal energy, solarenergy, small irrigation power, municipal solid waste, hydropower, marine andhydrokinetic renewables. Qualifying closed-loop biomass is any organic material from aplant that is planted exclusively for purposes of being used at a qualifying facility toproduce electricity. Qualifying closed-loop biomass facilities may include facilitiesmodified to use closed-loop biomass to co-fire with coal, with other biomass, or withboth, but only if the modification is approved under the Biomass Power for RuralDevelopment Programs or is part of a pilot project of the Commodity Credit Corporation.Qualifying open-loop biomass is any agricultural livestock waste nutrients or any solid,nonhazardous, cellulosic waste material or any lignin material that is derived from: (1)any of the following forest-related resources: mill and harvesting residues,precommercial thinnings, slash, and brush; (2) solid wood waste materials, includingwaste pallets, crates, dunnage, manufacturing and construction wood wastes (other thanpressure-treated, chemically-treated, or painted wood wastes), and landscape or right-of-way tree trimmings, or (3) agriculture sources, including orchard tree crops, vineyard,grain, legumes, sugar, and other crop by-products or residues. Qualifying open-loopbiomass does not include municipal solid waste, gas derived from the biodegradation ofsolid waste, or paper that is commonly recycled. Qualifying geothermal energy is energyderived from a geothermal deposit or reservoir consisting of natural heat that is stored inrocks or in an aqueous liquid or vapor (whether or not under pressure). Qualifying smallirrigation power is power generated without any dam or impoundment of water throughan irrigation system canal or ditch, with the nameplate capacity of more than 150kilowatts and less than 5 megawatts. Qualifying municipal solid waste facilities includelandfill gas facilities and trash combustion facilities. Qualifying hydropower productionis incremental hydropower production at any hydroelectric dam that was placed in servicebefore Aug. 9, 2005, or the hydropower production from any nonhydroelectric dam.Incremental hydropower production for any tax year is equal to the percentage of averageannual hydropower production at a facility that is attributable to efficiency improvementsor additions of capacity placed in service after Aug. 8, 2005 determined by using thesame water flow information used to determine an historic average annual hydropowerproduction baseline for that facility. Incremental hydropower production does notinclude any operational changes at the facility not directly associated with the efficiency

improvements or additions of capacity. Qualifying hydropower production must becertified by the Federal Energy Regulatory Commission. Qualifying marine andhydrokinetic energy is energy derived from waves, tides, and currents in oceans, estuariesand tidal areas; free flowing water in rivers, lakes and streams; free flowing water in anirrigation system, canal or other man-made channel, including projects that use non-mechanical structures to accelerate the flow of water for electric power productionpurposes; or differentials in ocean temperature (ocean thermal energy conversion).Qualifying marine and hydrokinetic energy does not include any energy that is derivedfrom any source that uses a dam, diversionary structure or impoundment for electricpower production purposes.
INCENTIVE AMOUNTS. The tax credit amount is $0.022 (2010) per kilowatt hour(KWH) of electricity produced and sold to an unrelated person. The tax credit amount isreduced by the lesser of 50% or the ratio of government subsidies received for the taxyear to the aggregate additions to the capital account attributable to the project for the taxyear and all earlier tax years. Government subsidies include: (1) governmental grantsreceived for the project; (2) proceeds from tax-exempt state or local government bondsused to finance the project; (3) directly and indirectly provided subsidized energyfinancing under a federal, state or local program in connection with the project; and (4)any other credit allowable with respect to any property that is part of the project.
INCENTIVE LIMITS. The tax credit amount is reduced by an amount determined bydividing the excess of the reference price for the calendar year of sale over $0.08 (2010)per KWH by $0.03. Reference price is the annual average contract price per KWH ofelectricity generated from the same qualifying energy resource and sold in the U.S. in theprevious year. The tax credit amount is not available if the national average price ofelectricity from the resource is more than $0.11 per KWH (2010).
INCENTIVE TIMEFRAME. The tax credit is available for a 10-year period beginning onthe placed-in-service date of the qualifying facility. The tax credit for qualifying closed-loop biomass facilities expires December 31, 2013. The tax credit for qualifying open-loop biomass facilities expires December 31, 2013. The tax credit for qualifying windfacilities expires December 31, 2012. The tax credit for qualifying landfill gas facilitiesexpires December 31, 2013. The tax credit for qualifying geothermal energy facilitiesexpires December 31, 2013. The tax credit for qualifying solar energy facilities expiredDecember 31, 2005. The tax credit for qualifying small irrigation facilities expiredOctober 2, 2008. The tax credit for qualifying hydropower facilities expires December31, 2013. The tax credit for qualifying marine and hydrokinetic energy facilities expiresDecember 31, 2013.

00.03 Federal business income tax credit for investment in advanced energy property
GENERAL DESCRIPTION. The Federal Internal Revenue Code provides a businessincome tax credit in the amount of 30% of the qualifying investment in qualifyingadvanced energy manufacturing projects. IRC §48C; Notice 2009-72, 2009-36 IRB; CCA201052005.
ELIGIBLE TAXPAYERS. The tax credit is available to Taxpayers investing inqualifying advanced energy manufacturing projects.
QUALIFYING ACTIVITY. Taxpayer must invest in a qualifying advanced energymanufacturing project. A qualifying advanced energy project is a project which re-equips, expands, or establishes a manufacturing facility for the production of: (1)property designed to be used to produce energy from the sun, wind, geothermal depositsor other renewable resources, (2) fuel cells, microturbines, or an energy storage systemfor use with electric or hybrid-electric motor vehicles, (3) electric grids to support thetransmission of intermittent sources of renewable energy, including storage of thatenergy, (4) property designed to capture and sequester carbon dioxide emissions, (5)property designed to refine or blend renewable fuels, other than fossil fuels, to produceenergy conservation technologies, (6) new qualifying plug-in electric drive motorvehicles, qualifying plug-in electric vehicles, or components which are designedspecifically for use with those vehicles, including electric motors, generators, and powercontrol units, or (7) other advanced energy property designed to reduce greenhouse gasemissions as may be determined by IRS. A qualifying advanced energy project must becertified by IRS, in consultation with the US Department of Energy, through a qualifyingadvanced energy project application process to consider and award certifications toTaxpayer. In determining which qualifying advanced energy projects to certify, IRS willtake into consideration only those projects where there is a reasonable expectation ofcommercial viability. IRS will also take into consideration which projects: (i) willprovide the greatest domestic job creation (both direct and indirect) during the tax creditperiod, (ii) will provide the greatest net impact in avoiding or reducing air pollutants oranthropogenic emissions of greenhouse gases, (iii) have the greatest potential fortechnological innovation and commercial deployment, (iv) have the lowest levelized costof generated or stored energy, or of measured reduction in energy consumption orgreenhouse gas emission (based on costs of the full supply chain), and (v) have theshortest project time from certification to completion. A qualifying advanced energyproject which has been allocated a tax credit, but subsequently undergoes a “significant”change in plans, may be denied the tax credit. A “significant” change in plans is not achange that would have influenced DOE, but rather, it is any change that a reasonableperson would conclude might have influenced DOE in recommending or ranking theproject or the IRS in accepting the project application, had they known about the changewhen they were considering the application. A qualifying advanced energy project mayinclude any portion of an investment in other projects as eligible for a credit under IRC§48C. A qualifying advanced energy project does not include any qualifying investmentfor which a credit is allowed under IRC §§48, 48A or 48B, or for which a payment isreceived under §1603 of the American Recovery and Reinvestment Tax Act of 2009. Aqualifying advanced energy project does not include any portion of a project for the

production of any property which is used in the refining or blending of any transportationfuel (other than renewable fuels).
INCENTIVE AMOUNTS. The tax credit amount is 30% of the qualifying investment.The qualifying investment amount is the basis of eligible property placed in serviceduring the taxable year. Eligible property is property (a) that is necessary for theproduction of specified energy property, (b) that is tangible personal property, or othertangible property, if such property is used as an integral part of the facility, and (c) withrespect to which depreciation (or amortization) is allowable. Eligible property does notinclude a building or its structural components.
INCENTIVE LIMITS. The nationwide maximum cumulative tax credit amount is $2.3billion.
INCENTIVE TIMEFRAME. Taxpayer must apply for the tax credit during the initialallocation round for 2009-2010 beginning August 14, 2009 and ending on December 16,2009. Preliminary application for US Department of Energy recommendation must besubmitted by September 16, 2009. The IRS will accept or reject 2009-2010 allocationround applications by January 15, 2010. Taxpayer will have 1 year from the date IRSaccepts the application during which to provide to IRS evidence that the requirements ofthe certification have been met. Taxpayer receiving a certification has 3 years from thedate of issuance of the certification to place the project in service.

00.13 Federal income tax deduction for certain energy property
GENERAL DESCRIPTION. The Federal Internal Revenue Code provides an income taxaccelerated cost recovery over 5 years for energy property. IRC §168(e)(3).
ELIGIBLE TAXPAYERS. The tax deduction is available to Taxpayer owners placing inservice energy property subject to cost recovery.
QUALIFYING ACTIVITY. Taxpayer must place in service energy property. Energyproperty is any property which is (1) equipment which uses solar energy to generateelectricity, to heat or cool (or provide hot water for use in) a structure, or to provide solarprocess heat, excepting property used to generate energy for the purposes of heating aswimming pool; (2) equipment which uses solar energy to illuminate the inside of astructure using fiber-optic distributed sunlight but only with respect to periods endingbefore January 1, 2017; (3) equipment used to produce, distribute, or use energy derivedfrom a geothermal deposit, but only, in the case of electricity generated by geothermalpower, up to (but not including) the electrical transmission stage; (4) qualifying fuel cellproperty or qualifying microturbine property; (5) combined heat and power systemproperty, (6) qualifying small wind energy property; or (7) equipment which uses theground or ground water as a thermal energy source to heat a structure or as a thermalenergy sink to cool a structure.
INCENTIVE AMOUNTS. The tax deduction amount is the amount MACRS specificallyprovides for IRC §48 energy property in the 5-year class. The depreciation method forproperty in the 5-year class is usually 200% declining balance, with a switch to straight-line to maximize the deduction (the 200% declining balance method). The 5-year classconsists of property with an ADR midpoint of more than 4 years and less than 10 years.
INCENTIVE TIMEFRAME. The tax deduction expires December 31, 2016.

00.16 Federal income tax credit for clean renewable energy bonds
GENERAL DESCRIPTION. The Federal Internal Revenue Code provides an income taxcredit in the amount of a portion of the clean renewable energy bonds’ nonrefundableoutstanding face amount which will permit issuance with a specified maturity orredemption date without discount and without interest cost. IRC §54; IRC §54C; Notice2007-26, 2007-14 IRB 870; Notice 2009-15, 2009-6 IRB 449; Notice 2009-33; IRSAnnouncement 2010-54.
ELIGIBLE TAXPAYERS. Taxpayer holders of clean renewable energy bonds.
QUALIFYING ACTIVITY. Taxpayer must hold clean renewable energy bonds. A cleanrenewable energy bond is a registered bond issued by a qualifying issuer under thenational clean renewable energy bond limitation, 95% or more of the proceeds of theissue used for capital expenditures incurred by government body or a mutual orcooperative electric company for one or more qualifying renewable energy projects.Qualifying renewable energy projects are facilities that qualify for the IRC §45(d)renewable electricity production credit. Qualifying issuers are (1) public powerproviders, (2) cooperative electric companies, (3) government bodies, (4) not-for-profitelectric utilities that have received a loan or loan guarantee under the RuralElectrification Act of 1936 (7 USC §901-950b), and (5) clean renewable energy bondlenders. A clean renewable energy bond lender is a cooperative that is owned by, or hasoutstanding loans to, 100 or more cooperative electric companies and was in existence onFeb. 1, 2002, or any affiliated entity controlled by the cooperative. Qualifying renewableenergy project do not include refined coal production facilities under IRC §45(d)(8) andIndian coal production facilities under IRC §45(d)(10). Qualifying renewable energyprojects must be owned by a government body, a public power provider, or a cooperativeelectric company. Qualifying renewable energy projects may be refinanced withproceeds of a clean renewable energy bond only if the indebtedness being refinanced(including any obligation directly or indirectly refinanced by that indebtedness) wasoriginally incurred after Aug. 8, 2005. Qualifying issuer must reasonably expects that :(1) at least 95% of the proceeds of the issue will be spent for one or more qualifyingprojects within the 5-year period beginning on the date of issuance of the clean renewableenergy bond; (2) a binding commitment with a third party to spend at least 10% of theproceeds of the issue will be incurred within the 6-month period beginning on the date ofissuance of the clean renewable energy bond on the date of the loan of those proceeds tomore than one borrower; and (3) those projects will be completed with due diligence andthe proceeds of the issue will be spent with due diligence. The 5-year period may beextended if the qualifying issuer establishes that the failure is due to reasonable cause andthe related projects will continue to proceed with due diligence. Qualifying issuer mustredeem all of the nonqualifying bonds within 90 days after the end of the extended orunextended period.
INCENTIVE AMOUNTS. The tax credit amount is the product of the tax credit ratedetermined by IRS for the day on which that bond was sold, multiplied by the bond'soutstanding face amount. The tax credit rate for any day is the tax credit rate which IRSestimates will permit the issuance of clean renewable energy bonds with a specified

maturity or redemption date without discount and without interest cost to the qualifyingissuer. The applicable credit rate for a tax credit bond on its sale date is the tax credit ratepublished for that date by the Bureau of Public Debt on its Internet site for State andLocal Government Series securities. The tax credit for new clean renewable energybonds is 70% of the amount that would otherwise be allowable under IRC §54A(b). Thetax credit rate will apply to the first day on which there is a binding, written contract forthe sale or exchange of the bond.
INCENTIVE LIMITS. The maximum annual tax credit allowable is the excess ofTaxpayer's regular tax and AMT liability, over tax credits allowed under Part IV ofsubchapter A tax credit provisions. The nationwide maximum aggregate tax creditamount is $1.2 billion, with an additional $1.6 billion authorized in 2009 for cleanrenewable energy bonds. The nationwide maximum aggregate tax credit amount forqualifying borrowers that are governmental bodies is $800 million. The tax credit isnonrefundable.
INCENTIVE TIMEFRAME. The tax credit for clean renewable energy bonds expiredDecember 31, 2009. An application for an allocation of the new clean renewable energybond limitation must be prepared and submitted in accordance with the requirements setforth in Notice 2009-33, 2009-17 IRB 865 . The application for new clean renewableenergy bond limitation must have been filed with the IRS by August 4, 2009.

00.19 Federal personal income tax credit for residential energy efficient property
GENERAL DESCRIPTION. The Federal Internal Revenue Code provides a personalincome tax credit in the amount of 30% the cost of residential energy efficient property,including qualifying solar electric property, qualifying solar water heating property,qualifying fuel cell property, qualifying small wind energy property, and qualifyinggeothermal heat pump property. IRC §25D; IRS Notice 2009-41;INFO 2009-0240;CONEX – 152472-09; INFO 2010-0036; PLR 201035003; INFO 2010-0085; INFO2010-0111; INFO 2010-0133; INFO 2010-0232.
ELIGIBLE TAXPAYERS. The tax credit is available to Taxpayer individuals installingresidential energy efficient property.
QUALIFYING ACTIVITY. Taxpayer must install residential energy efficient property.Residential energy efficient property includes solar electric, solar hot water, fuel cell,small wind energy, and geothermal heat pump. Qualifying solar electric property usessolar energy to generate electricity for use in a dwelling unit. Qualifying solar waterheating property heats water for use in a dwelling unit, if at least half of the energy usedby the property for that purpose is derived from the sun. Qualifying fuel cell property isan integrated system comprised of a fuel cell stack assembly and associated balance ofplant components that converts a fuel into electricity using electrochemical means, has anelectricity-only generation efficiency of greater than 30%, and generates at least 0.5 kwof electricity. Qualifying small wind energy property is property that uses a wind turbineto generate electricity. Qualifying geothermal heat pump property is property that usesthe ground or ground water as a thermal energy source to heat the dwelling unit or as athermal energy sink to cool the dwelling unit, and meets the Energy Star programrequirements in effect when the expenditure is made. Qualifying solar property includessolar panel or other property installed as a roof (or portion of a roof) even if it is astructural component of the structure on which it is installed. Qualifying solar waterheating property must be certified for performance by the Solar Rating CertificationCorporation or a comparable entity endorsed by the government of the state in which theproperty is installed. Qualifying solar water heating property does not includeexpenditures properly allocable to a swimming pool, hot tub, or any other energy-storagemedium that has a function other than energy storage.
INCENTIVE AMOUNTS. The tax credit amount is 30% of the qualifying property costs.Qualifying property costs include labor costs properly allocable to the on-site preparation,assembly, or original installation of qualifying property, and expenditures for piping orwiring to interconnect qualifying property to the dwelling unit. Qualifying propertycosts include expenditures that are made from subsidized energy financing. Subsidizedenergy financing is financing provided under a federal, state, or local program, a principalpurpose of which is to provide subsidized financing for projects designed to conserve orproduce energy. Qualifying property costs include only the portion of the cost fornonbusiness purpose if less than 80% of the use of an item is for nonbusiness purposes.Qualifying property costs does not include an expenditures financed with an energyconservation subsidy that a public utility provides to a customer to buy or install an

energy conservation measure, which is excluded from income. Qualifying property costsinclude amount of any Renewable Energy Credits payments from public utilities.
INCENTIVE LIMITS. The maximum annual tax credit amount is: $500 for each 0.5kilowatt of capacity for qualifying fuel cell property; $2,000 for solar water heating andgeothermal heat pump property; and $500 for each 0.5 kilowatt of capacity and a totalmaximum of $4,000 for small wind energy property. For qualifying fuel cell property ina dwelling unit that is jointly occupied and used during any calendar year as a residenceby two or more individuals, the maximum tax credit amount for all the individuals is$1,667 for each 0.5 kw of capacity of qualifying fuel cell property.
INCENTIVE TIMEFRAME. The tax credit expires December 31, 2016. Qualifyingproperty costs are made when the original installation is completed. Qualifying propertycosts related to the construction or reconstruction of a structure are made when Taxpayerbegins using the structure.

24. Maryland State Tax Incentives for Renewable Energy and Energy Efficiency

24.01 Maryland state income tax credit for renewable energy production
GENERAL DESCRIPTION. Maryland provides a corporate or personal income tax creditin the amount of $0.0085/kWh of renewable energy produced and $0.005/kWh forelectricity generated by co-firing. Md. Code Ann. §10-720; H.B. 464 (2010); S.B. 958(2011).
ELIGIBLE TAXPAYERS. The tax credit is available to Taxpayer corporations orindividuals producing electricity generated from renewable sources. Taxpayer must becertified by the MD Energy Administration.
QUALIFYING ACTIVITY. Taxpayer must produce and sell to third party electricitygenerated by wind, geothermal energy, solar energy, hydropower, small irrigation power,municipal solid waste and biomass resources. Biomass resources include anaerobicdigestion, landfill gas, wastewater-treatment gas, and cellulosic material derived fromforest-related resources (excluding old-growth timber and mill residues consisting ofsawdust or wood shavings), from waste pallets and crates, nonhazardous waste materialsegregated from other waste materials, or from agricultural sources.
INCENTIVE AMOUNTS. The tax credit amount is $0.0085/kWh for electricitygenerated by eligible resources. The tax credit amount is $0.0050/kWh for electricitygenerated by co-firing.
INCENTIVE LIMITS. The maximum tax credit amount is $2.5 million over a 5-yearperiod. The statewide aggregate maximum tax credit amount is $25 million.
INCENTIVE TIMEFRAME. The tax credit period is 5 years. The tax credit expiresDecember 31, 2015. The tax credit is refundable. The tax credit may be canceled ifover a 3-year period, Taxpayer does not claim on average at least 10% of the maximumtax credit amount stated in the certificate.

24.02 Maryland state property tax credit for solar, geothermal, and energy conservationdevices
GENERAL DESCRIPTION. Maryland provides a property tax credit in the amount of100% the cost of solar, geothermal, and energy conservation devices. Md. Code Ann. §9-203.
ELIGIBLE TAXPAYERS. The tax credit is available to Taxpayer owners of buildingswith a solar, geothermal or qualifying energy conservation device.
QUALIFYING ACTIVITY. Taxpayer must equip buildings with a solar, geothermal orqualifying energy conservation device. Qualifying devices may be used to heat or coolthe structure, to generate electricity to be used in the structure, or to provide hot water foruse in the structure.
INCENTIVE AMOUNTS. The tax credit amount is 100% of the cost of solar,geothermal, and energy conservation devices.

24.03 Maryland state property tax exemption for renewable energy systems
GENERAL DESCRIPTION. Maryland provides a property tax exemption in the amountof 100% of the cost of renewable energy systems. Md Code Ann. §7-242; H.B. 1171(2009); S.B. 621 (2009).
ELIGIBLE TAXPAYERS. The tax exemption is available to Taxpayer owners ofrenewable energy systems.
QUALIFYING ACTIVITY. Taxpayer must own geothermal, solar photovoltaic (PV),solar hot water system property and residential wind energy equipment.
INCENTIVE AMOUNTS. The tax exemption amount is 100% of the property tax due.

24.05 Maryland state sales tax exemption for geothermal, solar and wind energyequipment.
GENERAL DESCRIPTION. Maryland provides a sales tax exemption in the amount of100% of the tax on geothermal, solar and wind energy equipment. Md. Code Ann. §11-230; H.B. 1171 (2009); S.B. 621 (2009).
ELIGIBLE TAXPAYERS. Taxpayer purchasers of geothermal, solar and wind energyequipment.
QUALIFYING ACTIVITY. Taxpayer must purchase of geothermal, solar energy andresidential wind energy equipment. Geothermal equipment is equipment that uses groundloop technology to heat and cool a structure. Solar energy equipment is equipment thatuses solar energy to heat or cool a structure, generate electricity to be used in a structure,or provide hot water for use in a structure. Residential wind energy equipment isequipment installed on a residential property that uses wind energy to generate electricityfor use in a residential structure on that property. Solar energy equipment does notinclude equipment that is part of a non-solar energy system or that uses any type ofrecreational facility or equipment as a storage medium.
INCENTIVE AMOUNTS. The tax exemption amount is 100% of sales tax due.

24.06 Maryland state property tax exemption for solar and geothermal heating andcooling systems
GENERAL DESCRIPTION. Maryland provides a property tax assessment exemption inthe amount of 100% of the value of solar and geothermal heating and cooling systems.Md. Code Ann. §8-240.
ELIGIBLE TAXPAYERS. The tax exemption is available to Taxpayer owners of solarand geothermal heating and cooling system property.
QUALIFYING ACTIVITY. Taxpayer must own solar and geothermal heating andcooling systems.
INCENTIVE AMOUNTS. The tax exemption amount is 100% of the property tax due.

Golder Associates Inc. 2108 W Laburnum Ave, Suite 200 Richmond, Virginia , USA 23227 T: +1 (804) 358-7900
Caption Text