Geothermal Energy Reduction Emission (YD) · Pertamina Geothermal Energy (PGE) Sibayak, North...
37
International Climate Change Workshop Wisma Makara 18-19 March 2010 REDUCING EMISSION FROM REDUCING EMISSION FROM GEOTHERMAL ENERGY GEOTHERMAL ENERGY TECHNOLOGY TECHNOLOGY GEOTHERMAL ENERGY GEOTHERMAL ENERGY TECHNOLOGY TECHNOLOGY Geothermal Laboratory University of Indonesia Dr. Yunus Daud
Transcript of Geothermal Energy Reduction Emission (YD) · Pertamina Geothermal Energy (PGE) Sibayak, North...

International Climate Change Workshop Wisma Makara 18-19 March 2010
REDUCING EMISSION FROM REDUCING EMISSION FROM GEOTHERMAL ENERGYGEOTHERMAL ENERGY TECHNOLOGYTECHNOLOGYGEOTHERMAL ENERGYGEOTHERMAL ENERGY TECHNOLOGYTECHNOLOGY
Geothermal Laboratory University of IndonesiaDr. Yunus Daud

Government Policy to Reduce CO2 E i iEmissions
Government commitment for reducing CO2 2
Government commitment for reducing CO2 emission up to 26% in 2020Government Policy for Eletricity Generation Government Policy for Eletricity Generation Crash Program (Phase II) of 10,000 MW where geothermal energy contributes about where geothermal energy contributes about 48% (4,733 MW)

Wh i h l ?What is geothermal system?3

Plate Bo ndariesPlate Boundaries
“Ring of Fire”
4

Plate Tectonic Processes
Spreading Center
Oceanic PlateContinental
Plate
Convection

GEOTHERMAL SYSTEM MODEL 6
Fumarole
Clay Cap
High T System (> 225 C); Intermediate T System (125-225 C); Low T System (< 125 C)

Its temperature > 200˚C (more than 2x boiling)Its temperature > 200 C (more than 2x boiling)Geothermal is powerful energy source

G h l U ili i T h l
1 P G i T h l
Geothermal Utilization Technology8
1. Power Generation Technology2. Direct Uses Technology

Power Generation Technology
Water Vapor(no smoky emission)
I j i W llProduction Well
Injection Well

SCHEMATIC DIAGRAM OF SCHEMATIC DIAGRAM OF GEOTHERMAL POWER PLANT
Source: Pertamina

Dry Steam Power Plant Technologyy gy
Utilized for vapor Utilized for vapor dominated geothermal system
Wells produce dry steam steam

Flash Steam Power Plant Technologygy
Utilized for water Utilized for water dominated geothermal system
Wells produce hot water and small fraction of steam

Binary Cycle Power Plant Technologyy y gy
Utilized for low Utilized for low temperature geothermal system (T < 125oC)(T < 125oC)
Wells produce hot Working Fluid
Wells produce hot water
Zero emission

Flash Steam & Binary Cycle Power Plant (PP)
G tTo Steam Turbine
Working Fluid
PPBinary Cycle PP
Steam
Separator
Turbine
Generator
Flash Steam PP
2Ø Fluid
Condenser PumpBrine
Evaporator
Brine
Cooling Tower
Make‐upWater Pump
Brine
ProductionWells
ReinjectionWells

SCHEMATIC DIAGRAM OF SCHEMATIC DIAGRAM OF GEOTHERMAL DIRECT USES


CO i i f G h lCO2 Emission from Geothermal Energy24

CO2 Emissions Comparison(lbs/MW-hr)(lbs/MW-hr)
2000Coal
1500Naturalgas
Oil
1000 gas
500
Geothermal
Source EIA 1998; Bloomfield and Moore 1999
0
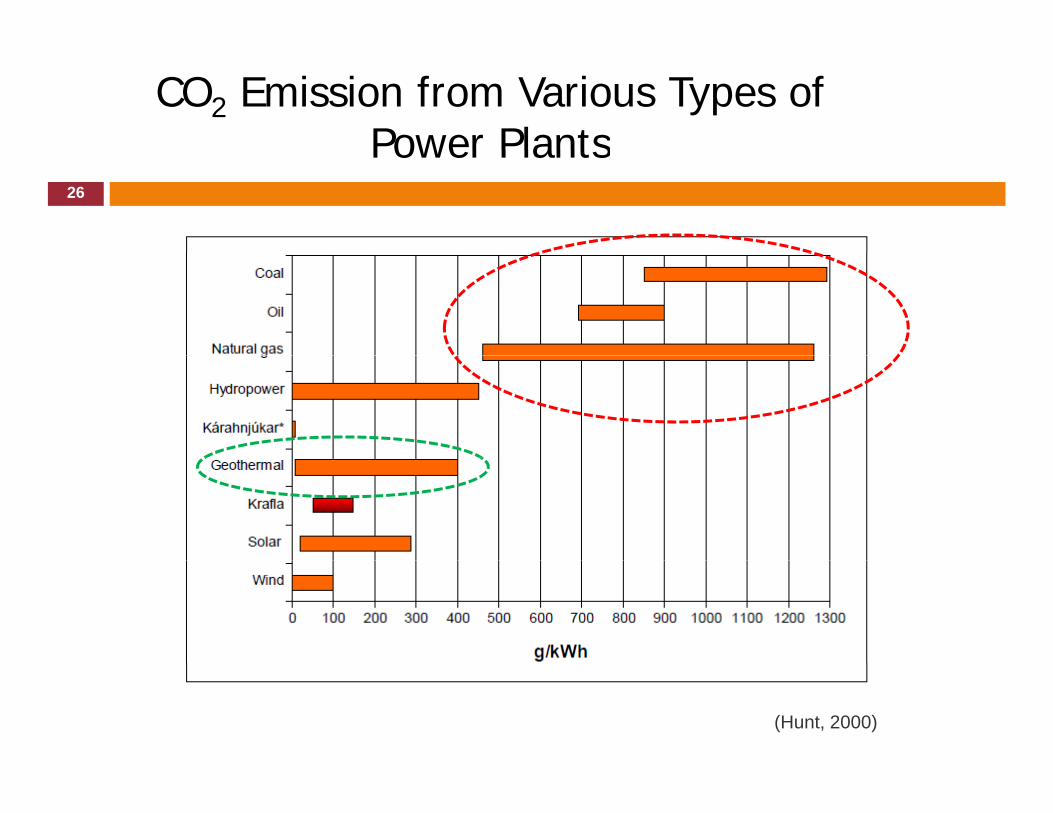
CO2 Emission from Various Types of Power Plants
26
Power Plants
(Hunt, 2000)

Geothermal Characteristics
Clean energy (low CO2 emission)
27
Clean energy (low CO2 emission)Environmentally friendly
SustainableSustainableRenewable
Supporting World Emission Reduction

G h l i d iGeothermal Resources in Indonesia28

Geothermal Distribution in Indonesia29
Total Geothermal Area: 253 locationsTotal Potential: 27,140 MWe
Non‐volcanic geothermal systemTotal Potential: 27,140 MWe geothermal system
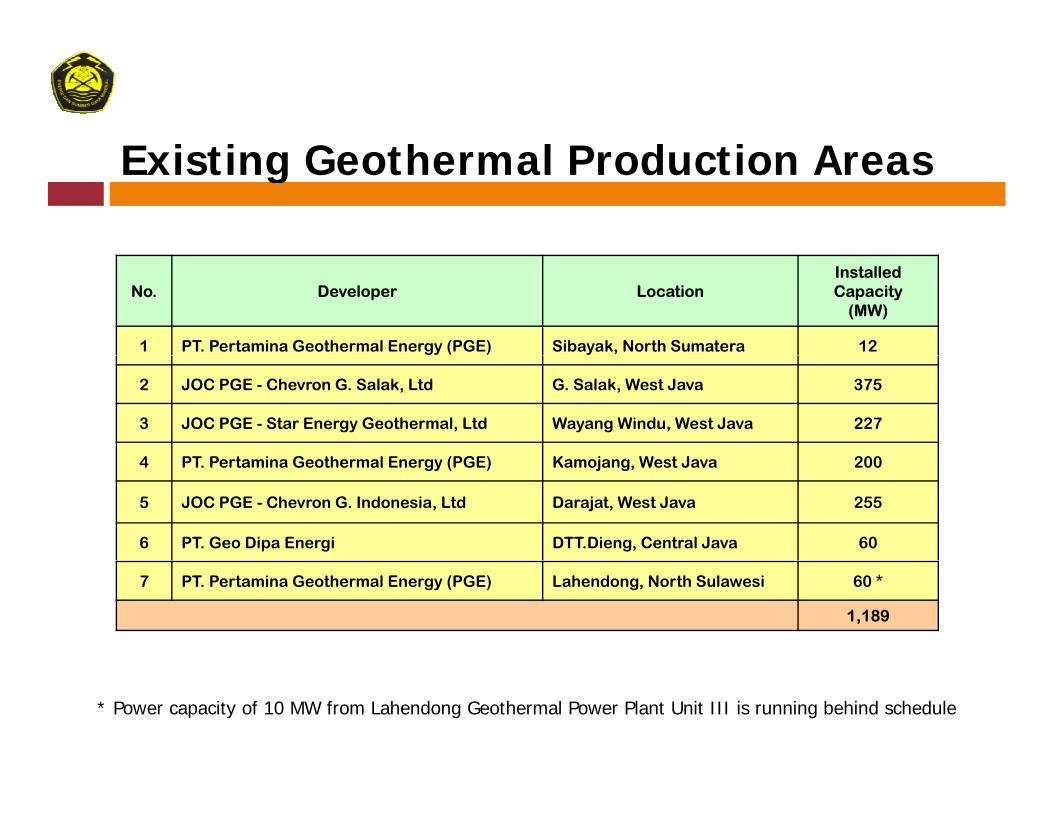
E i ti G th l P d ti AExisting Geothermal Production Areas
No. Developer LocationInstalled Capacity
(MW)
1 PT. Pertamina Geothermal Energy (PGE) Sibayak, North Sumatera 12
2 JOC PGE - Chevron G. Salak, Ltd G. Salak, West Java 375
3 JOC PGE - Star Energy Geothermal, Ltd Wayang Windu, West Java 227
4 PT P t i G th l E (PGE) K j W t J 2004 PT. Pertamina Geothermal Energy (PGE) Kamojang, West Java 200
5 JOC PGE - Chevron G. Indonesia, Ltd Darajat, West Java 255
6 PT. Geo Dipa Energi DTT.Dieng, Central Java 60
7 PT. Pertamina Geothermal Energy (PGE) Lahendong, North Sulawesi 60 *
1,189
* Power capacity of 10 MW from Lahendong Geothermal Power Plant Unit III is running behind schedule

Sibayak ‘95 Dieng ‘02 Lahendong ‘01 Geothermal Power Plant1 2 3yReserve, 170 MWProduction, 12 MW
gReserve, 580 MWProduction, 60 MW
gReserve, 175 MWProduction, 60 MW
Geothermal Power PlantTotal Capacity: 1189 MW
1 2 3
4 5 6 7
Gunung Salak ‘94Reserve, 600 MW
Production, 375 MW
Wayang Windu ‘99Reserve, 385 MW
Production, 227 MW
Darajat ‘94Reserve, 432 MW
Production, 255 MW
Kamojang ‘83Reserve, 333 MW
Production, 200 MW

Geothermal Contribution on 10,000 MW Power Development Acceleration Program Phase II
32
Power Development Acceleration Program Phase II
AREA PLTU PLTGU PLTP PLTA TOTAL
JAVA - 1.200 2.137 1.000 4.337OUTSIDE JAVA 2.616 240 2.596 174 5.626
2.616 1.440 4.733 1.174 9.96326% 14% 48% 12% 100%
TOTAL26% 14% 48% 12% 100%
Geothermal P Pl t
Remarks:PLTU : Coal Fired Power PlantPLTGU : Combine Cycle Power PlantPLTP : Geothermal Power Plant
Power Plant
PLTA : Hydro Power Plant

Development of Geothermal Power Plant 2009 – 2014(Based on Crash Program 10.000 MW Phase II)
No. System 2009 2010 2011 2012 2013 2014 Total1 Java-Bali 117 5 0 330 445 1240 21372 S 0 60 10 440 2 140 228
MW
2 Sumatera 0 60 105 440 275 1405 22853 Sulawesi 0 0 45 60 0 90 1954 Nusa Tenggara 0 5 8 3 20 40 765 Maluku 0 0 0 20 0 20 405 Maluku 0 0 0 20 0 20 40
117 70 158 853 740 2795 4733117 187 345 1198 1938 47331189 1259 1417 2270 3010 5805Installed Capacity
TotalCumulative Development
p y
CurrentCondition

CDM Potential Based on Crash Program 10,000 MW Phase IIin Geothermal Sectorin Geothermal Sector
YEARSYSTEM
MW tCO2e/year MW tCO2e/year MW tCO2e/year MW tCO2e/year MW tCO2e/year MW tCO2e/yearJawa Bali 117 702,000 5 30,000 - - 330 1,980,000 445 2,670,000 1,240 7,440,000
SYSTEM2009 2010 2011 2012 2013 2014
Sumatera - - 60 360,000 105 630,000 440 2,640,000 275 1,650,000 1,405 8,430,000 Sulawesi - - - - 45 270,000 60 360,000 - - 90 540,000 Nusa Tenggara - - 5 30,000 8 48,000 3 18,000 20 120,000 40 240,000 Maluku - - - - - - 20 120 000 - - 20 120 000 Maluku - - - - - - 20 120,000 - - 20 120,000
Total 117 702,000 70 420,000 158 948,000 853 5,118,000 740 4,440,000 2,795 16,770,000 Cumulative 117 702,000 187 1,122,000 345 2,070,000 1,198 7,188,000 1,938 11,628,000 4,733 28,398,000
Revenue fr CER *) US$ 14,040,000 US$ 22,440,000 US$ 41,400,000 US$ 143,760,000 US$ 232,560,000 US$ 567,960,000
Geothermal development plan until 2014 : 4,733 MWEmission reduction in 2014 : 28,398,000 t CO2Assumption of emission reduction : 6,000 tCO2e/MW/year*) Revenue estimation from CER if 1 CER = US$ 20 (based on JICA study, July 2009)
(ESDM, 2009)

C l iConclusions35

Conclusions
Geothermal is clean, renewable and sustainable
36
Geothermal is clean, renewable and sustainable energy that can be utilised for world emission reductionIndonesia commits to reduce emission up to 26% in 2020Following the commitment, Indonesia issued a policy to utilise geothermal energy up to almost 50 % in the 2nd Crash Program for Electricity GenerationThrough this program Indonesia will reduce CO2
i i 28 398 000 CO2 i 2014 emission up to 28,398,000 tCO2 in 2014

THANK YOUTHANK YOUTHANK YOUTHANK YOUREDUCING EMISSION FROM REDUCING EMISSION FROM GEOTHERMAL ENERGYGEOTHERMAL ENERGY
TECHNOLOGYTECHNOLOGY
Dr. Yunus DaudE-mail: [email protected], Mobile: 0812-877-2043
Geothermal Laboratory University of Indonesia