Geothermal Energy - link.springer.com · Geothermal Energy Hirofumi Muraoka* North Japan Research...
23
Geothermal Energy Hirofumi Muraoka* North Japan Research Institute for Sustainable Energy, Hirosaki University, Aomori, Japan Abstract While most renewable energies are, directly or indirectly, derived from the sun, geothermal energy originates in the interior of the earth. Geothermal energy is the most stable of the renewable energies because it can be utilized constantly, regardless of weather or season. Geothermal energy can be used not only for power generation but also for direct heat application. The development of geothermal power generation entered a phase of rapid growth in 2005, and its total installed capacity worldwide reached 10.7 GW e in 2010. The capacity of 10.7 GW e appears small when compared with solar and wind power generation; however, the high-capacity factor of geothermal power plants, which is 0.7–0.9, provides several times greater electricity from the same installed capacity than photovoltaic and wind plants. Direct heat application can be used almost anywhere on land. Geothermal resources are classified into two categories: hydrothermal convection resources and thermal conduction resources. Today’ s geothermal power capacity is mainly hydrothermal-based and unevenly distributed in volcanic countries. As a borehole is drilled into deeper formations, formation temperature becomes higher but permeability becomes lower. Hydrothermal convection resources have a limit depth. Rock’ s brittle-plastic transition gives a bottom depth to permeability, and it is the absolute limit depth for the hydrothermal convection resources. Enhanced or engineered geothermal systems (EGS), in which fractures are artificially created in less-permeable rocks and heat is extracted by artificially circulating water through the fractures, are still at a demonstration stage, but they will extend geothermal power generation to thermal conduction resources and to depths even deeper than the brittle-plastic transition. Assessment of worldwide geother- mal resource potential is still under study. However, an estimate shows that potential is 312 GW e for hydrothermal resources for electric power generation to a depth of 4 km, 1,500 GW e for EGS resources to a depth of 10 km, and 4,400 GW th for direct geothermal use resources. Were 70 % of hydrothermal resources, 20 % of EGS resources, and 20 % of direct-use resources to be developed by 2050, it could reduce carbon dioxide emission by 3.17 Gton/year, which is 11 % of the present worldwide emission. Introduction While most kinds of renewable energy available are, directly or indirectly, derived from the sun, geothermal energy originates in the interior of the earth. This makes geothermal energy distinct from other kinds of renewable energy, giving its use merits as well as demerits. Geothermal energy is the most stable energy among a variety of renewable energies. The capacity factor, a ratio of working time of the facility, of geothermal power plants is as high as those of thermal power plants, qualifying geothermal power generation as a base load electricity source. Geothermal energy can be supplied constantly from the earth’ s interior regardless of time of the day or night, weather, or season. Assessment of the resource potentials of most kinds of renewable energy, such as the wind velocity and solar radiant energy, is not very difficult because they can be directly observed. Assessment of geothermal *Email: [email protected] Handbook of Climate Change Mitigation and Adaptation DOI 10.1007/978-1-4614-6431-0_35-2 # Springer Science+Business Media New York 2015 Page 1 of 23
Transcript of Geothermal Energy - link.springer.com · Geothermal Energy Hirofumi Muraoka* North Japan Research...

Geothermal Energy
Hirofumi Muraoka*North Japan Research Institute for Sustainable Energy, Hirosaki University, Aomori, Japan
Abstract
While most renewable energies are, directly or indirectly, derived from the sun, geothermal energyoriginates in the interior of the earth. Geothermal energy is the most stable of the renewable energiesbecause it can be utilized constantly, regardless of weather or season. Geothermal energy can be used notonly for power generation but also for direct heat application. The development of geothermal powergeneration entered a phase of rapid growth in 2005, and its total installed capacity worldwide reached 10.7GWe in 2010. The capacity of 10.7 GWe appears small when compared with solar and wind powergeneration; however, the high-capacity factor of geothermal power plants, which is 0.7–0.9, providesseveral times greater electricity from the same installed capacity than photovoltaic and wind plants. Directheat application can be used almost anywhere on land. Geothermal resources are classified into twocategories: hydrothermal convection resources and thermal conduction resources. Today’s geothermalpower capacity is mainly hydrothermal-based and unevenly distributed in volcanic countries. As aborehole is drilled into deeper formations, formation temperature becomes higher but permeabilitybecomes lower. Hydrothermal convection resources have a limit depth. Rock’s brittle-plastic transitiongives a bottom depth to permeability, and it is the absolute limit depth for the hydrothermal convectionresources. Enhanced or engineered geothermal systems (EGS), in which fractures are artificially createdin less-permeable rocks and heat is extracted by artificially circulating water through the fractures, are stillat a demonstration stage, but they will extend geothermal power generation to thermal conductionresources and to depths even deeper than the brittle-plastic transition. Assessment of worldwide geother-mal resource potential is still under study. However, an estimate shows that potential is 312 GWe forhydrothermal resources for electric power generation to a depth of 4 km, 1,500 GWe for EGS resources toa depth of 10 km, and 4,400 GWth for direct geothermal use resources. Were 70 % of hydrothermalresources, 20 % of EGS resources, and 20 % of direct-use resources to be developed by 2050, it couldreduce carbon dioxide emission by 3.17 Gton/year, which is 11 % of the present worldwide emission.
Introduction
While most kinds of renewable energy available are, directly or indirectly, derived from the sun,geothermal energy originates in the interior of the earth. This makes geothermal energy distinct fromother kinds of renewable energy, giving its use merits as well as demerits.
Geothermal energy is the most stable energy among a variety of renewable energies. The capacityfactor, a ratio of working time of the facility, of geothermal power plants is as high as those of thermalpower plants, qualifying geothermal power generation as a base load electricity source. Geothermalenergy can be supplied constantly from the earth’s interior regardless of time of the day or night, weather,or season.
Assessment of the resource potentials of most kinds of renewable energy, such as the wind velocity andsolar radiant energy, is not very difficult because they can be directly observed. Assessment of geothermal
*Email: [email protected]
Handbook of Climate Change Mitigation and AdaptationDOI 10.1007/978-1-4614-6431-0_35-2# Springer Science+Business Media New York 2015
Page 1 of 23

resource potential is not as easy, however, because geothermal resources are stored in the earth’s crust.This makes the initial investment risk for geothermal energy developments higher.
For many years, geothermal energy development was only undertaken in volcanic countries such asItaly, New Zealand, Japan, the USA, the Philippines, Iceland, and Indonesia. More recently, however, lessvolcanic countries, such as Germany, Australia, France, and Switzerland, have begun enthusiasticallydeveloping geothermal power plants under a new concept of the enhanced or engineered geothermalsystem (EGS). Innovation in geothermal energy utilization technology currently aims at a goal that everycountry can use geothermal energy.
Heat in the Earth’s Interior
Enormous heat is stored in the earth’s interior. The simplified thermal structure of the earth’s interior isillustrated in Fig. 1. The deepest hole ever drilled was the SG-3 well in Kola Peninsula, Russia, thatreached a depth of 12,262 m in 1989 (Fuchs et al. 1990). The hole reached only 0.2 % of the radius of theearth, suggesting that direct temperature measurement of the earth’s interior would be difficult. Thetemperature of the earth’s interior is estimated from the transmissibility and velocity of seismic waves,
Fig. 1 Simplified thermal structure of the earth’s interior (Topographic data are taken from Lindquist et al. (2004) and drawingis made with GMT by Wessel and Smith (1998))
Handbook of Climate Change Mitigation and AdaptationDOI 10.1007/978-1-4614-6431-0_35-2# Springer Science+Business Media New York 2015
Page 2 of 23

high-temperature and high-pressure experiments for mineral phase changes, a model calculation oftemperature increases by the adiabatic compression of mineral phases, a model calculation of electricconductivity of mineral phases, and many other methods. All of these are indirect estimates and inevitablyyield a large opportunity for error. The temperature at the center of the earth is commonly estimated to be6,000 �C, but that may easily yield an error �1,000 �C (Fig. 1).
Seismological observation delineates that the outer core of the earth consists mainly of molten state ironand nickel, and the mantle of the earth consists of solid state peridotite (ultramafic rocks mostly composedof olivine, Ca-poor pyroxene, and Ca-rich pyroxene). When the melting point temperatures of these areconsidered at the given pressure, the core-mantle boundary is estimated to be about 4,000 �C (Kanamori1978). The abrupt change of the velocity of seismic waves at a depth of 670 km in the lower and uppermantle boundary is ascribed to the phase changes from g phase of spinel to perovskite + magnesiow€ustiteat 1,600 �C (Tajika 1996). The thickness of the lithosphere, a rigid plate, is less than 30 km near the axis ofocean ridges and increases to 100 km away from the ridge. Low-velocity zones of the seismic waves orasthenosphere underlie the rigid plate at a depth between 70 and 250 km. This zone is partially fused andprobably reaches 1,000 �C because of the wet solidus temperature of peridotite. Therefore, only a thinveneer of the earth’s surface is less than 1,000 �C, and the 93 % volume of the earth’s interior exceeds1,000 �C (Fig. 1). Thus, the earth is some sort of a thermal engine.
The derivation of the heat is mainly attributed to the accretion heat from bombardment of unsortedmicro-planet materials and the heat from gravitational differentiation and compression in the initial stageof the earth’s formation history some 4.6 billion years ago (Takahashi 1996). The earth is gradually losingthe initial heat with time. Nevertheless, abundant heat is still stored in the earth’s interior, 4.6 billion yearsafter its incipiency. The thermal life of the earth is prolonged by the additional heat generation inradioactive decay. Based on the past 4.6 billion years, the earth’s heat will be probably preserved foranother 4.6 billion years. Thus, the earth is some sort of a semipermanent thermal engine.
Quantity of Thermal Energy Supplied from the Earth’s Interior
The earth’s interior constantly supplies heat to the surface. This heat transportation phenomenon is called“terrestrial heat flow.” Terrestrial heat flow can be measured in wells at a depth from 0.3 to 3 km on shore,where the solar radiant heat does not reach. Terrestrial heat flow can be measured in shallower wells on theocean floor because of no disturbance by solar radiant heat. Terrestrial heat flow is calculated from theobserved thermal gradient multiplied by the thermal conductivity of the constituent rocks. An averageterrestrial heat flow is 65 � 1.6 mW/m2 onshore and 101 � 2.2 mW/m2 offshore (Tajika 1996). Thevalue of the terrestrial heat flow observed on shore consists of not only heat flow from the earth’s interiorbut also heat flow from radioactive decay of elements such as uranium, thorium, and potassiumpredominantly concentrated in the continental crust. About half of the terrestrial heat-flow value onshore may be derived from radioactive decay. The value of the terrestrial heat flow observed offshore has anegative correlation with the geological age of the ocean floor. The younger ocean floor tends to yield thehigher terrestrial heat flow (Tajika 1996).
Including both continental and oceanic regions, a global average terrestrial heat flow is87 � 2.0 mW/m2. This value 2.1 � 10�6 cal/cm2 � s (87 mW/m2) multiplied by the entire global areais converted to the annual value, yielding an annual global terrestrial heat-flow energy Ehf = 1.3 � 1021
J/year or 3.2 � 1020 cal/year (Mizutani andWatanabe 1978). This heat-flow energy causes a variety of theearth’s internal dynamics, such as mantle convection, plate tectonics, earthquakes, andmagma generation.Thermal energy of lava flow and volcanic ash that erupted from global volcanoes is estimated to beEe = 3 � 1019 J/year or 7 � 1018 cal/year (Mizutani and Watanabe 1978). This energy is one or two
Handbook of Climate Change Mitigation and AdaptationDOI 10.1007/978-1-4614-6431-0_35-2# Springer Science+Business Media New York 2015
Page 3 of 23

orders of magnitude lower than the terrestrial heat-flow energy that causes it. Many active volcanoes formhigh-level magma chambers that heat up ground water to discharge fumaroles (natural vents of steam andvolcanic gas) and hot springs. The discharge energy of fumaroles and hot springs on the earth is estimatedto be Ew = 2 � 1018 J/year or 5 � 1017 cal/year (Mizutani and Watanabe 1978). This energy is also onemagnitude lower than the volcanic eruption energy that causes it.
The earth seems to be an almost semipermanent thermal engine, where abundant terrestrial heat flow isalways being lost from the earth’s surface. Therefore, artificial utilization of the terrestrial heat flow doesnot seriously affect the dynamic equilibrium of the earth. This is a concept of the environment-friendlygeothermal energy utilization.
Direct Use of Geothermal Energy
Since the early history of human beings, hot springs and steaming grounds were utilized for a variety ofpurposes such as bathing, cooking, balneology, and healing. Direct use of geothermal energy thus has along history over the last few millenniums. The direct use of geothermal energy is currently extended tothe hot-water supply, swimming pools, space heating, snow melting, drying foods or materials, condens-ing sugar, greenhouse cultivation, and fish cultivation. Geothermal heat pumps for heating and cooling ofbuildings and houses are rapidly spreading in the world. Methods of direct use of geothermal energies arebriefly described here.
Bathing is one of the most traditional direct uses of geothermal energy. For example, as of March 2010,there are 27,825 hot-spring sources in Japan (Ministry of the Environment and Japan 2011), most of whichwere developed by drillings for bathing in hot-spring resort hotels. In China, since the China WesternDevelopment policy was launched in 2000, many hot springs were developed by 3,000-m class deepdrillings to the porous Ordovician limestone strata (Zheng 2004). In New Zealand, the Maori people havetraditionally cooked foods in steaming grounds in Rotorua and Taupo. Large-scale flower cultivationgreenhouses heated by hot springs are found inMonte Amiata, Italy. Shrimp cultivation by hot water fromthe geothermal power plant is famous in Wairakei, New Zealand. In Iceland, approximately 90 % ofresidences are heated by hot water from geothermal power plants and hot-spring wells. Thus, Iceland hasbecome an almost energy-independent nation.
Use of geothermal heat pumps, a direct use of geothermal energies, has increased rapidly because theydo not require any geothermal anomaly areas and can be utilized almost everywhere on land. Theequivalent number of the 12 kW units (typical of US and Western European homes) reached 2.94 millionin 2010, over double the number of units in 2005 (Lund et al. 2010). Temperature is constant under-ground. This can be experienced in limestone caves, which feel warm in winter and cool in summer. Onlythe atmospheric temperature changes from day to night and due to seasonal variation of solar radiantenergy. Solar radiant energy reaches the shallower part of the ground, to a depth of 10, 20, or 30 m,depending on the rock species of strata, but does not reach the deeper formations. Therefore, heat can bewasted through a well as shallow as 50 or 100 m underground by a heat pump in summer and can beextracted in winter. Geothermal heat pumps resemble air conditioners (air-sourced heat pumps), but airconditioners waste heat to the atmosphere in summer, causing the heat island phenomenon. Increasing useof geothermal heat pumps for heating and cooling of buildings and houses will effectively mitigate theglobal warming and the heat island phenomena.
Handbook of Climate Change Mitigation and AdaptationDOI 10.1007/978-1-4614-6431-0_35-2# Springer Science+Business Media New York 2015
Page 4 of 23

Geothermal Power Generation
Geothermal power generation has a relatively short history, beginning only in the last century. Geothermalpower-generation experiments were successfully initiated at Larderello in Tuscany, Italy, in 1904(Dickson and Fanelli 2004). Since then, a variety of methods of geothermal power generation havebeen developed. These methods are briefly described here.
Geothermal power generation is classified into two categories: steam flash power generation from high-temperature hydrothermal resources of 150–370 �C and binary cycle power generation fromlow-temperature hydrothermal resources of 50–200 �C (Fig. 2). In the 1970s, geothermal fluids lessthan 150 �C could not have been economically utilized for electric power generation. The only availablemethod of geothermal power generation in those days was conventional-type steam flash power gener-ation, which uses the conventional steam turbine directly rotated by the natural steam from the geothermalproduction wells (Fig. 3). Even if the subsurface natural fluid is a liquid state under the high-pressuregeothermal reservoirs at a depth, a pressure release by the drill hole makes the fluid boil and the steamascends to the surface automatically. This phenomenon is called “borehole flash” and requires thetemperature of water to be at least 150 �C (Fig. 3). Therefore, the temperature threshold of 150 �C usedto be important. This situation changed with the development of binary cycle power-generation technol-
Geothermalpower
generation
Kalina cycle powergeneration: two-
componentworking fluid
Rankine cyclepower generation:one-component
working fluid
Back pressurepower generation:no condenser and
cooling tower
Single flashpower generation:
no secondaryflasher
Double flashpower generation:secondary steam
can also be utilized
Binary cycle powergeneration: suitable for
50–200°C resources, zeroemission but low efficiency
and small scale
Steam flash powergeneration: suitable for 150–370°C resources, non-zeroemission but high efficiency
and large scale
Fig. 2 Classification of geothermal power generation
Water
Production well Reinjection well
Cooling water pump
Cooling tower
GeneratorTurbine
Condenser
Intr
a-bo
reho
le fl
ash
Steam
Steam
Separator
Fig. 3 Illustration of a plant of the single flash geothermal power generation (Modified from Dickson and Fanelli (2004))
Handbook of Climate Change Mitigation and AdaptationDOI 10.1007/978-1-4614-6431-0_35-2# Springer Science+Business Media New York 2015
Page 5 of 23

ogy in the 1980s. The binary cycle power-generation method uses a secondary working fluid, such aspentane or ammonia, that has a low boiling-point temperature (Fig. 4). When the temperature ofsubsurface water is around 150 �C or lower, the water is not easy to flash. Then, subsurface hot wateris pumped up from the production wells. The subsurface water is only used as a heat source for thesecondary working fluid. Today, binary cycle power-generation technology enables use of moderate-(150–90 �C) to low-temperature (<90 �C) geothermal fluids (Fig. 4).
The most common type of binary cycle power generation is Rankine cycle power generation, whichuses one-component working fluid with the fixed boiling-point temperature under a constant pressure.When a hydrocarbon is used for the working fluid, such as pentane and butane, the system is called anorganic Rankine cycle (ORC). In 1980, Aleksandr I. Kalina invented a binary cycle power-generationsystem that uses a two-component working fluid of ammonia and water. This system is called Kalina cyclepower generation. The boiling-point temperature is continuously changed with the ratio of two compo-nents under a constant pressure so that the thermal efficiency is higher than that of the Rankine cycle. Theoriginal Kalina cycle is specific to binary cycle power generation with the ammonia-water working fluid,but it seems more useful to extend it to binary cycle power generation with a two-component workingfluid (Fig. 2).
The most efficient existing cycle of thermal engines converting a given amount of thermal energy intowork is expressed by the Carnot cycle. The Carnot cycle is a particular thermodynamic cycle proposed byNicolas Léonard Sadi Carnot in 1824, and this theorem contributed to establish the second law ofthermodynamics. The most efficient cycle of thermal engines is expressed as follows:
� ¼ QH � QL
QH(1)
where � is the efficiency of the thermal engine, QH is the thermal energy given from the high-temperatureheat source to the working fluid, and QL is the thermal energy wasted from the working fluid to thelow-temperature heat source. Any excellent thermal engine cannot exceed the idealistic efficiencyexpressed by Eq. 1. Equation 1 indicates that the temperature difference between high- andlow-temperature heat sources is critically important for the efficiency of thermal engines regardless of
Water
Feed pump
Production well Reinjection well
Nor
mal
ly p
umpi
ng u
p
Cooling water pump
Heatexchanger(condenser)
Heatexchanger(evaporator)
Cooling tower
GeneratorTurbineWorkingfluid
Fig. 4 Illustration of a plant of the binary cycle geothermal power generation (Modified from Dickson and Fanelli (2004))
Handbook of Climate Change Mitigation and AdaptationDOI 10.1007/978-1-4614-6431-0_35-2# Springer Science+Business Media New York 2015
Page 6 of 23

any species of materials of working fluid. It can be easily estimated from Eq. 1 that the ideal thermalefficiency of high-temperature steam flash power generation might be close to 0.5 but that of thelow-temperature binary cycle power generation might be close to 0.2. In addition, low-temperature binarycycle power generation has large amounts of energy loss in the heat exchangers so that the availablethermal efficiency is normally close to half of the ideal efficiency, as low as 0.1.
From the environmental point of view, steam flash power generation releases small amounts of naturalsteam from the cooling tower that contains small amounts of carbon dioxide. Hence, subsurface hot waterin binary cycle power generation is only used as heat sources for the working fluid, and it can be totallyrecharged into shallower crust by reinjection wells. Zero-emission operation by a closed-loop system ispossible in binary cycle power generation. Therefore, binary cycle power generation is more environ-mentally friendly, even if the thermal efficiency is low. When high-temperature hydrothermal fluid isunusually high in carbon dioxide, water binary cycle power generation, where relatively pure water isused as the secondary working fluid, is a possible option for zero-emission operation instead of theconventional steam flash power generation.
Category of Geothermal Resource Base
The assessment of a geothermal resource requires economic feasibility criteria, the same as otherresources. Geothermal resources are one of the “invisible” resources stored in the earth’s interior.Therefore, the confirmation of geothermal resources requires geological assurance processes such asexploration, drilling, and production tests. Based on factors of economical feasibility and geologicalassurance, geothermal resources are defined on a so-calledMcKelvy diagram, as shown in Fig. 5 (Mufflerand Cataldi 1978).
In 1978, an economically feasible depth for geothermal power developments was considered to beabout 3 km (Brook et al. 1979). There were not any geothermal wells deeper than 3 km at that time. Today,deep wells, at depths of 3.58 km at Unterhaching, Germany; 4.42 km at Cooper Basin, Australia; and 5 kmat Soultz, France, are commonly utilized for geothermal power generation (Kaieda 2009). Likewise, theextent of geothermal resources is rapidly enlarging with time and technological innovation (Fig. 5).
The geothermal resource base, including future geothermal resources, is considered here (Fig. 5).A geothermal resource base is classified into three categories by the kind of the heat transportationmedium: hydrothermal convection system, thermal conduction system, and high-level magma system(Fig. 6). The hydrothermal convection system is, in a narrow sense, a traditional geothermal resource.Conventional geothermal power generation includes steam flash-type power generation and binary cyclepower generation using hydrothermal convection resources. The thermal conduction system is a next-generation geothermal resource and is economically marginal at this time. The high-level magma systemis a remote future geothermal resource. However, the high-level magma systems have already played animportant role of sub-volcanic heat sources to form hydrothermal convection systems.
Three representative thermal gradients are shown in Fig. 3, where their curvatures arise from the heatgeneration of radioactive decay mostly generated in the upper granitic crust. The geothermal gradientlabeled “Continent” shows an average trend about 30 �C/km on the continental regions, “Volcanic zone”shows the higher trend about 40 �C/km on active volcanic zone, and “Older continent” shows the lowertrend about 18 �C/km on the coldest region. In any geothermal gradient regions, if a hole is drilled deeperand deeper, the formation temperature can be higher and higher. Therefore, the greater depth is promising,with more abundant geothermal energy in terms of the temperature regime.
However, the permeability of crustal rocks is known to rapidly decrease with increasing depth of thecrust (Fig. 6; Manning and Ingebritsen 1999). Permeability is hydrological flow efficiency of water or
Handbook of Climate Change Mitigation and AdaptationDOI 10.1007/978-1-4614-6431-0_35-2# Springer Science+Business Media New York 2015
Page 7 of 23

water-dominated fluids in crustal rocks. This parameter depends not only on the porosity of rocks but alsoon the density of fractures of the macroscopic rock strata. The depth dependency of permeability indicatesthat the velocity of hydrothermal convection dramatically decreases with increasing depth of crust.Therefore, hydrothermal reservoirs become rarer with increasing depth of the crust. This is a continuous
Geological assurance
Inac
cess
ible
Res
ourc
e ba
se
Eco
nom
ic fe
asib
ility
Acc
essi
ble
Res
idua
lU
sefu
l
ResourceReserve
Subeco-nomic
Depth
Economic at future time
Economic
UndiscoveredIdentified
Fig. 5 Definition of geothermal resources on the so-called McKelvy diagram (Muffler and Cataldi 1978)
Fig. 6 Temperature (left) and permeability (right) with a depth of earth’s crust. In the left diagram, red dots show 6,522 bottomhole temperatures from Japanese wells (Muraoka et al. 2007) and BPT indicates the brittle-plastic transition. The right diagramis redrawn from Manning and Ingebritsen (1999)
Handbook of Climate Change Mitigation and AdaptationDOI 10.1007/978-1-4614-6431-0_35-2# Springer Science+Business Media New York 2015
Page 8 of 23

model on the permeability-depth relationship. There is another constraint on the permeability-depthrelationship: the concept of the brittle-plastic transition. All rocks will lose permeability at the depth ofthe brittle-plastic transition below which all fractures and pores will be closed by the viscous behavior ofrocks (Fournier 1991). Schematic models of the brittle-plastic transitions on upper granitic crust, lowergabbroic crust, and upper peridotite mantle are shown in Fig. 6. The WD-1a well drilled to the depth of3,729 m in Kakkonda, northeastern Japan, penetrated the brittle-plastic transition at a depth of 3,100 m(Muraoka et al. 1998). The brittle-plastic transition on the upper peridotite mantle may coincide with thebottom of the lithosphere. This is a discontinuous model on the permeability-depth relationship. Thecontinuous model (Manning and Ingebritsen 1999) and discontinuous model (Fournier 1991; Muraokaet al. 1998) on the permeability-depth relationship are probably compatible with each other. When thecrust is observed statistically, the continuous model will be valid. When the crust is observed in somespecific locality, the discontinuous model is obtained.
Based on both continuous and discontinuous models, the permeability-depth relationships suggest thatall hydrothermal convection resources have a limit depth. As a borehole is drilled into deeper formations,the formation temperature becomes higher but permeability becomes lower. Therefore, hydrothermalconvection resources have a limited depth. Particularly, the brittle-plastic transition of rock property givesa bottom depth to permeability and it gives the absolute limit depth for the hydrothermal convectionresources. As a result, the region of the hydrothermal system is confined to the low-temperature andshallow region, as schematically shown in Fig. 6.
Enhanced or engineered geothermal systems (EGS), in which fractures are artificially created in less-permeable rocks and heat is extracted by artificially circulating water through the fractures, are still at ademonstration stage. However, they will extend geothermal power generation to the thermal conductionregion to a broad depth range even greater than the brittle-plastic transition and to a broad temperaturerange even higher than the brittle-plastic transition (Fig. 6). Even if the given depth is a plastic region,artificial circulation of water makes the local domain brittle and attains artificial fracturing. Therefore, theEGS technology will open the next generation of geothermal power generation that can be appliedanywhere on land (Tester et al. 2006).
Sub-solidus Magma Penetrated by Well WD-1a in Kakkonda, Japan
The exploration well WD-1a was drilled to a depth of 3,729 m in the Kakkonda geothermal field,northeast Japan, using efficient borehole cooling techniques in July 1995 (Fig. 7; Muraoka et al. 1998;Muraoka 2005). The well penetrated an entire shallow hydrothermal convection zone, an entire contactmetamorphic aureole, and part of a young granitic intrusion called the Kakkonda Granite. The recoveredtemperature of the well indicates a boiling-point-controlled profile up to 380 �C to a depth of 3,100 m, anda conduction-controlled profile with a very high gradient from 3,100 m to the bottom of the hole, wherethe temperature is 500 �C (Fig. 8; Muraoka et al. 1998; Muraoka 2005). The well WD-1a may be the firstgeothermal well that encountered 500 �C, which exceeds the conventional hydrostatic boiling-point curve(Fig. 6). An inflection point of the temperature-depth profile at 3,100 m and about 380 �C reflects thebrittle-plastic boundary (Fig. 8). The brittle-plastic boundary constrains the maximum depth of fractureformation, and the fracture distribution constrains the maximum depth of hydrothermal convection.
The theory of lithosphere strength can be applied to the well WD-1a. The theory consists of Byerlee’slaw in a brittle region and a power law creep equation in a plastic region (Fig. 9). The Byerlee’s law in abrittle region is expressed by the following equation (Brace and Kohlstedt 1980):
Handbook of Climate Change Mitigation and AdaptationDOI 10.1007/978-1-4614-6431-0_35-2# Springer Science+Business Media New York 2015
Page 9 of 23

s1 ffi 5s3, s3 < 110MPas1 ffi 3:1s3 þ 210, s3 > 110MPa
(2)
where
• s1 = the maximum principal stress• s3 = the minimum principal stress
Figure 9 is only constrained by the upper equation. The power law creep is expressed by the followingequation (Brace and Kohlstedt 1980):
_ϵ ¼ A s1 � s3ð Þne �HRTð Þ (3)
where
• _ϵ = strain rate, s�1
• A = material constant specified to the rock or mineral species• n = stress exponent• H = activation enthalpy, J mol�1
• R = gas constant, J K-1 mol�1
• T = temperature, K
Most of these parameters are reasonably determined on the well WD-1a. The strain rate _ϵ is given to be10�12 s�1 because of the active compressive tectonic region (Fournier 1991). Taking the data from quartzdiorite close to the Kakkonda Granite, the stress exponent n is given to be 2.4, and activation enthalpy H isgiven to be 219 kJ mol�1. The temperature T is given by the temperature profile of the well WD-1a inFig. 8. The material constant A varies from 10�19 to 1049 according to the given material, and only this
Fig. 7 The Kakkonda geothermal field, Iwate Prefecture, Japan, and the well WD-1a (Muraoka et al. 1998; Muraoka 2005)
Handbook of Climate Change Mitigation and AdaptationDOI 10.1007/978-1-4614-6431-0_35-2# Springer Science+Business Media New York 2015
Page 10 of 23

parameter cannot be reasonably determined. However, the inflection point of the strength curve by thetemperature inflection in the plastic region should coincide with the depth of 3.1 km, restricting thematerial constant A to be 10�0.85. Then, the strength curve on the plastic field is drawn as shown in Fig. 9(Muraoka et al. 1999).
The four points of stress ratio measurements of the differential strain curve analysis (DSCA) on the coresamples (New Energy and Industrial Technology Development Organization 1996) are well explained bythe model of the strength profile drawn by the Byerlee’s law and the power law creep equation as shown inFig. 9. Particularly, closure of s1 value to s3 at the deepest DSCA stress ratio measurement indicates thatthe dramatic strength weakening occurred as being accommodated by the plastic field as shown in Fig. 9.Three points of DSCA stress ratio measurements in the brittle field are close to the dry line (l = 0). This isalso reasonable because the sampling of cores could have been only performed from impermeable zoneswith no lost circulation. These observations strongly support that the well WD-1a actually penetrated thebrittle-plastic transition (Muraoka et al. 1998; Muraoka 2005).
Minimumhomogenizationtemperature of fluidinclusions of minerals
Chemical compound tablets with knownmelting point temperatures (one for 500°C wasmelted but one for 505°C was unmelted)
Inflection pointdividing thehydrothermalconvectionzone andmagmaticconductionzone
TemperatureProfilesimplifiedfrom variousdata
0
1,000
2,000
Dep
th (
m)
3,000
3,800
Temperature log atFeb.14, 1996(167 days after drilling)
Equilibrium temperatureestimated fromrecovery trends
Pre-tertiarysystem
Temperature log atJul. 21, 1995(82.3 h after drilling)
Inflection point dividingthe shallow reservoir(low-pressure) anddeep reservoir(high-pressure)in the Kakkondageothermal field
0 100 200 300 400 500 600
Temperature (°C)
Kakkonda Granite
Fig. 8 Temperature profile of the well WD-1a in the Kakkonda geothermal field, Japan (Muraoka et al. 1998; Muraoka 2005)
Handbook of Climate Change Mitigation and AdaptationDOI 10.1007/978-1-4614-6431-0_35-2# Springer Science+Business Media New York 2015
Page 11 of 23

The brittle-plastic transition may primarily be expected in the temperature inflection point at the depthof 3,100 m and the temperature 380 �C (Muraoka et al. 1998). However, the graphical representationmakes it clear that the brittle-plastic transition in a strict sense probably lies at a shallower depth, like2,400 m, where the maximum strength is attained at 360 �C (Fig. 9). A zone of very high concentration oflow-angle fractures is observed in the depth interval from 1,770 to 2,860 m (Fig. 10; Muraoka and Ohtani2000). This fracture zone likely reflects the maximum strength zone of the bottom of the brittle layerbecause this zone may play a role of the dehydration front and dehydration-induced weakening front(Muraoka and Ohtani 2000).
Distribution of Geothermal Resources in the World
High-temperature hydrothermal resources (>150 �C) are unevenly distributed in the world. Figure 11shows global topography, global bathymetry (topography of ocean floors), plate boundaries, activevolcanoes (Siebert and Simkin 2002), and representative geothermal power plants. High-temperaturehydrothermal resources that are hot enough for the steam flash-type power generation are associated withactive volcanic zones so that most of the geothermal power plants are developed in active volcanic zones.This is because sub-volcanic magma chambers or their sub-solidus equivalents (hot intrusive bodies) areserving for geothermal heat sources for the high-temperature hydrothermal reservoirs. Actually, youngplutonic bodies are often penetrated by geothermal wells not only in the Kakkonda geothermal field,Japan, as described in the preceding section, but also in other geothermal fields such as The Geysers, inCalifornia, USA; Tongonan and Palinpinon, in the Philippines; and Mutnovsky, in Russia (Muraoka1993).
Active volcanic zones are associated with two types of plate boundaries: spreading and convergent.A typical spreading plate boundary is mid-ocean ridges. In Fig. 11, mid-ocean ridges are not representedas volcanoes, but they are the largest volcanoes on the earth that are lineally continued. Their geothermaldevelopment has been difficult so far because of the high cost of submarine exploitations. As a result, most
Fig. 9 Crustal strength-depth relation along the well WD-1a in the Kakkonda geothermal field, Japan (Muraoka et al. 1999)
Handbook of Climate Change Mitigation and AdaptationDOI 10.1007/978-1-4614-6431-0_35-2# Springer Science+Business Media New York 2015
Page 12 of 23

of the geothermal power plants are built in the volcanic zones of the convergent plate boundaries. Oneexception is the Great Rift Valley in the eastern Africa, where spreading plate boundaries appear on shore.The other exception is the Salton Sea and Cerro Prieto geothermal fields in the western North America,where spreading plate boundaries or their transform faults appear on shore. The last exception is Iceland,which is situated on the mid-Atlantic ridge where the ridge appears above sea level because of the strongvolcanic activity in the hot spot.
Most of geothermal power plants are developed in the volcanic zones of subduction zones. Particularly,the largest subduction zones are found in the circum-Pacific regions. Although the first geothermal powergeneration was accomplished in Italy in 1904, the largest geothermal power country is currently the USA,the second is the Philippines, and the third is Indonesia. All of these are situated along the circum-Pacificregions. Geothermal electricity plays a very important role in Central America, where 10 % or higherratios of electricity are supplied from geothermal power generation in many countries. It seems curiousthat very few geothermal power plants have been developed in South America, in spite of the hugegeothermal potential in the Andes. The Copahue geothermal power plant used to operate in Argentina, butit has been terminated. No geothermal power plant is currently operating in South America. In otherwords, South America has reserved a large potential for geothermal power development in the near future.
Global Geothermal Resource Potentials
Assessment of global geothermal resource potentials is hard to accomplish because subsurface explora-tion data with uniform accuracy are seldom available on a global scale. However, a rough estimate is
Fig. 10 Chemistry of cutting samples from the contact metamorphic aureole of the Kakkonda Granite and high concentrationof low-angle fractures (Muraoka and Ohtani 2000)
Handbook of Climate Change Mitigation and AdaptationDOI 10.1007/978-1-4614-6431-0_35-2# Springer Science+Business Media New York 2015
Page 13 of 23

Fig.11
Globaltopography,global
bathym
etry,plateboundaries,activ
evolcanoes,andrepresentativ
egeotherm
alpower
plants
(Topographic
data
aretakenfrom
Lindquistetal.(2004
),draw
ingismadewith
GMTby
Wesseland
Smith
(1998),and
activ
evolcanoesaretakenfrom
SiebertandSim
kin(2002))
Handbook of Climate Change Mitigation and AdaptationDOI 10.1007/978-1-4614-6431-0_35-2# Springer Science+Business Media New York 2015
Page 14 of 23

possible by analogical reasoning. Hydrothermal power resources, EGS power resources, and direct-useresources are estimated here by analogical reasoning.
Stefansson (Stefansson 2005) estimated world geothermal assessment based on well-known data onactive volcanoes (Siebert and Simkin 2002). Hydrothermal resources high enough in the temperature forthe steam flash-type power generation are normally associated with active volcanoes, and therefore, hismethod is an excellent analogical reasoning by use of well-known data. Although the size of the activevolcano varies from the 100-km-long Toba caldera in Indonesia to 0.6-km-long maars (explosion ofvolcanic craters without remarkable tuff rings in its surroundings) such as Megata in Japan, these sizedifferences might cancel one another by using statistical data. Here, modification is made from theoriginal paper because some data have been updated. Table 1 and Fig. 12 show a relationship betweenthe numbers of active volcanoes and assessed hydrothermal power resources in eight representativecountries modified from the original paper (Stefansson 2005). A number of active volcanoes are takenfrom the catalog (Siebert and Simkin 2002), where submarine volcanoes are excluded. Assessed hydro-thermal power potentials are taken from each reference described in Table 1. A regression equation is
Table 1 Number of active volcanoes and estimated geothermal potential for electrical generation in eight representativecountries. The number of active volcanoes is taken from Siebert and Simkin (2002) where submarine volcanoes are excluded
Country Number of active volcanoesAssessed hydrothermal power potentials(MW) References
USA 163 39,090 William et al. (2008)
Indonesia 137 27,140 Darma et al. (2010)
Japan 93 23,470 Muraoka et al. (2008)
Philippines 46 6,000 Wright (1999)
Mexico 39 6,000 Mulas de Pozoet al. (1985)
Iceland 27 5,800 Palmason et al. (1985)
NewZealand
12 3,650 Lawless (2002)
Italy 12 1,500 Buonasorte et al. (2007)
00
5,000
10,000
15,000
20,000
25,000
30,000
35,000
40,000
45,000
20
New Zealand
Iceland Philippines
Japan
E = 221.7vR 2 = 0.9598
Indonesia
USA
MexicoItaly
40 60 80 100
Number of active volcanoes
Ass
esse
d po
tent
ial (
MW
)
120 140 160 180
Fig. 12 Correlation between the number of active volcanoes and estimated geothermal potential in eight representativecountries slightly modified from Stefansson (2005). The number of active volcanoes is taken from Siebert and Simkin (2002),where submarine volcanoes are excluded
Handbook of Climate Change Mitigation and AdaptationDOI 10.1007/978-1-4614-6431-0_35-2# Springer Science+Business Media New York 2015
Page 15 of 23
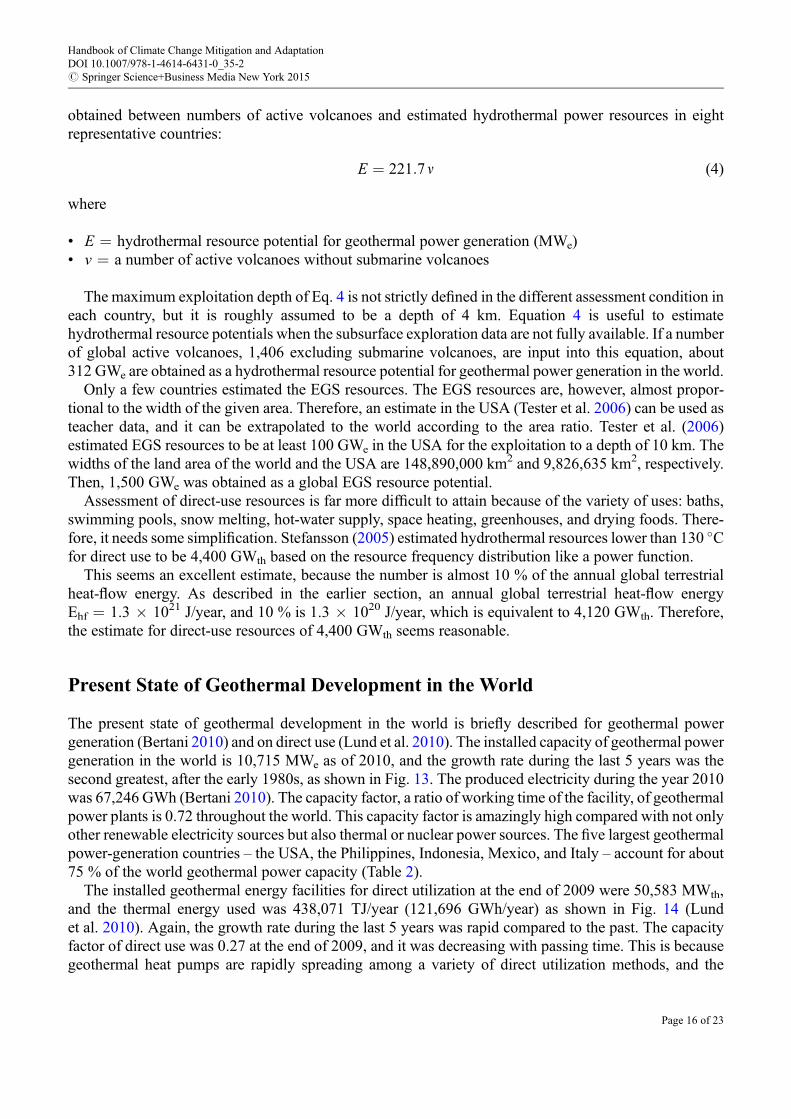
obtained between numbers of active volcanoes and estimated hydrothermal power resources in eightrepresentative countries:
E ¼ 221:7n (4)
where
• E = hydrothermal resource potential for geothermal power generation (MWe)• v = a number of active volcanoes without submarine volcanoes
The maximum exploitation depth of Eq. 4 is not strictly defined in the different assessment condition ineach country, but it is roughly assumed to be a depth of 4 km. Equation 4 is useful to estimatehydrothermal resource potentials when the subsurface exploration data are not fully available. If a numberof global active volcanoes, 1,406 excluding submarine volcanoes, are input into this equation, about312 GWe are obtained as a hydrothermal resource potential for geothermal power generation in the world.
Only a few countries estimated the EGS resources. The EGS resources are, however, almost propor-tional to the width of the given area. Therefore, an estimate in the USA (Tester et al. 2006) can be used asteacher data, and it can be extrapolated to the world according to the area ratio. Tester et al. (2006)estimated EGS resources to be at least 100 GWe in the USA for the exploitation to a depth of 10 km. Thewidths of the land area of the world and the USA are 148,890,000 km2 and 9,826,635 km2, respectively.Then, 1,500 GWe was obtained as a global EGS resource potential.
Assessment of direct-use resources is far more difficult to attain because of the variety of uses: baths,swimming pools, snow melting, hot-water supply, space heating, greenhouses, and drying foods. There-fore, it needs some simplification. Stefansson (2005) estimated hydrothermal resources lower than 130 �Cfor direct use to be 4,400 GWth based on the resource frequency distribution like a power function.
This seems an excellent estimate, because the number is almost 10 % of the annual global terrestrialheat-flow energy. As described in the earlier section, an annual global terrestrial heat-flow energyEhf = 1.3 � 1021 J/year, and 10 % is 1.3 � 1020 J/year, which is equivalent to 4,120 GWth. Therefore,the estimate for direct-use resources of 4,400 GWth seems reasonable.
Present State of Geothermal Development in the World
The present state of geothermal development in the world is briefly described for geothermal powergeneration (Bertani 2010) and on direct use (Lund et al. 2010). The installed capacity of geothermal powergeneration in the world is 10,715 MWe as of 2010, and the growth rate during the last 5 years was thesecond greatest, after the early 1980s, as shown in Fig. 13. The produced electricity during the year 2010was 67,246 GWh (Bertani 2010). The capacity factor, a ratio of working time of the facility, of geothermalpower plants is 0.72 throughout the world. This capacity factor is amazingly high compared with not onlyother renewable electricity sources but also thermal or nuclear power sources. The five largest geothermalpower-generation countries – the USA, the Philippines, Indonesia, Mexico, and Italy – account for about75 % of the world geothermal power capacity (Table 2).
The installed geothermal energy facilities for direct utilization at the end of 2009 were 50,583 MWth,and the thermal energy used was 438,071 TJ/year (121,696 GWh/year) as shown in Fig. 14 (Lundet al. 2010). Again, the growth rate during the last 5 years was rapid compared to the past. The capacityfactor of direct use was 0.27 at the end of 2009, and it was decreasing with passing time. This is becausegeothermal heat pumps are rapidly spreading among a variety of direct utilization methods, and the
Handbook of Climate Change Mitigation and AdaptationDOI 10.1007/978-1-4614-6431-0_35-2# Springer Science+Business Media New York 2015
Page 16 of 23

capacity factor of geothermal heat pumps is normally less than 0.2. Almost all countries are utilizinggeothermal heat directly (Table 3). Countries in colder regions tend to use more geothermal heat.
Geothermal Cascade Utilization Technology
To date, geothermal resources tend to be used for a single utilization purpose, and the spent resources havebeen wasted into reinjection wells or rivers, in the case of low-temperature direct use. However, a moreefficient utilization is repeated consumption of energy such as a cascade from the high-temperatureresources to the low-temperature resources as shown in Fig. 15. This can be called geothermal cascadeutilization.
A typical example is seen in Iceland, where voluminous hot water spent in geothermal power plants istransported by pipelines, more than 25 km long, to a tank on the hill of Reykjavik City. Then, the hot wateris distributed to each residence for space heating. This is a typical example of the geothermal cascadeutilization.
More efficient cascade utilization is possible with steam flash-type power generation, binary cyclepower generation, space heating, and snow melting in descending order as shown in Fig. 15. Cascadeutilization makes geothermal resources several times more efficient. However, for the development of thegeothermal cascade utilization, heat exchange technology and scale-inhibition technology are criticallyimportant.
Mitigation of Global Warming by Geothermal Development
If 70 % of hydrothermal power resources and 20 % of EGS resources are developed by 2050, thesecapacities would be 218 GWe and 300 GWe, respectively, and their total installed capacity would be518 GWe. When the capacity factor is assumed to be 0.72 and the unit reduction of carbon dioxideemission by the replacement from the oil thermal power to geothermal power is assumed to be 817 g-CO2/kWh (Mongillo 2005), it could reduce carbon dioxide emission by 2.67 Gton/year.
If 20 % of direct-use geothermal resources are developed by 2050, its installed capacity would be880 GWth. When the capacity factor is assumed to be 0.27 and the reduction unit of carbon dioxide
386
1950
200 270 520 7201,180
2,110
4,764
5,834
6,833
7,972
8,933
10,715
0
2,000
4,000
6,000
8,000
10,000
12,000
1960 1970 1980Calendar year
Inst
alle
d ca
paci
ty (
MW
)
1990 2000 2010
Fig. 13 Growing installed geothermal power capacity in the world (Bertani 2010)
Handbook of Climate Change Mitigation and AdaptationDOI 10.1007/978-1-4614-6431-0_35-2# Springer Science+Business Media New York 2015
Page 17 of 23

emission by the replacement from the oil fuels to geothermal energy is assumed to be 409 g-CO2/kWh(Mongillo 2005), it could reduce carbon dioxide emission by 0.50 Gton/year. Both geothermal electricityand direct use could reduce carbon dioxide emission by 3.17 Gton/year, which is 11 % of the presentworldwide emission.
Table 2 Installed geothermal power capacity and electricity production in the world (Bertani 2010)
Country Installed in 2005 (MW) Energy in 2005 (GWh) Installed in 2010 (MW) Energy in 2010 (GWh)
Argentina 0 0 0 0
Australia 0.2 0.5 1.1 0.5
Austria 1.1 3.2 1.4 3.8
Canada 0 0 0 0
Chile 0 0 0 0
China 28 96 24 150
Costa Rica 163 1,145 166 1,131
El Salvador 151 967 204 1,422
Ethiopia 7.3 0 7.3 10
France 15 102 16 95
Germany 0.2 1.5 6.6 50
Greece 0 0 0 0
Guatemala 33 212 52 289
Honduras 0 0 0 0
Hungary 0 0 0 0
Iceland 202 1,483 575 4,597
Indonesia 797 6,085 1,197 9,600
Italy 791 5,340 843 5,520
Japan 535 3,467 536 3,064
Kenya 129 1,088 167 1,430
Mexico 953 6,282 958 7,047
Nevis 0 0 0 0
New Zealand 435 2,774 628 4,055
Nicaragua 77 271 88 310
Papua New Guinea 6 17 56 450
Philippines 1,930 9,253 1,904 10,311
Portugal 16 90 29 175
Romania 0 0 0 0
Russia 79 85 82 441
Spain 0 0 0 0
Slovakia 0 0 0 0
Thailand 0.3 1.8 0.3 2
Netherlands 0 0 0 0
Turkey 20 105 82 490
USA 2,564 16,840 3,093 16,603
Total 8,933 55,709 10,715 67,246
Handbook of Climate Change Mitigation and AdaptationDOI 10.1007/978-1-4614-6431-0_35-2# Springer Science+Business Media New York 2015
Page 18 of 23

19950
50,000
112,441
190,699
272,372
438,071
100,000
150,000
200,000
250,000
300,000
350,000
400,000
450,000
500,000
2000 2005Calendar year
Util
izat
ion
(TJ/
yr)
2010
Fig. 14 Growing direct geothermal use in the world (Lund et al. 2010)
Table 3 Direct geothermal utilization in the world (Lund et al. 2010)
Country Capacity (MWt) Annual use (TJ/year) Annual use (GWh/year) Capacity factor
Albania 11.48 40.46 11.20 0.11
Algeria 55.64 1,723.13 478.70 0.98
Argentina 307.47 3,906.74 1,085.30 0.40
Armenia 1.00 15.00 4.20 0.48
Australia 33.33 235.10 65.30 0.22
Austria 662.85 3,727.70 1,035.60 0.18
Belarus 3.42 33.79 9.40 0.31
Belgium 117.90 546.97 151.90 0.15
Bosnia and Herzegovina 21.70 255.36 70.90 0.37
Brazil 360.10 6,622.40 1,839.70 0.58
Bulgaria 98.30 1,370.12 380.60 0.44
Canada 1,126.00 8,873.00 2,464.90 0.25
Caribbean islands 0.10 2.78 0.80 0.85
Chile 9.11 131.82 36.60 0.46
China 8,898.00 75.348.30 20,931.80 0.27
Columbia 14.40 287.00 79.70 0.63
Costa Rica 1.00 21.00 5.80 0.67
Croatia 67.48 468.89 130.30 0.22
Czech Republic 151.50 922.00 256.10 0.19
Denmark 200.00 2,500.00 694.50 0.40
Ecuador 5.16 102.40 28.40 0.63
Egypt 1.00 15.00 4.20 0.48
El Salvador 2.00 40.00 11.10 0.63
Estonia 63.00 356.00 98.90 0.18
Ethiopia 2.20 41.60 11.60 0.60
Finland 857.90 8,370.00 2,325.20 0.31
France 1,345.00 12,929.00 3,591.70 0.30
Georgia 24.51 659.24 183.10 0.85
Germany 2,485.40 12,764.50 3,546.00 0.16
Greece 134.60 937.80 260.50 0.22
Guatemala 2.31 56.46 15.70 0.78
(continued)
Handbook of Climate Change Mitigation and AdaptationDOI 10.1007/978-1-4614-6431-0_35-2# Springer Science+Business Media New York 2015
Page 19 of 23

Table 3 (continued)
Country Capacity (MWt) Annual use (TJ/year) Annual use (GWh/year) Capacity factor
Honduras 1.93 45.00 12.50 0.74
Hungary 654.60 9,767.00 2,713.30 0.47
Iceland 1,826.00 24,361.00 6,767.50 0.42
India 265.00 2,545.00 707.00 0.30
Indonesia 2.30 42.60 11.80 0.59
Iran 41.61 1,064.18 295.60 0.81
Ireland 152.88 764.02 212.20 0.16
Israel 82.40 2,193.00 609.20 0.84
Italy 867.00 9,941.00 2,761.60 0.36
Japan 2,099.53 25,697.94 7,138.90 0.39
Jordan 153.30 1,540.00 427.80 0.32
Kenya 16.00 126.62 35.20 0.25
Korea (South) 229.30 1,954.65 543.00 0.27
Latvia 1.63 31.81 8.80 0.62
Lithuania 48.10 411.52 114.30 0.27
Macedonia 47.18 601.41 167.10 0.40
Mexico 155.82 4,022.80 1,117.50 0.82
Mongolia 6.80 213.20 59.20 0.99
Morocco 5.02 79.14 22.00 0.50
Nepal 2.72 73.74 20.50 0.86
Netherlands 1,410.26 10,699.40 2,972.30 0.24
New Zealand 393.22 9,552.00 2,653.50 0.77
Norway 3,300.00 25,200.00 7,000.60 0.24
Papua New Guinea 0.10 1.00 0.30 0.32
Peru 2.40 49.00 13.60 0.65
Philippines 3.30 39.58 11.00 0.38
Poland 281.05 1,501.10 417.00 0.17
Portugal 28.10 386.40 107.30 0.44
Romania 153.24 1,265.43 351.50 0.26
Russia 308.20 6,143.50 1,706.70 0.63
Serbia 100.80 1,410.00 391.70 0.44
Slovak Republic 132.20 3,067.20 852.10 0.74
Slovenia 104.17 1,136.39 315.70 0.35
South Africa 6.01 114.75 31.90 0.61
Spain 141.04 684.05 190.00 0.15
Sweden 4,460.00 45,301.00 12,584.60 0.32
Switzerland 1,060.90 7,714.60 2,143.10 0.23
Tajikistan 2.93 55.40 15.40 0.60
Thailand 2.54 79.10 22.00 0.99
Tunisia 43.80 364.00 101.10 0.26
Turkey 2,084.00 36,885.90 10,246.90 0.56
Ukraine 10.90 118.80 33.00 0.35
UK 186.62 849.74 236.10 0.14
USA 12,611.46 56,551.80 15,710.10 0.14
Venezuela 0.70 14.00 3.90 0.63
Vietnam 31.20 92.33 25.60 0.09
Yemen 1.00 15.00 4.20 0.48
Total 50,583.12 438,070.66 121,695.90 0.27
Handbook of Climate Change Mitigation and AdaptationDOI 10.1007/978-1-4614-6431-0_35-2# Springer Science+Business Media New York 2015
Page 20 of 23

Future Directions
Available geothermal energy could commonly increase with increasing depth of drill holes in anygeothermal gradient regions. The deepest hole ever drilled was the SG-3 well in Kola Peninsula, Russia,that reached a depth of 12,262 m, only 0.2 % of a radius of the earth (Fuchs et al. 1990). There still remainvoluminous unexploited crust and upper mantle, and new technology will open a variety of techniques toutilize the enormous heat in the earth’s interior. Many researchers thought that only volcanic countriesenabled geothermal power generation in the 1970s. However, today, less volcanic countries such asGermany, Australia, France, and Switzerland are leading the EGS technology development for geother-mal power generation. A 1.5-MWe pilot power plant for the EGS has been operating in Soultz, France,since June 2008. Geothermal utilization technology thus may achieve the goal of the EGS, where everycountry can use geothermal energy.
References
Bertani R (2010) Geothermal power generation in the world 2005-2010 update report. In: Proceedings ofworld geothermal congress 2010 (CD-ROM), Bali, 41 p
Brace WF, Kohlstedt DL (1980) Limits on lithospheric stress imposed by laboratory experiments.J Geophys Res 85(B11):6248–6252
Brook CA, Mariner RH, Mabey DR, Swanson JR, Guffanti M, Muffler LJP (1979) Hydrothermalconvection systems with reservoir temperature �90�C. In: Assessment of geothermal resources ofthe United States – 1978, vol 790, Circular. U.S. Geological Survey, Oak Ridge, pp 18–85
Buonasorte G, Cataldi R, Passaleva G (2007) Geothermal development in Italy: from present to future. In:Proceedings of European geothermal congress 2007 (CD-ROM), Unterhaching, 9 p
Darma S, Harsoprayitno S, Setiawan B, Hadyanto, Sukhyar R, Soedibjo AW, Ganefianto N, StimacJ (2010) Geothermal energy update: geothermal energy development and utilization in Indonesia. In:Proceedings of world geothermal congress 2010 (CD-ROM), Bali, 13 p
Dickson MH, Fanelli M (2004) What is geothermal energy? http://www.geothermal-energy.org/314,what_is_geothermal_energy.html
Fournier RO (1991) The transition from hydrostatic to greater than hydrostatic fluid pressure in presentlyactive continental hydrothermal systems in crystalline rock. Geophys Res Lett 18:6248–6252
Fuchs K, Kozlovsky EA, Krivtsov AI, Zoback MD (1990) Super-deep continental drilling and deepgeophysical sounding. Springer, Berlin, 436 p
Steamflash
power
Binarycyclepower
T< 42°C
42°C<T< 100°C
80°C<T< 180°C
180°C<T
Hot water supply,space heating
Greenhouse, snow melting, fish farming
Fig. 15 A concept of the cascade utilization of geothermal energy
Handbook of Climate Change Mitigation and AdaptationDOI 10.1007/978-1-4614-6431-0_35-2# Springer Science+Business Media New York 2015
Page 21 of 23

Kaieda H (2009) Hot dry rock geothermal power technology. In: Kaieda H et al (eds) Geothermal powergeneration. Thermal and Nuclear Power Engineering Society, Tokyo, pp 117–126 (in Japanese)
Kanamori H (1978) Chapter 2: structure of the earth. In: Uyeda S,Mizutani H (eds) Iwanami earth sciencelecture course 1: earth. Iwanami-Shoten, Tokyo, pp 45–98 (in Japanese)
Lawless J (2002) New Zealand’s geothermal resources revised. In: Proceedings of the New Zealandgeothermal association seminar, Taupo
Lindquist KG, Engle K, Stahlke D, Price E (2004) Global topography and bathymetry grid improvesresearch efforts. EOS Trans AGU 85(19):186
Lund JW, Freeston DH, Boyd TL (2010) Direct utilization of geothermal energy 2010 worldwide review.In: Proceedings of world geothermal congress 2010 (CD-ROM), Bali, 23 p
Manning CE, Ingebritsen SE (1999) Permeability of the continental crust: implications of geothermal dataand metamorphic systems. Rev Geophys 37:127–150
Ministry of the Environment, Japan (2011) State of utilization of hot springs in the fiscal year 2009. 1 p(in Japanese). http://www.env.go.jp/nature/onsen/data/index.html
Mizutani H, Watanabe T (1978) Chapter 4: geothermal science. In: Uyeda S, Mizutani H (eds) Iwanamiearth science lecture course 1: earth. Iwanami-Shoten, Tokyo, pp 169–223 (in Japanese)
Mongillo MA (2005) Saving factors for geothermal energy utilization. International Energy Agency(IEA) – Geothermal Implementing Agreement (GIA), 4 p
Muffler LJP, Cataldi R (1978) Methods for regional assessments. Geothermics 7:53–89Mulas de Pozo P, Gómez DN, Holland FA (1985) Developments in geothermal energy in Mexico – part
one: general considerations. Heat Recovery Syst 5:277–283Muraoka H (1993) A scope of the picture of future geothermal resources in the viewpoint from magma.
Chinetsu (Geothermal) 30:100–126 (in Japanese)Muraoka H (2005) The blessings of volcanoes: the front line of the utilization of geothermal heat. AIST
Today 16:16Muraoka H, Ohtani T (2000) Profiling of the Kakkonda geothermal system by the bulk rock chemical
analyses of the well WD-1a. Rept Geol Surv Jpn 284:35–55 (in Japanese with English abstract)Muraoka H, Uchida T, Sasada M, Yagi M, Akaku K, Sasaki M, Yasukawa K, Miyazaki S-I, Doi N,
Saito S, Sato K, Tanaka S (1998) Deep geothermal resources survey program: igneous, metamorphicand hydrothermal processes in a well encountering 500�C at 3729 m depth, Kakkonda, Japan.Geothermics 27:507–534
Muraoka H, Tateno M, Okubo Y (1999) Brittle-plastic transition penetrated by the well WD-1a beneaththe Kakkonda geothermal field, Japan. In: Proceedings of the GSJ workshop “Fault Rocks and SeismicProcess”, Geol. Surv. Japan Interim Report, no. EQ/99/1, pp 66–68
Muraoka H, Sakaguchi K, Tamanyu S, Sasaki M, Shigeno H, Mizugaki K (2007) Atlas of hydrothermalsystems in Japan. Geological Survey of Japan, AIST, Tsukuba, 110 p (in Japanese with Englishabstract)
Muraoka H, Sakaguchi K, Komazawa M, Sasaki S (2008) 2008 assessment of hydrothermal resourcespotentials in Japan. In: Abstracts of 2008 meeting of Geotherm. Res. Soc. Japan, Kanazawa, B01(in Japanese)
New Energy and Industrial Technology Development Organization (1996) FY 1995 report of the deepgeothermal resources survey program. 887 p (in Japanese)
Palmason G, Johnsen GV, Torfason H, Saemundsson K, Ragnars K, Haraldsson GI, Halldorsson GK(1985) Assessment of the geothermal resources of Iceland. Orkustofnun Report OS-85076/JHD-10,134 p (in Icelandic)
Handbook of Climate Change Mitigation and AdaptationDOI 10.1007/978-1-4614-6431-0_35-2# Springer Science+Business Media New York 2015
Page 22 of 23

Siebert L, Simkin T (2002) Volcanoes of the world: an illustrated catalog of holocene volcanoes and theireruptions. Smithsonian Institution, Global Volcanism Program, Digital Information Series, GVP-3.http://www.volcano.si.edu/world/
Stefansson V (2005) World geothermal assessment. In: Proceedings of world geothermal congress 2005(CD-ROM), Antalya, 6 p
Tajika E (1996) Chapter 2: composition of the earth. In: Matsui T et al (eds) Iwanami earth science lecturecourse 1: introduction to earth and planetary sciences. Iwanami-Shoten, Tokyo, pp 47–100(in Japanese)
Takahashi E (1996) Chapter 3: differentiation. In: Matsui T et al (eds) Iwanami earth science lecturecourse 1: introduction to earth and planetary sciences. Iwanami-Shoten, Tokyo, pp 111–161(in Japanese)
Tester JW, Anderson BJ, Batchelor AS, Blackwell DD, DiPippo R, Drake EM, Garnish J, Livesay B,Moore MC, Nichols K, Petty S, Toksöz MN, Veatch RW Jr (2006) The future of geothermalenergy – impact of enhanced geothermal systems (EGS) on the United States in the 21st century.Massachusetts Institute of Technology, Cambridge, MA, 358 p
Wessel P, Smith WHF (1998) New, improved version of the generic mapping tools released. EOS TransAGU 79:579
Williams CF, Reed MJ, Mariner RH, DeAngelo J, Galanis SP Jr (2008) Assessment of moderate- andhigh-temperature geothermal resources of the United States. Fact Sheet 2008-3082, U.S. GeologicalSurvey, 4 p
Wright PM (1999) Summary of worldwide geothermal resources. Lecture given at the United NationsUniversity Geothermal Training Programme
Zheng K (2004) Newest statistics of geothermal development in China. In: Proceedings of 6th Asiangeothermal symposium, Daejeon, pp 85–90
Handbook of Climate Change Mitigation and AdaptationDOI 10.1007/978-1-4614-6431-0_35-2# Springer Science+Business Media New York 2015
Page 23 of 23