GEOTECHNICAL SERIES 100 REPORT - Maine
69
Maine Department of Transportation Highway Program GEOTECHNICAL SERIES 100 REPORT Route 1 Dennysville – Pembroke Prepared by: Scott A. Hayden, C.G. Soils Research Scientist Washington County PIN 17774.10 Soils Report 2010-110 June 14, 2010
Transcript of GEOTECHNICAL SERIES 100 REPORT - Maine
Maine Department of Transportation Highway Program
GEOTECHNICAL SERIES 100 REPORT
Route 1 Dennysville – Pembroke
Prepared by: Scott A. Hayden, C.G.
Soils Research Scientist
Washington County PIN 17774.10 Soils Report 2010-110 June 14, 2010
Memorandum
DATE: June 14, 2010
TO: Dennis Lovely DEPT: Region 4 FROM: Scott A. Hayden DEPT: Highway Program SUBJECT: Final Soils – Dennysville/Pembroke Route 1, 17774.10 Report # 2010-110 Project Description A subsurface investigation has been completed for a 2.3 mile portion of Route 1 in the towns of Dennysville and Pembroke. The project begins in Dennysville, 0.03 miles south of the intersection of Cross Road, and extends 2.3 miles northeast ending in Pembroke. The investigation included the use of a drill rig and falling weight deflectometer (FWD). Stationing was determined by using a distance measuring instrument (DMI). A beginning station of 10+00 was used as identified in the field by Region 4 personnel. This project is located in the downeast coastal area. The topography undulates slightly with several relatively small knolls present. Depth to bedrock is relatively shallow (<15’) throughout the project area but is very shallow (<5’) beneath the knolls. Till soils are commonly encountered at the higher elevations associated with these knolls whereas marine clays are encountered in the lower lying areas. FWD Results
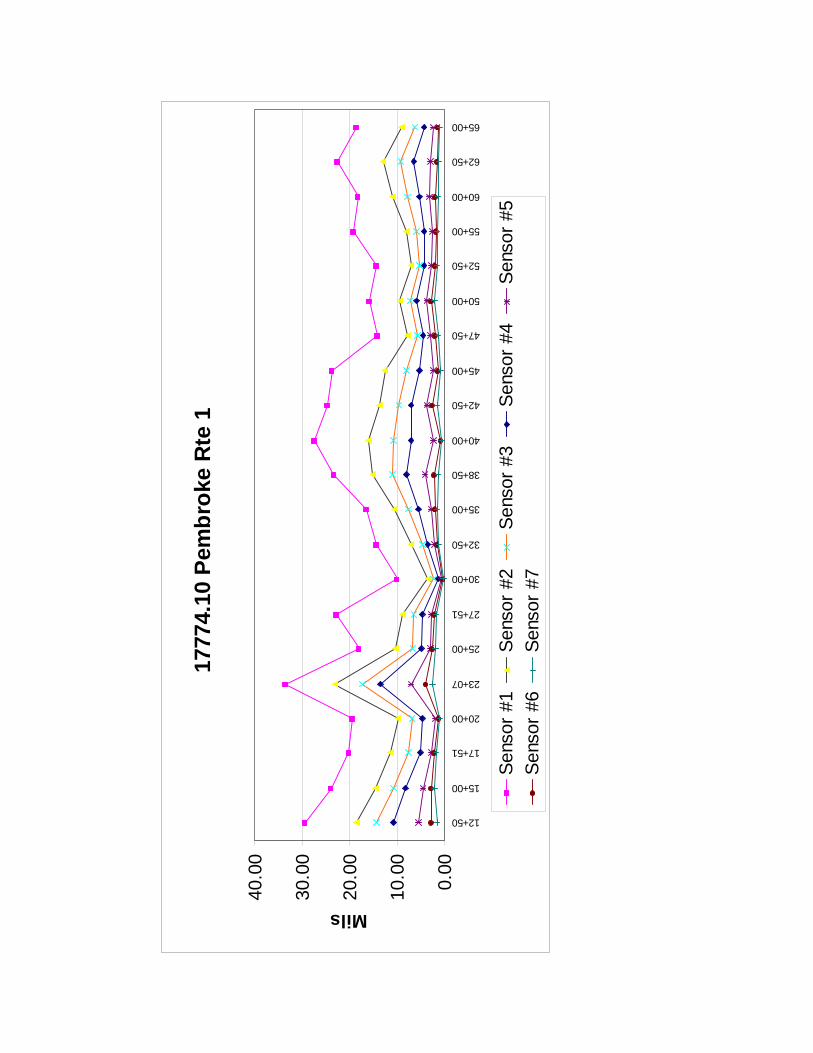
The FWD results are detailed in an attachment following this memo. The existing pavement performance and subgrade conditions are very poor along this project. The pavement is rough and heavily cracked. Many of these rough areas are associated with existing bedrock cut sections. Other areas along the project are severely rutted. The outside wheel path has been shimmed in many of these areas. This rutting is likely due to a bearing failure in the underlying, moisture sensitive, marine clay/silt. Due to the geologic conditions in this area it is anticipated that bedrock will be relatively shallow throughout the project area. This can result in abnormally high subgrade resilient modulus values ( Mr ). The subgrade soil conditions along this project consist of marine clay/silt and sandy silt (till). Based on other Maine highway projects, these soil conditions commonly have a Mr value between 2200psi - 3500psi and 4000psi – 4800psi respectively. However, FWD testing within existing bedrock cut sections produced Mr values as high as 28,557psi. It is obvious that extreme values like this are an indication of the bedrock surface and not the overlying till soil.
Highway Program Brad Foley, Program Manager

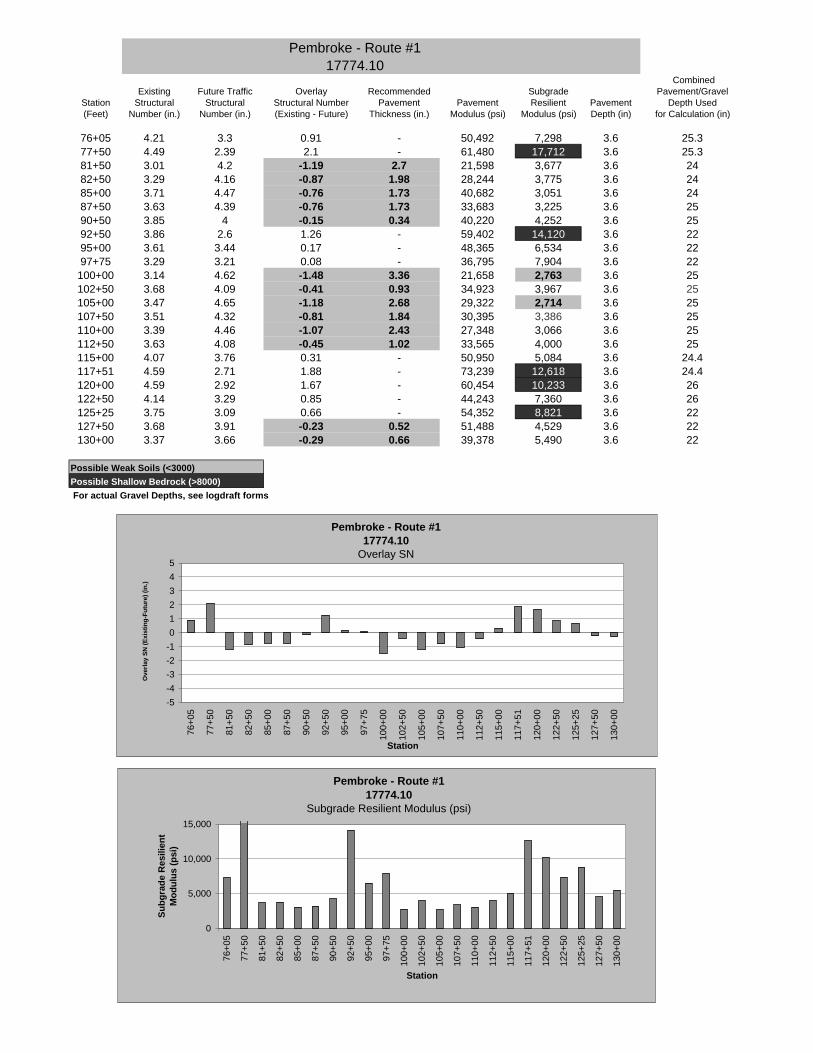
However, the affect of a relatively shallow bedrock surface on the subgrade resilient modulus value is not always this obvious. The existing pavement structure along this project generally consists of 4 inches of pavement and 24 inches of base material. This substantial pavement structure has failed (severe rutting) in many areas throughout the project. It would be reasonable to anticipate a Mr value in the range of 2200psi – 3200psi throughout most of these failed areas based upon the marine clay subgrade soil conditions. However, a much higher value, generally in the range of 3600psi-4200psi was encountered. It is anticipated that the presence of a relatively shallow bedrock surface has affected these values. Thus it is probable that the actual subgrade resilient modulus values for the overlying soils are lower than the values presented in the FWD analysis. This possibility should be taken into consideration during the design and construction process. Lastly, very low (<3000psi) subgrade resilient modulus values were encountered at stations 23+07, 100+00, 105+00, and 110+00. However, these areas of very low subgrade resilent modulus are likely under represented in the FWD analysis due to the reasons described above. As a result it should be noted; any area along this project that is underlain by marine clay/silt or sandy silt could become problematic especially during spring and early summer. Depending on the conditions at the time of construction the use of additional base material and/or geosynthetics may be necessary to support traffic once the existing pavement surface has been removed. Areas of greatest concern are listed below:
Station Soil Type Sample #
Water Content
% Passing # 200
20+50 – 24+50 Clay S2 26 96 61+00 – 65+00 Sandy Silt S5 16 59 71+50 – 74+50 Till/Rock/Water S5 16 59 78+00 – 115+00 Clay S9, S11 20 - 23 88 - 94 120+00 – 122+75 Clay/Fill Pocket S9, S11 20 - 23 88 - 94
Note: The FWD results provided in this memo are calculated using the existing pavement thickness, existing base thickness, and base quality as determined from boring information and sample data results. Thus the FWD results reflect the existing soil conditions and pavement structure. The FWD information contained in this memo is used in conjunction with subsurface exploration data to identify potential performance disparities along the project area. These areas are determined and illustrated using the attached Performance Data Summary Sheet. By identifying potential areas of differing performance, specific design and construction options can be considered and developed for each practical area. This can potentially provide greater design flexibility and reduce costs by eliminating the “one design fits all” approach which results in substantial areas being over designed or under designed. See the attached Performance Data Summary Sheet.

Boring Information The purpose of the subsurface investigation was to obtain subsurface soil, bedrock, and ground water information. Subsurface explorations were conducted by Maine DOT using a CME 45C truck mounted drill rig. Bore hole logging was performed by Maine DOT. A total of 15 power augers borings were conducted along the project (See Boring Logs). Power auger borings were conducted using 5” solid stem augers. Boring locations were determined based upon FWD deflection results and visual observations made during an on-site visit. Soils were described and sampled from the auger flights. Four test pits were dug in the shoulders by Region 4 personnel. A total of 20 soil samples were collected from the power auger borings and test pits and tested at the Maine DOT Materials and Testing laboratory, located in Bangor Maine. Grain size and water content testing was conducted on each sample. Based upon laboratory test results, soil samples were classified according to the Unified Classification System, AASHTO Soil Classification and Maine DOT Frost Susceptibility Rating. Testing results are summarized on the attached Laboratory Testing Summary Sheet. Pavement Conditions Pavement conditions are poor to fair. Although the existing pavement is rough and relatively thin, no unbound or highly friable pavement layers were encountered. For a complete listing of pavement measurements refer to boring logs and pavement core summary sheet. A pavement thickness summary follows:
Range of Solid Pavement (SP) Thickness: 2.4” – 6.0” Average Solid Pavement Thickness: 3.8”
Note: Pavement thickness estimates are based upon 15 power auger borings and 4 pavement cores. The maximum sample spacing is 2000 feet with an average spacing of 832 feet. Actual pavement thickness may vary.
Existing Base Material Existing Base Material Type: silty sandy Gravel silty gravelly Sand Percent Passing #200: 8% - 17% Range of Base Material Thickness: 20” – 27” Average Thickness: 24” Quality of Drainage (AASHTO): Poor to Fair Permeability: 4’ – 44’ per day The existing base generally consists of silty gravelly sand (gravel borrow). Because of the high percentage of fines the quality of drainage is limited. An estimated permeability range of 4 – 44 feet/day has been calculated based upon grain size distribution data obtained from existing base
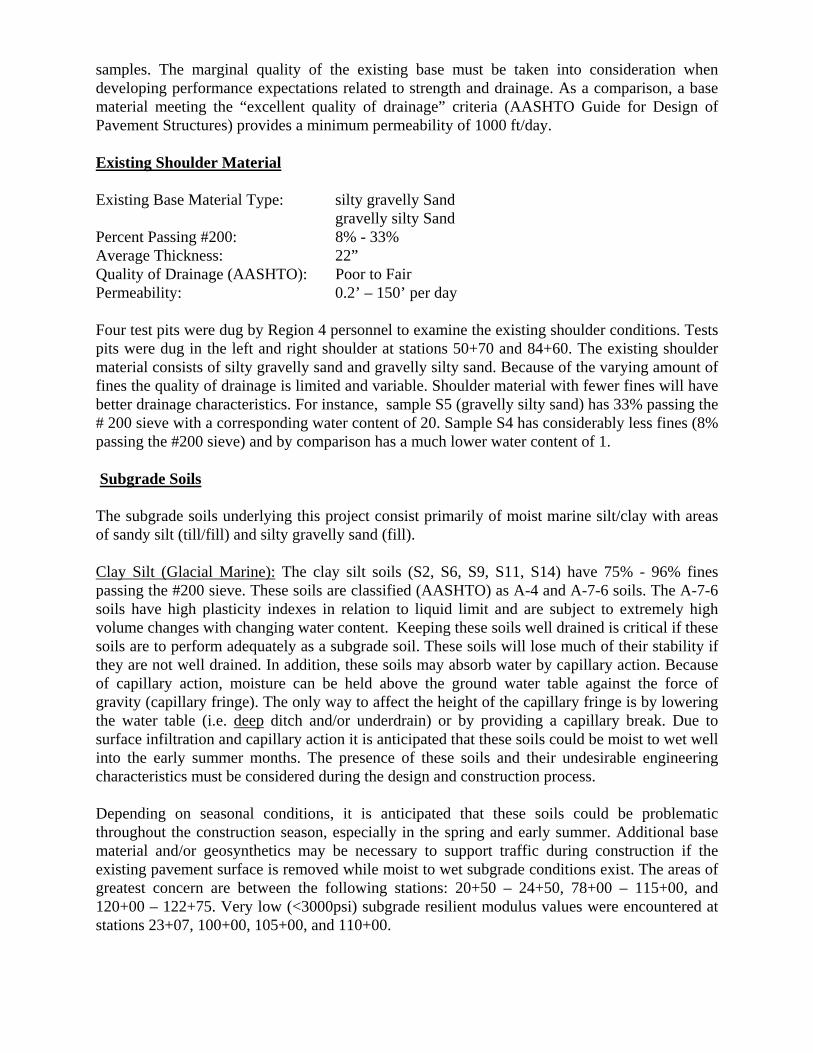
samples. The marginal quality of the existing base must be taken into consideration when developing performance expectations related to strength and drainage. As a comparison, a base material meeting the “excellent quality of drainage” criteria (AASHTO Guide for Design of Pavement Structures) provides a minimum permeability of 1000 ft/day. Existing Shoulder Material Existing Base Material Type: silty gravelly Sand gravelly silty Sand Percent Passing #200: 8% - 33% Average Thickness: 22” Quality of Drainage (AASHTO): Poor to Fair Permeability: 0.2’ – 150’ per day Four test pits were dug by Region 4 personnel to examine the existing shoulder conditions. Tests pits were dug in the left and right shoulder at stations 50+70 and 84+60. The existing shoulder material consists of silty gravelly sand and gravelly silty sand. Because of the varying amount of fines the quality of drainage is limited and variable. Shoulder material with fewer fines will have better drainage characteristics. For instance, sample S5 (gravelly silty sand) has 33% passing the # 200 sieve with a corresponding water content of 20. Sample S4 has considerably less fines (8% passing the #200 sieve) and by comparison has a much lower water content of 1. Subgrade Soils The subgrade soils underlying this project consist primarily of moist marine silt/clay with areas of sandy silt (till/fill) and silty gravelly sand (fill).
Clay Silt (Glacial Marine): The clay silt soils (S2, S6, S9, S11, S14) have 75% - 96% fines passing the #200 sieve. These soils are classified (AASHTO) as A-4 and A-7-6 soils. The A-7-6 soils have high plasticity indexes in relation to liquid limit and are subject to extremely high volume changes with changing water content. Keeping these soils well drained is critical if these soils are to perform adequately as a subgrade soil. These soils will lose much of their stability if they are not well drained. In addition, these soils may absorb water by capillary action. Because of capillary action, moisture can be held above the ground water table against the force of gravity (capillary fringe). The only way to affect the height of the capillary fringe is by lowering the water table (i.e. deep ditch and/or underdrain) or by providing a capillary break. Due to surface infiltration and capillary action it is anticipated that these soils could be moist to wet well into the early summer months. The presence of these soils and their undesirable engineering characteristics must be considered during the design and construction process. Depending on seasonal conditions, it is anticipated that these soils could be problematic throughout the construction season, especially in the spring and early summer. Additional base material and/or geosynthetics may be necessary to support traffic during construction if the existing pavement surface is removed while moist to wet subgrade conditions exist. The areas of greatest concern are between the following stations: 20+50 – 24+50, 78+00 – 115+00, and 120+00 – 122+75. Very low (<3000psi) subgrade resilient modulus values were encountered at stations 23+07, 100+00, 105+00, and 110+00.

Sandy Silt (Till): The sandy silts along this project are represented by sample S5. This material is classified (AASHTO) as an A-4 soil with 59% passing the # 200 sieve. These soils are highly frost susceptible. It is anticipated that the depth to bedrock will be shallow when these soils are encountered. These soils can perform adequately as a subgrade soil if they are properly compacted and drained. However, these soils will swell and lose much of their stability if they are not properly compacted and drained. If these soils are not well drained additional base material may be necessary to support traffic during construction once the existing pavement surface is removed. Currently, these soils may not be performing well between stations 61+00 and 74+50. This area could be problematic during construction in the spring and early summer. Additional base material may be necessary to support traffic during construction if the existing pavement surface is removed while moist to wet subgrade conditions exist. It is critical that this area be well drained. It should be noted that bedrock is near or at subgrade between stations 71+50 – 74+50. In addition, there is an existing underdrain outlet on the right at station 72+60. The outlet is buried but water is percolating up through the soil. The origin of this water may be from spring activity exiting the shallow bedrock surface. A summary of the anticipated subgrade soils is listed on the next page (Table I) based upon limited subsurface exploration and FWD deflection data. Actual field conditions may vary.

Table 1. Anticipated Subgrade Soil Conditions
Station
Soil Description
AASHTO /
Unified
Sample
%
#200 10+00 – 19+00 ClSi A-7-6 / CL S2 96 19+00 – 22+50 ClSi / Rock A-7-6 / CL S2 96 22+50 – 28+00 ClSi A-7-6 / CL S2 96 28+00 – 34+50 Bedrock/Till/Fill A-4 / ML S5 59 34+50 – 38+00 ClSi A-7-6 / CL S2 96 38+00 – 48+00 Bedrock/Till A-4 / ML S5 59 48+00 – 50+50 SaClSi / Fill A-4 / CL-ML S6 75 50+50– 51+75 GSaSi (Till) A-4 / ML S5 59 51+75 – 55+00 SaClSi A-4 / CL-ML S6 75 55+00 – 57+50 Bedrock/Till A-4 / ML S5 59 57+50 – 70+50 GSaSi (Till) A-4 / ML S5 59 70+50 – 74+00 Bedrock/Till A-4 / ML S5 59 74+00 – 75+00 GSaSi (Till) A-4 / ML S5 59 75+00 – 76+50 ClSi A-7-6 / CL S9 94 76+50 – 80+00 Bedrock/ClSi A-7-6 / CL S9 94 80+00 – 91+50 ClSi A-7-6 / CL S9 94 91+50 – 93+50 Bedrock/Till A-4 / ML S5 59 93+50 – 96+50 GSaSi (Till) A-4 / ML S5 59 96+50 – 99+50 Bedrock/Till A-4 / ML S5 59 99+50 – 102+00 ClSi A-7-6 / CL S11 88 102+00 – 104+00 Bedrock?/Till A-4 / ML S5 59 104+00 – 114+00 ClSi A-7-6 / CL S11 88 114+00 – 117+00 GSaSi (Till) A-2-4 / SM S13 26 117+00 – 120+50 Bedrock/Till A-2-4 / SM S13 26 120+50 – 122+75 ClSi / Fill A-7-6 / CL S11 88 122+75 – 127+00 Bedrock/Till A-2-4 / SM S13 26 127+00 – 132+00 ClSi A-7-6 / CL S14 78
Bedrock Relatively shallow bedrock (< 15’) is anticipated to underlie the entire project area. In many areas the bedrock will be less than < 5’ below the existing ground surface. Multiple bedrock outcrops are present (See Table II). The bedrock in this area consists primarily of basalt belonging to the Edmunds formation. These volcanics vary slightly in texture and mineral assemblage varying from mafic to felsic. Blasting will be required for the removal of this bedrock. It should be noted that the soils in this region may be slightly acidic due to the presense of these volcanics. A pH test of the soils could be taken at different locations along the project if metal drainage structures are to be used.
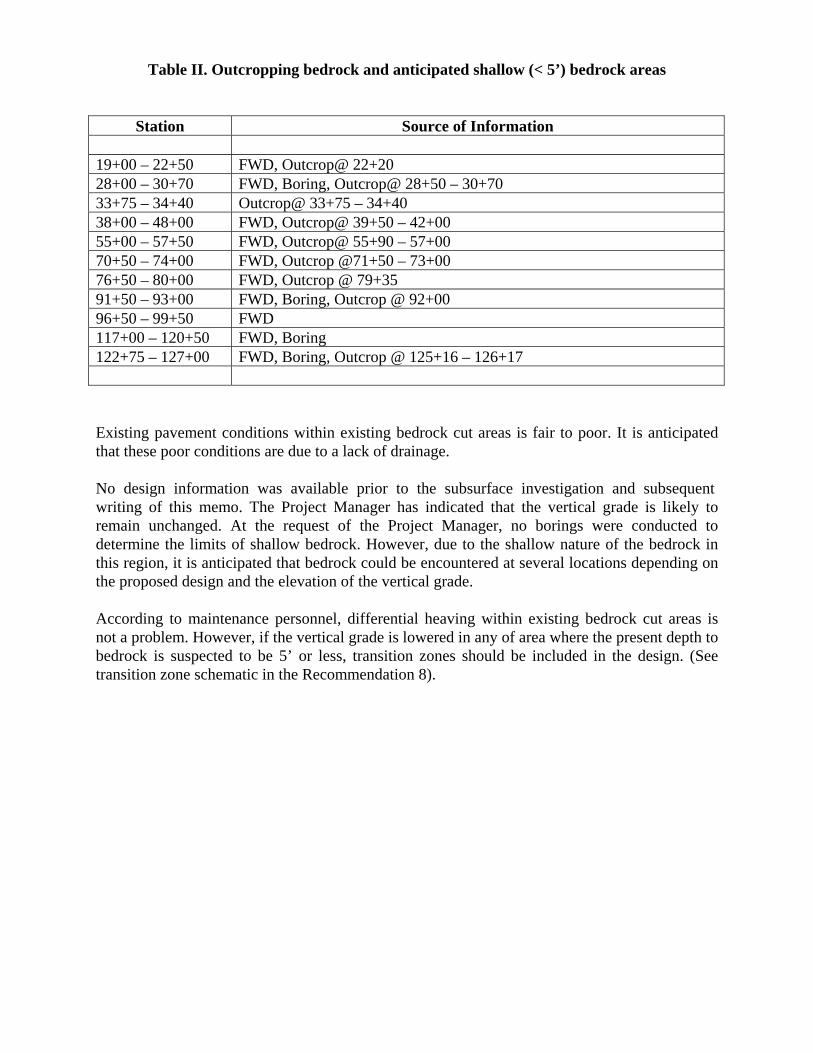
Table II. Outcropping bedrock and anticipated shallow (< 5’) bedrock areas
Station Source of Information 19+00 – 22+50 FWD, Outcrop@ 22+20 28+00 – 30+70 FWD, Boring, Outcrop@ 28+50 – 30+70 33+75 – 34+40 Outcrop@ 33+75 – 34+40 38+00 – 48+00 FWD, Outcrop@ 39+50 – 42+00 55+00 – 57+50 FWD, Outcrop@ 55+90 – 57+00 70+50 – 74+00 FWD, Outcrop @71+50 – 73+00 76+50 – 80+00 FWD, Outcrop @ 79+35 91+50 – 93+00 FWD, Boring, Outcrop @ 92+00 96+50 – 99+50 FWD 117+00 – 120+50 FWD, Boring 122+75 – 127+00 FWD, Boring, Outcrop @ 125+16 – 126+17 Existing pavement conditions within existing bedrock cut areas is fair to poor. It is anticipated that these poor conditions are due to a lack of drainage. No design information was available prior to the subsurface investigation and subsequent writing of this memo. The Project Manager has indicated that the vertical grade is likely to remain unchanged. At the request of the Project Manager, no borings were conducted to determine the limits of shallow bedrock. However, due to the shallow nature of the bedrock in this region, it is anticipated that bedrock could be encountered at several locations depending on the proposed design and the elevation of the vertical grade.
According to maintenance personnel, differential heaving within existing bedrock cut areas is not a problem. However, if the vertical grade is lowered in any of area where the present depth to bedrock is suspected to be 5’ or less, transition zones should be included in the design. (See transition zone schematic in the Recommendation 8).

Recommendations 1. It is recommended that the entire project area be well drained. It is anticipated that the poor
pavement performance in existing bedrock cut areas is due to inadequate drainage. Ditching in these areas should be as deep as possible. Furthermore, failure (severe rutting) of the existing pavement structure is likely due to inadequate drainage of moisture sensitive marine clay/silts. Deep ditching is most critical in these areas where marine clay/silt soils are present in order to draw down the water table. In these areas, ditches should be constructed with a minimum depth of 3 feet below finished grade when possible. Refer to Table I for a listing of the anticipated subgrade soil conditions.
2. It is recommended that all cross pipes be lowered to allow for an adequate ditching depth.
Cross pipes should be installed based upon the following design schematic:
3. Due to the presence of poorly drained moisture sensitive marine clay/silt and silty glacial till,
several areas poise a higher risk of future premature pavement failure. In addition, these areas could become problematic throughout the construction season, especially in the spring and early summer. Additional base material may be necessary to support traffic during construction if the existing pavement surface is removed while moist to wet subgrade conditions exist. Furthermore, additional variable depth gravel placement or full construction should be considered in these areas if future pavement performance expectations are to be realized. The areas of greatest concern are between stations:
20+50 – 24+50, 61+00 - 74+50, 78+00 – 112+00, 120+00 – 122+75
It is recommended that these areas be aggressively drained prior to removing the existing pavement structure.
4. If new base material is to be placed directly upon the marine clay/silt, a 6 once, non-woven,
needle punched separation geotextile should utilized to prevent the intermixing of the new base layer with the underlying marine clay/silt.
5. In addition to the areas of concern listed above in Recommendation 3., any area containing
marine clay/silt could become problematic during construction, especially during the spring. The existing pavement surface should not be removed until necessary or until the subgrade

soil conditions have stabilized. The roadway could become unstable or fail under loading if the existing pavement surface is removed during moist to wet subgrade conditions. Additional base material could be required to support traffic during construction if the subgrade soils become unstable. Refer to Table I for a listing of possible areas where marine clay/silt could be encountered.
6. Full reconstruction is recommended between stations 71+50 – 74+50 due to poor existing
pavement performance, drainage, and the possible presence of a spring. It is recommended that the existing bedrock surface be exposed and examined for spring activity. An underdrain outlet (buried) is present on the right at station 72+60. At the time of this writing, water was seen percolating up through the surface in the vicinity of this buried UD outlet.
7. Full reconstruction or additional variable depth gravel placement over the existing pavement
structure is recommended between stations 78+00 and 112+00 due to the presence of moisture sensitive marine clays, low subgrade resilient modulus values, inadequate drainage, and structural failure of the existing pavement structure.
8. Shallow bedrock is present in many areas along this project. Currently, differential heaving is
not an issue according to maintenance personnel. However, if the vertical grade is lowered differential heaving could become an issue along soil/bedrock contacts. Transition zones should be constructed along soil/bedrock contacts to aid in the prevention of differential heaving. It is recommended that a 2 foot undercut be constructed with a 20:1 transition.

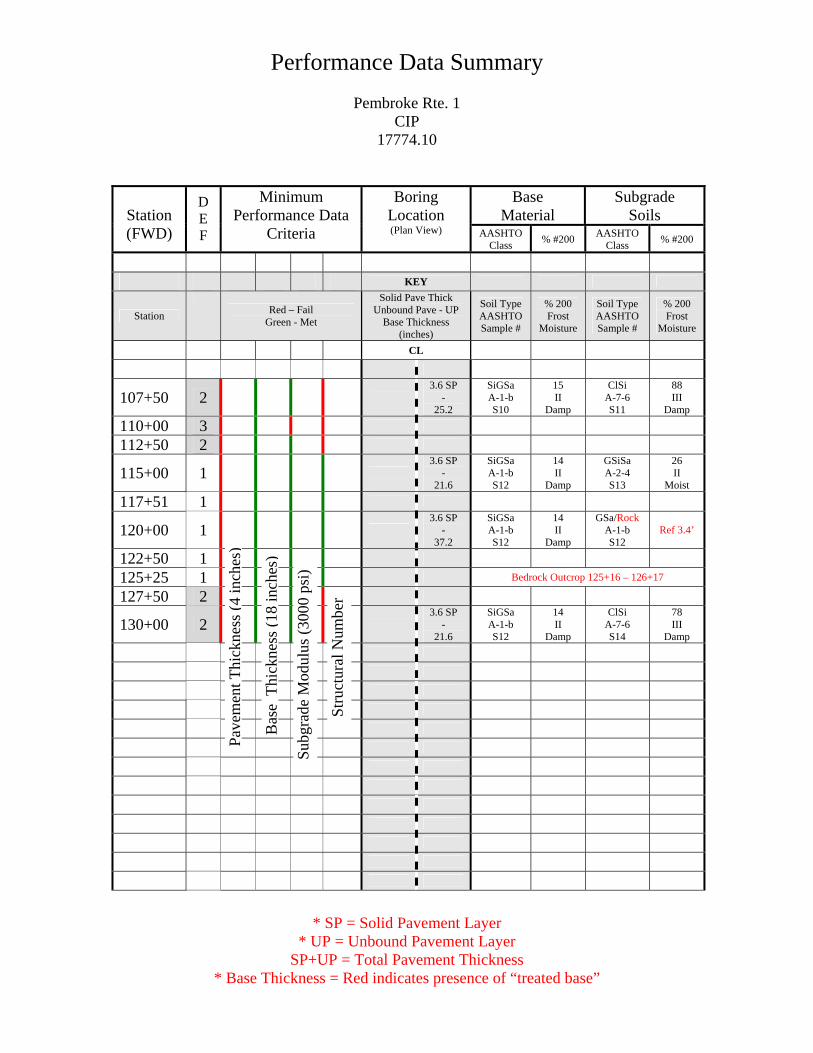
Performance Data Summary
Pembroke Rte. 1 CIP
17774.10
* Base Thickness = Red indicates presence of “treated base”
* SP = Solid Pavement Layer * UP = Unbound Pavement Layer
SP+UP = Total Pavement Thickness
Performance Data Summary A Performance Data Summary (PDS) is included on the next pages. The purpose of the (PDS) is to identify potential performance differences by station based upon 4 minimal performance criteria (asphalt thickness, base thickness, subgrade resilient modulus, and existing/future structural number comparison. The PDS is color coded and should be printed in color to fully utilize the information If an area fails to meet 2 or more of the minimal performance criteria the area will be shaded in the deficiency (DEF) column located next to the Station column. Areas having two or more deficiencies have a lower existing performance expectation and are at a higher risk of pavement structure failure. The presence of shallow bedrock throughout much of this project has caused the subgrade resilient modulus to be abnormally high. In many cases these elevated values have caused the existing structural number to falsely meet or exceed the future structural number. In addition, these elevated values have resulted in fewer low subgrade modulus value (<3000psi) to be identified on the PDS. Because of this, the number in the deficiency column (DEF) on the Performance Data Summary Sheet (PDS) is under estimated. In many instances the value should be increased by one.

Performance Data Summary
Pembroke Rte. 1 CIP
17774.10
* Base Thickness = Red indicates presence of “treated base”
Base
Material Subgrade
Soils
Station (FWD)
D E F
Minimum Performance Data
Criteria
Boring Location (Plan View) AASHTO
Class % #200 AASHTO Class % #200
KEY
Station
Red – Fail
Green - Met
Solid Pave Thick Unbound Pave - UP
Base Thickness (inches)
Soil Type AASHTO Sample #
% 200 Frost
Moisture
Soil Type AASHTO Sample #
% 200 Frost
Moisture
CL
12+50 1
4.8 SP -
20.4
SiGSa A-1-a
S1
12 0
Damp
ClSi A-7-6
S2
96 III
Moist
15+00 1
17+51 1
20+00 2 Bedrock Outcrop 22+20
23+07 3
3.6 SP -
25.2
SiGSa A-1-a
S1
12 0
Damp
ClSi A-7-6
S2
96 III
Moist
25+00 2
27+51 2 Bedrock Outcrop 28+50 – 30+70
30+00 2
* SP = Solid Pavement Layer * UP = Unbound Pavement Layer
SP+UP = Total Pavement Thickness
3.6 SP -
25.2
SiSaG A-1-a
S3
8 0
Damp
Weathered Rock
Ref. 3.8’
32+50 2 Bedrock Outcrop 33+75 – 34+40
35+00 2
38+50 2
3.6 SP -
50.4
SiGSa A-1-b
S4
9 0
Wet
SiGSa A-1-b
S4
9 0
Wet
40+00 2
42+50 2 39+50 – 42+00
Shallow and Outcropping Bedrock
43+07 2 Dennysville / Pembroke Townline
45+00 1
Bas
e T
hick
ness
(18
inch
es)
2.4 SP -
27.6
SiSaG A-1-a
S3
8 0
Damp
GSaSi A-4 S5
59 IV
Wet 2.5’
47+50 1
50+00 1
3.6 SP -
25.2
SiSaG A-1-a
S3
8 0
Damp
SaClSi A-4 S6
75 IV
Moist
52+50 1
55+00 1 Bedrock Outcrop 55+90 – 57+00
60+00 1
62+50 1
3.6 SP -
25.2
SiGSa A-1-b
S7
17 II
Damp
GSaSi A-4 S5
59 IV
Damp
Subg
rade
Mod
ulus
(300
0 ps
i)
Pave
men
t Thi
ckne
ss (4
inch
es)
Stru
ctur
al N
umbe
r

Performance Data Summary
Pembroke Rte. 1 CIP
17774.10
* Base Thickness = Red indicates presence of “treated base”
Base
Material Subgrade
Soils
Station (FWD)
D E F
Minimum Performance Data
Criteria
Boring Location (Plan View) AASHTO
Class % #200 AASHTO Class % #200
KEY
Station
Red – Fail
Green - Met
Solid Pave Thick Unbound Pave - UP
Base Thickness (inches)
Soil Type AASHTO Sample #
% 200 Frost
Moisture
Soil Type AASHTO Sample #
% 200 Frost
Moisture
CL
62+50 1
3.6 SP -
25.2
SiGSa A-1-b
S7
17 II
Damp
GSaSi A-4 S5
59 IV
Damp
65+00 1
67+50 1
70+05 1
71+50 1
72+65 1 Bedrock Outcrop 71+50 – 73+00
Underdrain Present – Possible Spring?
76+05 1
77+50 1 Bedrock Outcrop 79+35
81+50 2
* SP = Solid Pavement Layer * UP = Unbound Pavement Layer
SP+UP = Total Pavement Thickness
82+50 2
3.6 SP -
24.0
SiGSa A-1-b
S8
13 II
Damp
ClSi A-7-6
S9
94 III
Moist
85+00 3
87+50 2
3.6 SP -
25.2
SiGSa A-1-b
S8
13 II
Damp
ClSi A-7-6
S9
94 III
Moist
90+50 2 Bedrock Outcrop 92+00
92+50 1
3.6 SP -
21.6
SiGSa A-1-b
S8
13 II
Damp
ClSi/Rock A-7-6
S9
94 III
Ref 3.2’
95+00 1
Bas
e T
hick
ness
(18
inch
es)
97+75 1
100+00 3
3.6 SP -
25.2
SiGSa A-1-b S10
15 II
Damp
ClSi A-7-6 S11
88 III
Damp
102+50 2
105+00 3
107+50 2
3.6 SP -
25.2
SiGSa A-1-b S10
15 II
Damp
ClSi A-7-6 S11
88 III
Damp
Subg
rade
Mod
ulus
(300
0 ps
i)
Pave
men
t Thi
ckne
ss (4
inch
es)
urm
bal
Nu
er
Stru
ct
Performance Data Summary
Pembroke Rte. 1 CIP
17774.10
* Base Thickness = Red indicates presence of “treated base”
Base
Material Subgrade
Soils
Station (FWD)
D E F
Minimum Performance Data
Criteria
Boring Location (Plan View) AASHTO
Class % #200 AASHTO Class % #200
KEY
Station
Red – Fail
Green - Met
Solid Pave Thick Unbound Pave - UP
Base Thickness (inches)
Soil Type AASHTO Sample #
% 200 Frost
Moisture
Soil Type AASHTO Sample #
% 200 Frost
Moisture
CL
107+50 2
3.6 SP -
25.2
SiGSa A-1-b S10
15 II
Damp
ClSi A-7-6 S11
88 III
Damp
110+00 3
112+50 2
115+00 1
3.6 SP -
21.6
SiGSa A-1-b S12
14 II
Damp
GSiSa A-2-4 S13
26 II
Moist
117+51 1
120+00 1
3.6 SP -
37.2
SiGSa A-1-b S12
14 II
Damp
GSa/Rock A-1-b S12
Ref 3.4’
122+50 1
* SP = Solid Pavement Layer * UP = Unbound Pavement Layer
SP+UP = Total Pavement Thickness
125+25 1 Bedrock Outcrop 125+16 – 126+17
127+50 2
130+00 2
3.6 SP -
21.6
SiGSa A-1-b S12
14 II
Damp
ClSi A-7-6 S14
78 III
Damp
Pave
men
t Thi
ckne
ss (4
inch
es)
Bas
e T
hick
ness
(18
inch
es)
Subg
rade
Mod
ulus
(300
0 ps
i)
Stru
ctur
al N
umbe
r

Falling Weight Deflectometer (FWD) Summary Sheet
Project #: 17774.10 Town(s): Pembroke Route(s): 1 Date Tested: 05/11/2010 Requested By: S. Hayden Direction of Testing: South to North # Of FWD tests: 47 # Of Power Augers/Spoons - 15 Design Life: 12 Yrs Future 18-kip ESALs (Design Life): 819,060 Initial Serviceability: 4.5 Terminal Serviceability: 2.5 Reliability Level: 90 Overall Standard Deviation: .45 Functional Class: Minor Arterial Locations Station (meters) Description Project Stationing Comments:

Pembroke - Route #117774.10
CombinedExisting Future Traffic Overlay Recommended Subgrade Pavement/Gravel
Station Structural Structural Structural Number Pavement Pavement Resilient Pavement Depth Used(Feet) Number (in.) Number (in.) (Existing - Future) Thickness (in.) Modulus (psi) Modulus (psi) Depth (in) for Calculation (in)
12+50 3.5 4.4 -0.9 2.05 29,492 3,208 4.8 25.215+00 3.76 4.14 -0.38 0.86 36,550 3,840 4.8 25.217+51 3.85 3.5 0.35 - 39,211 6,204 4.8 25.220+00 3.83 3.13 0.7 - 38,474 8,496 4.8 25.223+07 3.83 4.79 -0.96 2.18 25,907 2,467 3.6 28.825+00 4.62 3.59 1.03 - 45,172 5,771 3.6 28.827+51 4.16 3.51 0.65 - 33,150 6,163 3.6 28.830+00 5.96 1.99 3.97 - 97,489 28,557 3.6 28.832+50 4.95 3.23 1.72 - 55,573 7,748 3.6 28.835+00 4.76 3.52 1.24 - 49,557 6,133 3.6 28.838+50 3.86 4.01 -0.15 0.34 35,980 4,219 3.6 2640+00 3.46 3.33 0.13 - 25,967 7,150 3.6 2642+50 3.73 3.9 -0.17 0.39 32,476 4,565 3.6 2645+00 4.19 3.25 0.94 - 29,822 7,631 2.4 3047+50 5.22 3.53 1.69 - 57,903 6,056 2.4 3050+00 4.96 3.9 1.06 - 55,901 4,575 3.6 28.852+50 5.03 3.47 1.56 - 58,319 6,358 3.6 28.855+00 4.42 3.35 1.07 - 39,662 7,042 3.6 28.860+00 4.57 3.61 0.96 - 43,834 5,701 3.6 28.862+50 3.69 3.57 0.12 - 33,955 5,896 3.6 25.365+00 3.91 3.26 0.65 - 40,484 7,558 3.6 25.367+50 4.34 3.28 1.06 - 55,406 7,473 3.6 25.370+05 3.99 3.99 0 - 42,970 4,273 3.6 25.372+65 4.27 2.52 1.75 - 52,929 15,401 3.6 25.3
Possible Weak Soils (<3000)Possible Shallow Bedrock (>8000)For actual Gravel Depths, see logdraft forms
Pembroke - Route #117774.10
Subgrade Resilient Modulus (psi)
0
5,000
10,000
15,000
12+5
0
15+0
0
17+5
1
20+0
0
23+0
7
25+0
0
27+5
1
30+0
0
32+5
0
35+0
0
38+5
0
40+0
0
42+5
0
45+0
0
47+5
0
50+0
0
52+5
0
55+0
0
60+0
0
62+5
0
65+0
0
67+5
0
70+0
5
72+6
5
Station
Subg
rade
Res
ilien
t M
odul
us (p
si)
Pembroke - Route #117774.10
Overlay SN
-5-4-3-2-1012345
12+5
0
15+0
0
17+5
1
20+0
0
23+0
7
25+0
0
27+5
1
30+0
0
32+5
0
35+0
0
38+5
0
40+0
0
42+5
0
45+0
0
47+5
0
50+0
0
52+5
0
55+0
0
60+0
0
62+5
0
65+0
0
67+5
0
70+0
5
72+6
5
Station
Ove
rlay
SN (E
xist
ing-
Futu
re) (
in.)
Pembroke - Route #117774.10
CombinedExisting Future Traffic Overlay Recommended Subgrade Pavement/Gravel
Station Structural Structural Structural Number Pavement Pavement Resilient Pavement Depth Used(Feet) Number (in.) Number (in.) (Existing - Future) Thickness (in.) Modulus (psi) Modulus (psi) Depth (in) for Calculation (in)
76+05 4.21 3.3 0.91 - 50,492 7,298 3.6 25.377+50 4.49 2.39 2.1 - 61,480 17,712 3.6 25.381+50 3.01 4.2 -1.19 2.7 21,598 3,677 3.6 2482+50 3.29 4.16 -0.87 1.98 28,244 3,775 3.6 2485+00 3.71 4.47 -0.76 1.73 40,682 3,051 3.6 2487+50 3.63 4.39 -0.76 1.73 33,683 3,225 3.6 2590+50 3.85 4 -0.15 0.34 40,220 4,252 3.6 2592+50 3.86 2.6 1.26 - 59,402 14,120 3.6 2295+00 3.61 3.44 0.17 - 48,365 6,534 3.6 2297+75 3.29 3.21 0.08 - 36,795 7,904 3.6 22
100+00 3.14 4.62 -1.48 3.36 21,658 2,763 3.6 25102+50 3.68 4.09 -0.41 0.93 34,923 3,967 3.6 25105+00 3.47 4.65 -1.18 2.68 29,322 2,714 3.6 25107+50 3.51 4.32 -0.81 1.84 30,395 3,386 3.6 25110+00 3.39 4.46 -1.07 2.43 27,348 3,066 3.6 25112+50 3.63 4.08 -0.45 1.02 33,565 4,000 3.6 25115+00 4.07 3.76 0.31 - 50,950 5,084 3.6 24.4117+51 4.59 2.71 1.88 - 73,239 12,618 3.6 24.4120+00 4.59 2.92 1.67 - 60,454 10,233 3.6 26122+50 4.14 3.29 0.85 - 44,243 7,360 3.6 26125+25 3.75 3.09 0.66 - 54,352 8,821 3.6 22127+50 3.68 3.91 -0.23 0.52 51,488 4,529 3.6 22130+00 3.37 3.66 -0.29 0.66 39,378 5,490 3.6 22
Possible Weak Soils (<3000)Possible Shallow Bedrock (>8000) For actual Gravel Depths, see logdraft forms
Pembroke - Route #117774.10
Subgrade Resilient Modulus (psi)
0
5,000
10,000
15,000
76+0
5
77+5
0
81+5
0
82+5
0
85+0
0
87+5
0
90+5
0
92+5
0
95+0
0
97+7
5
100+
00
102+
50
105+
00
107+
50
110+
00
112+
50
115+
00
117+
51
120+
00
122+
50
125+
25
127+
50
130+
00
Station
Subg
rade
Res
ilien
t M
odul
us (p
si)
Pembroke - Route #117774.10
Overlay SN
-5-4-3-2-1012345
76+0
5
77+5
0
81+5
0
82+5
0
85+0
0
87+5
0
90+5
0
92+5
0
95+0
0
97+7
5
100+
00
102+
50
105+
00
107+
50
110+
00
112+
50
115+
00
117+
51
120+
00
122+
50
125+
25
127+
50
130+
00
Station
Ove
rlay
SN (E
xist
ing-
Futu
re) (
in.)
1777
4.10
Pem
brok
e R
te 1
0.00
10.0
0
20.0
0
30.0
0
40.0
012+50
15+00
17+51
20+00
23+07
25+00
27+51
30+00
32+50
35+00
38+50
40+00
42+50
45+00
47+50
50+00
52+50
55+00
60+00
62+50
65+00
Mils
Sens
or #
1Se
nsor
#2
Sens
or #
3Se
nsor
#4
Sens
or #
5Se
nsor
#6
Sens
or #
7

1777
4.10
Pem
brok
e R
te 1
0.00
10.0
0
20.0
0
30.0
0
40.0
06750
7005
7265
7605
7750
8150
8250
8500
8750
9050
9250
9500
9775
10000
10250
10500
10750
11000
11250
11500
11751
Mils
Sens
or #
1Se
nsor
#2
Sens
or #
3Se
nsor
#4
Sens
or #
5Se
nsor
#6
Sens
or #
7

1777
4.10
Pem
brok
e R
te 1
0.00
10.0
0
20.0
0
30.0
0
40.0
012000
12250
12525
12750
13000
0
0
0
0
0
0
0
0
0
0
0
0
0
0
0
0
Mils
Sens
or #
1Se
nsor
#2
Sens
or #
3Se
nsor
#4
Sens
or #
5Se
nsor
#6
Sens
or #
7

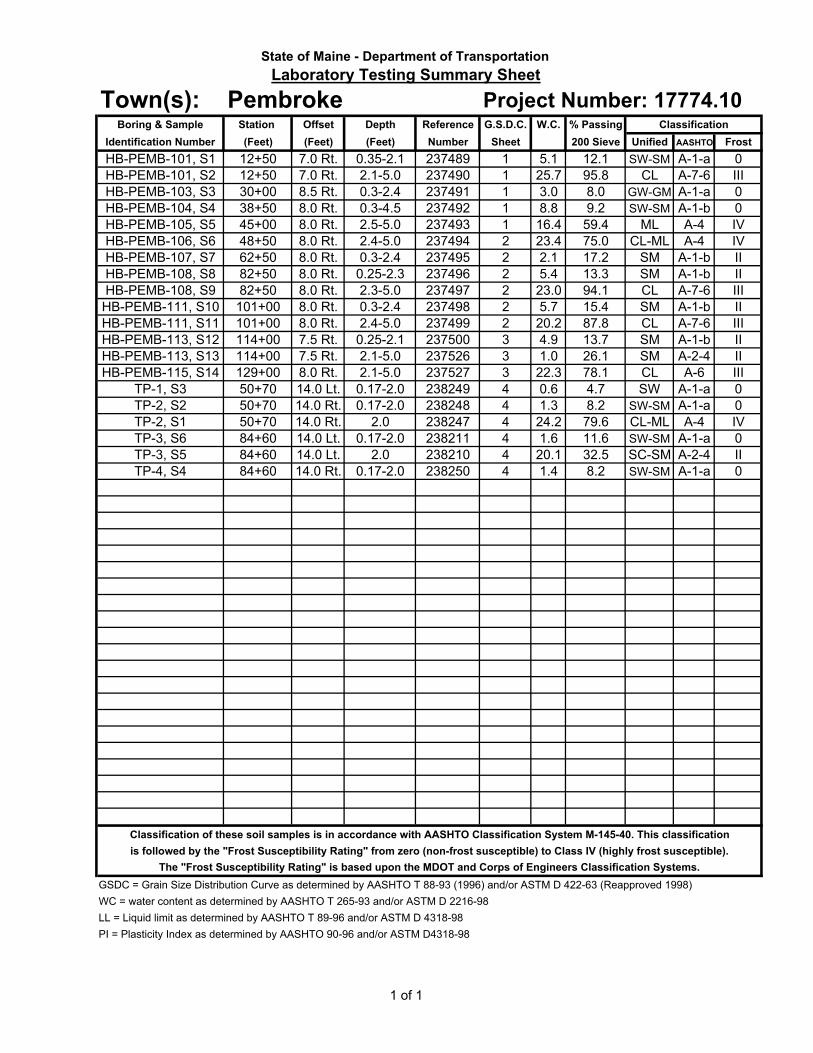
Station Offset Depth Reference G.S.D.C. W.C.
(Feet) (Feet) (Feet) Number Sheet Unified AASHTO Frost
12+50 7.0 Rt. 0.35-2.1 237489 1 5.1 SW-SM A-1-a 0
12+50 7.0 Rt. 2.1-5.0 237490 1 25.7 CL A-7-6 III
30+00 8.5 Rt. 0.3-2.4 237491 1 3.0 GW-GM A-1-a 0
38+50 8.0 Rt. 0.3-4.5 237492 1 8.8 SW-SM A-1-b 0
45+00 8.0 Rt. 2.5-5.0 237493 1 16.4 ML A-4 IV
48+50 8.0 Rt. 2.4-5.0 237494 2 23.4 CL-ML A-4 IV
62+50 8.0 Rt. 0.3-2.4 237495 2 2.1 SM A-1-b II
82+50 8.0 Rt. 0.25-2.3 237496 2 5.4 SM A-1-b II
82+50 8.0 Rt. 2.3-5.0 237497 2 23.0 CL A-7-6 III
101+00 8.0 Rt. 0.3-2.4 237498 2 5.7 SM A-1-b II
101+00 8.0 Rt. 2.4-5.0 237499 2 20.2 CL A-7-6 III
114+00 7.5 Rt. 0.25-2.1 237500 3 4.9 SM A-1-b II
114+00 7.5 Rt. 2.1-5.0 237526 3 1.0 SM A-2-4 II
129+00 8.0 Rt. 2.1-5.0 237527 3 22.3 CL A-6 III
50+70 14.0 Lt. 0.17-2.0 238249 4 0.6 SW A-1-a 0
50+70 14.0 Rt. 0.17-2.0 238248 4 1.3 SW-SM A-1-a 0
50+70 14.0 Rt. 2.0 238247 4 24.2 CL-ML A-4 IV
84+60 14.0 Lt. 0.17-2.0 238211 4 1.6 SW-SM A-1-a 0
84+60 14.0 Lt. 2.0 238210 4 20.1 SC-SM A-2-4 II
84+60 14.0 Rt. 0.17-2.0 238250 4 1.4 SW-SM A-1-a 0
Classification of these soil samples is in accordance with AASHTO Classification System M-145-40. This classification
is followed by the "Frost Susceptibility Rating" from zero (non-frost susceptible) to Class IV (highly frost susceptible).
The "Frost Susceptibility Rating" is based upon the MDOT and Corps of Engineers Classification Systems.
GSDC = Grain Size Distribution Curve as determined by AASHTO T 88-93 (1996) and/or ASTM D 422-63 (Reapproved 1998)
WC = water content as determined by AASHTO T 265-93 and/or ASTM D 2216-98
LL = Liquid limit as determined by AASHTO T 89-96 and/or ASTM D 4318-98
PI = Plasticity Index as determined by AASHTO 90-96 and/or ASTM D4318-98
8.2
8.2
79.6
11.6
32.5
13.7
26.1
78.1
4.7
13.3
94.1
15.4
87.8
9.2
59.4
75.0
17.2
TP-4, S4
TP-2, S2
TP-2, S1
TP-3, S6
TP-3, S5
HB-PEMB-113, S12
HB-PEMB-113, S13
HB-PEMB-115, S14
TP-1, S3
HB-PEMB-108, S8
HB-PEMB-108, S9
HB-PEMB-111, S10
HB-PEMB-111, S11
HB-PEMB-106, S6
Identification Number
HB-PEMB-101, S1
HB-PEMB-105, S5
Project Number: 17774.10
HB-PEMB-101, S2
% Passing
200 Sieve
12.1
95.8
8.0
HB-PEMB-107, S7
Classification
State of Maine - Department of Transportation
Laboratory Testing Summary Sheet
Town(s): PembrokeBoring & Sample
HB-PEMB-103, S3
HB-PEMB-104, S4
1 of 1

3"
2"1-1/2"
1"
3/4"
1/2"
3/8"
1/4"
#4
#8
#10
#16
#20
#40
#60
#100
#200
0.05
0.03
0.010
0.005
0.001
76.2
50.8
38.1
25.4
19.05
12.7
9.53
6.35
4.75
2.36
2.00
1.18
0.85
0.426
0.25
0.15
0.075
0.05
0.03
0.005
GRAVEL
SAND
SILT
SIEVE ANALYSIS
US Standard Sieve Numbers
HYDROMETER ANALYSIS
Grain Diameter, mm
State of Maine Department of Transportation
GRAIN SIZE DISTRIBUTIO
N CURVE
100
10
10.1
0.01
0.001
Grain Diameter, mm
0
10
20
30
40
50
60
70
80
90
100
Percent Finer by Weight
100
90
80
70
60
50
40
30
20
10
0
Percent Retained by Weight
CLAY
SHEET NO.
UNIFIED CLASSIFICATION
Gravelly SAND, little silt.
SAND, some gravel, trace silt.
GRAVEL, some sand, trace silt.
SILT with clay, trace sand, trace gravel.
5.1
16.4
Sandy SILT, trace gravel.
25.7
3.0
8.8
45
22
23
HB-PEMB-101/S1
HB-PEMB-105/S5
HB-PEMB-101/S2
HB-PEMB-103/S3
HB-PEMB-104/S4
0.35-2.1
2.5-5.0
2.1-5.0
0.3-2.4
0.3-4.5
Depth, ft
Boring/Sample No.
Description
W, %
LL
PL
PI
� ��� � ��� � ��� � ��� � ��� � ���
SHEET 1
Dennysville,Pembroke,W
hiting
17774.10
WHITE, TERRY A 6/3/2010
PIN
Town
Reported by/Date
7.0 RT
8.0 RT
7.0 RT
8.5 RT
8.0 RT
Offset, ft
12+50
45+00
12+50
30+00
38+50
Station

3"
2"1-1/2"
1"
3/4"
1/2"
3/8"
1/4"
#4
#8
#10
#16
#20
#40
#60
#100
#200
0.05
0.03
0.010
0.005
0.001
76.2
50.8
38.1
25.4
19.05
12.7
9.53
6.35
4.75
2.36
2.00
1.18
0.85
0.426
0.25
0.15
0.075
0.05
0.03
0.005
GRAVEL
SAND
SILT
SIEVE ANALYSIS
US Standard Sieve Numbers
HYDROMETER ANALYSIS
Grain Diameter, mm
State of Maine Department of Transportation
GRAIN SIZE DISTRIBUTIO
N CURVE
100
10
10.1
0.01
0.001
Grain Diameter, mm
0
10
20
30
40
50
60
70
80
90
100
Percent Finer by Weight
100
90
80
70
60
50
40
30
20
10
0
Percent Retained by Weight
CLAY
SHEET NO.
UNIFIED CLASSIFICATION
SILT with clay, some sand, trace gravel.
SILT, with clay, trace sand.
Gravelly SAND, little silt.
SAND, some gravel, little silt.
23.4
5.7
SAND, some gravel, little silt.
2.1
5.4
23.0
47
24
23
HB-PEMB-106/S6
HB-PEMB-111/S10
HB-PEMB-107/S7
HB-PEMB-108/S8
HB-PEMB-108/S9
20.2
SILT with clay, little sand, trace gravel.
44
21
23
HB-PEMB-11/S11
2.4-5.0
0.3-2.4
2.4-5.0
0.25-2.3
2.3-5.0
2.4-5.0
Depth, ft
Boring/Sample No.
Description
W, %
LL
PL
PI
� ��� � ��� � ��� � ��� � ��� � ���
SHEET 2
Dennysville,Pembroke,W
hiting
17774.10
WHITE, TERRY A 6/3/2010
PIN
Town
Reported by/Date
8.0 RT
8.0 RT
8.0 RT
8.0 RT
8.0 RT
8.0 RT
Offset, ft
48+50
101+00
62+50
82+50
82+50
101+00
Station

3"
2"1-1/2"
1"
3/4"
1/2"
3/8"
1/4"
#4
#8
#10
#16
#20
#40
#60
#100
#200
0.05
0.03
0.010
0.005
0.001
76.2
50.8
38.1
25.4
19.05
12.7
9.53
6.35
4.75
2.36
2.00
1.18
0.85
0.426
0.25
0.15
0.075
0.05
0.03
0.005
GRAVEL
SAND
SILT
SIEVE ANALYSIS
US Standard Sieve Numbers
HYDROMETER ANALYSIS
Grain Diameter, mm
State of Maine Department of Transportation
GRAIN SIZE DISTRIBUTIO
N CURVE
100
10
10.1
0.01
0.001
Grain Diameter, mm
0
10
20
30
40
50
60
70
80
90
100
Percent Finer by Weight
100
90
80
70
60
50
40
30
20
10
0
Percent Retained by Weight
CLAY
SHEET NO.
UNIFIED CLASSIFICATION
SAND, some gravel, little silt.
SILT with clay, little sand, trace gravel.
SAND, some gravel, some silt.
4.9
1.0
22.3
35
20
15
HB-PEMB-113/S12
HB-PEMB-113/S13
HB-PEMB-115/S14
0.25-2.1
2.1-5.0
2.1-5.0
Depth, ft
Boring/Sample No.
Description
W, %
LL
PL
PI
� ��� � ��� � ��� � ��� � ��� � ���
SHEET 3
Dennysville,Pembroke,W
hiting
17774.10
WHITE, TERRY A 6/3/2010
PIN
Town
Reported by/Date
7.5 RT
7.5 RT
8.0 RT
Offset, ft
114+00
114+00
129+00
Station

3"
2"1-1/2"
1"
3/4"
1/2"
3/8"
1/4"
#4
#8
#10
#16
#20
#40
#60
#100
#200
0.05
0.03
0.010
0.005
0.001
76.2
50.8
38.1
25.4
19.05
12.7
9.53
6.35
4.75
2.36
2.00
1.18
0.85
0.426
0.25
0.15
0.075
0.05
0.03
0.005
GRAVEL
SAND
SILT
SIEVE ANALYSIS
US Standard Sieve Numbers
HYDROMETER ANALYSIS
Grain Diameter, mm
State of Maine Department of Transportation
GRAIN SIZE DISTRIBUTIO
N CURVE
100
10
10.1
0.01
0.001
Grain Diameter, mm
0
10
20
30
40
50
60
70
80
90
100
Percent Finer by Weight
100
90
80
70
60
50
40
30
20
10
0
Percent Retained by Weight
CLAY
SHEET NO.
UNIFIED CLASSIFICATION
Gravelly SAND, trace silt.
Gravelly SAND, little silt.
SILT with clay, little sand, trace gravel.
Gravelly SAND, trace silt.
0.6
20.1
SAND, some silt with clay, little gravel.
1.3
24.2
1.6
TP-1/S3
TP-3/S5
TP-2/S2
TP-2/S1
TP-3/S6
1.4
Gravelly SAND, trace silt.
TP-4/S4
0.17-2.0
2
0.17-2.0
2
0.17-2.0
0.17-2.0
Depth, ft
Boring/Sample No.
Description
W, %
LL
PL
PI
� ��� � ��� � ��� � ��� � ��� � ���
SHEET 4
Dennysville,Pembroke,W
hiting
17774.10
WHITE, TERRY A 6/3/2010
PIN
Town
Reported by/Date
14.0 LT
14.0 LT
14.0 RT
14.0 RT
14.0 LT
14.0 RT
Offset, ft
50+70
84+60
50+70
50+70
84+60
84+60
Station
0
5
10
15
20
25
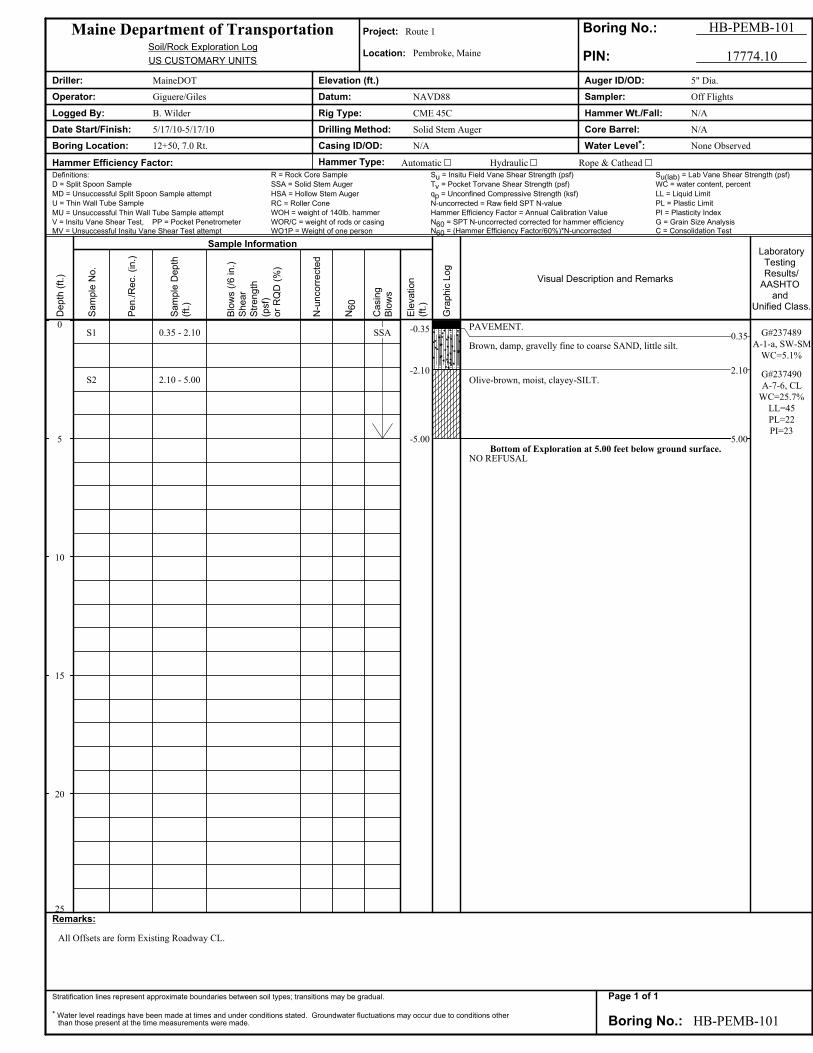
S1
S2
0.35 - 2.10
2.10 - 5.00
SSA -0.35
-2.10
-5.00
PAVEMENT.0.35
Brown, damp, gravelly fine to coarse SAND, little silt.
2.10Olive-brown, moist, clayey-SILT.
5.00Bottom of Exploration at 5.00 feet below ground surface.
NO REFUSAL
G#237489
A-1-a, SW-SM
WC=5.1%
G#237490
A-7-6, CL
WC=25.7%
LL=45
PL=22
PI=23
Maine Department of Transportation Project: Route 1 Boring No.: HB-PEMB-101
Soil/Rock Exploration LogLocation: Pembroke, Maine
US CUSTOMARY UNITS PIN: 17774.10
Driller: MaineDOT Elevation (ft.) Auger ID/OD: 5" Dia.
Operator: Giguere/Giles Datum: NAVD88 Sampler: Off Flights
Logged By: B. Wilder Rig Type: CME 45C Hammer Wt./Fall: N/A
Date Start/Finish: 5/17/10-5/17/10 Drilling Method: Solid Stem Auger Core Barrel: N/A
Boring Location: 12+50, 7.0 Rt. Casing ID/OD: N/A Water Level*: None Observed
Hammer Efficiency Factor: Hammer Type: Automatic Hydraulic Rope & Cathead
Definitions: R = Rock Core Sample Su = Insitu Field Vane Shear Strength (psf) Su(lab) = Lab Vane Shear Strength (psf)
D = Split Spoon Sample SSA = Solid Stem Auger Tv = Pocket Torvane Shear Strength (psf) WC = water content, percent
MD = Unsuccessful Split Spoon Sample attempt HSA = Hollow Stem Auger qp = Unconfined Compressive Strength (ksf) LL = Liquid Limit
U = Thin Wall Tube Sample RC = Roller Cone N-uncorrected = Raw field SPT N-value PL = Plastic Limit
MU = Unsuccessful Thin Wall Tube Sample attempt WOH = weight of 140lb. hammer Hammer Efficiency Factor = Annual Calibration Value PI = Plasticity Index
V = Insitu Vane Shear Test, PP = Pocket Penetrometer WOR/C = weight of rods or casing N60 = SPT N-uncorrected corrected for hammer efficiency G = Grain Size Analysis
MV = Unsuccessful Insitu Vane Shear Test attempt WO1P = Weight of one person N60 = (Hammer Efficiency Factor/60%)*N-uncorrected C = Consolidation Test
Remarks:
All Offsets are form Existing Roadway CL.
Stratification lines represent approximate boundaries between soil types; transitions may be gradual.
* Water level readings have been made at times and under conditions stated. Groundwater fluctuations may occur due to conditions otherthan those present at the time measurements were made. Boring No.: HB-PEMB-101
Depth
(ft
.)
Sam
ple
No.
Sample Information
Pen./
Rec.
(in.)
Sam
ple
Depth
(ft.
)
Blo
ws (
/6 in.)
Shear
Str
ength
(psf)
or
RQ
D (
%)
N-u
ncorr
ecte
d
N60
Casin
g
Blo
ws
Ele
vation
(ft.
)
Gra
phic
Log
Visual Description and Remarks
LaboratoryTesting Results/
AASHTO and
Unified Class.
Page 1 of 1

0
5
10
15
20
25
SSA-0.30
-2.40
-5.00
PAVEMENT.0.30
Brown, damp, gravelly fine to coarse SAND, little silt, occasional
cobbles. ≅S1
2.40Olive-brown, moist, clayey-SILT. ≅S2
5.00Bottom of Exploration at 5.00 feet below ground surface.
NO REFUSAL
Maine Department of Transportation Project: Route 1 Boring No.: HB-PEMB-102
Soil/Rock Exploration LogLocation: Pembroke, Maine
US CUSTOMARY UNITS PIN: 17774.10
Driller: MaineDOT Elevation (ft.) Auger ID/OD: 5" Dia.
Operator: Giguere/Giles Datum: NAVD88 Sampler: Off Flights
Logged By: B. Wilder Rig Type: CME 45C Hammer Wt./Fall: N/A
Date Start/Finish: 5/17/10-5/17/10 Drilling Method: Solid Stem Auger Core Barrel: N/A
Boring Location: 23+00, 6.0 Rt. Casing ID/OD: N/A Water Level*: None Observed
Hammer Efficiency Factor: Hammer Type: Automatic Hydraulic Rope & Cathead
Definitions: R = Rock Core Sample Su = Insitu Field Vane Shear Strength (psf) Su(lab) = Lab Vane Shear Strength (psf)
D = Split Spoon Sample SSA = Solid Stem Auger Tv = Pocket Torvane Shear Strength (psf) WC = water content, percent
MD = Unsuccessful Split Spoon Sample attempt HSA = Hollow Stem Auger qp = Unconfined Compressive Strength (ksf) LL = Liquid Limit
U = Thin Wall Tube Sample RC = Roller Cone N-uncorrected = Raw field SPT N-value PL = Plastic Limit
MU = Unsuccessful Thin Wall Tube Sample attempt WOH = weight of 140lb. hammer Hammer Efficiency Factor = Annual Calibration Value PI = Plasticity Index
V = Insitu Vane Shear Test, PP = Pocket Penetrometer WOR/C = weight of rods or casing N60 = SPT N-uncorrected corrected for hammer efficiency G = Grain Size Analysis
MV = Unsuccessful Insitu Vane Shear Test attempt WO1P = Weight of one person N60 = (Hammer Efficiency Factor/60%)*N-uncorrected C = Consolidation Test
Remarks:
All Offsets are form Existing Roadway CL.
Stratification lines represent approximate boundaries between soil types; transitions may be gradual.
* Water level readings have been made at times and under conditions stated. Groundwater fluctuations may occur due to conditions otherthan those present at the time measurements were made. Boring No.: HB-PEMB-102
Depth
(ft
.)
Sam
ple
No.
Sample Information
Pen./
Rec.
(in.)
Sam
ple
Depth
(ft.
)
Blo
ws (
/6 in.)
Shear
Str
ength
(psf)
or
RQ
D (
%)
N-u
ncorr
ecte
d
N60
Casin
g
Blo
ws
Ele
vation
(ft.
)
Gra
phic
Log
Visual Description and Remarks
LaboratoryTesting Results/
AASHTO and
Unified Class.
Page 1 of 1

0
5
10
15
20
25
S3 0.30 - 2.40 SSA-0.30
-2.40
-3.80
PAVEMENT.0.30
Brown, damp, gravelly fine to coarse SAND, little silt.
2.40Weathered ROCK.
3.80Bottom of Exploration at 3.80 feet below ground surface.
REFUSAL
G#237491
A-1-a, GW-GM
WC=3.0%
Maine Department of Transportation Project: Route 1 Boring No.: HB-PEMB-103
Soil/Rock Exploration LogLocation: Pembroke, Maine
US CUSTOMARY UNITS PIN: 17774.10
Driller: MaineDOT Elevation (ft.) Auger ID/OD: 5" Dia.
Operator: Giguere/Giles Datum: NAVD88 Sampler: Off Flights
Logged By: B. Wilder Rig Type: CME 45C Hammer Wt./Fall: N/A
Date Start/Finish: 5/17/10-5/17/10 Drilling Method: Solid Stem Auger Core Barrel: N/A
Boring Location: 30+00, 8.5 Rt. Casing ID/OD: N/A Water Level*: None Observed
Hammer Efficiency Factor: Hammer Type: Automatic Hydraulic Rope & Cathead
Definitions: R = Rock Core Sample Su = Insitu Field Vane Shear Strength (psf) Su(lab) = Lab Vane Shear Strength (psf)
D = Split Spoon Sample SSA = Solid Stem Auger Tv = Pocket Torvane Shear Strength (psf) WC = water content, percent
MD = Unsuccessful Split Spoon Sample attempt HSA = Hollow Stem Auger qp = Unconfined Compressive Strength (ksf) LL = Liquid Limit
U = Thin Wall Tube Sample RC = Roller Cone N-uncorrected = Raw field SPT N-value PL = Plastic Limit
MU = Unsuccessful Thin Wall Tube Sample attempt WOH = weight of 140lb. hammer Hammer Efficiency Factor = Annual Calibration Value PI = Plasticity Index
V = Insitu Vane Shear Test, PP = Pocket Penetrometer WOR/C = weight of rods or casing N60 = SPT N-uncorrected corrected for hammer efficiency G = Grain Size Analysis
MV = Unsuccessful Insitu Vane Shear Test attempt WO1P = Weight of one person N60 = (Hammer Efficiency Factor/60%)*N-uncorrected C = Consolidation Test
Remarks:
All Offsets are form Existing Roadway CL.
Stratification lines represent approximate boundaries between soil types; transitions may be gradual.
* Water level readings have been made at times and under conditions stated. Groundwater fluctuations may occur due to conditions otherthan those present at the time measurements were made. Boring No.: HB-PEMB-103
Depth
(ft
.)
Sam
ple
No.
Sample Information
Pen./
Rec.
(in.)
Sam
ple
Depth
(ft.
)
Blo
ws (
/6 in.)
Shear
Str
ength
(psf)
or
RQ
D (
%)
N-u
ncorr
ecte
d
N60
Casin
g
Blo
ws
Ele
vation
(ft.
)
Gra
phic
Log
Visual Description and Remarks
LaboratoryTesting Results/
AASHTO and
Unified Class.
Page 1 of 1

0
5
10
15
20
25
S4 0.30 - 4.45 SSA-0.30
-4.50
PAVEMENT.0.30
Brown, wet, gravelly fine to coarse SAND, little silt.
4.50Bottom of Exploration at 4.50 feet below ground surface.
REFUSAL
G#237492
A-1-b, SW-SM
WC=8.8%
Maine Department of Transportation Project: Route 1 Boring No.: HB-PEMB-104
Soil/Rock Exploration LogLocation: Pembroke, Maine
US CUSTOMARY UNITS PIN: 17774.10
Driller: MaineDOT Elevation (ft.) Auger ID/OD: 5" Dia.
Operator: Giguere/Giles Datum: NAVD88 Sampler: Off Flights
Logged By: B. Wilder Rig Type: CME 45C Hammer Wt./Fall: N/A
Date Start/Finish: 5/17/10-5/17/10 Drilling Method: Solid Stem Auger Core Barrel: N/A
Boring Location: 38+50, 8.0 Rt. Casing ID/OD: N/A Water Level*: None Observed
Hammer Efficiency Factor: Hammer Type: Automatic Hydraulic Rope & Cathead
Definitions: R = Rock Core Sample Su = Insitu Field Vane Shear Strength (psf) Su(lab) = Lab Vane Shear Strength (psf)
D = Split Spoon Sample SSA = Solid Stem Auger Tv = Pocket Torvane Shear Strength (psf) WC = water content, percent
MD = Unsuccessful Split Spoon Sample attempt HSA = Hollow Stem Auger qp = Unconfined Compressive Strength (ksf) LL = Liquid Limit
U = Thin Wall Tube Sample RC = Roller Cone N-uncorrected = Raw field SPT N-value PL = Plastic Limit
MU = Unsuccessful Thin Wall Tube Sample attempt WOH = weight of 140lb. hammer Hammer Efficiency Factor = Annual Calibration Value PI = Plasticity Index
V = Insitu Vane Shear Test, PP = Pocket Penetrometer WOR/C = weight of rods or casing N60 = SPT N-uncorrected corrected for hammer efficiency G = Grain Size Analysis
MV = Unsuccessful Insitu Vane Shear Test attempt WO1P = Weight of one person N60 = (Hammer Efficiency Factor/60%)*N-uncorrected C = Consolidation Test
Remarks:
All Offsets are form Existing Roadway CL.
Stratification lines represent approximate boundaries between soil types; transitions may be gradual.
* Water level readings have been made at times and under conditions stated. Groundwater fluctuations may occur due to conditions otherthan those present at the time measurements were made. Boring No.: HB-PEMB-104
Depth
(ft
.)
Sam
ple
No.
Sample Information
Pen./
Rec.
(in.)
Sam
ple
Depth
(ft.
)
Blo
ws (
/6 in.)
Shear
Str
ength
(psf)
or
RQ
D (
%)
N-u
ncorr
ecte
d
N60
Casin
g
Blo
ws
Ele
vation
(ft.
)
Gra
phic
Log
Visual Description and Remarks
LaboratoryTesting Results/
AASHTO and
Unified Class.
Page 1 of 1

0
5
10
15
20
25
S5 2.50 - 5.00
SSA-0.20
-2.50
-5.00
PAVEMENT.0.20
Brown, damp, gravelly fine to coarse SAND, little silt. ≅S3
Cobbles from 2.0-2.4' bgs.2.50
Brown, wet, silty fine to medium SAND.
5.00Bottom of Exploration at 5.00 feet below ground surface.
NO REFUSAL
G#237493
A-4. ML
WC=16.4%
Maine Department of Transportation Project: Route 1 Boring No.: HB-PEMB-105
Soil/Rock Exploration LogLocation: Pembroke, Maine
US CUSTOMARY UNITS PIN: 17774.10
Driller: MaineDOT Elevation (ft.) Auger ID/OD: 5" Dia.
Operator: Giguere/Giles Datum: NAVD88 Sampler: Off Flights
Logged By: B. Wilder Rig Type: CME 45C Hammer Wt./Fall: N/A
Date Start/Finish: 5/17/10-5/17/10 Drilling Method: Solid Stem Auger Core Barrel: N/A
Boring Location: 45+00, 8.0 Rt. Casing ID/OD: N/A Water Level*: None Observed
Hammer Efficiency Factor: Hammer Type: Automatic Hydraulic Rope & Cathead
Definitions: R = Rock Core Sample Su = Insitu Field Vane Shear Strength (psf) Su(lab) = Lab Vane Shear Strength (psf)
D = Split Spoon Sample SSA = Solid Stem Auger Tv = Pocket Torvane Shear Strength (psf) WC = water content, percent
MD = Unsuccessful Split Spoon Sample attempt HSA = Hollow Stem Auger qp = Unconfined Compressive Strength (ksf) LL = Liquid Limit
U = Thin Wall Tube Sample RC = Roller Cone N-uncorrected = Raw field SPT N-value PL = Plastic Limit
MU = Unsuccessful Thin Wall Tube Sample attempt WOH = weight of 140lb. hammer Hammer Efficiency Factor = Annual Calibration Value PI = Plasticity Index
V = Insitu Vane Shear Test, PP = Pocket Penetrometer WOR/C = weight of rods or casing N60 = SPT N-uncorrected corrected for hammer efficiency G = Grain Size Analysis
MV = Unsuccessful Insitu Vane Shear Test attempt WO1P = Weight of one person N60 = (Hammer Efficiency Factor/60%)*N-uncorrected C = Consolidation Test
Remarks:
All Offsets are form Existing Roadway CL.
Stratification lines represent approximate boundaries between soil types; transitions may be gradual.
* Water level readings have been made at times and under conditions stated. Groundwater fluctuations may occur due to conditions otherthan those present at the time measurements were made. Boring No.: HB-PEMB-105
Depth
(ft
.)
Sam
ple
No.
Sample Information
Pen./
Rec.
(in.)
Sam
ple
Depth
(ft.
)
Blo
ws (
/6 in.)
Shear
Str
ength
(psf)
or
RQ
D (
%)
N-u
ncorr
ecte
d
N60
Casin
g
Blo
ws
Ele
vation
(ft.
)
Gra
phic
Log
Visual Description and Remarks
LaboratoryTesting Results/
AASHTO and
Unified Class.
Page 1 of 1

0
5
10
15
20
25
S6 2.40 - 5.00
SSA-0.25
-2.40
-5.00
PAVEMENT.0.25
Brown, damp, gravelly fine to coarse SAND, little silt. ≅S3
2.40Grey, moist, silty fine SAND, some clay.
5.00Bottom of Exploration at 5.00 feet below ground surface.
NO REFUSAL
G#237494
Maine Department of Transportation Project: Route 1 Boring No.: HB-PEMB-106
Soil/Rock Exploration LogLocation: Pembroke, Maine
US CUSTOMARY UNITS PIN: 17774.10
Driller: MaineDOT Elevation (ft.) Auger ID/OD: 5" Dia.
Operator: Giguere/Giles Datum: NAVD88 Sampler: Off Flights
Logged By: B. Wilder Rig Type: CME 45C Hammer Wt./Fall: N/A
Date Start/Finish: 5/17/10-5/17/10 Drilling Method: Solid Stem Auger Core Barrel: N/A
Boring Location: 48+50, 8.0 Rt. Casing ID/OD: N/A Water Level*: None Observed
Hammer Efficiency Factor: Hammer Type: Automatic Hydraulic Rope & Cathead
Definitions: R = Rock Core Sample Su = Insitu Field Vane Shear Strength (psf) Su(lab) = Lab Vane Shear Strength (psf)
D = Split Spoon Sample SSA = Solid Stem Auger Tv = Pocket Torvane Shear Strength (psf) WC = water content, percent
MD = Unsuccessful Split Spoon Sample attempt HSA = Hollow Stem Auger qp = Unconfined Compressive Strength (ksf) LL = Liquid Limit
U = Thin Wall Tube Sample RC = Roller Cone N-uncorrected = Raw field SPT N-value PL = Plastic Limit
MU = Unsuccessful Thin Wall Tube Sample attempt WOH = weight of 140lb. hammer Hammer Efficiency Factor = Annual Calibration Value PI = Plasticity Index
V = Insitu Vane Shear Test, PP = Pocket Penetrometer WOR/C = weight of rods or casing N60 = SPT N-uncorrected corrected for hammer efficiency G = Grain Size Analysis
MV = Unsuccessful Insitu Vane Shear Test attempt WO1P = Weight of one person N60 = (Hammer Efficiency Factor/60%)*N-uncorrected C = Consolidation Test
Remarks:
All Offsets are form Existing Roadway CL.
Stratification lines represent approximate boundaries between soil types; transitions may be gradual.
* Water level readings have been made at times and under conditions stated. Groundwater fluctuations may occur due to conditions otherthan those present at the time measurements were made. Boring No.: HB-PEMB-106
Depth
(ft
.)
Sam
ple
No.
Sample Information
Pen./
Rec.
(in.)
Sam
ple
Depth
(ft.
)
Blo
ws (
/6 in.)
Shear
Str
ength
(psf)
or
RQ
D (
%)
N-u
ncorr
ecte
d
N60
Casin
g
Blo
ws
Ele
vation
(ft.
)
Gra
phic
Log
Visual Description and Remarks
LaboratoryTesting Results/
AASHTO and
Unified Class.
Page 1 of 1

0
5
10
15
20
25
S7 0.30 - 2.40 SSA-0.30
-2.40
-5.00
PAVEMENT.0.30
Brown, damp, gravelly fine to coarse SAND, little silt.
2.40Brown, damp, silty fine to medium SAND. ≅S5
5.00Bottom of Exploration at 5.00 feet below ground surface.
NO REFUSAL
G#237495
A-1-b, SM
WC=2.1%
Maine Department of Transportation Project: Route 1 Boring No.: HB-PEMB-107
Soil/Rock Exploration LogLocation: Pembroke, Maine
US CUSTOMARY UNITS PIN: 17774.10
Driller: MaineDOT Elevation (ft.) Auger ID/OD: 5" Dia.
Operator: Giguere/Giles Datum: NAVD88 Sampler: Off Flights
Logged By: B. Wilder Rig Type: CME 45C Hammer Wt./Fall: N/A
Date Start/Finish: 5/17/10-5/17/10 Drilling Method: Solid Stem Auger Core Barrel: N/A
Boring Location: 62+50, 8.0 Rt. Casing ID/OD: N/A Water Level*: None Observed
Hammer Efficiency Factor: Hammer Type: Automatic Hydraulic Rope & Cathead
Definitions: R = Rock Core Sample Su = Insitu Field Vane Shear Strength (psf) Su(lab) = Lab Vane Shear Strength (psf)
D = Split Spoon Sample SSA = Solid Stem Auger Tv = Pocket Torvane Shear Strength (psf) WC = water content, percent
MD = Unsuccessful Split Spoon Sample attempt HSA = Hollow Stem Auger qp = Unconfined Compressive Strength (ksf) LL = Liquid Limit
U = Thin Wall Tube Sample RC = Roller Cone N-uncorrected = Raw field SPT N-value PL = Plastic Limit
MU = Unsuccessful Thin Wall Tube Sample attempt WOH = weight of 140lb. hammer Hammer Efficiency Factor = Annual Calibration Value PI = Plasticity Index
V = Insitu Vane Shear Test, PP = Pocket Penetrometer WOR/C = weight of rods or casing N60 = SPT N-uncorrected corrected for hammer efficiency G = Grain Size Analysis
MV = Unsuccessful Insitu Vane Shear Test attempt WO1P = Weight of one person N60 = (Hammer Efficiency Factor/60%)*N-uncorrected C = Consolidation Test
Remarks:
All Offsets are form Existing Roadway CL.
Stratification lines represent approximate boundaries between soil types; transitions may be gradual.
* Water level readings have been made at times and under conditions stated. Groundwater fluctuations may occur due to conditions otherthan those present at the time measurements were made. Boring No.: HB-PEMB-107
Depth
(ft
.)
Sam
ple
No.
Sample Information
Pen./
Rec.
(in.)
Sam
ple
Depth
(ft.
)
Blo
ws (
/6 in.)
Shear
Str
ength
(psf)
or
RQ
D (
%)
N-u
ncorr
ecte
d
N60
Casin
g
Blo
ws
Ele
vation
(ft.
)
Gra
phic
Log
Visual Description and Remarks
LaboratoryTesting Results/
AASHTO and
Unified Class.
Page 1 of 1

0
5
10
15
20
25
S8
S9
0.25 - 2.30
2.30 - 5.00
SSA-0.25
-2.30
-5.00
PAVEMENT.0.25
Brown, damp, gravelly fine to coarse SAND, little silt.
2.30Olive-brown, damp, SILT, trace fine sand, trace clay.
5.00Bottom of Exploration at 5.00 feet below ground surface.
NO REFUSAL
G#237496
A-1-b, SM
WC=5.4%
G#237497
A-7-6, CL
WC=23.0%
LL=47
PL=24
PI=23
Maine Department of Transportation Project: Route 1 Boring No.: HB-PEMB-108
Soil/Rock Exploration LogLocation: Pembroke, Maine
US CUSTOMARY UNITS PIN: 17774.10
Driller: MaineDOT Elevation (ft.) Auger ID/OD: 5" Dia.
Operator: Giguere/Giles Datum: NAVD88 Sampler: Off Flights
Logged By: B. Wilder Rig Type: CME 45C Hammer Wt./Fall: N/A
Date Start/Finish: 5/17/10-5/17/10 Drilling Method: Solid Stem Auger Core Barrel: N/A
Boring Location: 82+50, 8.0 Rt. Casing ID/OD: N/A Water Level*: None Observed
Hammer Efficiency Factor: Hammer Type: Automatic Hydraulic Rope & Cathead
Definitions: R = Rock Core Sample Su = Insitu Field Vane Shear Strength (psf) Su(lab) = Lab Vane Shear Strength (psf)
D = Split Spoon Sample SSA = Solid Stem Auger Tv = Pocket Torvane Shear Strength (psf) WC = water content, percent
MD = Unsuccessful Split Spoon Sample attempt HSA = Hollow Stem Auger qp = Unconfined Compressive Strength (ksf) LL = Liquid Limit
U = Thin Wall Tube Sample RC = Roller Cone N-uncorrected = Raw field SPT N-value PL = Plastic Limit
MU = Unsuccessful Thin Wall Tube Sample attempt WOH = weight of 140lb. hammer Hammer Efficiency Factor = Annual Calibration Value PI = Plasticity Index
V = Insitu Vane Shear Test, PP = Pocket Penetrometer WOR/C = weight of rods or casing N60 = SPT N-uncorrected corrected for hammer efficiency G = Grain Size Analysis
MV = Unsuccessful Insitu Vane Shear Test attempt WO1P = Weight of one person N60 = (Hammer Efficiency Factor/60%)*N-uncorrected C = Consolidation Test
Remarks:
All Offsets are form Existing Roadway CL.
Stratification lines represent approximate boundaries between soil types; transitions may be gradual.
* Water level readings have been made at times and under conditions stated. Groundwater fluctuations may occur due to conditions otherthan those present at the time measurements were made. Boring No.: HB-PEMB-108
Depth
(ft
.)
Sam
ple
No.
Sample Information
Pen./
Rec.
(in.)
Sam
ple
Depth
(ft.
)
Blo
ws (
/6 in.)
Shear
Str
ength
(psf)
or
RQ
D (
%)
N-u
ncorr
ecte
d
N60
Casin
g
Blo
ws
Ele
vation
(ft.
)
Gra
phic
Log
Visual Description and Remarks
LaboratoryTesting Results/
AASHTO and
Unified Class.
Page 1 of 1

0
5
10
15
20
25
SSA-0.30
-2.40
-5.00
PAVEMENT.0.30
Brown, damp, gravelly fine to coarse SAND, little silt. ≅S8
2.40Olive-brown, moist, SILT, trace fine sand, trace clay. ≅S9
5.00Bottom of Exploration at 5.00 feet below ground surface.
NO REFUSAL
Maine Department of Transportation Project: Route 1 Boring No.: HB-PEMB-109
Soil/Rock Exploration LogLocation: Pembroke, Maine
US CUSTOMARY UNITS PIN: 17774.10
Driller: MaineDOT Elevation (ft.) Auger ID/OD: 5" Dia.
Operator: Giguere/Giles Datum: NAVD88 Sampler: Off Flights
Logged By: B. Wilder Rig Type: CME 45C Hammer Wt./Fall: N/A
Date Start/Finish: 5/17/10-5/17/10 Drilling Method: Solid Stem Auger Core Barrel: N/A
Boring Location: 86+50, 7.5 Rt. Casing ID/OD: N/A Water Level*: None Observed
Hammer Efficiency Factor: Hammer Type: Automatic Hydraulic Rope & Cathead
Definitions: R = Rock Core Sample Su = Insitu Field Vane Shear Strength (psf) Su(lab) = Lab Vane Shear Strength (psf)
D = Split Spoon Sample SSA = Solid Stem Auger Tv = Pocket Torvane Shear Strength (psf) WC = water content, percent
MD = Unsuccessful Split Spoon Sample attempt HSA = Hollow Stem Auger qp = Unconfined Compressive Strength (ksf) LL = Liquid Limit
U = Thin Wall Tube Sample RC = Roller Cone N-uncorrected = Raw field SPT N-value PL = Plastic Limit
MU = Unsuccessful Thin Wall Tube Sample attempt WOH = weight of 140lb. hammer Hammer Efficiency Factor = Annual Calibration Value PI = Plasticity Index
V = Insitu Vane Shear Test, PP = Pocket Penetrometer WOR/C = weight of rods or casing N60 = SPT N-uncorrected corrected for hammer efficiency G = Grain Size Analysis
MV = Unsuccessful Insitu Vane Shear Test attempt WO1P = Weight of one person N60 = (Hammer Efficiency Factor/60%)*N-uncorrected C = Consolidation Test
Remarks:
All Offsets are form Existing Roadway CL.
Stratification lines represent approximate boundaries between soil types; transitions may be gradual.
* Water level readings have been made at times and under conditions stated. Groundwater fluctuations may occur due to conditions otherthan those present at the time measurements were made. Boring No.: HB-PEMB-109
Depth
(ft
.)
Sam
ple
No.
Sample Information
Pen./
Rec.
(in.)
Sam
ple
Depth
(ft.
)
Blo
ws (
/6 in.)
Shear
Str
ength
(psf)
or
RQ
D (
%)
N-u
ncorr
ecte
d
N60
Casin
g
Blo
ws
Ele
vation
(ft.
)
Gra
phic
Log
Visual Description and Remarks
LaboratoryTesting Results/
AASHTO and
Unified Class.
Page 1 of 1

0
5
10
15
20
25
SSA-0.30
-2.10
-2.80-3.20
PAVEMENT.0.30
Brown, damp, gravelly fine to coarse SAND, little silt. ≅S8
2.10Olive-brown, damp, SILT, trace fine sand, trace clay. ≅S9
2.80Weathered ROCK.
3.20Bottom of Exploration at 3.20 feet below ground surface.
REFUSAL
Maine Department of Transportation Project: Route 1 Boring No.: HB-PEMB-110
Soil/Rock Exploration LogLocation: Pembroke, Maine
US CUSTOMARY UNITS PIN: 17774.10
Driller: MaineDOT Elevation (ft.) Auger ID/OD: 5" Dia.
Operator: Giguere/Giles Datum: NAVD88 Sampler: Off Flights
Logged By: B. Wilder Rig Type: CME 45C Hammer Wt./Fall: N/A
Date Start/Finish: 5/17/10-5/17/10 Drilling Method: Solid Stem Auger Core Barrel: N/A
Boring Location: 92+00, 7.5 Rt. Casing ID/OD: N/A Water Level*: None Observed
Hammer Efficiency Factor: Hammer Type: Automatic Hydraulic Rope & Cathead
Definitions: R = Rock Core Sample Su = Insitu Field Vane Shear Strength (psf) Su(lab) = Lab Vane Shear Strength (psf)
D = Split Spoon Sample SSA = Solid Stem Auger Tv = Pocket Torvane Shear Strength (psf) WC = water content, percent
MD = Unsuccessful Split Spoon Sample attempt HSA = Hollow Stem Auger qp = Unconfined Compressive Strength (ksf) LL = Liquid Limit
U = Thin Wall Tube Sample RC = Roller Cone N-uncorrected = Raw field SPT N-value PL = Plastic Limit
MU = Unsuccessful Thin Wall Tube Sample attempt WOH = weight of 140lb. hammer Hammer Efficiency Factor = Annual Calibration Value PI = Plasticity Index
V = Insitu Vane Shear Test, PP = Pocket Penetrometer WOR/C = weight of rods or casing N60 = SPT N-uncorrected corrected for hammer efficiency G = Grain Size Analysis
MV = Unsuccessful Insitu Vane Shear Test attempt WO1P = Weight of one person N60 = (Hammer Efficiency Factor/60%)*N-uncorrected C = Consolidation Test
Remarks:
All Offsets are form Existing Roadway CL.
Stratification lines represent approximate boundaries between soil types; transitions may be gradual.
* Water level readings have been made at times and under conditions stated. Groundwater fluctuations may occur due to conditions otherthan those present at the time measurements were made. Boring No.: HB-PEMB-110
Depth
(ft
.)
Sam
ple
No.
Sample Information
Pen./
Rec.
(in.)
Sam
ple
Depth
(ft.
)
Blo
ws (
/6 in.)
Shear
Str
ength
(psf)
or
RQ
D (
%)
N-u
ncorr
ecte
d
N60
Casin
g
Blo
ws
Ele
vation
(ft.
)
Gra
phic
Log
Visual Description and Remarks
LaboratoryTesting Results/
AASHTO and
Unified Class.
Page 1 of 1
0
5
10
15
20
25
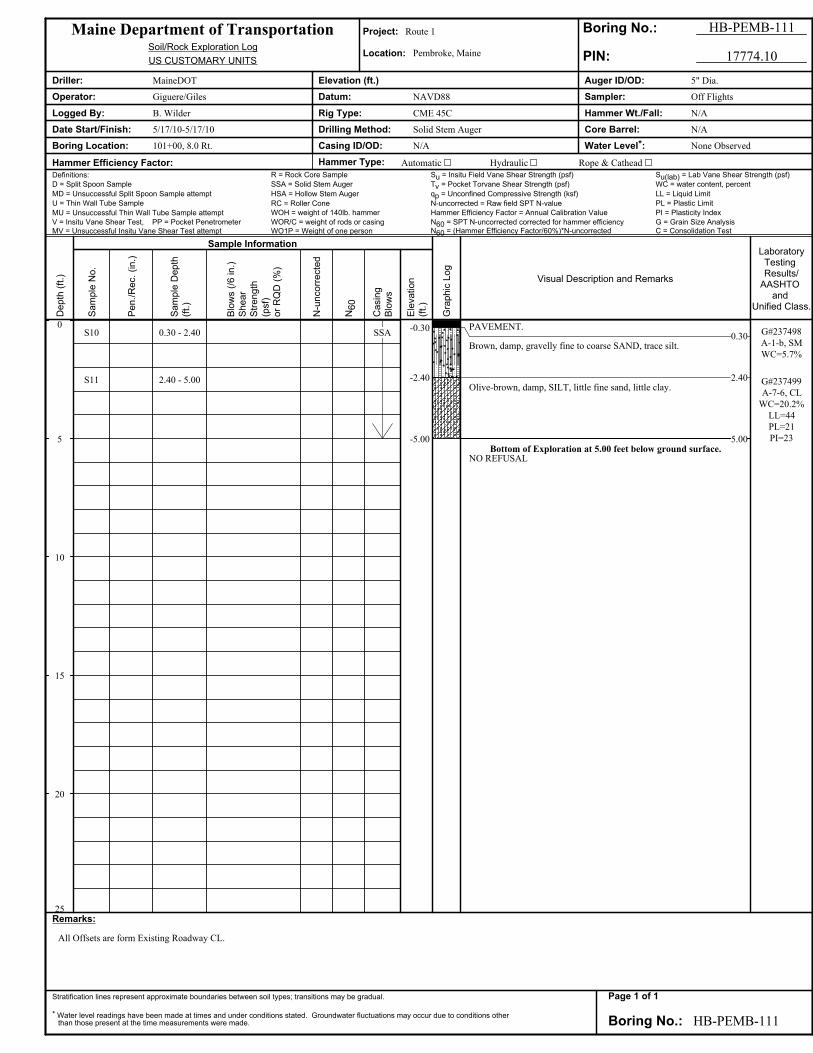
S10
S11
0.30 - 2.40
2.40 - 5.00
SSA-0.30
-2.40
-5.00
PAVEMENT.0.30
Brown, damp, gravelly fine to coarse SAND, trace silt.
2.40Olive-brown, damp, SILT, little fine sand, little clay.
5.00Bottom of Exploration at 5.00 feet below ground surface.
NO REFUSAL
G#237498
A-1-b, SM
WC=5.7%
G#237499
A-7-6, CL
WC=20.2%
LL=44
PL=21
PI=23
Maine Department of Transportation Project: Route 1 Boring No.: HB-PEMB-111
Soil/Rock Exploration LogLocation: Pembroke, Maine
US CUSTOMARY UNITS PIN: 17774.10
Driller: MaineDOT Elevation (ft.) Auger ID/OD: 5" Dia.
Operator: Giguere/Giles Datum: NAVD88 Sampler: Off Flights
Logged By: B. Wilder Rig Type: CME 45C Hammer Wt./Fall: N/A
Date Start/Finish: 5/17/10-5/17/10 Drilling Method: Solid Stem Auger Core Barrel: N/A
Boring Location: 101+00, 8.0 Rt. Casing ID/OD: N/A Water Level*: None Observed
Hammer Efficiency Factor: Hammer Type: Automatic Hydraulic Rope & Cathead
Definitions: R = Rock Core Sample Su = Insitu Field Vane Shear Strength (psf) Su(lab) = Lab Vane Shear Strength (psf)
D = Split Spoon Sample SSA = Solid Stem Auger Tv = Pocket Torvane Shear Strength (psf) WC = water content, percent
MD = Unsuccessful Split Spoon Sample attempt HSA = Hollow Stem Auger qp = Unconfined Compressive Strength (ksf) LL = Liquid Limit
U = Thin Wall Tube Sample RC = Roller Cone N-uncorrected = Raw field SPT N-value PL = Plastic Limit
MU = Unsuccessful Thin Wall Tube Sample attempt WOH = weight of 140lb. hammer Hammer Efficiency Factor = Annual Calibration Value PI = Plasticity Index
V = Insitu Vane Shear Test, PP = Pocket Penetrometer WOR/C = weight of rods or casing N60 = SPT N-uncorrected corrected for hammer efficiency G = Grain Size Analysis
MV = Unsuccessful Insitu Vane Shear Test attempt WO1P = Weight of one person N60 = (Hammer Efficiency Factor/60%)*N-uncorrected C = Consolidation Test
Remarks:
All Offsets are form Existing Roadway CL.
Stratification lines represent approximate boundaries between soil types; transitions may be gradual.
* Water level readings have been made at times and under conditions stated. Groundwater fluctuations may occur due to conditions otherthan those present at the time measurements were made. Boring No.: HB-PEMB-111
Depth
(ft
.)
Sam
ple
No.
Sample Information
Pen./
Rec.
(in.)
Sam
ple
Depth
(ft.
)
Blo
ws (
/6 in.)
Shear
Str
ength
(psf)
or
RQ
D (
%)
N-u
ncorr
ecte
d
N60
Casin
g
Blo
ws
Ele
vation
(ft.
)
Gra
phic
Log
Visual Description and Remarks
LaboratoryTesting Results/
AASHTO and
Unified Class.
Page 1 of 1

0
5
10
15
20
25
SSA-0.30
-2.40
-5.00
PAVEMENT.0.30
Brown, damp, gravelly fine to coarse SAND, trace silt. ≅S10
2.40Olive-brown, damp, SILT, little fine sand, little clay. ≅S11
5.00Bottom of Exploration at 5.00 feet below ground surface.
NO REFUSAL
Maine Department of Transportation Project: Route 1 Boring No.: HB-PEMB-112
Soil/Rock Exploration LogLocation: Pembroke, Maine
US CUSTOMARY UNITS PIN: 17774.10
Driller: MaineDOT Elevation (ft.) Auger ID/OD: 5" Dia.
Operator: Giguere/Giles Datum: NAVD88 Sampler: Off Flights
Logged By: B. Wilder Rig Type: CME 45C Hammer Wt./Fall: N/A
Date Start/Finish: 5/17/10-5/17/10 Drilling Method: Solid Stem Auger Core Barrel: N/A
Boring Location: 107+50, 8.5 Rt. Casing ID/OD: N/A Water Level*: None Observed
Hammer Efficiency Factor: Hammer Type: Automatic Hydraulic Rope & Cathead
Definitions: R = Rock Core Sample Su = Insitu Field Vane Shear Strength (psf) Su(lab) = Lab Vane Shear Strength (psf)
D = Split Spoon Sample SSA = Solid Stem Auger Tv = Pocket Torvane Shear Strength (psf) WC = water content, percent
MD = Unsuccessful Split Spoon Sample attempt HSA = Hollow Stem Auger qp = Unconfined Compressive Strength (ksf) LL = Liquid Limit
U = Thin Wall Tube Sample RC = Roller Cone N-uncorrected = Raw field SPT N-value PL = Plastic Limit
MU = Unsuccessful Thin Wall Tube Sample attempt WOH = weight of 140lb. hammer Hammer Efficiency Factor = Annual Calibration Value PI = Plasticity Index
V = Insitu Vane Shear Test, PP = Pocket Penetrometer WOR/C = weight of rods or casing N60 = SPT N-uncorrected corrected for hammer efficiency G = Grain Size Analysis
MV = Unsuccessful Insitu Vane Shear Test attempt WO1P = Weight of one person N60 = (Hammer Efficiency Factor/60%)*N-uncorrected C = Consolidation Test
Remarks:
All Offsets are form Existing Roadway CL.
Stratification lines represent approximate boundaries between soil types; transitions may be gradual.
* Water level readings have been made at times and under conditions stated. Groundwater fluctuations may occur due to conditions otherthan those present at the time measurements were made. Boring No.: HB-PEMB-112
Depth
(ft
.)
Sam
ple
No.
Sample Information
Pen./
Rec.
(in.)
Sam
ple
Depth
(ft.
)
Blo
ws (
/6 in.)
Shear
Str
ength
(psf)
or
RQ
D (
%)
N-u
ncorr
ecte
d
N60
Casin
g
Blo
ws
Ele
vation
(ft.
)
Gra
phic
Log
Visual Description and Remarks
LaboratoryTesting Results/
AASHTO and
Unified Class.
Page 1 of 1

0
5
10
15
20
25
S12
S13
0.25 - 2.10
2.10 - 5.00
SSA-0.25
-2.10
-5.00
PAVEMENT.0.25
Brown, damp, gravelly fine to coarse SAND, trace silt.
2.10Light brown, moist, silty fine to coarse SAND, litle gravel.
5.00Bottom of Exploration at 5.00 feet below ground surface.
NO REFUSAL
G#237500
A-1-b, SM
WC=4.9%
G#237526
A-2-4, SM
WC=1.0%
Maine Department of Transportation Project: Route 1 Boring No.: HB-PEMB-113
Soil/Rock Exploration LogLocation: Pembroke, Maine
US CUSTOMARY UNITS PIN: 17774.10
Driller: MaineDOT Elevation (ft.) Auger ID/OD: 5" Dia.
Operator: Giguere/Giles Datum: NAVD88 Sampler: Off Flights
Logged By: B. Wilder Rig Type: CME 45C Hammer Wt./Fall: N/A
Date Start/Finish: 5/17/10-5/17/10 Drilling Method: Solid Stem Auger Core Barrel: N/A
Boring Location: 114+00, 7.5 Rt. Casing ID/OD: N/A Water Level*: None Observed
Hammer Efficiency Factor: Hammer Type: Automatic Hydraulic Rope & Cathead
Definitions: R = Rock Core Sample Su = Insitu Field Vane Shear Strength (psf) Su(lab) = Lab Vane Shear Strength (psf)
D = Split Spoon Sample SSA = Solid Stem Auger Tv = Pocket Torvane Shear Strength (psf) WC = water content, percent
MD = Unsuccessful Split Spoon Sample attempt HSA = Hollow Stem Auger qp = Unconfined Compressive Strength (ksf) LL = Liquid Limit
U = Thin Wall Tube Sample RC = Roller Cone N-uncorrected = Raw field SPT N-value PL = Plastic Limit
MU = Unsuccessful Thin Wall Tube Sample attempt WOH = weight of 140lb. hammer Hammer Efficiency Factor = Annual Calibration Value PI = Plasticity Index
V = Insitu Vane Shear Test, PP = Pocket Penetrometer WOR/C = weight of rods or casing N60 = SPT N-uncorrected corrected for hammer efficiency G = Grain Size Analysis
MV = Unsuccessful Insitu Vane Shear Test attempt WO1P = Weight of one person N60 = (Hammer Efficiency Factor/60%)*N-uncorrected C = Consolidation Test
Remarks:
All Offsets are form Existing Roadway CL.
Stratification lines represent approximate boundaries between soil types; transitions may be gradual.
* Water level readings have been made at times and under conditions stated. Groundwater fluctuations may occur due to conditions otherthan those present at the time measurements were made. Boring No.: HB-PEMB-113
Depth
(ft
.)
Sam
ple
No.
Sample Information
Pen./
Rec.
(in.)
Sam
ple
Depth
(ft.
)
Blo
ws (
/6 in.)
Shear
Str
ength
(psf)
or
RQ
D (
%)
N-u
ncorr
ecte
d
N60
Casin
g
Blo
ws
Ele
vation
(ft.
)
Gra
phic
Log
Visual Description and Remarks
LaboratoryTesting Results/
AASHTO and
Unified Class.
Page 1 of 1

0
5
10
15
20
25
SSA-0.25
-3.40
PAVEMENT.0.25
Brown, damp, gravelly fine to coarse SAND, trace silt, occasional
cobbles. ≅S12
3.40Bottom of Exploration at 3.40 feet below ground surface.
REFUSAL
Maine Department of Transportation Project: Route 1 Boring No.: HB-PEMB-114
Soil/Rock Exploration LogLocation: Pembroke, Maine
US CUSTOMARY UNITS PIN: 17774.10
Driller: MaineDOT Elevation (ft.) Auger ID/OD: 5" Dia.
Operator: Giguere/Giles Datum: NAVD88 Sampler: Off Flights
Logged By: B. Wilder Rig Type: CME 45C Hammer Wt./Fall: N/A
Date Start/Finish: 5/17/10-5/17/10 Drilling Method: Solid Stem Auger Core Barrel: N/A
Boring Location: 120+00, 8.0 Rt. Casing ID/OD: N/A Water Level*: None Observed
Hammer Efficiency Factor: Hammer Type: Automatic Hydraulic Rope & Cathead
Definitions: R = Rock Core Sample Su = Insitu Field Vane Shear Strength (psf) Su(lab) = Lab Vane Shear Strength (psf)
D = Split Spoon Sample SSA = Solid Stem Auger Tv = Pocket Torvane Shear Strength (psf) WC = water content, percent
MD = Unsuccessful Split Spoon Sample attempt HSA = Hollow Stem Auger qp = Unconfined Compressive Strength (ksf) LL = Liquid Limit
U = Thin Wall Tube Sample RC = Roller Cone N-uncorrected = Raw field SPT N-value PL = Plastic Limit
MU = Unsuccessful Thin Wall Tube Sample attempt WOH = weight of 140lb. hammer Hammer Efficiency Factor = Annual Calibration Value PI = Plasticity Index
V = Insitu Vane Shear Test, PP = Pocket Penetrometer WOR/C = weight of rods or casing N60 = SPT N-uncorrected corrected for hammer efficiency G = Grain Size Analysis
MV = Unsuccessful Insitu Vane Shear Test attempt WO1P = Weight of one person N60 = (Hammer Efficiency Factor/60%)*N-uncorrected C = Consolidation Test
Remarks:
All Offsets are form Existing Roadway CL.
Stratification lines represent approximate boundaries between soil types; transitions may be gradual.
* Water level readings have been made at times and under conditions stated. Groundwater fluctuations may occur due to conditions otherthan those present at the time measurements were made. Boring No.: HB-PEMB-114
Depth
(ft
.)
Sam
ple
No.
Sample Information
Pen./
Rec.
(in.)
Sam
ple
Depth
(ft.
)
Blo
ws (
/6 in.)
Shear
Str
ength
(psf)
or
RQ
D (
%)
N-u
ncorr
ecte
d
N60
Casin
g
Blo
ws
Ele
vation
(ft.
)
Gra
phic
Log
Visual Description and Remarks
LaboratoryTesting Results/
AASHTO and
Unified Class.
Page 1 of 1

0
5
10
15
20
25
S14 2.10 - 5.00
SSA-0.25
-2.10
-5.00
PAVEMENT.0.25
Brown, damp, gravelly fine to coarse SAND, trace silt. ≅S12
2.10Olive-brown, damp, SILT, little fine sand, little clay.
5.00Bottom of Exploration at 5.00 feet below ground surface.
NO REFUSAL
G#237527
A-6, CL
WC=22.3%
LL=35
PL=20
PI=15
Maine Department of Transportation Project: Route 1 Boring No.: HB-PEMB-115
Soil/Rock Exploration LogLocation: Pembroke, Maine
US CUSTOMARY UNITS PIN: 17774.10
Driller: MaineDOT Elevation (ft.) Auger ID/OD: 5" Dia.
Operator: Giguere/Giles Datum: NAVD88 Sampler: Off Flights
Logged By: B. Wilder Rig Type: CME 45C Hammer Wt./Fall: N/A
Date Start/Finish: 5/17/10-5/17/10 Drilling Method: Solid Stem Auger Core Barrel: N/A
Boring Location: 129+00, 8.0 Rt. Casing ID/OD: N/A Water Level*: None Observed
Hammer Efficiency Factor: Hammer Type: Automatic Hydraulic Rope & Cathead
Definitions: R = Rock Core Sample Su = Insitu Field Vane Shear Strength (psf) Su(lab) = Lab Vane Shear Strength (psf)
D = Split Spoon Sample SSA = Solid Stem Auger Tv = Pocket Torvane Shear Strength (psf) WC = water content, percent
MD = Unsuccessful Split Spoon Sample attempt HSA = Hollow Stem Auger qp = Unconfined Compressive Strength (ksf) LL = Liquid Limit
U = Thin Wall Tube Sample RC = Roller Cone N-uncorrected = Raw field SPT N-value PL = Plastic Limit
MU = Unsuccessful Thin Wall Tube Sample attempt WOH = weight of 140lb. hammer Hammer Efficiency Factor = Annual Calibration Value PI = Plasticity Index
V = Insitu Vane Shear Test, PP = Pocket Penetrometer WOR/C = weight of rods or casing N60 = SPT N-uncorrected corrected for hammer efficiency G = Grain Size Analysis
MV = Unsuccessful Insitu Vane Shear Test attempt WO1P = Weight of one person N60 = (Hammer Efficiency Factor/60%)*N-uncorrected C = Consolidation Test
Remarks:
All Offsets are form Existing Roadway CL.
Stratification lines represent approximate boundaries between soil types; transitions may be gradual.
* Water level readings have been made at times and under conditions stated. Groundwater fluctuations may occur due to conditions otherthan those present at the time measurements were made. Boring No.: HB-PEMB-115
Depth
(ft
.)
Sam
ple
No.
Sample Information
Pen./
Rec.
(in.)
Sam
ple
Depth
(ft.
)
Blo
ws (
/6 in.)
Shear
Str
ength
(psf)
or
RQ
D (
%)
N-u
ncorr
ecte
d
N60
Casin
g
Blo
ws
Ele
vation
(ft.
)
Gra
phic
Log
Visual Description and Remarks
LaboratoryTesting Results/
AASHTO and
Unified Class.
Page 1 of 1

0
5
10
15
20
25
S3-0.17
-2.00
Sandy Surface.0.2
Gravelly Material.
2.0Bottom of Test Pit at 2.0 feet below ground surface.
NO REFUSAL
G#238249
A-1-a, SW
WC=0.6%
Maine Department of Transportation Project: Route 1 Test Pit No.: TP-1
Test Pit LogLocation: Pembroke, Maine
US CUSTOMARY UNITS PIN: 17774.10
Contractor: N/A Equipment Type: N/A Elevation (ft.)
Operator: N/A Sampling Method: C. Forzetting Datum: NAVD 88
Logged By: C. Forzetting Test Pit Dimensions (ft): Unknown
Date Start/Finish: 4/26/2010 Total Depth (ft): 2.0
Location: 50+70, 14.0 Lt. Water Level* (ft): None Observed
Definitions: Definitions: Definitions:
S = Grab Sample Su = Insitu Field Vane Shear Strength (psf) WC = water content, percent
V = Insitu Vane Shear Test Tv = Pocket Torvane Shear Strength (psf) LL = Liquid Limit
U = Thin Wall Tube Sample qp = Unconfined Compressive Strength (ksf) PL = Plastic Limit
Su(lab) = Lab Vane Shear Strength (psf) PI = Plasticity Index
G = Grain Size Analysis
Remarks:
Stratification lines represent approximate boundaries between soil types; transitions may be gradual.
* Water level readings have been made at times and under conditions stated. Groundwater fluctuations may occur due to conditions other than thosepresent at the time measurements were made. Test Pit No.: TP-1
De
pth
(ft
.)
Sa
mp
le N
o.
Sample Information
Sa
mp
le D
ep
th
(ft.
)
Sh
ea
r
Str
en
gth
(ps
f)
Ele
va
tio
n
(ft.
)
Gra
ph
ic L
og
Visual Description and Remarks
LaboratoryTesting Results/
AASHTO and
Unified Class.
Page 1 of 1
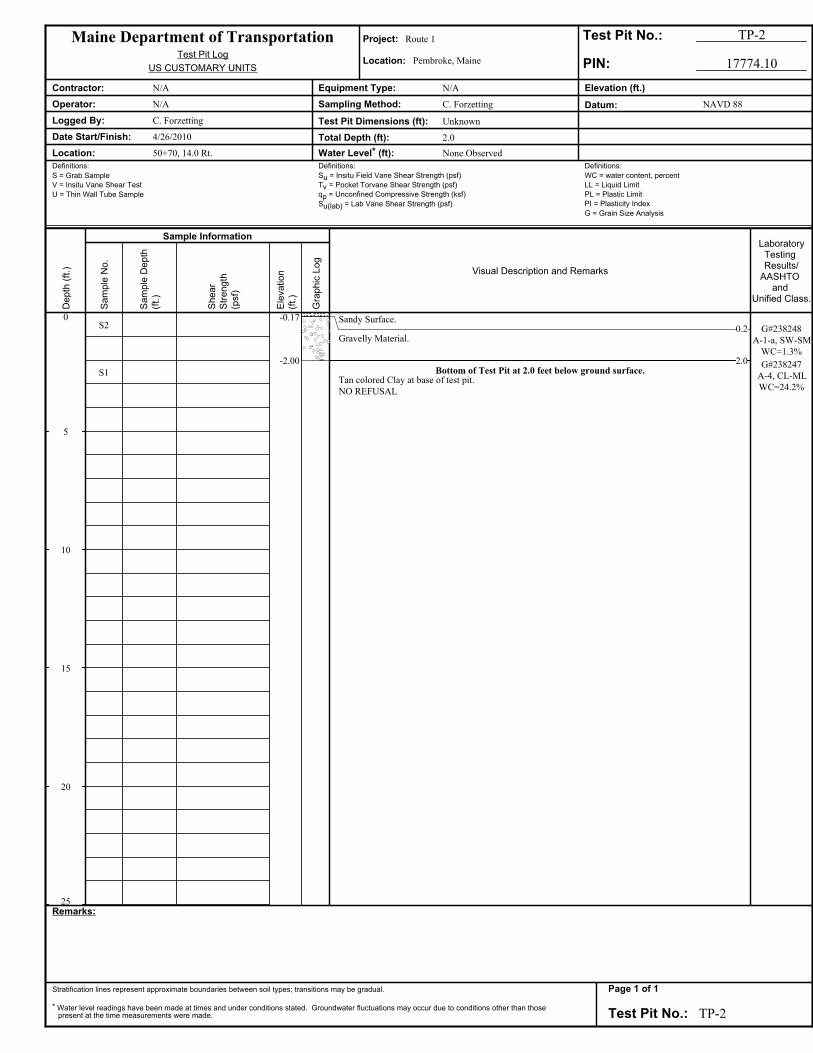
0
5
10
15
20
25
S2
S1
-0.17
-2.00
Sandy Surface.0.2
Gravelly Material.
2.0Bottom of Test Pit at 2.0 feet below ground surface.
Tan colored Clay at base of test pit.
NO REFUSAL
G#238248
A-1-a, SW-SM
WC=1.3%
G#238247
A-4, CL-ML
WC=24.2%
Maine Department of Transportation Project: Route 1 Test Pit No.: TP-2
Test Pit LogLocation: Pembroke, Maine
US CUSTOMARY UNITS PIN: 17774.10
Contractor: N/A Equipment Type: N/A Elevation (ft.)
Operator: N/A Sampling Method: C. Forzetting Datum: NAVD 88
Logged By: C. Forzetting Test Pit Dimensions (ft): Unknown
Date Start/Finish: 4/26/2010 Total Depth (ft): 2.0
Location: 50+70, 14.0 Rt. Water Level* (ft): None Observed
Definitions: Definitions: Definitions:
S = Grab Sample Su = Insitu Field Vane Shear Strength (psf) WC = water content, percent
V = Insitu Vane Shear Test Tv = Pocket Torvane Shear Strength (psf) LL = Liquid Limit
U = Thin Wall Tube Sample qp = Unconfined Compressive Strength (ksf) PL = Plastic Limit
Su(lab) = Lab Vane Shear Strength (psf) PI = Plasticity Index
G = Grain Size Analysis
Remarks:
Stratification lines represent approximate boundaries between soil types; transitions may be gradual.
* Water level readings have been made at times and under conditions stated. Groundwater fluctuations may occur due to conditions other than thosepresent at the time measurements were made. Test Pit No.: TP-2
De
pth
(ft
.)
Sa
mp
le N
o.
Sample Information
Sa
mp
le D
ep
th
(ft.
)
Sh
ea
r
Str
en
gth
(ps
f)
Ele
va
tio
n
(ft.
)
Gra
ph
ic L
og
Visual Description and Remarks
LaboratoryTesting Results/
AASHTO and
Unified Class.
Page 1 of 1
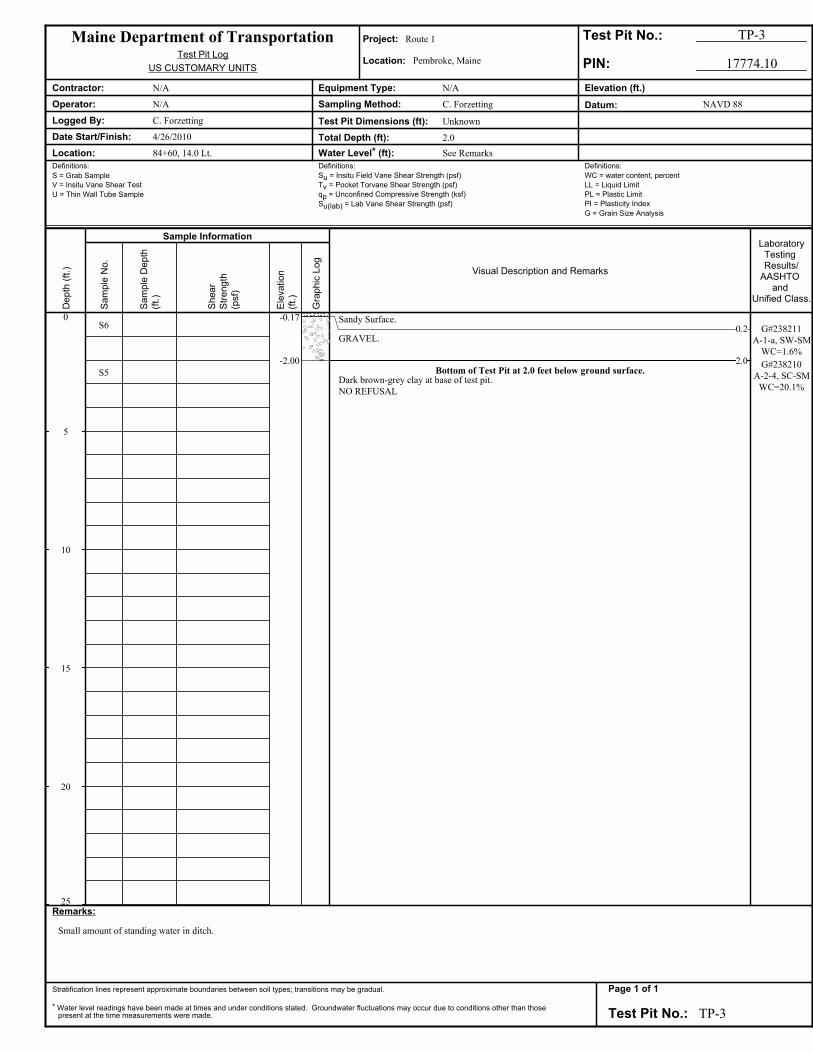
0
5
10
15
20
25
S6
S5
-0.17
-2.00
Sandy Surface.0.2
GRAVEL.
2.0Bottom of Test Pit at 2.0 feet below ground surface.
Dark brown-grey clay at base of test pit.
NO REFUSAL
G#238211
A-1-a, SW-SM
WC=1.6%
G#238210
A-2-4, SC-SM
WC=20.1%
Maine Department of Transportation Project: Route 1 Test Pit No.: TP-3
Test Pit LogLocation: Pembroke, Maine
US CUSTOMARY UNITS PIN: 17774.10
Contractor: N/A Equipment Type: N/A Elevation (ft.)
Operator: N/A Sampling Method: C. Forzetting Datum: NAVD 88
Logged By: C. Forzetting Test Pit Dimensions (ft): Unknown
Date Start/Finish: 4/26/2010 Total Depth (ft): 2.0
Location: 84+60, 14.0 Lt. Water Level* (ft): See Remarks
Definitions: Definitions: Definitions:
S = Grab Sample Su = Insitu Field Vane Shear Strength (psf) WC = water content, percent
V = Insitu Vane Shear Test Tv = Pocket Torvane Shear Strength (psf) LL = Liquid Limit
U = Thin Wall Tube Sample qp = Unconfined Compressive Strength (ksf) PL = Plastic Limit
Su(lab) = Lab Vane Shear Strength (psf) PI = Plasticity Index
G = Grain Size Analysis
Remarks:
Small amount of standing water in ditch.
Stratification lines represent approximate boundaries between soil types; transitions may be gradual.
* Water level readings have been made at times and under conditions stated. Groundwater fluctuations may occur due to conditions other than thosepresent at the time measurements were made. Test Pit No.: TP-3
De
pth
(ft
.)
Sa
mp
le N
o.
Sample Information
Sa
mp
le D
ep
th
(ft.
)
Sh
ea
r
Str
en
gth
(ps
f)
Ele
va
tio
n
(ft.
)
Gra
ph
ic L
og
Visual Description and Remarks
LaboratoryTesting Results/
AASHTO and
Unified Class.
Page 1 of 1
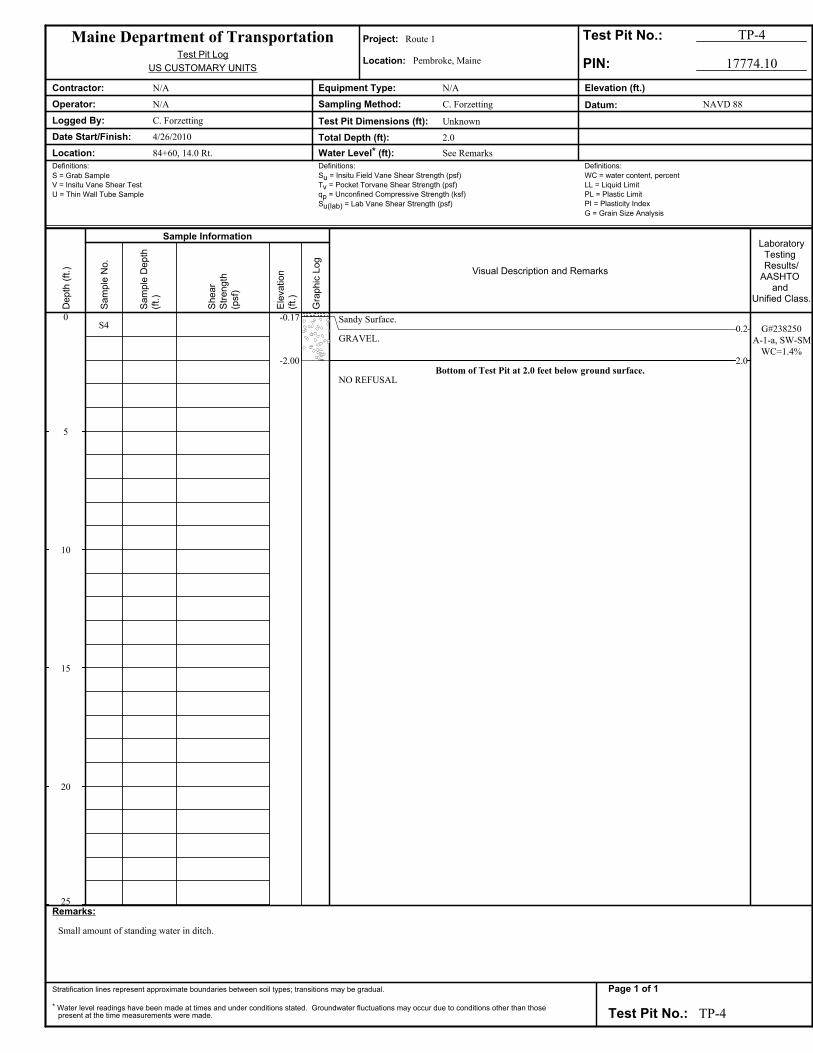
0
5
10
15
20
25
S4-0.17
-2.00
Sandy Surface.0.2
GRAVEL.
2.0Bottom of Test Pit at 2.0 feet below ground surface.
NO REFUSAL
G#238250
A-1-a, SW-SM
WC=1.4%
Maine Department of Transportation Project: Route 1 Test Pit No.: TP-4
Test Pit LogLocation: Pembroke, Maine
US CUSTOMARY UNITS PIN: 17774.10
Contractor: N/A Equipment Type: N/A Elevation (ft.)
Operator: N/A Sampling Method: C. Forzetting Datum: NAVD 88
Logged By: C. Forzetting Test Pit Dimensions (ft): Unknown
Date Start/Finish: 4/26/2010 Total Depth (ft): 2.0
Location: 84+60, 14.0 Rt. Water Level* (ft): See Remarks
Definitions: Definitions: Definitions:
S = Grab Sample Su = Insitu Field Vane Shear Strength (psf) WC = water content, percent
V = Insitu Vane Shear Test Tv = Pocket Torvane Shear Strength (psf) LL = Liquid Limit
U = Thin Wall Tube Sample qp = Unconfined Compressive Strength (ksf) PL = Plastic Limit
Su(lab) = Lab Vane Shear Strength (psf) PI = Plasticity Index
G = Grain Size Analysis
Remarks:
Small amount of standing water in ditch.
Stratification lines represent approximate boundaries between soil types; transitions may be gradual.
* Water level readings have been made at times and under conditions stated. Groundwater fluctuations may occur due to conditions other than thosepresent at the time measurements were made. Test Pit No.: TP-4
De
pth
(ft
.)
Sa
mp
le N
o.
Sample Information
Sa
mp
le D
ep
th
(ft.
)
Sh
ea
r
Str
en
gth
(ps
f)
Ele
va
tio
n
(ft.
)
Gra
ph
ic L
og
Visual Description and Remarks
LaboratoryTesting Results/
AASHTO and
Unified Class.
Page 1 of 1

Offset Pavement Depth Unbound PC- Saved Comments / Date
(Feet) (Feet) Pavement Number Core 5/17/2010
CL 0.50 1
8.5 Lt. 0.40 2
CL 0.35 3
8.5 Lt. 0.30 4
Town(s):Station
62+50
(Feet)
38+50
38+50
State of Maine - Department of Transportation
Pavement Core Summary Sheet
Dennysville-Pembroke Project Number: 17774.10
62+50
Logged By: B. Wilder 1 of 1 2" Thinwall Core

Reference No.
237489
M a i n e D O T , M a t e r i a l s T e s t i n g & E x p l o r a t i o n , 2 1 9 H o g a n R o a d , B a n g o r , M a i n e 0 4 4 0 1
Sample Description
GEOTECHNICAL (DISTURBED)
Sampler: WILDER, BRUCE H
Location: ROADWAY
Sampled
5/17/2010
Received
5/19/2010
PIN: 017774.00 Town: Dennysville,Pembroke,Whiting
Miscellaneous Tests
Comments:
Station: 12+50 Offset, ft: 7.0 RT Dbfg, ft: 0.35-2.1
Boring No./Sample No.
HB-PEMB-101/S1
Liquid Limit @ 25 blows(T 89), %
Plastic Limit (T 90), %
Plasticity Index (T 90), %
Specific Gravity, Corrected to 20°C (T 100)
Loss on Ignition (T 267)
Sample Type: GEOTECHNICAL
Depth
taken in
tube, ft tons/ft² tons/ft²
3 In.
tons/ft² tons/ft²
6 In. Water
Content,
%
Description of Material Sampled at the
Various Tube Depths
Vane Shear Test on Shelby Tubes (Maine DOT)
Direct Shear (T 236)
Shear Angle, °
Normal Stress, psi
Initial Water Content, %
Wet Density, lbs/ft³
Dry Density, lbs/ft³
Specimen Thickness, in
Water Content (T 265), %
5.1
Loss, % H2O, %
Paper Copy: Lab File; Project File; Geotech File
Reported by: FOGG, BRIAN Date Reported: 5/24/2010
S A M P L E I N F O R M A T I O N
A U T H O R I Z A T I O N A N D D I S T R I B U T I O N
T E S T R E S U L T S
U. Shear Remold U. Shear Remold
Sieve Analysis (T 27,
T 11)
3 in. [75.0 mm] 100.0
⅜ in. [9.5 mm] 80.4
¾ in. [19.0 mm] 97.7
½ in. [12.5 mm] 89.5
SIEVE SIZEU.S. [SI]
% Passing
¼ in. [6.3 mm] 71.1
No. 4 [4.75 mm] 64.2
No. 10 [2.00 mm] 49.0
1 in. [25.0 mm] 97.7
No. 20 [0.850 mm] 35.4
No. 40 [0.425 mm] 25.4
No. 200 [0.075 mm] 12.1
No. 60 [0.250 mm] 19.9
No. 100 [0.150 mm] 15.7
Wash Method
Procedure A
GEOTECHNICAL TEST REPORT
Central Laboratory
Consolidation (T 216)
Trimmings, Water Content, %
Initial FinalVoid
Ratio
%
Strain
Water Content, %
Dry Density, lbs/ft³
Void Ratio
Saturation, %
Pmin
Pp
Pmax
Cc/C'c

Reference No.
237490
M a i n e D O T , M a t e r i a l s T e s t i n g & E x p l o r a t i o n , 2 1 9 H o g a n R o a d , B a n g o r , M a i n e 0 4 4 0 1
Sample Description
GEOTECHNICAL (DISTURBED)
Sampler: WILDER, BRUCE H
Location: ROADWAY
Sampled
5/17/2010
Received
5/19/2010
PIN: 017774.00 Town: Dennysville,Pembroke,Whiting
Miscellaneous Tests
Comments:
Station: 12+50 Offset, ft: 7.0 RT Dbfg, ft: 2.1-5.0
Boring No./Sample No.
HB-PEMB-101/S2
Liquid Limit @ 25 blows(T 89), %
45
Plastic Limit (T 90), %
22
Plasticity Index (T 90), %
23
Specific Gravity, Corrected to 20°C (T 100)
Loss on Ignition (T 267)
Sample Type: GEOTECHNICAL
Depth
taken in
tube, ft tons/ft² tons/ft²
3 In.
tons/ft² tons/ft²
6 In. Water
Content,
%
Description of Material Sampled at the
Various Tube Depths
Vane Shear Test on Shelby Tubes (Maine DOT)
Direct Shear (T 236)
Shear Angle, °
Normal Stress, psi
Initial Water Content, %
Wet Density, lbs/ft³
Dry Density, lbs/ft³
Specimen Thickness, in
Water Content (T 265), %
25.7
Loss, % H2O, %
Paper Copy: Lab File; Project File; Geotech File
Reported by: FOGG, BRIAN Date Reported: 6/3/2010
S A M P L E I N F O R M A T I O N
A U T H O R I Z A T I O N A N D D I S T R I B U T I O N
T E S T R E S U L T S
U. Shear Remold U. Shear Remold
Sieve Analysis (T 27,
T 11)
3 in. [75.0 mm]
⅜ in. [9.5 mm] 99.6
¾ in. [19.0 mm]
½ in. [12.5 mm] 100.0
SIEVE SIZEU.S. [SI]
% Passing
¼ in. [6.3 mm] 99.4
No. 4 [4.75 mm] 99.4
No. 10 [2.00 mm] 98.9
1 in. [25.0 mm]
No. 20 [0.850 mm] 98.3
No. 40 [0.425 mm] 97.7
No. 200 [0.075 mm] 95.8
No. 60 [0.250 mm] 97.3
No. 100 [0.150 mm] 96.7
Wash Method
Procedure A
GEOTECHNICAL TEST REPORT
Central Laboratory
Consolidation (T 216)
Trimmings, Water Content, %
Initial FinalVoid
Ratio
%
Strain
Water Content, %
Dry Density, lbs/ft³
Void Ratio
Saturation, %
Pmin
Pp
Pmax
Cc/C'c

0 10 20 30 40 50 60 70 80 90 100 110Liquid Limit, LL
0
10
20
30
40
50
60
Plasticity Index, PI
A-Line
U-Line
CH or OH
CL or OL
MH or OH
ML or OL
CL-ML
PLASTICITY CHART
10 20 30 40 5098765Number of Blows
43
44
45
46
Water Content, %
44.7
21
27
33
FLOW CURVE
25
Reference No. 237490
PIN 017774.00
Station 12+50
Boring No./Sample No. HB-PEMB-101/S2
TOWN Dennysville,Pembroke,Whiting
Sampled 5/17/2010
Water Content, % 25.7
Tested By KDRESDepth 2.1-5.0
Plastic Limit 22
Liquid Limit 45
Plasticity Index 23

Reference No.
237491
M a i n e D O T , M a t e r i a l s T e s t i n g & E x p l o r a t i o n , 2 1 9 H o g a n R o a d , B a n g o r , M a i n e 0 4 4 0 1
Sample Description
GEOTECHNICAL (DISTURBED)
Sampler: WILDER, BRUCE H
Location: ROADWAY
Sampled
5/17/2010
Received
5/19/2010
PIN: 017774.00 Town: Dennysville,Pembroke,Whiting
Miscellaneous Tests
Comments:
Station: 30+00 Offset, ft: 8.5 RT Dbfg, ft: 0.3-2.4
Boring No./Sample No.
HB-PEMB-103/S3
Liquid Limit @ 25 blows(T 89), %
Plastic Limit (T 90), %
Plasticity Index (T 90), %
Specific Gravity, Corrected to 20°C (T 100)
Loss on Ignition (T 267)
Sample Type: GEOTECHNICAL
Depth
taken in
tube, ft tons/ft² tons/ft²
3 In.
tons/ft² tons/ft²
6 In. Water
Content,
%
Description of Material Sampled at the
Various Tube Depths
Vane Shear Test on Shelby Tubes (Maine DOT)
Direct Shear (T 236)
Shear Angle, °
Normal Stress, psi
Initial Water Content, %
Wet Density, lbs/ft³
Dry Density, lbs/ft³
Specimen Thickness, in
Water Content (T 265), %
3.0
Loss, % H2O, %
Paper Copy: Lab File; Project File; Geotech File
Reported by: FOGG, BRIAN Date Reported: 5/24/2010
S A M P L E I N F O R M A T I O N
A U T H O R I Z A T I O N A N D D I S T R I B U T I O N
T E S T R E S U L T S
U. Shear Remold U. Shear Remold
Sieve Analysis (T 27,
T 11)
3 in. [75.0 mm]
⅜ in. [9.5 mm] 60.3
¾ in. [19.0 mm] 100.0
½ in. [12.5 mm] 74.9
SIEVE SIZEU.S. [SI]
% Passing
¼ in. [6.3 mm] 43.0
No. 4 [4.75 mm] 35.8
No. 10 [2.00 mm] 24.2
1 in. [25.0 mm]
No. 20 [0.850 mm] 18.5
No. 40 [0.425 mm] 15.0
No. 200 [0.075 mm] 8.0
No. 60 [0.250 mm] 12.8
No. 100 [0.150 mm] 10.9
Wash Method
Procedure A
GEOTECHNICAL TEST REPORT
Central Laboratory
Consolidation (T 216)
Trimmings, Water Content, %
Initial FinalVoid
Ratio
%
Strain
Water Content, %
Dry Density, lbs/ft³
Void Ratio
Saturation, %
Pmin
Pp
Pmax
Cc/C'c

Reference No.
237492
M a i n e D O T , M a t e r i a l s T e s t i n g & E x p l o r a t i o n , 2 1 9 H o g a n R o a d , B a n g o r , M a i n e 0 4 4 0 1
Sample Description
GEOTECHNICAL (DISTURBED)
Sampler: WILDER, BRUCE H
Location: ROADWAY
Sampled
5/17/2010
Received
5/19/2010
PIN: 017774.00 Town: Dennysville,Pembroke,Whiting
Miscellaneous Tests
Comments:
Station: 38+50 Offset, ft: 8.0 RT Dbfg, ft: 0.3-4.5
Boring No./Sample No.
HB-PEMB-104/S4
Liquid Limit @ 25 blows(T 89), %
Plastic Limit (T 90), %
Plasticity Index (T 90), %
Specific Gravity, Corrected to 20°C (T 100)
Loss on Ignition (T 267)
Sample Type: GEOTECHNICAL
Depth
taken in
tube, ft tons/ft² tons/ft²
3 In.
tons/ft² tons/ft²
6 In. Water
Content,
%
Description of Material Sampled at the
Various Tube Depths
Vane Shear Test on Shelby Tubes (Maine DOT)
Direct Shear (T 236)
Shear Angle, °
Normal Stress, psi
Initial Water Content, %
Wet Density, lbs/ft³
Dry Density, lbs/ft³
Specimen Thickness, in
Water Content (T 265), %
8.8
Loss, % H2O, %
Paper Copy: Lab File; Project File; Geotech File
Reported by: FOGG, BRIAN Date Reported: 6/1/2010
S A M P L E I N F O R M A T I O N
A U T H O R I Z A T I O N A N D D I S T R I B U T I O N
T E S T R E S U L T S
U. Shear Remold U. Shear Remold
Sieve Analysis (T 27,
T 11)
3 in. [75.0 mm]
⅜ in. [9.5 mm] 91.1
¾ in. [19.0 mm] 100.0
½ in. [12.5 mm] 94.4
SIEVE SIZEU.S. [SI]
% Passing
¼ in. [6.3 mm] 84.7
No. 4 [4.75 mm] 79.6
No. 10 [2.00 mm] 62.8
1 in. [25.0 mm]
No. 20 [0.850 mm] 43.7
No. 40 [0.425 mm] 28.3
No. 200 [0.075 mm] 9.2
No. 60 [0.250 mm] 19.4
No. 100 [0.150 mm] 13.4
Wash Method
Procedure A
GEOTECHNICAL TEST REPORT
Central Laboratory
Consolidation (T 216)
Trimmings, Water Content, %
Initial FinalVoid
Ratio
%
Strain
Water Content, %
Dry Density, lbs/ft³
Void Ratio
Saturation, %
Pmin
Pp
Pmax
Cc/C'c

Reference No.
237493
M a i n e D O T , M a t e r i a l s T e s t i n g & E x p l o r a t i o n , 2 1 9 H o g a n R o a d , B a n g o r , M a i n e 0 4 4 0 1
Sample Description
GEOTECHNICAL (DISTURBED)
Sampler: WILDER, BRUCE H
Location: ROADWAY
Sampled
5/17/2010
Received
5/19/2010
PIN: 017774.00 Town: Dennysville,Pembroke,Whiting
Miscellaneous Tests
Comments:
Station: 45+00 Offset, ft: 8.0 RT Dbfg, ft: 2.5-5.0
Boring No./Sample No.
HB-PEMB-105/S5
Liquid Limit @ 25 blows(T 89), %
Plastic Limit (T 90), %
Plasticity Index (T 90), %
Specific Gravity, Corrected to 20°C (T 100)
Loss on Ignition (T 267)
Sample Type: GEOTECHNICAL
Depth
taken in
tube, ft tons/ft² tons/ft²
3 In.
tons/ft² tons/ft²
6 In. Water
Content,
%
Description of Material Sampled at the
Various Tube Depths
Vane Shear Test on Shelby Tubes (Maine DOT)
Direct Shear (T 236)
Shear Angle, °
Normal Stress, psi
Initial Water Content, %
Wet Density, lbs/ft³
Dry Density, lbs/ft³
Specimen Thickness, in
Water Content (T 265), %
16.4
Loss, % H2O, %
Paper Copy: Lab File; Project File; Geotech File
Reported by: FOGG, BRIAN Date Reported: 6/1/2010
S A M P L E I N F O R M A T I O N
A U T H O R I Z A T I O N A N D D I S T R I B U T I O N
T E S T R E S U L T S
U. Shear Remold U. Shear Remold
Sieve Analysis (T 27,
T 11)
3 in. [75.0 mm]
⅜ in. [9.5 mm] 96.5
¾ in. [19.0 mm] 100.0
½ in. [12.5 mm] 97.6
SIEVE SIZEU.S. [SI]
% Passing
¼ in. [6.3 mm] 95.4
No. 4 [4.75 mm] 94.9
No. 10 [2.00 mm] 93.3
1 in. [25.0 mm]
No. 20 [0.850 mm] 91.6
No. 40 [0.425 mm] 90.1
No. 200 [0.075 mm] 59.4
No. 60 [0.250 mm] 88.4
No. 100 [0.150 mm] 83.9
Wash Method
Procedure A
GEOTECHNICAL TEST REPORT
Central Laboratory
Consolidation (T 216)
Trimmings, Water Content, %
Initial FinalVoid
Ratio
%
Strain
Water Content, %
Dry Density, lbs/ft³
Void Ratio
Saturation, %
Pmin
Pp
Pmax
Cc/C'c

Reference No.
237494
M a i n e D O T , M a t e r i a l s T e s t i n g & E x p l o r a t i o n , 2 1 9 H o g a n R o a d , B a n g o r , M a i n e 0 4 4 0 1
Sample Description
GEOTECHNICAL (DISTURBED)
Sampler: WILDER, BRUCE H
Location: ROADWAY
Sampled
5/17/2010
Received
5/19/2010
PIN: 017774.00 Town: Dennysville,Pembroke,Whiting
Miscellaneous Tests
Comments:
Station: 48+50 Offset, ft: 8.0 RT Dbfg, ft: 2.4-5.0
Boring No./Sample No.
HB-PEMB-106/S6
Liquid Limit @ 25 blows(T 89), %
Plastic Limit (T 90), %
Plasticity Index (T 90), %
Specific Gravity, Corrected to 20°C (T 100)
Loss on Ignition (T 267)
Sample Type: GEOTECHNICAL
Depth
taken in
tube, ft tons/ft² tons/ft²
3 In.
tons/ft² tons/ft²
6 In. Water
Content,
%
Description of Material Sampled at the
Various Tube Depths
Vane Shear Test on Shelby Tubes (Maine DOT)
Direct Shear (T 236)
Shear Angle, °
Normal Stress, psi
Initial Water Content, %
Wet Density, lbs/ft³
Dry Density, lbs/ft³
Specimen Thickness, in
Water Content (T 265), %
23.4
Loss, % H2O, %
Paper Copy: Lab File; Project File; Geotech File
Reported by: FOGG, BRIAN Date Reported: 6/1/2010
S A M P L E I N F O R M A T I O N
A U T H O R I Z A T I O N A N D D I S T R I B U T I O N
T E S T R E S U L T S
U. Shear Remold U. Shear Remold
Sieve Analysis (T 27,
T 11)
3 in. [75.0 mm]
⅜ in. [9.5 mm] 98.4
¾ in. [19.0 mm] 100.0
½ in. [12.5 mm] 98.4
SIEVE SIZEU.S. [SI]
% Passing
¼ in. [6.3 mm] 97.9
No. 4 [4.75 mm] 97.2
No. 10 [2.00 mm] 94.7
1 in. [25.0 mm]
No. 20 [0.850 mm] 92.0
No. 40 [0.425 mm] 89.5
No. 200 [0.075 mm] 75.0
No. 60 [0.250 mm] 86.7
No. 100 [0.150 mm] 81.9
Wash Method
Procedure A
GEOTECHNICAL TEST REPORT
Central Laboratory
Consolidation (T 216)
Trimmings, Water Content, %
Initial FinalVoid
Ratio
%
Strain
Water Content, %
Dry Density, lbs/ft³
Void Ratio
Saturation, %
Pmin
Pp
Pmax
Cc/C'c

Reference No.
237495
M a i n e D O T , M a t e r i a l s T e s t i n g & E x p l o r a t i o n , 2 1 9 H o g a n R o a d , B a n g o r , M a i n e 0 4 4 0 1
Sample Description
GEOTECHNICAL (DISTURBED)
Sampler: WILDER, BRUCE H
Location: ROADWAY
Sampled
5/17/2010
Received
5/19/2010
PIN: 017774.00 Town: Dennysville,Pembroke,Whiting
Miscellaneous Tests
Comments:
Station: 62+50 Offset, ft: 8.0 RT Dbfg, ft: 2.4-5.0
Boring No./Sample No.
HB-PEMB-107/S7
Liquid Limit @ 25 blows(T 89), %
Plastic Limit (T 90), %
Plasticity Index (T 90), %
Specific Gravity, Corrected to 20°C (T 100)
Loss on Ignition (T 267)
Sample Type: GEOTECHNICAL
Depth
taken in
tube, ft tons/ft² tons/ft²
3 In.
tons/ft² tons/ft²
6 In. Water
Content,
%
Description of Material Sampled at the
Various Tube Depths
Vane Shear Test on Shelby Tubes (Maine DOT)
Direct Shear (T 236)
Shear Angle, °
Normal Stress, psi
Initial Water Content, %
Wet Density, lbs/ft³
Dry Density, lbs/ft³
Specimen Thickness, in
Water Content (T 265), %
2.1
Loss, % H2O, %
Paper Copy: Lab File; Project File; Geotech File
Reported by: FOGG, BRIAN Date Reported: 5/24/2010
S A M P L E I N F O R M A T I O N
A U T H O R I Z A T I O N A N D D I S T R I B U T I O N
T E S T R E S U L T S
U. Shear Remold U. Shear Remold
Sieve Analysis (T 27,
T 11)
3 in. [75.0 mm]
⅜ in. [9.5 mm] 85.0
¾ in. [19.0 mm] 98.7
½ in. [12.5 mm] 94.3
SIEVE SIZEU.S. [SI]
% Passing
¼ in. [6.3 mm] 78.7
No. 4 [4.75 mm] 73.5
No. 10 [2.00 mm] 61.5
1 in. [25.0 mm] 100.0
No. 20 [0.850 mm] 49.5
No. 40 [0.425 mm] 38.5
No. 200 [0.075 mm] 17.2
No. 60 [0.250 mm] 30.5
No. 100 [0.150 mm] 24.2
Wash Method
Procedure A
GEOTECHNICAL TEST REPORT
Central Laboratory
Consolidation (T 216)
Trimmings, Water Content, %
Initial FinalVoid
Ratio
%
Strain
Water Content, %
Dry Density, lbs/ft³
Void Ratio
Saturation, %
Pmin
Pp
Pmax
Cc/C'c

Reference No.
237496
M a i n e D O T , M a t e r i a l s T e s t i n g & E x p l o r a t i o n , 2 1 9 H o g a n R o a d , B a n g o r , M a i n e 0 4 4 0 1
Sample Description
GEOTECHNICAL (DISTURBED)
Sampler: WILDER, BRUCE H
Location: ROADWAY
Sampled
5/17/2010
Received
5/19/2010
PIN: 017774.00 Town: Dennysville,Pembroke,Whiting
Miscellaneous Tests
Comments:
Station: 82+50 Offset, ft: 8.0 RT Dbfg, ft: 0.25-2.3
Boring No./Sample No.
HB-PEMB-108/S8
Liquid Limit @ 25 blows(T 89), %
Plastic Limit (T 90), %
Plasticity Index (T 90), %
Specific Gravity, Corrected to 20°C (T 100)
Loss on Ignition (T 267)
Sample Type: GEOTECHNICAL
Depth
taken in
tube, ft tons/ft² tons/ft²
3 In.
tons/ft² tons/ft²
6 In. Water
Content,
%
Description of Material Sampled at the
Various Tube Depths
Vane Shear Test on Shelby Tubes (Maine DOT)
Direct Shear (T 236)
Shear Angle, °
Normal Stress, psi
Initial Water Content, %
Wet Density, lbs/ft³
Dry Density, lbs/ft³
Specimen Thickness, in
Water Content (T 265), %
5.4
Loss, % H2O, %
Paper Copy: Lab File; Project File; Geotech File
Reported by: FOGG, BRIAN Date Reported: 5/24/2010
S A M P L E I N F O R M A T I O N
A U T H O R I Z A T I O N A N D D I S T R I B U T I O N
T E S T R E S U L T S
U. Shear Remold U. Shear Remold
Sieve Analysis (T 27,
T 11)
3 in. [75.0 mm]
⅜ in. [9.5 mm] 77.6
¾ in. [19.0 mm] 97.6
½ in. [12.5 mm] 85.7
SIEVE SIZEU.S. [SI]
% Passing
¼ in. [6.3 mm] 68.6
No. 4 [4.75 mm] 63.3
No. 10 [2.00 mm] 50.9
1 in. [25.0 mm] 100.0
No. 20 [0.850 mm] 39.5
No. 40 [0.425 mm] 29.9
No. 200 [0.075 mm] 13.3
No. 60 [0.250 mm] 23.8
No. 100 [0.150 mm] 18.3
Wash Method
Procedure A
GEOTECHNICAL TEST REPORT
Central Laboratory
Consolidation (T 216)
Trimmings, Water Content, %
Initial FinalVoid
Ratio
%
Strain
Water Content, %
Dry Density, lbs/ft³
Void Ratio
Saturation, %
Pmin
Pp
Pmax
Cc/C'c

Reference No.
237497
M a i n e D O T , M a t e r i a l s T e s t i n g & E x p l o r a t i o n , 2 1 9 H o g a n R o a d , B a n g o r , M a i n e 0 4 4 0 1
Sample Description
GEOTECHNICAL (DISTURBED)
Sampler: WILDER, BRUCE H
Location: ROADWAY
Sampled
5/17/2010
Received
5/19/2010
PIN: 017774.00 Town: Dennysville,Pembroke,Whiting
Miscellaneous Tests
Comments:
Station: 82+50 Offset, ft: 8.0 RT Dbfg, ft: 2.3-5.0
Boring No./Sample No.
HB-PEMB-108/S9
Liquid Limit @ 25 blows(T 89), %
47
Plastic Limit (T 90), %
24
Plasticity Index (T 90), %
23
Specific Gravity, Corrected to 20°C (T 100)
Loss on Ignition (T 267)
Sample Type: GEOTECHNICAL
Depth
taken in
tube, ft tons/ft² tons/ft²
3 In.
tons/ft² tons/ft²
6 In. Water
Content,
%
Description of Material Sampled at the
Various Tube Depths
Vane Shear Test on Shelby Tubes (Maine DOT)
Direct Shear (T 236)
Shear Angle, °
Normal Stress, psi
Initial Water Content, %
Wet Density, lbs/ft³
Dry Density, lbs/ft³
Specimen Thickness, in
Water Content (T 265), %
23.0
Loss, % H2O, %
Paper Copy: Lab File; Project File; Geotech File
Reported by: FOGG, BRIAN Date Reported: 6/3/2010
S A M P L E I N F O R M A T I O N
A U T H O R I Z A T I O N A N D D I S T R I B U T I O N
T E S T R E S U L T S
U. Shear Remold U. Shear Remold
Sieve Analysis (T 27,
T 11)
3 in. [75.0 mm]
⅜ in. [9.5 mm]
¾ in. [19.0 mm]
½ in. [12.5 mm]
SIEVE SIZEU.S. [SI]
% Passing
¼ in. [6.3 mm]
No. 4 [4.75 mm] 100.0
No. 10 [2.00 mm] 99.9
1 in. [25.0 mm]
No. 20 [0.850 mm] 99.4
No. 40 [0.425 mm] 98.6
No. 200 [0.075 mm] 94.1
No. 60 [0.250 mm] 97.7
No. 100 [0.150 mm] 96.1
Wash Method
Procedure A
GEOTECHNICAL TEST REPORT
Central Laboratory
Consolidation (T 216)
Trimmings, Water Content, %
Initial FinalVoid
Ratio
%
Strain
Water Content, %
Dry Density, lbs/ft³
Void Ratio
Saturation, %
Pmin
Pp
Pmax
Cc/C'c

0 10 20 30 40 50 60 70 80 90 100 110Liquid Limit, LL
0
10
20
30
40
50
60
Plasticity Index, PI
A-Line
U-Line
CH or OH
CL or OL
MH or OH
ML or OL
CL-ML
PLASTICITY CHART
10 20 30 40 5098765Number of Blows
44
45
46
47
48
49
Water Content, %
46.6
18
24
35
FLOW CURVE
25
Reference No. 237497
PIN 017774.00
Station 82+50
Boring No./Sample No. HB-PEMB-108/S9
TOWN Dennysville,Pembroke,Whiting
Sampled 5/17/2010
Water Content, % 23
Tested By KDRESDepth 2.3-5.0
Plastic Limit 24
Liquid Limit 47
Plasticity Index 23

Reference No.
237498
M a i n e D O T , M a t e r i a l s T e s t i n g & E x p l o r a t i o n , 2 1 9 H o g a n R o a d , B a n g o r , M a i n e 0 4 4 0 1
Sample Description
GEOTECHNICAL (DISTURBED)
Sampler: WILDER, BRUCE H
Location: ROADWAY
Sampled
5/17/2010
Received
5/19/2010
PIN: 017774.00 Town: Dennysville,Pembroke,Whiting
Miscellaneous Tests
Comments:
Station: 101+00 Offset, ft: 8.0 RT Dbfg, ft: 0.3-2.4
Boring No./Sample No.
HB-PEMB-111/S10
Liquid Limit @ 25 blows(T 89), %
Plastic Limit (T 90), %
Plasticity Index (T 90), %
Specific Gravity, Corrected to 20°C (T 100)
Loss on Ignition (T 267)
Sample Type: GEOTECHNICAL
Depth
taken in
tube, ft tons/ft² tons/ft²
3 In.
tons/ft² tons/ft²
6 In. Water
Content,
%
Description of Material Sampled at the
Various Tube Depths
Vane Shear Test on Shelby Tubes (Maine DOT)
Direct Shear (T 236)
Shear Angle, °
Normal Stress, psi
Initial Water Content, %
Wet Density, lbs/ft³
Dry Density, lbs/ft³
Specimen Thickness, in
Water Content (T 265), %
5.7
Loss, % H2O, %
Paper Copy: Lab File; Project File; Geotech File
Reported by: FOGG, BRIAN Date Reported: 6/1/2010
S A M P L E I N F O R M A T I O N
A U T H O R I Z A T I O N A N D D I S T R I B U T I O N
T E S T R E S U L T S
U. Shear Remold U. Shear Remold
Sieve Analysis (T 27,
T 11)
3 in. [75.0 mm]
⅜ in. [9.5 mm] 81.6
¾ in. [19.0 mm] 97.2
½ in. [12.5 mm] 85.9
SIEVE SIZEU.S. [SI]
% Passing
¼ in. [6.3 mm] 72.0
No. 4 [4.75 mm] 66.3
No. 10 [2.00 mm] 53.0
1 in. [25.0 mm] 100.0
No. 20 [0.850 mm] 40.2
No. 40 [0.425 mm] 30.9
No. 200 [0.075 mm] 15.4
No. 60 [0.250 mm] 25.4
No. 100 [0.150 mm] 20.9
Wash Method
Procedure A
GEOTECHNICAL TEST REPORT
Central Laboratory
Consolidation (T 216)
Trimmings, Water Content, %
Initial FinalVoid
Ratio
%
Strain
Water Content, %
Dry Density, lbs/ft³
Void Ratio
Saturation, %
Pmin
Pp
Pmax
Cc/C'c
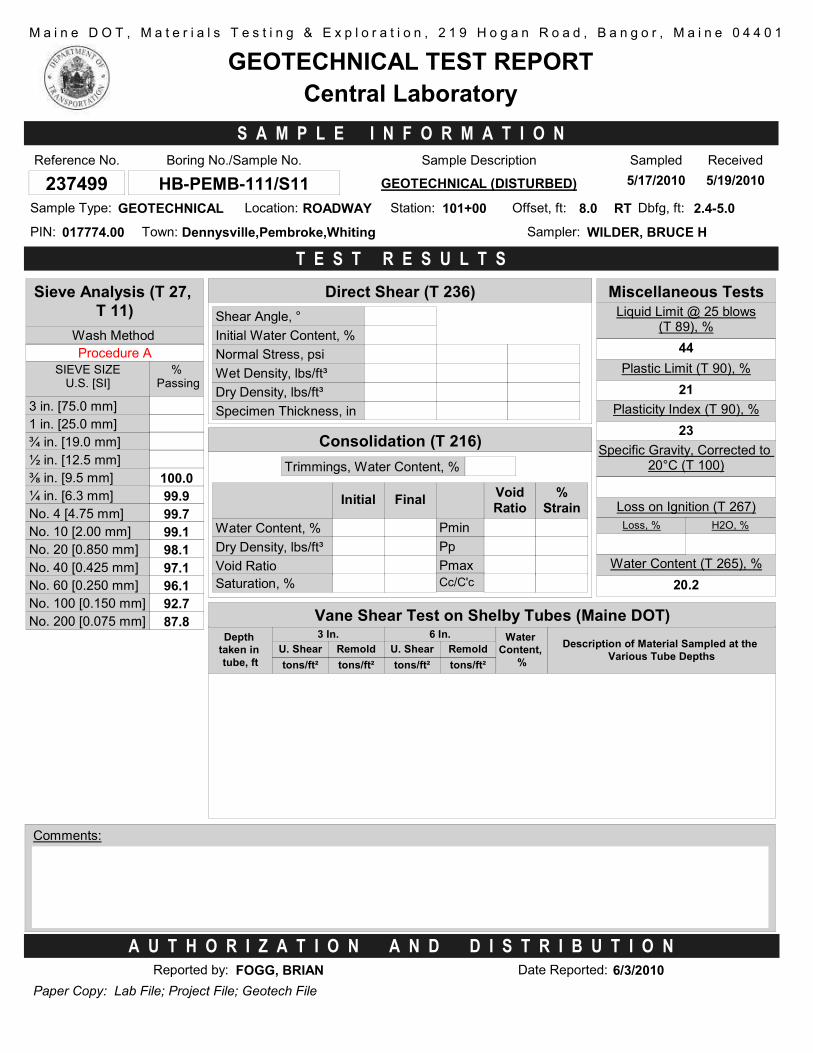
Reference No.
237499
M a i n e D O T , M a t e r i a l s T e s t i n g & E x p l o r a t i o n , 2 1 9 H o g a n R o a d , B a n g o r , M a i n e 0 4 4 0 1
Sample Description
GEOTECHNICAL (DISTURBED)
Sampler: WILDER, BRUCE H
Location: ROADWAY
Sampled
5/17/2010
Received
5/19/2010
PIN: 017774.00 Town: Dennysville,Pembroke,Whiting
Miscellaneous Tests
Comments:
Station: 101+00 Offset, ft: 8.0 RT Dbfg, ft: 2.4-5.0
Boring No./Sample No.
HB-PEMB-111/S11
Liquid Limit @ 25 blows(T 89), %
44
Plastic Limit (T 90), %
21
Plasticity Index (T 90), %
23
Specific Gravity, Corrected to 20°C (T 100)
Loss on Ignition (T 267)
Sample Type: GEOTECHNICAL
Depth
taken in
tube, ft tons/ft² tons/ft²
3 In.
tons/ft² tons/ft²
6 In. Water
Content,
%
Description of Material Sampled at the
Various Tube Depths
Vane Shear Test on Shelby Tubes (Maine DOT)
Direct Shear (T 236)
Shear Angle, °
Normal Stress, psi
Initial Water Content, %
Wet Density, lbs/ft³
Dry Density, lbs/ft³
Specimen Thickness, in
Water Content (T 265), %
20.2
Loss, % H2O, %
Paper Copy: Lab File; Project File; Geotech File
Reported by: FOGG, BRIAN Date Reported: 6/3/2010
S A M P L E I N F O R M A T I O N
A U T H O R I Z A T I O N A N D D I S T R I B U T I O N
T E S T R E S U L T S
U. Shear Remold U. Shear Remold
Sieve Analysis (T 27,
T 11)
3 in. [75.0 mm]
⅜ in. [9.5 mm] 100.0
¾ in. [19.0 mm]
½ in. [12.5 mm]
SIEVE SIZEU.S. [SI]
% Passing
¼ in. [6.3 mm] 99.9
No. 4 [4.75 mm] 99.7
No. 10 [2.00 mm] 99.1
1 in. [25.0 mm]
No. 20 [0.850 mm] 98.1
No. 40 [0.425 mm] 97.1
No. 200 [0.075 mm] 87.8
No. 60 [0.250 mm] 96.1
No. 100 [0.150 mm] 92.7
Wash Method
Procedure A
GEOTECHNICAL TEST REPORT
Central Laboratory
Consolidation (T 216)
Trimmings, Water Content, %
Initial FinalVoid
Ratio
%
Strain
Water Content, %
Dry Density, lbs/ft³
Void Ratio
Saturation, %
Pmin
Pp
Pmax
Cc/C'c

0 10 20 30 40 50 60 70 80 90 100 110Liquid Limit, LL
0
10
20
30
40
50
60
Plasticity Index, PI
A-Line
U-Line
CH or OH
CL or OL
MH or OH
ML or OL
CL-ML
PLASTICITY CHART
10 20 30 40 5098765Number of Blows
42.8
43.2
43.6
44
44.4
44.8
45.2
Water Content, %
44.2
20
26
35
FLOW CURVE
25
Reference No. 237499
PIN 017774.00
Station 101+00
Boring No./Sample No. HB-PEMB-111/S11
TOWN Dennysville,Pembroke,Whiting
Sampled 5/17/2010
Water Content, % 20.2
Tested By KDRESDepth 2.4-5.0
Plastic Limit 21
Liquid Limit 44
Plasticity Index 23

Reference No.
237500
M a i n e D O T , M a t e r i a l s T e s t i n g & E x p l o r a t i o n , 2 1 9 H o g a n R o a d , B a n g o r , M a i n e 0 4 4 0 1
Sample Description
GEOTECHNICAL (DISTURBED)
Sampler: WILDER, BRUCE H
Location: ROADWAY
Sampled
5/18/2010
Received
5/19/2010
PIN: 017774.00 Town: Dennysville,Pembroke,Whiting
Miscellaneous Tests
Comments:
Station: 114+00 Offset, ft: 7.5 RT Dbfg, ft: 0.25-2.1
Boring No./Sample No.
HB-PEMB-113/S12
Liquid Limit @ 25 blows(T 89), %
Plastic Limit (T 90), %
Plasticity Index (T 90), %
Specific Gravity, Corrected to 20°C (T 100)
Loss on Ignition (T 267)
Sample Type: GEOTECHNICAL
Depth
taken in
tube, ft tons/ft² tons/ft²
3 In.
tons/ft² tons/ft²
6 In. Water
Content,
%
Description of Material Sampled at the
Various Tube Depths
Vane Shear Test on Shelby Tubes (Maine DOT)
Direct Shear (T 236)
Shear Angle, °
Normal Stress, psi
Initial Water Content, %
Wet Density, lbs/ft³
Dry Density, lbs/ft³
Specimen Thickness, in
Water Content (T 265), %
4.9
Loss, % H2O, %
Paper Copy: Lab File; Project File; Geotech File
Reported by: FOGG, BRIAN Date Reported: 6/1/2010
S A M P L E I N F O R M A T I O N
A U T H O R I Z A T I O N A N D D I S T R I B U T I O N
T E S T R E S U L T S
U. Shear Remold U. Shear Remold
Sieve Analysis (T 27,
T 11)
3 in. [75.0 mm]
⅜ in. [9.5 mm] 80.0
¾ in. [19.0 mm] 93.8
½ in. [12.5 mm] 84.1
SIEVE SIZEU.S. [SI]
% Passing
¼ in. [6.3 mm] 71.0
No. 4 [4.75 mm] 65.0
No. 10 [2.00 mm] 51.7
1 in. [25.0 mm] 100.0
No. 20 [0.850 mm] 40.4
No. 40 [0.425 mm] 31.1
No. 200 [0.075 mm] 13.7
No. 60 [0.250 mm] 24.3
No. 100 [0.150 mm] 18.7
Wash Method
Procedure A
GEOTECHNICAL TEST REPORT
Central Laboratory
Consolidation (T 216)
Trimmings, Water Content, %
Initial FinalVoid
Ratio
%
Strain
Water Content, %
Dry Density, lbs/ft³
Void Ratio
Saturation, %
Pmin
Pp
Pmax
Cc/C'c

Reference No.
237526
M a i n e D O T , M a t e r i a l s T e s t i n g & E x p l o r a t i o n , 2 1 9 H o g a n R o a d , B a n g o r , M a i n e 0 4 4 0 1
Sample Description
GEOTECHNICAL (DISTURBED)
Sampler: WILDER, BRUCE H
Location: ROADWAY
Sampled
5/18/2010
Received
5/19/2010
PIN: 017774.00 Town: Dennysville,Pembroke,Whiting
Miscellaneous Tests
Comments:
WHITING
Station: 114+00 Offset, ft: 7.5 RT Dbfg, ft: 2.1-5.0
Boring No./Sample No.
HB-PEMB-113/S13
Liquid Limit @ 25 blows(T 89), %
Plastic Limit (T 90), %
Plasticity Index (T 90), %
Specific Gravity, Corrected to 20°C (T 100)
Loss on Ignition (T 267)
Sample Type: GEOTECHNICAL
Depth
taken in
tube, ft tons/ft² tons/ft²
3 In.
tons/ft² tons/ft²
6 In. Water
Content,
%
Description of Material Sampled at the
Various Tube Depths
Vane Shear Test on Shelby Tubes (Maine DOT)
Direct Shear (T 236)
Shear Angle, °
Normal Stress, psi
Initial Water Content, %
Wet Density, lbs/ft³
Dry Density, lbs/ft³
Specimen Thickness, in
Water Content (T 265), %
1.0
Loss, % H2O, %
Paper Copy: Lab File; Project File; Geotech File
Reported by: FOGG, BRIAN Date Reported: 6/1/2010
S A M P L E I N F O R M A T I O N
A U T H O R I Z A T I O N A N D D I S T R I B U T I O N
T E S T R E S U L T S
U. Shear Remold U. Shear Remold
Sieve Analysis (T 27,
T 11)
3 in. [75.0 mm]
⅜ in. [9.5 mm] 87.5
¾ in. [19.0 mm] 96.3
½ in. [12.5 mm] 91.3
SIEVE SIZEU.S. [SI]
% Passing
¼ in. [6.3 mm] 81.4
No. 4 [4.75 mm] 77.2
No. 10 [2.00 mm] 65.4
1 in. [25.0 mm] 100.0
No. 20 [0.850 mm] 55.3
No. 40 [0.425 mm] 47.0
No. 200 [0.075 mm] 26.1
No. 60 [0.250 mm] 40.5
No. 100 [0.150 mm] 34.2
Wash Method
Procedure A
GEOTECHNICAL TEST REPORT
Central Laboratory
Consolidation (T 216)
Trimmings, Water Content, %
Initial FinalVoid
Ratio
%
Strain
Water Content, %
Dry Density, lbs/ft³
Void Ratio
Saturation, %
Pmin
Pp
Pmax
Cc/C'c

Reference No.
237527
M a i n e D O T , M a t e r i a l s T e s t i n g & E x p l o r a t i o n , 2 1 9 H o g a n R o a d , B a n g o r , M a i n e 0 4 4 0 1
Sample Description
GEOTECHNICAL (DISTURBED)
Sampler: WILDER, BRUCE H
Location: ROADWAY
Sampled
5/17/2010
Received
5/19/2010
PIN: 017774.00 Town: Dennysville,Pembroke,Whiting
Miscellaneous Tests
Comments:
Station: 129+00 Offset, ft: 8.0 RT Dbfg, ft: 2.1-5.0
Boring No./Sample No.
HB-PEMB-115/S14
Liquid Limit @ 25 blows(T 89), %
35
Plastic Limit (T 90), %
20
Plasticity Index (T 90), %
15
Specific Gravity, Corrected to 20°C (T 100)
Loss on Ignition (T 267)
Sample Type: GEOTECHNICAL
Depth
taken in
tube, ft tons/ft² tons/ft²
3 In.
tons/ft² tons/ft²
6 In. Water
Content,
%
Description of Material Sampled at the
Various Tube Depths
Vane Shear Test on Shelby Tubes (Maine DOT)
Direct Shear (T 236)
Shear Angle, °
Normal Stress, psi
Initial Water Content, %
Wet Density, lbs/ft³
Dry Density, lbs/ft³
Specimen Thickness, in
Water Content (T 265), %
22.3
Loss, % H2O, %
Paper Copy: Lab File; Project File; Geotech File
Reported by: FOGG, BRIAN Date Reported: 6/2/2010
S A M P L E I N F O R M A T I O N
A U T H O R I Z A T I O N A N D D I S T R I B U T I O N
T E S T R E S U L T S
U. Shear Remold U. Shear Remold
Sieve Analysis (T 27,
T 11)
3 in. [75.0 mm]
⅜ in. [9.5 mm] 98.1
¾ in. [19.0 mm] 100.0
½ in. [12.5 mm] 98.1
SIEVE SIZEU.S. [SI]
% Passing
¼ in. [6.3 mm] 96.7
No. 4 [4.75 mm] 96.2
No. 10 [2.00 mm] 93.9
1 in. [25.0 mm]
No. 20 [0.850 mm] 91.4
No. 40 [0.425 mm] 88.9
No. 200 [0.075 mm] 78.1
No. 60 [0.250 mm] 86.7
No. 100 [0.150 mm] 83.6
Wash Method
Procedure A
GEOTECHNICAL TEST REPORT
Central Laboratory
Consolidation (T 216)
Trimmings, Water Content, %
Initial FinalVoid
Ratio
%
Strain
Water Content, %
Dry Density, lbs/ft³
Void Ratio
Saturation, %
Pmin
Pp
Pmax
Cc/C'c

Reference No.
238249
M a i n e D O T , M a t e r i a l s T e s t i n g & E x p l o r a t i o n , 2 1 9 H o g a n R o a d , B a n g o r , M a i n e 0 4 4 0 1
Sample Description
GEOTECHNICAL (DISTURBED)
Sampler: FORZETTING, CARMEN L
Location: ROADWAY
Sampled
4/26/2010
Received
4/27/2010
PIN: 017774.00 Town: Dennysville,Pembroke,Whiting
Miscellaneous Tests
Comments:
Station: 50+70 Offset, ft: 14.0 LT Dbfg, ft: 0.17-2.0
Boring No./Sample No.
TP-1/S3
Liquid Limit @ 25 blows(T 89), %
Plastic Limit (T 90), %
Plasticity Index (T 90), %
Specific Gravity, Corrected to 20°C (T 100)
Loss on Ignition (T 267)
Sample Type: GEOTECHNICAL
Depth
taken in
tube, ft tons/ft² tons/ft²
3 In.
tons/ft² tons/ft²
6 In. Water
Content,
%
Description of Material Sampled at the
Various Tube Depths
Vane Shear Test on Shelby Tubes (Maine DOT)
Direct Shear (T 236)
Shear Angle, °
Normal Stress, psi
Initial Water Content, %
Wet Density, lbs/ft³
Dry Density, lbs/ft³
Specimen Thickness, in
Water Content (T 265), %
0.6
Loss, % H2O, %
Paper Copy: Lab File; Project File; Geotech File
Reported by: FOGG, BRIAN Date Reported: 5/6/2010
S A M P L E I N F O R M A T I O N
A U T H O R I Z A T I O N A N D D I S T R I B U T I O N
T E S T R E S U L T S
U. Shear Remold U. Shear Remold
Sieve Analysis (T 27,
T 11)
3 in. [75.0 mm] 100.0
⅜ in. [9.5 mm] 68.8
¾ in. [19.0 mm] 81.5
½ in. [12.5 mm] 73.2
SIEVE SIZEU.S. [SI]
% Passing
¼ in. [6.3 mm] 63.0
No. 4 [4.75 mm] 58.4
No. 10 [2.00 mm] 44.9
1 in. [25.0 mm] 88.9
No. 20 [0.850 mm] 29.7
No. 40 [0.425 mm] 17.3
No. 200 [0.075 mm] 4.7
No. 60 [0.250 mm] 10.8
No. 100 [0.150 mm] 7.1
Wash Method
Procedure A
GEOTECHNICAL TEST REPORT
Central Laboratory
Consolidation (T 216)
Trimmings, Water Content, %
Initial FinalVoid
Ratio
%
Strain
Water Content, %
Dry Density, lbs/ft³
Void Ratio
Saturation, %
Pmin
Pp
Pmax
Cc/C'c

Reference No.
238247
M a i n e D O T , M a t e r i a l s T e s t i n g & E x p l o r a t i o n , 2 1 9 H o g a n R o a d , B a n g o r , M a i n e 0 4 4 0 1
Sample Description
GEOTECHNICAL (DISTURBED)
Sampler: FORZETTING, CARMEN L
Location: ROADWAY
Sampled
4/26/2010
Received
4/27/2010
PIN: 017774.00 Town: Dennysville,Pembroke,Whiting
Miscellaneous Tests
Comments:
Station: 50+70 Offset, ft: 14.0 RT Dbfg, ft: 2.0
Boring No./Sample No.
TP-2/S1
Liquid Limit @ 25 blows(T 89), %
Plastic Limit (T 90), %
Plasticity Index (T 90), %
Specific Gravity, Corrected to 20°C (T 100)
Loss on Ignition (T 267)
Sample Type: GEOTECHNICAL
Depth
taken in
tube, ft tons/ft² tons/ft²
3 In.
tons/ft² tons/ft²
6 In. Water
Content,
%
Description of Material Sampled at the
Various Tube Depths
Vane Shear Test on Shelby Tubes (Maine DOT)
Direct Shear (T 236)
Shear Angle, °
Normal Stress, psi
Initial Water Content, %
Wet Density, lbs/ft³
Dry Density, lbs/ft³
Specimen Thickness, in
Water Content (T 265), %
24.2
Loss, % H2O, %
Paper Copy: Lab File; Project File; Geotech File
Reported by: FOGG, BRIAN Date Reported: 5/3/2010
S A M P L E I N F O R M A T I O N
A U T H O R I Z A T I O N A N D D I S T R I B U T I O N
T E S T R E S U L T S
U. Shear Remold U. Shear Remold
Sieve Analysis (T 27,
T 11)
3 in. [75.0 mm]
⅜ in. [9.5 mm] 96.1
¾ in. [19.0 mm] 100.0
½ in. [12.5 mm] 96.7
SIEVE SIZEU.S. [SI]
% Passing
¼ in. [6.3 mm] 94.3
No. 4 [4.75 mm] 93.6
No. 10 [2.00 mm] 91.7
1 in. [25.0 mm]
No. 20 [0.850 mm] 89.4
No. 40 [0.425 mm] 87.4
No. 200 [0.075 mm] 79.6
No. 60 [0.250 mm] 86.1
No. 100 [0.150 mm] 84.0
Wash Method
Procedure A
GEOTECHNICAL TEST REPORT
Central Laboratory
Consolidation (T 216)
Trimmings, Water Content, %
Initial FinalVoid
Ratio
%
Strain
Water Content, %
Dry Density, lbs/ft³
Void Ratio
Saturation, %
Pmin
Pp
Pmax
Cc/C'c

Reference No.
238248
M a i n e D O T , M a t e r i a l s T e s t i n g & E x p l o r a t i o n , 2 1 9 H o g a n R o a d , B a n g o r , M a i n e 0 4 4 0 1
Sample Description
GEOTECHNICAL (DISTURBED)
Sampler: FORZETTING, CARMEN L
Location: ROADWAY
Sampled
4/26/2010
Received
4/27/2010
PIN: 017774.00 Town: Dennysville,Pembroke,Whiting
Miscellaneous Tests
Comments:
Station: 50+70 Offset, ft: 14.0 RT Dbfg, ft: 0.17-2.0
Boring No./Sample No.
TP-2/S2
Liquid Limit @ 25 blows(T 89), %
Plastic Limit (T 90), %
Plasticity Index (T 90), %
Specific Gravity, Corrected to 20°C (T 100)
Loss on Ignition (T 267)
Sample Type: GEOTECHNICAL
Depth
taken in
tube, ft tons/ft² tons/ft²
3 In.
tons/ft² tons/ft²
6 In. Water
Content,
%
Description of Material Sampled at the
Various Tube Depths
Vane Shear Test on Shelby Tubes (Maine DOT)
Direct Shear (T 236)
Shear Angle, °
Normal Stress, psi
Initial Water Content, %
Wet Density, lbs/ft³
Dry Density, lbs/ft³
Specimen Thickness, in
Water Content (T 265), %
1.3
Loss, % H2O, %
Paper Copy: Lab File; Project File; Geotech File
Reported by: FOGG, BRIAN Date Reported: 5/6/2010
S A M P L E I N F O R M A T I O N
A U T H O R I Z A T I O N A N D D I S T R I B U T I O N
T E S T R E S U L T S
U. Shear Remold U. Shear Remold
Sieve Analysis (T 27,
T 11)
3 in. [75.0 mm] 91.9
⅜ in. [9.5 mm] 67.7
¾ in. [19.0 mm] 78.4
½ in. [12.5 mm] 72.5
SIEVE SIZEU.S. [SI]
% Passing
¼ in. [6.3 mm] 61.3
No. 4 [4.75 mm] 56.6
No. 10 [2.00 mm] 43.6
1 in. [25.0 mm] 80.2
No. 20 [0.850 mm] 29.9
No. 40 [0.425 mm] 20.0
No. 200 [0.075 mm] 8.2
No. 60 [0.250 mm] 14.6
No. 100 [0.150 mm] 11.0
Wash Method
Procedure A
GEOTECHNICAL TEST REPORT
Central Laboratory
Consolidation (T 216)
Trimmings, Water Content, %
Initial FinalVoid
Ratio
%
Strain
Water Content, %
Dry Density, lbs/ft³
Void Ratio
Saturation, %
Pmin
Pp
Pmax
Cc/C'c

Reference No.
238210
M a i n e D O T , M a t e r i a l s T e s t i n g & E x p l o r a t i o n , 2 1 9 H o g a n R o a d , B a n g o r , M a i n e 0 4 4 0 1
Sample Description
GEOTECHNICAL (DISTURBED)
Sampler: FORZETTING, CARMEN L
Location: ROADWAY
Sampled
4/26/2010
Received
4/27/2010
PIN: 017774.00 Town: Dennysville,Pembroke,Whiting
Miscellaneous Tests
Comments:
Station: 84+60 Offset, ft: 14.0 LT Dbfg, ft: 2.0
Boring No./Sample No.
TP-3/S5
Liquid Limit @ 25 blows(T 89), %
Plastic Limit (T 90), %
Plasticity Index (T 90), %
Specific Gravity, Corrected to 20°C (T 100)
Loss on Ignition (T 267)
Sample Type: GEOTECHNICAL
Depth
taken in
tube, ft tons/ft² tons/ft²
3 In.
tons/ft² tons/ft²
6 In. Water
Content,
%
Description of Material Sampled at the
Various Tube Depths
Vane Shear Test on Shelby Tubes (Maine DOT)
Direct Shear (T 236)
Shear Angle, °
Normal Stress, psi
Initial Water Content, %
Wet Density, lbs/ft³
Dry Density, lbs/ft³
Specimen Thickness, in
Water Content (T 265), %
20.1
Loss, % H2O, %
Paper Copy: Lab File; Project File; Geotech File
Reported by: FOGG, BRIAN Date Reported: 5/3/2010
S A M P L E I N F O R M A T I O N
A U T H O R I Z A T I O N A N D D I S T R I B U T I O N
T E S T R E S U L T S
U. Shear Remold U. Shear Remold
Sieve Analysis (T 27,
T 11)
3 in. [75.0 mm]
⅜ in. [9.5 mm] 89.4
¾ in. [19.0 mm] 100.0
½ in. [12.5 mm] 92.0
SIEVE SIZEU.S. [SI]
% Passing
¼ in. [6.3 mm] 84.1
No. 4 [4.75 mm] 80.8
No. 10 [2.00 mm] 70.2
1 in. [25.0 mm]
No. 20 [0.850 mm] 59.2
No. 40 [0.425 mm] 50.7
No. 200 [0.075 mm] 32.5
No. 60 [0.250 mm] 45.4
No. 100 [0.150 mm] 39.8
Wash Method
Procedure A
GEOTECHNICAL TEST REPORT
Central Laboratory
Consolidation (T 216)
Trimmings, Water Content, %
Initial FinalVoid
Ratio
%
Strain
Water Content, %
Dry Density, lbs/ft³
Void Ratio
Saturation, %
Pmin
Pp
Pmax
Cc/C'c
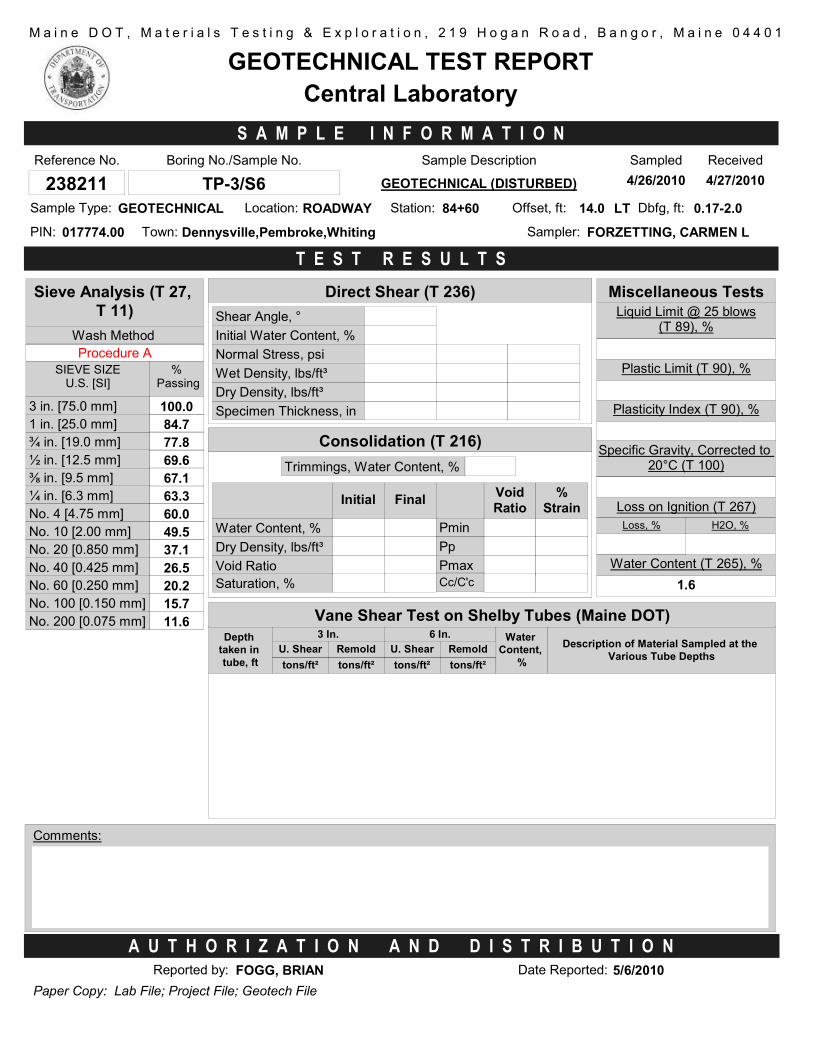
Reference No.
238211
M a i n e D O T , M a t e r i a l s T e s t i n g & E x p l o r a t i o n , 2 1 9 H o g a n R o a d , B a n g o r , M a i n e 0 4 4 0 1
Sample Description
GEOTECHNICAL (DISTURBED)
Sampler: FORZETTING, CARMEN L
Location: ROADWAY
Sampled
4/26/2010
Received
4/27/2010
PIN: 017774.00 Town: Dennysville,Pembroke,Whiting
Miscellaneous Tests
Comments:
Station: 84+60 Offset, ft: 14.0 LT Dbfg, ft: 0.17-2.0
Boring No./Sample No.
TP-3/S6
Liquid Limit @ 25 blows(T 89), %
Plastic Limit (T 90), %
Plasticity Index (T 90), %
Specific Gravity, Corrected to 20°C (T 100)
Loss on Ignition (T 267)
Sample Type: GEOTECHNICAL
Depth
taken in
tube, ft tons/ft² tons/ft²
3 In.
tons/ft² tons/ft²
6 In. Water
Content,
%
Description of Material Sampled at the
Various Tube Depths
Vane Shear Test on Shelby Tubes (Maine DOT)
Direct Shear (T 236)
Shear Angle, °
Normal Stress, psi
Initial Water Content, %
Wet Density, lbs/ft³
Dry Density, lbs/ft³
Specimen Thickness, in
Water Content (T 265), %
1.6
Loss, % H2O, %
Paper Copy: Lab File; Project File; Geotech File
Reported by: FOGG, BRIAN Date Reported: 5/6/2010
S A M P L E I N F O R M A T I O N
A U T H O R I Z A T I O N A N D D I S T R I B U T I O N
T E S T R E S U L T S
U. Shear Remold U. Shear Remold
Sieve Analysis (T 27,
T 11)
3 in. [75.0 mm] 100.0
⅜ in. [9.5 mm] 67.1
¾ in. [19.0 mm] 77.8
½ in. [12.5 mm] 69.6
SIEVE SIZEU.S. [SI]
% Passing
¼ in. [6.3 mm] 63.3
No. 4 [4.75 mm] 60.0
No. 10 [2.00 mm] 49.5
1 in. [25.0 mm] 84.7
No. 20 [0.850 mm] 37.1
No. 40 [0.425 mm] 26.5
No. 200 [0.075 mm] 11.6
No. 60 [0.250 mm] 20.2
No. 100 [0.150 mm] 15.7
Wash Method
Procedure A
GEOTECHNICAL TEST REPORT
Central Laboratory
Consolidation (T 216)
Trimmings, Water Content, %
Initial FinalVoid
Ratio
%
Strain
Water Content, %
Dry Density, lbs/ft³
Void Ratio
Saturation, %
Pmin
Pp
Pmax
Cc/C'c

Reference No.
238250
M a i n e D O T , M a t e r i a l s T e s t i n g & E x p l o r a t i o n , 2 1 9 H o g a n R o a d , B a n g o r , M a i n e 0 4 4 0 1
Sample Description
GEOTECHNICAL (DISTURBED)
Sampler: FORZETTING, CARMEN L
Location: ROADWAY
Sampled
4/26/2010
Received
4/27/2010
PIN: 017774.00 Town: Dennysville,Pembroke,Whiting
Miscellaneous Tests
Comments:
Station: 84+60 Offset, ft: 14.0 RT Dbfg, ft: 0.17-2.0
Boring No./Sample No.
TP-4/S4
Liquid Limit @ 25 blows(T 89), %
Plastic Limit (T 90), %
Plasticity Index (T 90), %
Specific Gravity, Corrected to 20°C (T 100)
Loss on Ignition (T 267)
Sample Type: GEOTECHNICAL
Depth
taken in
tube, ft tons/ft² tons/ft²
3 In.
tons/ft² tons/ft²
6 In. Water
Content,
%
Description of Material Sampled at the
Various Tube Depths
Vane Shear Test on Shelby Tubes (Maine DOT)
Direct Shear (T 236)
Shear Angle, °
Normal Stress, psi
Initial Water Content, %
Wet Density, lbs/ft³
Dry Density, lbs/ft³
Specimen Thickness, in
Water Content (T 265), %
1.4
Loss, % H2O, %
Paper Copy: Lab File; Project File; Geotech File
Reported by: FOGG, BRIAN Date Reported: 5/6/2010
S A M P L E I N F O R M A T I O N
A U T H O R I Z A T I O N A N D D I S T R I B U T I O N
T E S T R E S U L T S
U. Shear Remold U. Shear Remold
Sieve Analysis (T 27,
T 11)
3 in. [75.0 mm] 100.0
⅜ in. [9.5 mm] 69.0
¾ in. [19.0 mm] 81.5
½ in. [12.5 mm] 75.5
SIEVE SIZEU.S. [SI]
% Passing
¼ in. [6.3 mm] 62.3
No. 4 [4.75 mm] 58.4
No. 10 [2.00 mm] 45.7
1 in. [25.0 mm] 85.6
No. 20 [0.850 mm] 32.1
No. 40 [0.425 mm] 21.5
No. 200 [0.075 mm] 8.2
No. 60 [0.250 mm] 15.6
No. 100 [0.150 mm] 11.6
Wash Method
Procedure A
GEOTECHNICAL TEST REPORT
Central Laboratory
Consolidation (T 216)
Trimmings, Water Content, %
Initial FinalVoid
Ratio
%
Strain
Water Content, %
Dry Density, lbs/ft³
Void Ratio
Saturation, %
Pmin
Pp
Pmax
Cc/C'c