Geotechnical Engineering Report - Denton - Construction...1 GEOTECHNICAL INVESTIGATION DENTON...
165
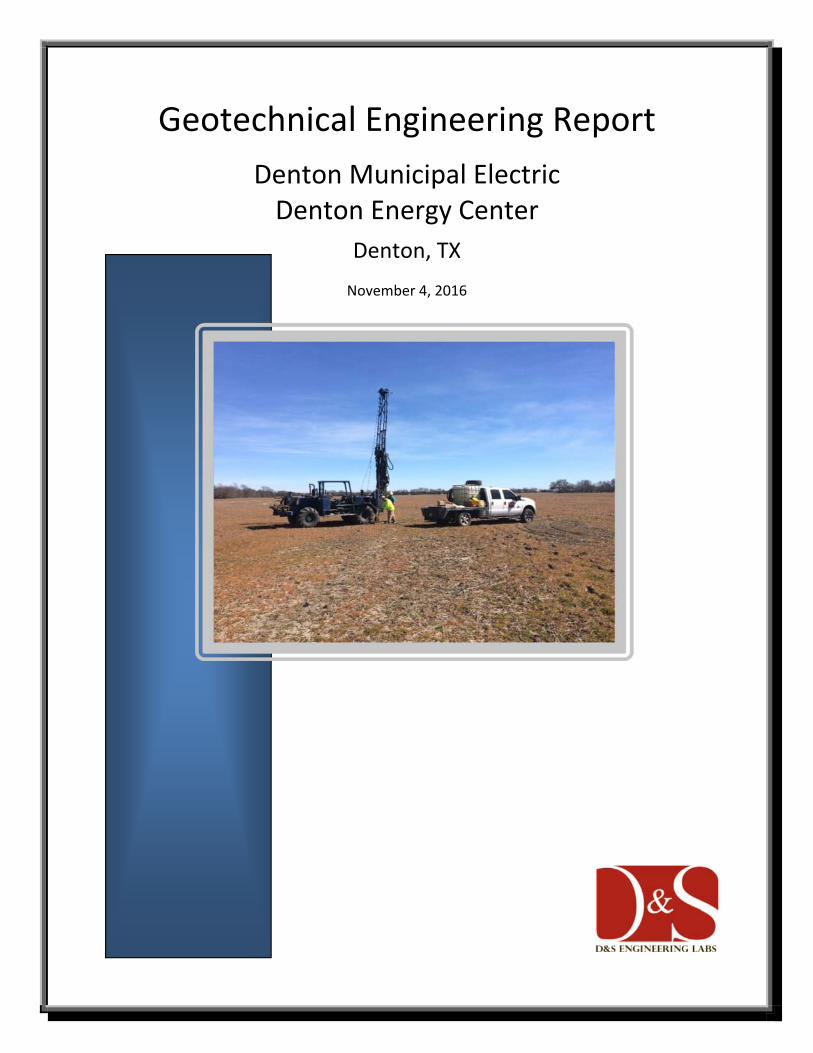
Geotechnical Engineering Report Denton Municipal Electric Denton Energy Center Denton, TX November 4, 2016
Transcript of Geotechnical Engineering Report - Denton - Construction...1 GEOTECHNICAL INVESTIGATION DENTON...
Geotechnical Engineering Report
Denton Municipal Electric Denton Energy Center
Denton, TX
November 4, 2016
D&S ENGINEERING LABS, LLC DME Denton Energy Center - Denton, Texas (13-0278-12)
TABLE OF CONTENTS
1.0 PROJECT DESCRIPTION ...................................................................................... 1
2.0 PURPOSE AND SCOPE ........................................................................................ 2
3.0 FIELD AND LABORATORY INVESTIGATION ....................................................... 2
3.1 Drilling and Sampling ........................................................................................ 2
3.1.1 Field Resistivity Surveys .......................................................................... 3
3.2 Laboratory Testing ............................................................................................ 4
3.2.1 Unconfined Compression Tests ............................................................... 5
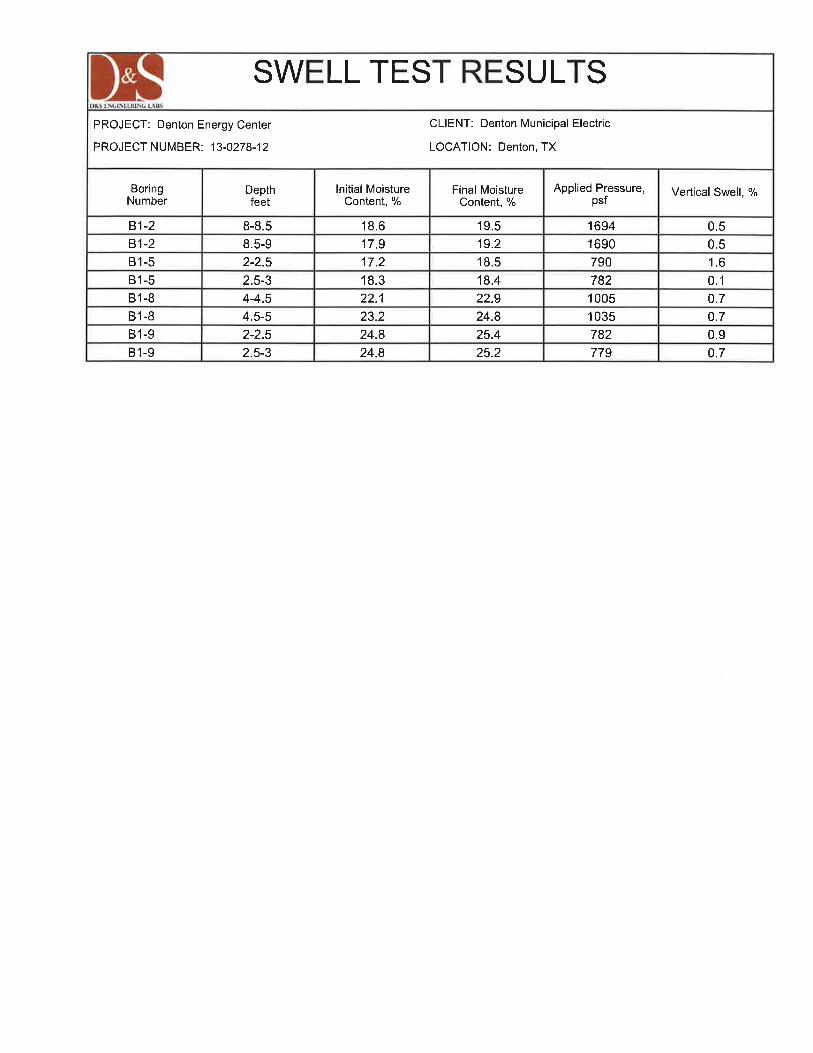
3.2.2 Overburden Swell Tests ........................................................................... 5
3.2.3 California Bearing Ratio (CBR) ................................................................ 5
4.0 SITE CONDITIONS ................................................................................................ 5
4.1 Geology ............................................................................................................. 5
4.2 Stratigraphy ....................................................................................................... 6
4.3 Groundwater ..................................................................................................... 7
4.4 Frost Depth ....................................................................................................... 9
5.0 ENGINEERING ANALYSIS .................................................................................... 9
5.1 Estimated Potential Vertical Movement (PVM) ................................................. 9
5.2 Settlement Potential .......................................................................................... 9
6.0 FOUNDATION RECOMMENDATIONS .................................................................. 9
6.1 Drilled Shaft Foundations ................................................................................ 10
6.1.1 Straight-sided Drilled Shafts .................................................................. 10
6.1.2 Pier-supported Grade Beams and Suspended Floor Slabs ................... 11
6.1.3 Lateral Load Parameters ....................................................................... 12
6.1.4 Drilled Shaft Construction Considerations ............................................. 13
6.2 Shallow Foundations ....................................................................................... 14
6.2.1 Mat Foundations .................................................................................... 14
6.2.2 Shallow Footings .................................................................................... 15
7.0 EARTHWORK RECOMMENDATIONS ................................................................ 16
7.1 Subgrade Modifications .................................................................................. 16
7.2 Utility Lines and Flexible Connections ............................................................ 17
7.3 Additional Considerations ............................................................................... 18
8.0 RETAINING WALLS AND BELOW GRADE WALLS ............................................ 18
8.1 Lateral Earth Pressures .................................................................................. 18
8.2 Wall Drainage ................................................................................................. 19
8.3 Wall Backfill ..................................................................................................... 20
9.0 EXCAVATIONS .................................................................................................... 20
D&S ENGINEERING LABS, LLC DME Denton Energy Center - Denton, Texas (13-0278-12)
10.0 DEWATERING ...................................................................................................... 20
11.0 CORROSION POTENTIAL ................................................................................... 21
12.0 PAVEMENTS ........................................................................................................ 22
12.1 General ......................................................................................................... 22
12.2 Behavior Characteristics of Expansive Soils Beneath Pavement ................. 22
12.3 Subgrade Strength Characteristics ............................................................... 23
12.4 Flexible Pavement Design and Recommendations ...................................... 23
12.4.1 Full Depth HMAC ................................................................................. 23
12.4.2 Soil Preparation for Flexible Pavements – Lime Treatment ................. 23
12.4.3 Aggregate Base ................................................................................... 25
12.5 All-weather Roads and Parking .................................................................... 26
12.6 Non-Paved Areas .......................................................................................... 26
13.0 GEOLOGIC HAZARDS / SEISMIC CONSIDERATIONS ..................................... 27
14.0 LIMITATIONS ....................................................................................................... 27
APPENDIX A – BORING LOGS AND SUPPORTING DATA APPENDIX B – ROCK CORE PHOTOGRAPHS APPENDIX C – SOIL RESISTIVITY SURVEY REPORT APPENDIX D – CHEMICAL TEST RESULTS APPENDIX E – GENERAL DESCRIPTION OF PROCEDURES
1
GEOTECHNICAL INVESTIGATION DENTON MUNICIPAL ELETRIC
DENTON ENERGY CENTER DENTON, TEXAS
1.0 PROJECT DESCRIPTION
This report presents the results of the geotechnical investigation for the proposed Denton Municipal Electric Denton Energy Center to be constructed just northwest of the existing Denton Municipal Airport in Denton, Texas. The site is addressed at 8201 Jim Christal Road, Denton, Texas. The project originally consisted of a quick start natural gas fired, simple cycle reciprocating internal combustion engine (RICE) driven generating plant with nominal electrical output of 110 megawatts. Since the original investigation, the center has expanded to provide about double the output capacity. Additional investigation was performed as a result. This new information has been incorporated into this report. The engines will be housed in a steel, clear span, moment framed, metal sided building. The building columns and floors are anticipated to be supported on mat foundations. In addition to the engines and housing structure, the project will include the installation of support facilities including fan coolers, steel supported exhaust ducts, steel stacks, steel storage tanks and pumps, and step-up transformers. The anticipated foundation types of the support facilities will include grade supported mat foundations, drilled shaft supported mat foundations, drilled piers and spread footings. We understand that foundation elements are sensitive to post-construction deflection, and all foundations shall be limited to ½ inch differential deflection.
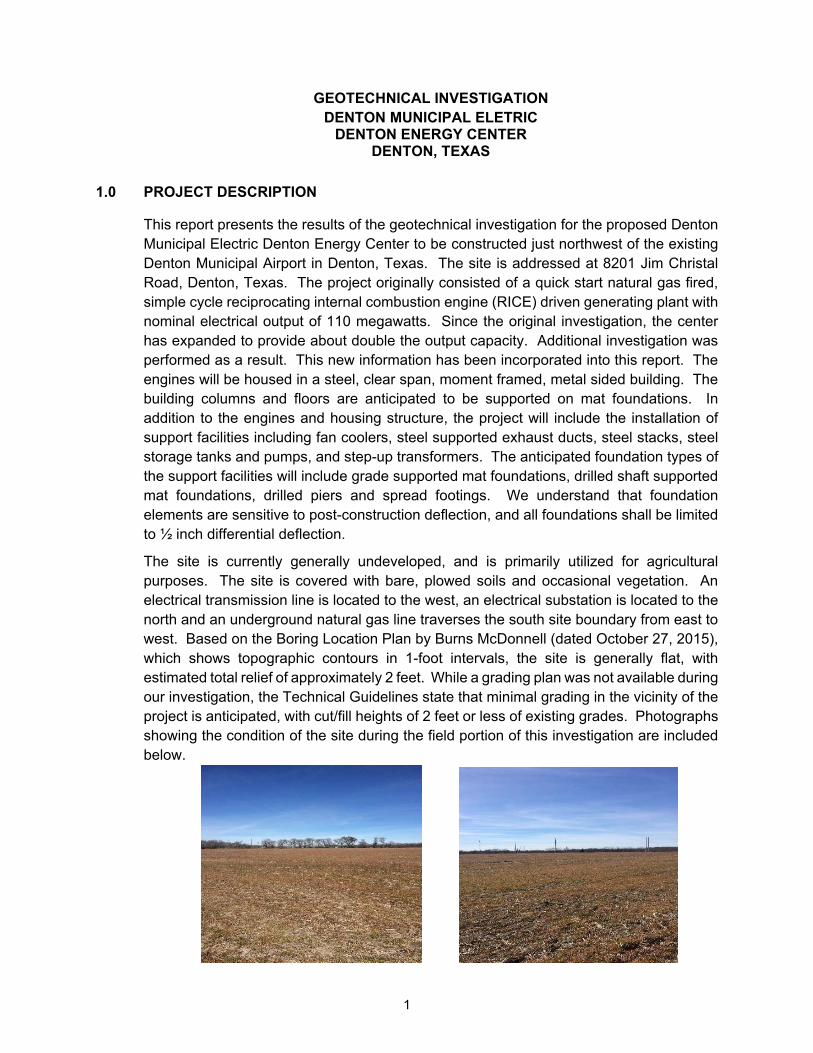
The site is currently generally undeveloped, and is primarily utilized for agricultural purposes. The site is covered with bare, plowed soils and occasional vegetation. An electrical transmission line is located to the west, an electrical substation is located to the north and an underground natural gas line traverses the south site boundary from east to west. Based on the Boring Location Plan by Burns McDonnell (dated October 27, 2015), which shows topographic contours in 1-foot intervals, the site is generally flat, with estimated total relief of approximately 2 feet. While a grading plan was not available during our investigation, the Technical Guidelines state that minimal grading in the vicinity of the project is anticipated, with cut/fill heights of 2 feet or less of existing grades. Photographs showing the condition of the site during the field portion of this investigation are included below.
D&S ENGINEERING LABS, LLC DME Denton Energy Center - Denton, Texas (13-0278-12)
2
2.0 PURPOSE AND SCOPE
The purpose of this investigation was to:
Identify the subsurface soil and bedrock stratigraphy and groundwater conditions across the proposed energy center site.
Evaluate the physical and engineering properties of the subsurface materials present.
Provide geotechnical recommendations for use in design and construction of the energy center facilities, and related site work.
The scope of this investigation included:
Drilling and sampling thirteen (13) borings (B1-1 through B1-13) to depths of about 10 to 50 feet for the original investigation in February and March 2016, and an additional six (6) borings (B1 through B6) to depths of 30 feet in August 2016 for the additional investigation. All boring locations were determined by the design team.
Perform field electrical resistivity survey as described in section 7.0 of the Technical Guidelines.
Laboratory testing of selected soil samples obtained during the investigation.
Preparation of a Geotechnical Report, including:
o A discussion of subsurface soil and groundwater conditions.
o A discussion of the site geology and potential geologic hazards
o Recommendations for the design of energy structure foundations, alternate foundation types, depths and allowable loading, modulus of subgrade reaction, uplift considerations, and Seismic Site Class and spectral acceleration parameters (2012 IBC).
o Estimates of soil movement related to settlement and heave.
o Recommendations for subgrade preparation.
o Recommendations for earthwork, including materials type(s) and backfill requirements.
o Asphalt pavement and gravel pavement recommendations.
o Subsurface soil resistivity data for use in substation grounding grid design.
3.0 FIELD AND LABORATORY INVESTIGATION
3.1 Drilling and Sampling
The borings were advanced utilizing truck-mounted drilling equipment outfitted with continuous flight and hollow-stem augers, as well as wet rotary bedrock coring equipment. The approximate locations of borings explored at the site are shown on the boring location map included in Appendix A.
D&S ENGINEERING LABS, LLC DME Denton Energy Center - Denton, Texas (13-0278-12)
3
Undisturbed samples of cohesive soil and certain weathered shale bedrock strata were obtained using 3-inch diameter tube samplers that were advanced into the soils in one (1) foot increments using the continuous thrust of hydraulic rams on the drilling equipment (ASTM D 1587). Field estimates of soil consistency of each cohesive samples were collected using a hand penetrometer.
Bedrock materials were periodically tested in situ using cone penetration tests to examine the resistance of the bedrock materials to penetration and to augment information developed during coring. In this test a 3-inch diameter steel cone is driven by the energy equivalent of a 170-pound hammer freely falling 24 inches and striking an anvil at the top of the drill string. Depending on the resistance of the materials, either the number of blows of the hammer required to provide 12 inches of penetration (in two increments of 6 inches each), or the inches of penetration of the cone due to 100 blows of the hammer are recorded (in two increments of 50 blows each).
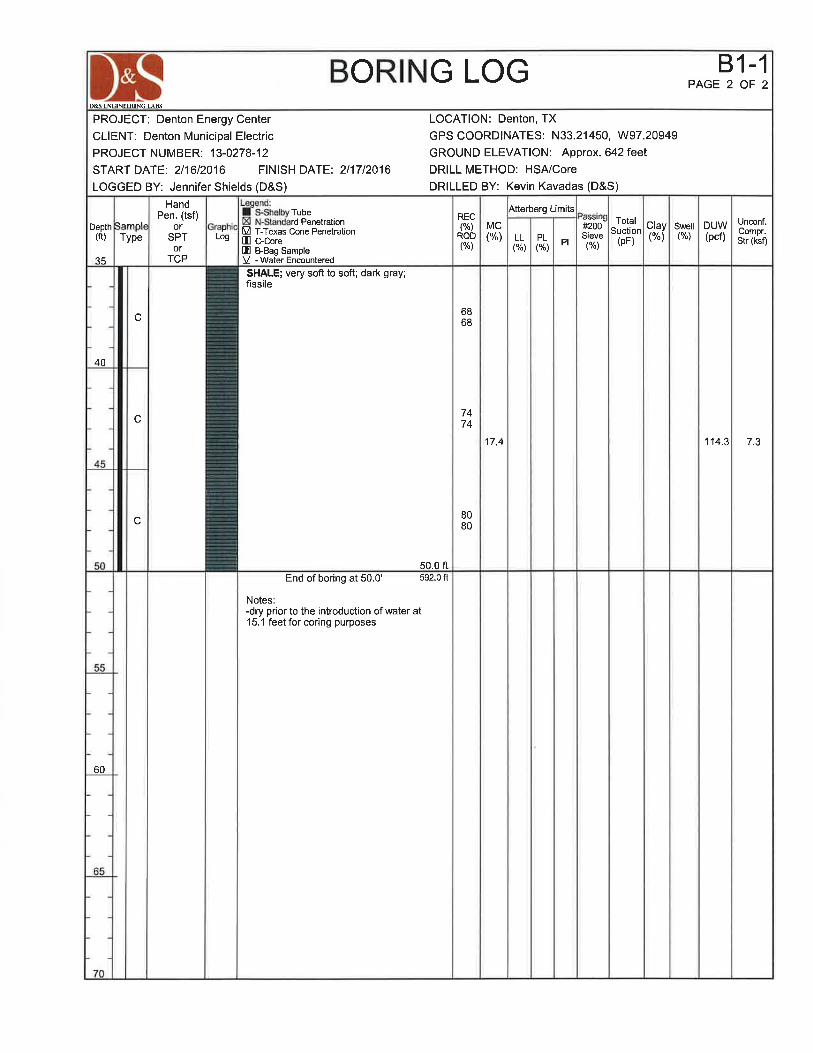
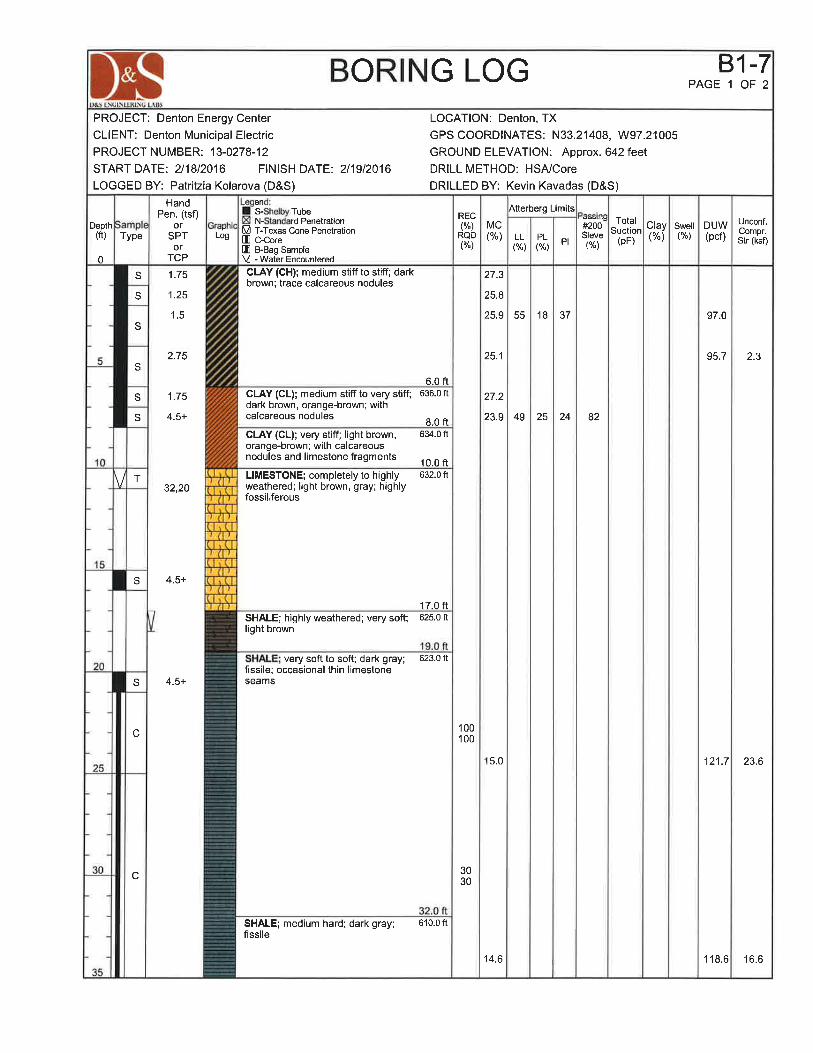
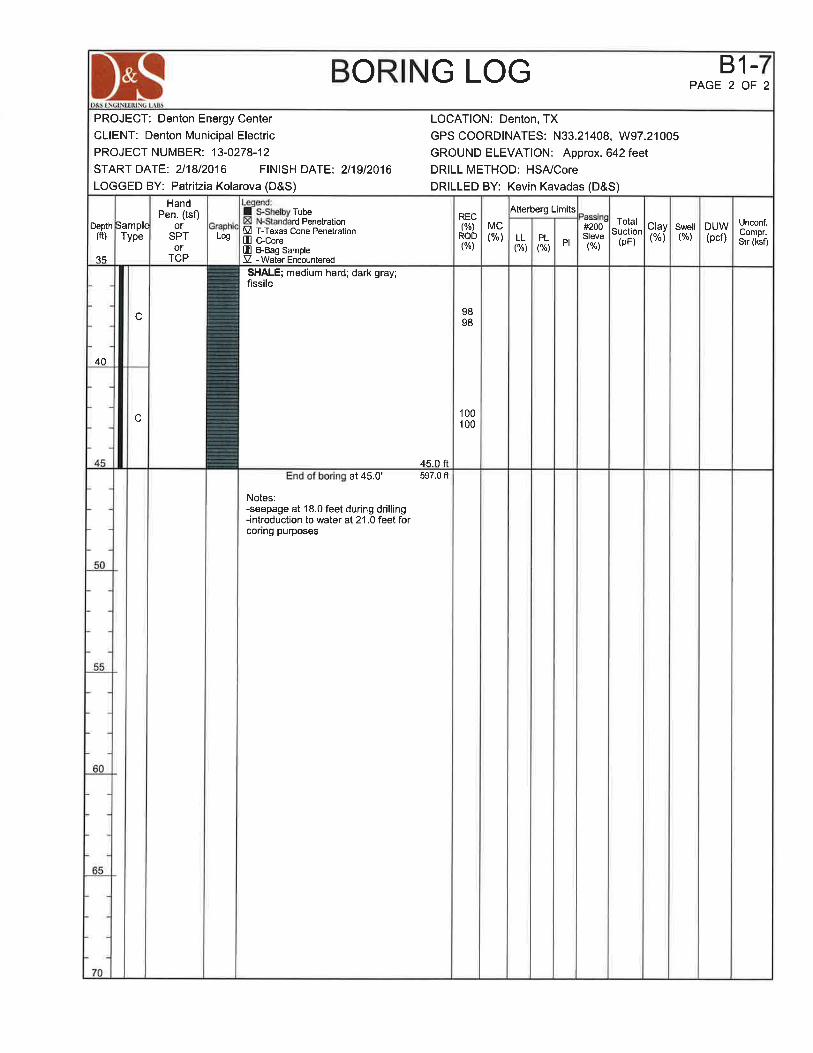
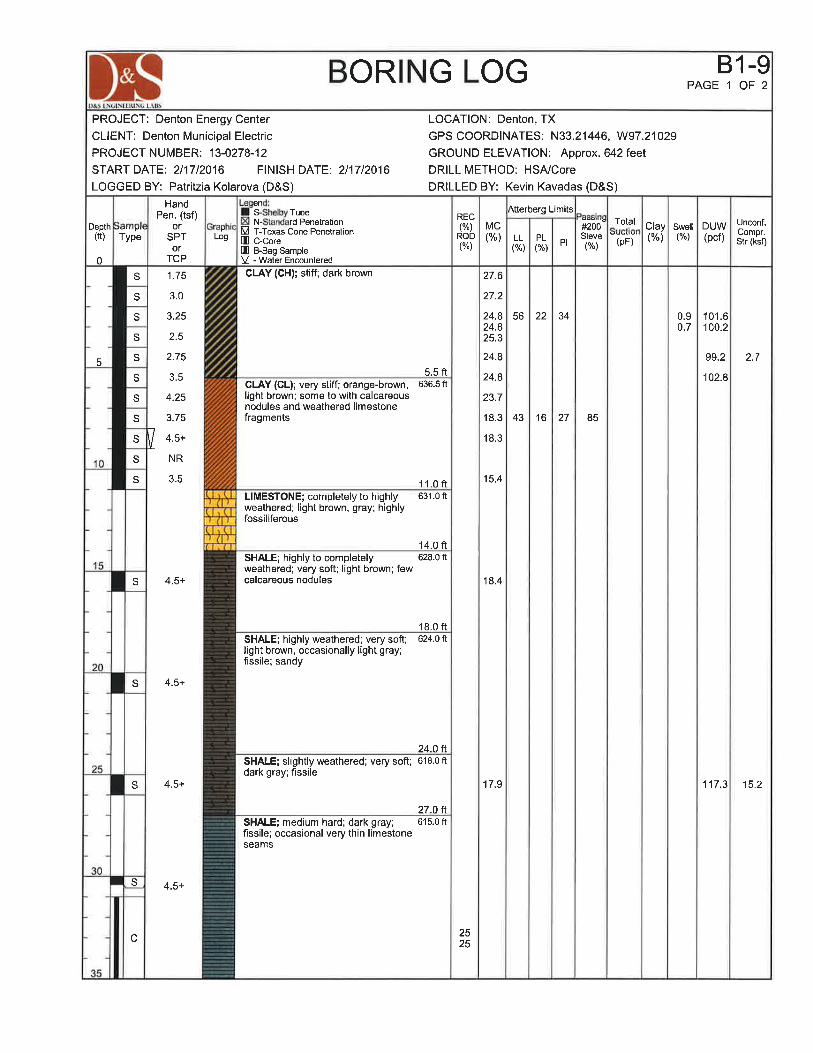
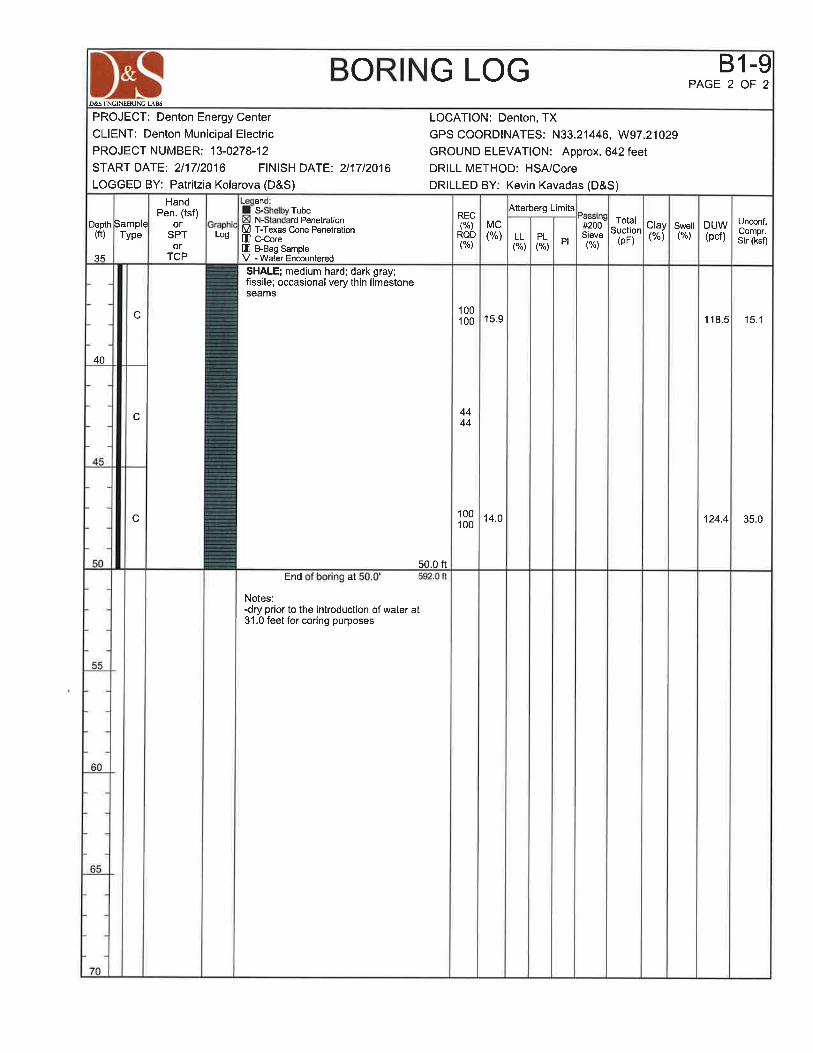
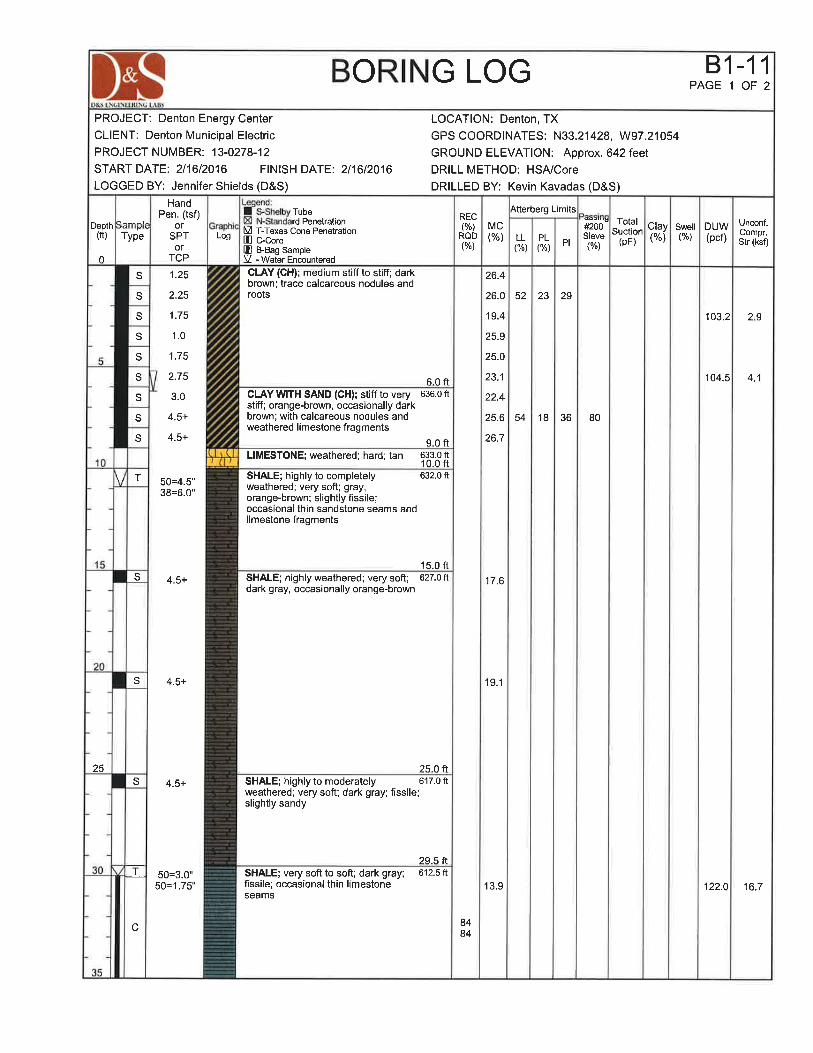
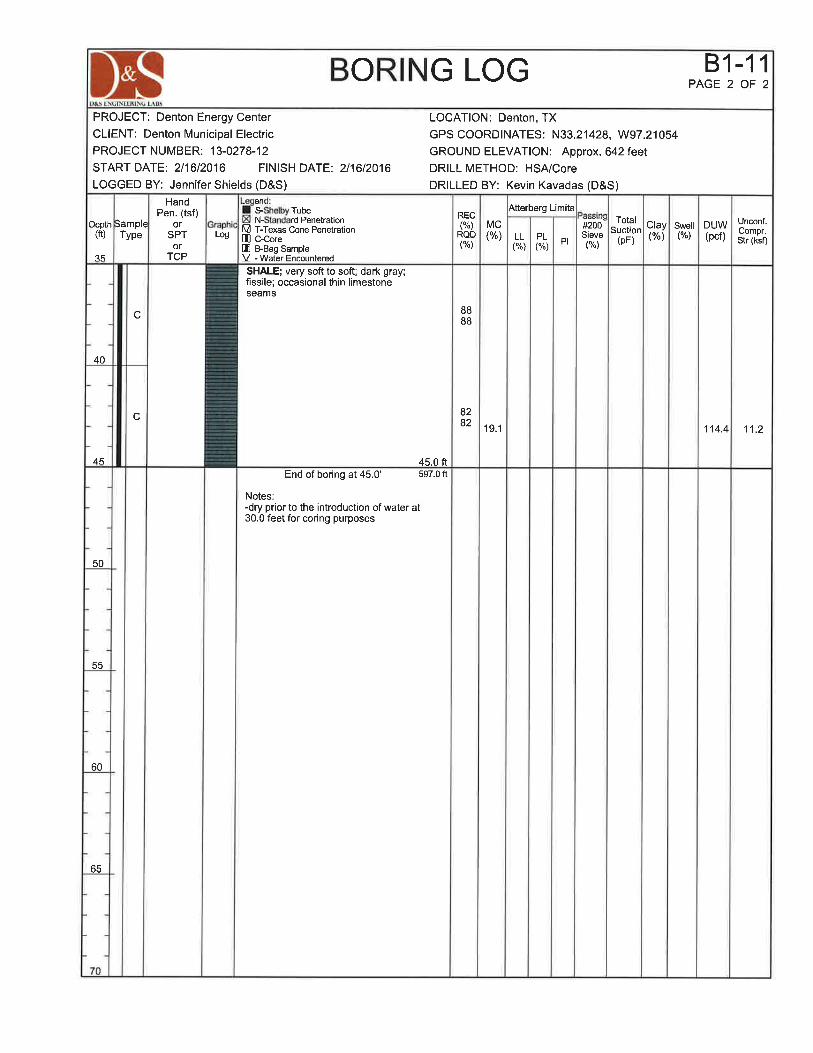
The rock strata present were drilled and sampled using a double-tube core barrel fitted with a tungsten-carbide, sawtooth bit (ASTM D 2113) within Borings B1-1, B1-7, B1-9 and B1-11. The lengths of core recovered (REC), expressed as a percentage of the coring interval, and the Rock Quality Designations (RQD) are tabulated at the appropriate depths on the Log of Boring illustrations. The RQD is the sum of all core pieces longer than four inches divided by the total length of the cored interval. Pieces shorter than four inches which were determined to be broken by drilling or by handling, were fitted together and considered as one intact piece. Color photographs of each complete box of core samples are included in the appendix of this report.
All samples were extruded in the field, described by an engineering geologist, placed in plastic bags to minimize changes in the natural moisture condition, labeled as to appropriate boring number and depth, and placed in protective cardboard boxes for shipment to the laboratory.
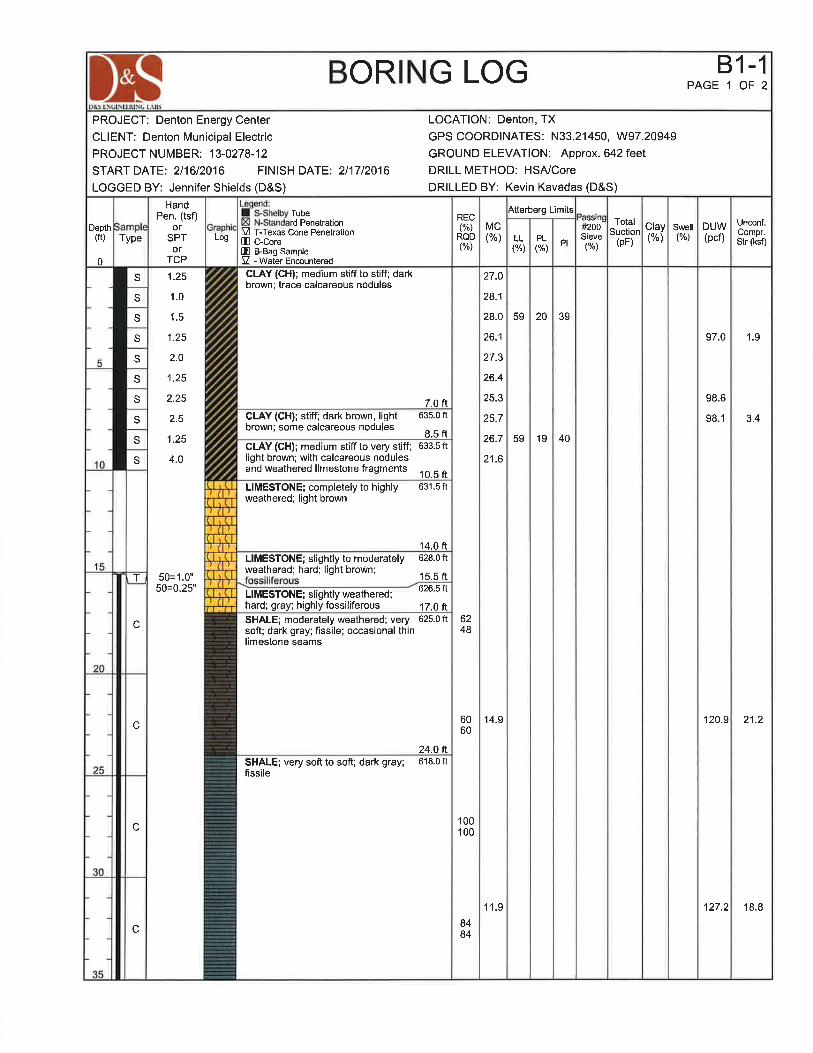
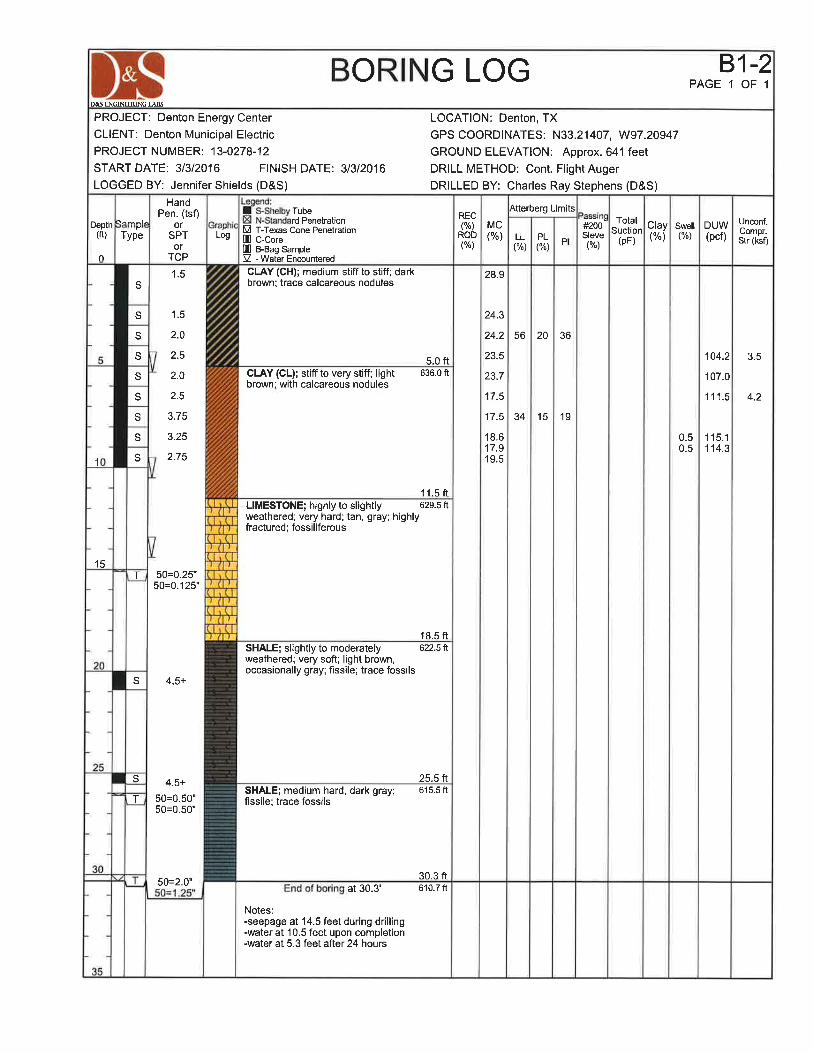
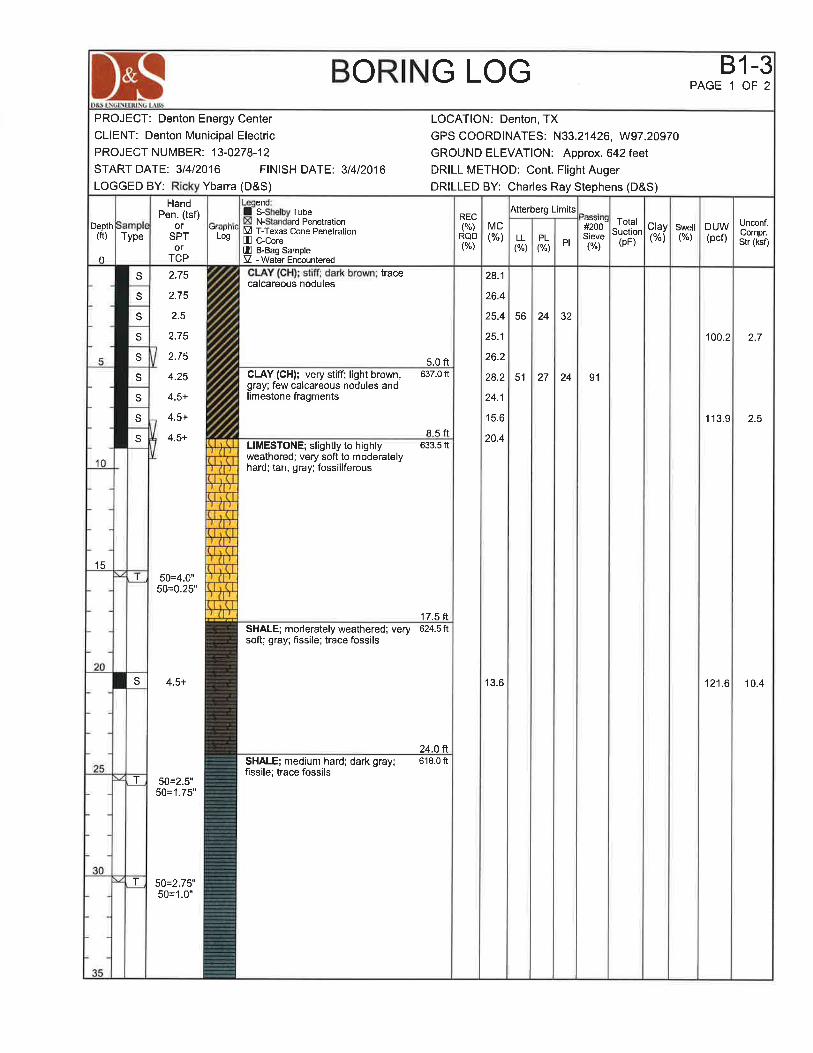
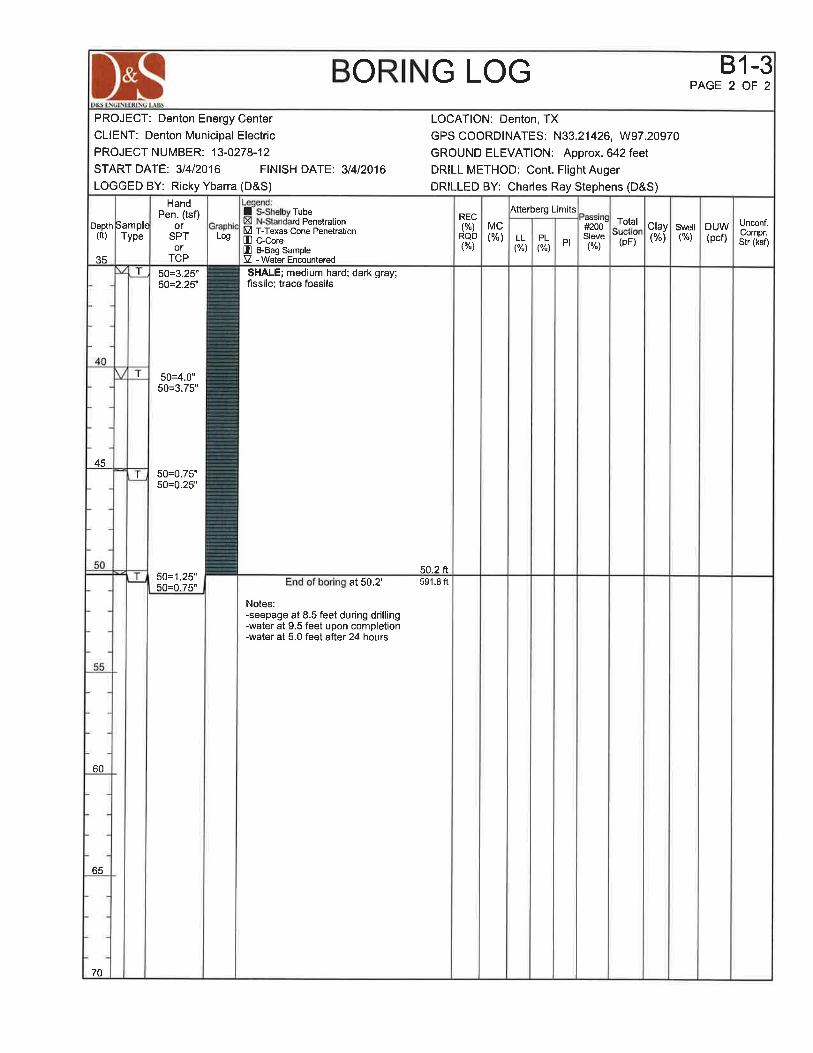
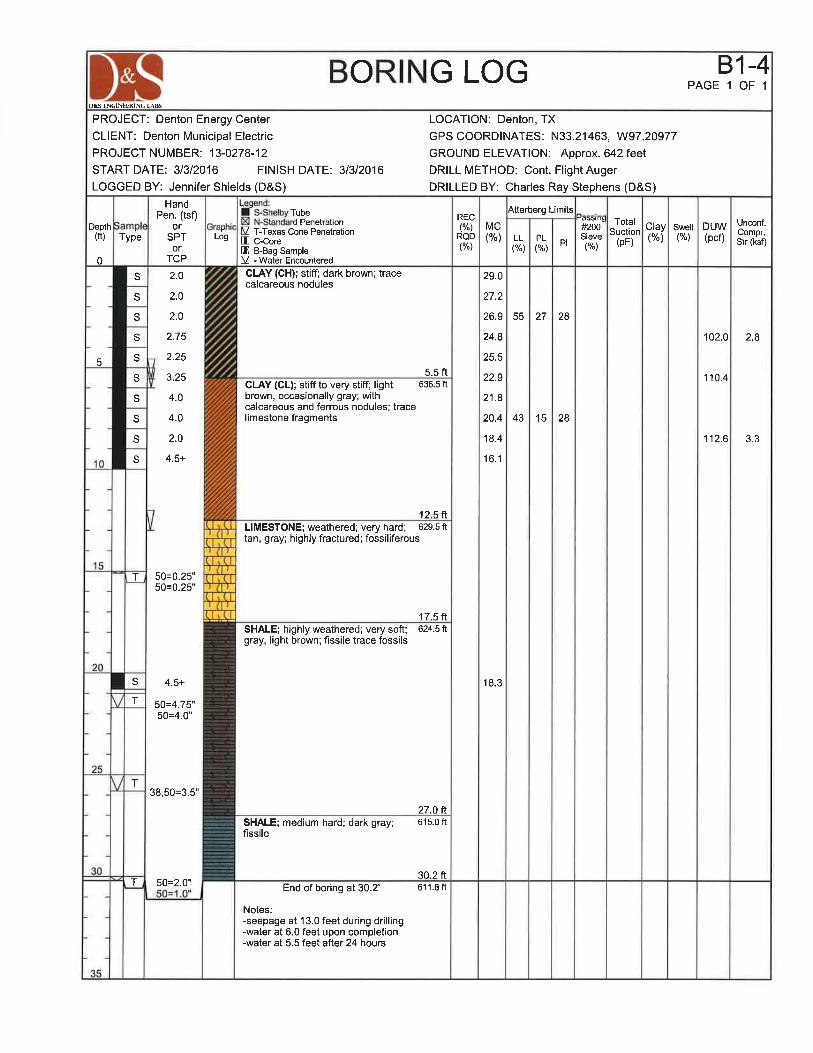
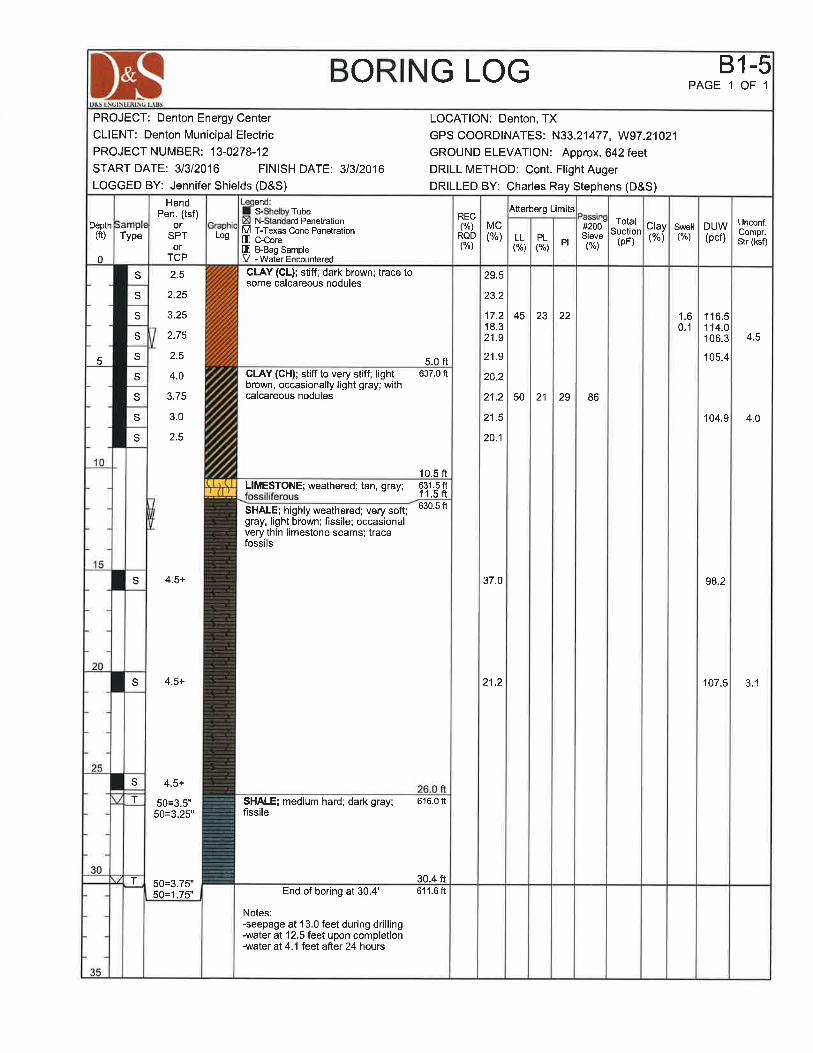
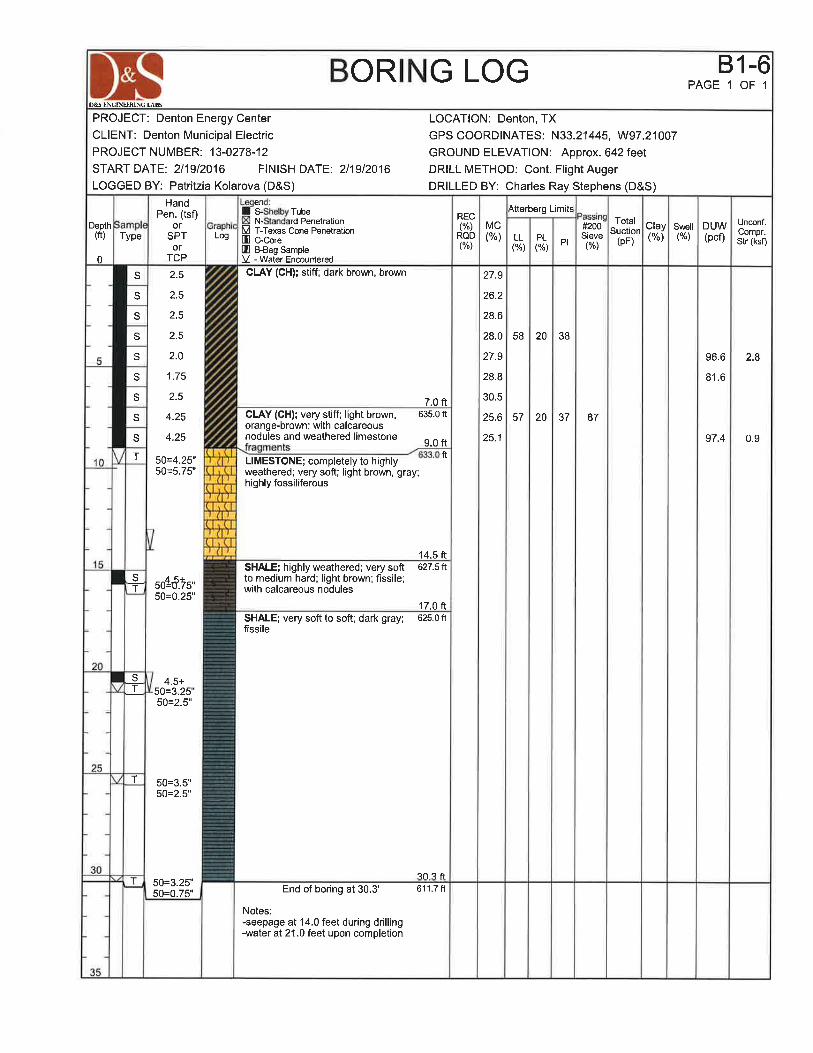
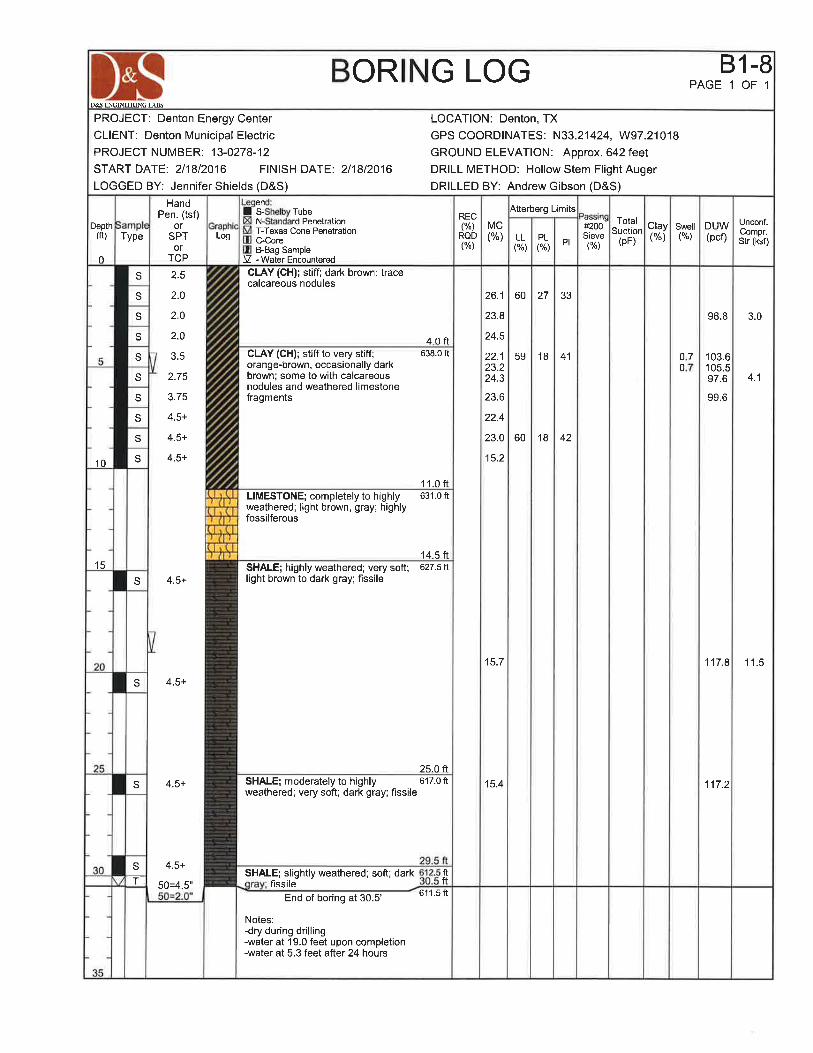
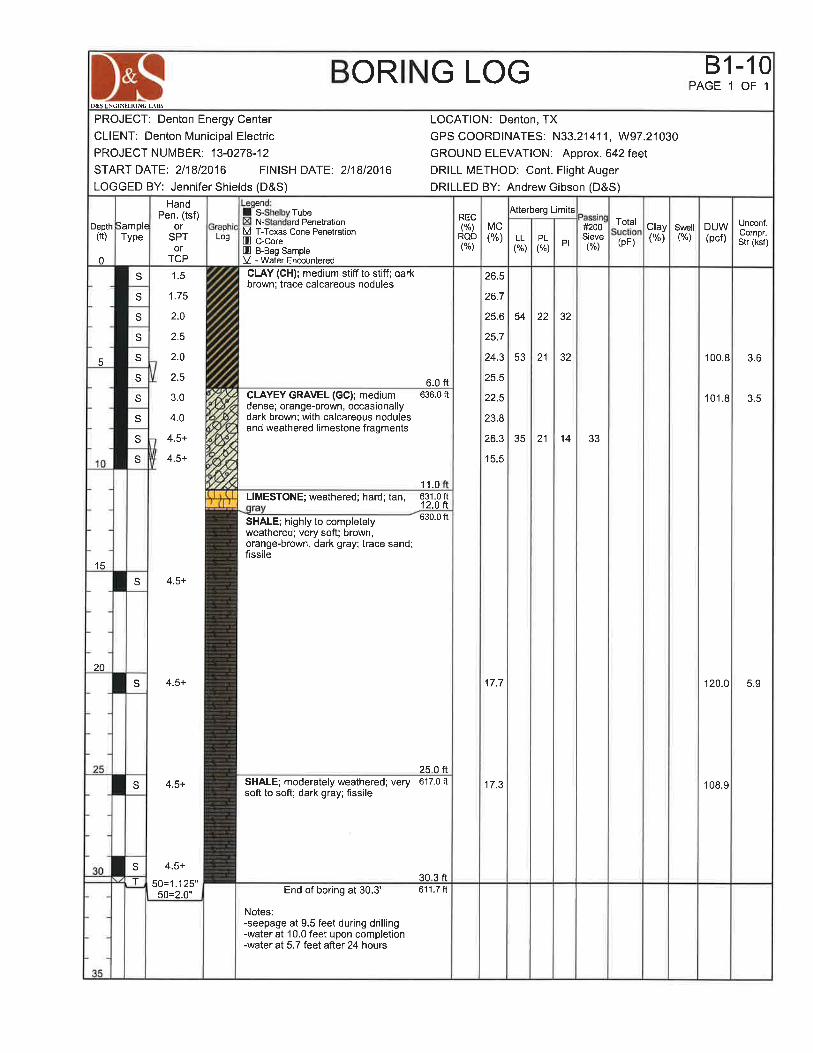
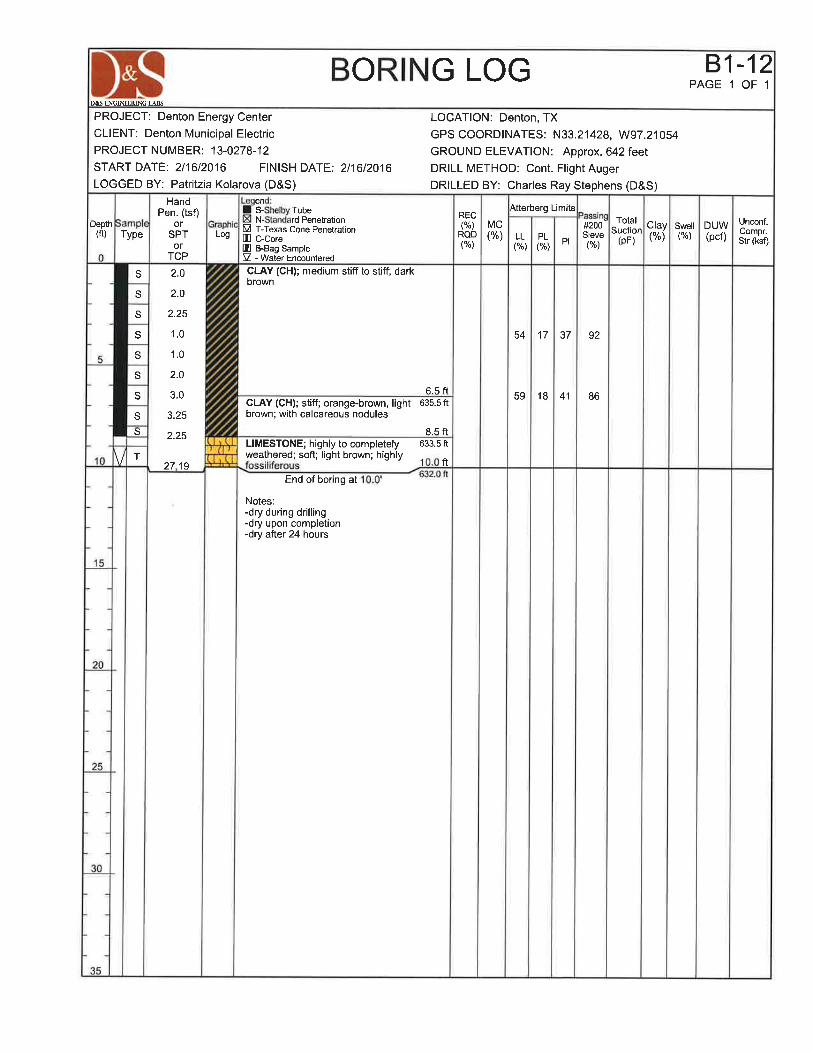
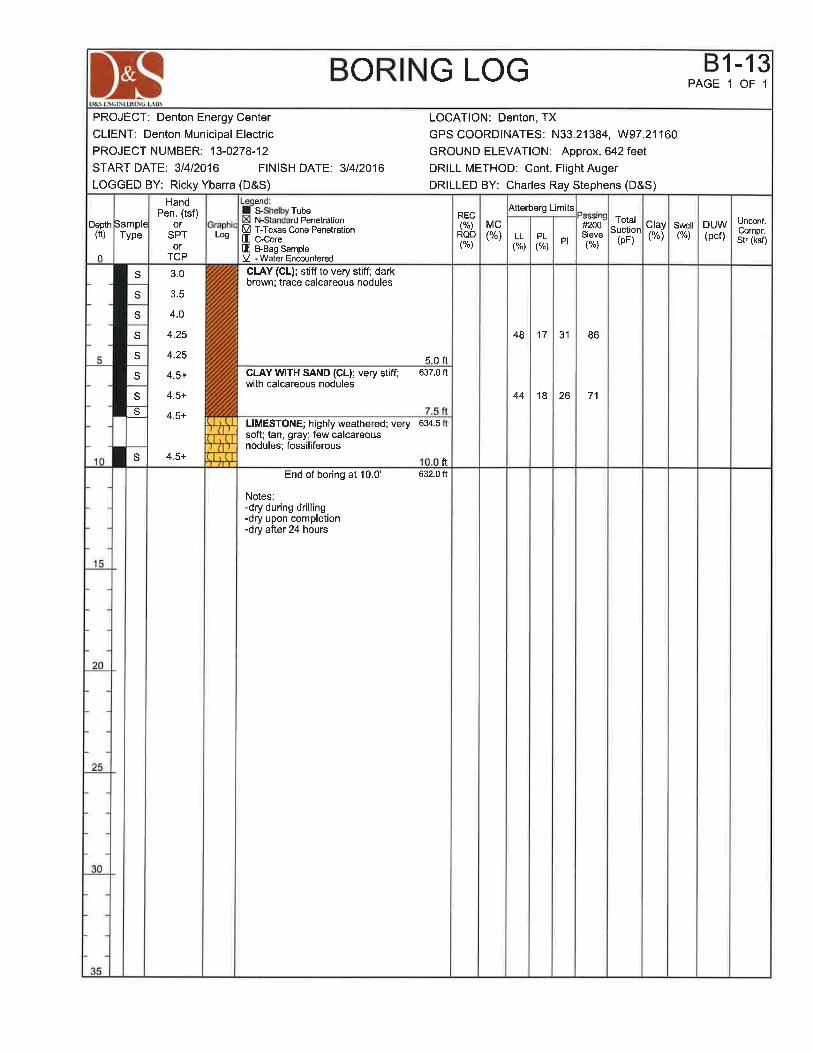
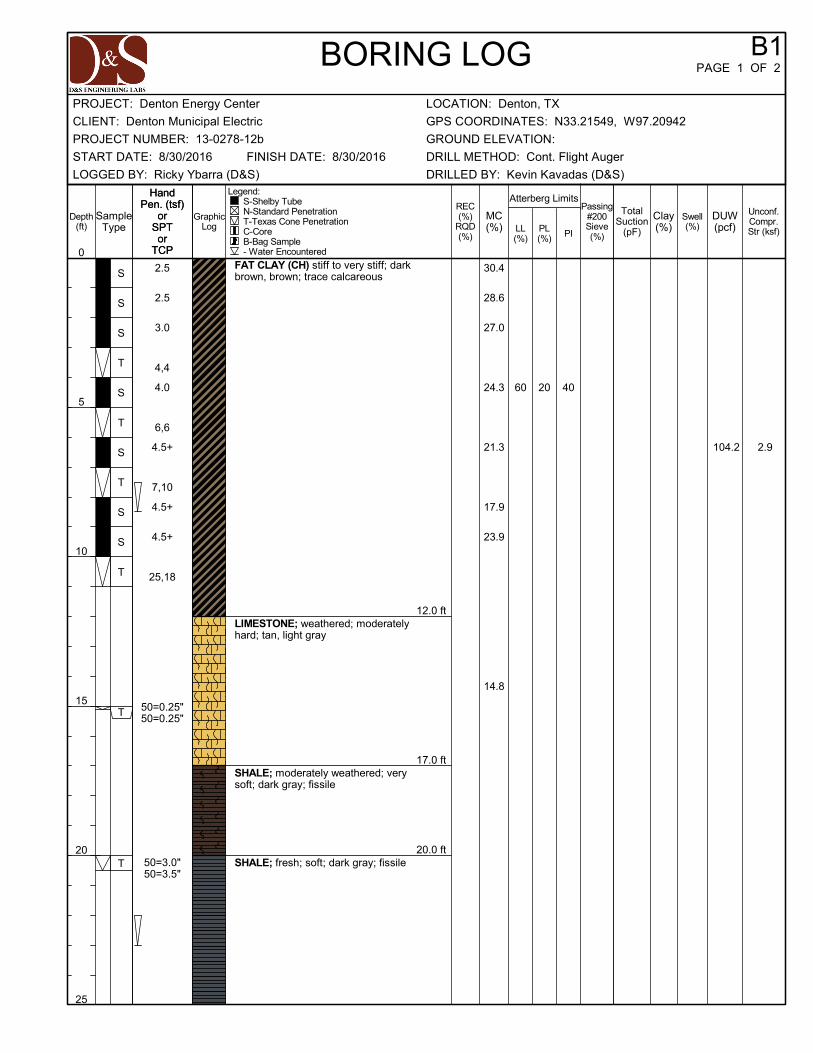
The specific depths, thicknesses and descriptions of the strata encountered are presented on the individual Boring Log illustrations presented in Appendix A. Strata boundaries shown on the boring logs are approximate.
3.1.1 Field Resistivity Surveys
Field resistivity surveys were conducted originating from the Boring B1-6 location and extending along two perpendicular lines, east-west and north-south, for total traverse lengths of 450 feet each, as shown on the Resistivity Plan included in Appendix A. The survey was conducted using the Wenner Four-Electrode Method (IEEE Standard 81, Guide for Measuring Earth Resistivity, Ground Impedance, and Earth Surface Potentials of a Ground System). The depth of investigation is approximately equal to the “A” spacing distance.
In the Wenner configuration, a known current is applied between the outer pins and the resultant electrical potential induced by that applied current is measured between the inner pins. The resistance, in Ohm-cm, is obtained by achieving a “null” reading on the readout box, reading the measured resistance and applying
D&S ENGINEERING LABS, LLC DME Denton Energy Center - Denton, Texas (13-0278-12)
4
a multiplier factor based on the spacing. The “A” spacing is progressively increased until the desired depth of exploration is achieved. For this investigation, “A” spacings ranged from 1 foot to 150 feet along each traverse. Current generation and readings were obtained using an AEMC® Instruments 6471-B multifunction ground resistance soil resistivity tester and a MC Miller B#-A1 multimeter. Results of the surveys are included Appendix A.
3.2 Laboratory Testing
Laboratory tests were performed in order to identify relevant engineering characteristics of the subsurface materials encountered and to provide data for developing engineering design parameters. Descriptions of the subsurface soil and bedrock samples obtained during the field exploration were later refined by a Geotechnical Engineer based on results of the laboratory tests performed.
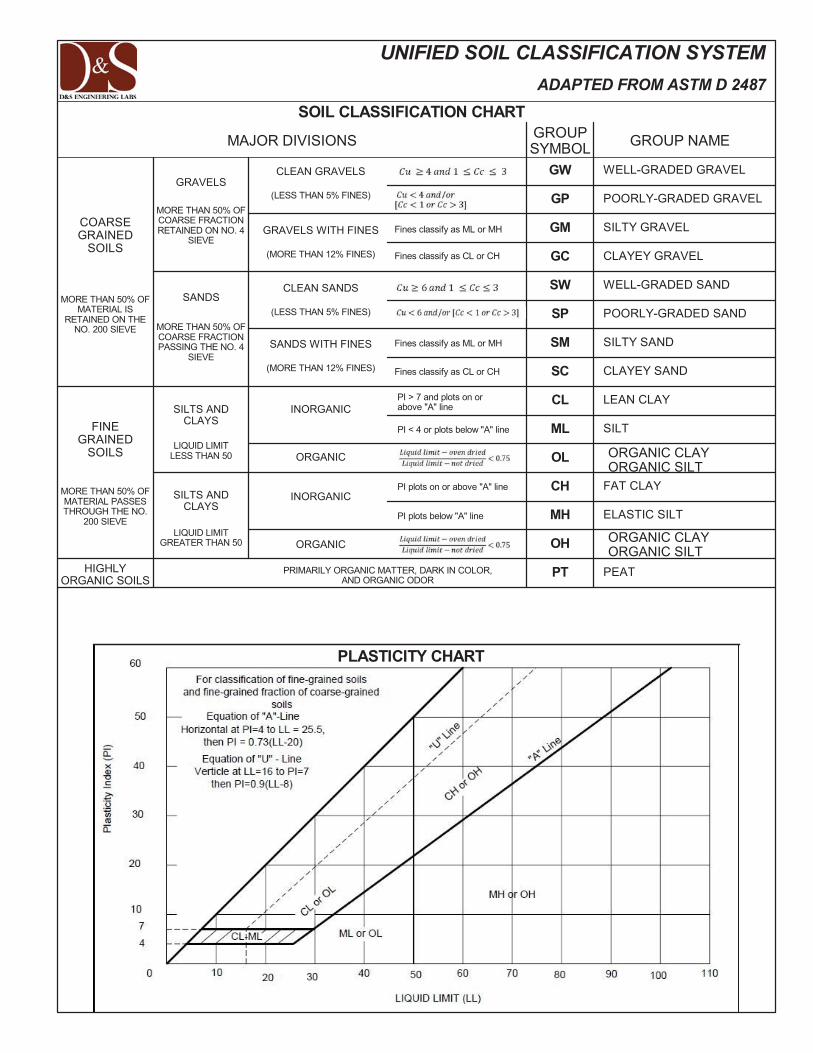
All recovered soil samples were classified and described using procedures in general accordance with ASTM and the Unified Soil Classification System (USCS). Bedrock strata were described using standard geologic nomenclature.
In order to determine soil characteristics and to aid in classifying the soils, index property testing was completed on samples selected by the Geotechnical Engineer. These tests were performed in general accordance with the following test procedures.
Moisture Content ASTM D 2216
Atterberg Limits ASTM D 4318
Particle size analysis ASTM D 422 and D 1140
Additional tests were performed to aid in evaluating soil strength and volume change characteristics, including:
Unconfined Compressive Strength of Cohesive Soil ASTM D 2166
Unconfined Compressive Strength of Rock Cores ASTM D 7012
Unconsolidated-Undrained Triaxial Compression ASTM D 2850
Direct Shear Test Under Consolidated Drained Conditions ASTM D 3080
Compaction Characteristics of Soil ASTM D 698
California Bearing Ratio ASTM D 1883
Absorption Pressure and Swell Tests ASTM D 4546
Soluble Sulfates EPA SW-846 9038
Chloride Ion, Mercuric Nitrate Method NEMI SM4500-CI-B
Redox Potential ASTM G 200
D&S ENGINEERING LABS, LLC DME Denton Energy Center - Denton, Texas (13-0278-12)
5
Sulfides NEMI SM4500-S-F-00
pH EPA SW-846 9045C
Electrical Resistivity NACE
The results of these tests are presented at the corresponding sample depths on the appropriate Boring Log illustrations. The index property tests are described in more detail in Appendix B (General Description of Procedures).
3.2.1 Unconfined Compression Tests
Unconfined compression tests were performed on selected samples of the cohesive soil and weathered bedrock, and on selected sections of the in-tact rock cores of the unweathered bedrock. These tests were performed in general accordance with ASTM D 2166 for tube samples, and ASTM D 7012 for intact rock core specimens. For each unconfined compression test performed, a cylindrical specimen was subjected to an axial load applied at a constant rate of strain until failure or a large strain (greater than 15 percent) occurred.
3.2.2 Overburden Swell Tests
Selected samples of the near-surface cohesive soils were subjected to overburden swell tests. In this test, a sample is placed in a consolidometer and subjected to the estimated overburden pressure. The sample is then inundated with water and allowed to swell. Moisture contents are determined both before and after completion of the test. Test results are recorded as the percent swell, with initial and final moisture content.
3.2.3 California Bearing Ratio (CBR)
These tests were performed in general accordance with ASTM D 1883. The test consists of measuring the pressure required to penetrate a soil sample molded in the laboratory according to ASTM D 698 (Standard Proctor) with a plunger of standard area. The pressure is then recorded and divided over the pressure necessary to obtain equal penetration into a standard crushed rock material.
4.0 SITE CONDITIONS
4.1 Geology
Based upon a review of the Geologic Atlas of Texas, Sherman Sheet, this site located in an area underlain by soil and bedrock strata associated with the undivided Pawpaw Formation, Weno Limestone and Denton Clay with Quaternary surficial deposits overlying the native materials. While shown on the geologic map, Quaternary surficial deposits were not observed within the near surface soil samples in the borings. The subsurface materials are indicated to be lower Weno Limestone and upper Denton Clay strata.
D&S ENGINEERING LABS, LLC DME Denton Energy Center - Denton, Texas (13-0278-12)
6
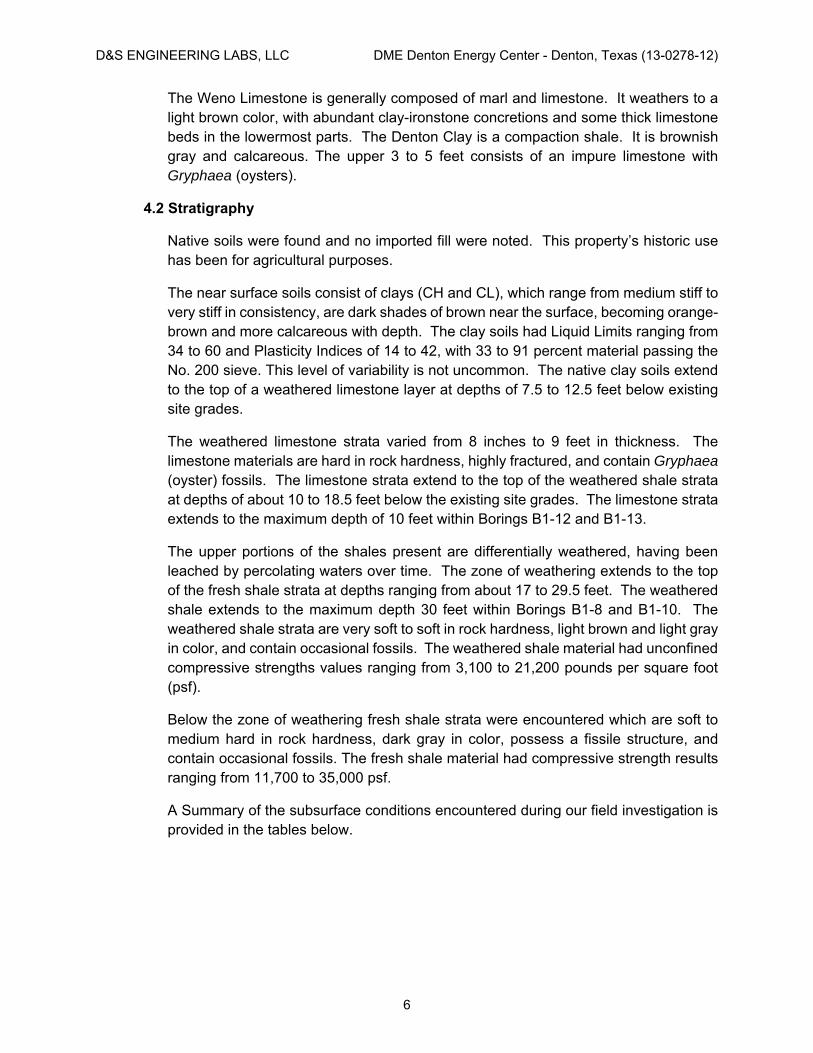
The Weno Limestone is generally composed of marl and limestone. It weathers to a light brown color, with abundant clay-ironstone concretions and some thick limestone beds in the lowermost parts. The Denton Clay is a compaction shale. It is brownish gray and calcareous. The upper 3 to 5 feet consists of an impure limestone with Gryphaea (oysters).
4.2 Stratigraphy
Native soils were found and no imported fill were noted. This property’s historic use has been for agricultural purposes.
The near surface soils consist of clays (CH and CL), which range from medium stiff to very stiff in consistency, are dark shades of brown near the surface, becoming orange-brown and more calcareous with depth. The clay soils had Liquid Limits ranging from 34 to 60 and Plasticity Indices of 14 to 42, with 33 to 91 percent material passing the No. 200 sieve. This level of variability is not uncommon. The native clay soils extend to the top of a weathered limestone layer at depths of 7.5 to 12.5 feet below existing site grades.
The weathered limestone strata varied from 8 inches to 9 feet in thickness. The limestone materials are hard in rock hardness, highly fractured, and contain Gryphaea (oyster) fossils. The limestone strata extend to the top of the weathered shale strata at depths of about 10 to 18.5 feet below the existing site grades. The limestone strata extends to the maximum depth of 10 feet within Borings B1-12 and B1-13.
The upper portions of the shales present are differentially weathered, having been leached by percolating waters over time. The zone of weathering extends to the top of the fresh shale strata at depths ranging from about 17 to 29.5 feet. The weathered shale extends to the maximum depth 30 feet within Borings B1-8 and B1-10. The weathered shale strata are very soft to soft in rock hardness, light brown and light gray in color, and contain occasional fossils. The weathered shale material had unconfined compressive strengths values ranging from 3,100 to 21,200 pounds per square foot (psf).
Below the zone of weathering fresh shale strata were encountered which are soft to medium hard in rock hardness, dark gray in color, possess a fissile structure, and contain occasional fossils. The fresh shale material had compressive strength results ranging from 11,700 to 35,000 psf.
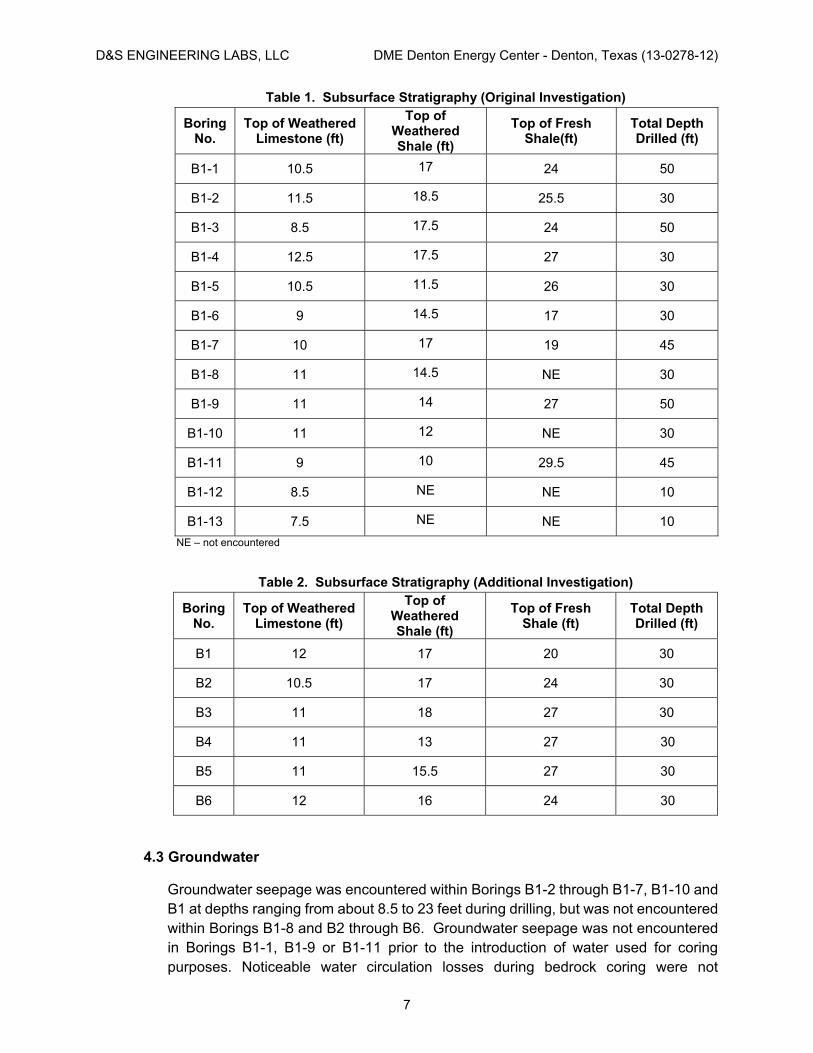
A Summary of the subsurface conditions encountered during our field investigation is provided in the tables below.
D&S ENGINEERING LABS, LLC DME Denton Energy Center - Denton, Texas (13-0278-12)
7
Table 1. Subsurface Stratigraphy (Original Investigation)
Boring No.
Top of Weathered Limestone (ft)
Top of Weathered Shale (ft)
Top of Fresh Shale(ft)
Total Depth Drilled (ft)
B1-1 10.5 17 24 50
B1-2 11.5 18.5 25.5 30
B1-3 8.5 17.5 24 50
B1-4 12.5 17.5 27 30
B1-5 10.5 11.5 26 30
B1-6 9 14.5 17 30
B1-7 10 17 19 45
B1-8 11 14.5 NE 30
B1-9 11 14 27 50
B1-10 11 12 NE 30
B1-11 9 10 29.5 45
B1-12 8.5 NE NE 10
B1-13 7.5 NE NE 10
NE – not encountered
Table 2. Subsurface Stratigraphy (Additional Investigation)
Boring No.
Top of Weathered Limestone (ft)
Top of Weathered Shale (ft)
Top of Fresh Shale (ft)
Total Depth Drilled (ft)
B1 12 17 20 30
B2 10.5 17 24 30
B3 11 18 27 30
B4 11 13 27 30
B5 11 15.5 27 30
B6 12 16 24 30
4.3 Groundwater
Groundwater seepage was encountered within Borings B1-2 through B1-7, B1-10 and B1 at depths ranging from about 8.5 to 23 feet during drilling, but was not encountered within Borings B1-8 and B2 through B6. Groundwater seepage was not encountered in Borings B1-1, B1-9 or B1-11 prior to the introduction of water used for coring purposes. Noticeable water circulation losses during bedrock coring were not
D&S ENGINEERING LABS, LLC DME Denton Energy Center - Denton, Texas (13-0278-12)
8
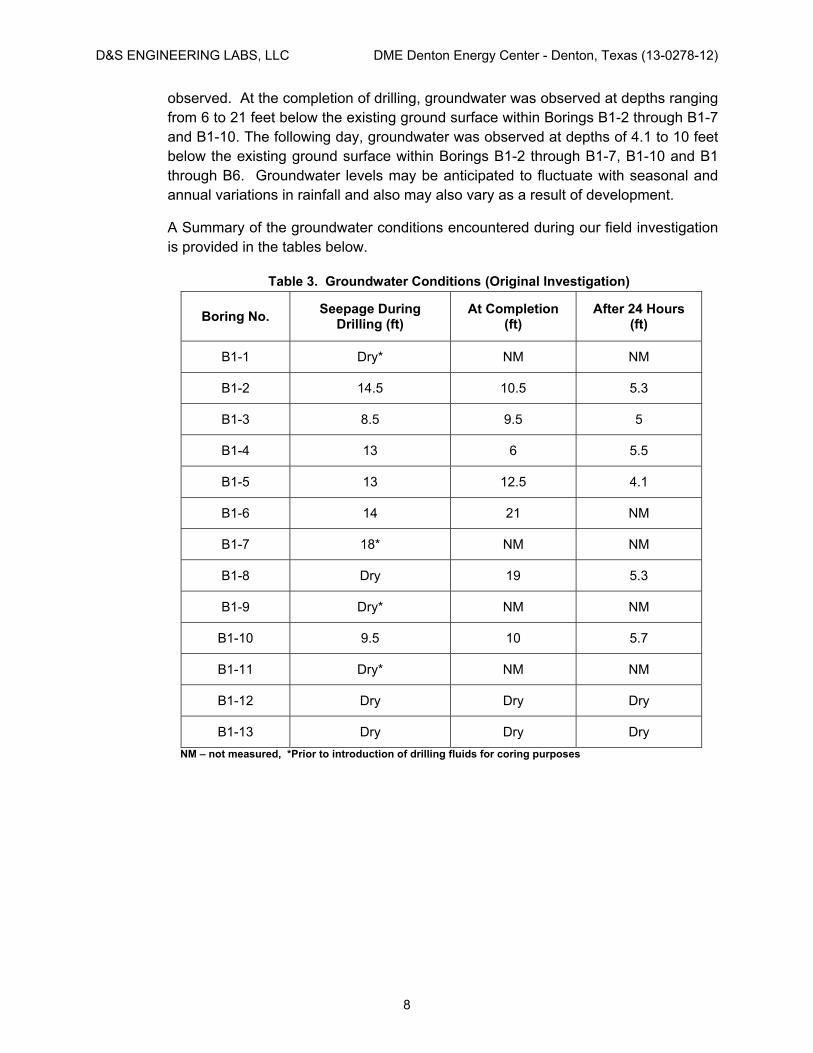
observed. At the completion of drilling, groundwater was observed at depths ranging from 6 to 21 feet below the existing ground surface within Borings B1-2 through B1-7 and B1-10. The following day, groundwater was observed at depths of 4.1 to 10 feet below the existing ground surface within Borings B1-2 through B1-7, B1-10 and B1 through B6. Groundwater levels may be anticipated to fluctuate with seasonal and annual variations in rainfall and also may also vary as a result of development.
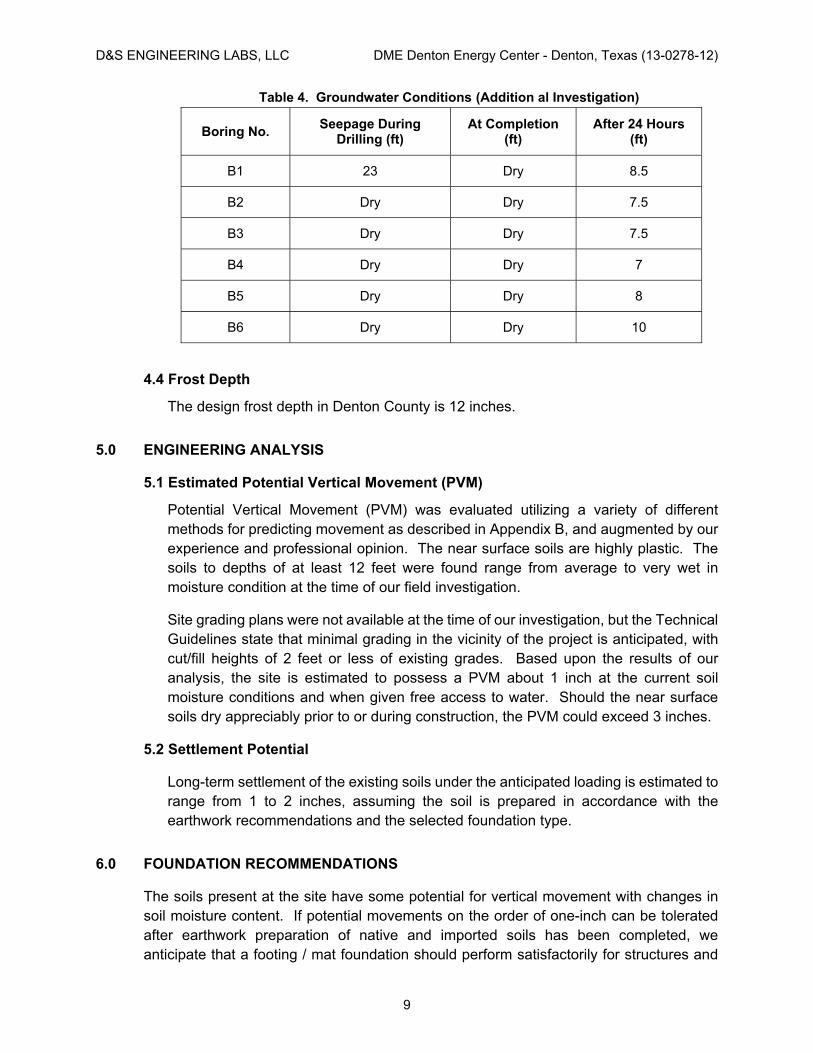
A Summary of the groundwater conditions encountered during our field investigation is provided in the tables below.
Table 3. Groundwater Conditions (Original Investigation)
Boring No. Seepage During
Drilling (ft) At Completion
(ft) After 24 Hours
(ft)
B1-1 Dry* NM NM
B1-2 14.5 10.5 5.3
B1-3 8.5 9.5 5
B1-4 13 6 5.5
B1-5 13 12.5 4.1
B1-6 14 21 NM
B1-7 18* NM NM
B1-8 Dry 19 5.3
B1-9 Dry* NM NM
B1-10 9.5 10 5.7
B1-11 Dry* NM NM
B1-12 Dry Dry Dry
B1-13 Dry Dry Dry
NM – not measured, *Prior to introduction of drilling fluids for coring purposes
D&S ENGINEERING LABS, LLC DME Denton Energy Center - Denton, Texas (13-0278-12)
9
Table 4. Groundwater Conditions (Addition al Investigation)
Boring No. Seepage During
Drilling (ft) At Completion
(ft) After 24 Hours
(ft)
B1 23 Dry 8.5
B2 Dry Dry 7.5
B3 Dry Dry 7.5
B4 Dry Dry 7
B5 Dry Dry 8
B6 Dry Dry 10
4.4 Frost Depth
The design frost depth in Denton County is 12 inches.
5.0 ENGINEERING ANALYSIS
5.1 Estimated Potential Vertical Movement (PVM)
Potential Vertical Movement (PVM) was evaluated utilizing a variety of different methods for predicting movement as described in Appendix B, and augmented by our experience and professional opinion. The near surface soils are highly plastic. The soils to depths of at least 12 feet were found range from average to very wet in moisture condition at the time of our field investigation.
Site grading plans were not available at the time of our investigation, but the Technical Guidelines state that minimal grading in the vicinity of the project is anticipated, with cut/fill heights of 2 feet or less of existing grades. Based upon the results of our analysis, the site is estimated to possess a PVM about 1 inch at the current soil moisture conditions and when given free access to water. Should the near surface soils dry appreciably prior to or during construction, the PVM could exceed 3 inches.
5.2 Settlement Potential
Long-term settlement of the existing soils under the anticipated loading is estimated to range from 1 to 2 inches, assuming the soil is prepared in accordance with the earthwork recommendations and the selected foundation type.
6.0 FOUNDATION RECOMMENDATIONS
The soils present at the site have some potential for vertical movement with changes in soil moisture content. If potential movements on the order of one-inch can be tolerated after earthwork preparation of native and imported soils has been completed, we anticipate that a footing / mat foundation should perform satisfactorily for structures and
D&S ENGINEERING LABS, LLC DME Denton Energy Center - Denton, Texas (13-0278-12)
10
equipment pads. If post-construction vertical movements on the order of those described cannot be tolerated, consideration should be given to a drilled shaft foundation system with structurally-supported floor slabs / equipment pads.
Recommendations for subgrade preparation to reduce potential post-construction movement are described in the Earthwork Section of this report. Note that a soil-supported foundation / floor system may experience some movement with changes in soil moisture content. Non-load bearing walls, partitions, equipment and other elements bearing on the floor slab will reflect these movements should they occur. However, with appropriate design, adherence to good construction practices and appropriate post-construction maintenance, these movements can be minimized and controlled.
6.1 Drilled Shaft Foundations
Drilled straight-sided shaft foundations are currently anticipated for the exhaust stack structure, auxiliary equipment and pipe supports, but are also well-suited for all structures at the site. Consideration was given to underreamed shaft foundations. Due to the generally shallow depth to rock and groundwater conditions observed, we do not recommend the use of underreamed shafts.
6.1.1 Straight-sided Drilled Shafts
We recommend that major structure loads, conduit racks, and other movement sensitive elements, be supported on reinforced concrete, straight-shaft drilled piers bearing in dark gray fresh shale encountered at depths of 17 to 29.5 feet below existing site grades. We recommend those shafts penetrate a minimum of 1 pier diameter into the fresh shale to utilize the full amount of allowable end bearing. Drilled shafts may be designed to transfer imposed loads into the bearing stratum using a combination of end-bearing and skin friction.
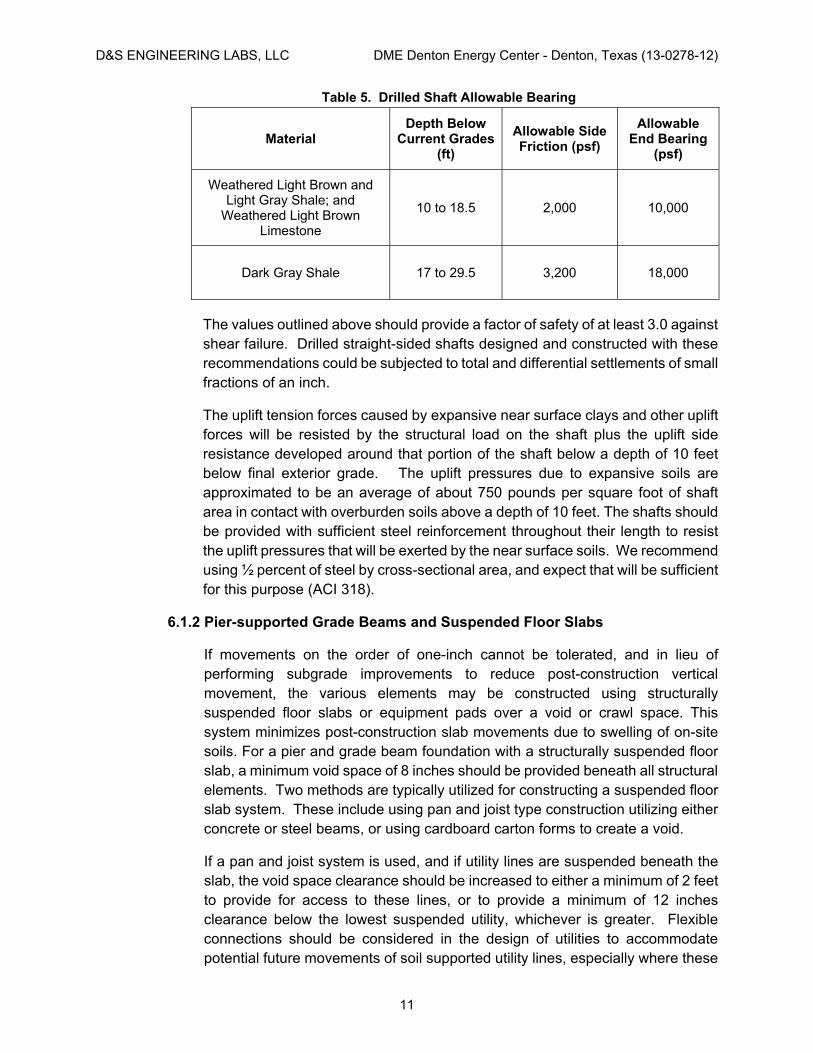
We recommend the piers be a minimum of 18 inches in diameter. Larger diameters may be required to accommodate anchor bolts, embed plates, or other geometric considerations. We recommend using allowable bearing parameters as outlined in Table 3 below. The allowable side frictions noted in Table 3 may be taken from the top each stratum or from the bottom of any temporary casing used, whichever is deeper, to resist both axial loading and uplift. As there is appreciable strain-compatibility between the weathered and the fresh shales, the side friction for both may be included in the shaft design for shafts extending into the fresh dark gray shale. The allowable bearing values are summarized in Table 5 below.
D&S ENGINEERING LABS, LLC DME Denton Energy Center - Denton, Texas (13-0278-12)
11
Table 5. Drilled Shaft Allowable Bearing
Material Depth Below
Current Grades (ft)
Allowable Side Friction (psf)
Allowable End Bearing
(psf)
Weathered Light Brown and Light Gray Shale; and
Weathered Light Brown Limestone
10 to 18.5 2,000 10,000
Dark Gray Shale 17 to 29.5 3,200 18,000
The values outlined above should provide a factor of safety of at least 3.0 against shear failure. Drilled straight-sided shafts designed and constructed with these recommendations could be subjected to total and differential settlements of small fractions of an inch.
The uplift tension forces caused by expansive near surface clays and other uplift forces will be resisted by the structural load on the shaft plus the uplift side resistance developed around that portion of the shaft below a depth of 10 feet below final exterior grade. The uplift pressures due to expansive soils are approximated to be an average of about 750 pounds per square foot of shaft area in contact with overburden soils above a depth of 10 feet. The shafts should be provided with sufficient steel reinforcement throughout their length to resist the uplift pressures that will be exerted by the near surface soils. We recommend using ½ percent of steel by cross-sectional area, and expect that will be sufficient for this purpose (ACI 318).
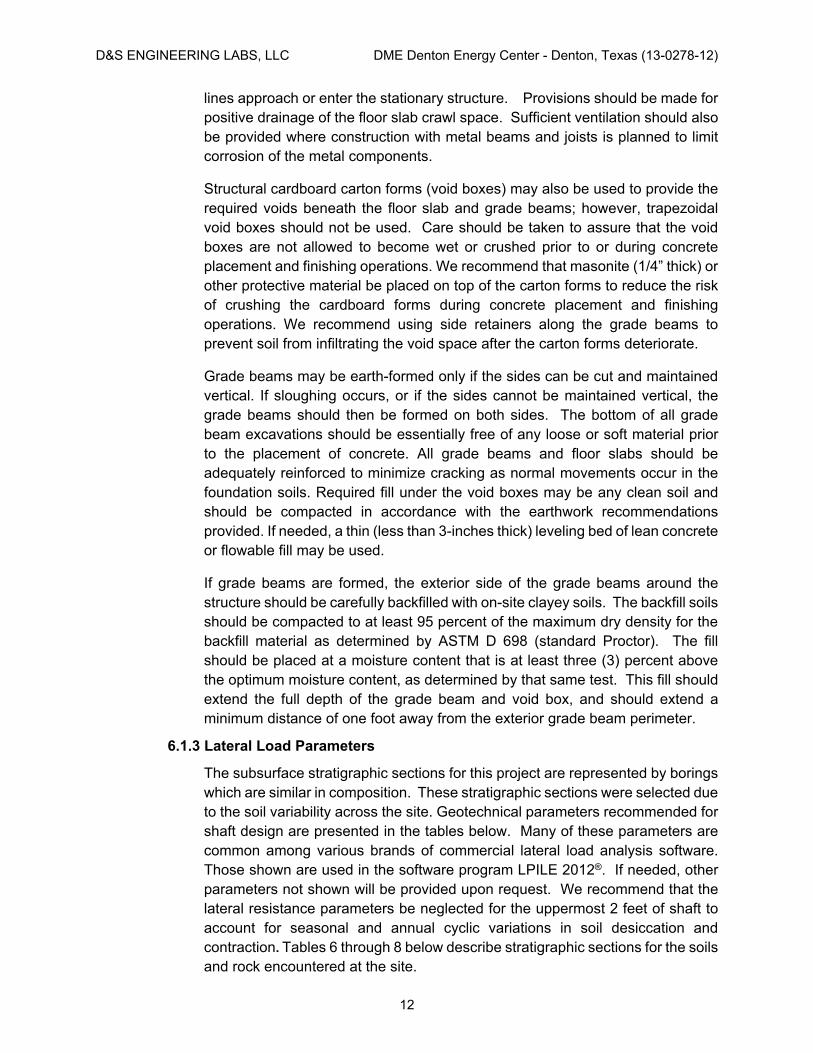
6.1.2 Pier-supported Grade Beams and Suspended Floor Slabs
If movements on the order of one-inch cannot be tolerated, and in lieu of performing subgrade improvements to reduce post-construction vertical movement, the various elements may be constructed using structurally suspended floor slabs or equipment pads over a void or crawl space. This system minimizes post-construction slab movements due to swelling of on-site soils. For a pier and grade beam foundation with a structurally suspended floor slab, a minimum void space of 8 inches should be provided beneath all structural elements. Two methods are typically utilized for constructing a suspended floor slab system. These include using pan and joist type construction utilizing either concrete or steel beams, or using cardboard carton forms to create a void.
If a pan and joist system is used, and if utility lines are suspended beneath the slab, the void space clearance should be increased to either a minimum of 2 feet to provide for access to these lines, or to provide a minimum of 12 inches clearance below the lowest suspended utility, whichever is greater. Flexible connections should be considered in the design of utilities to accommodate potential future movements of soil supported utility lines, especially where these
D&S ENGINEERING LABS, LLC DME Denton Energy Center - Denton, Texas (13-0278-12)
12
lines approach or enter the stationary structure. Provisions should be made for positive drainage of the floor slab crawl space. Sufficient ventilation should also be provided where construction with metal beams and joists is planned to limit corrosion of the metal components.
Structural cardboard carton forms (void boxes) may also be used to provide the required voids beneath the floor slab and grade beams; however, trapezoidal void boxes should not be used. Care should be taken to assure that the void boxes are not allowed to become wet or crushed prior to or during concrete placement and finishing operations. We recommend that masonite (1/4” thick) or other protective material be placed on top of the carton forms to reduce the risk of crushing the cardboard forms during concrete placement and finishing operations. We recommend using side retainers along the grade beams to prevent soil from infiltrating the void space after the carton forms deteriorate.
Grade beams may be earth-formed only if the sides can be cut and maintained vertical. If sloughing occurs, or if the sides cannot be maintained vertical, the grade beams should then be formed on both sides. The bottom of all grade beam excavations should be essentially free of any loose or soft material prior to the placement of concrete. All grade beams and floor slabs should be adequately reinforced to minimize cracking as normal movements occur in the foundation soils. Required fill under the void boxes may be any clean soil and should be compacted in accordance with the earthwork recommendations provided. If needed, a thin (less than 3-inches thick) leveling bed of lean concrete or flowable fill may be used.
If grade beams are formed, the exterior side of the grade beams around the structure should be carefully backfilled with on-site clayey soils. The backfill soils should be compacted to at least 95 percent of the maximum dry density for the backfill material as determined by ASTM D 698 (standard Proctor). The fill should be placed at a moisture content that is at least three (3) percent above the optimum moisture content, as determined by that same test. This fill should extend the full depth of the grade beam and void box, and should extend a minimum distance of one foot away from the exterior grade beam perimeter.
6.1.3 Lateral Load Parameters
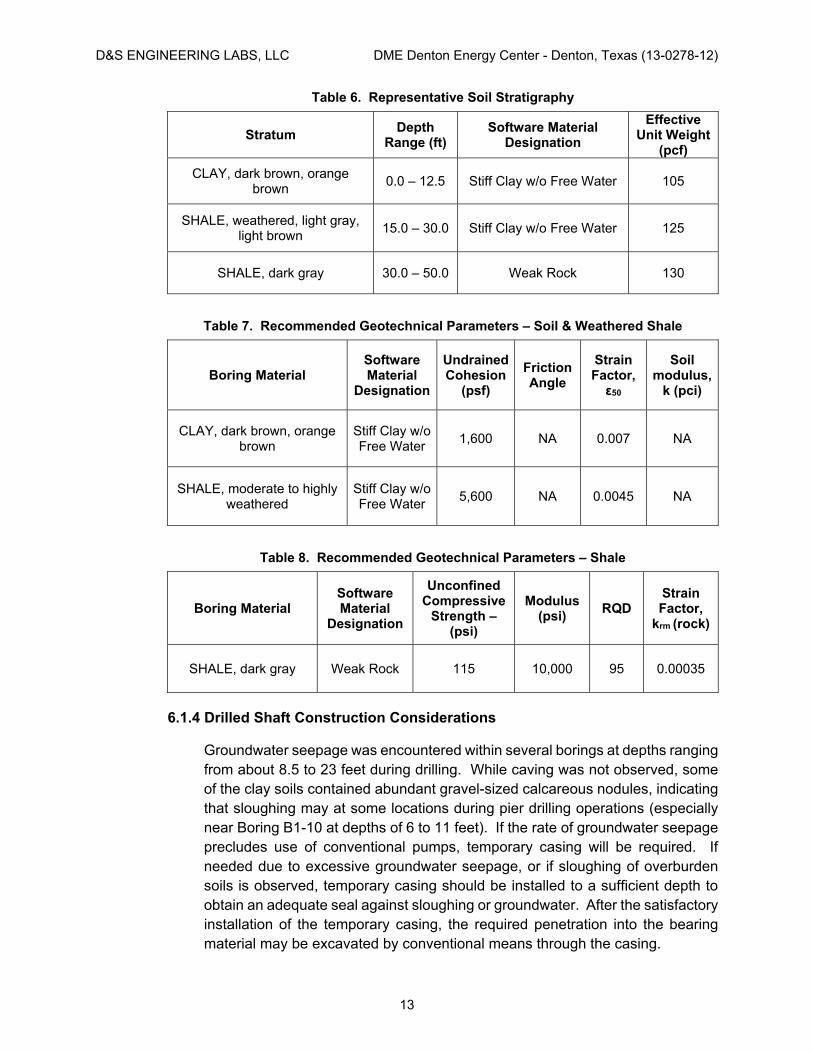
The subsurface stratigraphic sections for this project are represented by borings which are similar in composition. These stratigraphic sections were selected due to the soil variability across the site. Geotechnical parameters recommended for shaft design are presented in the tables below. Many of these parameters are common among various brands of commercial lateral load analysis software. Those shown are used in the software program LPILE 2012®. If needed, other parameters not shown will be provided upon request. We recommend that the lateral resistance parameters be neglected for the uppermost 2 feet of shaft to account for seasonal and annual cyclic variations in soil desiccation and contraction. Tables 6 through 8 below describe stratigraphic sections for the soils and rock encountered at the site.
D&S ENGINEERING LABS, LLC DME Denton Energy Center - Denton, Texas (13-0278-12)
13
Table 6. Representative Soil Stratigraphy
Stratum Depth
Range (ft) Software Material
Designation
Effective Unit Weight
(pcf)
CLAY, dark brown, orange brown
0.0 – 12.5 Stiff Clay w/o Free Water 105
SHALE, weathered, light gray, light brown
15.0 – 30.0 Stiff Clay w/o Free Water 125
SHALE, dark gray 30.0 – 50.0 Weak Rock 130
Table 7. Recommended Geotechnical Parameters – Soil & Weathered Shale
Boring Material Software Material
Designation
Undrained Cohesion
(psf)
Friction Angle
Strain Factor, ε50
Soil modulus,
k (pci)
CLAY, dark brown, orange brown
Stiff Clay w/o Free Water
1,600 NA 0.007 NA
SHALE, moderate to highly weathered
Stiff Clay w/o Free Water
5,600 NA 0.0045 NA
Table 8. Recommended Geotechnical Parameters – Shale
Boring Material Software Material
Designation
Unconfined Compressive
Strength – (psi)
Modulus (psi)
RQD Strain Factor,
krm (rock)
SHALE, dark gray Weak Rock 115 10,000 95 0.00035
6.1.4 Drilled Shaft Construction Considerations
Groundwater seepage was encountered within several borings at depths ranging from about 8.5 to 23 feet during drilling. While caving was not observed, some of the clay soils contained abundant gravel-sized calcareous nodules, indicating that sloughing may at some locations during pier drilling operations (especially near Boring B1-10 at depths of 6 to 11 feet). If the rate of groundwater seepage precludes use of conventional pumps, temporary casing will be required. If needed due to excessive groundwater seepage, or if sloughing of overburden soils is observed, temporary casing should be installed to a sufficient depth to obtain an adequate seal against sloughing or groundwater. After the satisfactory installation of the temporary casing, the required penetration into the bearing material may be excavated by conventional means through the casing.
D&S ENGINEERING LABS, LLC DME Denton Energy Center - Denton, Texas (13-0278-12)
14
The installation of all drilled piers should be observed by experienced geotechnical personnel during construction to verify compliance with design assumptions including: 1) verticality of the shaft excavation, 2) identification of the bearing stratum, 3) minimum pier diameter and depth, 4) correct reinforcement is placed, 5) proper removal of loose spoil, and 6) proper handling of groundwater, if encountered. D&S would be pleased to provide these services in support of this project.
During construction of the drilled shafts, care should be taken to avoid creating an oversized cap ("mushroom") in excess of the shaft diameter, particularly near the ground surface, that could allow expansive soils to heave against. If near surface soils are prone to sloughing and “mushroom” formation, the tops of the shafts should be formed above the depth of sloughing using cardboard or other circular forms equal to the diameter of the shaft.
Concrete used for the shafts should have a slump of 8 inches ± 1. Individual shafts should be excavated in a continuous operation and concrete placed as soon as practical after completion of the drilling. All pier holes should be filled with concrete within 8 hours after completion of drilling. In the event of equipment breakdown, any uncompleted open shaft should be backfilled with soil to be redrilled at a later date. Backfilled shafts that have reached the target depth prior to the delay and then backfilled should be extended a minimum of 2 feet deeper than the original target depth. However, in such cases this office should be notified to evaluate individual situations.
6.2 Shallow Foundations
If limited post-construction slab movements are acceptable, shallow foundations may be suitable for site structures that are less movement-sensitive.
6.2.1 Mat Foundations
Grade supported mat foundations are currently anticipated for the engine hall elements, containment structure, transformers and gas equipment. For structural loads supported on reinforced concrete, monolithic shallow mats, the mats should be founded in properly prepared subgrade soils at a minimum depth of 24 inches below final exterior grades. Mat foundations should be a minimum of 16 inches thick and should be designed using a load-deformation method. The value of the elastic modulus (k) should be taken as 85 pci. This value is based on an assumed plate diameter of 30 inches. With these methods, it is customary to assume an allowable bearing capacity for the iterations. The initial assumption should be that value given for the shallow footings. The standard practice for design of mat foundations uses a total and differential settlement of 2-inches and 0.5-inch, respectively. If designing for less movement, that should be compensated for in the mat design iteration process.
Mat foundations should be formed on all sides. The base of mat excavations should not be left open overnight. Concrete or engineered fill should be placed
D&S ENGINEERING LABS, LLC DME Denton Energy Center - Denton, Texas (13-0278-12)
15
the same day that mats are excavated. In the event that reinforcement and concrete cannot be placed on the day final excavation grades are achieved, the base of the excavation may be deepened slightly and covered by a thin seal slab of lean concrete or flowable fill to protect the integrity of the foundation bearing material. The bottom of all mat excavations should be free of any loose or soft material prior to the placement of concrete. All equipment pads should be adequately reinforced to minimize cracking as noted movements may occur in the foundation soils. We recommend that a representative of D&S observe all mat excavations prior to placing concrete to verify the excavation depth, cleanliness, and integrity of the mat bearing surface. Any mat excavations left open overnight should be observed by D&S prior to placing concrete to evaluate the depth of additional excavation required.
6.2.2 Shallow Footings
Shallow footings are anticipated for the support of the radiator structure, SCR structure and charge air filters. For shallow footing foundations, we recommend that structural loads for these structures be supported on reinforced concrete, monolithic shallow isolated spread or continuous footings that are founded at a minimum depth of 24 inches below the final exterior grade. The continuous footings should be a minimum of 12 inches in width, whereas isolated footings should be a minimum of 24 inches in width. The footings may be designed using a net allowable bearing capacity 3,400 pounds per square foot when placed on prepared subgrade as described in the Earthwork section of this report. We recommend that shallow foundations be a minimum of 16 inches thick. The friction coefficient against sliding should be taken as 0.36 for concrete cast against natural or compacted soils. The values outlined above should provide a factor of safety of at least 3.0 against shear failure. We anticipate that the total and differential settlements will be on the order of 1-inch and 0.5-inch, respectively.
Footings should be formed on all sides. The base of footing excavations should not be left open overnight. Concrete or engineered fill should be placed the same day that footings are excavated. In the event that reinforcement and concrete cannot be placed on the day final excavation grades are achieved, the base of the excavation may be deepened slightly and covered by a thin seal slab of lean concrete or flowable fill to protect the integrity of the foundation bearing material. The bottom of all footing excavations should be free of any loose or soft material prior to the placement of concrete. All equipment pads should be adequately reinforced to minimize cracking as noted movements may occur in the foundation soils. We recommend that a representative of D&S observe all footing excavations prior to placing concrete to verify the excavation depth, cleanliness, and integrity of the footing bearing surface. Any footing excavations left open overnight should be observed by D&S prior to placing concrete to evaluate the depth of additional excavation required.
D&S ENGINEERING LABS, LLC DME Denton Energy Center - Denton, Texas (13-0278-12)
16
7.0 EARTHWORK RECOMMENDATIONS
In order to reduce Potential Vertical Movements to less than one-inch for soil-supported equipment pads and other elements, we have the following recommendations for subgrade preparation for the energy center.
7.1 Subgrade Modifications
Strip the site of all vegetation and remove any remaining organic or deleterious material, including all tree stumps and root balls of existing trees under areas that will be covered with structures and pavements.
After stripping the site, perform any required cuts.
After excavating, and prior to the placement of any grade-raise fill across non-paved areas, scarify, rework, and recompact the upper 12 inches of the exposed subgrade soils. The soils should be compacted to between 93 and 98 percent of the maximum density as determined by ASTM D 698 (Standard Proctor), and to at least plus three (+3) percentage points above its optimum moisture content.
Grade raise fill should be placed in layer-compacted lifts not exceeding 8 inches in compacted thickness. These fills should be compacted to between 93 and 98 percent of the maximum density as determined by ASTM D 698 (Standard Proctor), and to at least plus three (+3) percentage points above its optimum moisture content.
After the overall site has been brought to grade, excavate equipment pad areas to a minimum depth of three (3) feet below the bottom of mat and spread footing foundations. The excavated materials may be stockpiled for possible future reuse. Excavations should extend at least to the exterior mat dimensions and then extend up to the ground surface at a slope no steeper than 1:Horizontal to 1:Vertical.
Place geogrid across bottom and up the sides of the pad excavations to at least the bottom of mat elevation. Geogrid may be either Tensar BX-1100, Tensar Triax 160, or approved equivalent.
Place the stockpiled excavated soil in maximum 8-inch thick compacted lifts. Continue placing the reworked soil to a depth of 2 feet below the bottom of the foundation. The reworked on-site fill should be compacted to between 93 and 98 percent of the maximum density as determined by ASTM D 698 (Standard Proctor), and to at least plus three (+3) percentage points above its optimum moisture content.
On-site soils in the borrow area (near B1-12 and B1-13) may be used for general fill beneath the proposed structures, but may not be used in the select fill zone.
D&S ENGINEERING LABS, LLC DME Denton Energy Center - Denton, Texas (13-0278-12)
17
Place a minimum of 2 feet of select fill below the bottom of the mat footing elevation. Select fill should have a liquid limit less than 35 and a plasticity index between 6 and 18, should be essentially free of organic materials and particles in excess of 4 inches in their maximum direction, and should have not less than 30 percent material passing a No. 200 mesh sieve. The select fill should be placed in maximum 6-inch thick compacted lifts and compacted to at least 95 percent of the maximum Standard Proctor density and within three (-3 to +3) percentage points of its optimum moisture content.
Alternatively, aggregate base meeting the gradation, plasticity, and durability requirements of TxDOT Standard Specification Item 247, Type A or D, Grade 2 or better may be used in lieu of select fill materials. If used, these materials should be placed in maximum 4-inch thick compacted lifts and should be compacted to at least 95 percent of the maximum Standard Proctor density.
Backfill around the equipment pad containment walls above the reworked on-site soil, select fill, or aggregate base pad fill should be clay soils with a Plasticity Index of at least 25.
Backfill should be placed in maximum 8-inch compacted lifts and should be compacted to a minimum of 95 percent of the maximum density as determined by ASTM D 698 (Standard Proctor), and to its optimum moisture content or above.
Each lift of fill or backfill should be tested for moisture content and compaction by a testing laboratory at the rate of 1 test every 3,000 square feet per lift, with a minimum of 3 tests per lift within each pad.
7.2 Utility Lines and Flexible Connections
There is concern regarding the effect of potential vertical movements on buried utilities at transitions from soils, to connections supported by drilled shafts. The buried utilities are reported to range in depth from approximately 2 to 7.5 feet below grades. Flexible connections should be used regardless of the ground penetration. In order to minimize the potential for post-construction vertical movement to 1-inch for buried site utilities, we recommend the following:
Excavate to a minimum depth of 8 feet or to 2 feet below bottom of pipe elevation, whichever is deeper, and stockpile the excavated soils for subsequent trench backfill.
After the excavations has reached target depth, begin backfilling by placing the stockpiled soils in layer-compacted lifts required to bottom of pipe elevation.
D&S ENGINEERING LABS, LLC DME Denton Energy Center - Denton, Texas (13-0278-12)
18
The trench backfill should be placed in compacted lifts not exceeding 8-inches in thickness, and should be compacted to at least 95 percent of the materials maximum dry density as determined by ASTM D698, and at a moisture content that is at least one percent above the material’s optimum moisture content.
7.3 Additional Considerations
In order to minimize the potential for post-construction vertical movement, consideration should be given to the following:
Final subgrade should slope away from the foundations to the maximum degree possible. A minimum of 5 percent in the first 5 feet is recommended.
Water should not be allowed to pond next to foundations or containment walls.
8.0 RETAINING WALLS AND BELOW GRADE WALLS
As outlined in the Technical Guidelines, no significant below grade construction is anticipated, however some short retaining walls may be required to establish required grades. If below grade elements (including utility lines) require excavations extending to depths greater than 4 feet below existing grade, the excavations should conform to applicable OSHA excavation safety requirements. The soils present should be considered as Type C soils for excavation safety purposes.
8.1 Lateral Earth Pressures
Retaining or below grade structures will be subjected to lateral earth pressures and should be designed in consideration of these forces. Earth pressures will be influenced by structural design of the walls, conditions of wall restraint, methods of construction and/or compaction, the strength of the materials being restrained, and drainage conditions.
Active earth pressure is commonly used for design of free-standing cantilever site retaining walls and assumes some small outward rotation of the wall. Passive pressures below the toe of walls may be taken as an equivalent fluid pressure of 200 pounds per square foot (undrained) or 275 pounds per square foot (drained) for that portion of the wall or wall footing below a depth of 2 feet below final exterior grade. The coefficient of friction beneath concrete footings cast on clay soils present may be taken as 0.36. This is an ultimate value. The lateral movement required to develop the passive pressure values above can be taken as 0.02 multiplied by the height of the passive zone. The passive pressure values may only be used if no excavations will be cut along the toe of the retaining walls.
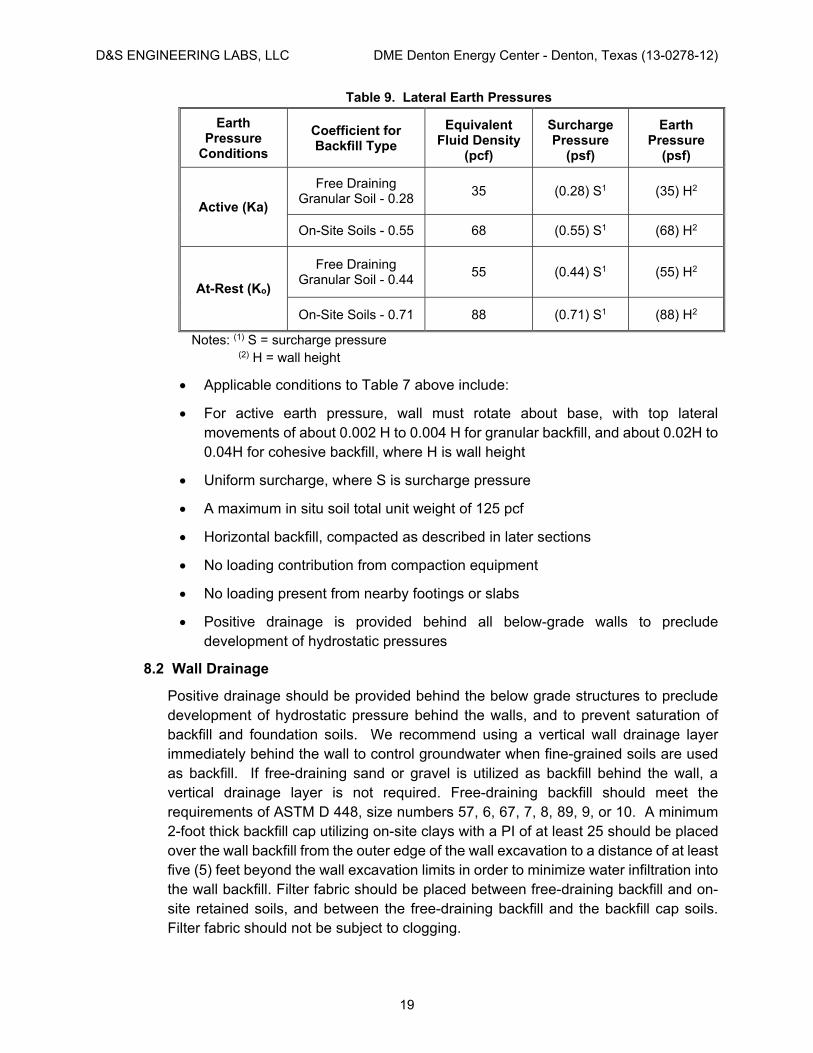
The design lateral earth pressures recommended herein do not include a Factor of Safety and do not provide for hydrostatic or dynamic pressures on the walls. Lateral loads due to surcharge should be calculated as shown in Table 9. These loads need to be considered where appropriate.
D&S ENGINEERING LABS, LLC DME Denton Energy Center - Denton, Texas (13-0278-12)
19
Table 9. Lateral Earth Pressures
Earth Pressure
Conditions
Coefficient for Backfill Type
Equivalent Fluid Density
(pcf)
Surcharge Pressure
(psf)
Earth Pressure
(psf)
Active (Ka)
Free Draining Granular Soil - 0.28
35 (0.28) S1 (35) H2
On-Site Soils - 0.55 68 (0.55) S1 (68) H2
At-Rest (Ko)
Free Draining Granular Soil - 0.44
55 (0.44) S1 (55) H2
On-Site Soils - 0.71 88 (0.71) S1 (88) H2
Notes: (1) S = surcharge pressure (2) H = wall height
Applicable conditions to Table 7 above include:
For active earth pressure, wall must rotate about base, with top lateral movements of about 0.002 H to 0.004 H for granular backfill, and about 0.02H to 0.04H for cohesive backfill, where H is wall height
Uniform surcharge, where S is surcharge pressure
A maximum in situ soil total unit weight of 125 pcf
Horizontal backfill, compacted as described in later sections
No loading contribution from compaction equipment
No loading present from nearby footings or slabs
Positive drainage is provided behind all below-grade walls to preclude development of hydrostatic pressures
8.2 Wall Drainage
Positive drainage should be provided behind the below grade structures to preclude development of hydrostatic pressure behind the walls, and to prevent saturation of backfill and foundation soils. We recommend using a vertical wall drainage layer immediately behind the wall to control groundwater when fine-grained soils are used as backfill. If free-draining sand or gravel is utilized as backfill behind the wall, a vertical drainage layer is not required. Free-draining backfill should meet the requirements of ASTM D 448, size numbers 57, 6, 67, 7, 8, 89, 9, or 10. A minimum 2-foot thick backfill cap utilizing on-site clays with a PI of at least 25 should be placed over the wall backfill from the outer edge of the wall excavation to a distance of at least five (5) feet beyond the wall excavation limits in order to minimize water infiltration into the wall backfill. Filter fabric should be placed between free-draining backfill and on-site retained soils, and between the free-draining backfill and the backfill cap soils. Filter fabric should not be subject to clogging.
D&S ENGINEERING LABS, LLC DME Denton Energy Center - Denton, Texas (13-0278-12)
20
We recommend that a perimeter drain, such as a perforated pipe drain, be installed along the base of the fill to rapidly remove water from behind the retaining wall. The perimeter drain should discharge collected water at least at 5 feet away from any structure foundations. Design of perimeter drainage systems should consider the potential for movement due to expansive soil and should employ flexible pipe, connections, or both.
8.3 Wall Backfill
Free-draining backfill materials should be placed in maximum 1-foot thick loose layers and be consolidated by use of a vibrating plates or sleds, light hand-held compactors, or other appropriate methods to adequately consolidate the backfill. Heavy compactors and grading equipment should not be allowed to operate within 5 feet of the walls during backfilling to avoid developing excessive temporary or long-term lateral soil pressures.
If on-site soils are used as backfill, these materials should be placed in maximum 6-inch compacted lifts and be compacted to between 90 and 93 percent of the maximum dry density as determined by ASTM D 698 and at a moisture content that is at least 3 percentage points above the optimum moisture content as determined by that same test. A qualified geotechnical engineer or geotechnical representative should be present to monitor backfill placement. D&S would be pleased to provide these services in support of this project.
9.0 EXCAVATIONS
Excavations performed during site grading operations should not be difficult and will require the use of normal construction equipment. Drilled shaft excavations also should not be difficult, even when penetrating the bedrock limestone strata. These excavations are typically accomplished with normal pier drilling rigs using single flight augers fitted with “spade–type” teeth.
Excavations greater than 5 feet in height/depth should be in accordance with 29CFR 1926 Subpart P using temporary slopes as described therein or temporary shoring as appropriate.
10.0 DEWATERING
Excavation dewatering may become crucial in deep excavations or after periods of prolonged or heavy precipitation. We anticipate that a combination of sump pits and trenching can adequately control the groundwater within the planned excavations. The soils encountered at the site are susceptible to erosion through groundwater seepage and surface water runoff. Adequate groundwater control and siltation control measures should be maintained throughout the earthwork operations.
D&S ENGINEERING LABS, LLC DME Denton Energy Center - Denton, Texas (13-0278-12)
21
11.0 CORROSION POTENTIAL
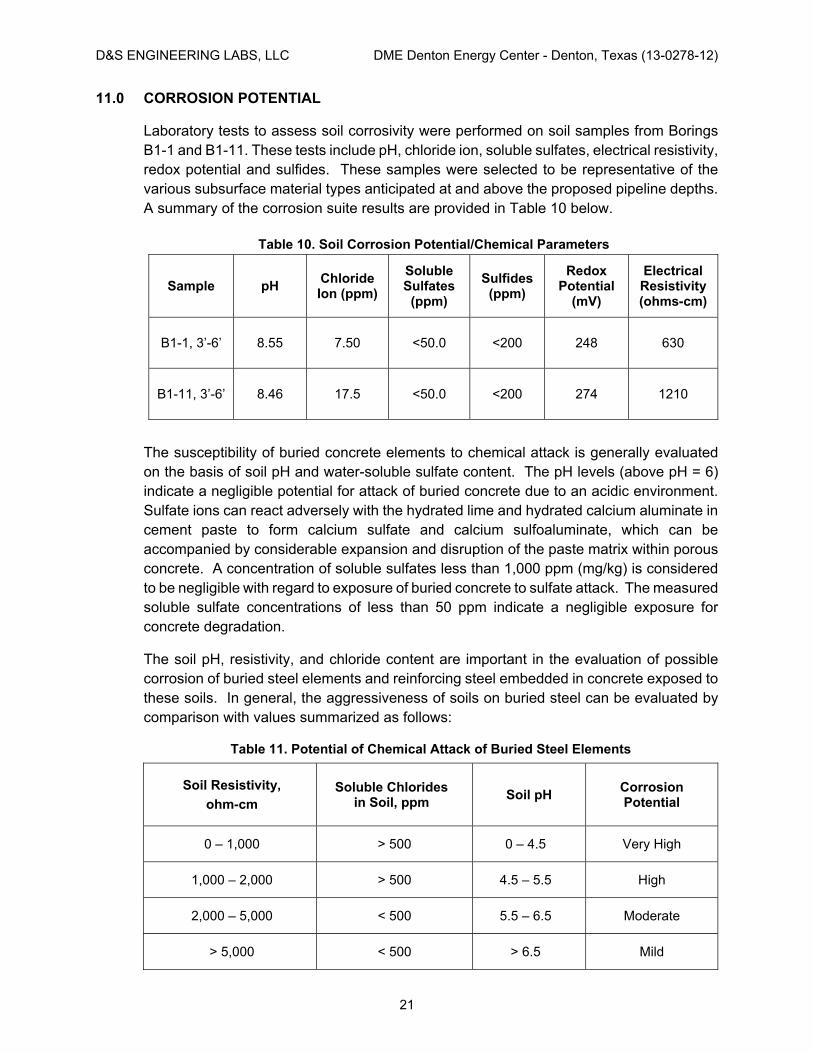
Laboratory tests to assess soil corrosivity were performed on soil samples from Borings B1-1 and B1-11. These tests include pH, chloride ion, soluble sulfates, electrical resistivity, redox potential and sulfides. These samples were selected to be representative of the various subsurface material types anticipated at and above the proposed pipeline depths. A summary of the corrosion suite results are provided in Table 10 below.
Table 10. Soil Corrosion Potential/Chemical Parameters
Sample pH Chloride Ion (ppm)
Soluble Sulfates
(ppm)
Sulfides (ppm)
Redox Potential
(mV)
Electrical Resistivity (ohms-cm)
B1-1, 3’-6’ 8.55 7.50 <50.0 <200 248 630
B1-11, 3’-6’ 8.46 17.5 <50.0 <200 274 1210
The susceptibility of buried concrete elements to chemical attack is generally evaluated on the basis of soil pH and water-soluble sulfate content. The pH levels (above pH = 6) indicate a negligible potential for attack of buried concrete due to an acidic environment. Sulfate ions can react adversely with the hydrated lime and hydrated calcium aluminate in cement paste to form calcium sulfate and calcium sulfoaluminate, which can be accompanied by considerable expansion and disruption of the paste matrix within porous concrete. A concentration of soluble sulfates less than 1,000 ppm (mg/kg) is considered to be negligible with regard to exposure of buried concrete to sulfate attack. The measured soluble sulfate concentrations of less than 50 ppm indicate a negligible exposure for concrete degradation.
The soil pH, resistivity, and chloride content are important in the evaluation of possible corrosion of buried steel elements and reinforcing steel embedded in concrete exposed to these soils. In general, the aggressiveness of soils on buried steel can be evaluated by comparison with values summarized as follows:
Table 11. Potential of Chemical Attack of Buried Steel Elements
Soil Resistivity,
ohm-cm Soluble Chlorides
in Soil, ppm Soil pH
Corrosion Potential
0 – 1,000 > 500 0 – 4.5 Very High
1,000 – 2,000 > 500 4.5 – 5.5 High
2,000 – 5,000 < 500 5.5 – 6.5 Moderate
> 5,000 < 500 > 6.5 Mild
D&S ENGINEERING LABS, LLC DME Denton Energy Center - Denton, Texas (13-0278-12)
22
Each of the columns in this table should be used independently of the others when evaluating corrosion potential. (For example, it is not necessary to have a soil resistivity between 0 and 1,000 ohm-cm and a pH between 0 and 4.5 to indicate a very high potential for corrosion of steel.) The two (2) laboratory soil resistivity test results ranged from 630 to 1,210 ohm-cm. The laboratory test procedures for soil resistivity often yield results representative of soils at a high moisture content with correspondingly lower resistance values. The laboratory resistivity test results indicate a high to very high potential for corrosion of buried steel elements.
In summary, the results of the soil chemistry corrosivity tests obtained to date indicate a low potential for corrosion of buried concrete. However, the results indicate a moderate potential for corrosion of buried steel. Corrosivity tests on additional soil samples could be performed (upon request) for a more comprehensive evaluation of soil corrosion potential.
12.0 PAVEMENTS
We understand that final site work will consist of either asphalt or gravel surfaces. This includes access roads and parking areas in the immediate vicinity of the engine plant and surrounding facilities. Access roads will consist of two 12-feet wide lanes with 3-foot wide shoulders, while the plant loop road will be 20-feet wide.
Considering the existing subsurface conditions, the earthwork recommendations presented previously, and the foregoing discussion, our recommendations for pavements are presented in subsequent paragraphs.
12.1 General
The pavement designs given in this report are based upon the geotechnical information developed during this study and design criteria assumptions based on conversations with Denton Municipal Electric personnel and the design team. The pavement designs shown below were produced considering the pavement design practices for rigid pavements, the guidelines and recommendations of the American Concrete Pavement Association (ACPA) as well as our experience and professional opinion. However, the Civil Engineer-of-Record should produce the final pavement design and all associated specifications for the project.
12.2 Behavior Characteristics of Expansive Soils Beneath Pavement
The near surface soils for this site are somewhat expansive. These soils and have the potential for volume change with changes in soil moisture content. The moisture content can be maintained to some degree in these soils by covering them with an impermeable surface such as pavement areas. However, if moisture is introduced to the subgrade soils by surface or subsurface water, poor drainage, addition of excessive rainfall after periods of no moisture, or removed by desiccation, the soils can swell or shrink significantly, resulting in distress to pavements in contact with the soil in the form of cracks and displacements. The edges of pavements are particularly prone to moisture variations, and these areas often experience the most distress (cracking).
D&S ENGINEERING LABS, LLC DME Denton Energy Center - Denton, Texas (13-0278-12)
23
In order to minimize the negative impacts of expansive soil on pavement areas and improve the long term performance of the pavement, we have the following recommendations:
Provide a crowned or sloped pavement to quickly shed water off the pavement surface.
Provide the maximum practical drainage away from the pavement. A minimum of 5% slope for the first 5 feet is considered ideal.
Avoid long areas of low slope roadway. Adjust slopes to account for the Potential Vertical Movement.
12.3 Subgrade Strength Characteristics
Based on the testing from the investigation and support characteristics after performing the recommended subgrade soil preparation, we recommend using a California Bearing Ratio (CBR) value of 3.5 for the on-site dark brown clay soils and a CBR value of 7.5 for the orange-brown clay soils for the pavement section design. A corresponding resilient modulus of 5,000 psi may be used for the dark brown clays. Should pavement grading reach the orange brown soils, a corresponding subgrade modulus of 10,000 psi may be used. We also recommend a Modulus of Subgrade Reaction (k) of 85 pounds per cubic inch (pci) for the subgrade soils (300 pci if pavement is placed over aggregate base).
As the shear strength of soil is inversely related to the soil moisture content, we recommend using an undrained shear strength of 1,600 psf for reworked soils prepared as recommended herein, and when the site is graded properly to preclude water from ponding at pavement edges.
12.4 Flexible Pavement Design and Recommendations
If utilized for this project, hot mix asphaltic concrete (HMAC) pavement should conform to current TxDOT standards. The following subparagraphs provide recommendations for HMAC. Actual loading conditions may require modifications.
12.4.1 Full Depth HMAC
Full-depth HMAC should consist of at least 2 inches of Type C or D surface course over 4 inches of Type B base course as specified by TxDOT. The full-depth asphalt should be placed over a minimum of 8 inches of lime treated subgrade soil, or 6 inches of aggregate base.
12.4.2 Soil Preparation for Flexible Pavements – Lime Treatment
Strip the site of all vegetation and existing pavement materials to a minimum depth of 6 inches below existing grades and remove any remaining organic or deleterious material under the planned paved areas, including all tree stumps and root balls of existing trees.
D&S ENGINEERING LABS, LLC DME Denton Energy Center - Denton, Texas (13-0278-12)
24
Cut or fill as needed to required pavement subgrade elevation. In areas to receive fill, the fill should be placed in maximum 6-inch compacted lifts, compacted to at least 95 percent of the maximum dry density, as determined by ASTM D 698 (standard Proctor), and placed at a moisture content that is at least two percentage points above the optimum moisture content, as determined by the same test (≥+2%). Fill materials may be derived from on-site or may be imported as long as the materials are essentially free of organic materials and particles in excess of 4 inches their maximum direction. Imported fill material should have no less than 35 percent material passing a No. 200 mesh sieve and a Plasticity Index of no more than 30.
Mix lime slurry into the prepared subgrade soil after scarifying to a depth of at least 6 inches. We estimate that a treated subgrade with a minimum of 6 percent lime by dry weight measure (about 27 pounds of lime per square yard of treated area) will be required. The actual amount of lime should be determined by the testing lab once rough grading is complete. The hydrated lime should be applied only in an area where the initial mixing operations can be completed the same working day. The area of lime treated subgrade should extend a minimum of 18-inches beyond the back of roadway curbs or edges.
The material and hydrated lime should be thoroughly mixed to obtain a homogeneous, friable mixture free of clods or lumps larger than about the size of a golf ball. After initial mixing, roll the mixed material with a suitable type and size of equipment in order to “seal-in” moisture and minimize moisture loss. The rolled subgrade should be left to cure from one to four days. During the curing period, the material should be kept moist. To that end, in no case should the subgrade surface be allowed to dry for more than 12 hours between instances of surface moistening / wetting.
After the curing period, the subgrade should be thoroughly re-mixed to a depth of 6 inches until the following gradational characteristics are achieved (after the removal of non-slaking particles such as limestone, concrete and/or asphalt fragments):
o Minimum passing 1-3/4 inch sieve = 100%
o Minimum passing no. 4 sieve = 60%
After achieving the required gradation, the treated soil-lime mixture should then be immediately compacted to at least 95 percent of the maximum dry density, as determined by ASTM D 698 (standard Proctor), at placed at a moisture content that is at or above the optimum moisture content, as determined by the same test.
D&S ENGINEERING LABS, LLC DME Denton Energy Center - Denton, Texas (13-0278-12)
25
Water should not be allowed to pond on the treated surface. To that end, the lime-treated subgrade surface should be shaped in a way that will allow water to shed from one or more edges of the prepared subgrade.
Field density and moisture content testing should be performed at the rate of one test per 10,000 square feet in pavement areas whose planned use will principally consist of personal vehicles, and one test per 100 linear feet in utility trenches. For fire lanes and areas that will be subjected to heavy vehicular traffic, the rate of testing should be increased to one test performed per 5,000 square feet.
12.4.3 Aggregate Base
As an alternative to lime treatment, aggregate base may be placed over the prepared subgrade in accordance with the following recommendations prior to placing the pavement.
After stripping the site and prior to the placement of aggregate base, the exposed subgrade beneath pavement areas should be scarified and reworked to a depth of 12 inches, moisture added or removed as required, and the subgrade soils recompacted to a minimum of 95 percent of the maximum dry density of the materials obtained in accordance with ASTM D 698 (standard Proctor test) and to at least two percentage points above the material’s optimum moisture content (≥ 2%). The rework should extend to at least 18-inches beyond the outside edges of curbs.
Within 24 hours of subgrade rework, begin fill operations as required to final grade elevation. The fill soil should be placed in maximum 8-inch loose lifts and be compacted to a minimum of 95 percent of the maximum dry density of the materials obtained in accordance with ASTM D 698 (standard Proctor test) and to at least two percentage points above the material’s optimum moisture content (≥ 2%).
After completing the subgrade preparation, place a minimum 4-inch thick layer of aggregate base for parking areas and minimum 6-inch thick layer in drive areas, fire lanes, and areas that will be subjected to occasional truck traffic. The area of aggregate base should extend a minimum of 18-inches beyond the back of roadway curbs or edges of pavement.
D&S ENGINEERING LABS, LLC DME Denton Energy Center - Denton, Texas (13-0278-12)
26
Aggregate base should be TxDOT Type A and meet the gradation, durability and plasticity requirements of TxDOT Item 247 Grade 1. Aggregate base material should be uniformly compacted to a minimum of 95% of the maximum standard Proctor dry density (ASTM D 698) and placed at a moisture content that is sufficient to achieve density.
12.5 All-weather Roads and Parking
For truck and trailer parking, product storage, and others areas that will be constructed as all-weather surfaces, we have the following recommendations:
Prepare the subgrade similar to that described above for lime treatment.
Place a minimum of 10-inches of aggregate base. Aggregate base, should be TxDOT Type A and meeting the gradation, durability and plasticity requirements of TxDOT Item 247 Grade 1. Aggregate base material should be uniformly compacted to a minimum of 95% of the maximum standard Proctor dry density (ASTM D 698) and placed at a moisture content that is sufficient to achieve density.
Place a minimum 2-inch thick surface course of clean durable gravel or crushed stone over the compacted aggregate base surface. Suitable surface course materials may include ASTM C 33 Types 3, 4, 5 or other similar coarse gravel or crushed stone.
Field density and moisture content testing should be performed at the rate of one test per 10,000 square feet in parking areas whose planned use will principally consist of personal vehicles and one test per 100 linear feet in utility trenches. For fire lanes and areas that will be subjected to heavy vehicular traffic, the rate of testing should be increased to one test performed per 5,000 square feet.
12.6 Non-Paved Areas
We understand that non-paved areas within the substation footprint will receive about 12 inches of crushed stone over the prepared subgrade. For these areas, we recommend the following:
After the site has been brought to grade in accordance with the Earthwork Section of this report, place a geotextile “filer fabric” between the subgrade soil and the crushed stone to prevent soil migration into the stone
Place 12 inches of crushed stone around the paved areas as shown on the plans.
Crushed stone should be a clean material conforming to ASTM C 33 with particle sizes meeting materials size No. 57 or larger, or other similar coarse gravel or crushed stone.
D&S ENGINEERING LABS, LLC DME Denton Energy Center - Denton, Texas (13-0278-12)
27
13.0 GEOLOGIC HAZARDS / SEISMIC CONSIDERATIONS
North central Texas is generally regarded as an area of low seismic activity. Based on the data developed, and considering the geologic conditions present, we recommend that IBC Soil Site Class “C” be used at this site. The acceleration values below were interpolated from published U.S. Geological Survey National Seismic Hazard Maps.
Table 12. Seismic Design Parameters
Design Parameters Values
Site Class C
Spectral Acceleration for 0.2 sec Period, Ss (g) 0.111
Spectral Acceleration for 1.0 sec Period, S1 (g) 0.054
Site Coefficient for 0.2 sec Period, Fa 1.2
Site Coefficient for 1.0 sec Period, Fv 1.7
Design Spectral Acceleration for 0.2 sec Period, SDS (g) 0.089
Design Spectral Acceleration for 1.0 sec Period, SD1 (g) 0.061
Expansive soils are the principal geotechnical issue at the site. There does not appear to be a significant hazard from slope instability, liquefaction or subsurface rupture due to faulting or lateral spreading that would occur during earthquake motion. Landslides, dispersive or collapsible soils, tsunamis, seiches inundation, scour and subsidence, are unlikely at the site. Bedrock solutioning is extremely rare in the north central Texas bedrock formations. Based on review of the Federal Emergency Management Agency’s Flood Insurance Rate Map (map no. 48121C0355G, revised April 18, 2011), the site is located within Zone X, which is defined as “areas determined to be outside the 0.2% annual chance flood plain”. The closest creeks are located approximately 1,800 feet northeast and 2,200 feet west of the site, therefore, flooding, inundation and scour should not be a concern.
14.0 LIMITATIONS
The professional geotechnical engineering services performed for this project, the findings obtained, and the recommendations prepared were accomplished in accordance with currently accepted geotechnical engineering principles and practices.
Variations in the subsurface conditions are noted at the specific boring locations for this study. As such, all users of this report should be aware that differences in depths and thicknesses of strata encountered can vary between the boring locations. Statements in the report as to subsurface conditions across the site are extrapolated from the data obtained at specific boring locations. The number and spacing of the exploration borings were chosen to obtain adequate geotechnical information for the design and construction of industrial structure foundations. If there are any conditions differing significantly from
D&S ENGINEERING LABS, LLC DME Denton Energy Center - Denton, Texas (13-0278-12)
28
those described herein, D&S should be notified to re-evaluate the recommendations contained in this report.
Recommendations contained herein are not considered applicable for an indefinite period of time. Our office must be contacted to re-evaluate the contents of this report if construction does not begin within a one year period after completion of this report.
The scope of services provided herein does not include an environmental assessment of the site or investigation for the presence or absence of hazardous materials in the soil, surface water, or groundwater.
All contractors referring to this geotechnical report should draw their own conclusions regarding excavations, construction, etc. for bidding purposes. D&S is not responsible for conclusions, opinions or recommendations made by others based on these data. The report is intended to guide preparation of project specifications and should not be used as a substitute for the project specifications.
Recommendations provided in this report are based on our understanding of information provided by the Client to us regarding the scope of work for this project. If the Client notes any differences, our office should be contacted immediately since this may materially alter the recommendations.

APPENDIX A - BORING LOGS AND SUPPORTING DATA
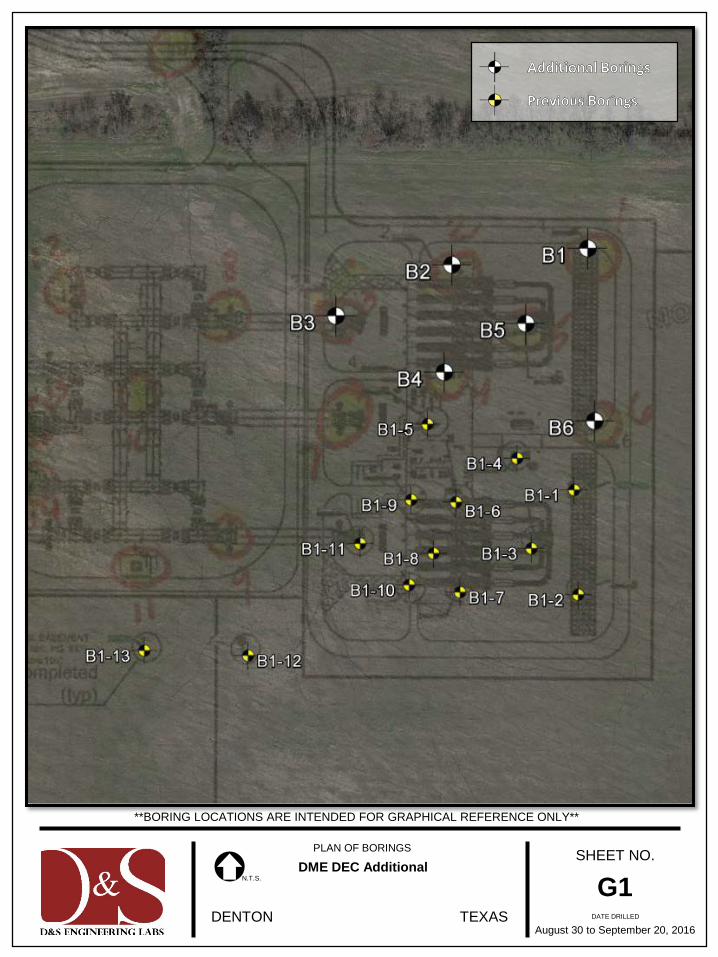
**BORING LOCATIONS ARE INTENDED FOR GRAPHICAL REFERENCE ONLY**
N.T.S.
DENTON TEXAS
SHEET NO.
DATE DRILLED
G1August 30 to September 20, 2016
PLAN OF BORINGS
DME DEC Additional
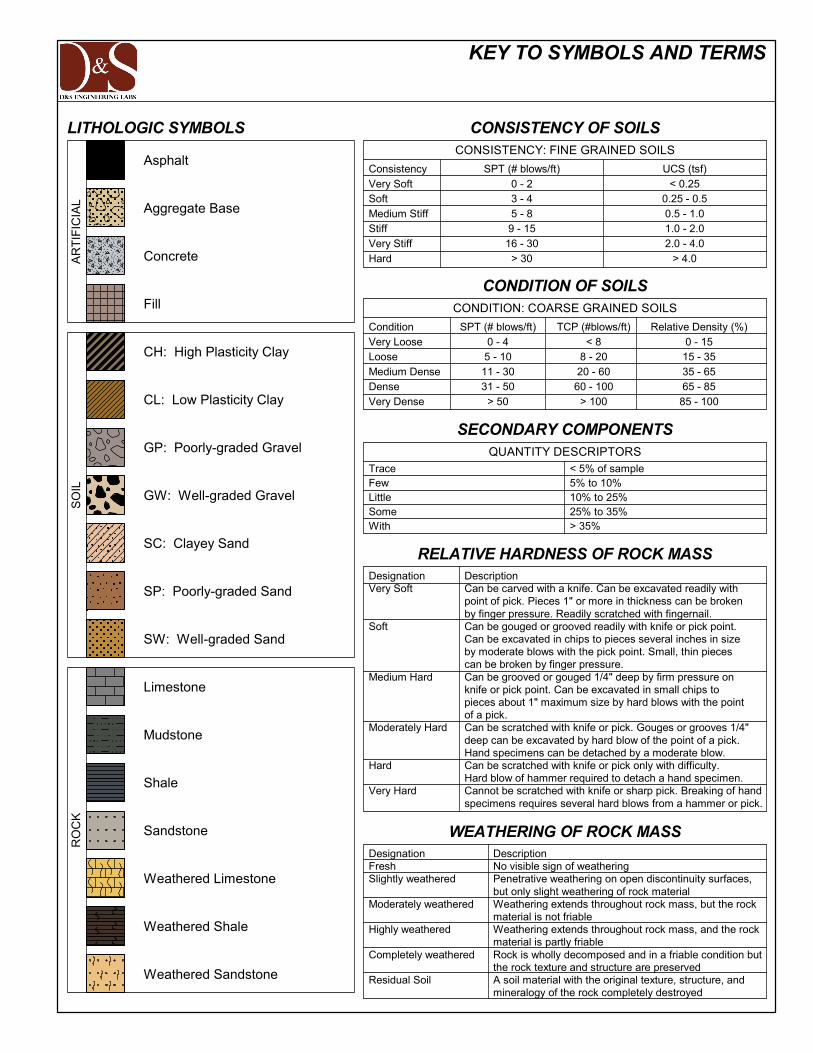
KEY TO SYMBOLS AND TERMS
CONSISTENCY: FINE GRAINED SOILS
CONDITION OF SOILS
SECONDARY COMPONENTS
WEATHERING OF ROCK MASS
TCP (#blows/ft)
< 88 - 20
20 - 6060 - 100
> 100
Relative Density (%)
0 - 1515 - 35
35 - 6565 - 85
85 - 100
SPT (# blows/ft)
0 - 23 - 4
5 - 89 - 15
16 - 30
> 30
UCS (tsf)
< 0.250.25 - 0.5
0.5 - 1.01.0 - 2.0
2.0 - 4.0
> 4.0
CONSISTENCY OF SOILSLITHOLOGIC SYMBOLS
CONDITION: COARSE GRAINED SOILS
QUANTITY DESCRIPTORS
RELATIVE HARDNESS OF ROCK MASS
SPT (# blows/ft)
0 - 45 - 10
11 - 3031 - 50
> 50
DescriptionNo visible sign of weatheringPenetrative weathering on open discontinuity surfaces,but only slight weathering of rock materialWeathering extends throughout rock mass, but the rockmaterial is not friableWeathering extends throughout rock mass, and the rockmaterial is partly friableRock is wholly decomposed and in a friable condition butthe rock texture and structure are preservedA soil material with the original texture, structure, andmineralogy of the rock completely destroyed
DesignationFreshSlightly weathered
Moderately weathered
Highly weathered
Completely weathered
Residual Soil
DescriptionCan be carved with a knife. Can be excavated readily withpoint of pick. Pieces 1" or more in thickness can be brokenby finger pressure. Readily scratched with fingernail.Can be gouged or grooved readily with knife or pick point.Can be excavated in chips to pieces several inches in sizeby moderate blows with the pick point. Small, thin piecescan be broken by finger pressure.Can be grooved or gouged 1/4" deep by firm pressure onknife or pick point. Can be excavated in small chips topieces about 1" maximum size by hard blows with the pointof a pick.Can be scratched with knife or pick. Gouges or grooves 1/4"deep can be excavated by hard blow of the point of a pick.Hand specimens can be detached by a moderate blow.Can be scratched with knife or pick only with difficulty.Hard blow of hammer required to detach a hand specimen.Cannot be scratched with knife or sharp pick. Breaking of handspecimens requires several hard blows from a hammer or pick.
TraceFewLittleSomeWith
DesignationVery Soft
Soft
Medium Hard
Moderately Hard
Hard
Very Hard
< 5% of sample5% to 10%10% to 25%25% to 35%> 35%
Condition
Very LooseLoose
Medium DenseDense
Very Dense
Consistency
Very SoftSoft
Medium StiffStiff
Very Stiff
HardAR
TIF
ICIA
L
Asphalt
Aggregate Base
Concrete
Fill
SO
ILR
OC
K
Limestone
Mudstone
Shale
Sandstone
Weathered Limestone
Weathered Shale
Weathered Sandstone
CH: High Plasticity Clay
CL: Low Plasticity Clay
GP: Poorly-graded Gravel
GW: Well-graded Gravel
SC: Clayey Sand
SP: Poorly-graded Sand
SW: Well-graded Sand
60 20 40
4,4
6,6
7,10
25,18
50=0.25"50=0.25"
50=3.0"50=3.5"
2.5
2.5
3.0
4.0
4.5+
4.5+
4.5+
104.2 2.9
30.4
28.6
27.0
24.3
21.3
17.9
23.9
14.8
12.0 ft
17.0 ft
20.0 ft
FAT CLAY (CH) stiff to very stiff; darkbrown, brown; trace calcareous
LIMESTONE; weathered; moderatelyhard; tan, light gray
SHALE; moderately weathered; verysoft; dark gray; fissile
SHALE; fresh; soft; dark gray; fissile
S
S
S
T
S
T
S
T
S
S
T
T
T
Swell(%)LL
(%)PL(%) PI
TotalSuction
(pF)
HandPen. (tsf)
orSPTor
TCP
HandPen. (tsf)
orSPTor
TCP
Passing#200Sieve(%)
BORING LOG
GraphicLog
DUW(pcf)
Unconf.Compr.Str (ksf)
Depth(ft)
0
5
10
15
20
25
Atterberg Limits
Clay(%)
B1PAGE 1 OF 2
MC(%)
Legend: S-Shelby Tube N-Standard Penetration T-Texas Cone Penetration C-Core B-Bag Sample - Water Encountered
REC(%)
RQD(%)
SampleType
CLIENT: Denton Municipal Electric
LOCATION: Denton, TXPROJECT: Denton Energy Center
DRILLED BY: Kevin Kavadas (D&S)
START DATE: 8/30/2016 DRILL METHOD: Cont. Flight Auger
LOGGED BY: Ricky Ybarra (D&S)
FINISH DATE: 8/30/2016
GROUND ELEVATION:
GPS COORDINATES: N33.21549, W97.20942
PROJECT NUMBER: 13-0278-12b
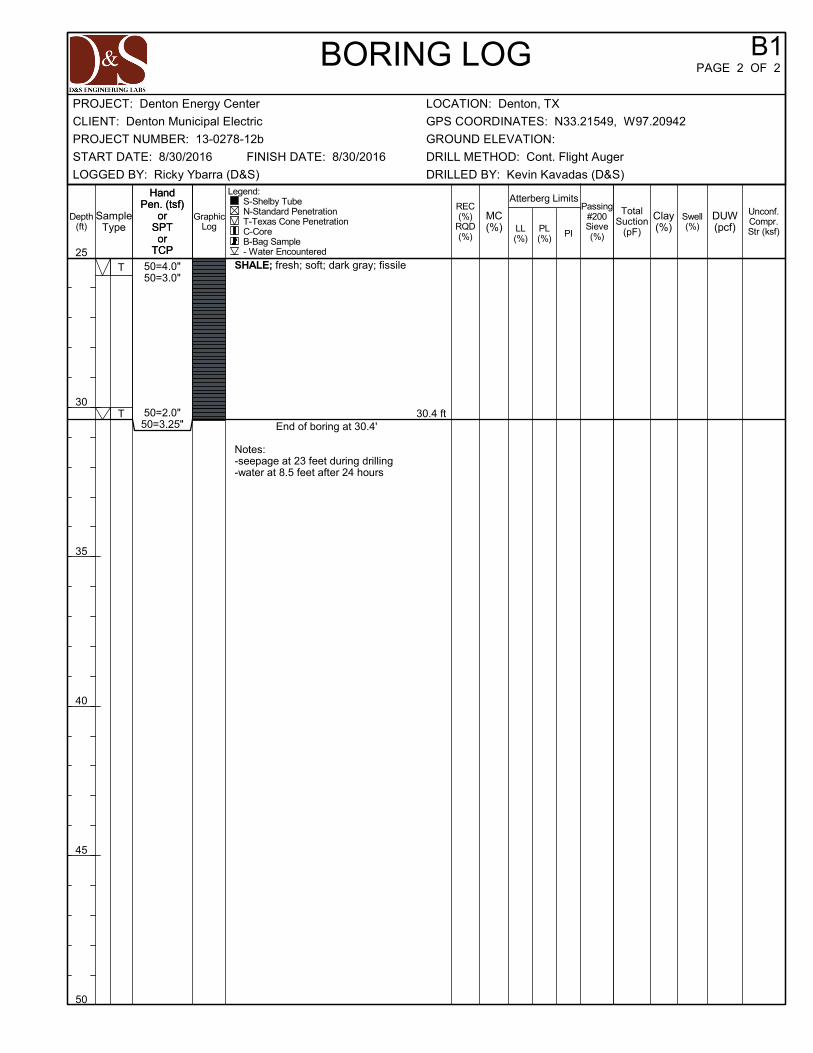
50=4.0"50=3.0"
50=2.0"50=3.25"
30.4 ft
SHALE; fresh; soft; dark gray; fissile
End of boring at 30.4'
Notes:-seepage at 23 feet during drilling-water at 8.5 feet after 24 hours
T
T
Swell(%)LL
(%)PL(%) PI
TotalSuction
(pF)
HandPen. (tsf)
orSPTor
TCP
HandPen. (tsf)
orSPTor
TCP
Passing#200Sieve(%)
BORING LOG
GraphicLog
DUW(pcf)
Unconf.Compr.Str (ksf)
Depth(ft)
25
30
35
40
45
50
Atterberg Limits
Clay(%)
B1PAGE 2 OF 2
MC(%)
Legend: S-Shelby Tube N-Standard Penetration T-Texas Cone Penetration C-Core B-Bag Sample - Water Encountered
REC(%)
RQD(%)
SampleType
CLIENT: Denton Municipal Electric
LOCATION: Denton, TXPROJECT: Denton Energy Center
DRILLED BY: Kevin Kavadas (D&S)
START DATE: 8/30/2016 DRILL METHOD: Cont. Flight Auger
LOGGED BY: Ricky Ybarra (D&S)
FINISH DATE: 8/30/2016
GROUND ELEVATION:
GPS COORDINATES: N33.21549, W97.20942
PROJECT NUMBER: 13-0278-12b
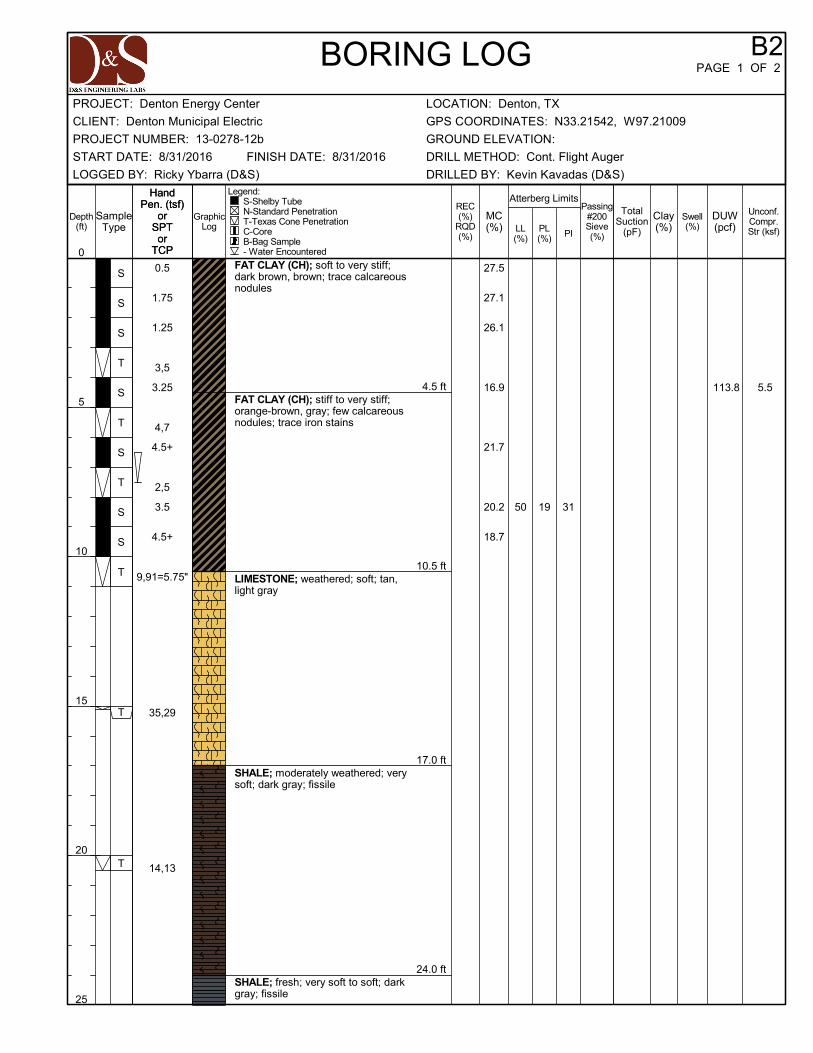
50 19 31
3,5
4,7
2,5
9,91=5.75"
35,29
14,13
0.5
1.75
1.25
3.25
4.5+
3.5
4.5+
113.8 5.5
27.5
27.1
26.1
16.9
21.7
20.2
18.7
4.5 ft
10.5 ft
17.0 ft
24.0 ft
FAT CLAY (CH); soft to very stiff;dark brown, brown; trace calcareousnodules
FAT CLAY (CH); stiff to very stiff;orange-brown, gray; few calcareousnodules; trace iron stains
LIMESTONE; weathered; soft; tan,light gray
SHALE; moderately weathered; verysoft; dark gray; fissile
SHALE; fresh; very soft to soft; darkgray; fissile
S
S
S
T
S
T
S
T
S
S
T
T
T
Swell(%)LL
(%)PL(%) PI
TotalSuction
(pF)
HandPen. (tsf)
orSPTor
TCP
HandPen. (tsf)
orSPTor
TCP
Passing#200Sieve(%)
BORING LOG
GraphicLog
DUW(pcf)
Unconf.Compr.Str (ksf)
Depth(ft)
0
5
10
15
20
25
Atterberg Limits
Clay(%)
B2PAGE 1 OF 2
MC(%)
Legend: S-Shelby Tube N-Standard Penetration T-Texas Cone Penetration C-Core B-Bag Sample - Water Encountered
REC(%)
RQD(%)
SampleType
CLIENT: Denton Municipal Electric
LOCATION: Denton, TXPROJECT: Denton Energy Center
DRILLED BY: Kevin Kavadas (D&S)
START DATE: 8/31/2016 DRILL METHOD: Cont. Flight Auger
LOGGED BY: Ricky Ybarra (D&S)
FINISH DATE: 8/31/2016
GROUND ELEVATION:
GPS COORDINATES: N33.21542, W97.21009
PROJECT NUMBER: 13-0278-12b
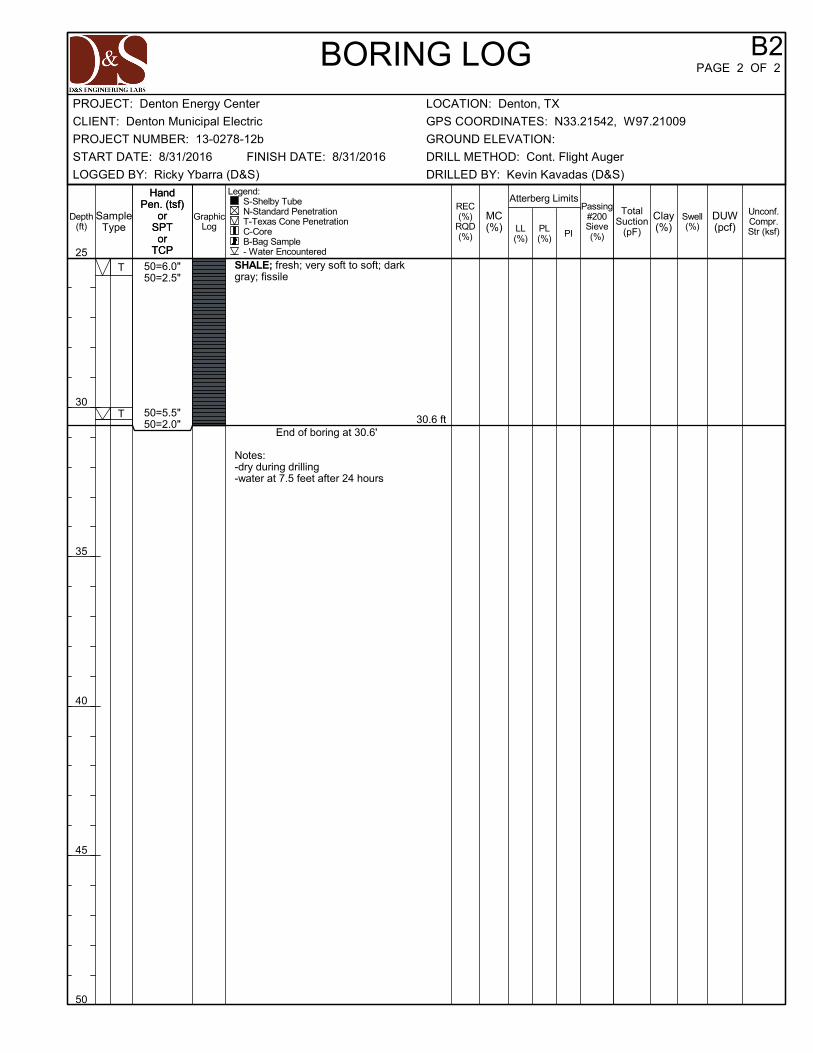
50=6.0"50=2.5"
50=5.5"50=2.0" 30.6 ft
SHALE; fresh; very soft to soft; darkgray; fissile
End of boring at 30.6'
Notes:-dry during drilling-water at 7.5 feet after 24 hours
T
T
Swell(%)LL
(%)PL(%) PI
TotalSuction
(pF)
HandPen. (tsf)
orSPTor
TCP
HandPen. (tsf)
orSPTor
TCP
Passing#200Sieve(%)
BORING LOG
GraphicLog
DUW(pcf)
Unconf.Compr.Str (ksf)
Depth(ft)
25
30
35
40
45
50
Atterberg Limits
Clay(%)
B2PAGE 2 OF 2
MC(%)
Legend: S-Shelby Tube N-Standard Penetration T-Texas Cone Penetration C-Core B-Bag Sample - Water Encountered
REC(%)
RQD(%)
SampleType
CLIENT: Denton Municipal Electric
LOCATION: Denton, TXPROJECT: Denton Energy Center
DRILLED BY: Kevin Kavadas (D&S)
START DATE: 8/31/2016 DRILL METHOD: Cont. Flight Auger
LOGGED BY: Ricky Ybarra (D&S)
FINISH DATE: 8/31/2016
GROUND ELEVATION:
GPS COORDINATES: N33.21542, W97.21009
PROJECT NUMBER: 13-0278-12b
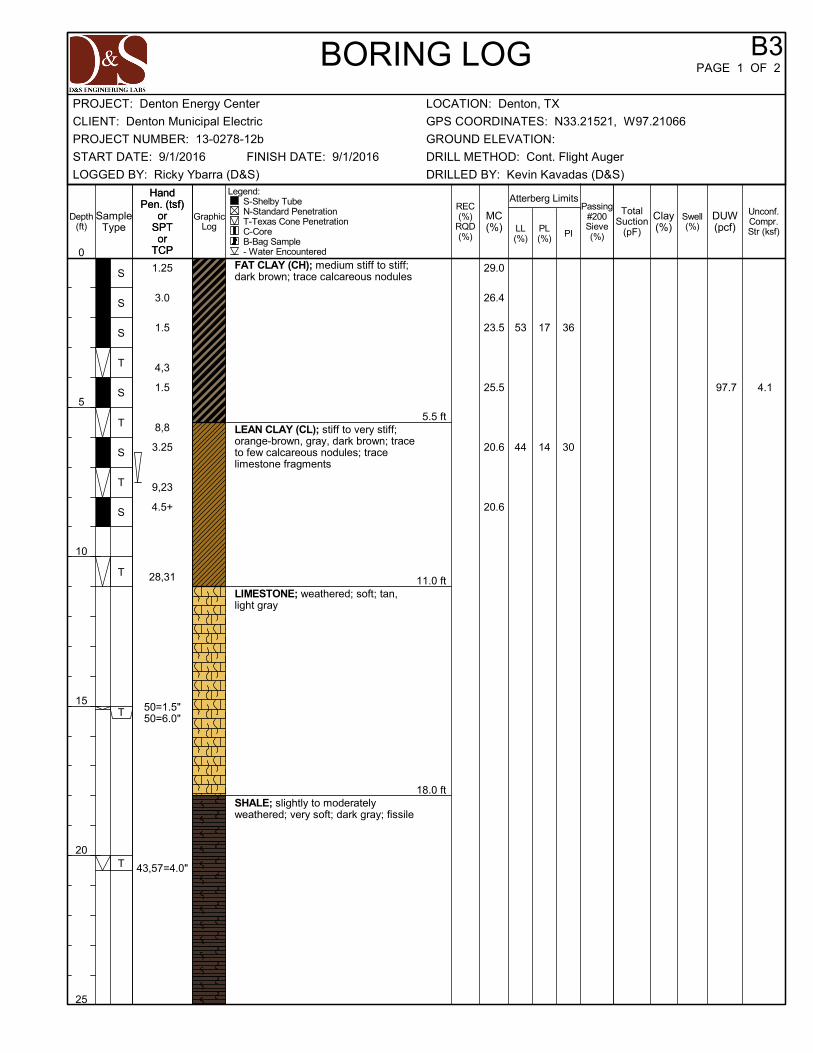
53
44
17
14
36
30
4,3
8,8
9,23
28,31
50=1.5"50=6.0"
43,57=4.0"
1.25
3.0
1.5
1.5
3.25
4.5+
97.7 4.1
29.0
26.4
23.5
25.5
20.6
20.6
5.5 ft
11.0 ft
18.0 ft
FAT CLAY (CH); medium stiff to stiff;dark brown; trace calcareous nodules
LEAN CLAY (CL); stiff to very stiff;orange-brown, gray, dark brown; traceto few calcareous nodules; tracelimestone fragments
LIMESTONE; weathered; soft; tan,light gray
SHALE; slightly to moderatelyweathered; very soft; dark gray; fissile
S
S
S
T
S
T
S
T
S
T
T
T
Swell(%)LL
(%)PL(%) PI
TotalSuction
(pF)
HandPen. (tsf)
orSPTor
TCP
HandPen. (tsf)
orSPTor
TCP
Passing#200Sieve(%)
BORING LOG
GraphicLog
DUW(pcf)
Unconf.Compr.Str (ksf)
Depth(ft)
0
5
10
15
20
25
Atterberg Limits
Clay(%)
B3PAGE 1 OF 2
MC(%)
Legend: S-Shelby Tube N-Standard Penetration T-Texas Cone Penetration C-Core B-Bag Sample - Water Encountered
REC(%)
RQD(%)
SampleType
CLIENT: Denton Municipal Electric
LOCATION: Denton, TXPROJECT: Denton Energy Center
DRILLED BY: Kevin Kavadas (D&S)
START DATE: 9/1/2016 DRILL METHOD: Cont. Flight Auger
LOGGED BY: Ricky Ybarra (D&S)
FINISH DATE: 9/1/2016
GROUND ELEVATION:
GPS COORDINATES: N33.21521, W97.21066
PROJECT NUMBER: 13-0278-12b
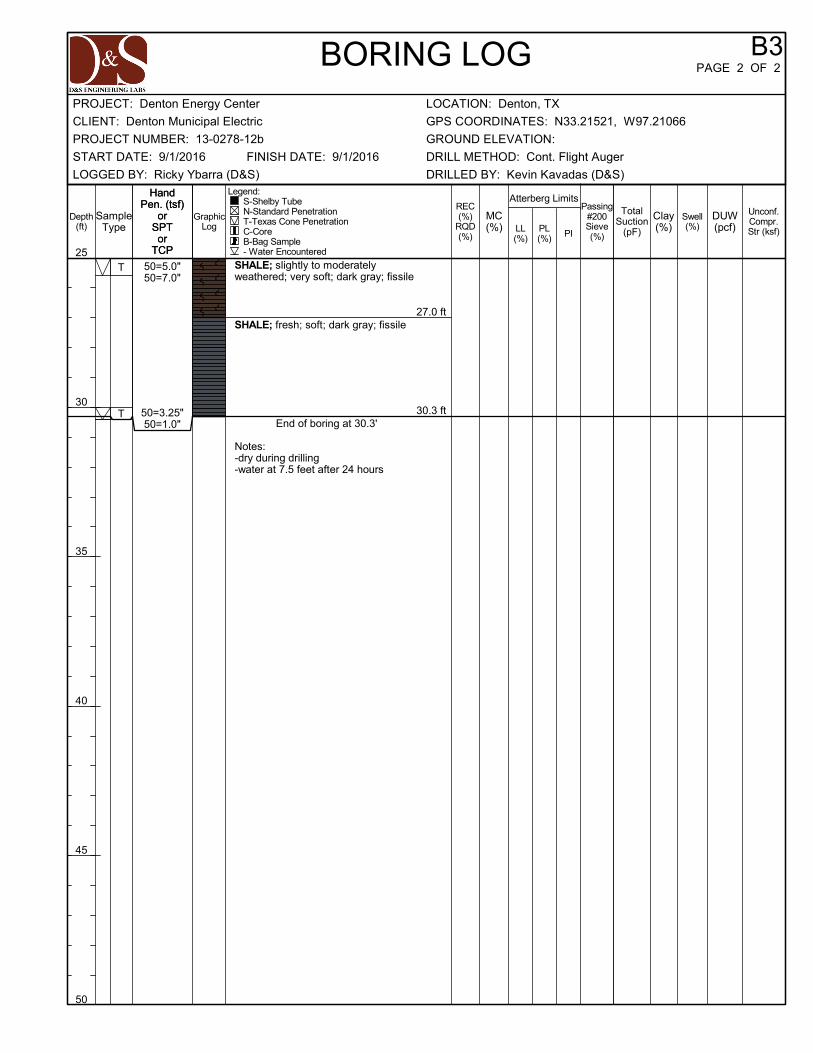
50=5.0"50=7.0"
50=3.25"50=1.0"
27.0 ft
30.3 ft
SHALE; slightly to moderatelyweathered; very soft; dark gray; fissile
SHALE; fresh; soft; dark gray; fissile
End of boring at 30.3'
Notes:-dry during drilling-water at 7.5 feet after 24 hours
T
T
Swell(%)LL
(%)PL(%) PI
TotalSuction
(pF)
HandPen. (tsf)
orSPTor
TCP
HandPen. (tsf)
orSPTor
TCP
Passing#200Sieve(%)
BORING LOG
GraphicLog
DUW(pcf)
Unconf.Compr.Str (ksf)
Depth(ft)
25
30
35
40
45
50
Atterberg Limits
Clay(%)
B3PAGE 2 OF 2
MC(%)
Legend: S-Shelby Tube N-Standard Penetration T-Texas Cone Penetration C-Core B-Bag Sample - Water Encountered
REC(%)
RQD(%)
SampleType
CLIENT: Denton Municipal Electric
LOCATION: Denton, TXPROJECT: Denton Energy Center
DRILLED BY: Kevin Kavadas (D&S)
START DATE: 9/1/2016 DRILL METHOD: Cont. Flight Auger
LOGGED BY: Ricky Ybarra (D&S)
FINISH DATE: 9/1/2016
GROUND ELEVATION:
GPS COORDINATES: N33.21521, W97.21066
PROJECT NUMBER: 13-0278-12b
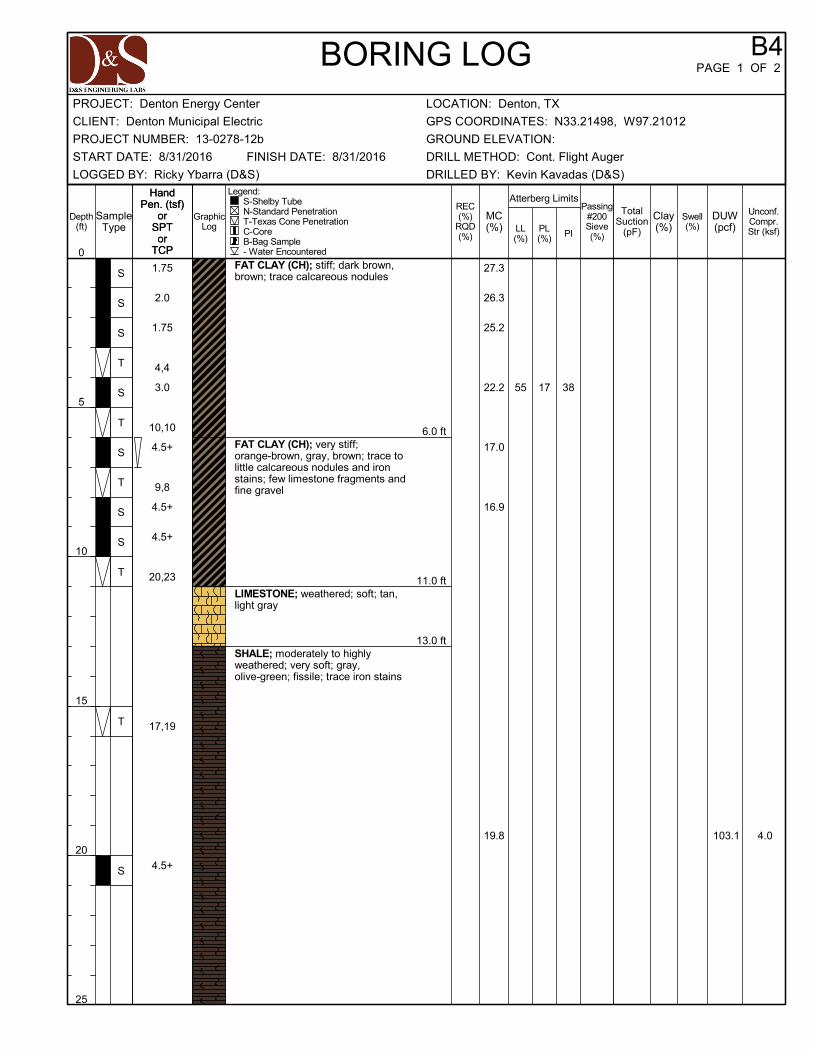
55 17 38
4,4
10,10
9,8
20,23
17,19
1.75
2.0
1.75
3.0
4.5+
4.5+
4.5+
4.5+
103.1 4.0
27.3
26.3
25.2
22.2
17.0
16.9
19.8
6.0 ft
11.0 ft
13.0 ft
FAT CLAY (CH); stiff; dark brown,brown; trace calcareous nodules
FAT CLAY (CH); very stiff;orange-brown, gray, brown; trace tolittle calcareous nodules and ironstains; few limestone fragments andfine gravel
LIMESTONE; weathered; soft; tan,light gray
SHALE; moderately to highlyweathered; very soft; gray,olive-green; fissile; trace iron stains
S
S
S
T
S
T
S
T
S
S
T
T
S
Swell(%)LL
(%)PL(%) PI
TotalSuction
(pF)
HandPen. (tsf)
orSPTor
TCP
HandPen. (tsf)
orSPTor
TCP
Passing#200Sieve(%)
BORING LOG
GraphicLog
DUW(pcf)
Unconf.Compr.Str (ksf)
Depth(ft)
0
5
10
15
20
25
Atterberg Limits
Clay(%)
B4PAGE 1 OF 2
MC(%)
Legend: S-Shelby Tube N-Standard Penetration T-Texas Cone Penetration C-Core B-Bag Sample - Water Encountered
REC(%)
RQD(%)
SampleType
CLIENT: Denton Municipal Electric
LOCATION: Denton, TXPROJECT: Denton Energy Center
DRILLED BY: Kevin Kavadas (D&S)
START DATE: 8/31/2016 DRILL METHOD: Cont. Flight Auger
LOGGED BY: Ricky Ybarra (D&S)
FINISH DATE: 8/31/2016
GROUND ELEVATION:
GPS COORDINATES: N33.21498, W97.21012
PROJECT NUMBER: 13-0278-12b
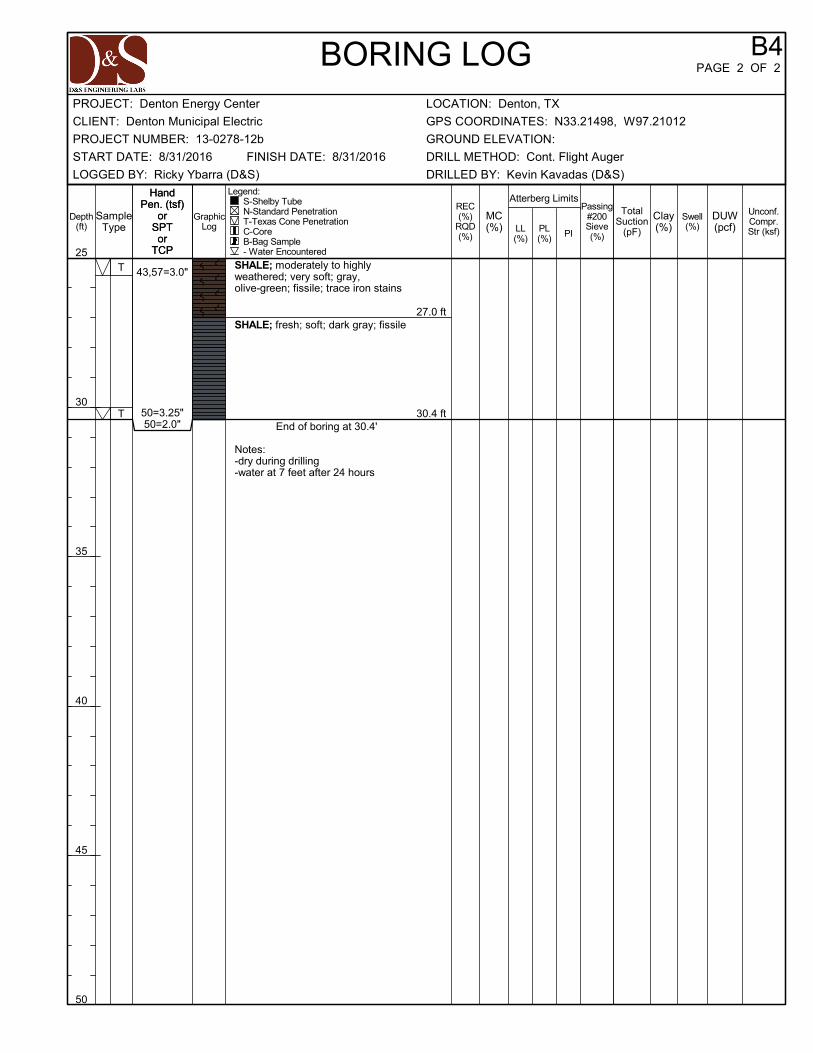
43,57=3.0"
50=3.25"50=2.0"
27.0 ft
30.4 ft
SHALE; moderately to highlyweathered; very soft; gray,olive-green; fissile; trace iron stains
SHALE; fresh; soft; dark gray; fissile
End of boring at 30.4'
Notes:-dry during drilling-water at 7 feet after 24 hours
T
T
Swell(%)LL
(%)PL(%) PI
TotalSuction
(pF)
HandPen. (tsf)
orSPTor
TCP
HandPen. (tsf)
orSPTor
TCP
Passing#200Sieve(%)
BORING LOG
GraphicLog
DUW(pcf)
Unconf.Compr.Str (ksf)
Depth(ft)
25
30
35
40
45
50
Atterberg Limits
Clay(%)
B4PAGE 2 OF 2
MC(%)
Legend: S-Shelby Tube N-Standard Penetration T-Texas Cone Penetration C-Core B-Bag Sample - Water Encountered
REC(%)
RQD(%)
SampleType
CLIENT: Denton Municipal Electric
LOCATION: Denton, TXPROJECT: Denton Energy Center
DRILLED BY: Kevin Kavadas (D&S)
START DATE: 8/31/2016 DRILL METHOD: Cont. Flight Auger
LOGGED BY: Ricky Ybarra (D&S)
FINISH DATE: 8/31/2016
GROUND ELEVATION:
GPS COORDINATES: N33.21498, W97.21012
PROJECT NUMBER: 13-0278-12b
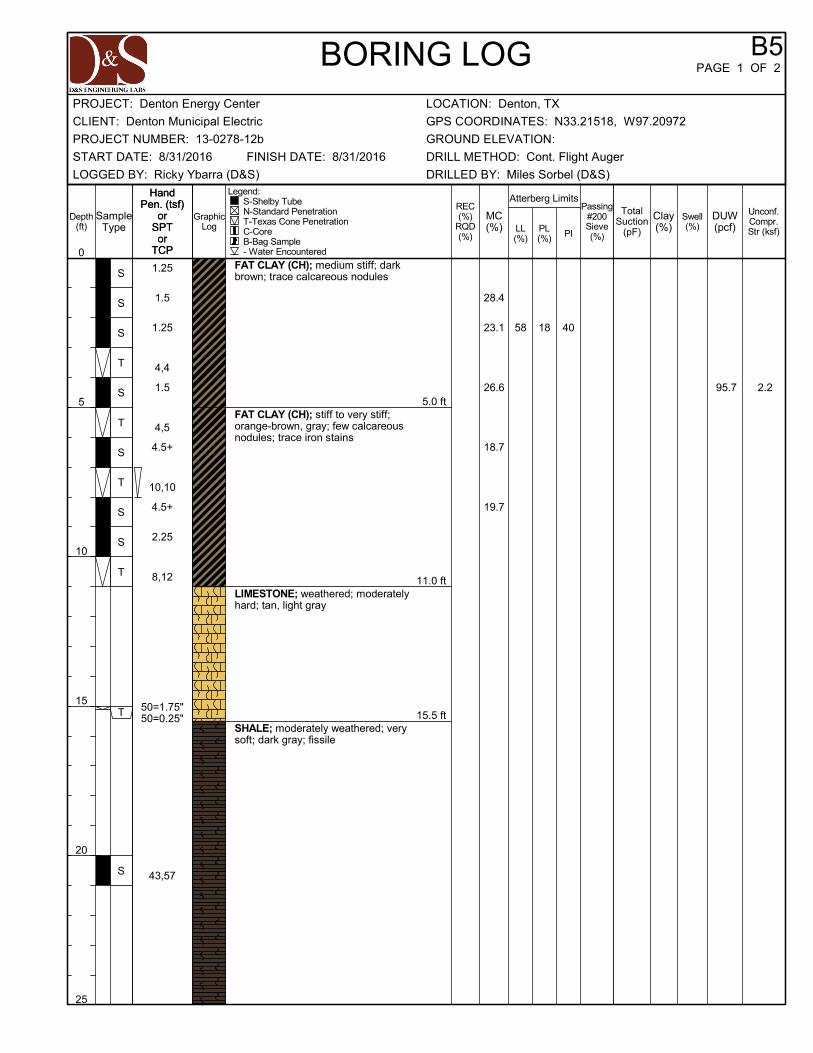
58 18 40
4,4
4,5
10,10
8,12
50=1.75"50=0.25"
43,57
1.25
1.5
1.25
1.5
4.5+
4.5+
2.25
95.7 2.2
28.4
23.1
26.6
18.7
19.7
5.0 ft
11.0 ft
15.5 ft
FAT CLAY (CH); medium stiff; darkbrown; trace calcareous nodules
FAT CLAY (CH); stiff to very stiff;orange-brown, gray; few calcareousnodules; trace iron stains
LIMESTONE; weathered; moderatelyhard; tan, light gray
SHALE; moderately weathered; verysoft; dark gray; fissile
S
S
S
T
S
T
S
T
S
S
T
T
S
Swell(%)LL
(%)PL(%) PI
TotalSuction
(pF)
HandPen. (tsf)
orSPTor
TCP
HandPen. (tsf)
orSPTor
TCP
Passing#200Sieve(%)
BORING LOG
GraphicLog
DUW(pcf)
Unconf.Compr.Str (ksf)
Depth(ft)
0
5
10
15
20
25
Atterberg Limits
Clay(%)
B5PAGE 1 OF 2
MC(%)
Legend: S-Shelby Tube N-Standard Penetration T-Texas Cone Penetration C-Core B-Bag Sample - Water Encountered
REC(%)
RQD(%)
SampleType
CLIENT: Denton Municipal Electric
LOCATION: Denton, TXPROJECT: Denton Energy Center
DRILLED BY: Miles Sorbel (D&S)
START DATE: 8/31/2016 DRILL METHOD: Cont. Flight Auger
LOGGED BY: Ricky Ybarra (D&S)
FINISH DATE: 8/31/2016
GROUND ELEVATION:
GPS COORDINATES: N33.21518, W97.20972
PROJECT NUMBER: 13-0278-12b

45,55=4.0"
50=3.0"50=1.5"
27.0 ft
30.3 ft
SHALE; moderately weathered; verysoft; dark gray; fissile
SHALE; fresh; soft; dark gray; fissile
End of boring at 30.3'
Notes:-dry during drilling-water at 8 feet after 24 hours
T
T
Swell(%)LL
(%)PL(%) PI
TotalSuction
(pF)
HandPen. (tsf)
orSPTor
TCP
HandPen. (tsf)
orSPTor
TCP
Passing#200Sieve(%)
BORING LOG
GraphicLog
DUW(pcf)
Unconf.Compr.Str (ksf)
Depth(ft)
25
30
35
40
45
50
Atterberg Limits
Clay(%)
B5PAGE 2 OF 2
MC(%)
Legend: S-Shelby Tube N-Standard Penetration T-Texas Cone Penetration C-Core B-Bag Sample - Water Encountered
REC(%)
RQD(%)
SampleType
CLIENT: Denton Municipal Electric
LOCATION: Denton, TXPROJECT: Denton Energy Center
DRILLED BY: Miles Sorbel (D&S)
START DATE: 8/31/2016 DRILL METHOD: Cont. Flight Auger
LOGGED BY: Ricky Ybarra (D&S)
FINISH DATE: 8/31/2016
GROUND ELEVATION:
GPS COORDINATES: N33.21518, W97.20972
PROJECT NUMBER: 13-0278-12b
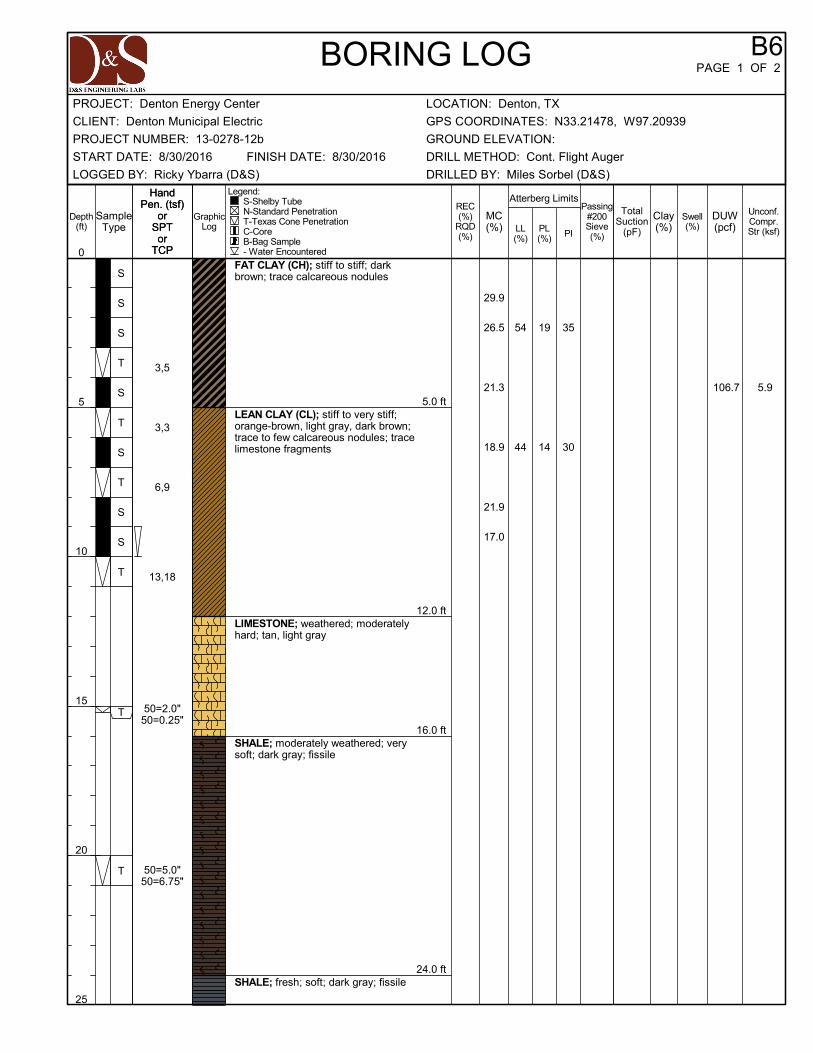
54
44
19
14
35
30
3,5
3,3
6,9
13,18
50=2.0"50=0.25"
50=5.0"50=6.75"
106.7 5.9
29.9
26.5
21.3
18.9
21.9
17.0
5.0 ft
12.0 ft
16.0 ft
24.0 ft
FAT CLAY (CH); stiff to stiff; darkbrown; trace calcareous nodules
LEAN CLAY (CL); stiff to very stiff;orange-brown, light gray, dark brown;trace to few calcareous nodules; tracelimestone fragments
LIMESTONE; weathered; moderatelyhard; tan, light gray
SHALE; moderately weathered; verysoft; dark gray; fissile
SHALE; fresh; soft; dark gray; fissile
S
S
S
T
S
T
S
T
S
S
T
T
T
Swell(%)LL
(%)PL(%) PI
TotalSuction
(pF)
HandPen. (tsf)
orSPTor
TCP
HandPen. (tsf)
orSPTor
TCP
Passing#200Sieve(%)
BORING LOG
GraphicLog
DUW(pcf)
Unconf.Compr.Str (ksf)
Depth(ft)
0
5
10
15
20
25
Atterberg Limits
Clay(%)
B6PAGE 1 OF 2
MC(%)
Legend: S-Shelby Tube N-Standard Penetration T-Texas Cone Penetration C-Core B-Bag Sample - Water Encountered
REC(%)
RQD(%)
SampleType
CLIENT: Denton Municipal Electric
LOCATION: Denton, TXPROJECT: Denton Energy Center
DRILLED BY: Miles Sorbel (D&S)
START DATE: 8/30/2016 DRILL METHOD: Cont. Flight Auger
LOGGED BY: Ricky Ybarra (D&S)
FINISH DATE: 8/30/2016
GROUND ELEVATION:
GPS COORDINATES: N33.21478, W97.20939
PROJECT NUMBER: 13-0278-12b
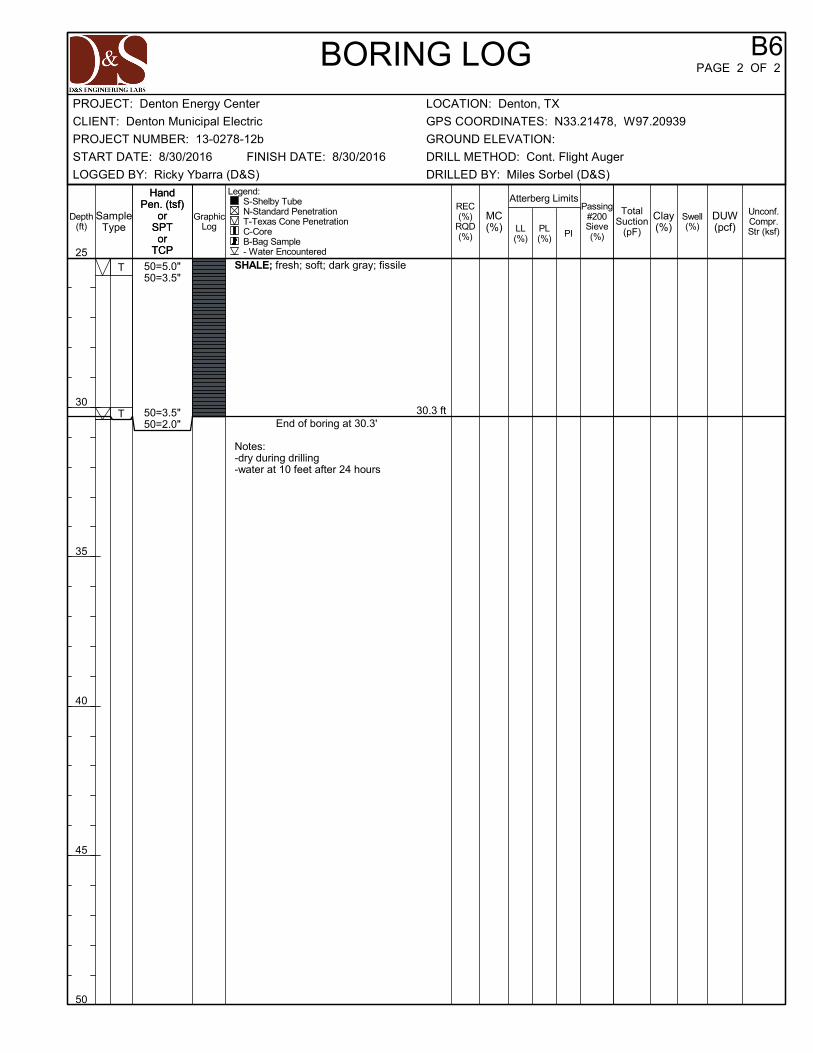
50=5.0"50=3.5"
50=3.5"50=2.0"
30.3 ft
SHALE; fresh; soft; dark gray; fissile
End of boring at 30.3'
Notes:-dry during drilling-water at 10 feet after 24 hours
T
T
Swell(%)LL
(%)PL(%) PI
TotalSuction
(pF)
HandPen. (tsf)
orSPTor
TCP
HandPen. (tsf)
orSPTor
TCP
Passing#200Sieve(%)
BORING LOG
GraphicLog
DUW(pcf)
Unconf.Compr.Str (ksf)
Depth(ft)
25
30
35
40
45
50
Atterberg Limits
Clay(%)
B6PAGE 2 OF 2
MC(%)
Legend: S-Shelby Tube N-Standard Penetration T-Texas Cone Penetration C-Core B-Bag Sample - Water Encountered
REC(%)
RQD(%)
SampleType
CLIENT: Denton Municipal Electric
LOCATION: Denton, TXPROJECT: Denton Energy Center
DRILLED BY: Miles Sorbel (D&S)
START DATE: 8/30/2016 DRILL METHOD: Cont. Flight Auger
LOGGED BY: Ricky Ybarra (D&S)
FINISH DATE: 8/30/2016
GROUND ELEVATION:
GPS COORDINATES: N33.21478, W97.20939
PROJECT NUMBER: 13-0278-12b
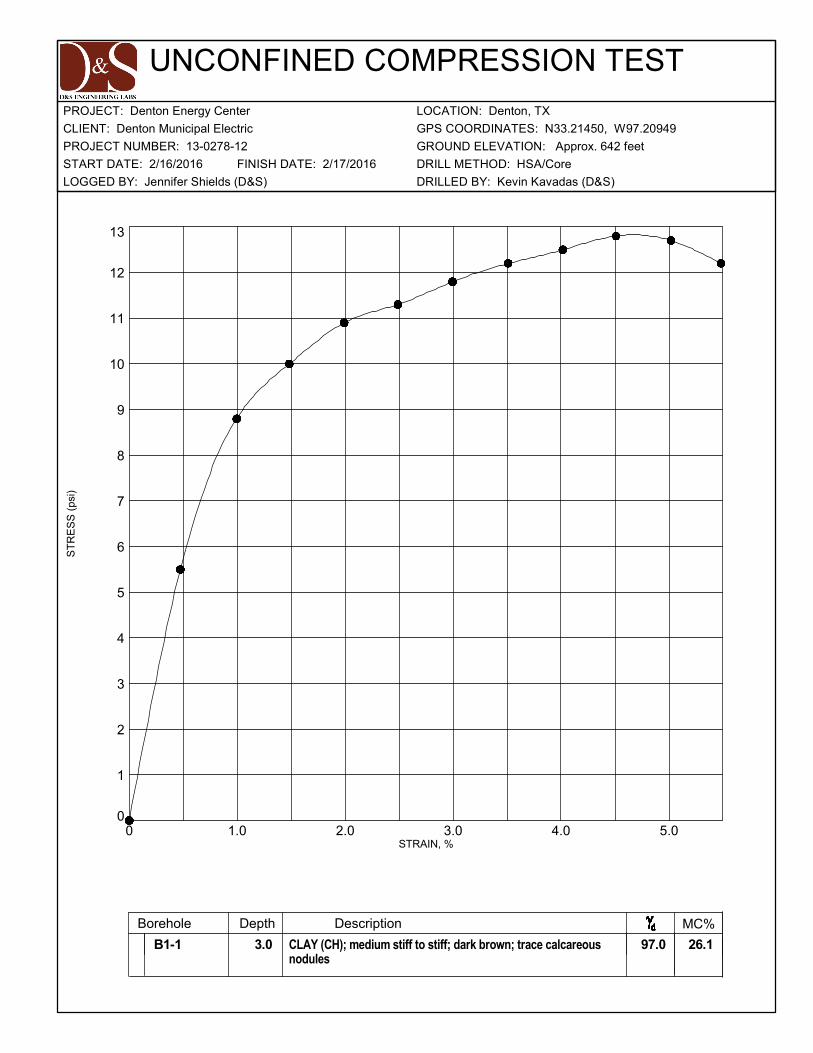
0
1
2
3
4
5
6
7
8
9
10
11
12
13
0 1.0 2.0 3.0 4.0 5.0
UNCONFINED COMPRESSION TEST
STRAIN, %
26.1 97.0
ST
RE
SS
(ps
i)
CLIENT: Denton Municipal Electric
LOCATION: Denton, TXPROJECT: Denton Energy Center
DRILLED BY: Kevin Kavadas (D&S)
START DATE: 2/16/2016 DRILL METHOD: HSA/Core
LOGGED BY: Jennifer Shields (D&S)
FINISH DATE: 2/17/2016
GROUND ELEVATION: Approx. 642 feet
GPS COORDINATES: N33.21450, W97.20949
PROJECT NUMBER: 13-0278-12
3.0
Borehole Depth Description MC%
B1-1 CLAY (CH); medium stiff to stiff; dark brown; trace calcareousnodules
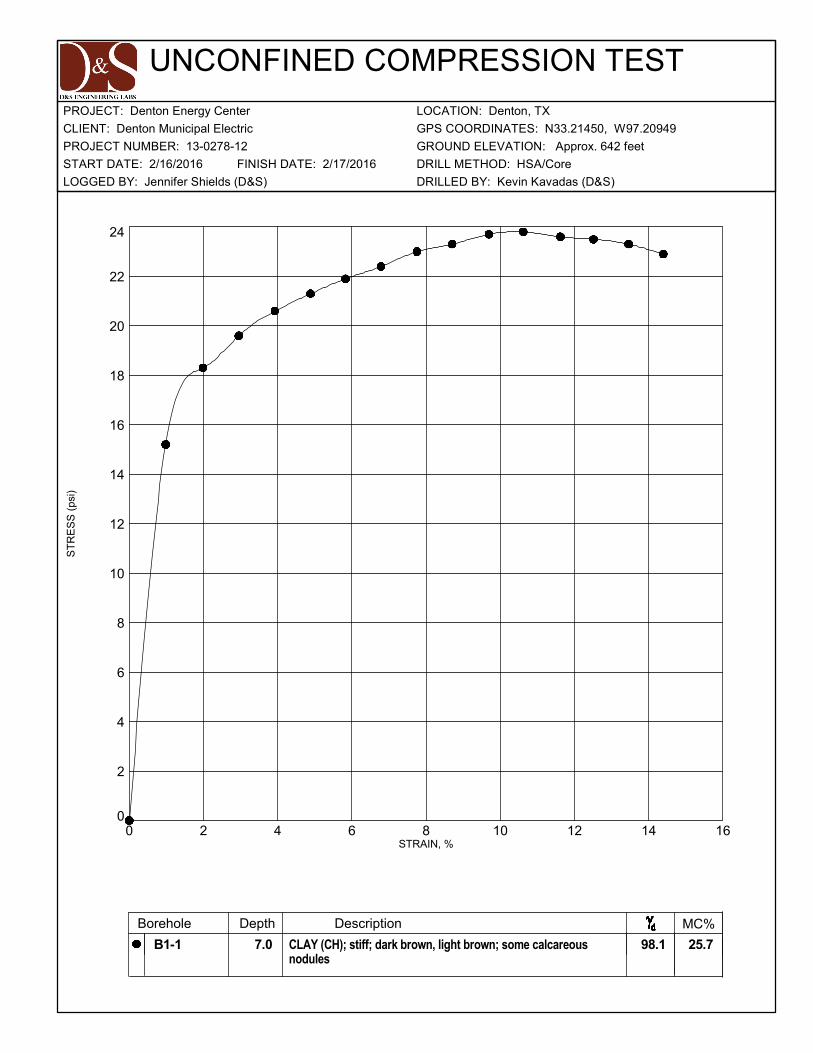
0
2
4
6
8
10
12
14
16
18
20
22
24
0 2 4 6 8 10 12 14 16
UNCONFINED COMPRESSION TEST
STRAIN, %
25.7 98.1
ST
RE
SS
(ps
i)
CLIENT: Denton Municipal Electric
LOCATION: Denton, TXPROJECT: Denton Energy Center
DRILLED BY: Kevin Kavadas (D&S)
START DATE: 2/16/2016 DRILL METHOD: HSA/Core
LOGGED BY: Jennifer Shields (D&S)
FINISH DATE: 2/17/2016
GROUND ELEVATION: Approx. 642 feet
GPS COORDINATES: N33.21450, W97.20949
PROJECT NUMBER: 13-0278-12
7.0
Borehole Depth Description MC%
B1-1 CLAY (CH); stiff; dark brown, light brown; some calcareousnodules

0
2
4
6
8
10
12
14
16
18
20
22
0 2 4 6 8 10 12 14 16
UNCONFINED COMPRESSION TEST
STRAIN, %
24.3 100.8
ST
RE
SS
(ps
i)
CLIENT: Denton Municipal Electric
LOCATION: Denton, TXPROJECT: Denton Energy Center
DRILLED BY: Andrew Gibson (D&S)
START DATE: 2/18/2016 DRILL METHOD: Cont. Flight Auger
LOGGED BY: Jennifer Shields (D&S)
FINISH DATE: 2/18/2016
GROUND ELEVATION: Approx. 642 feet
GPS COORDINATES: N33.21411, W97.21030
PROJECT NUMBER: 13-0278-12
4.0
Borehole Depth Description MC%
B1-10 CLAY (CH); medium stiff to stiff; dark brown; trace calcareousnodules

0
2
4
6
8
10
12
14
16
18
20
22
24
26
0 2 4 6 8 10 12 14
UNCONFINED COMPRESSION TEST
STRAIN, %
22.5 101.8
ST
RE
SS
(ps
i)
CLIENT: Denton Municipal Electric
LOCATION: Denton, TXPROJECT: Denton Energy Center
DRILLED BY: Andrew Gibson (D&S)
START DATE: 2/18/2016 DRILL METHOD: Cont. Flight Auger
LOGGED BY: Jennifer Shields (D&S)
FINISH DATE: 2/18/2016
GROUND ELEVATION: Approx. 642 feet
GPS COORDINATES: N33.21411, W97.21030
PROJECT NUMBER: 13-0278-12
6.0
Borehole Depth Description MC%
B1-10 CLAYEY GRAVEL (GC); medium dense; orange-brown,occasionally dark brown; with calcareous nodules andweathered limestone fragments
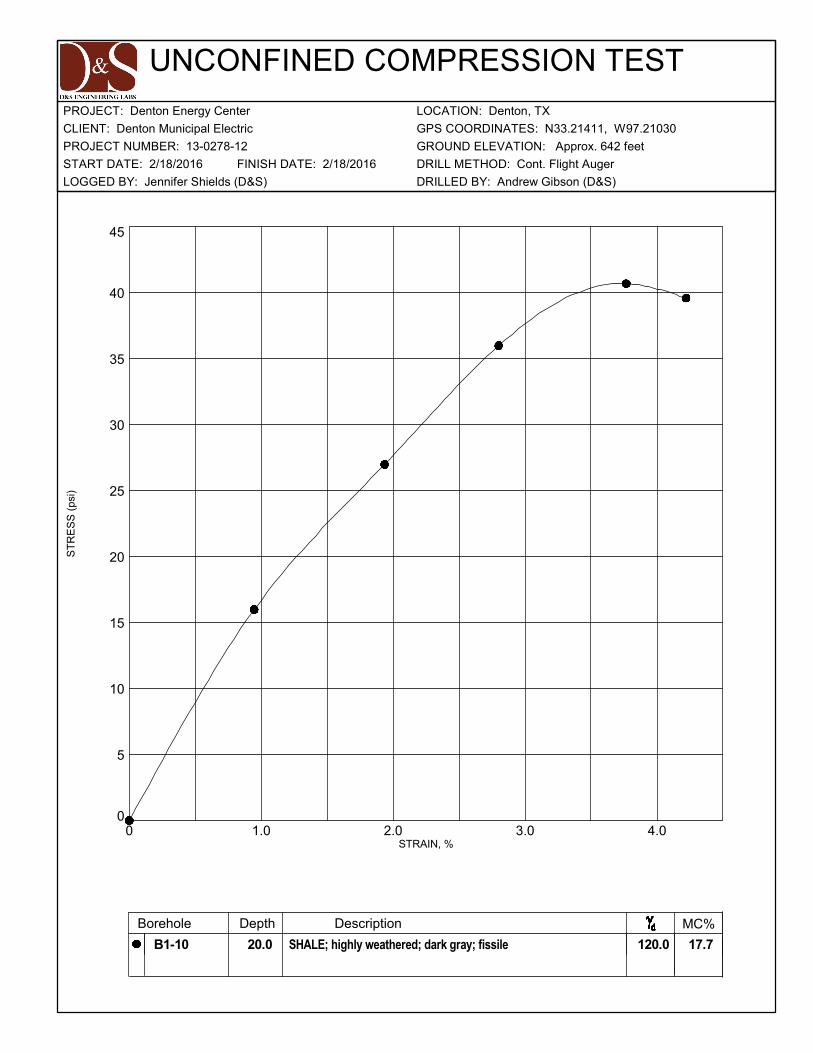
0
5
10
15
20
25
30
35
40
45
0 1.0 2.0 3.0 4.0
UNCONFINED COMPRESSION TEST
STRAIN, %
17.7 120.0
ST
RE
SS
(ps
i)
CLIENT: Denton Municipal Electric
LOCATION: Denton, TXPROJECT: Denton Energy Center
DRILLED BY: Andrew Gibson (D&S)
START DATE: 2/18/2016 DRILL METHOD: Cont. Flight Auger
LOGGED BY: Jennifer Shields (D&S)
FINISH DATE: 2/18/2016
GROUND ELEVATION: Approx. 642 feet
GPS COORDINATES: N33.21411, W97.21030
PROJECT NUMBER: 13-0278-12
20.0
Borehole Depth Description MC%
B1-10 SHALE; highly weathered; dark gray; fissile

0
2
4
6
8
10
12
14
16
18
20
22
0 4 8 12 16
UNCONFINED COMPRESSION TEST
STRAIN, %
19.4 103.2
ST
RE
SS
(ps
i)
CLIENT: Denton Municipal Electric
LOCATION: Denton, TXPROJECT: Denton Energy Center
DRILLED BY: Kevin Kavadas (D&S)
START DATE: 2/16/2016 DRILL METHOD: HSA/Core
LOGGED BY: Jennifer Shields (D&S)
FINISH DATE: 2/16/2016
GROUND ELEVATION: Approx. 642 feet
GPS COORDINATES: N33.21428, W97.21054
PROJECT NUMBER: 13-0278-12
2.0
Borehole Depth Description MC%
B1-11 CLAY (CH); medium stiff to stiff; dark brown; tracecalcareous nodules and roots
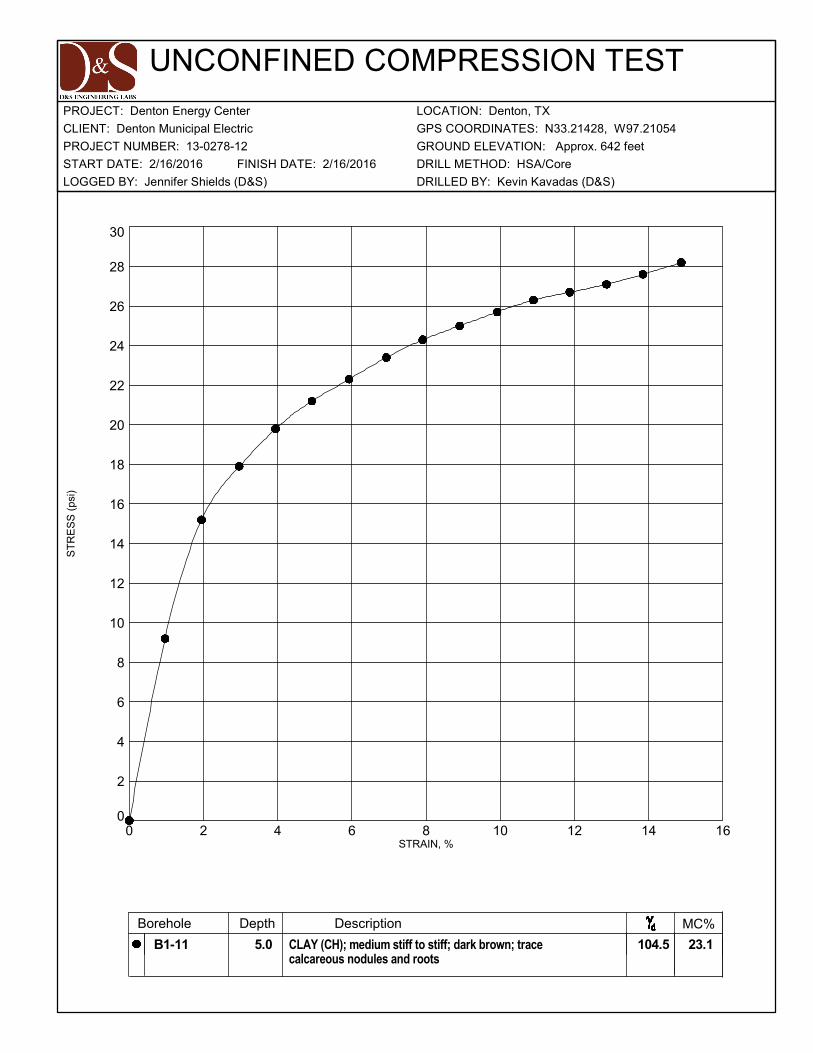
0
2
4
6
8
10
12
14
16
18
20
22
24
26
28
30
0 2 4 6 8 10 12 14 16
UNCONFINED COMPRESSION TEST
STRAIN, %
23.1 104.5
ST
RE
SS
(ps
i)
CLIENT: Denton Municipal Electric
LOCATION: Denton, TXPROJECT: Denton Energy Center
DRILLED BY: Kevin Kavadas (D&S)
START DATE: 2/16/2016 DRILL METHOD: HSA/Core
LOGGED BY: Jennifer Shields (D&S)
FINISH DATE: 2/16/2016
GROUND ELEVATION: Approx. 642 feet
GPS COORDINATES: N33.21428, W97.21054
PROJECT NUMBER: 13-0278-12
5.0
Borehole Depth Description MC%
B1-11 CLAY (CH); medium stiff to stiff; dark brown; tracecalcareous nodules and roots
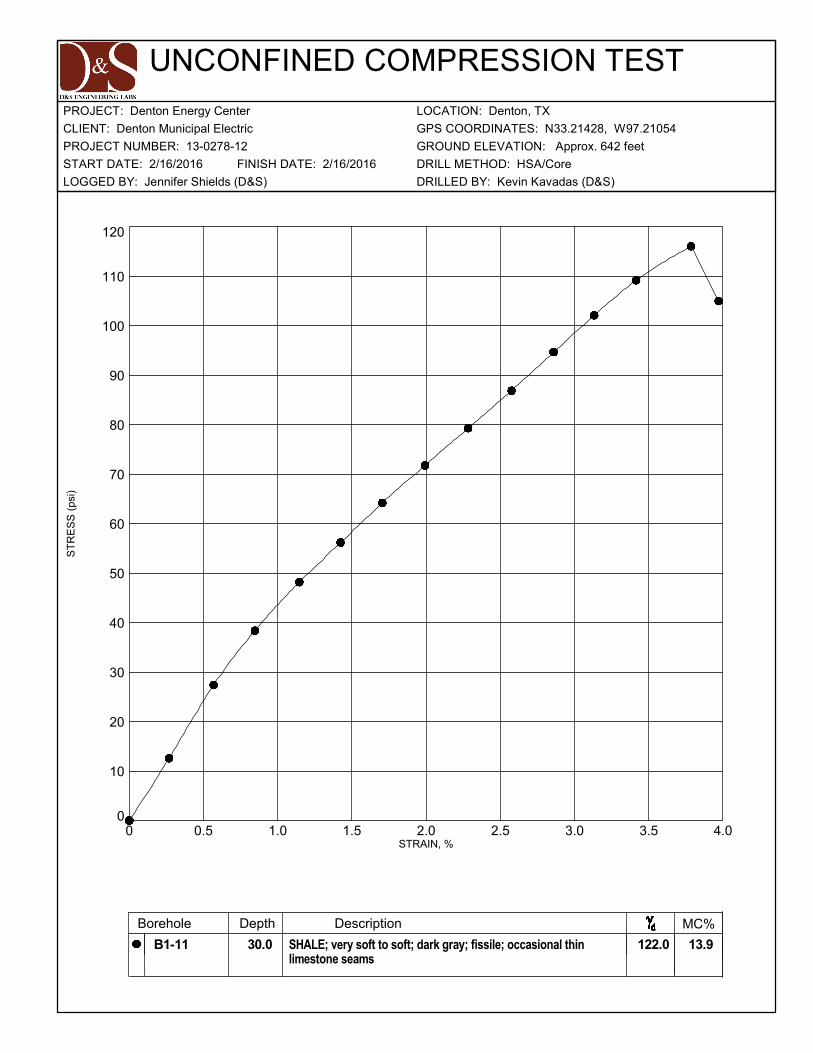
0
10
20
30
40
50
60
70
80
90
100
110
120
0 0.5 1.0 1.5 2.0 2.5 3.0 3.5 4.0
UNCONFINED COMPRESSION TEST
STRAIN, %
13.9 122.0
ST
RE
SS
(ps
i)
CLIENT: Denton Municipal Electric
LOCATION: Denton, TXPROJECT: Denton Energy Center
DRILLED BY: Kevin Kavadas (D&S)
START DATE: 2/16/2016 DRILL METHOD: HSA/Core
LOGGED BY: Jennifer Shields (D&S)
FINISH DATE: 2/16/2016
GROUND ELEVATION: Approx. 642 feet
GPS COORDINATES: N33.21428, W97.21054
PROJECT NUMBER: 13-0278-12
30.0
Borehole Depth Description MC%
B1-11 SHALE; very soft to soft; dark gray; fissile; occasional thinlimestone seams

0
2
4
6
8
10
12
14
16
18
20
22
24
26
0 4 8 12 16
UNCONFINED COMPRESSION TEST
STRAIN, %
23.5 104.2
ST
RE
SS
(ps
i)
CLIENT: Denton Municipal Electric
LOCATION: Denton, TXPROJECT: Denton Energy Center
DRILLED BY: Charles Ray Stephens (D&S)
START DATE: 3/3/2016 DRILL METHOD: Cont. Flight Auger
LOGGED BY: Jennifer Shields (D&S)
FINISH DATE: 3/3/2016
GROUND ELEVATION: Approx. 641 feet
GPS COORDINATES: N33.21407, W97.20947
PROJECT NUMBER: 13-0278-12
4.0
Borehole Depth Description MC%
B1-2 CLAY (CH); medium stiff to stiff; dark brown; tracecalcareous nodules
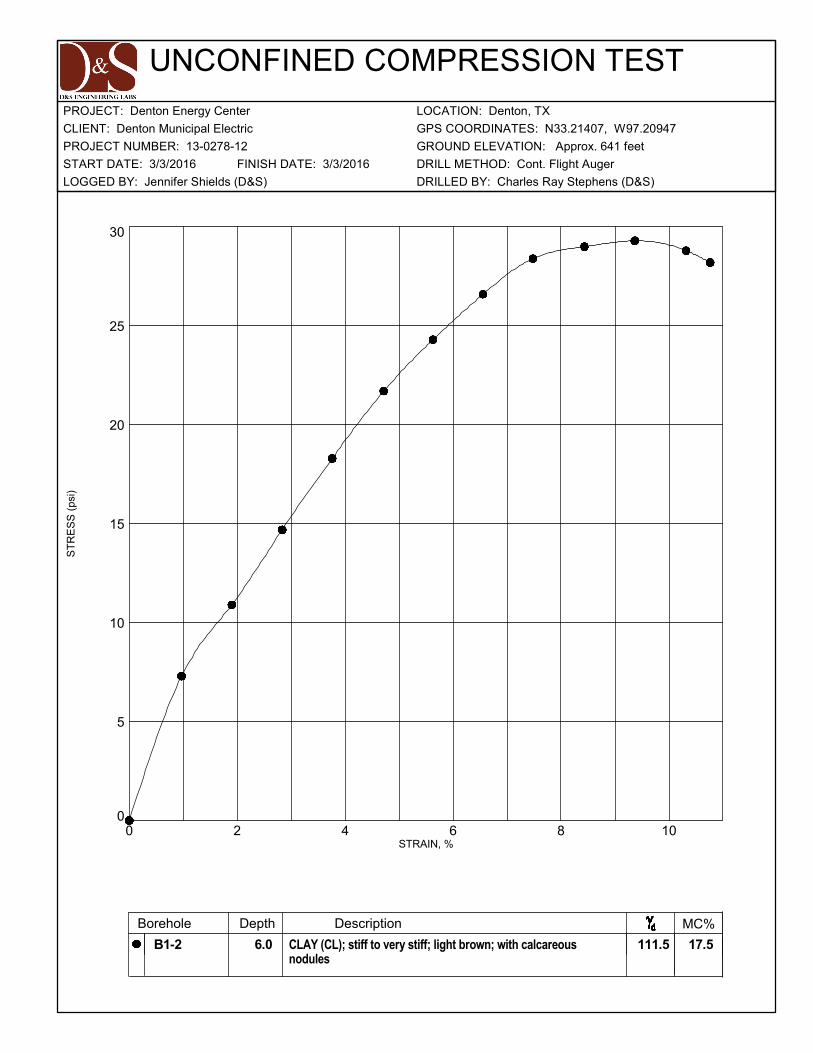
0
5
10
15
20
25
30
0 2 4 6 8 10
UNCONFINED COMPRESSION TEST
STRAIN, %
17.5 111.5
ST
RE
SS
(ps
i)
CLIENT: Denton Municipal Electric
LOCATION: Denton, TXPROJECT: Denton Energy Center
DRILLED BY: Charles Ray Stephens (D&S)
START DATE: 3/3/2016 DRILL METHOD: Cont. Flight Auger
LOGGED BY: Jennifer Shields (D&S)
FINISH DATE: 3/3/2016
GROUND ELEVATION: Approx. 641 feet
GPS COORDINATES: N33.21407, W97.20947
PROJECT NUMBER: 13-0278-12
6.0
Borehole Depth Description MC%
B1-2 CLAY (CL); stiff to very stiff; light brown; with calcareousnodules

0
10
20
30
40
50
60
70
80
0 1.0 2.0 3.0 4.0 5.0
UNCONFINED COMPRESSION TEST
STRAIN, %
13.6 121.6
ST
RE
SS
(ps
i)
CLIENT: Denton Municipal Electric
LOCATION: Denton, TXPROJECT: Denton Energy Center
DRILLED BY: Charles Ray Stephens (D&S)
START DATE: 3/4/2016 DRILL METHOD: Cont. Flight Auger
LOGGED BY: Ricky Ybarra (D&S)
FINISH DATE: 3/4/2016
GROUND ELEVATION: Approx. 642 feet
GPS COORDINATES: N33.21426, W97.20970
PROJECT NUMBER: 13-0278-12
20.0
Borehole Depth Description MC%
B1-3 SHALE; moderately weathered; very soft; gray; fissile; trace fossils

0
2
4
6
8
10
12
14
16
18
0 4 8 12 16
UNCONFINED COMPRESSION TEST
STRAIN, %
15.6 113.9
ST
RE
SS
(ps
i)
CLIENT: Denton Municipal Electric
LOCATION: Denton, TXPROJECT: Denton Energy Center
DRILLED BY: Charles Ray Stephens (D&S)
START DATE: 3/4/2016 DRILL METHOD: Cont. Flight Auger
LOGGED BY: Ricky Ybarra (D&S)
FINISH DATE: 3/4/2016
GROUND ELEVATION: Approx. 642 feet
GPS COORDINATES: N33.21426, W97.20970
PROJECT NUMBER: 13-0278-12
7.0
Borehole Depth Description MC%
B1-3 CLAY (CH); very stiff; light brown, gray; few calcareousnodules and limestone fragments
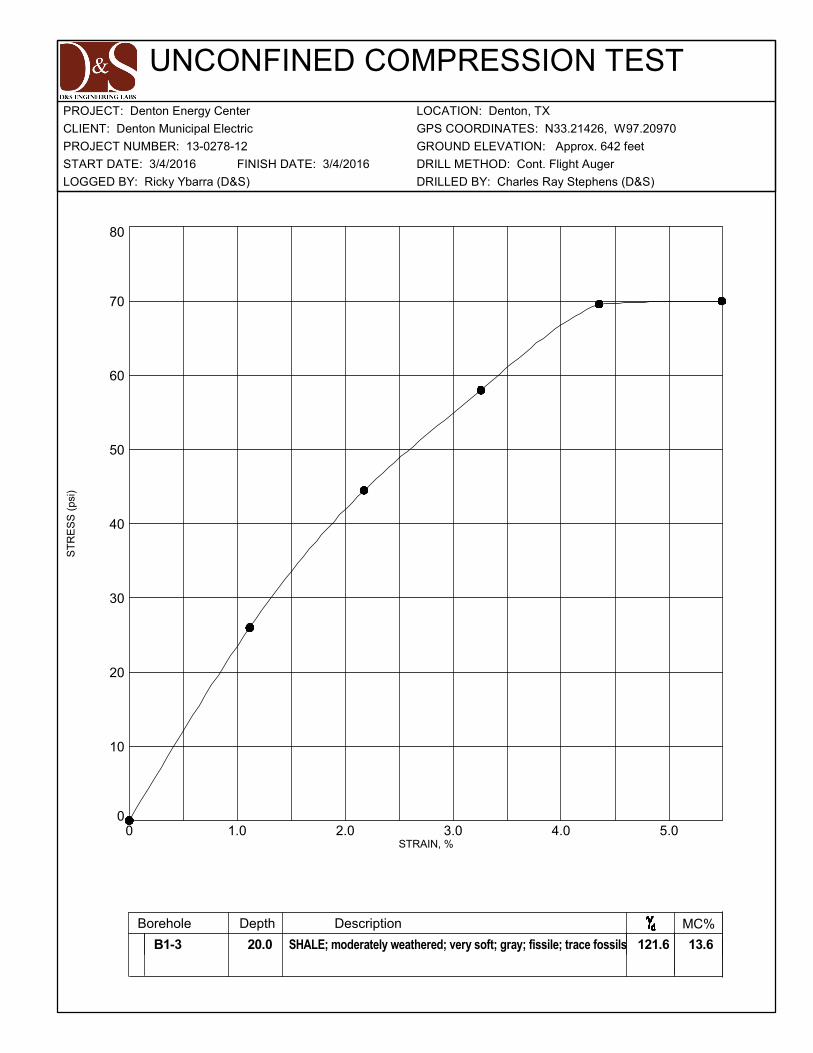
0
10
20
30
40
50
60
70
80
0 1.0 2.0 3.0 4.0 5.0
UNCONFINED COMPRESSION TEST
STRAIN, %
13.6 121.6
ST
RE
SS
(ps
i)
CLIENT: Denton Municipal Electric
LOCATION: Denton, TXPROJECT: Denton Energy Center
DRILLED BY: Charles Ray Stephens (D&S)
START DATE: 3/4/2016 DRILL METHOD: Cont. Flight Auger
LOGGED BY: Ricky Ybarra (D&S)
FINISH DATE: 3/4/2016
GROUND ELEVATION: Approx. 642 feet
GPS COORDINATES: N33.21426, W97.20970
PROJECT NUMBER: 13-0278-12
20.0
Borehole Depth Description MC%
B1-3 SHALE; moderately weathered; very soft; gray; fissile; trace fossils

0
2
4
6
8
10
12
14
16
18
20
0 4 8 12 16
UNCONFINED COMPRESSION TEST
STRAIN, %
24.8 102.0
ST
RE
SS
(ps
i)
CLIENT: Denton Municipal Electric
LOCATION: Denton, TXPROJECT: Denton Energy Center
DRILLED BY: Charles Ray Stephens (D&S)
START DATE: 3/3/2016 DRILL METHOD: Cont. Flight Auger
LOGGED BY: Jennifer Shields (D&S)
FINISH DATE: 3/3/2016
GROUND ELEVATION: Approx. 642 feet
GPS COORDINATES: N33.21463, W97.20977
PROJECT NUMBER: 13-0278-12
3.0
Borehole Depth Description MC%
B1-4 CLAY (CH); stiff; dark brown; trace calcareous nodules
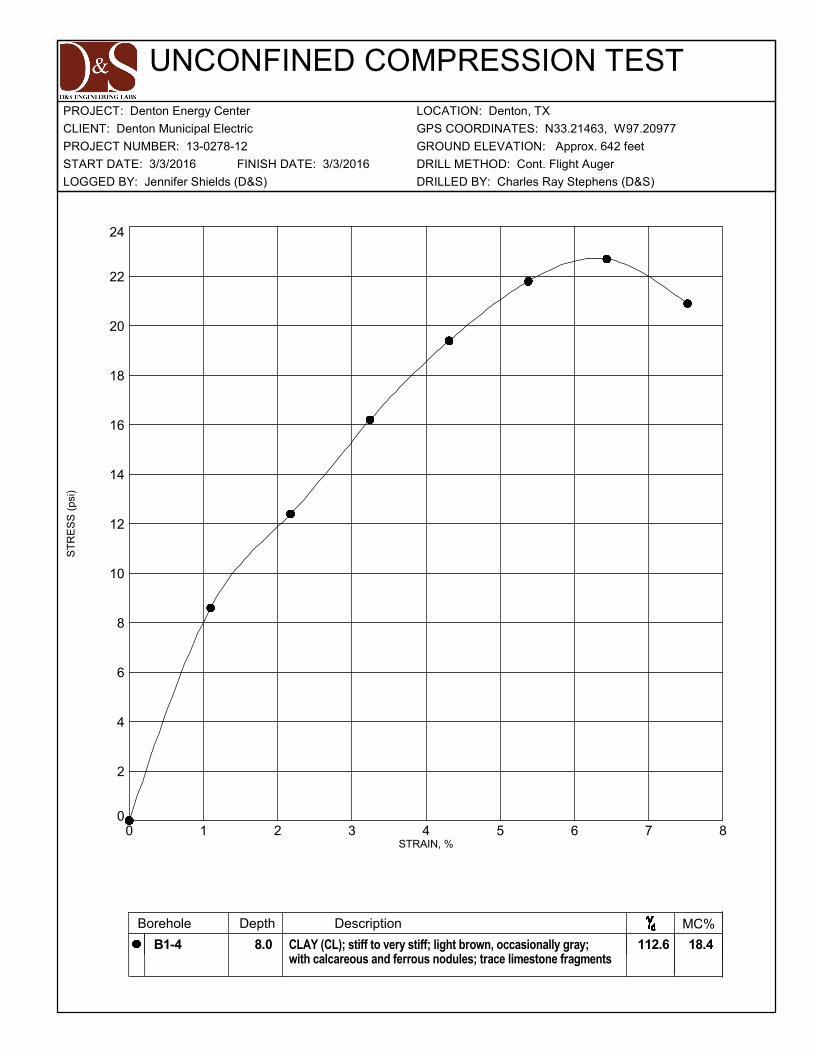
0
2
4
6
8
10
12
14
16
18
20
22
24
0 1 2 3 4 5 6 7 8
UNCONFINED COMPRESSION TEST
STRAIN, %
18.4 112.6
ST
RE
SS
(ps
i)
CLIENT: Denton Municipal Electric
LOCATION: Denton, TXPROJECT: Denton Energy Center
DRILLED BY: Charles Ray Stephens (D&S)
START DATE: 3/3/2016 DRILL METHOD: Cont. Flight Auger
LOGGED BY: Jennifer Shields (D&S)
FINISH DATE: 3/3/2016
GROUND ELEVATION: Approx. 642 feet
GPS COORDINATES: N33.21463, W97.20977
PROJECT NUMBER: 13-0278-12
8.0
Borehole Depth Description MC%
B1-4 CLAY (CL); stiff to very stiff; light brown, occasionally gray;with calcareous and ferrous nodules; trace limestone fragments

0
5
10
15
20
25
30
35
0 4 8 12 16
UNCONFINED COMPRESSION TEST
STRAIN, %
21.9 106.3
ST
RE
SS
(ps
i)
CLIENT: Denton Municipal Electric
LOCATION: Denton, TXPROJECT: Denton Energy Center
DRILLED BY: Charles Ray Stephens (D&S)
START DATE: 3/3/2016 DRILL METHOD: Cont. Flight Auger
LOGGED BY: Jennifer Shields (D&S)
FINISH DATE: 3/3/2016
GROUND ELEVATION: Approx. 642 feet
GPS COORDINATES: N33.21477, W97.21021
PROJECT NUMBER: 13-0278-12
3.0
Borehole Depth Description MC%
B1-5 CLAY (CH); stiff; dark brown; trace to some calcareousnodules
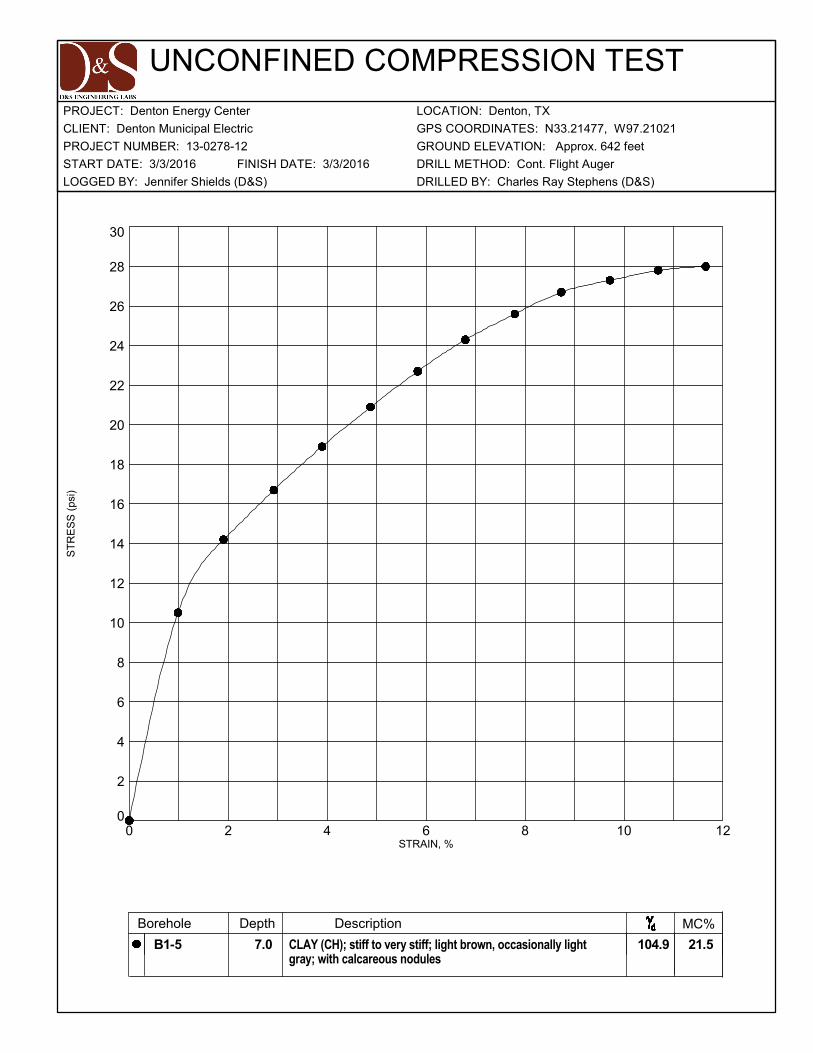
0
2
4
6
8
10
12
14
16
18
20
22
24
26
28
30
0 2 4 6 8 10 12
UNCONFINED COMPRESSION TEST
STRAIN, %
21.5 104.9
ST
RE
SS
(ps
i)
CLIENT: Denton Municipal Electric
LOCATION: Denton, TXPROJECT: Denton Energy Center
DRILLED BY: Charles Ray Stephens (D&S)
START DATE: 3/3/2016 DRILL METHOD: Cont. Flight Auger
LOGGED BY: Jennifer Shields (D&S)
FINISH DATE: 3/3/2016
GROUND ELEVATION: Approx. 642 feet
GPS COORDINATES: N33.21477, W97.21021
PROJECT NUMBER: 13-0278-12
7.0
Borehole Depth Description MC%
B1-5 CLAY (CH); stiff to very stiff; light brown, occasionally lightgray; with calcareous nodules

0
2
4
6
8
10
12
14
16
18
20
22
0 1.0 2.0 3.0 4.0 5.0 6.0
UNCONFINED COMPRESSION TEST
STRAIN, %
21.2 107.5
ST
RE
SS
(ps
i)
CLIENT: Denton Municipal Electric
LOCATION: Denton, TXPROJECT: Denton Energy Center
DRILLED BY: Charles Ray Stephens (D&S)
START DATE: 3/3/2016 DRILL METHOD: Cont. Flight Auger
LOGGED BY: Jennifer Shields (D&S)
FINISH DATE: 3/3/2016
GROUND ELEVATION: Approx. 642 feet
GPS COORDINATES: N33.21477, W97.21021
PROJECT NUMBER: 13-0278-12
20.0
Borehole Depth Description MC%
B1-5 SHALE; highly weathered; very soft; gray, light brown;fissile; occasional very thin limestone seams; trace fossils

0
2
4
6
8
10
12
14
16
18
20
0 2 4 6 8 10 12 14 16
UNCONFINED COMPRESSION TEST
STRAIN, %
27.9 96.6
ST
RE
SS
(ps
i)
CLIENT: Denton Municipal Electric
LOCATION: Denton, TXPROJECT: Denton Energy Center
DRILLED BY: Charles Ray Stephens (D&S)
START DATE: 2/19/2016 DRILL METHOD: Cont. Flight Auger
LOGGED BY: Patritzia Kolarova (D&S)
FINISH DATE: 2/19/2016
GROUND ELEVATION: Approx. 642 feet
GPS COORDINATES: N33.21445, W97.21007
PROJECT NUMBER: 13-0278-12
4.0
Borehole Depth Description MC%
B1-6 CLAY (CH); stiff; dark brown, brown
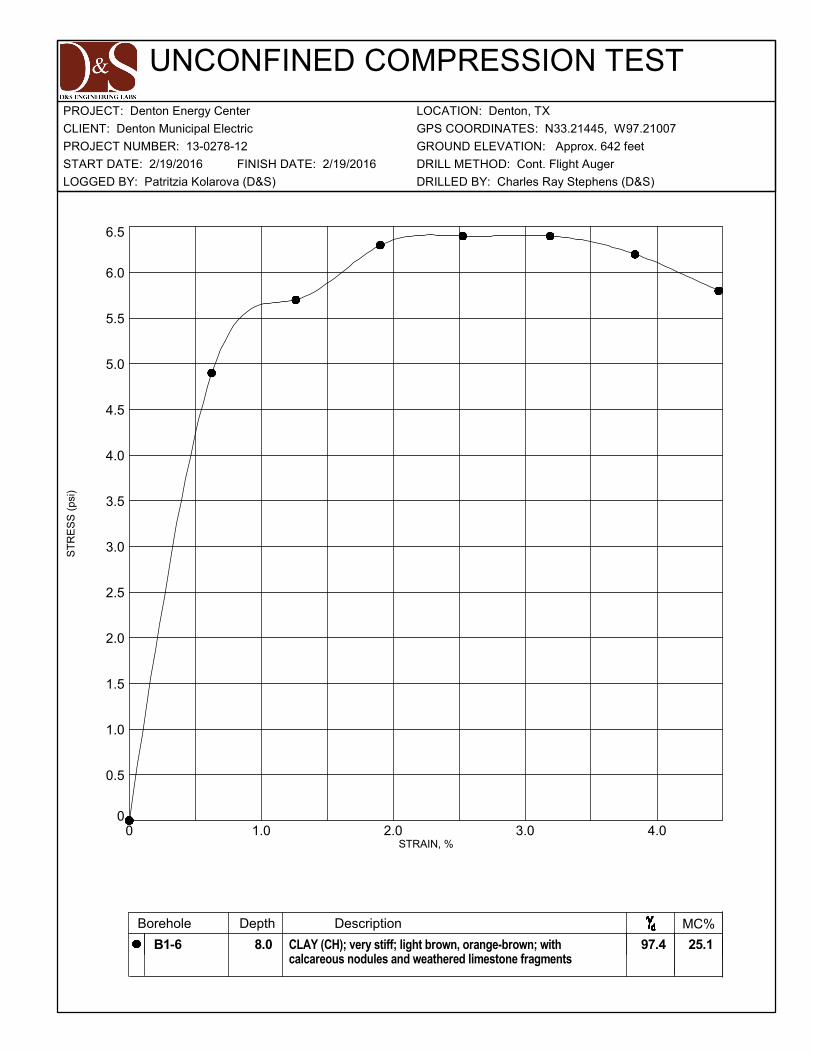
0
0.5
1.0
1.5
2.0
2.5
3.0
3.5
4.0
4.5
5.0
5.5
6.0
6.5
0 1.0 2.0 3.0 4.0
UNCONFINED COMPRESSION TEST
STRAIN, %
25.1 97.4
ST
RE
SS
(ps
i)
CLIENT: Denton Municipal Electric
LOCATION: Denton, TXPROJECT: Denton Energy Center
DRILLED BY: Charles Ray Stephens (D&S)
START DATE: 2/19/2016 DRILL METHOD: Cont. Flight Auger
LOGGED BY: Patritzia Kolarova (D&S)
FINISH DATE: 2/19/2016
GROUND ELEVATION: Approx. 642 feet
GPS COORDINATES: N33.21445, W97.21007
PROJECT NUMBER: 13-0278-12
8.0
Borehole Depth Description MC%
B1-6 CLAY (CH); very stiff; light brown, orange-brown; withcalcareous nodules and weathered limestone fragments
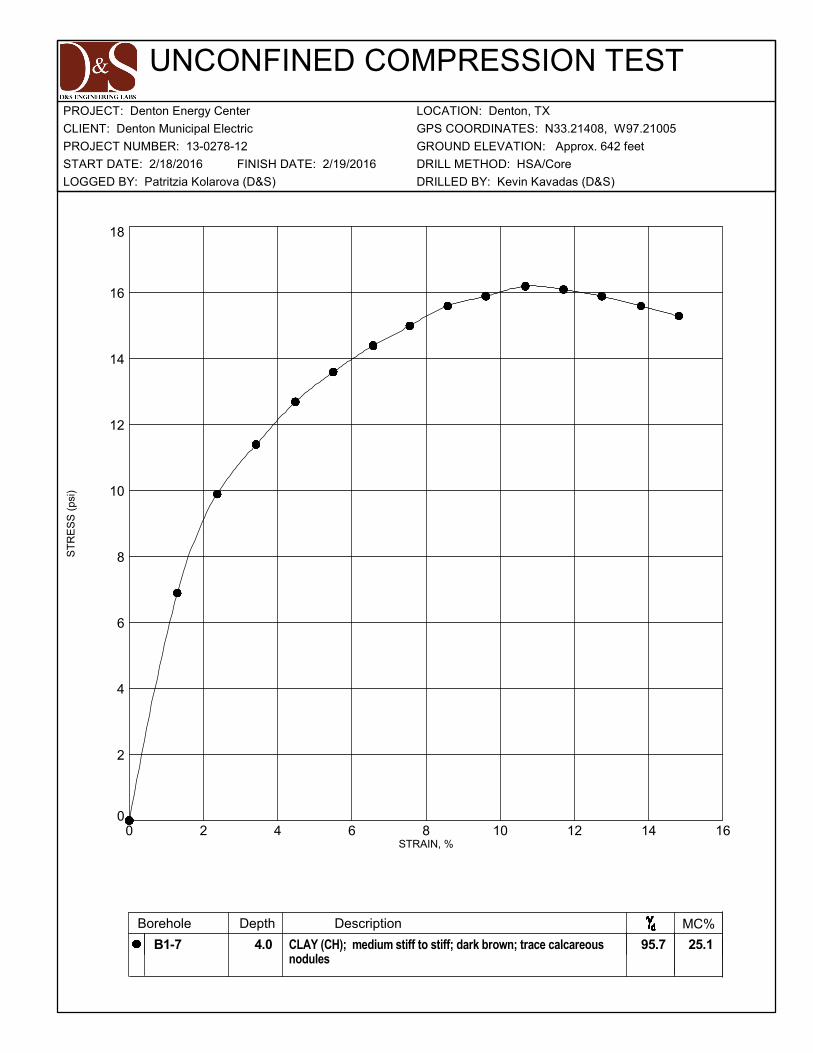
0
2
4
6
8
10
12
14
16
18
0 2 4 6 8 10 12 14 16
UNCONFINED COMPRESSION TEST
STRAIN, %
25.1 95.7
ST
RE
SS
(ps
i)
CLIENT: Denton Municipal Electric
LOCATION: Denton, TXPROJECT: Denton Energy Center
DRILLED BY: Kevin Kavadas (D&S)
START DATE: 2/18/2016 DRILL METHOD: HSA/Core
LOGGED BY: Patritzia Kolarova (D&S)
FINISH DATE: 2/19/2016
GROUND ELEVATION: Approx. 642 feet
GPS COORDINATES: N33.21408, W97.21005
PROJECT NUMBER: 13-0278-12
4.0
Borehole Depth Description MC%
B1-7 CLAY (CH); medium stiff to stiff; dark brown; trace calcareousnodules

0
20
40
60
80
100
120
140
160
180
0 0.5 1.0 1.5 2.0 2.5 3.0 3.5
UNCONFINED COMPRESSION TEST
STRAIN, %
15.0 121.7
ST
RE
SS
(ps
i)
CLIENT: Denton Municipal Electric
LOCATION: Denton, TXPROJECT: Denton Energy Center
DRILLED BY: Kevin Kavadas (D&S)
START DATE: 2/18/2016 DRILL METHOD: HSA/Core
LOGGED BY: Patritzia Kolarova (D&S)
FINISH DATE: 2/19/2016
GROUND ELEVATION: Approx. 642 feet
GPS COORDINATES: N33.21408, W97.21005
PROJECT NUMBER: 13-0278-12
23.9
Borehole Depth Description MC%
B1-7 SHALE; very soft to soft; dark gray; fissile; occasionalthin limestone seams
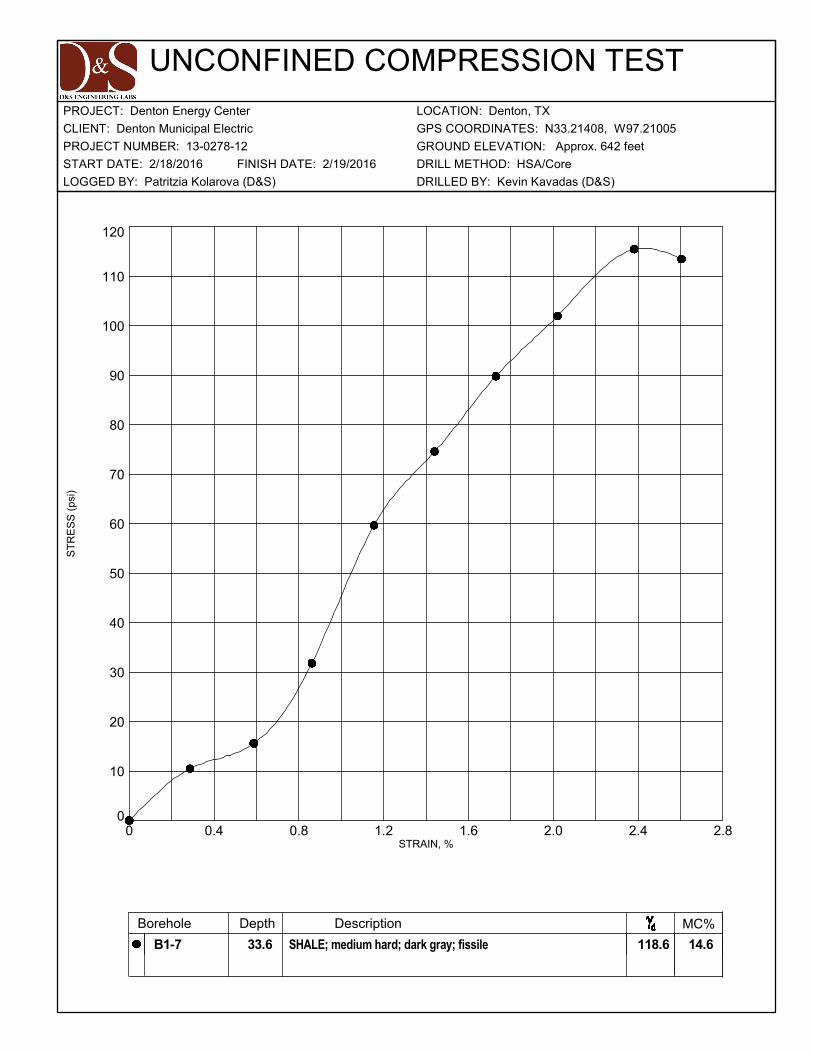
0
10
20
30
40
50
60
70
80
90
100
110
120
0 0.4 0.8 1.2 1.6 2.0 2.4 2.8
UNCONFINED COMPRESSION TEST
STRAIN, %
14.6 118.6
ST
RE
SS
(ps
i)
CLIENT: Denton Municipal Electric
LOCATION: Denton, TXPROJECT: Denton Energy Center
DRILLED BY: Kevin Kavadas (D&S)
START DATE: 2/18/2016 DRILL METHOD: HSA/Core
LOGGED BY: Patritzia Kolarova (D&S)
FINISH DATE: 2/19/2016
GROUND ELEVATION: Approx. 642 feet
GPS COORDINATES: N33.21408, W97.21005
PROJECT NUMBER: 13-0278-12
33.6
Borehole Depth Description MC%
B1-7 SHALE; medium hard; dark gray; fissile

0
2
4
6
8
10
12
14
16
18
20
22
0 2 4 6 8 10 12 14
UNCONFINED COMPRESSION TEST
STRAIN, %
23.8 98.8
ST
RE
SS
(ps
i)
CLIENT: Denton Municipal Electric
LOCATION: Denton, TXPROJECT: Denton Energy Center
DRILLED BY: Andrew Gibson (D&S)
START DATE: 2/18/2016 DRILL METHOD: Hollow Stem Flight Auger
LOGGED BY: Jennifer Shields (D&S)
FINISH DATE: 2/18/2016
GROUND ELEVATION: Approx. 642 feet
GPS COORDINATES: N33.21424, W97.21018
PROJECT NUMBER: 13-0278-12
2.0
Borehole Depth Description MC%
B1-8 CLAY (CH); stiff; dark brown; trace calcareous nodules

0
2
4
6
8
10
12
14
16
18
20
22
24
26
28
30
0 2 4 6 8 10 12 14 16
UNCONFINED COMPRESSION TEST
STRAIN, %
24.3 97.6
ST
RE
SS
(ps
i)
CLIENT: Denton Municipal Electric
LOCATION: Denton, TXPROJECT: Denton Energy Center
DRILLED BY: Andrew Gibson (D&S)
START DATE: 2/18/2016 DRILL METHOD: Hollow Stem Flight Auger
LOGGED BY: Jennifer Shields (D&S)
FINISH DATE: 2/18/2016
GROUND ELEVATION: Approx. 642 feet
GPS COORDINATES: N33.21424, W97.21018
PROJECT NUMBER: 13-0278-12
5.0
Borehole Depth Description MC%
B1-8 CLAY (CH); stiff to very stiff; orange-brown, occasionallydark brown

0
10
20
30
40
50
60
70
80
90
0 1.0 2.0 3.0 4.0
UNCONFINED COMPRESSION TEST
STRAIN, %
15.7 117.8
ST
RE
SS
(ps
i)
CLIENT: Denton Municipal Electric
LOCATION: Denton, TXPROJECT: Denton Energy Center
DRILLED BY: Andrew Gibson (D&S)
START DATE: 2/18/2016 DRILL METHOD: Hollow Stem Flight Auger
LOGGED BY: Jennifer Shields (D&S)
FINISH DATE: 2/18/2016
GROUND ELEVATION: Approx. 642 feet
GPS COORDINATES: N33.21424, W97.21018
PROJECT NUMBER: 13-0278-12
19.0
Borehole Depth Description MC%
B1-8 SHALE; highly weathered; very soft; light brown to dark gray;fissile
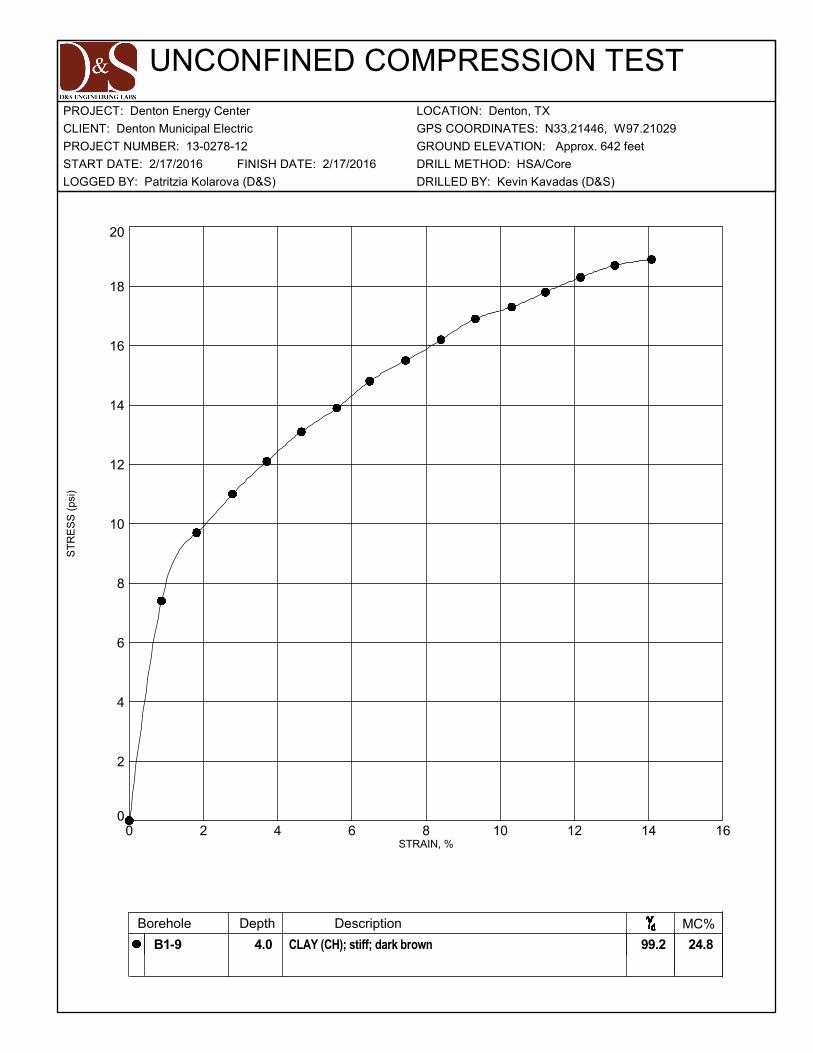
0
2
4
6
8
10
12
14
16
18
20
0 2 4 6 8 10 12 14 16
UNCONFINED COMPRESSION TEST
STRAIN, %
24.8 99.2
ST
RE
SS
(ps
i)
CLIENT: Denton Municipal Electric
LOCATION: Denton, TXPROJECT: Denton Energy Center
DRILLED BY: Kevin Kavadas (D&S)
START DATE: 2/17/2016 DRILL METHOD: HSA/Core
LOGGED BY: Patritzia Kolarova (D&S)
FINISH DATE: 2/17/2016
GROUND ELEVATION: Approx. 642 feet
GPS COORDINATES: N33.21446, W97.21029
PROJECT NUMBER: 13-0278-12
4.0
Borehole Depth Description MC%
B1-9 CLAY (CH); stiff; dark brown
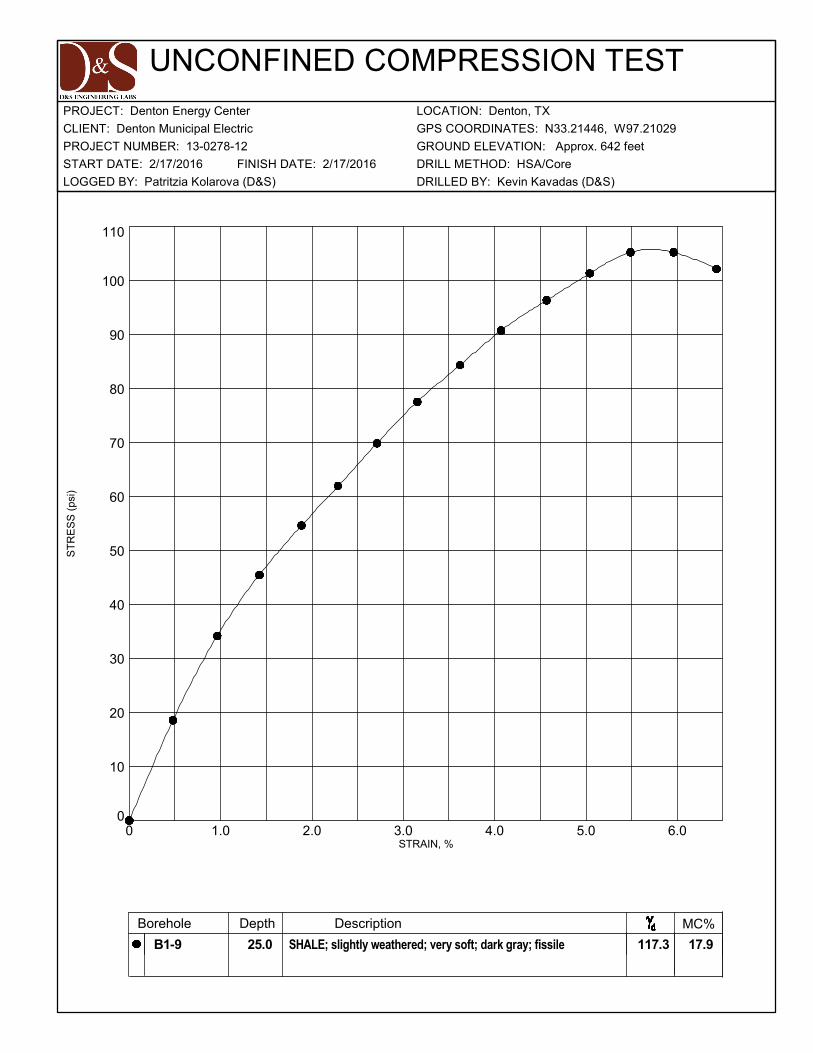
0
10
20
30
40
50
60
70
80
90
100
110
0 1.0 2.0 3.0 4.0 5.0 6.0
UNCONFINED COMPRESSION TEST
STRAIN, %
17.9 117.3
ST
RE
SS
(ps
i)
CLIENT: Denton Municipal Electric
LOCATION: Denton, TXPROJECT: Denton Energy Center
DRILLED BY: Kevin Kavadas (D&S)
START DATE: 2/17/2016 DRILL METHOD: HSA/Core
LOGGED BY: Patritzia Kolarova (D&S)
FINISH DATE: 2/17/2016
GROUND ELEVATION: Approx. 642 feet
GPS COORDINATES: N33.21446, W97.21029
PROJECT NUMBER: 13-0278-12
25.0
Borehole Depth Description MC%
B1-9 SHALE; slightly weathered; very soft; dark gray; fissile
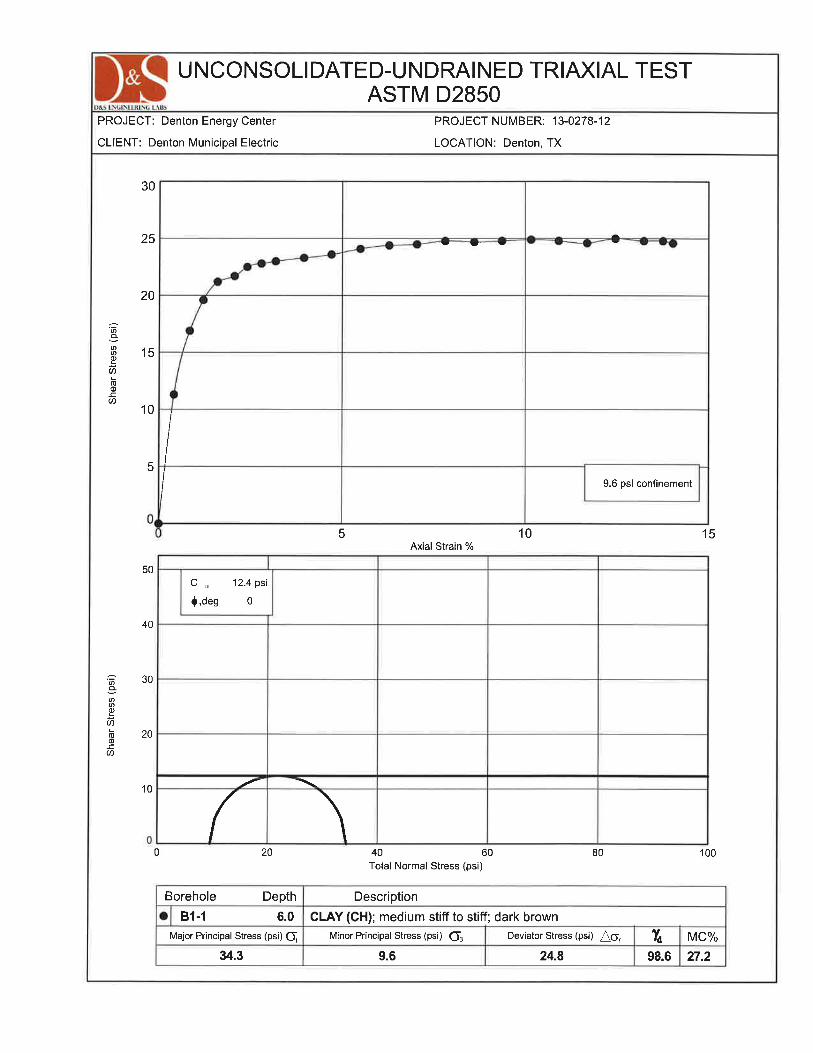
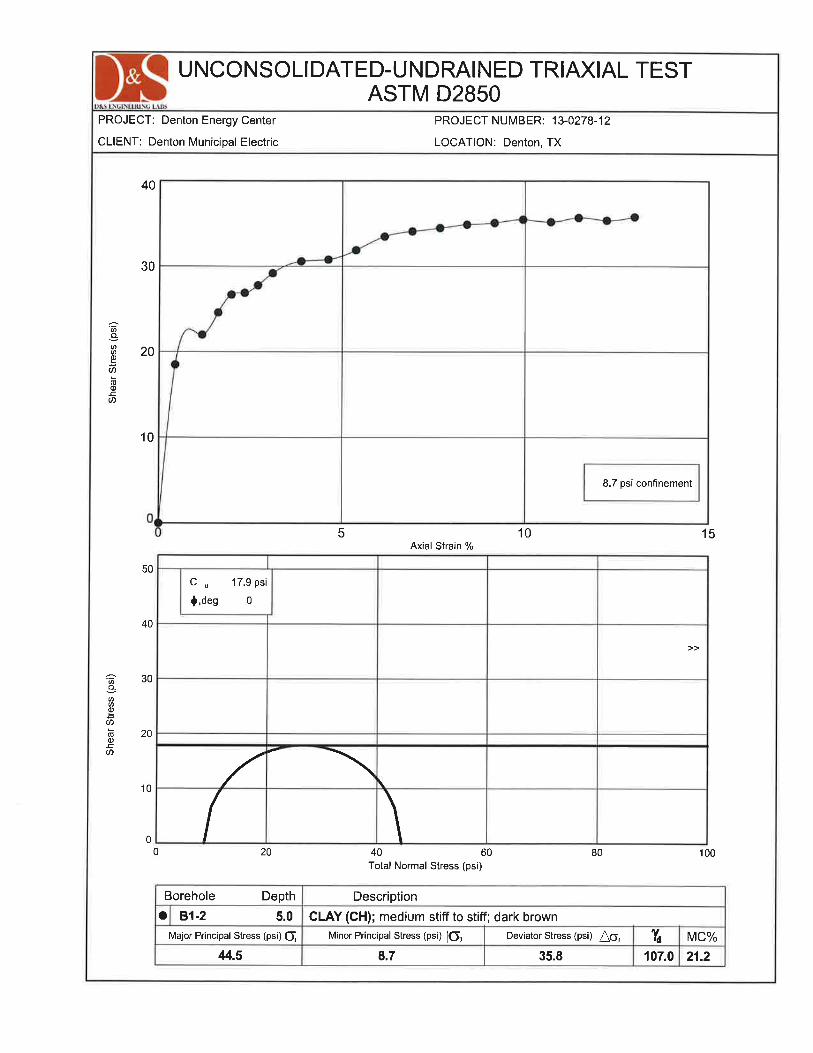
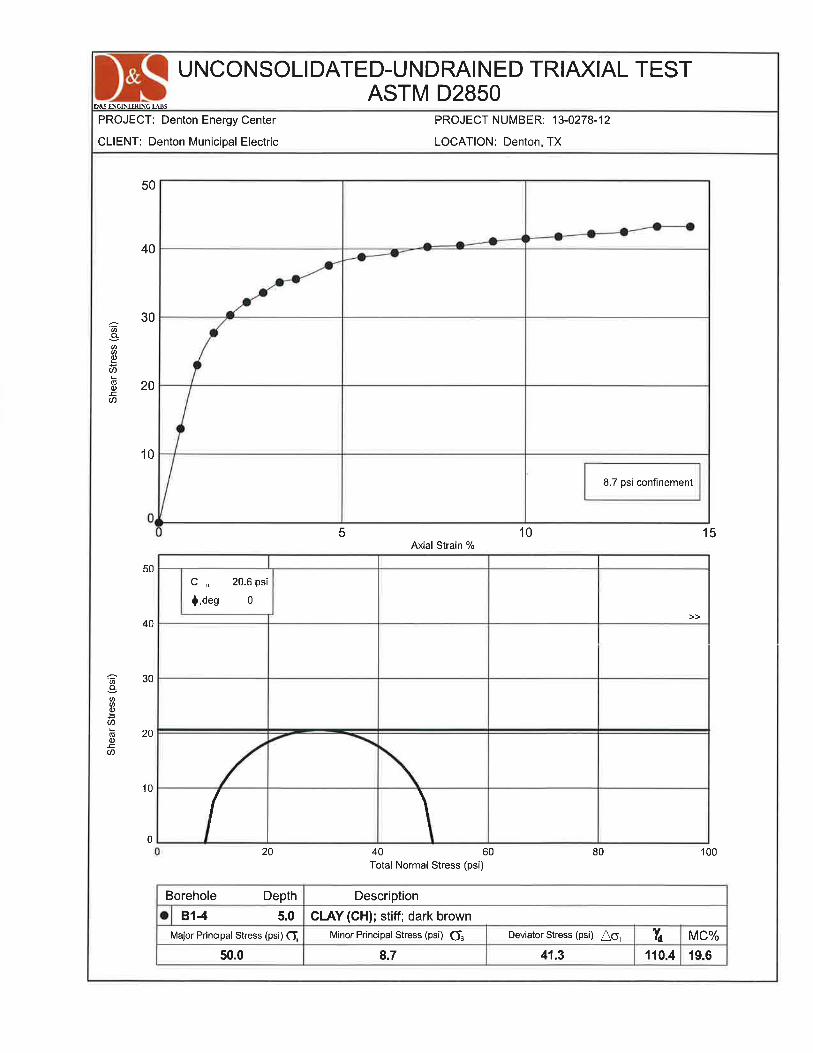
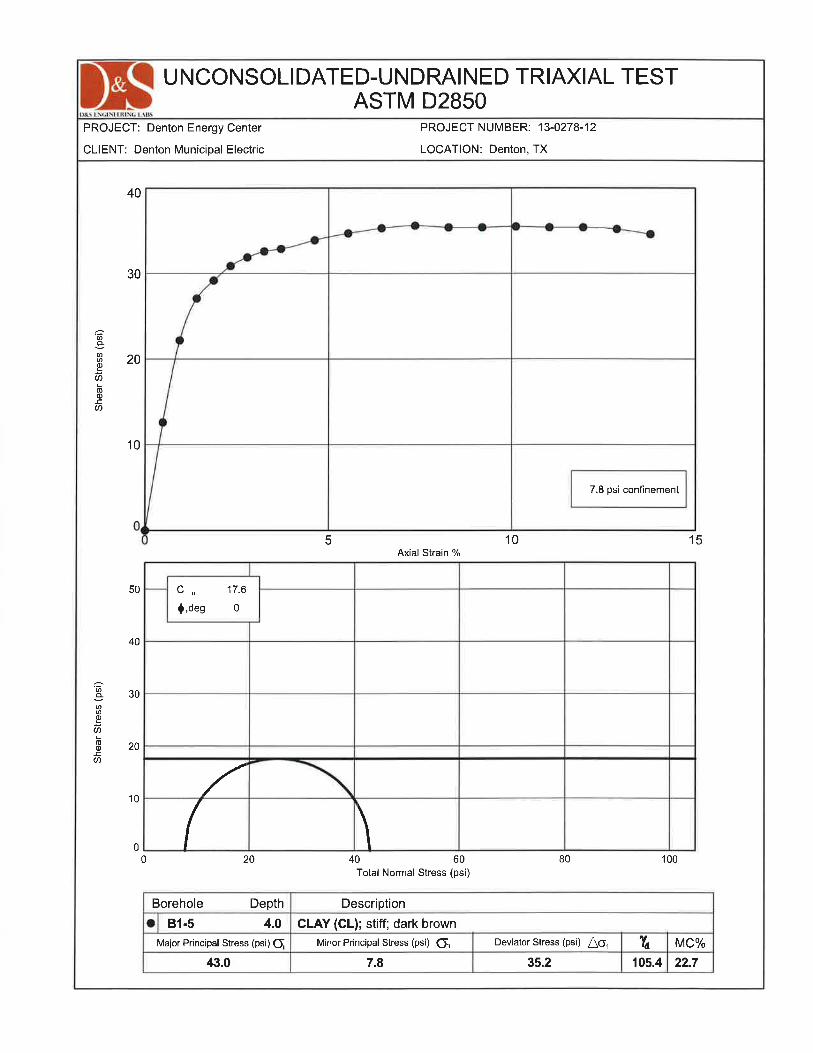
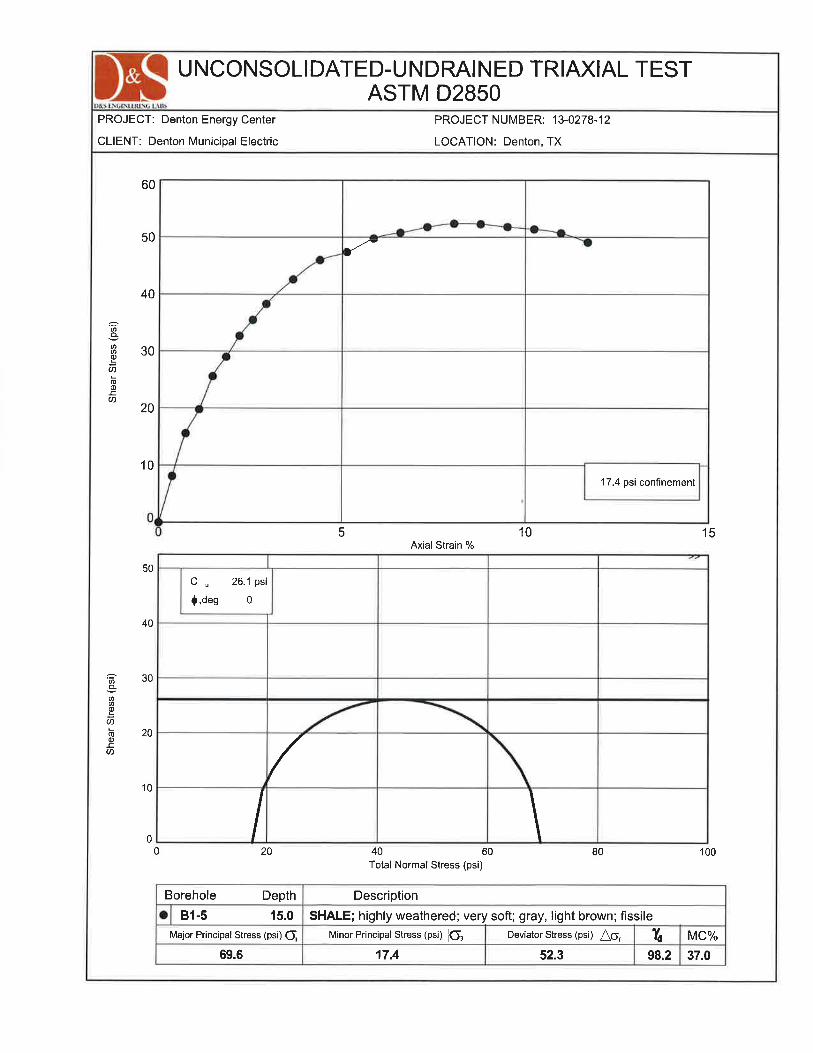

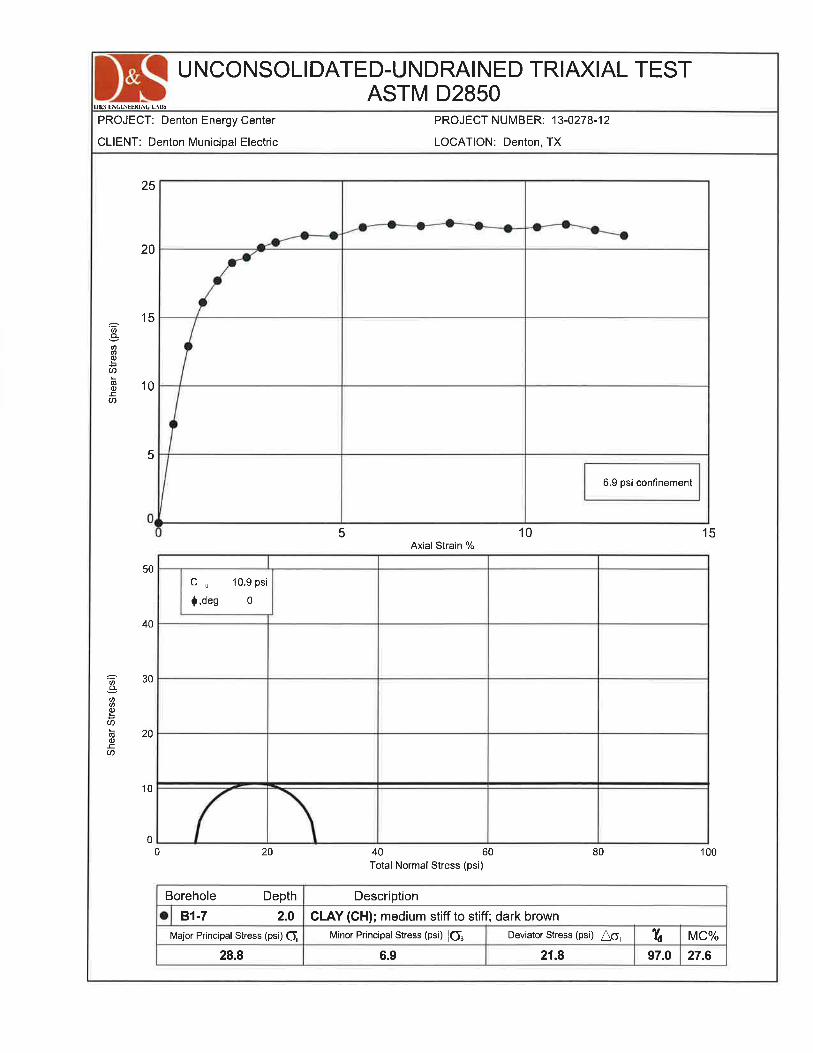
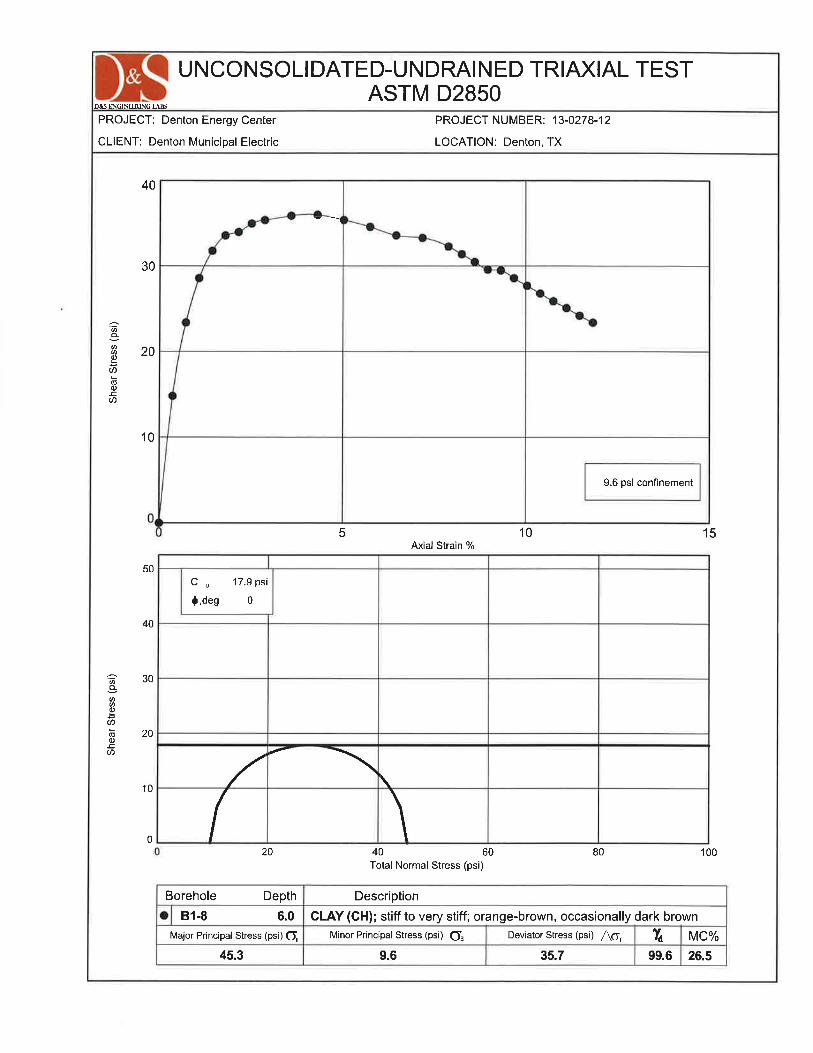
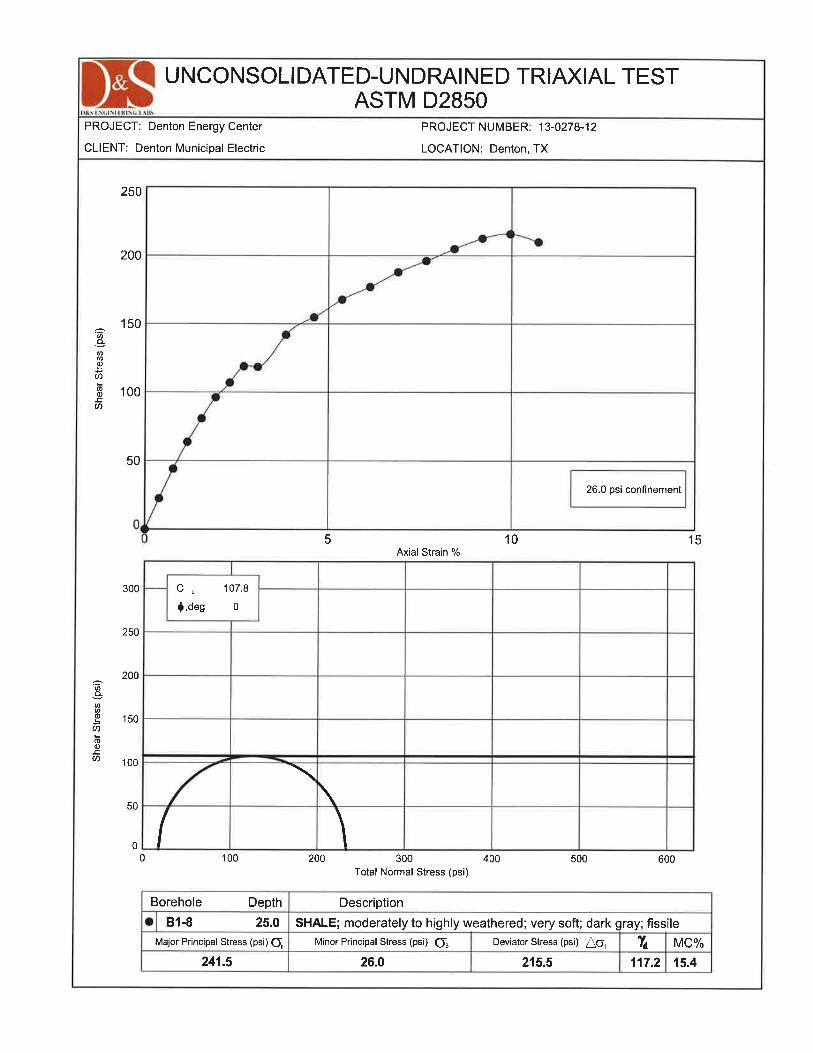
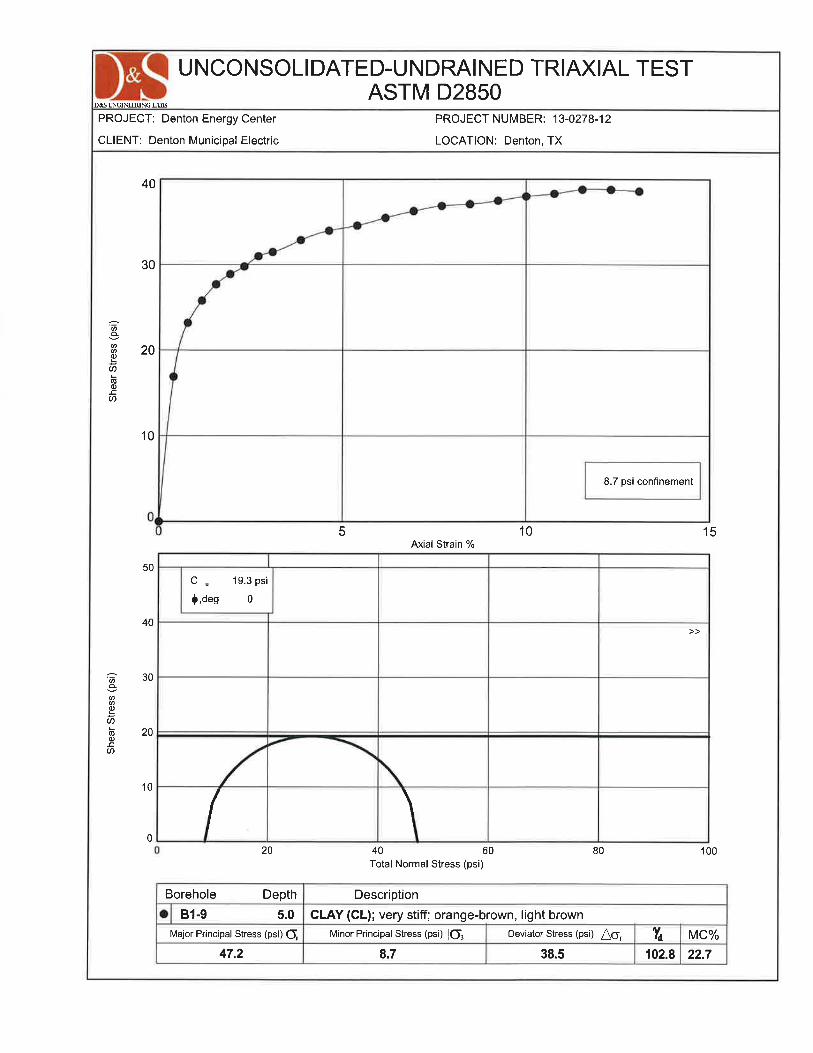
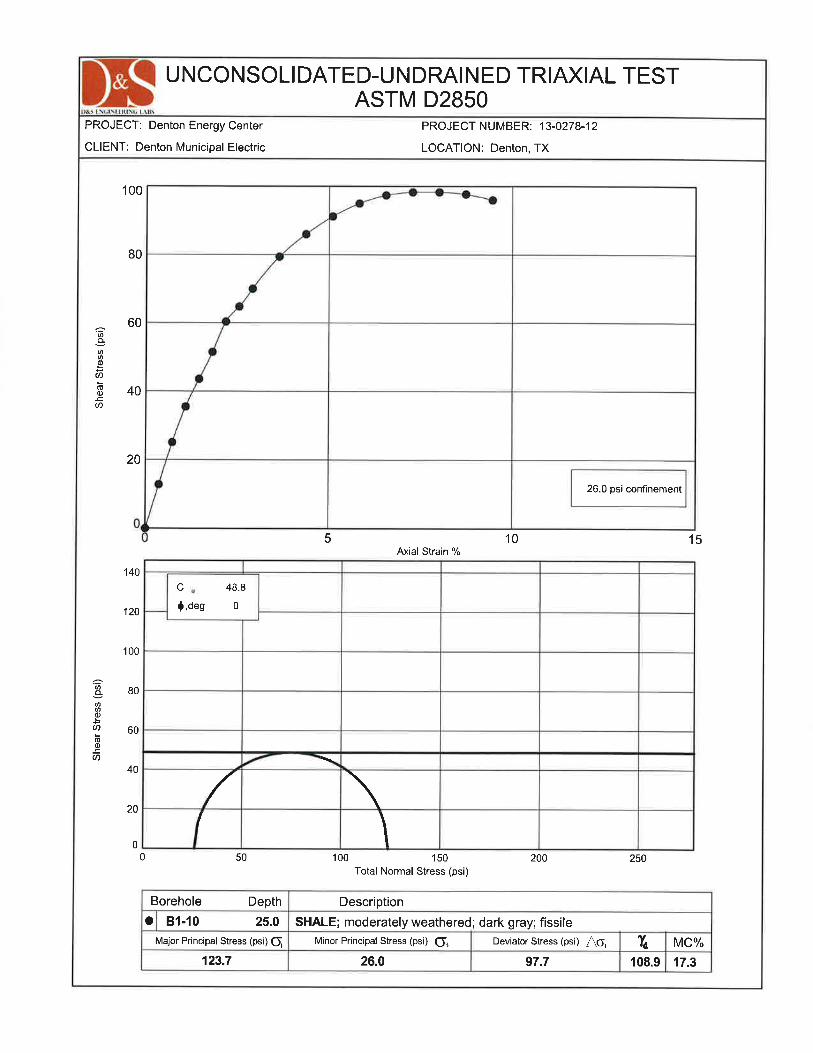
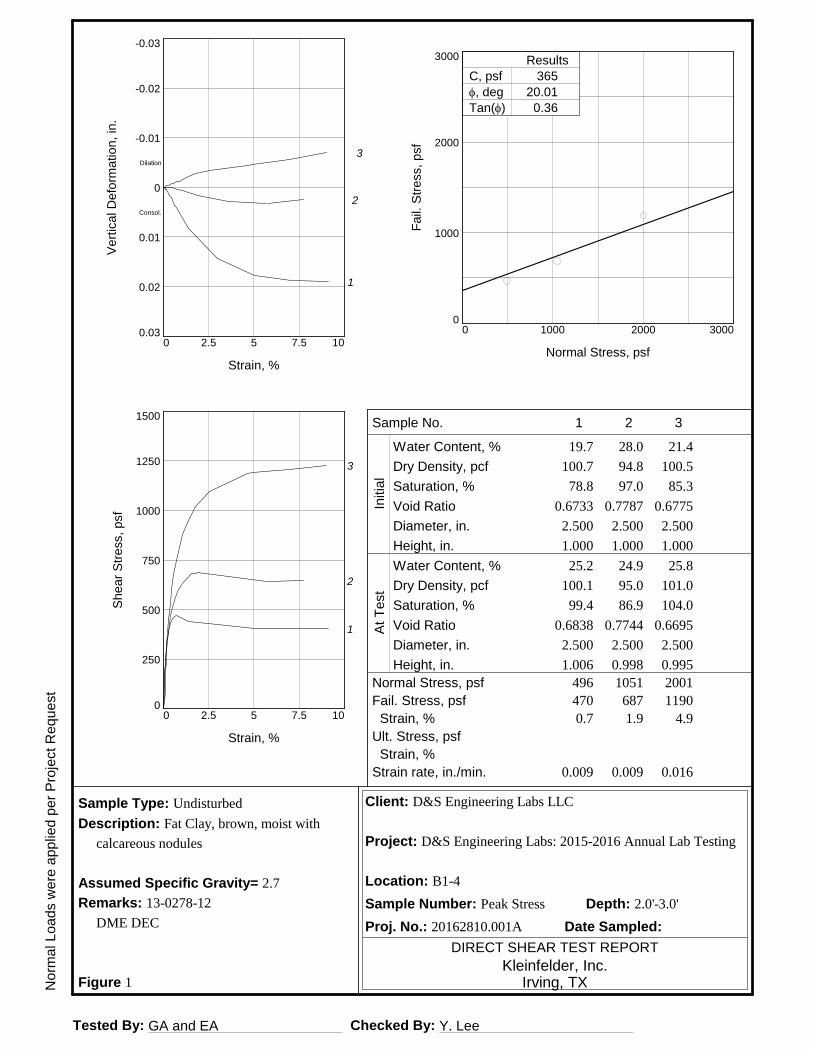
Tested By: GA and EA Checked By: Y. Lee
No
rma
lL
oa
ds
we
rea
pp
lied
pe
rP
roje
ctR
eq
ue
st
DIRECT SHEAR TEST REPORT
Kleinfelder, Inc.Irving, TX
Client: D&S Engineering Labs LLC
Project: D&S Engineering Labs: 2015-2016 Annual Lab Testing
Location: B1-4
Sample Number: Peak Stress Depth: 2.0'-3.0'
Proj. No.: 20162810.001A Date Sampled:
Sample Type: Undisturbed
Description: Fat Clay, brown, moist with
calcareous nodules
Assumed Specific Gravity= 2.7
Remarks: 13-0278-12
DME DEC
Figure 1
Sample No.
Water Content, %
Dry Density, pcf
Saturation, %
Void Ratio
Diameter, in.
Height, in.
Water Content, %
Dry Density, pcf
Saturation, %
Void Ratio
Diameter, in.
Height, in.
Normal Stress, psf
Fail. Stress, psf
Strain, %
Ult. Stress, psf
Strain, %
Strain rate, in./min.
Initia
lA
tT
est
Sh
ea
rS
tre
ss,
psf
0
250
500
750
1000
1250
1500
Strain, %
0 2.5 5 7.5 10
1
2
3
Ve
rtic
alD
efo
rma
tio
n,
in.
0.03
0.02
0.01
0
-0.01
-0.02
-0.03
Strain, %
0 2.5 5 7.5 10
Dilation
Consol.
1
2
3
Fa
il.S
tre
ss,
psf
0
1000
2000
3000
Normal Stress, psf
0 1000 2000 3000
C, psf
, deg
Tan()
Results
365
20.01
0.36
1
19.7
100.7
78.8
0.6733
2.500
1.000
25.2
100.1
99.4
0.6838
2.500
1.006
496
470
0.7
0.009
2
28.0
94.8
97.0
0.7787
2.500
1.000
24.9
95.0
86.9
0.7744
2.500
0.998
1051
687
1.9
0.009
3
21.4
100.5
85.3
0.6775
2.500
1.000
25.8
101.0
104.0
0.6695
2.500
0.995
2001
1190
4.9
0.016
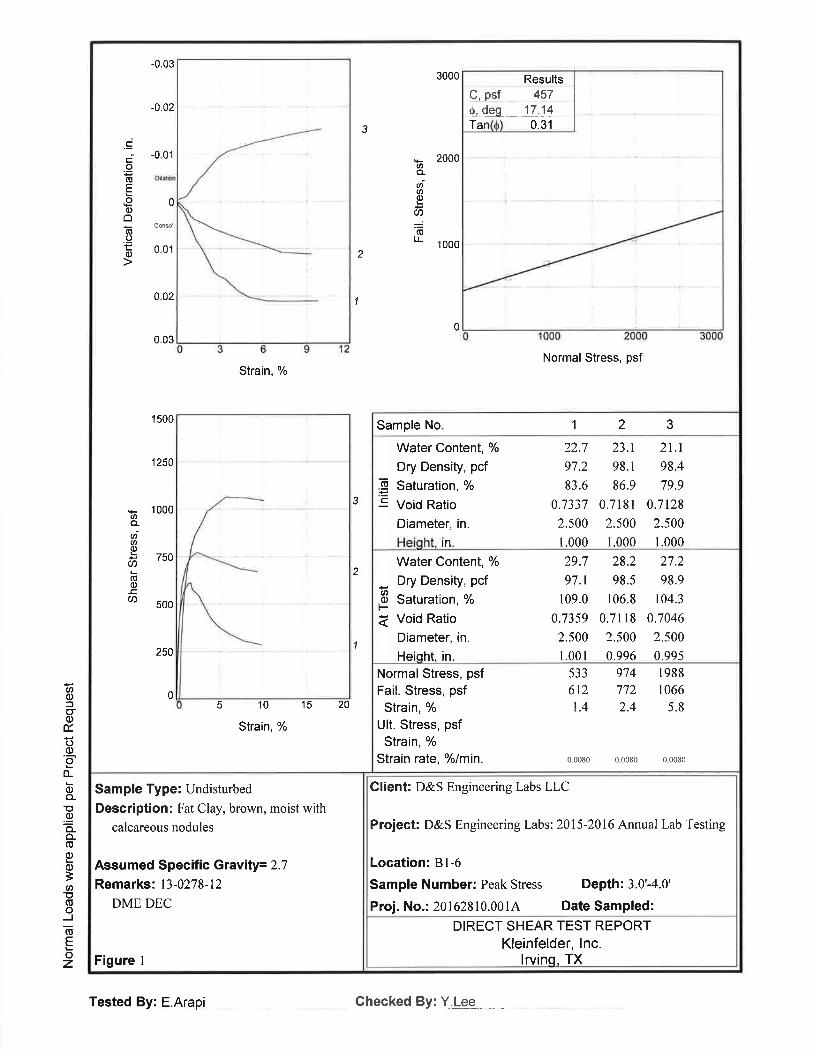
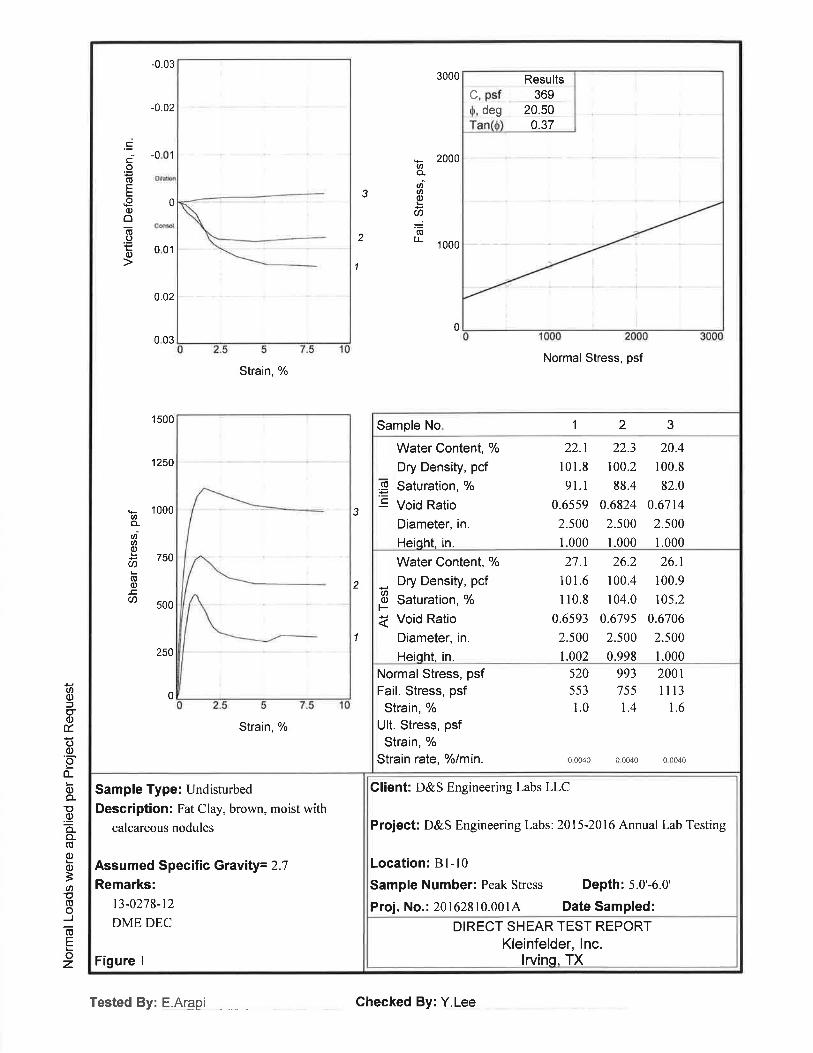
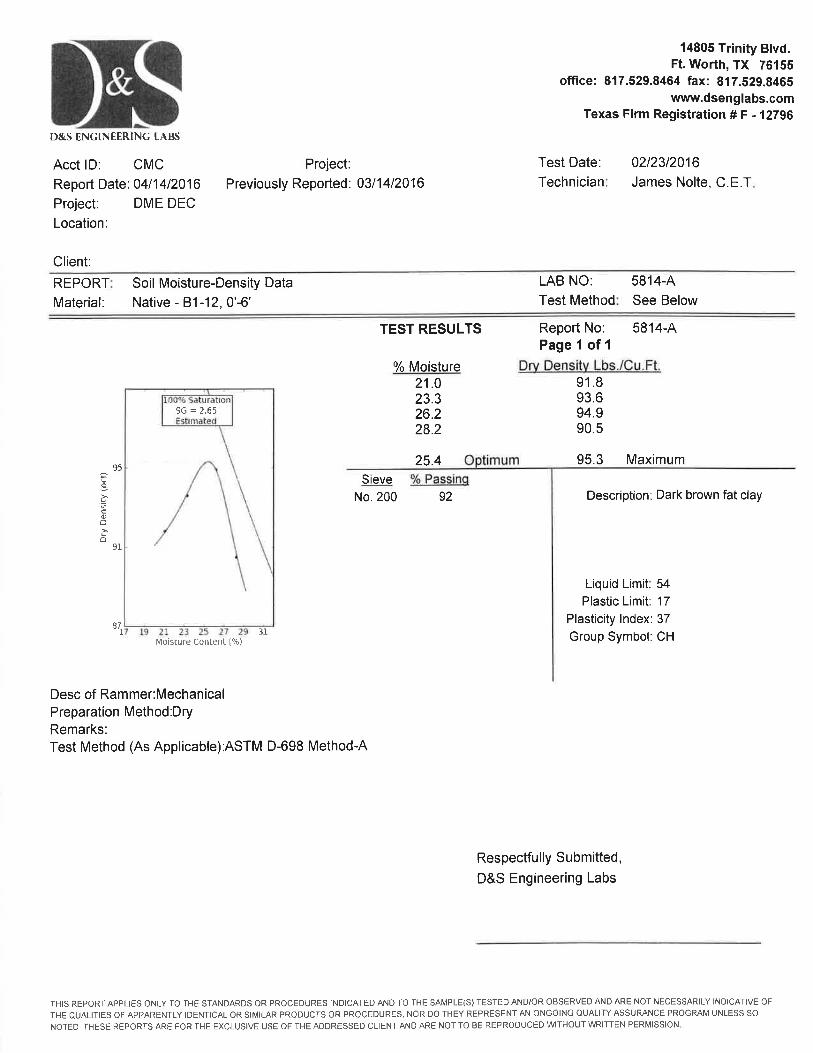
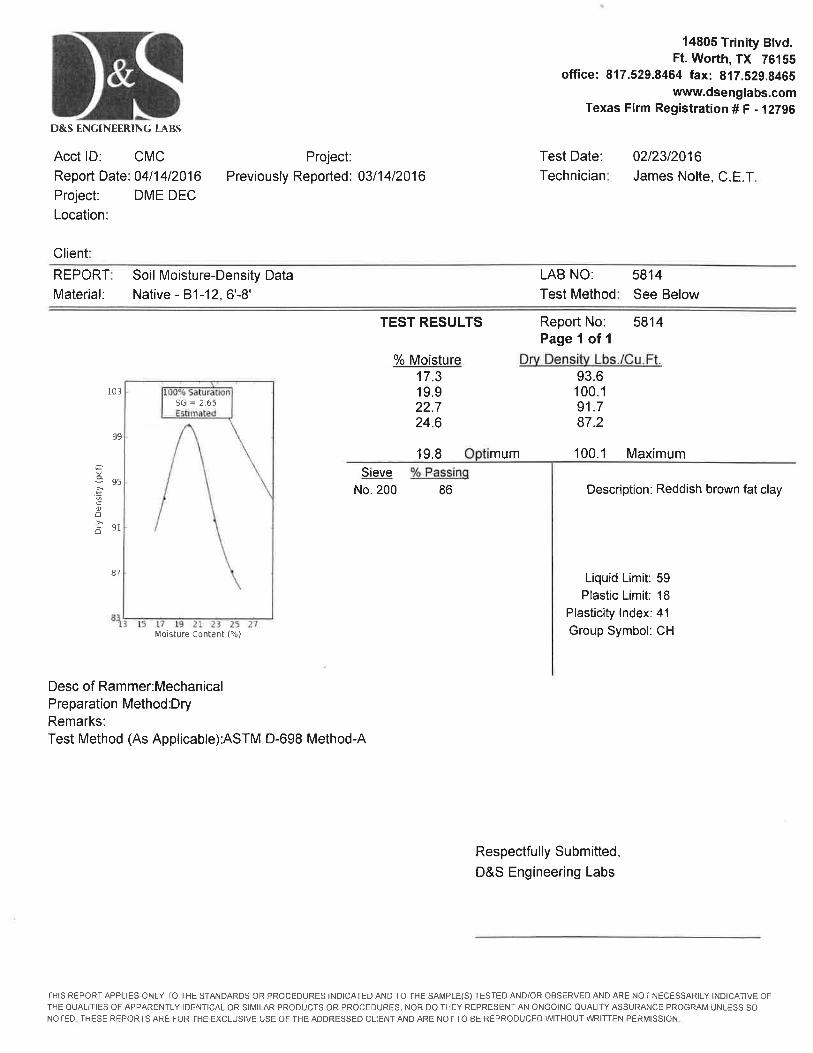
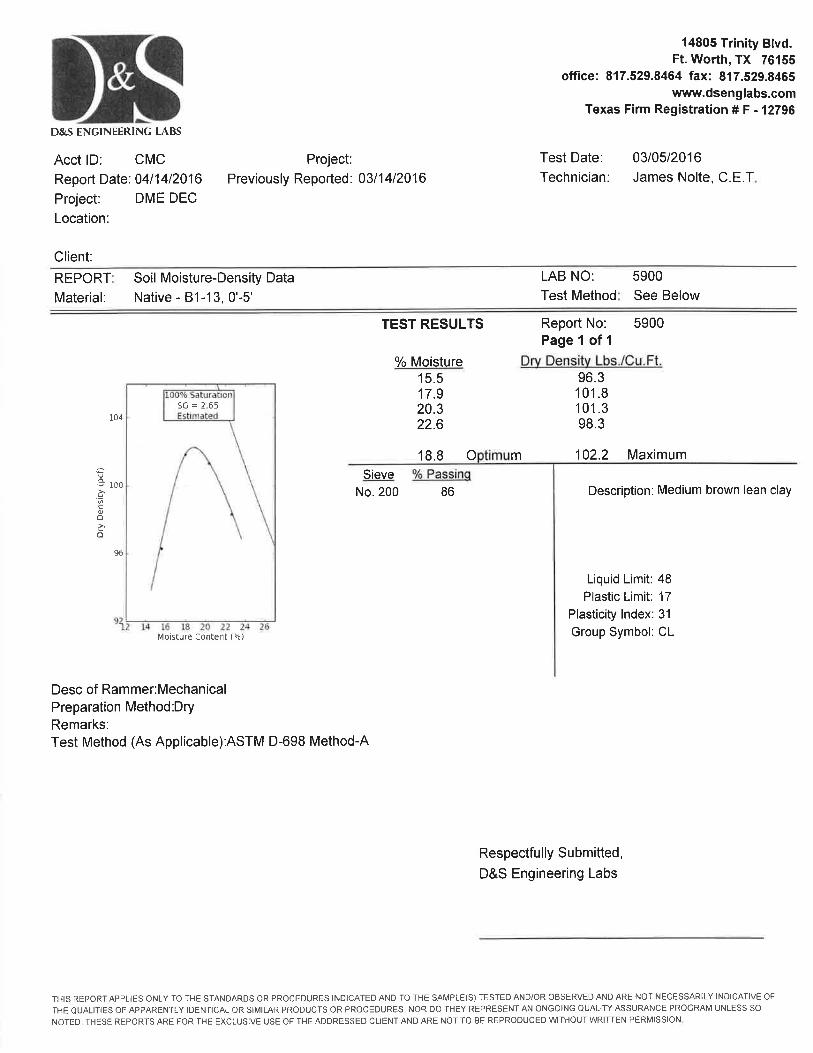
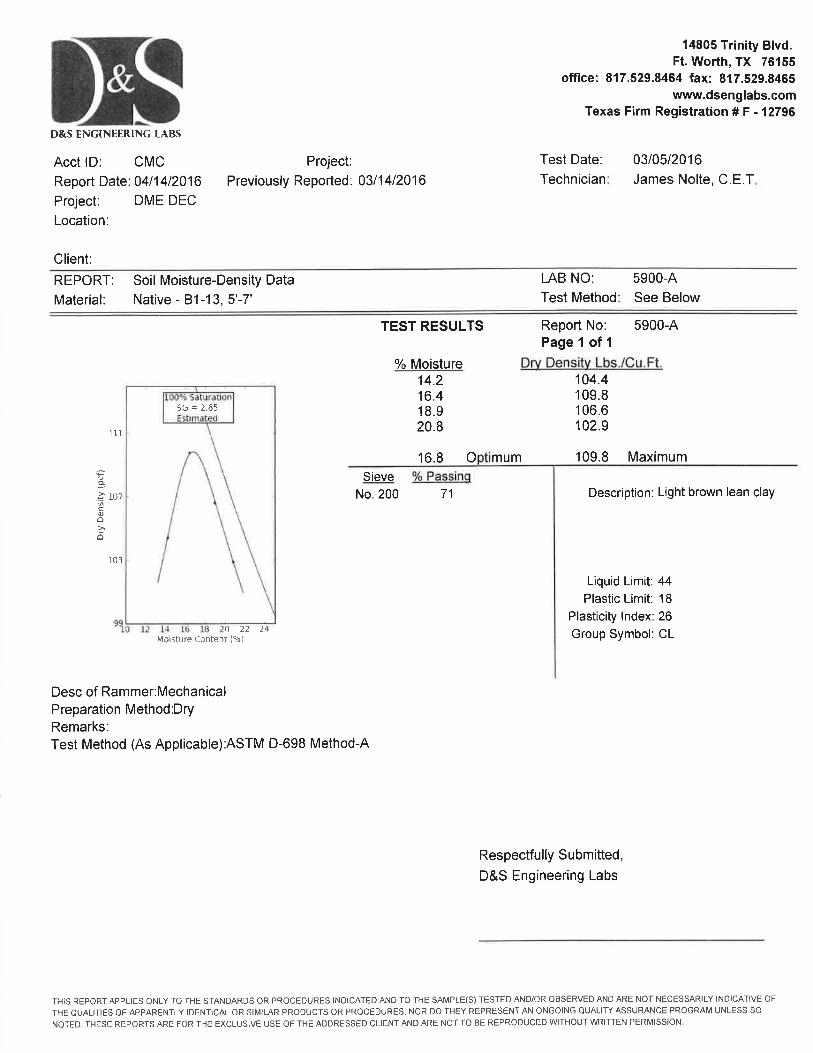
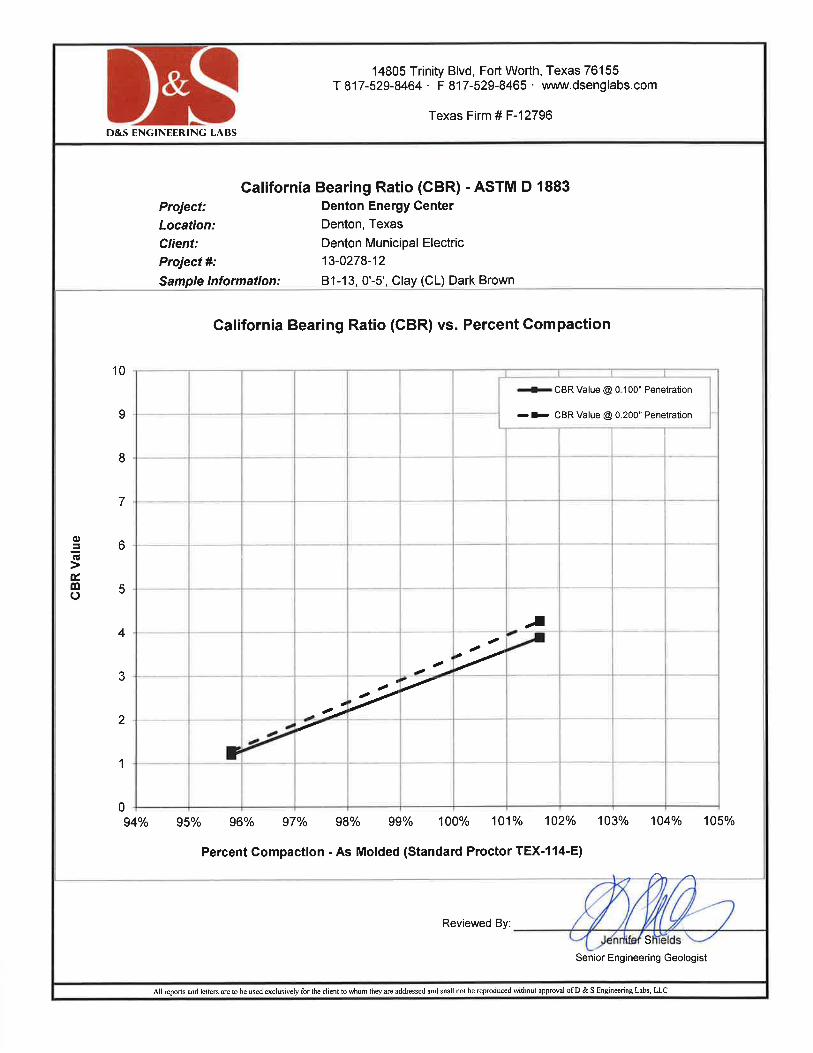
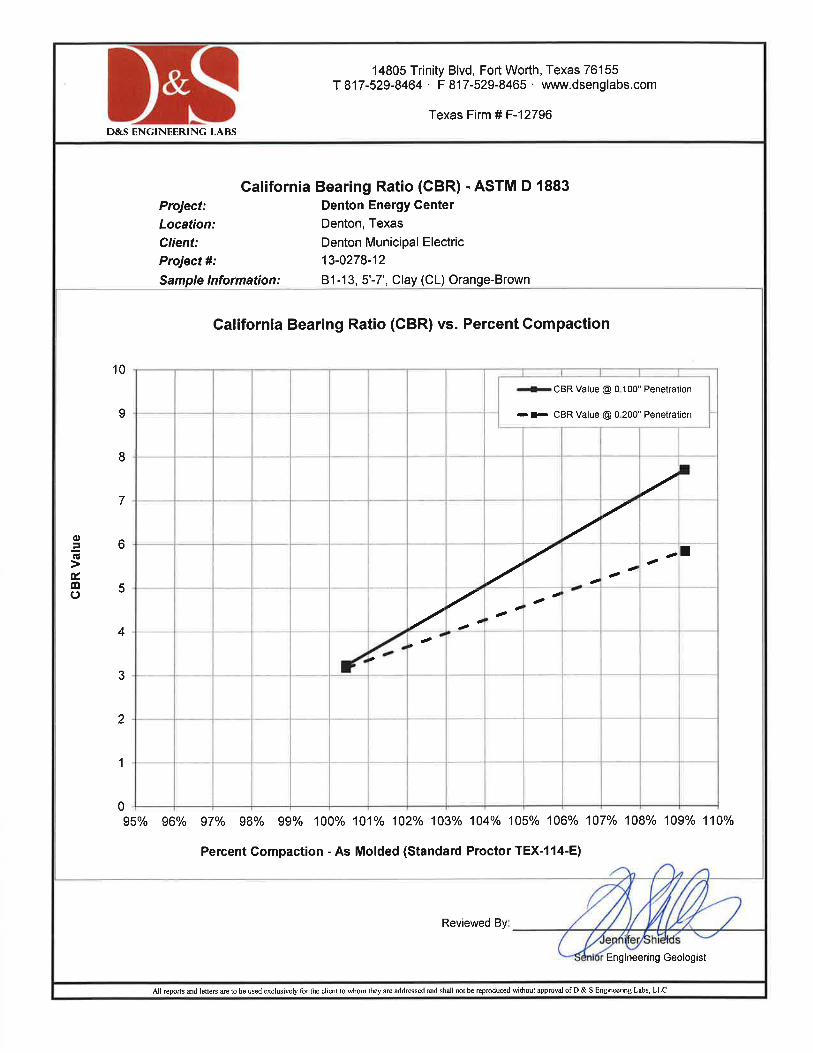

APPENDIX B – ROCK CORE PHOTOGRAPHS

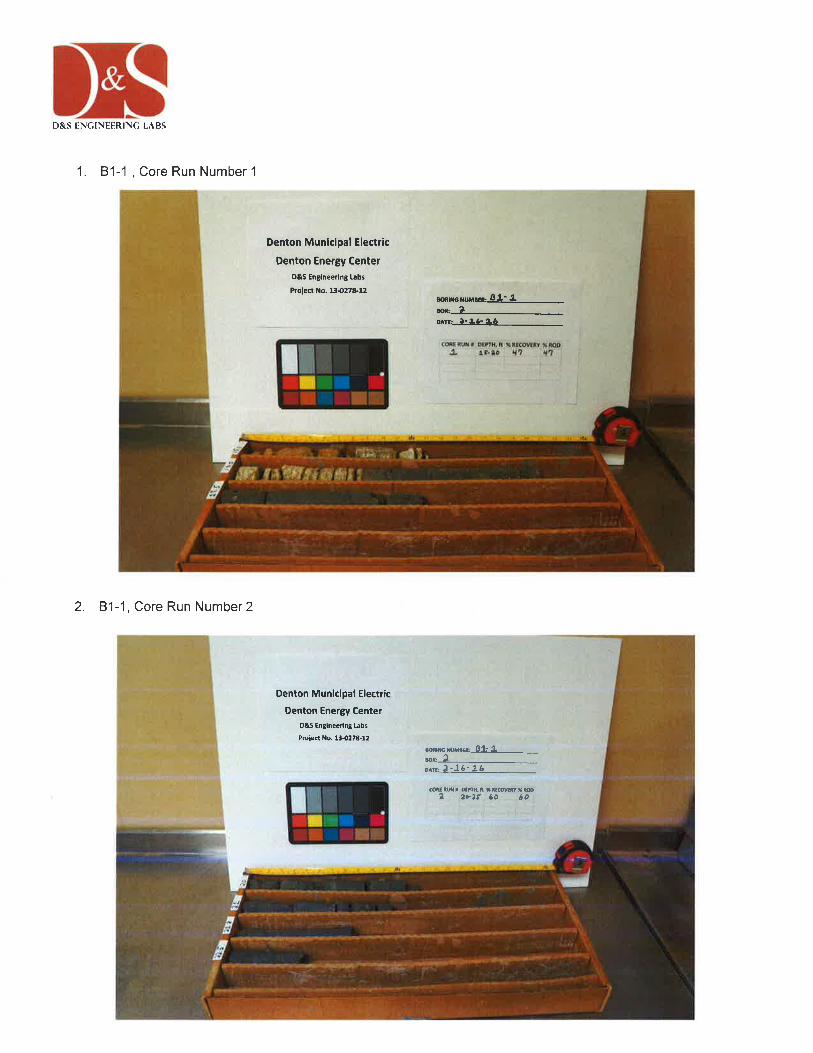
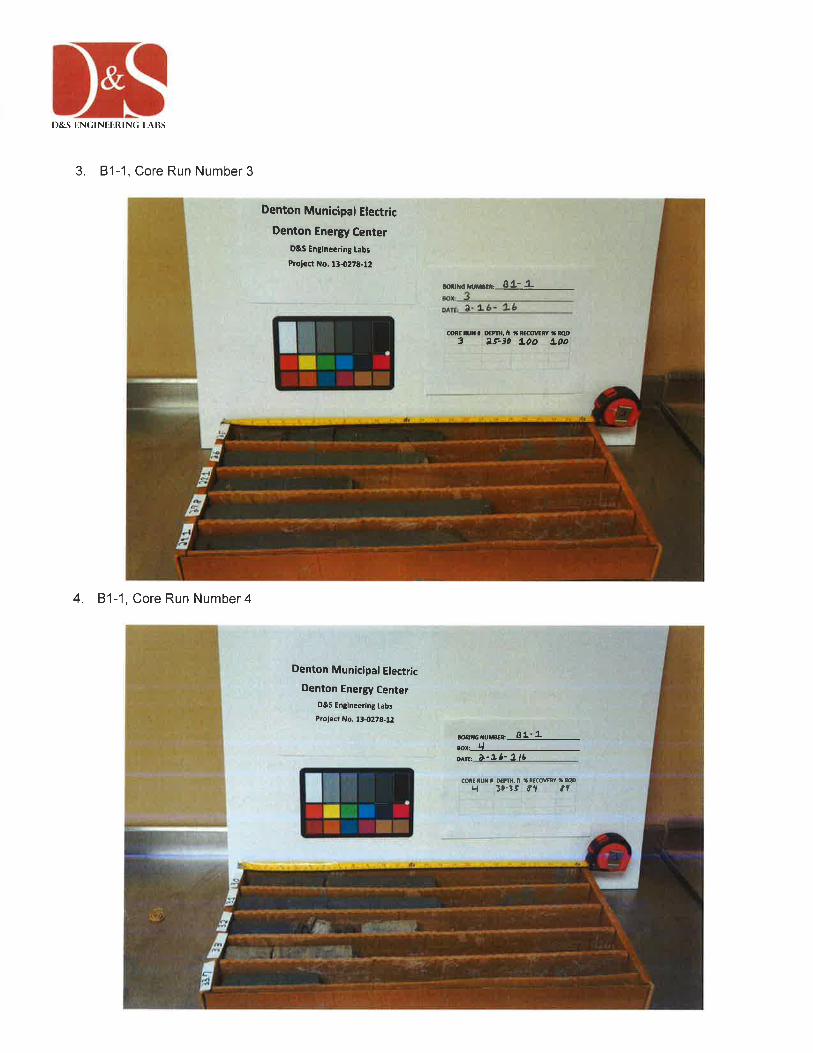
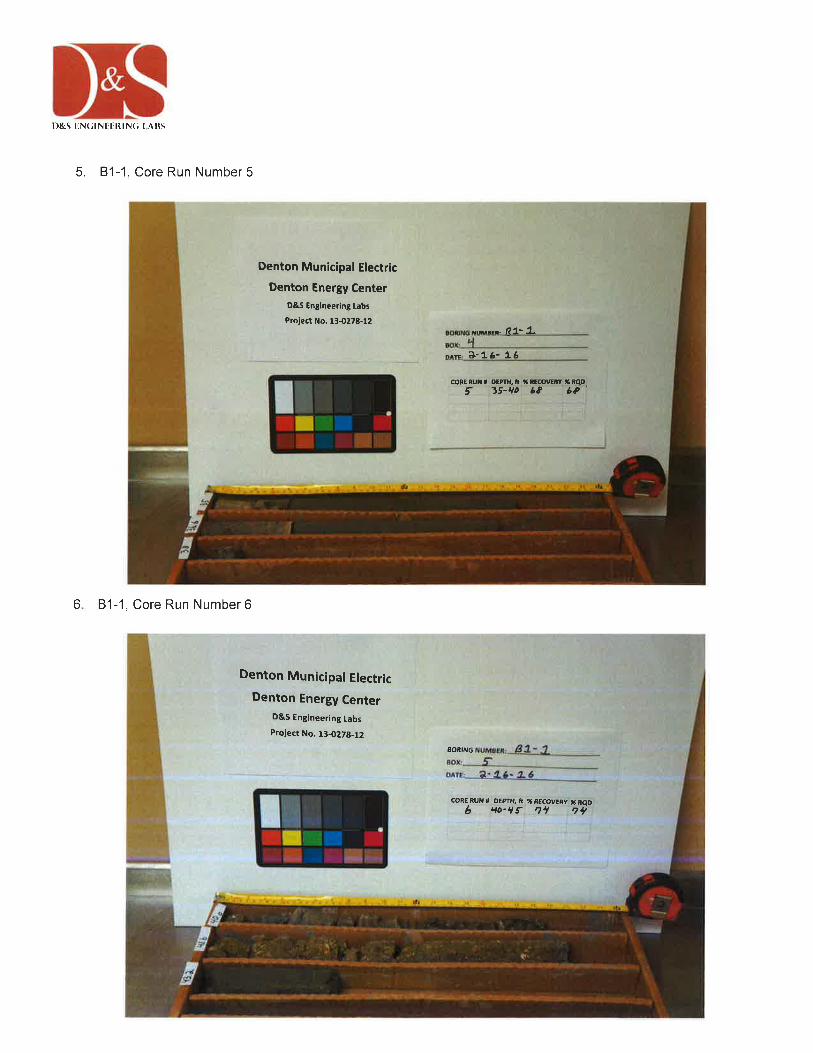
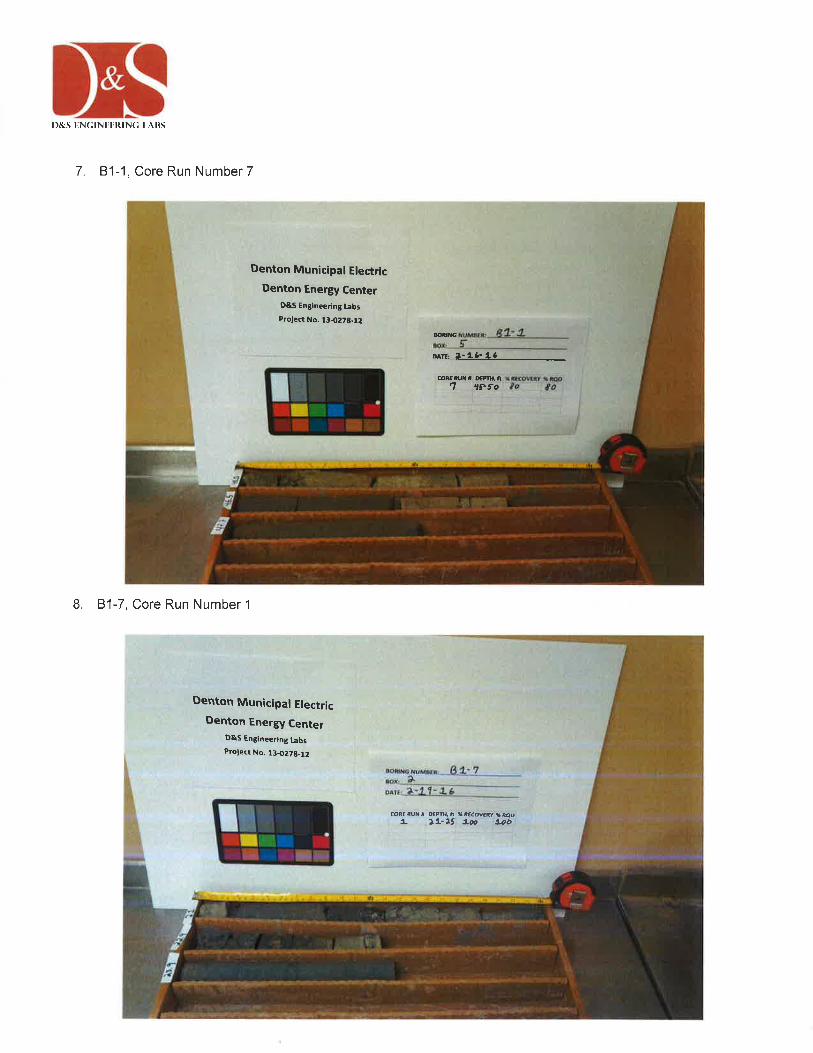
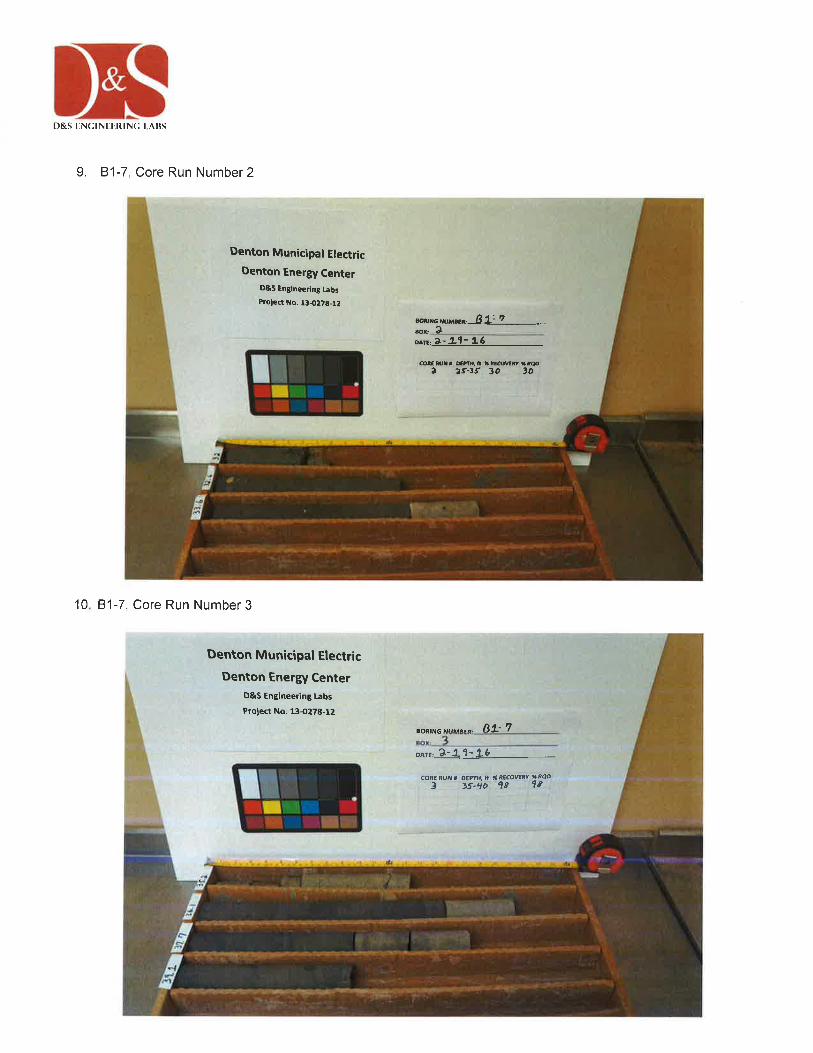
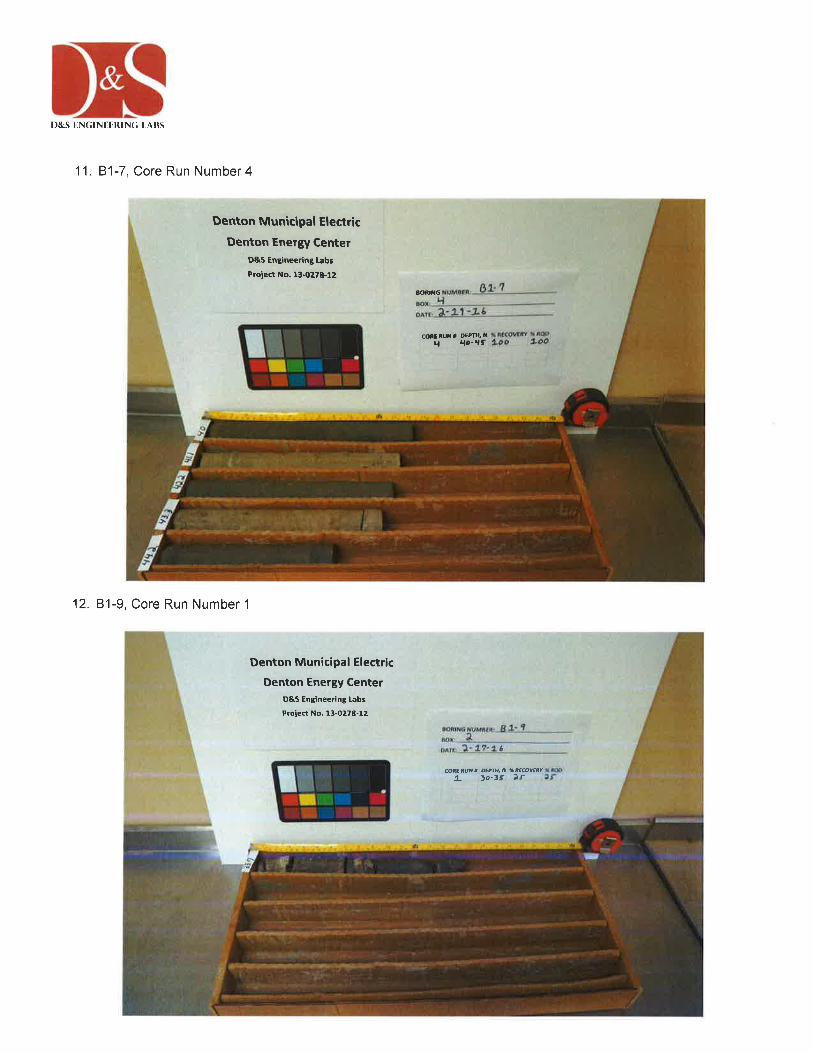
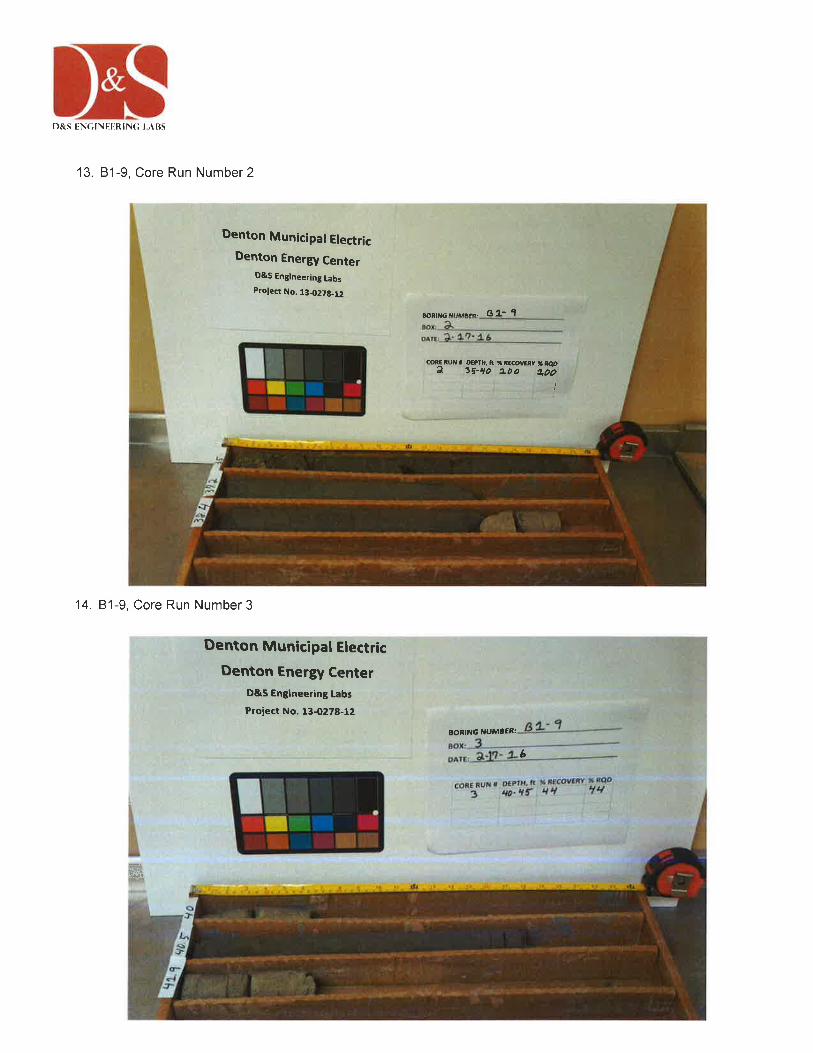
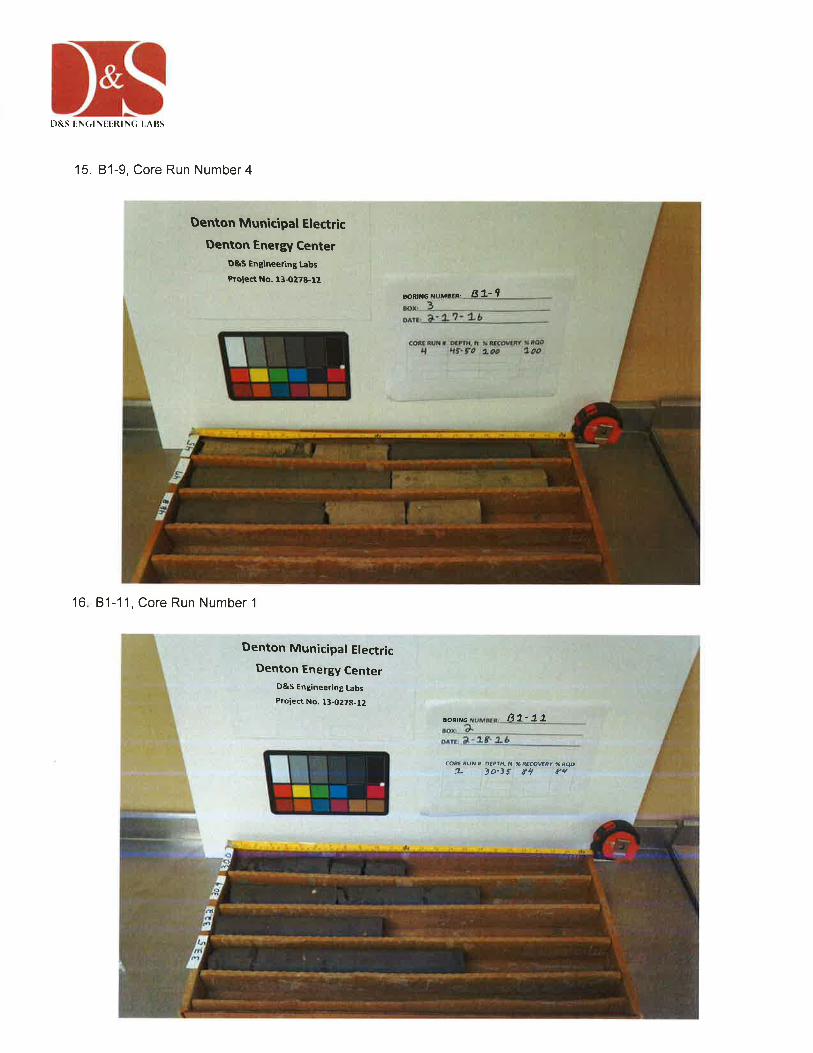
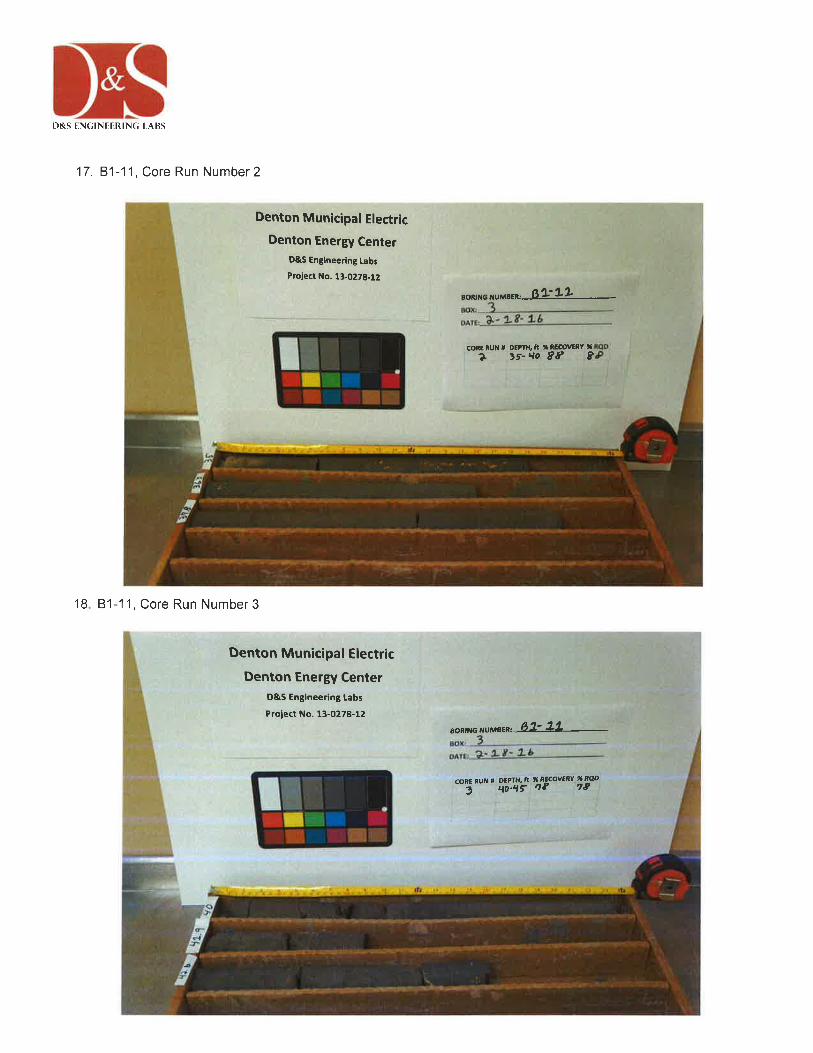
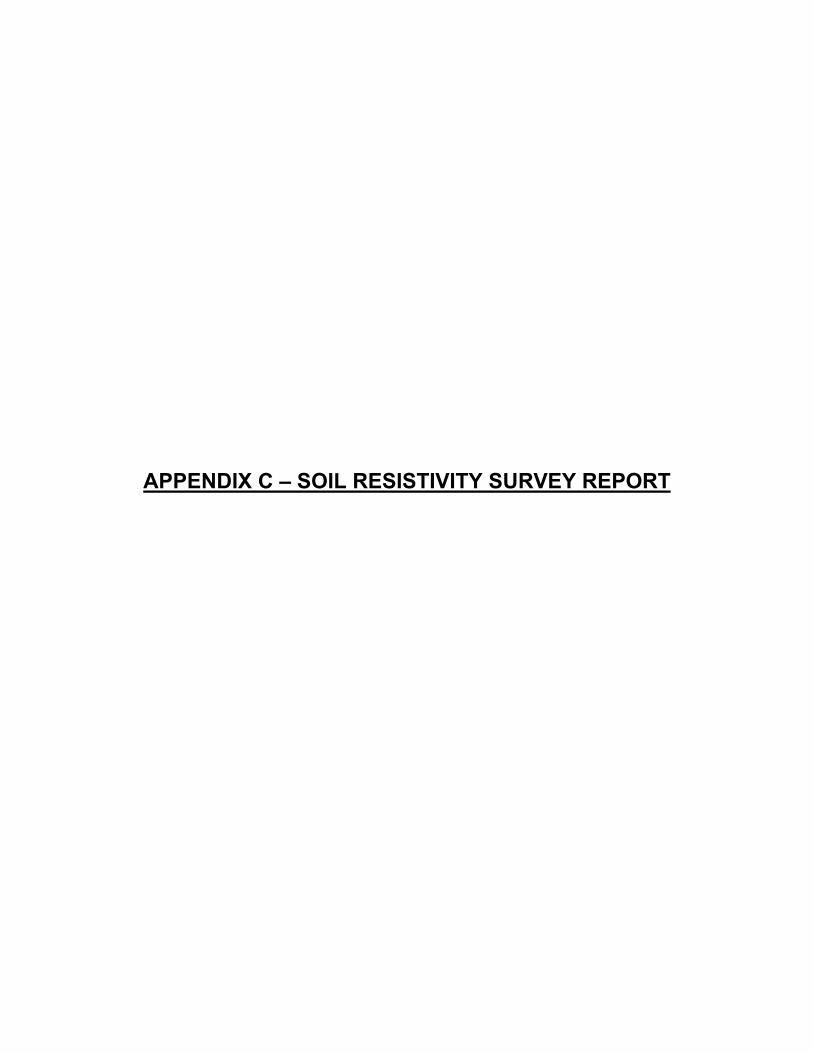
APPENDIX C – SOIL RESISTIVITY SURVEY REPORT
Baselineof
Study
Soil Resistivity forSouth Parcel - DEC, Dênton, TX100% Submittal - Rev. IELK Job No.2968.02
9 March 2016
Prepared by: ELK Engineering Associates, lnc.8950 Forum WayFort Worth,fX76140TBPE ID FOO3434
Prepared for: D & S Engineering Labs, LLC14805 Trinity Blvd.Fort Worth, TX 76155
Zz"
ELK Job 2968.02Baseline Study for So/ Resrsflvrfy
100% Submittal- Rev. 1
Appendices
APPENDIX A
Field Data - Soil Resistivity Su rvey
APPEDIX B
Equipment Calibration Certificates
9 March 2016 Rev. 1
Baseline Studyof
Soil Resistivity forSouth Parcel - DEC, Denton, TX
100% Submittal - Rev. IELK Job 2968.02
9 March 20'16
1.0 INTRODUCTION
Per a specific request by the D & S Engineering Labs, LLC (D&S) ELK EngineeringAssociates, lnc. (ELK) has performed site specific soil resistivity tests using the Wennermethod. The tests were made at the referenced facility northwest of Denton.
2.0 SITE INVESTIGATIONS
Soil Resistivitv Equipment and Test Procedure
The following equipment was used to perform the soil resistivity tests required for thisproject.
. Chauvin ArnouP, lnc. dba AEMC@ lnstruments model number 6471-Bmultifunction ground resistance soil resistivity tester, Serial Number2287 99HCDV (Cal ibration certificate is attached. )o MC Miller Company, lnc. model number 83-41 multimeter, Serial Number2537 (Calibration certificate is attached.)
o Battery Box. Copper Pins. Cable Clipso Wire Reels. Hand tools
Our baseline soil resistivity survey was performed using the Wenner 4-pin method inaccordance with ASTM GSTTests were performed on a North / South and East / Westalignment. The origin of both sets of tests was atN7127193.79 and E2362984.31.
Testsweretakenatpinspacingsof 1,3,5, 10, 15,20,30,40,50,60,70,80,90, 100,110, 120, 130, 140, and 15O-feet. Each test was repeated three (3) times beforemoving to the next pin spacing. The test results are recorded on the appended fielddata sheet.
The multiplier used to convert the measured resistance to resistivity stated in Ohm-meters is 1.9151 times the pin spacing. Thus the resistance multiplier at 1O-feet is19.151 or (1 .9151 x 10) while the resistance multiplier for 1OO-feet is 191 .51 or (1 .9151x 100.)
9 March 2016 Rev. 1 Page 1
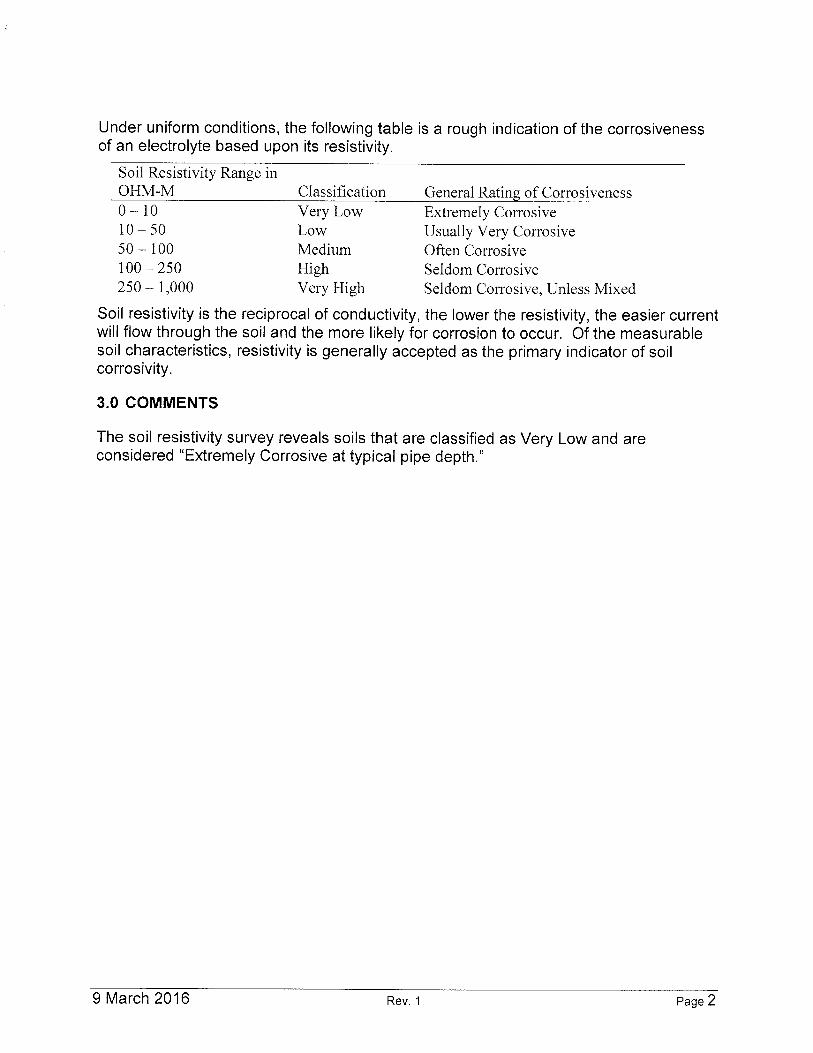
Under uniform conditions, the following table is a rough indication of the corrosivenessof an electrolyte based upon its resistivity.
Soil Resistivity Range inOHM-M Classification General Rating of Corrosiveness0 - l0 Very Low Extremely Corrosive10 - 50 Low Usually Very Corrosive50 - 100 Medium Often Corrosive100 - 250 High Seldom Corrosive250 - 1,000 Very High Seldom Corrosive, Unless Mixed
Soil resistivity is the reciprocal of conductivity, the lower the resistivity, the easier currentwill flow through the soil and the more likely for corrosion to occur. Of the measurablesoil characteristics, resistivity is generally accepted as the primary indicator of soilcorrosivity.
3.0 COMMENTS
The soil resistivity survey reveals soils that are classified as Very Low and areconsidered "Extremely Corrosive at typical pipe depth."
9 March 2016 Rev. 1 Page2
Frelo Dera sotL REstsrtvtry suRvEy
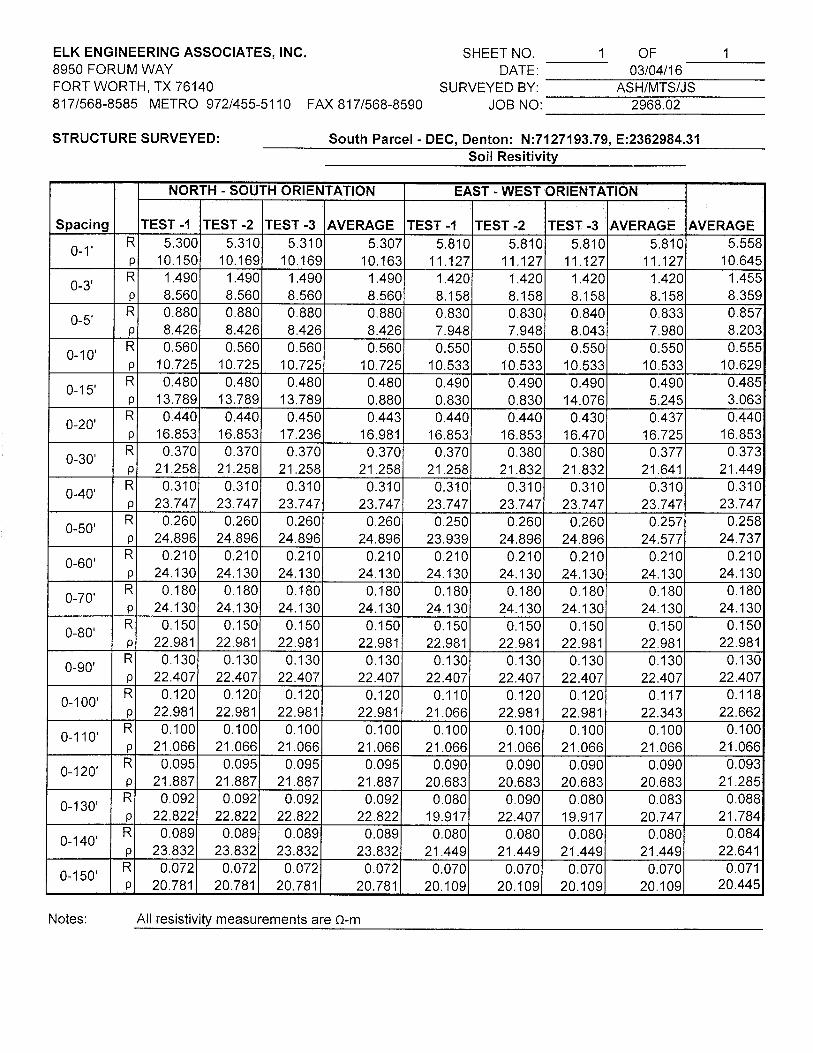
ELK ENGINEERING ASSOCIATES, INC. SHEET NO.8950 FORUM WAY DATE:FORT WORTH, TX7614O SURVEYED BY:817/568-8585 METRO 972t455-5110 FAX 817/568-8590 JOB NO:
STRUCTURE SURVEYED: South Parcel - DEC, Denton: N:7127193.79, E:2362984.31
OF03104t16
2968.02
Soil Resitivity
Spacing
NORTH . SOUTH ORIENTATION EAST. WEST ORIENTAT¡ON
AVERAGErEsT -1 TEST -2 TEST -3 AVERAGE rEsT -1 rEsT -2 TEST.3 AVERAGE
0-1'R
p
5.30010.150
5.31C
1 0.1 6€
5.3101 0.1 69
5.3071 0.1 63
5.81011.127
5.81011.127
5.81011.127
5.81C
11.12i5.558
10.645
0-3'Rp
1.4908.560
1.49C
8.56C
1.4908.560
1.4908.560
1.4208.158
1.4208.1 58
1.4208.158
1.42C8.1 58
1.4558.359
0-5'R
0
0.8808.426
0.88C
8.42e0.8808.426
0.8808.426
0.8307.948
0.8307.948
0.8408.043
0.8337.98C
0.8578.203
0-1 0'R
p
0.56010.725
5600.
10.7250.560
10.7250.560
10.7250.55C
10.5330.550
10.5330.55C
10.5330. 550
10.5330.555
10.629
0-1 5'R
p0.48C
13.7890.480
13.7890.480
13.7890.4800.880
0.49C
0.83C
0.4900.830
0.49C
M.07e0.4905.245
0.4853.063
0-20'R
0
0,44016.853
0.44016.853
0.45C17.23e
0.44316.981
0.44C16.853
0.44016.853
0.43C
16.47C0,437
16.7250.44C
16.853
0-30'Rp
0.37021.258
0.37021.258
0.37C21.258
0.37021,258
0.37021.258
0 .38021.832
3800.21.832
0.37721.641
0.37321.449
0-40'R
o
0.31023.747
0.31023.747
0.31023.747
0.31023.747
0.31023.747
0.31023.747
0.31023.747
0.31023.747
0.31023.747
0-50'R
o
0.26024.896
0.26024.896
0.26024.896
0.26C
24.89e0.250
23.9390.260
24.8960.26C
24.8960.257
24.5770.258
24.737
0-60'Rp
0.21C24.13C
0.21024.130
0.21024.130
0.21C24.13C
0.21024.130
0.21024.130
0.21024.130
0.21024.130
0.21024.130
0-70'R
p0.18C
24.13C0.1 80
24.1300.180
24.1300.18C
24.13C0.1 8C
24.13C0.1 80
24.1300.180
24.1300.180
24.1300.1 80
24.130
0-80'Rp
0.1 5C
22.9810.1 50
22.981500.1
22.9815C
981
0.1
220.150
22.9810.150
22.9810.150
22.9810.1 50
22,9810.150
22.981
0-90'Rp
0.13022.407
0.13022.407
0.13022.407
0.13022.407
0.13022.407
0.13C22.407
0.13022.407
0.13C
22.4070.130
22.407
0-l 00'R
a
0.12022.981
2C0.1
22.9810.12C
22.9810.120
22.9810.1 10
21.0660.12C
22.981200.1
22.9810.117
22.34?0.1 1B
22.662
0-1 1 0'R
p
0.10021.066
0.10c21.06e
0.10021.066
0.10021.066
0.1 0021.066
0.1 0c21.06e
0.10021.066
000.1
21.0660.100
21.066
0-120'R
p
0.09521.887
0.09521.887
0.09521.887
0.09521.887
0.09020.683
0.09c20.683
0.09020.683
0.09020.683
0.09321.285
0-1 30'Rp
0.09222.822
0.09222.822
0.09222.822
0.09222.822
0.08c19.917
0.09022.407 19,917
800.0 0.08320.747
O.OB€
21.784
0-140'R
o
0.08923.832
0.08923.832
0.08s23.832
0.08923.832
0.08c21.449
0.08021.449
0.08021.449
0.08021.449
0.08422.641
0-1 50'Rp
0.07220.781 20.781
720.0 0.07220.781
0.07220.781
0.07020.109
0.07020.109
0.07020.109
0.07020.109
0.07120.448
Notes: All resistivity measurements are O-m
ApPENDIx B
EQUIPMENT CALIBRATION CERTIFICATES
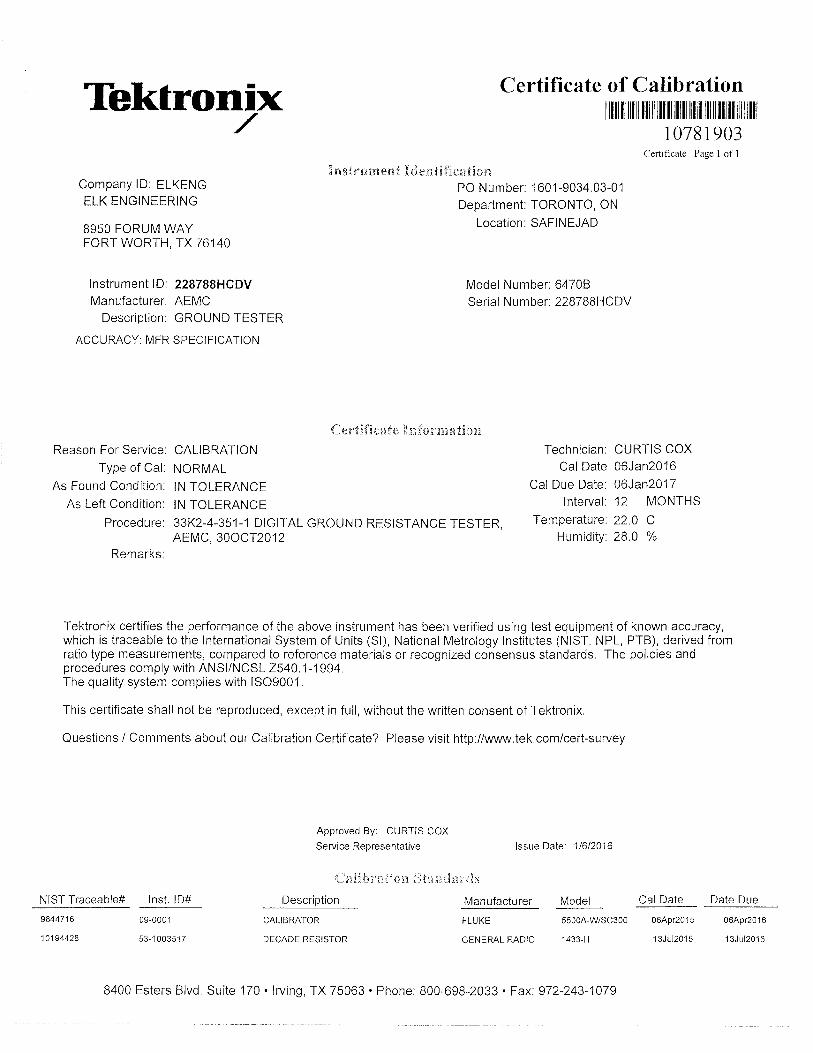
ïþktronix
Company lD: ELKENGELK ENGINEERING
B95O FORUM WAYFORT WORTH, TX76140
10194428 53-1003517 DECADE RESISTOR
Certificate of CalibratronIilil ililtililtililtilll tilfl t]ilililttiltil]
I 078 1 903Ce¡tifìcate Page I of I
[nstrurnenf trdentificationPO Number: 160'1 -9034.03-01
Department: TORONTO, ON
Location: SAFINEJAD
lnstrument lD: 228788HGDV Model Number. 64708Manufacturer: AEMC Serial Number: 22B788HCDV
Description: GROUND TESTER
ACCURACY: MFR SPECIFICATION
Certificaúe nnformafionReason For Service: CALIBRATION Technician: CURTIS COX
Type of Cal: NORMA¡ CalDate 06Jan2016
As Found Condition: lN TOLERANCE Cal Due Date: 06Jan2017
As Left Condition: tN TOLERANCE lnterval: 12 MONTHS
procedure: 33t<2-4-351-.1 DtctTAL GROUND RESTSTANCE TESTER, Temperature: 22.0 CAEMC, 30OCT2O12 HumiditY: 28.0 %
Remarks:
Tektronix certifies the performance of the above instrument has been verified using test equipment of known accuracy,which is traceable to the lnternational System of Units (Sl), National Metrology lnstitutes (NlST, NPL, PTB), derived fromratio type measurements, compared to reference materials or recognized consensus standards. The policies andprocedures comply with ANSI/NCSL 2540.1-1 994.The quality system complies with 1SO9001.
This certificate shall not be reproduced, except in full, without the written consent of Tektronix.
Questions / Comments about our Calibration Certificate? Please visit http://wvlrw.tek.com/cert-survey
Approved By: CURTIS COX
Service Representative lssue Date: 11612016
Calihration Sfr¡nd¿rrris
NIST Traceable# lnst. lD# Description Manufacturer Model Cal Date Date Due
9844716 09-0001 CALIBRATOR FLUKE 55004-WSC300 064pr2015 064pr2016
GENERAL RADIO 1433-H 13Ju12015 13Ju12016
8400 Esters Blvd. Suite 170 . lrving, TX 75063 . Phone: 800-698-2033 . Fax: 972-243-1079
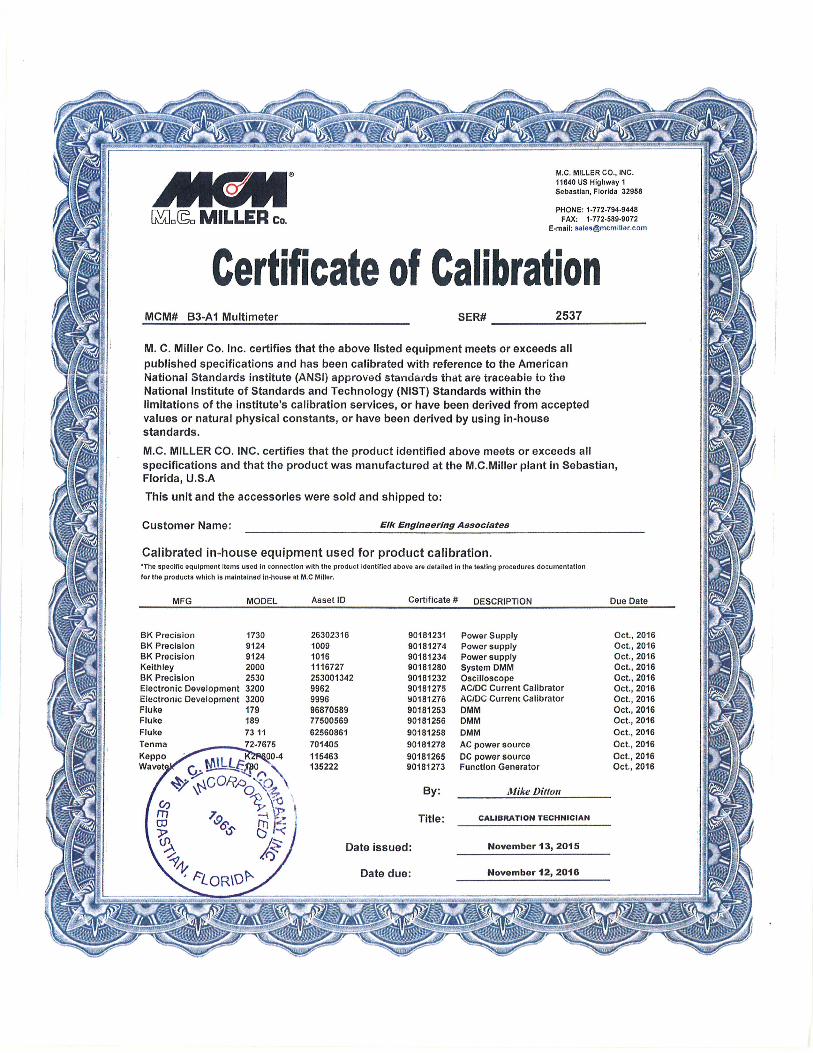
m'nfl"G" MILLER c".
M.C. MTLLER CO., rNC.
f16,t0 US Hlghway ISêbasl¡Bn, Florlda 32058
PHONE:'1.772-794-9¡148Fîú,t 1-772-589-9072
E'mril: saf€[email protected]
Certificate of GalibrationMCM# 83-41 Multimeter 2537
M. C. Miller Co. lnc. certifies that the above listed equipment meets or exceeds allpublished specifications and has been calibrated with reference to the AmericanNational Standards lnstitute (ANSI) approved sta¡rdards that are traceable to tireNational lnstitute of Standards and Technology (NIST) Standards within thelimitations of the institute's calibration services, or havs been derived from acceptedvalues or natural physical constants, or have been derived by using in-housestandards.
M.C. MILLER CO. lNC. certifies that the product identified above meets or exceeds allspecifications and that the product was manufactured at the M.C.Miller plant in Sebastian,Florida, U.S.A
This unlt and the accessories were sold and shipped to:
Customer Name: Elk Englneer¡ng A&soclates
Calibrated in-house equipment used for product calibration.'Îhe gpecll¡c equlpmsnt ilems used in corngctlon w¡th the producl identltied above are do{elled ln thê têstlng procodures dôcumnt¡tlonlor tho producl! wh¡ch ls m¡¡ntaingd ln-house at M,C Milhi
MOoEL Asset lD Cert¡f¡cate# DESCRtpTION
SER#
Due Oate
BK PrecisionBK Prec¡slonBK PrecislonKeithleyBK PrecisionElêctfonic DevelopmentElèctron¡c DevelopmentFlukeFlukeFlukeTenma
't730
I't2491242000253032003200179189
73 11
72,7675
263023r 6
100910161116727253001 34299629996968705E977500569
62s60861
7014{15
I 15463135222
Oct., 201ôOct., 2016Oct.,2016Oct.,2016Oct.,2016Oct, 2016OcL, 2016Oct,,2016Oct.,20l6Oct., 2016
Oct., 2016
Oct., 2016Oct., 2016
90181231 PowerSupply90181274 Powersupply90181234 Powersupply90'181280 System DMM90181232 Oscilloscope90181275 AcrtlcCurrentCalibrator9018127ô ÀC/DC Current Caliþrator90181253 DMM901812s6 DMM
90181258 DMM
90181278 ACpower3ource90181265 DCpowersource90181273 Fl¡nctionGenerator
ùIike Ditton
Novembêr 13, 2Ol5
llov¿mber 12,2lJ18
By:
Title:
Date issued:
Date due:

APPENDIX D – CHEMICAL TEST RESULTS
Analytical Report 526313for
D&S Engineering Lads
Project Manager: Jennifer Shields
DME DEC
16-MAR-16
13-0278-12
9701 Harry Hines BlvdDallas, TX 75220
Xenco-Houston (EPA Lab code: TX00122):Texas (T104704215-15-19), Arizona (AZ0765), Florida (E871002), Louisiana (03054)
Oklahoma (9218)
Xenco-Dallas (EPA Lab code: TX01468): Texas (T104704295)Xenco-Odessa (EPA Lab code: TX00158): Texas (T104704400)
Xenco-San Antonio: Texas (T104704534-15-1)Xenco Phoenix (EPA Lab Code: AZ00901): Arizona(AZ0757)
Xenco-Phoenix Mobile (EPA Lab code: AZ00901): Arizona (AZM757)Xenco-Atlanta (EPA Lab Code: GA00046):
Florida (E87429), North Carolina (483), South Carolina (98015), Kentucky (85), DoD ( L10-135)Texas (T104704477), Louisiana (04176), USDA (P330-07-00105)
Xenco-Lakeland: Florida (E84098)
Collected By: Client
Page 1 of 14 Final 1.000
Page 2 of 14 Final 1.000
Table of Contents
Cover Page 1 Cover Letter 3 Sample ID Cross Reference 4 Case Narrative 5 Certificate of Analysis (Detailed Report) 6 Summary of Quality control 10
Explanation of Qualifiers (Flags) 12
Chain of Custody 13
Sample Receipt Conformance Report 14
Houston - Dallas - Odessa - San Antonio - Tampa - Lakeland - Atlanta - Phoenix - Oklahoma - Latin America
Recipient of the Prestigious Small Business Administration Award of Excellence in 1994.Certified and approved by numerous States and Agencies.
A Small Business and Minority Status Company that delivers SERVICE and QUALITY
Project Manager: Jennifer Shields D&S Engineering Lads14805 Trinity BlvdFort Worth, TX 76155 Reference: XENCO Report No(s): 526313 DME DEC Project Address: Denton, TX
Jennifer Shields :
We are reporting to you the results of the analyses performed on the samples received under the project namereferenced above and identified with the XENCO Report Number(s) 526313. All results being reported underthis Report Number apply to the samples analyzed and properly identified with a Laboratory ID number.Subcontracted analyses are identified in this report with either the NELAC certification number of thesubcontract lab in the analyst ID field, or the complete subcontracted report attached to this report.
Unless otherwise noted in a Case Narrative, all data reported in this Analytical Report are in compliance withNELAC standards. The uncertainty of measurement associated with the results of analysis reported isavailable upon request. Should insufficient sample be provided to the laboratory to meet the method andNELAC Matrix Duplicate and Matrix Spike requirements, then the data will be analyzed, evaluated andreported using all other available quality control measures.
The validity and integrity of this report will remain intact as long as it is accompanied by this letter andreproduced in full, unless written approval is granted by XENCO Laboratories. This report will be filed for atleast 5 years in our archives after which time it will be destroyed without further notice, unless otherwisearranged with you. The samples received, and described as recorded in Report No. 526313 will be filed for60 days, and after that time they will be properly disposed without further notice, unless otherwise arrangedwith you. We reserve the right to return to you any unused samples, extracts or solutions related to them if weconsider so necessary (e.g., samples identified as hazardous waste, sample sizes exceeding analytical standardpractices, controlled substances under regulated protocols, etc).
We thank you for selecting XENCO Laboratories to serve your analytical needs. If you have any questionsconcerning this report, please feel free to contact us at any time.
Respectfully,
16-MAR-16
Project ManagerMonica Tobar
Page 3 of 14 Final 1.000
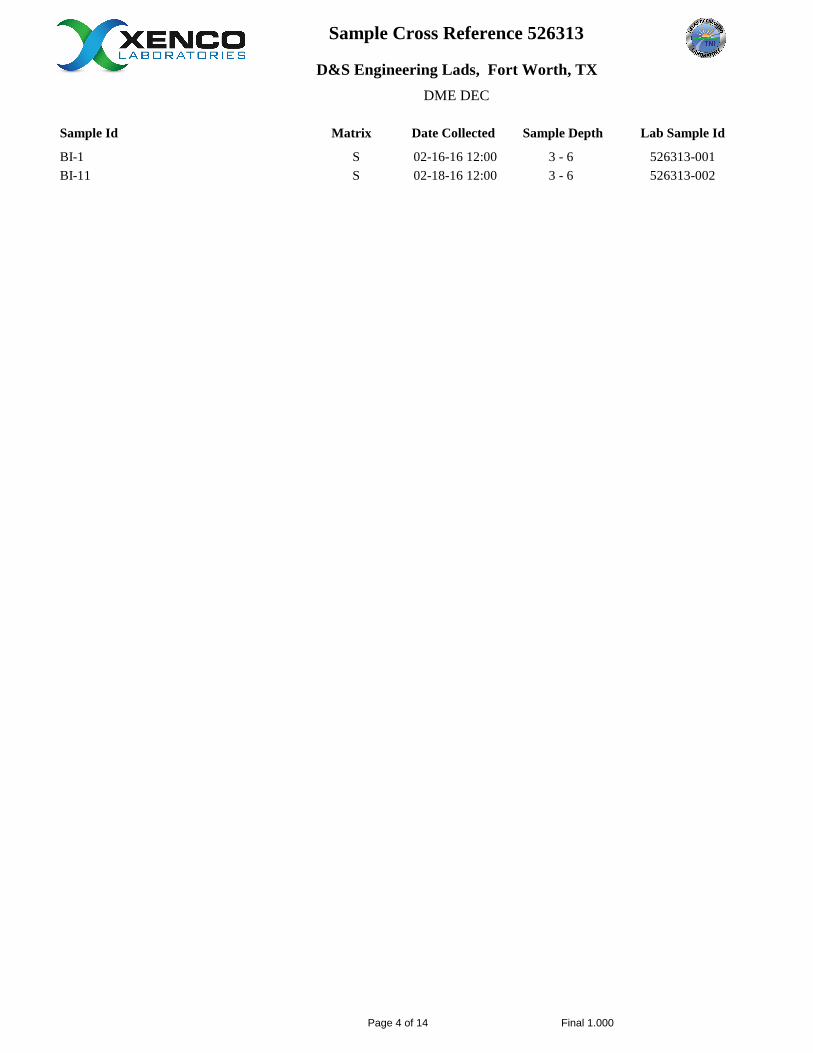
Sample Cross Reference 526313
D&S Engineering Lads, Fort Worth, TXDME DEC
Sample Id
BI-1BI-11
02-16-16 12:0002-18-16 12:00
Date Collected Lab Sample Id
526313-001526313-002
3 - 6 3 - 6
Sample DepthMatrix
SS
Page 4 of 14 Final 1.000
CASE NARRATIVE
526313Work Order Number(s):16-MAR-16Report Date: 13-0278-12Project ID:
Project Name: DME DEC
Date Received:
Client Name: D&S Engineering Lads
03/07/2016
Samples were submitted to Sub lab for Redox Potential via Fed Ex. The data for Analysis is found in aseparate subcontractor's report that will be forwarded upon completion.
None
LBA-990002Batch: Samples were received out of holding time. DHE 03/10/16
Sulfide by SM4500-S-F-00
Sample receipt non conformances and comments:
Sample receipt non conformances and comments per sample:
Analytical non conformances and comments:
Page 5 of 14 Final 1.000
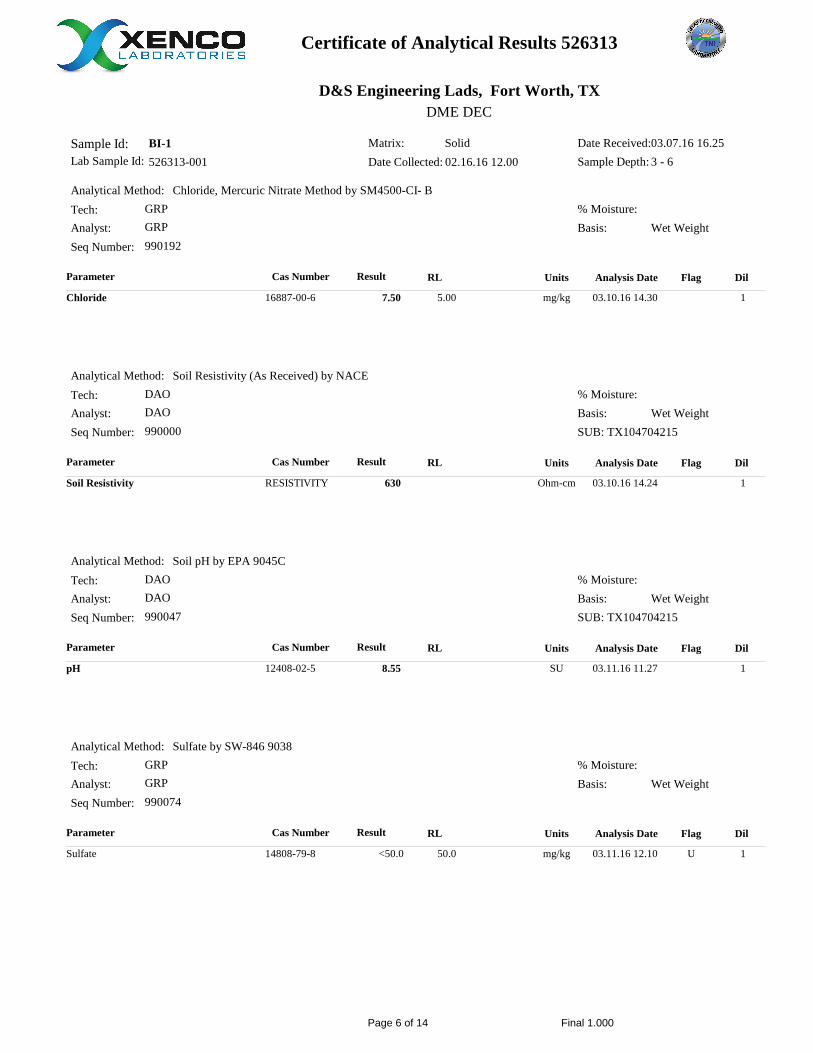
Certificate of Analytical Results 526313
D&S Engineering Lads, Fort Worth, TXDME DEC
03.07.16 16.25 Date Received:02.16.16 12.00 Date Collected:526313-001Lab Sample Id:SolidMatrix: BI-1Sample Id:
Chloride, Mercuric Nitrate Method by SM4500-CI- B
Soil Resistivity (As Received) by NACE
Soil pH by EPA 9045C
Sulfate by SW-846 9038
Analytical Method:
Analytical Method:
Analytical Method:
Analytical Method:
GRP
DAO
DAO
GRP
Analyst:
Analyst:
Analyst:
Analyst:
GRP
DAO
DAO
GRP
Tech:
Tech:
Tech:
Tech:
Chloride
Soil Resistivity
pH
Sulfate
Parameter
Parameter
Parameter
Parameter
Result
Result
Result
Result
U
5.00
50.0
Flag
Flag
Flag
Flag
mg/kg
Ohm-cm
SU
mg/kg
Units
Units
Units
Units
1
1
1
1
Dil
Dil
Dil
Dil
Cas Number
Cas Number
Cas Number
Cas Number
16887-00-6
RESISTIVITY
12408-02-5
14808-79-8
7.50
630
8.55
<50.0
990192
990000
990047
990074
Seq Number:
Seq Number:
Seq Number:
Seq Number:
3 - 6 Sample Depth:
SUB: TX104704215
SUB: TX104704215
RL
RL
RL
RL
Wet Weight
Wet Weight
Wet Weight
Wet Weight
Basis:
Basis:
Basis:
Basis:
03.10.16 14.30
03.10.16 14.24
03.11.16 11.27
03.11.16 12.10
Analysis Date
Analysis Date
Analysis Date
Analysis Date
% Moisture:
% Moisture:
% Moisture:
% Moisture:
Page 6 of 14 Final 1.000

Certificate of Analytical Results 526313
D&S Engineering Lads, Fort Worth, TXDME DEC
03.07.16 16.25 Date Received:02.16.16 12.00 Date Collected:526313-001Lab Sample Id:SolidMatrix: BI-1Sample Id:
Sulfide by SM4500-S-F-00 Analytical Method:
DHEAnalyst:
DHETech:
Sulfide, total
Parameter Result
UK200
Flag
mg/kg
Units
10
DilCas Number
18496-25-8 <200
990002Seq Number:
3 - 6 Sample Depth:
SUB: TX104704215
RL
Wet WeightBasis:
03.10.16 13.00
Analysis Date
% Moisture:
Page 7 of 14 Final 1.000

Certificate of Analytical Results 526313
D&S Engineering Lads, Fort Worth, TXDME DEC
03.07.16 16.25 Date Received:02.18.16 12.00 Date Collected:526313-002Lab Sample Id:SolidMatrix: BI-11Sample Id:
Chloride, Mercuric Nitrate Method by SM4500-CI- B
Soil Resistivity (As Received) by NACE
Soil pH by EPA 9045C
Sulfate by SW-846 9038
Analytical Method:
Analytical Method:
Analytical Method:
Analytical Method:
GRP
DAO
DAO
GRP
Analyst:
Analyst:
Analyst:
Analyst:
GRP
DAO
DAO
GRP
Tech:
Tech:
Tech:
Tech:
Chloride
Soil Resistivity
pH
Sulfate
Parameter
Parameter
Parameter
Parameter
Result
Result
Result
Result
U
4.99
50.0
Flag
Flag
Flag
Flag
mg/kg
Ohm-cm
SU
mg/kg
Units
Units
Units
Units
1
1
1
1
Dil
Dil
Dil
Dil
Cas Number
Cas Number
Cas Number
Cas Number
16887-00-6
RESISTIVITY
12408-02-5
14808-79-8
17.5
1210
8.46
<50.0
990192
990000
990047
990074
Seq Number:
Seq Number:
Seq Number:
Seq Number:
3 - 6 Sample Depth:
SUB: TX104704215
SUB: TX104704215
RL
RL
RL
RL
Wet Weight
Wet Weight
Wet Weight
Wet Weight
Basis:
Basis:
Basis:
Basis:
03.10.16 14.30
03.10.16 14.24
03.11.16 11.27
03.11.16 12.10
Analysis Date
Analysis Date
Analysis Date
Analysis Date
% Moisture:
% Moisture:
% Moisture:
% Moisture:
Page 8 of 14 Final 1.000
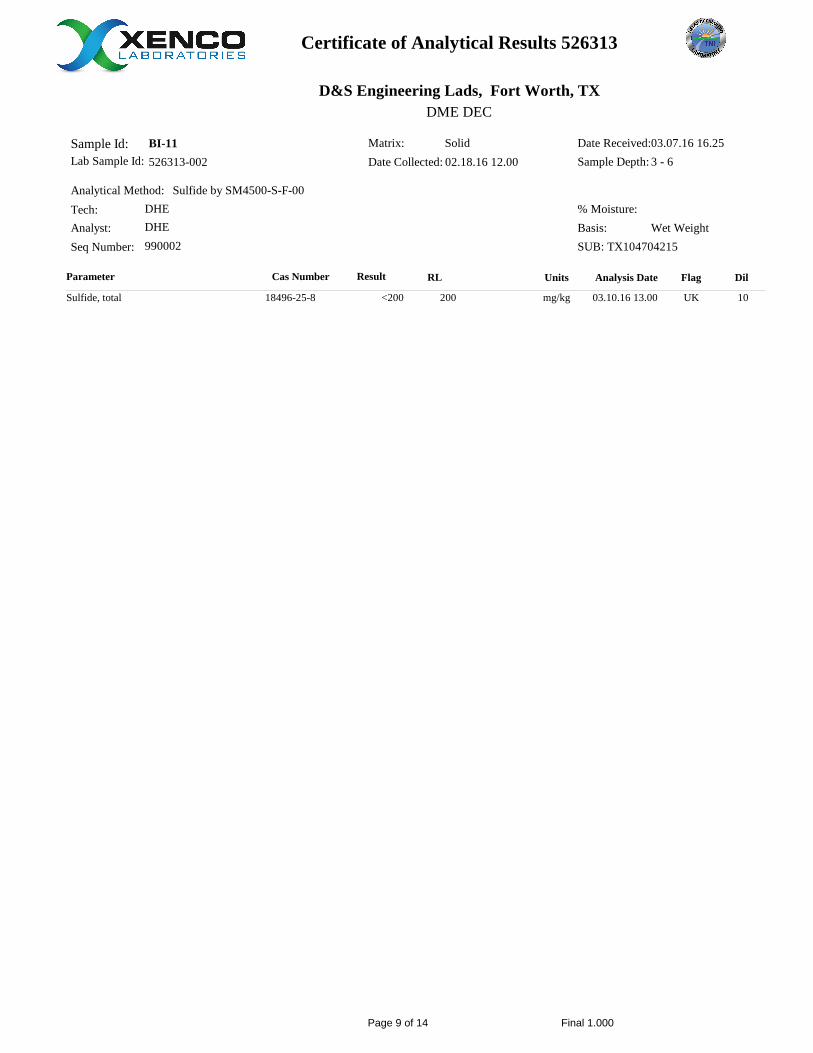
Certificate of Analytical Results 526313
D&S Engineering Lads, Fort Worth, TXDME DEC
03.07.16 16.25 Date Received:02.18.16 12.00 Date Collected:526313-002Lab Sample Id:SolidMatrix: BI-11Sample Id:
Sulfide by SM4500-S-F-00 Analytical Method:
DHEAnalyst:
DHETech:
Sulfide, total
Parameter Result
UK200
Flag
mg/kg
Units
10
DilCas Number
18496-25-8 <200
990002Seq Number:
3 - 6 Sample Depth:
SUB: TX104704215
RL
Wet WeightBasis:
03.10.16 13.00
Analysis Date
% Moisture:
Page 9 of 14 Final 1.000
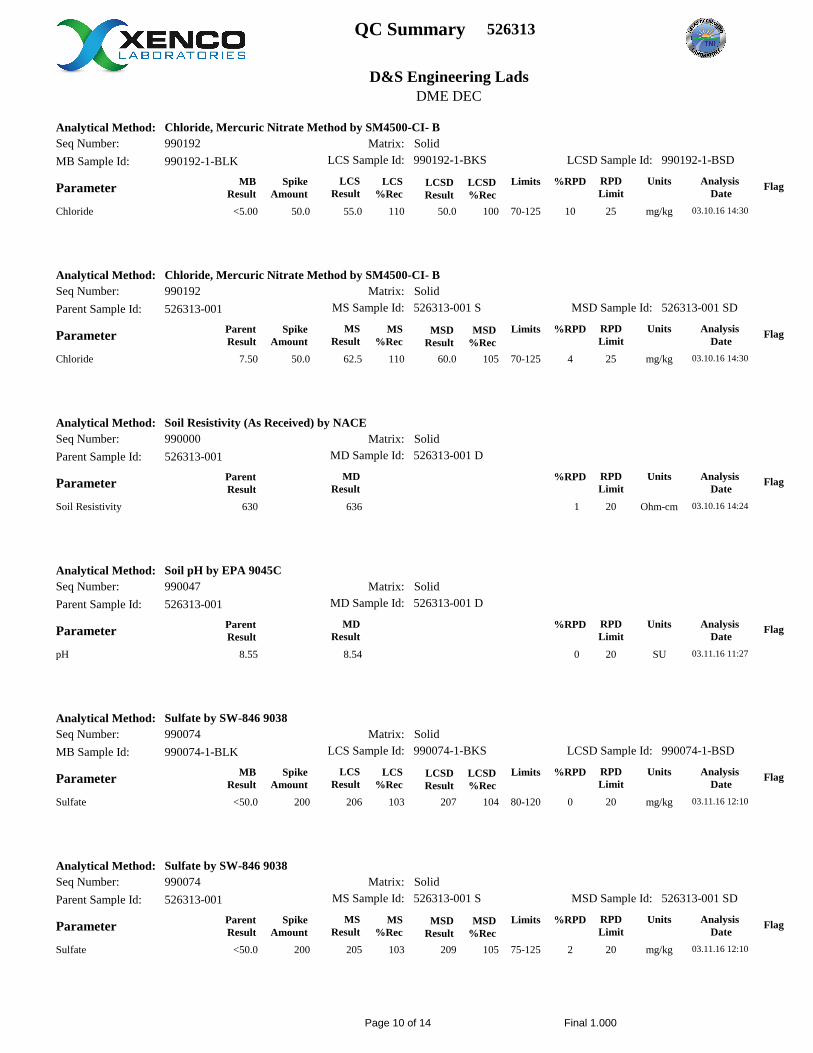
QC Summary 526313
D&S Engineering LadsDME DEC
990192-1-BLK
526313-001
526313-001
526313-001
990074-1-BLK
526313-001
MB Sample Id:
Parent Sample Id:
Parent Sample Id:
Parent Sample Id:
MB Sample Id:
Parent Sample Id:
Solid
Solid
Solid
Solid
Solid
Solid
Matrix:
Matrix:
Matrix:
Matrix:
Matrix:
Matrix:
Chloride, Mercuric Nitrate Method by SM4500-CI- B
Chloride, Mercuric Nitrate Method by SM4500-CI- B
Soil Resistivity (As Received) by NACE
Soil pH by EPA 9045C
Sulfate by SW-846 9038
Sulfate by SW-846 9038
Analytical Method:
Analytical Method:
Analytical Method:
Analytical Method:
Analytical Method:
Analytical Method:
Chloride
Chloride
Soil Resistivity
pH
Sulfate
Sulfate
Parameter
Parameter
Parameter
Parameter
Parameter
Parameter
%RPD
%RPD
%RPD
%RPD
%RPD
%RPD
Flag
Flag
Flag
Flag
Flag
Flag
25
25
20
20
20
20
RPDLimit
RPDLimit
RPDLimit
RPDLimit
RPDLimit
RPDLimit
10
4
1
0
0
2
990192
990192
990000
990047
990074
990074
Seq Number:
Seq Number:
Seq Number:
Seq Number:
Seq Number:
Seq Number:
03.10.16 14:30
03.10.16 14:30
03.10.16 14:24
03.11.16 11:27
03.11.16 12:10
03.11.16 12:10
Analysis Date
Analysis Date
Analysis Date
Analysis Date
Analysis Date
Analysis Date
Limits
Limits
Limits
Limits
70-125
70-125
80-120
75-125
LCSD %Rec
MSD %Rec
LCSD %Rec
MSD %Rec
100
105
104
105
LCSD Result
MSD Result
LCSD Result
MSD Result
50.0
60.0
207
209
LCS %Rec
MS %Rec
LCS %Rec
MS %Rec
110
110
103
103
55.0
62.5
636
8.54
206
205
Spike Amount
Spike Amount
Spike Amount
Spike Amount
50.0
50.0
200
200
MB Result
Parent Result
Parent Result
Parent Result
MB Result
Parent Result
<5.00
7.50
630
8.55
<50.0
<50.0
990192-1-BKS
526313-001 S
526313-001 D
526313-001 D
990074-1-BKS
526313-001 S
LCS Sample Id:
MS Sample Id:
MD Sample Id:
MD Sample Id:
LCS Sample Id:
MS Sample Id:
990192-1-BSD
526313-001 SD
990074-1-BSD
526313-001 SD
LCSD Sample Id:
MSD Sample Id:
LCSD Sample Id:
MSD Sample Id:
mg/kg
mg/kg
Ohm-cm
SU
mg/kg
mg/kg
Units
Units
Units
Units
Units
Units
LCS Result
MS Result
MD Result
MD Result
LCS Result
MS Result
Page 10 of 14 Final 1.000
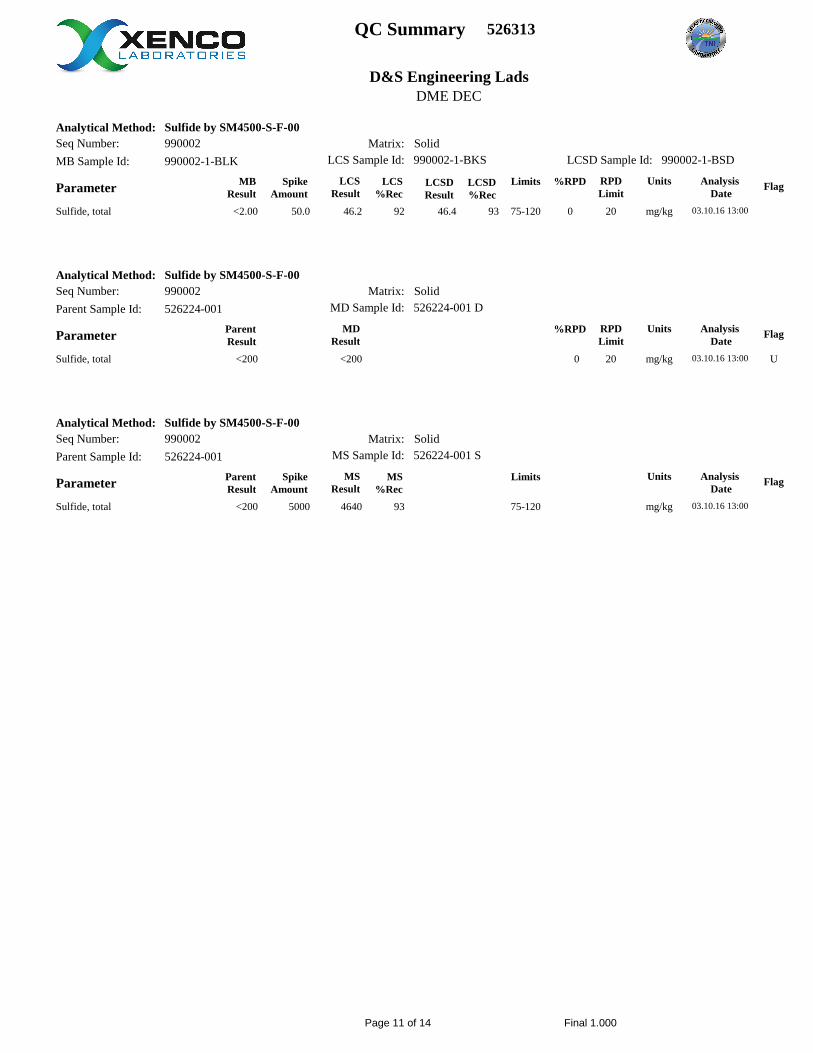
QC Summary 526313
D&S Engineering LadsDME DEC
990002-1-BLK
526224-001
526224-001
MB Sample Id:
Parent Sample Id:
Parent Sample Id:
Solid
Solid
Solid
Matrix:
Matrix:
Matrix:
Sulfide by SM4500-S-F-00
Sulfide by SM4500-S-F-00
Sulfide by SM4500-S-F-00
Analytical Method:
Analytical Method:
Analytical Method:
Sulfide, total
Sulfide, total
Sulfide, total
Parameter
Parameter
Parameter
%RPD
%RPD
U
Flag
Flag
Flag
20
20
RPDLimit
RPDLimit
0
0
990002
990002
990002
Seq Number:
Seq Number:
Seq Number:
03.10.16 13:00
03.10.16 13:00
03.10.16 13:00
Analysis Date
Analysis Date
Analysis Date
Limits
Limits
75-120
75-120
LCSD %Rec
93
LCSD Result
46.4
LCS %Rec
MS %Rec
92
93
46.2
<200
4640
Spike Amount
Spike Amount
50.0
5000
MB Result
Parent Result
Parent Result
<2.00
<200
<200
990002-1-BKS
526224-001 D
526224-001 S
LCS Sample Id:
MD Sample Id:
MS Sample Id:
990002-1-BSDLCSD Sample Id:
mg/kg
mg/kg
mg/kg
Units
Units
Units
LCS Result
MD Result
MS Result
Page 11 of 14 Final 1.000
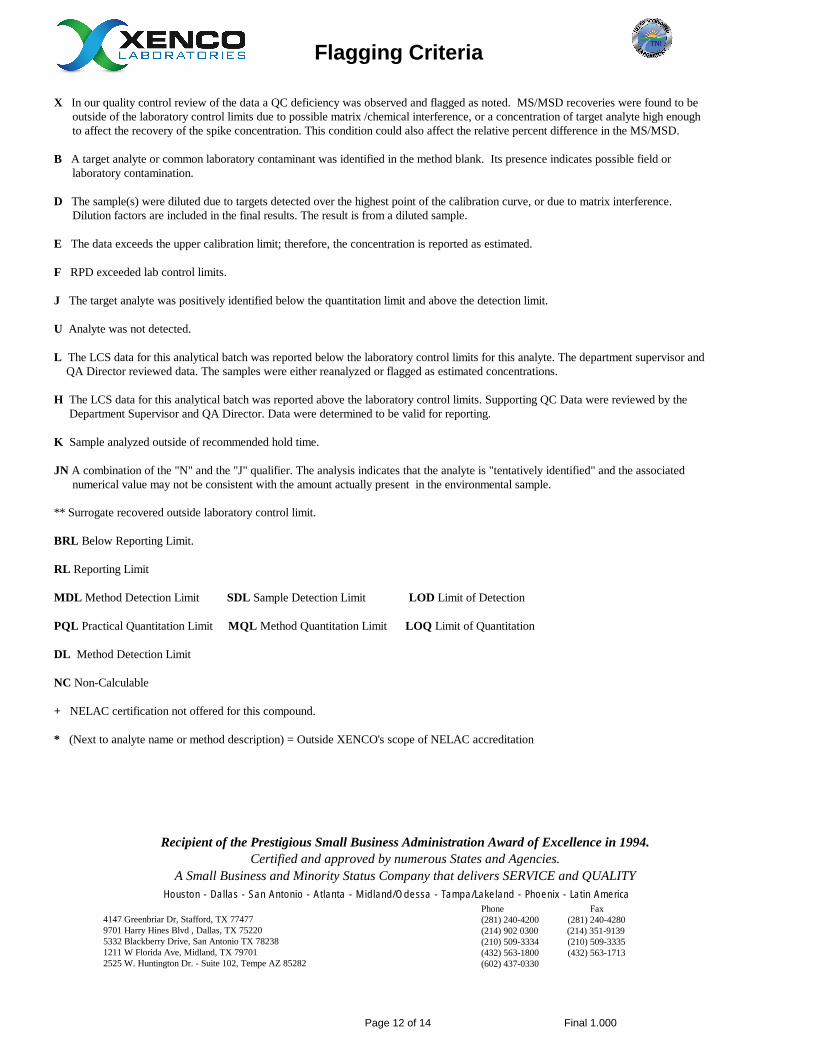
Houston - Dallas - San Antonio - Atlanta - Midland/Odessa - Tampa/Lakeland - Phoenix - Latin America
4147 Greenbriar Dr, Stafford, TX 774779701 Harry Hines Blvd , Dallas, TX 75220 5332 Blackberry Drive, San Antonio TX 78238 1211 W Florida Ave, Midland, TX 797012525 W. Huntington Dr. - Suite 102, Tempe AZ 85282
Phone Fax(281) 240-4200 (281) 240-4280(214) 902 0300 (214) 351-9139(210) 509-3334 (210) 509-3335(432) 563-1800 (432) 563-1713(602) 437-0330
Recipient of the Prestigious Small Business Administration Award of Excellence in 1994.Certified and approved by numerous States and Agencies.
A Small Business and Minority Status Company that delivers SERVICE and QUALITY
Flagging Criteria
X In our quality control review of the data a QC deficiency was observed and flagged as noted. MS/MSD recoveries were found to be outside of the laboratory control limits due to possible matrix /chemical interference, or a concentration of target analyte high enough to affect the recovery of the spike concentration. This condition could also affect the relative percent difference in the MS/MSD.
B A target analyte or common laboratory contaminant was identified in the method blank. Its presence indicates possible field or laboratory contamination.
D The sample(s) were diluted due to targets detected over the highest point of the calibration curve, or due to matrix interference. Dilution factors are included in the final results. The result is from a diluted sample.
E The data exceeds the upper calibration limit; therefore, the concentration is reported as estimated.
F RPD exceeded lab control limits.
J The target analyte was positively identified below the quantitation limit and above the detection limit.
U Analyte was not detected.
L The LCS data for this analytical batch was reported below the laboratory control limits for this analyte. The department supervisor and QA Director reviewed data. The samples were either reanalyzed or flagged as estimated concentrations.
H The LCS data for this analytical batch was reported above the laboratory control limits. Supporting QC Data were reviewed by the Department Supervisor and QA Director. Data were determined to be valid for reporting.
K Sample analyzed outside of recommended hold time.
JN A combination of the "N" and the "J" qualifier. The analysis indicates that the analyte is "tentatively identified" and the associated numerical value may not be consistent with the amount actually present in the environmental sample.
** Surrogate recovered outside laboratory control limit.
BRL Below Reporting Limit.
RL Reporting Limit
MDL Method Detection Limit SDL Sample Detection Limit LOD Limit of Detection
PQL Practical Quantitation Limit MQL Method Quantitation Limit LOQ Limit of Quantitation
DL Method Detection Limit
NC Non-Calculable
+ NELAC certification not offered for this compound. * (Next to analyte name or method description) = Outside XENCO's scope of NELAC accreditation
Page 12 of 14 Final 1.000
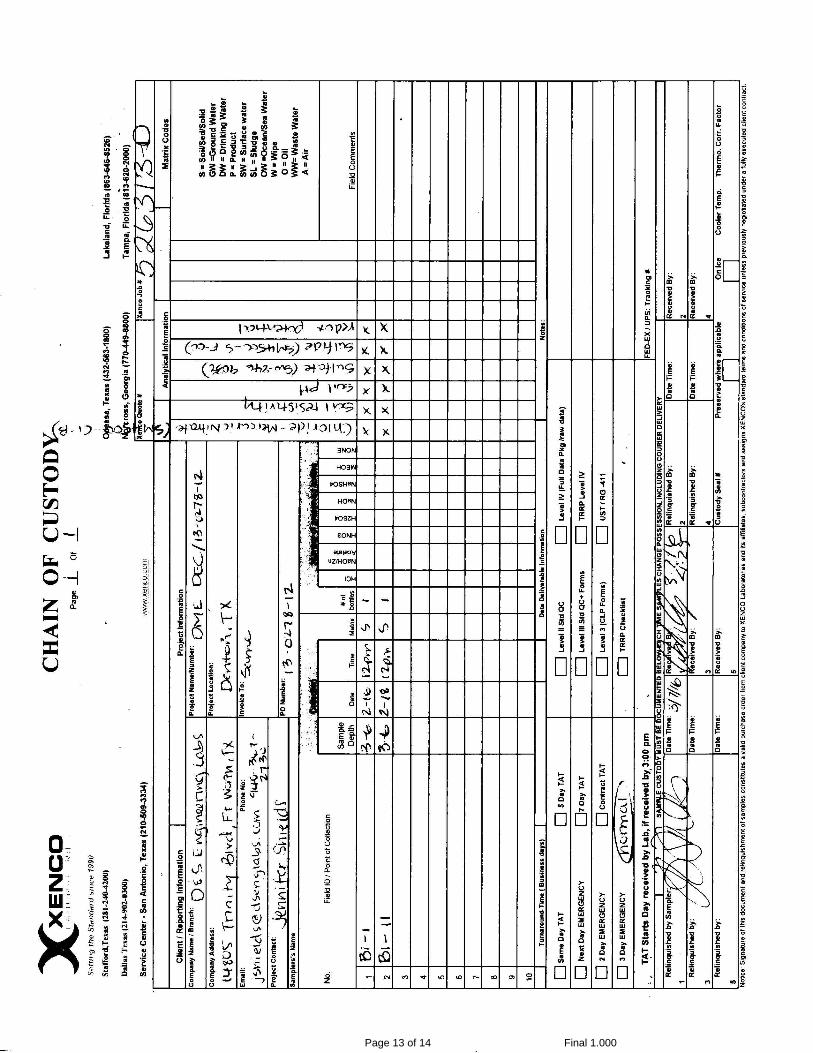
Page 13 of 14 Final 1.000
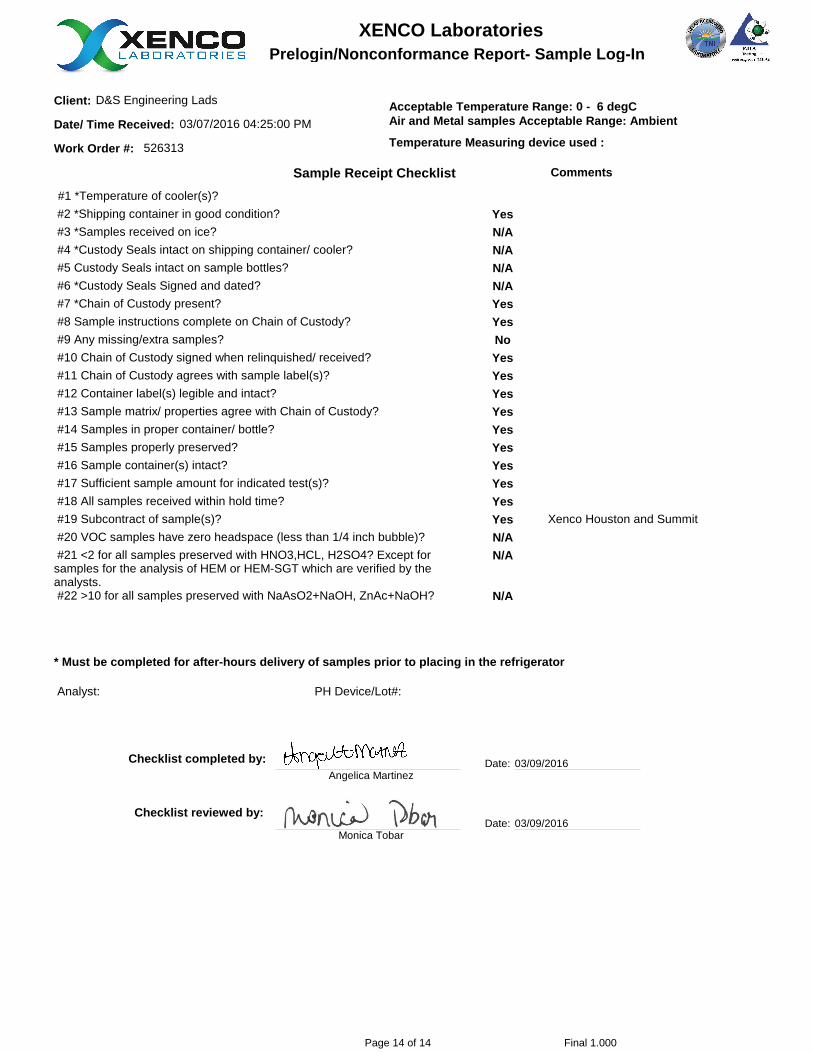
Prelogin/Nonconformance Report- Sample Log-InXENCO Laboratories
526313Work Order #:
03/07/2016 04:25:00 PMDate/ Time Received:
D&S Engineering Lads Client:
Sample Receipt Checklist
Checklist completed by: Date:
Checklist reviewed by:Date:
Monica Tobar
03/09/2016
03/09/2016
#2 *Shipping container in good condition? #3 *Samples received on ice? #4 *Custody Seals intact on shipping container/ cooler? #5 Custody Seals intact on sample bottles? #6 *Custody Seals Signed and dated? #7 *Chain of Custody present? #8 Sample instructions complete on Chain of Custody? #9 Any missing/extra samples? #10 Chain of Custody signed when relinquished/ received? #11 Chain of Custody agrees with sample label(s)? #12 Container label(s) legible and intact? #13 Sample matrix/ properties agree with Chain of Custody? #14 Samples in proper container/ bottle? #15 Samples properly preserved? #16 Sample container(s) intact? #17 Sufficient sample amount for indicated test(s)? #18 All samples received within hold time? #19 Subcontract of sample(s)? #20 VOC samples have zero headspace (less than 1/4 inch bubble)? #21 <2 for all samples preserved with HNO3,HCL, H2SO4? Except forsamples for the analysis of HEM or HEM-SGT which are verified by theanalysts. #22 >10 for all samples preserved with NaAsO2+NaOH, ZnAc+NaOH?
YesN/AN/AN/AN/AYesYesNoYesYesYesYesYesYesYesYesYesYesN/AN/A
N/A
Xenco Houston and Summit
#1 *Temperature of cooler(s)?
Acceptable Temperature Range: 0 - 6 degCAir and Metal samples Acceptable Range: Ambient
* Must be completed for after-hours delivery of samples prior to placing in the refrigerator
Analyst: PH Device/Lot#:
Comments
Angelica Martinez
Temperature Measuring device used :
Page 14 of 14 Final 1.000
March 14, 2016
Xenco Laboratories
Monica Tobar
Dear Monica Tobar:
RE: 1033633
Order No.: 16030650
FAX: (214) 351-9139
TEL: (214) 902-0300
9701 Harry Hines Blvd
Dallas, Texas 75220
Summit Environmental Technologies, Inc.3310 Win St.
Cuyahoga Falls, Ohio 44223
Website: http://www.settek.comTEL: (330) 253-8211 FAX: (330) 253-4489
Bachar Najm
Project Manager
3310 Win St.Cuyahoga Falls, Ohio 44223
There were no problems with the analytical events associated with this report unless noted in the Case Narrative.
Quality control data is within laboratory defined or method specified acceptance limits except where noted.
If you have any questions regarding these tests results, please feel free to call the laboratory.
Sincerely,
Summit Environmental Technologies, Inc. received 2 sample(s) on 3/10/2016 for the analyses presented in the following report.
Page 1 of 7
Alabama 41600, Arkansas 88-0735, California 07256CA, Colorado, Connecticut PH-0105, Delaware, Florida NELAC E87688, Georgia E87688 and 943, Idaho OH00923, Illinois 200061 and Reg.5, Indiana C-OH-13, Kansas E-10347, Kentucky (Underground Storage Tank) 3, Kentucky 90146, Louisiana 04061 and LA12004, Maine 2012015, Maryland 339, Massachusetts M-OPH923, Minnesota 409711, Montana CERT0099, New Hampshire 2996, New Jersey OH006, New York 11777, North Carolina 39705 and 631, Ohio Drinking Water 4170, Ohio VAP CL0052, Oklahoma 9940, Oregon OH200001, Rhode Island LA000317, South Carolina 92016001, Texas T104704466-11-5, Region 8 8TMS-L, USDA/APHIS P330-11-00244, Utah OH009232011-1, Vermont VT-87688, Virginia 00440 and 1581, Washington C891, West Virginia 248 and 9957C and E87688, Wisconsin 399013010
Project: 1033633
CLIENT: Xenco Laboratories
3/14/2016
Case Narrative16030650
Date:
WO#:
Summit Environmental Technologies, Inc.3310 Win St.
Cuyahoga Falls, Ohio 44223
Website: http://www.settek.comTEL: (330) 253-8211 FAX: (330) 253-4489
This report in its entirety consists of the documents listed below. All documents contain the Summit Environmental Technologies, Inc., Work Order Number assigned to this report.
Paginated Report including Cover Letter, Case Narrative, Analytical Results, Applicable Quality Control Summary Reports, and copies of the Chain of Custody Documents are supplied with this sample set.
Concentrations reported with a J-Flag in the Qualifier Field are values below the Limit of Quantitation (LOQ) but greater than the established Method Detection Limit (MDL).
Method numbers, unless specified as SM (Standard Methods) or ASTM, are EPA methods.
Estimated uncertainty values are available upon request.
Analysis performed by DBM, VRM, or SFG were performed at Summit Labs 2704 Eatonton Highway Haddock, GA 31033
All results for Solid Samples are reported on an "as received" or "wet weight" basis unless indicated as "dry weight" using the "-dry" designation on the reporting units.
Summit Environmental Technologies, Inc., holds the accreditations/certifications listed at the bottom of the cover letter that may or may not pertain to this report.
The information contained in this analytical report is the sole property of Summit Environmental Technologies, Inc. and that of the customer. It cannot be reproduced in any form without the consent of Summit Environmental Technologies, Inc. or the customer for which this report was issued. The results contained in this report are only representative of the samples received. Conditions can vary at different times and at different sampling conditions. Summit Environmental Technologies, Inc. is not responsible for use or interpretation of the data included herein.
This report is believed to meet all of the requirements of NELAC or the accrediting / certifying agency. Any comments or problems with the analytical events associated with this report are noted below.
Page 2 of 7
Original

3/14/2016
Qualifiers and Acronyms16030650
Date:
WO#:
These commonly used Qualifiers and Acronyms may or may not be present in this report.
Summit Environmental Technologies, Inc.3310 Win St.
Cuyahoga Falls, Ohio 44223
Website: http://www.settek.comTEL: (330) 253-8211 FAX: (330) 253-4489
This list of Qualifiers and Acronyms reflects the most commonly utilized Qualifiers and Acronyms for reporting. Please refer to the Analytical Notes in the Case Narrative for any Qualifiers or Acronyms that do not appear in this list or for additional information regarding the use of these Qualifiers on reported data.
Qualifiers U The compound was analyzed for but was not detected. J The reported value is greater than the Method Detection Limit but less than the Reporting Limit. H The hold time for sample preparation and/or analysis was exceeded. D The result is reported from a dilution. E The result exceeded the linear range of the calibration or is estimated due to interference. MC The result is below the Minimum Compound Limit. * The result exceeds the Regulatory Limit or Maximum Contamination Limit. m Manual integration was used to determine the area response. N The result is presumptive based on a Mass Spectral library search assuming a 1:1 response. P The second column confirmation exceeded 25% difference. C The result has been confirmed by GC/MS. X The result was not confirmed when GC/MS Analysis was performed. B/MB+ The analyte was detected in the associated blank. G The ICB or CCB contained reportable amounts of analyte. QC-/+ The CCV recovery failed low (-) or high (+). R/QDR The RPD was outside of accepted recovery limits. QL-/+ The LCS or LCSD recovery failed low (-) or high (+). QLR The LCS/LCSD RPD was outside of accepted recovery limits. QM-/+ The MS or MSD recovery failed low (-) or high (+). QMR The MS/MSD RPD was outside of accepted recovery limits. QV-/+ The ICV recovery failed low (-) or high (+). S The spike result was outside of accepted recovery limits. Z Deviation; A deviation from the method was performed; Please refer to the Case Narrative for
additional information Acronyms ND Not Detected RL Reporting Limit QC Quality Control MDL Method Detection Limit MB Method Blank LOD Level of Detection LCS Laboratory Control Sample LOQ Level of Quantitation LCSD Laboratory Control Sample Duplicate PQL Practical Quantitation Limit QCS Quality Control Sample CRQL Contract Required Quantitation Limit DUP Duplicate PL Permit Limit MS Matrix Spike RegLvl Regulatory Limit MSD Matrix Spike Duplicate MCL Maximum Contamination Limit RPD Relative Percent Different MinCL Minimum Compound Limit ICV Initial Calibration Verification RA Reanalysis ICB Initial Calibration Blank RE Reextraction CCV Continuing Calibration Verification TIC Tentatively Identified Compound CCB Continuing Calibration Blank RT Retention Time RLC Reporting Limit Check CF Calibration Factor DF Dilution Factor RF Response Factor
Page 3 of 7
Original
Project: 1033633
CLIENT: Xenco Laboratories
Lab SampleID Client Sample ID Tag No Date ReceivedDate Collected
14-Mar-16
WorkorderSample Summary
16030650WO#:
Matrix
Summit Environmental Technologies, Inc.3310 Win St.
Cuyahoga Falls, Ohio 44223
Website: http://www.settek.comTEL: (330) 253-8211 FAX: (330) 253-4489
16030650-001 526313-001 2/16/2016 12:00:00 PM 3/10/2016 12:00:00 PM Solid
16030650-002 526313-002 2/18/2016 12:00:00 PM 3/10/2016 12:00:00 PM Solid
Page 4 of 7
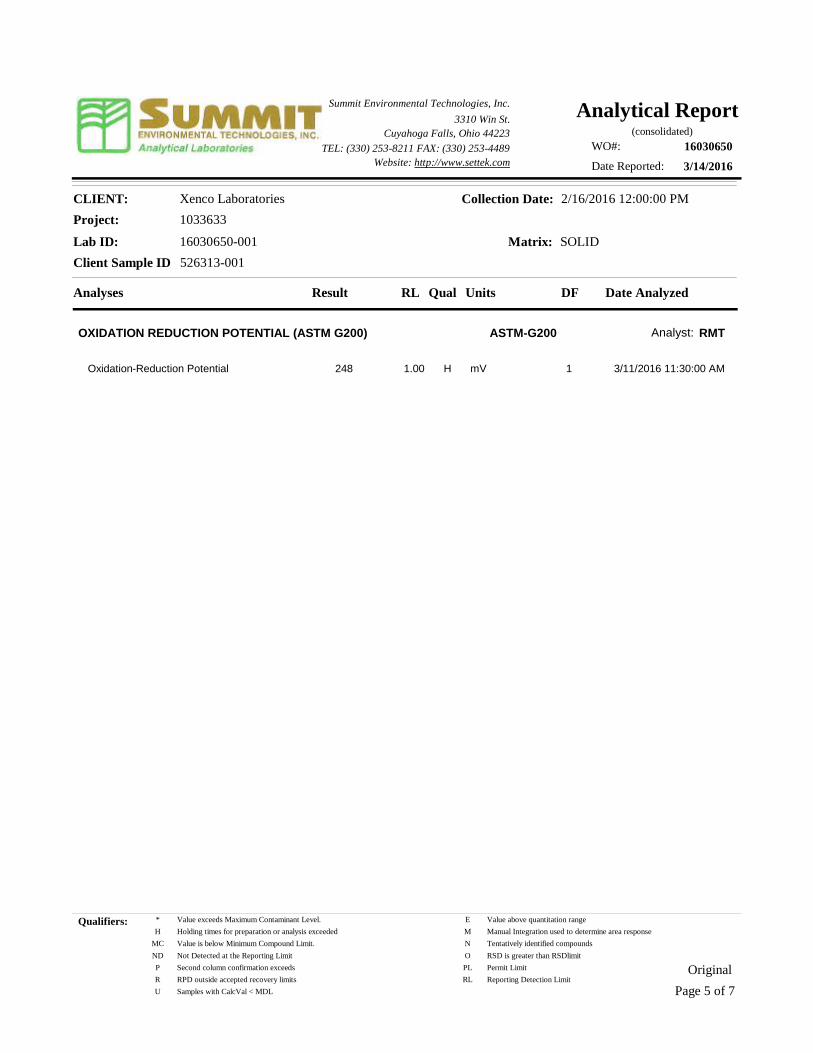
Project: 1033633
Client Sample ID 526313-001
Collection Date: 2/16/2016 12:00:00 PM
Matrix: SOLID
CLIENT: Xenco Laboratories
Lab ID: 16030650-001
3/14/2016
Analytical Report16030650
Date Reported:
WO#:
(consolidated)
Analyses Result Qual Units Date AnalyzedDFRL
Summit Environmental Technologies, Inc.3310 Win St.
Cuyahoga Falls, Ohio 44223
Website: http://www.settek.comTEL: (330) 253-8211 FAX: (330) 253-4489
OXIDATION REDUCTION POTENTIAL (ASTM G200) ASTM-G200 Analyst: RMT
Oxidation-Reduction Potential H 3/11/2016 11:30:00 AM1.00 mV 1248
Qualifiers:
Page 5 of 7
Original
* Value exceeds Maximum Contaminant Level. E Value above quantitation range
H Holding times for preparation or analysis exceeded M Manual Integration used to determine area response
MC Value is below Minimum Compound Limit. N Tentatively identified compounds
ND Not Detected at the Reporting Limit O RSD is greater than RSDlimit
P Second column confirmation exceeds PL Permit Limit
R RPD outside accepted recovery limits RL Reporting Detection Limit
U Samples with CalcVal < MDL
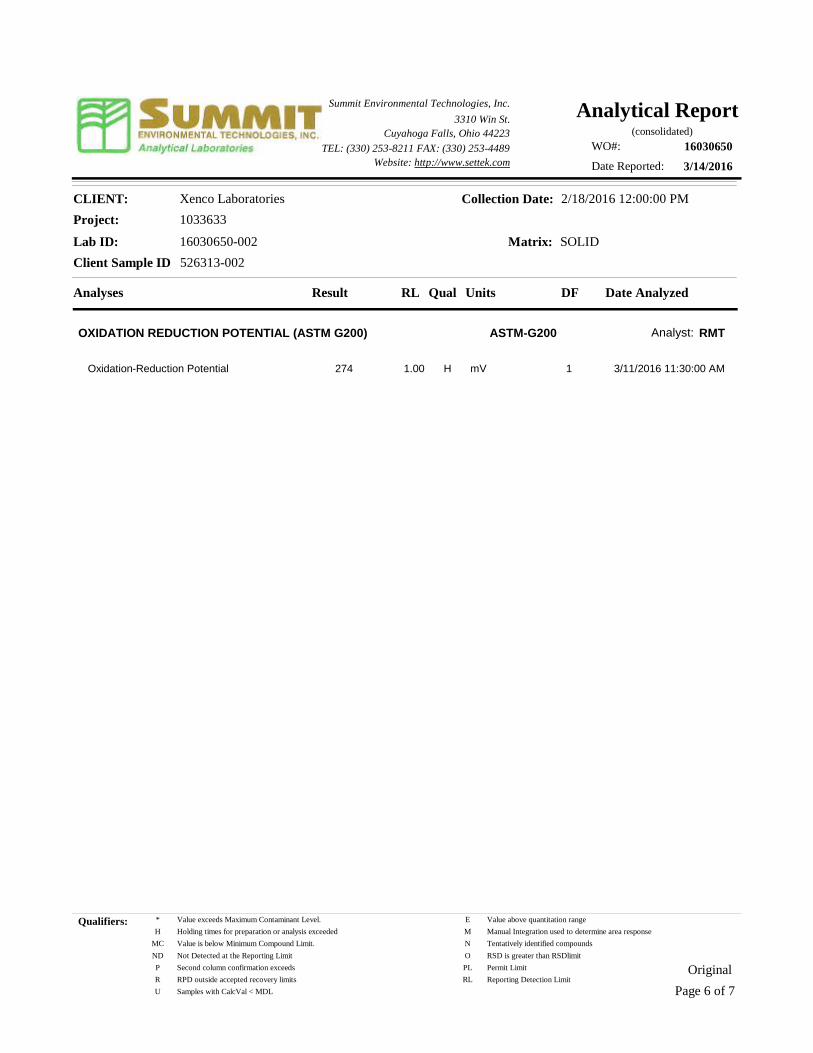
Project: 1033633
Client Sample ID 526313-002
Collection Date: 2/18/2016 12:00:00 PM
Matrix: SOLID
CLIENT: Xenco Laboratories
Lab ID: 16030650-002
3/14/2016
Analytical Report16030650
Date Reported:
WO#:
(consolidated)
Analyses Result Qual Units Date AnalyzedDFRL
Summit Environmental Technologies, Inc.3310 Win St.
Cuyahoga Falls, Ohio 44223
Website: http://www.settek.comTEL: (330) 253-8211 FAX: (330) 253-4489
OXIDATION REDUCTION POTENTIAL (ASTM G200) ASTM-G200 Analyst: RMT
Oxidation-Reduction Potential H 3/11/2016 11:30:00 AM1.00 mV 1274
Qualifiers:
Page 6 of 7
Original
* Value exceeds Maximum Contaminant Level. E Value above quantitation range
H Holding times for preparation or analysis exceeded M Manual Integration used to determine area response
MC Value is below Minimum Compound Limit. N Tentatively identified compounds
ND Not Detected at the Reporting Limit O RSD is greater than RSDlimit
P Second column confirmation exceeds PL Permit Limit
R RPD outside accepted recovery limits RL Reporting Detection Limit
U Samples with CalcVal < MDL
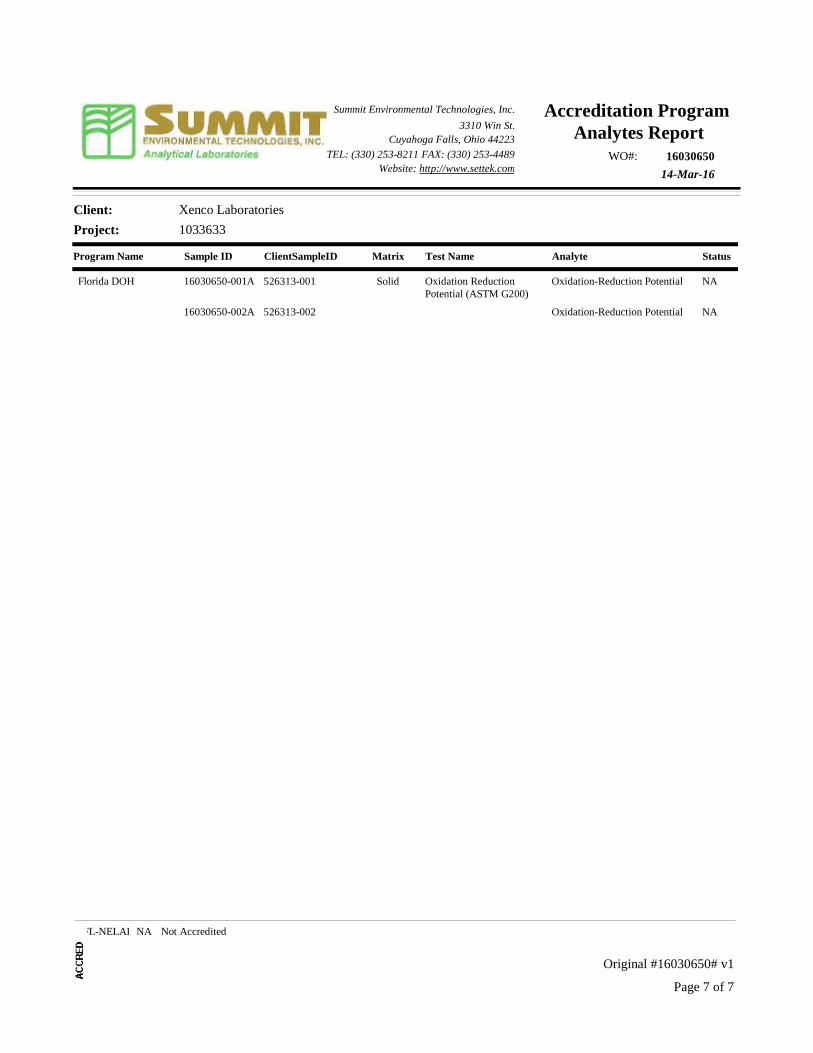
Sample ID ClientSampleIDProgram Name Matrix Status
Client: Xenco Laboratories
Project: 1033633
Test Name Analyte
14-Mar-16
Accreditation Program Analytes Report
16030650WO#:
Summit Environmental Technologies, Inc.3310 Win St.
Cuyahoga Falls, Ohio 44223
Website: http://www.settek.comTEL: (330) 253-8211 FAX: (330) 253-4489
16030650-001A 526313-001Florida DOH Solid Oxidation Reduction Potential (ASTM G200)
NAOxidation-Reduction Potential
16030650-002A 526313-002 NAOxidation-Reduction Potential
Page 7 of 7
Original #16030650# v1
FL-NELAP Not AccreditedNA
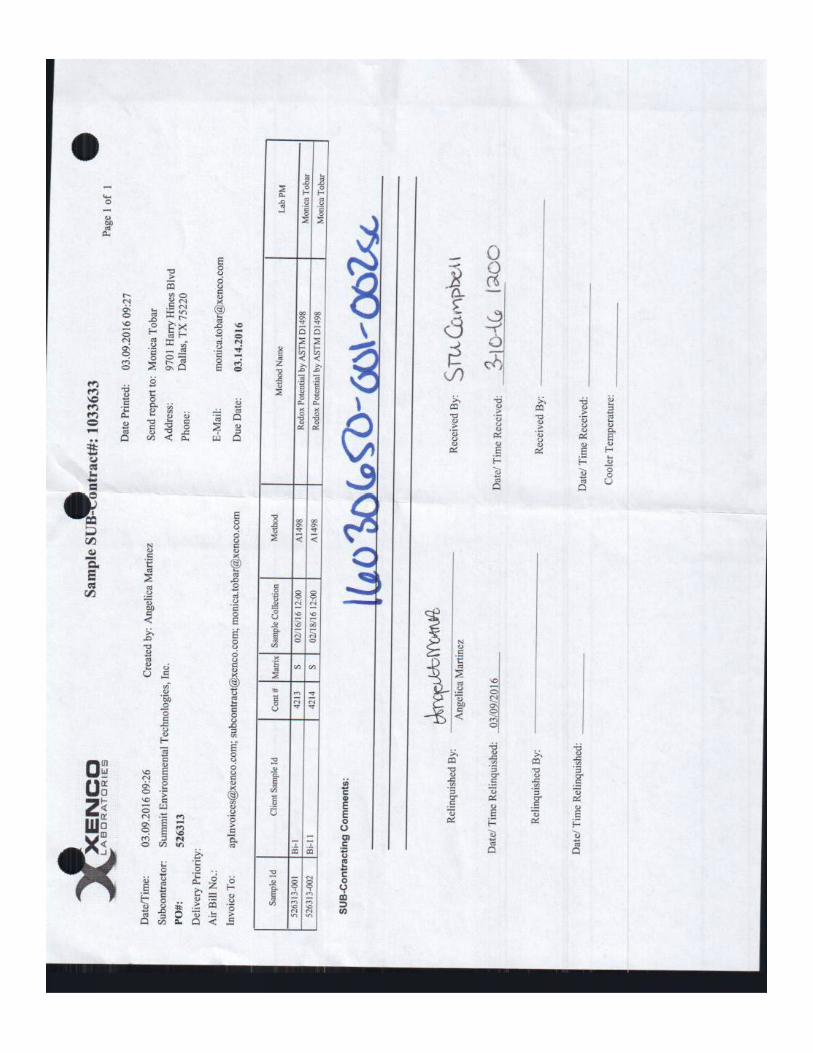
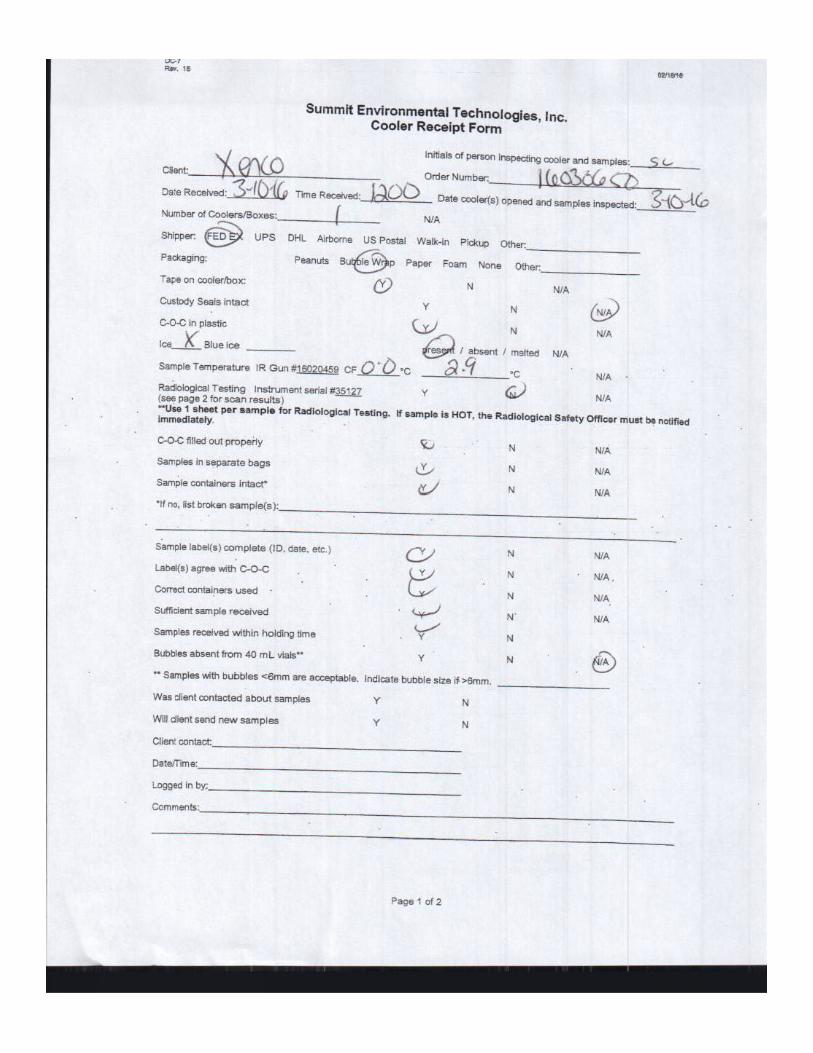

APPENDIX E – GENERAL DESCRIPTION OF PROCEDURES
D&S ENGINEERING LABS, LLC DME Denton Energy Center - Denton, Texas (13-0278-12)
ANALYTICAL METHODS TO PREDICT MOVEMENT
INDEX PROPERTY TESTS
Index property testing is perhaps the most basic, yet fundamental tool available for predicting potential movements of clay soils. Index property testing typically consists of moisture content, Atterberg Limits, and Grain-size distribution determinations. From these results a general assessment of a soil’s propensity for volume change with changes in soil moisture content can be made.
Moisture Content
By studying the moisture content of the soils at varying depths and comparing them with the results of Atterberg Limits, one can estimate a rough order of magnitude of potential soil movement at various moisture contents, as well as movements with moisture changes. These tests are typically performed in accordance with ASTM D 2216.
Atterberg Limits
Atterberg limits determine the liquid limit (LL), plastic limit (PL), and plasticity index (PI) of a soil. The liquid limit is the moisture content at which a soil begins to behave as a viscous fluid. The plastic limit is the moisture content at which a soil becomes workable like putty, and at which a clay soil begins to crumble when rolled into a thin thread (1/8” diameter). The PI is the numerical difference between the moisture constants at the liquid limit and the plastic limit. This test is typically performed in accordance with ASTM D 4318.
Clay mineralogy and the particle size influence the Atterberg Limits values, with certain minerals (e.g., montmorillonite) and smaller particle sizes having higher PI values, and therefore higher movement potential.
A soil with a PI below about 15 to 18 is considered to be generally stable and should not experience significant movement with changes in moisture content. Soils with a PI above about 30 to 35 are considered to be highly active and may exhibit considerable movement with changes in moisture content.
Fat clays with high very liquid limits, weakly cemented sandy clays, or silty clays are examples of soils in which it can be difficult to predict movement from index property testing alone.
Grain-size Distribution The simplest grain-size distribution test involves washing a soil specimen over the No. 200 mesh sieve with an opening size of 0.075 mm (ASTM D 1140)). This particle size has been defined by the engineering community as the demarcation between coarse-grained and fine-grained soils. Particles smaller than this size can be further distinguished between silt-size and clay-size particles by use of a Hydrometer test (ASTM D 422). Once the characteristics of the soil are determined through index property testing, a number of movement prediction techniques are available to predict the potential movement of the soils. Some of these are discussed in general below.
D&S ENGINEERING LABS, LLC DME Denton Energy Center - Denton, Texas (13-0278-12)
TEXAS DEPARTMENT OF TRANSPORTATION METHOD 124-E The Texas Department of Transportation (TxDOT) has developed a generally simplistic method to predict movements for highways based on the plasticity index of the soil. The TxDOT method is empirical and is based on the Atterberg limits and moisture content of the subsurface soil. This method generally assumes three different initial moisture conditions: dry, “as-is”, and wet. Computation of each over an assumed depth of seasonal moisture variation (usually about 15 feet or less) provides an estimate of potential movement at each initial condition. This method requires a number of additional assumptions to develop a potential movement estimate. As such, the predicted movements generally possess large uncertainties when applied to the analysis of conditions under building slabs and foundations. In our opinion, estimates derived by this method should not be used alone in determination of potential movement. SUCTION Suction measurements may be used along with other movement prediction methods to predict soil movement. Suction is a measure of the ability of a soil to attract or lose moisture between the soil particles. Since changes in soil moisture result in volume changes within the soil mass of fine-grained soils (clays and to some degree silts), a knowledge of the suction potential of a soil mass at a given point in time may be used to estimate potential future volume changes with changes in soil moisture content. For this analysis, a series of suction measurements versus depth is typically performed on a number of soil samples recovered from a boring in order to develop a suction profile. SWELL TESTS Swell tests can lead to more accurate site specific predictions of potential vertical movement by measuring actual swell volumes at in situ initial moisture contents. One-dimensional swell tests are almost always performed for this measurement. Though swell is a three-dimensional process, the one-dimensional test provides greatly improved potential vertical movement estimates than other methods alone, particularly when the results are “weighted” with respect to depth, putting more emphasis on the swell characteristics closer to the surface and less on values at depth. WIRE REINFORCEMENT INSTITUTE The Wire Reinforcement Institute (WRI) has developed a design methodology using a weighted plasticity index. This index is modified for ground slope and the strength of the soil. These values are also used as input into the movement potential.
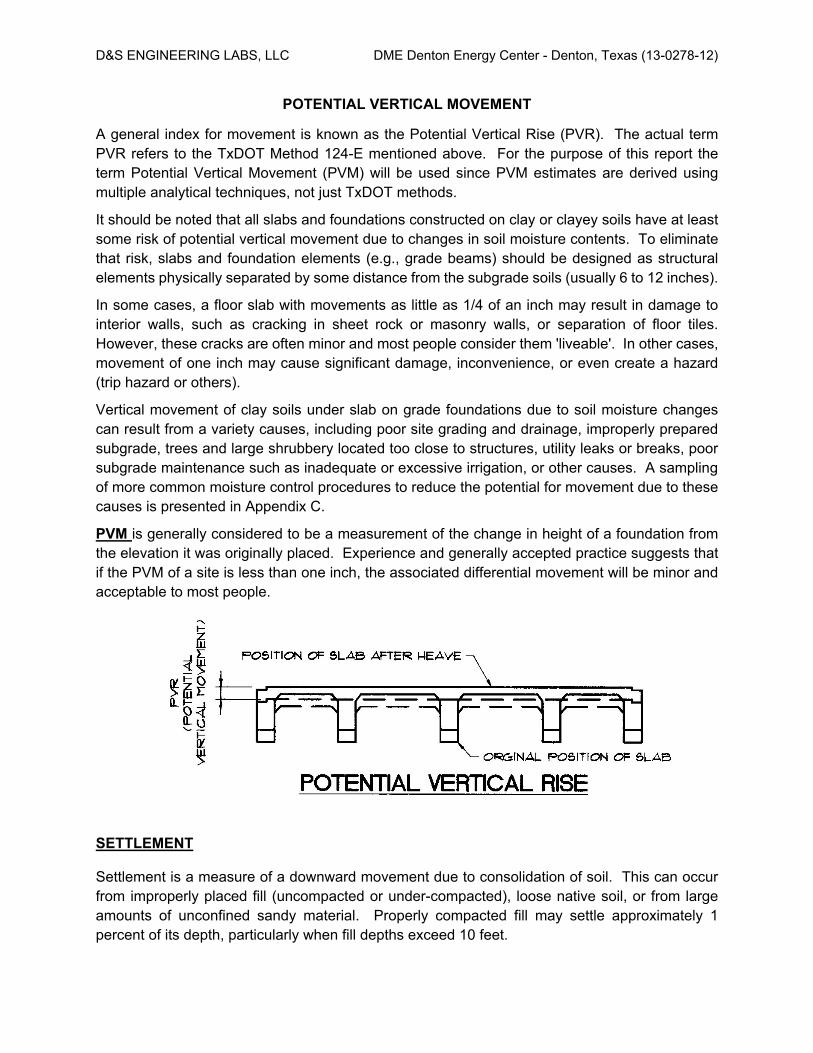
D&S ENGINEERING LABS, LLC DME Denton Energy Center - Denton, Texas (13-0278-12)
POTENTIAL VERTICAL MOVEMENT
A general index for movement is known as the Potential Vertical Rise (PVR). The actual term PVR refers to the TxDOT Method 124-E mentioned above. For the purpose of this report the term Potential Vertical Movement (PVM) will be used since PVM estimates are derived using multiple analytical techniques, not just TxDOT methods.
It should be noted that all slabs and foundations constructed on clay or clayey soils have at least some risk of potential vertical movement due to changes in soil moisture contents. To eliminate that risk, slabs and foundation elements (e.g., grade beams) should be designed as structural elements physically separated by some distance from the subgrade soils (usually 6 to 12 inches).
In some cases, a floor slab with movements as little as 1/4 of an inch may result in damage to interior walls, such as cracking in sheet rock or masonry walls, or separation of floor tiles. However, these cracks are often minor and most people consider them 'liveable'. In other cases, movement of one inch may cause significant damage, inconvenience, or even create a hazard (trip hazard or others).
Vertical movement of clay soils under slab on grade foundations due to soil moisture changes can result from a variety causes, including poor site grading and drainage, improperly prepared subgrade, trees and large shrubbery located too close to structures, utility leaks or breaks, poor subgrade maintenance such as inadequate or excessive irrigation, or other causes. A sampling of more common moisture control procedures to reduce the potential for movement due to these causes is presented in Appendix C.
PVM is generally considered to be a measurement of the change in height of a foundation from the elevation it was originally placed. Experience and generally accepted practice suggests that if the PVM of a site is less than one inch, the associated differential movement will be minor and acceptable to most people.
SETTLEMENT Settlement is a measure of a downward movement due to consolidation of soil. This can occur from improperly placed fill (uncompacted or under-compacted), loose native soil, or from large amounts of unconfined sandy material. Properly compacted fill may settle approximately 1 percent of its depth, particularly when fill depths exceed 10 feet.
14805 Trinity Boulevard, Fort Worth, Texas 76155
Geotechnical 817.529.8464 Corporate 940.735.3733
www.dsenglabs.com
Texas Engineering Firm Registration # F‐12796
Oklahoma Engineering Firm Certificate of Authorization CA 7181