Geotechnical Asset Management – Unstable Slope … · UNSTABLE SLOPE RATING ... such as Rock...
33
GEOTECHNICAL ASSET MANAGEMENT – UNSTABLE SLOPE RATING CATEGORY DESCRIPTIONS FOR FEDERAL LAND MANAGEMENT AGENCIES April 19, 2017 Landslide Technology and FHWA - Western Federal Lands
-
Upload
nguyenphuc -
Category
Documents
-
view
217 -
download
1
Transcript of Geotechnical Asset Management – Unstable Slope … · UNSTABLE SLOPE RATING ... such as Rock...

GEOTECHNICAL ASSET MANAGEMENT –
UNSTABLE SLOPE RATING CATEGORY DESCRIPTIONS
FOR FEDERAL LAND MANAGEMENT AGENCIES
April 19, 2017
Landslide Technology and FHWA - Western Federal Lands

Landslide Technology i April 19, 2017
CONTENTS 1 Site Information .................................................................................................................................... 1
1.1 Hazard Type .................................................................................................................................. 1
1.2 Length of Affected Road/Trail ....................................................................................................... 2
1.3 Slope Height/Axial Length ............................................................................................................. 2
1.4 Slope angle .................................................................................................................................... 3
1.5 Sight Distance ................................................................................................................................ 3
1.6 Roadway/Trail Width .................................................................................................................... 3
1.7 Ditch Width/Depth/Foreslope ...................................................................................................... 3
1.8 Block Size/Rockfall Volume ........................................................................................................... 4
1.9 Annual Rainfall .............................................................................................................................. 4
1.10 Sole Access Route ......................................................................................................................... 4
1.11 Mitigation Present ........................................................................................................................ 4
2 Preliminary Ratings ............................................................................................................................... 5
2.1 Landslide-Specific Preliminary Ratings.......................................................................................... 5
A. Roadway Width Affected ............................................................................................ 5 B. Slide/Erosion Effects ................................................................................................... 7 C. Roadway Length Affected ........................................................................................... 8
2.2 Rockfall-Specific Preliminary Ratings ............................................................................................ 8
D. Ditch Effectiveness ...................................................................................................... 8 E. Rockfall History ........................................................................................................... 9 F. Block Size or Volume per Event ................................................................................ 10
2.3 Common Preliminary Slope Ratings ............................................................................................ 12
G. Impact on Use ........................................................................................................... 12 H. Annual Average Daily Traffic (AADT) or Usage/Economic/Recreational Importance 13
3 Detailed Hazard Ratings ...................................................................................................................... 14
3.1 Common Hazard Ratings ............................................................................................................. 14
I. Slope Drainage .......................................................................................................... 14 J. Annual Rainfall .......................................................................................................... 15 K. Slope Height or Axial Length of Slide ........................................................................ 15
3.2 Landslide-Specific Hazards .......................................................................................................... 16
L. Thaw Stability (Cold Climates) .................................................................................. 16 M. Instability-Related Maintenance Frequency ............................................................. 17 N. Movement History .................................................................................................... 18
3.3 Rockfall-Specific Hazards ............................................................................................................ 18
O. Rockfall Related Maintenance Frequency ................................................................ 18 P. Case 1 - Structural Condition .................................................................................... 20 Q. Case 1 - Rock Friction ................................................................................................ 21 R. Case 2 - Structural Condition .................................................................................... 22 S. Case 2 - Differential Erosion Rate ............................................................................. 22
4 Detailed Risk Ratings ........................................................................................................................... 24
V. Route Width or Trail Width ....................................................................................... 24 W. Human Exposure Factor ............................................................................................ 25 X. Percent Decision Sight Distance (PDSD) or Avoidance Ability on Trails ................... 26 Y. Right of Way Impacts if Left Unattended ................................................................. 27

Landslide Technology ii April 19, 2017
Z. Environmental/Cultural Impacts if Left Unattended ................................................ 28 AA. Maintenance Complexity .......................................................................................... 28 BB. Event Cost ................................................................................................................. 29
LIST OF FIGURES Figure 1-1: Simplified rock slope failure types (planar, wedge, toppling, and circular adapted from Hoek
and Bray, 1981). ..................................................................................................................................... 1 Figure 1-2: Simplified landslide failure types (modifed from Ohio DOT, California Geological Survey and
Cornforth, 2005). .................................................................................................................................... 2 Figure 1-3: Examples of measuring vertical slope height on a rock slope and axial length on a landslide. . 3 Figure 1-4: Simple schematic of rockslope ditch. ......................................................................................... 3 Figure 2-1: Embankment failure affecting up to 25 percent of the roadway. Forest Service Road 25,
Milepost 30. ............................................................................................................................................ 6 Figure 2-2: Embankment failure affecting entire roadway. Forest Service Road 25, Milepost 25. .............. 6 Figure 2-3: Roadway deformation caused by embankment failure. Forest Service Road 90, Milepost
11.5. ........................................................................................................................................................ 7 Figure 2-4: Chart illustrating the relationship between the length of roadway affected and the category
score. The category score maxes out at an affected roadway length of about 440 feet. .................... 8 Figure 2-5: Ditch effectiveness explanatory diagram ................................................................................... 9 Figure 2-6: Rockfall debris in the roadside ditch can be used to help assess both block size/event volume
and failure type. Forest Service Rd 25, Milepost 25. ........................................................................... 11 Figure 2-7: Chart pair illustrating the relationship between the block size and the category score and
between the event volume and the category score. Note that the category score for block size maxes out for block sizes greater than 4 feet, while the category score for event volume maxes out for events over 12 cubic yards. ............................................................................................................ 12
Figure 2-8: Chart illustrating the relationship between AADT and the category score. The category score maxes out at an AADT of approximately 880 vehicles. ........................................................................ 13
Figure 3-1: Guidance figure for evaluating slope drainage. ........................................................................ 14 Figure 3-2: Examples of measuring vertical slope height on a rock slope and axial length on a landslide.15 Figure 3-3: Chart illustrating the relationship between the slope height or axial length and the category
score. The category score maxes out at height/axial length of approximately 105 feet .................... 16 Figure 3-4: Instability requiring repeated maintenance attention. Forest Service Road 25, Milepost 25. 17 Figure 3-5: Constant rockfalls occur at this rock slope on the Glenn Highway in Alaska. Maintenance
personnel stockpile the daily debris in this pullout for regular removal. This rock cut received a category score of 100. .......................................................................................................................... 19
Figure 3-6: Rock cut where failure is controlled by interaction between geologic structure and rock friction. Forest Service Road 90, Milepost 13...................................................................................... 20
Figure 3-7: Rock cut where differential erosion is the dominant cause of failure. Forest Service Road 25, Milepost 30. .......................................................................................................................................... 22
Figure 4-1: Chart pair illustrating the relationship between the paved roadway with and the category score and between the trail width and the category score. Note that the category score for paved roadway width maxes out at a width of 10 feet, while the category score for trail width maxes out at a width of 1 foot. .................................................................................................................................. 25
LIST OF TABLES Table 2-1: Preliminary Landslide Slope Rating – Roadway Impedance Category Narratives ....................... 5 Table 2-2: Preliminary Landslide Slope Rating – Slide/Erosion Effects Category Narratives ........................ 7 Table 2-3: Preliminary Landslide Slope Rating – Roadway Length Affected Sample Calculated Scores ...... 8

Landslide Technology iii April 19, 2017
Table 2-4: Preliminary Rock Slope Rating – Ditch Effectiveness Category Narratives .................................. 9 Table 2-5: Preliminary Rock Slope Rating – Rockfall History Category Narratives ..................................... 10 Table 2-6: Preliminary Rock Slope Rating – Block Size or Volume Size Sample Calculated Scores ............ 12 Table 2-7: Common Preliminary Rating – Traffic Impacts Category Narratives ......................................... 12 Table 2-8: Common Preliminary Rating – AADT Sample Calculated Scores ............................................... 13 Table 3-1: Common Hazard Rating - Slope Drainage Category Narratives ................................................. 14 Table 3-2: Common Hazard Rating – Annual Rainfall ................................................................................. 15 Table 3-3: Common Hazard Rating - Slope Height or Axial Length of Slide Sample Calculated Scores ...... 16 Table 3-4: Detailed Landslide Slope Rating – Thaw Stability Category Narratives ..................................... 17 Table 3-5: Detailed Landslide Slope Rating – Maintenance Frequency Category Narratives ..................... 18 Table 3-6: Detailed Landslide Slope Rating – Movement History Category Narratives ............................. 18 Table 3-7: Detailed Rock Slope Rating – Rockfall-Related Maintenance Frequency Category Narratives . 19 Table 3-8: Detailed Rock Slope Rating – Case 1 Structural Condition Category Narratives ....................... 20 Table 3-9: Detailed Rock Slope Rating – Case 1 Rock Friction Category Narratives ................................... 21 Table 3-10: Detailed Rock Slope Rating – Case 2 Structural Category Narratives ...................................... 22 Table 3-11: Detailed Rock Slope Rating – Case 2 Differential Erosion Rate Category Narratives .............. 23 Table 4-1: Risk Rating – Roadway Width Sample Calculated Scores .......................................................... 25 Table 4-2: Risk Rating – Human Exposure Factor Sample Calculated Scores ............................................. 26 Table 4-3: Risk Rating – Percent Decision Sight Distance Sample Calculated Scores ................................. 27 Table 4-4: Risk Rating – Right of Way Impacts Category Narratives........................................................... 27 Table 4-5: Risk Rating – Environmental/Cultural Impacts Category Narratives ......................................... 28 Table 4-6: Risk Rating – Maintenance Complexity Category Narratives .................................................... 28 Table 4-7: Risk Rating – Event Costs Category Narratives .......................................................................... 29
LIST OF EQUATIONS Equation 2-1: Length of Roadway Affected Score ........................................................................................ 8 Equation 2-2: Block Size and Volume Size Score ........................................................................................ 11 Equation 2-3: Annual Average Daily Traffic Score ...................................................................................... 13 Equation 3-1: Slope Height or Axial Length Score ...................................................................................... 16 Equation 4-1: Roadway Width Score .......................................................................................................... 24 Equation 4-2: Human Exposure Factor Score ............................................................................................. 26 Equation 4-3: Percent Decision Sight Distance Score ................................................................................. 27
Landslide Technology 1 April 19, 2017
1 SITE INFORMATION
The top of the field data collection sheet contains
fields for the collection of location and site
information that both records location
information and field measurements critical for
later rating criteria. Many of the fields should be
self-evident to the geological or engineering
personnel that will be performing the ratings, but
some of the fields are explained in more detail
below.
1.1 Hazard Type
The section is divided into two unstable slope
hazard types, rockfall and landslides. Rockfall
failure types include classic failure mechanisms
(planar, wedge, and toppling)1, raveling rock
slopes (i.e. talus slopes), rock avalanche,
differential erosion (interlayered weak and
stronger rock), and indeterminate rock failures.
See Figure 1-1 for simplified schematic drawings
of each rock failure type. Note that the
‘indeterminate rock failure’ classification is
primarily for sites where the rockfall mechanism
is a complex interaction between multiple joints
such that the straightforward planar, wedge, or
toppling models are insufficient sufficient to
describe the failure mechanism. This
classification may be quite common in steep,
hard, jointed rock cut slopes.
Landslides can be generally classified by both
their location relative to the route in question
and by broad failure mode. Translational slides
1 See reference material for additional explanation, such as Rock Slope Engineering, Hoek and Bray, 1981 or Rockfall: Characterization and Control, Part 1: Section 2 Rockfall Types and Causes (pg 21-55), Transportation Research Board, 2012.
Figure 1-1: Simplified rock slope failure types (planar, wedge, toppling, and circular adapted from Hoek and Bray, 1981).

Landslide Technology 2 April 19, 2017
are typically composed of intact blocks that are
moving on a flat or inclined discrete failure plane
weaker than the surrounding geologic material.
Rotational slides are typically formed by a circular
failure surface, often on steep slopes. Debris flows
are sudden, fast moving flows comprised of rock, soil,
water and woody debris. Shallow slumps are
common on transportation systems where the
shoulder or outside lane are failing within the fill
material. Erosional failures are typical where the
river system or culvert outfall is eroding the
embankment or slope below the road which
currently or may threaten the route in the future2.
See Figure 1-2 for simplified schematic drawings of
each rock failure type.
1.2 Length of Affected Road/Trail
This is measured as the length of the road or trail
adjacent to the hazard. For rockfall, it is measured
from the start to the end of the cut slope or outcrop,
not just where the highest level of rockfall activity is
present. For landslides, it is measured from the
beginning to the end of the slide where it is affecting
the road or trail. For roadways, the affected length
measurement includes both the paved road surface
and the embankment on which the road is founded.
For slides above the road, the affected length is
measured as the distance over which the slide is likely
to impact the road or trail, from one end to the other.
This measure is used in rating calculations.
1.3 Slope Height/Axial Length
This is measured as the maximum vertical height of
the rock slope or the maximum axial length of a
landslide feature. On short embankments where it appears that a fill failure is at fault, this measure is
typically the axial length from the top to the base of fill; in other cases, engineering judgment may be
2 Landslides: Investigation and Mitigation, Transportation Research Board Special Report 247 Part 1: Section 3 Landslide Types and Processes (pg 36-75), 1996 or Landslides in Practice, Investigation, Analysis and Remedial/Preventative Options in Soils, Chapter 1: Landslides (pg 3 -6), Cornforth, 2005.
Figure 1-2: Simplified landslide failure types (modified from Ohio DOT, California Geological Survey and Cornforth, 2005).

Landslide Technology 3 April 19, 2017
needed. For debris flows, the axial length
measurement could be in the thousands of
feet due to the channel length (i.e. axial
length) being quite long. This measure is used
in rating calculations. See Figure 1-3 for an
example for evaluating slope height for rock
slopes or landslides.
1.4 Slope angle
This is the average or representative angle of
the rock cut slope/outcrop or the angle of the
failing embankment or soil slope. This
measure is not used in rating calculations.
1.5 Sight Distance
Sight distance is measured as the length of
roadway from when a 6-inch object is first
seen from a driving position (3.5 feet from the
surface) until the object is reached. Sight distance is typically hindered by narrow shoulders, poor ditch
vegetation control, and vertical and horizontal roadway curvature. The location’s sight distance should
be measured in the lane direction with the worst visibility. This measure is used in rating calculations.
1.6 Roadway/Trail Width
This is measured as the full paved width of the roadway or trail, including paved shoulders. On unpaved
routes, it would be the measured as the drivable or navigable width. Where width changes within a
section, it should be taken at the narrowest part of the section. This measure is used in rating calculations.
1.7 Ditch Width/Depth/Foreslope
For rockfall areas, the roadside catchment ditch
is an important rockfall mitigation measure. A
clean, wide ditch with a well maintained
foreslope is one of the most common mitigation
measures on transportation systems. Provide a
measure of the range of ditch widths and depths
and a representative foreslope angle. If needed,
provide a note on the cleanliness of the ditch in
the comments area. This measure is not used in
rating calculations.
Figure 1-3: Examples of measuring vertical slope height on a rock slope and axial length on a landslide.
Figure 1-4: Simple schematic of rockslope ditch.

Landslide Technology 4 April 19, 2017
1.8 Block Size/Rockfall Volume
For rockfall only. Enter a reasonable value for the largest rock size (in feet) that could enter the roadway.
This can be estimated by observation of rocks in the ditch, rocks that appear loose on the slope, or
interviews with maintenance personnel. If a volumetric event is the dominant failure mechanism, enter
the number of cubic yards that have or reasonably could enter the roadway.
1.9 Annual Rainfall
Enter the average annual rainfall for the location. This measure is used in rating calculations.
1.10 Sole Access Route
If there are no alternative routes or detours in the event of a road closure, select “Yes.”
1.11 Mitigation Present
If mitigation measures have been undertaken to halt or slow down a landslide, stabilize the rock slope,
prevent rocks from reaching the roadway, etc., check the appropriate box. Typically, asphalt patches do
not offer any appreciable stabilization effect on landslides and eventually can accelerate movement, so
do not include patching or crack sealing as mitigation for landslides.

Landslide Technology 5 April 19, 2017
2 PRELIMINARY RATINGS
The preliminary ratings are a select subset of the comprehensive rating categories. This subset is intended
to provide guidance on whether to continue the rating assessment and can be used to include or exclude
a candidate unstable slope location from the final database. If a site falls below the suggested score
cutoffs, an Agency may opt to completely exclude the site from the unstable slope database. If a site later
becomes more of an issue, it should be assumed that the site has degraded from an acceptable to an
unacceptable condition. If the site’s Preliminary Rating is above the suggested cutoff score, the full filed
rating should be completed.
2.1 Landslide-Specific Preliminary Ratings
A. Roadway Width Affected
When a part of the roadway or trail is lost or blocked the following can occur: collision with the debris,
driving off a scarp, attempting an evasive maneuver where the driver goes off the road or into oncoming
traffic, or a hiker is forced into a hazardous situation that can lead to an accident. The hazard is related to
the percentage of the roadway or trail affected.
Table 2-1: Preliminary Landslide Slope Rating – Roadway Impedance Category Narratives
3 points 0-5 percent The travel lanes are generally not affected by the landslide feature, but the available paved surface is reduced. A detour or traffic control (flagging) is typically not required except during maintenance activities. Trails typically are only slightly affected.
9 points 6-25 percent Events affect up to 25% of the travel lanes. Adequate paved surface is available to maneuver around the event. A detour is typically not required but traffic control may need to be utilized until the roadway is reestablished. A visual cue for tripping hazards may be needed on trails.
27 points 26-50 percent Events affect up to half of the surface dedicated to travel lanes. Maneuvering actions may still be possible by using paved or unpaved shoulders, if available. A detour or complete vehicle stoppage may be required. A visual cue for tripping hazards may be needed on trails and maintenance may be considered.
81 points 51-100 percent Events affect more than half of the road with limited paved surface available to maneuver around the event. A detour or stopping traffic flow is required. Trails may be closed and maintenance may be required to keep the trail open.
Example of roadways affected by landslide or settlement-related displacement are presented in Figure
2-1 and Figure 2-2 below. As shown in Figure 2-1, the affected roadway width can vary throughout the
site extents. The score should be based on the largest percentage observed at the site or reasonably
predicted to occur in the event of landslide movement.

Landslide Technology 6 April 19, 2017
Figure 2-1: Embankment failure affecting up to 25 percent of the roadway. Forest Service Road 25, Milepost 30.
Figure 2-2: Embankment failure affecting entire roadway. Forest Service Road 25, Milepost 25.

Landslide Technology 7 April 19, 2017
B. Slide/Erosion Effects
Unanticipated condition changes in a travel lane,
such as those shown in Figure 2-3 at right, can
result in unsafe maneuvers or loss of vehicle
control. Larger obstructions increase the
likelihood of an accident and require more
maintenance effort and cost to repair. The
category is scored by following the rating
category narratives in the table below.
Note: For trails, the slower driving speed
indicated in the table below may be reflected in
increased tripping hazards rather than lower
speed limits.
Table 2-2: Preliminary Landslide Slope Rating – Slide/Erosion Effects Category Narratives
3 points Visible crack or slight deposit of material on road/minor erosion. Slight pavement cracking or heaving, or a thin deposit of slide debris has occurred but they are small enough not to disturb traffic flow or require evasive maneuvers. Scheduled roadway maintenance is required. For thaw unstable slopes, normal highway speeds and driving behavior is maintained throughout the affected section.
9 points 1 inch offset, or 6-inch deposit of material on road/major erosion will affect travel in <5 years. A noticeable drop or heave in the pavement or a deposit of slide debris has occurred that requires lower speeds to traverse. Maintenance attention is required. For thaw unstable slopes, tire marks are observed and a notable vertical movement is felt when traversing the affected section at the speed limit.
27 points 2-inch offset or 12-inch deposit of material on road/moderate erosion impacting travel annually. A large drop or heave in the pavement or a deposit of slide debris has occurred that requires significantly lower speeds to traverse and may elicit unsafe driver reactions. Immediate maintenance attention is required. For thaw unstable slopes, breaking or evasive maneuvering is required when travelling the speed limit.
81 points 4-inch offset or 24-inch deposit of material on road/severe erosion impacting traffic consistently. A major drop or heave in the pavement or deposit of slide debris has occurred that cannot be traversed. Unsafe driver reactions are likely and immediate maintenance attention is required to reestablish safe traffic flow. For thaw-unstable slopes, these sections have been marked by maintenance crews with warning signs, cones, or a temporary reduction of the speed limit.
Figure 2-3: Roadway deformation caused by embankment failure. Forest Service Road 90, Milepost 11.5.

Landslide Technology 8 April 19, 2017
C. Roadway Length Affected
The length of the roadway (or trail) affected by a landslide poses a hazard to the travelling public by
increasing the likelihood of encountering the hazard, diverting into an adjacent lane, or increasing the
distance or length of time the hazard will need to be avoided. To the agency, the length is proportional
to the maintenance required and the costs associated with treatment. Longer slides will also require
longer (both time duration and spatial length) lane closures during maintenance or repair activities.
The length of roadway affected by landslide deformation is measured in the field, and the score is directly
calculated from these field measurements, using the equation below. A graph of this equation is also
provided for reference in Figure 2-4, as well as a table showing sample category scores, Table 2-3.
𝑆𝑐𝑜𝑟𝑒 = 3𝑥 (max 100); 𝑥 = √𝑙𝑒𝑛𝑔𝑡ℎ 𝑜𝑓 𝑟𝑜𝑎𝑑𝑤𝑎𝑦 𝑎𝑓𝑓𝑒𝑐𝑡𝑒𝑑
25 (𝑓𝑒𝑒𝑡)
Equation 2-1: Length of Roadway Affected Score
Figure 2-4: Chart illustrating the relationship between the length of roadway affected and the category score. The category score maxes out at an affected roadway length of about 440 feet.
Table 2-3: Preliminary Landslide Slope Rating – Roadway Length Affected Sample Calculated Scores
3 points 25 feet
9 points 100 feet
27 points 225 feet
81 points 400 feet
2.2 Rockfall-Specific Preliminary Ratings
D. Ditch Effectiveness
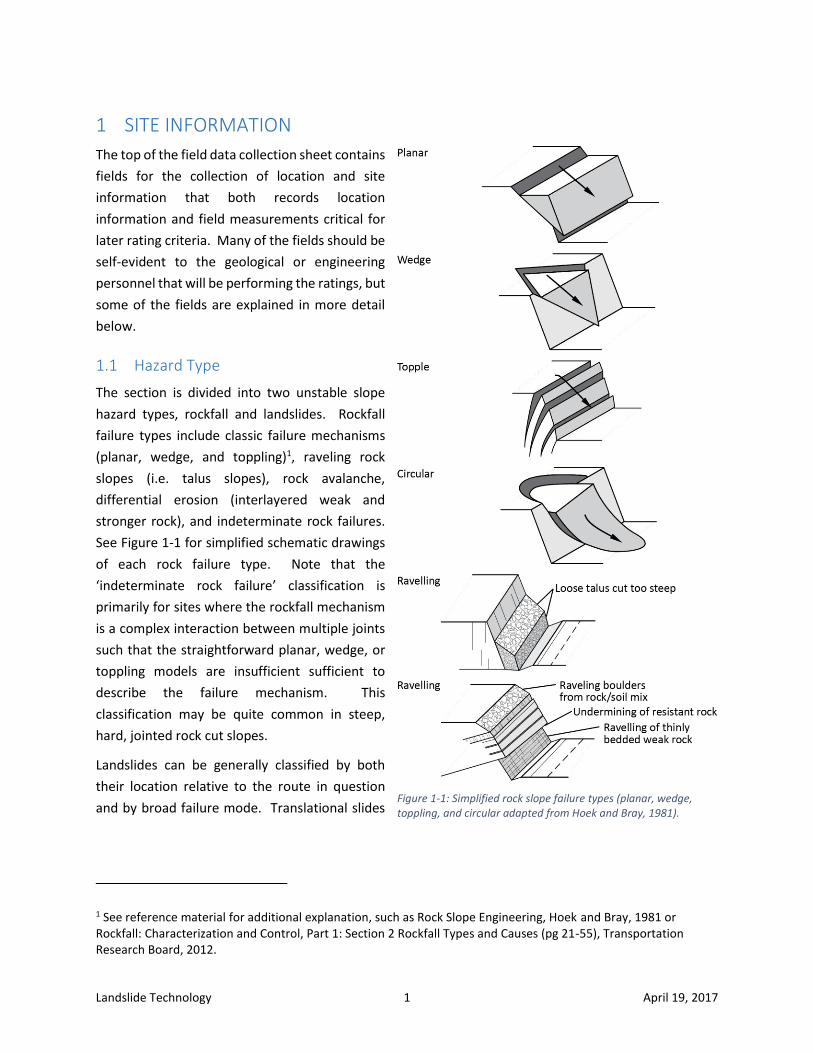
The effectiveness of a ditch is measured by its ability to restrict falling rock from reaching the roadway.
The risk associated with a particular rock slope section is dependent on how well the ditch is performing
in capturing rockfall. When little rock reaches the roadway, no matter how much rockfall is released from
the slope, the danger to the public is low and the category score assessed is low. Conversely, if rockfall
0
25
50
75
100
0 50 100 150 200 250 300 350 400 450
Ro
adw
ay L
engt
h C
ateg
ory
Sco
re
Roadway Length Affected
Landslide Technology 9 April 19, 2017
events are rare occurrences but the ditch is nonexistent, the resulting hazard is greater and a higher score
is assigned to this category. Many factors must be considered in evaluating this category. The reliability
of the result depends heavily on the rater's experience. Ditch Effectiveness is a subjective category. Figure
2-5 presents a graphic diagram of ditch effectiveness for guidance.
Figure 2-5: Ditch effectiveness explanatory diagram
A wide fallout area does not necessarily guarantee that rockfall will be restricted from the highway. In
estimating the ditch effectiveness, the rater should consider several factors, such as: 1) slope height and
angle; 2) ditch width, depth and shape; 3) anticipated volume of rockfall per event; and 4) impact of slope
irregularities (launching features) on falling rocks. Evaluating the effect of slope irregularities is especially
important because they can completely negate the benefits expected from a fallout area. Valuable
information on past ditch performance can be obtained from maintenance personnel.
Table 2-4: Preliminary Rock Slope Rating – Ditch Effectiveness Category Narratives
3 points Good Catchment. All or nearly all falling rocks are retained in the catch ditch.
9 points Moderate Catchment. Falling rocks occasionally reach the roadway.
27 points Limited Catchment. Falling rocks frequently reach the roadway.
81 points No Catchment. No ditch, or ditch is totally ineffective. All or nearly all falling rocks reach the road.
E. Rockfall History
The rockfall history directly represents the known rockfall activity at the site. This information is an
important check on the potential for future rockfalls. This information is best obtained from the

Landslide Technology 10 April 19, 2017
maintenance personnel responsible for the slope. There may be no history available at newly constructed
sites or where documentation practices are poor. The maintenance costs associated with a site may be
the only information that reflects the rockfall activity.
If the score a rater assigns to a section is determined not to correspond well with the rockfall history, a
review of the rating is advisable.
Table 2-5: Preliminary Rock Slope Rating – Rockfall History Category Narratives
3 points Few Falls. Rockfalls occur only a few times a year (or less), or only during severe storms. This category is also used if no rockfall history data is available and evidence of rockfall is absent.
9 points Occasional Falls. Rockfall occurs regularly. Rockfall can be expected several times per year and during most storms.
27 points Many Falls. Typically, rockfall occurs frequently during a certain season, such as the winter or spring wet period, or the winter freeze/thaw, etc. This category is for sites where frequent rockfalls occur during a certain season but are not a significant problem during the rest of the year. This category may also be used where severe rockfall events have occurred.
81 points Constant Falls. Rockfalls occur frequently throughout the year. This category is also for sites where severe rockfall events are common.
F. Block Size or Volume per Event
Larger blocks or volumes of falling rock produce more total kinetic energy and greater impact force than
smaller events. In addition, the larger events obstruct more of the roadway, reducing the possibility of
safely avoiding the rock(s), and result in higher cleanup costs for the managing agency. In essence, the
larger the blocks or event volume; the greater the hazard created; thus the higher the assigned score in
this category.
This measurement should be representative of the type of rockfall event most likely to occur. As shown
in Figure 2-6, debris currently contained in the roadside ditch can help generate a reasonable estimate. If
individual blocks are typical of the rockfall at a site, as at the site in Figure 2-6, then block size should be
used for scoring. If a mass of blocks tends to be the dominant type of rockfall, volume per event should
be used. A decision on which to use can be determined from the maintenance history, or estimated from
observed conditions when no history is available. This measurement will also be beneficial in determining
remedial measures.

Landslide Technology 11 April 19, 2017
Figure 2-6: Rockfall debris in the roadside ditch can be used to help assess both block size/event volume and failure type. Forest Service Rd 25, Milepost 25.
The category score is calculated according to the following equations. If the rater is uncertain, rate the
site using both equations and record the higher of the two scores. A pair of charts showing the
exponential relationship between block size/event volume and category score is also presented in Figure
2-7 for reference, as are sample calculated category scores in Table 2-6.
𝐵𝑙𝑜𝑐𝑘 𝑆𝑖𝑧𝑒 𝑆𝑐𝑜𝑟𝑒 = 3𝑥 (max 100) ; 𝑥 = 𝑏𝑙𝑜𝑐𝑘 𝑠𝑖𝑧𝑒 (𝑓𝑡)
𝑉𝑜𝑙𝑢𝑚𝑒 𝑆𝑖𝑧𝑒 𝑆𝑐𝑜𝑟𝑒 = 3𝑥 (max 100) ; 𝑥 = (𝑦𝑑𝑠3
3)
Equation 2-2: Block Size and Volume Size Score

Landslide Technology 12 April 19, 2017
Figure 2-7: Chart pair illustrating the relationship between the block size and the category score and between the event volume and the category score. Note that the category score for block size maxes out for block sizes greater than 4 feet, while the category score for event volume maxes out for events over 12 cubic yards.
Table 2-6: Preliminary Rock Slope Rating – Block Size or Volume Size Sample Calculated Scores
Block Size Volume Size
3 points 1 foot 3 cubic yards
9 points 2 feet 6 cubic yards
27 points 3 feet 9 cubic yards
81 points 4 feet 12 cubic yards
2.3 Common Preliminary Slope Ratings
G. Impact on Use
Impacts on the transportation system due to a failure can be minimized if the expected impacts would be
minimal, or if a detour around the site is available. The scoring should take into account a probable worst
case scenario, rockfall history, and geologic conditions when judging the impacts on traffic.
Table 2-7: Common Preliminary Rating – Traffic Impacts Category Narratives
3 points Full use continues with minor delay. A wide shoulder is available for traffic diversion for large slide events; small rockfall events contained in the ditch; nearby detours are available.
9 points Partial use remains. Use modification required, short (<3mile/30min.) detour available. Traffic control for a lane closure or detour is required for maintenance or clean-up. Detours are less than 3 miles or under 30 minutes in length for up to 1 day.
27 points Use is blocked – long (>30 min) detour available or less than 1 day closure for up to 1 week.
81 points Use is blocked – no detour available or closure longer than 1 week. Major reconstruction efforts with weeks or months closure with no detour score 100 points.
0
25
50
75
100
0 1 2 3 4 5
Blo
ck S
ize
Cat
ego
ry S
core
Block Size (feet)
0
25
50
75
100
0 3 6 9 12 15
Even
t V
olu
mn
e C
ateg
ory
Sco
re
Event Volume (cubic yds)

Landslide Technology 13 April 19, 2017
H. Annual Average Daily Traffic (AADT) or Usage/Economic/Recreational Importance
This category is designed to capture route or trail importance and can be assessed using either
quantitative or qualitative data. The AADT of a roadway provides a rough quantitative indicator of its
impact on the regional economy and mobility of people, goods, and services. High traffic corridors will
receive a higher risk score. The AADT score is based on the following equation:
𝑆𝑐𝑜𝑟𝑒 = 3𝑥 (max 100) ; 𝑥 = √𝐴𝐴𝐷𝑇
50
Equation 2-3: Annual Average Daily Traffic Score
Figure 2-8: Chart illustrating the relationship between AADT and the category score. The category score maxes out at an AADT of approximately 880 vehicles.
For those roads or trails where AADT information is not available, a qualitative score relating to usage and
relative economic/recreational importance is applied, as shown in Table 2-8.
Table 2-8: Common Preliminary Rating – AADT Sample Calculated Scores
AADT Score * Qualitative Usage/Economic/Recreational Importance Score*
3 points 50 Rarely used. Insignificant economic and/or recreational importance
9 points 200 Occasionally used. Minor economic and/or recreational importance
27 points 450 Frequently used. Moderate economic and/or recreational importance
81 points 800 Constantly used. Significant economic and/or recreational importance *The highest rating of the two category narratives is applied
For site where both quantitative (AADT) and qualitative (i.e., relative importance) data is available, both
categories should be evaluated, and the highest resulting score given to the site. For example, a roadway
that is the only route to a popular trail may be of moderate recreational importance (27 pts), but the AADT
is only 200 (9 pts). For this site, the higher score of 27 would be used.
0
25
50
75
100
0 100 200 300 400 500 600 700 800 900
AA
DT
Cat
ego
ry S
core
Annual Average Daily Traffic (AADT)

Landslide Technology 14 April 19, 2017
3 DETAILED HAZARD RATINGS
3.1 Common Hazard Ratings
I. Slope Drainage
In conjunction with rainfall quantity, the ability of the slope materials to be free draining and the presence
of seeps and/or springs (indicating a relatively constant water source) provides information on the ability
of the slope to cope with rainfall and freeze-thaw events. This subcategory is based on subjective
evaluations. Note that rating this category at different times of the year may produce different results as
creeks and springs may dry up during late summer months. For guidance in field evaluations, Figure 3-1
is provided below, and rating category narratives are provided in Table 3-1.
Figure 3-1: Guidance figure for evaluating slope drainage.
Table 3-1: Common Hazard Rating - Slope Drainage Category Narratives
3 points Well Drained. Slope appears dry or well drained; surface runoff well controlled; slope is dry hours after rain events.
9 points Moderately Well Drained. Water is intermittently on slope; moderately well drained; surface runoff moderately controlled; slope is dry days after rain events.
27 points Moderately Poorly Drained. Water usually on slope; poorly drained; surface runoff poorly controlled; slope is still wet a week or two following rain events, but may dry during prolonged dry spells.
81 points Poorly Drained. Water always on slope; very poorly drained; or surface water runoff control not present.

Landslide Technology 15 April 19, 2017
J. Annual Rainfall
In conjunction with slope drainage, the amount of annual rainfall at a site is a rough indicator of the
frequency of potential for high pore water pressures to accumulate. Areas with frequent, intense storms
typically have more unstable rock and soil slopes.
This subcategory is rated based on rainfall ranges. A rock slope in an area with 12 inches of average annual
rainfall and a rock slope in an area with 29 inches of average annual rainfall should both receive a score
of 9 points in this category. Because annual rainfall cannot be estimated during a site visit, annual rainfall
data must be obtained from the appropriate source before starting field work.
Table 3-2: Common Hazard Rating – Annual Rainfall
3 points 0-10 inches of rain annually
9 points 10-30 inches of rain annually
27 points 30-60 inches of rain annually
81 points 60+ inches of rain annually
K. Slope Height or Axial Length of Slide
This category evaluates the risk associated
with the height of a rock slope or axial length
of a landslide or debris flow. The slope height
measurement is to the highest point from
which rockfall is expected or the axial length
(slope distance) of a landslide, as shown in the
adjacent figure.
If rockfall is generated from the natural slope
above the cut slope, the slope height
measurement should include both the cut
height and the additional vertical height on
the natural slope to the rockfall source. On a
landslide, the distance from scarp to toe
should be measured. For debris flows the
approximate axial or channel distance from
the roadway to the source area should be
entered.3
In cold climates, thaw instability can affect roadway embankments that run over relatively flat ground. In
those cases, the axial length of the slide is assumed to be equal to the axial length of the embankment fill
3 Note: Channel length measurements for debris flows do not need to be precise, as the rating category score maxes out at a slope height/axial length of approximately 105 ft. An estimated channel length of 1,000 feet or of one mile has the same net effect: maxing out the rating score for this category.
Figure 3-2: Examples of measuring vertical slope height on a rock slope and axial length on a landslide.

Landslide Technology 16 April 19, 2017
prism. Although thaw instability can affect an embankment over many hundreds of feet, the maximum
slump or settlement caused by thawing soils cannot exceed the height of the roadway embankment.
This category is directly measured and scored using the equation presented below. A chart relating slope
height/axial length and category score is presented for reference, as is a table containg sample calculated
category scores.
Equation 3-1: Slope Height or Axial Length Score
𝑆𝑐𝑜𝑟𝑒 = 3𝑥 (max 100) ; 𝑥 =𝑠𝑙𝑜𝑝𝑒 ℎ𝑒𝑖𝑔ℎ𝑡 𝑜𝑟 𝑎𝑥𝑖𝑎𝑙 𝑙𝑒𝑛𝑔𝑡ℎ
25
Figure 3-3: Chart illustrating the relationship between the slope height or axial length and the category score. The category score maxes out at height/axial length of approximately 105 feet
Table 3-3: Common Hazard Rating - Slope Height or Axial Length of Slide Sample Calculated Scores
3 points 25 feet
9 points 50 feet
27 points 75 feet
81 points 100 feet
3.2 Landslide-Specific Hazards
L. Thaw Stability (Cold Climates)
Roads and embankments founded on melting permafrost become unstable, creating a rough and wavy
driving surface along with other roadway hazards. Melting slopes above the road become unstable and
have the potential to impact the roadway. Depending on the gradation, soils containing frozen water
pose maintenance problems if the ice thaws. The magnitude and likelihood of related problems is higher
for finer-grained soils that contain larger amounts of ice or for materials containing ice layers. Where the
ice-bearing layers are not visible, base the thaw stability on the relative performance of the roadway.
0
25
50
75
100
0 10 20 30 40 50 60 70 80 90 100 110
Hei
ght/
Axi
al L
engt
h C
ateg
ory
Sco
re
Slope Height or Axial Length (ft)

Landslide Technology 17 April 19, 2017
Table 3-4: Detailed Landslide Slope Rating – Thaw Stability Category Narratives
3 points Unfrozen / Thaw Stable. Soil may be coarse- or fine-grained. No ice is visible with the naked eye but if present, it does not occupy space in excess of the original voids. These soils are usually thaw-stable. No thaw unstable slopes should be rated in this category
9 points Slightly Thaw Unstable. Soil is coarse-grained. Ice occupies space equal to, or in excess of, the original voids. It is present as crystals or lenses visible with the naked eye. These soils may be thaw-unstable depending on soil density. Few thaw unstable slopes should be rated in this subcategory.
27 points Moderately Thaw Unstable. Soil is fine-grained. Ice occupies space equal to, or in excess of the original voids and is present as crystals or lenses visible with the naked eye. These soils are typically thaw-unstable. Most thaw unstable slopes are rated in this category based on relative performance of the roadway.
81 points Highly Thaw Unstable. Soil layers contain significant quantities of ice well in excess of the original void space. The ice is readily visible with the naked eye and is present as large lenses or as separate ice layers. These materials are highly thaw-unstable. Any embankment sections with characteristics indicating a likelihood or history of rapid failure or severe displacement due to the presence of thaw unstable materials should be rated in this subcategory.
M. Instability-Related Maintenance Frequency
As instability-related movement progresses, trail or
roadway deformation begins to hamper
performance, and maintenance attention is
required to ensure that the site remains passable.
Slide maintenance puts staff and equipment in or
near the road, which may impede traffic and
exposes both maintenance personnel and the
general public to potential hazards. The more often
maintenance activity is required, the greater the
hazards posed to the public and maintenance staff,
and the greater the maintenance cost.
Maintenance frequency should initially be
estimated by the rater based on field observation,
and refined in interviews with maintenance
personnel if possible. This category is rated subjectively based on the rating category narratives in Table
3-5 below.
Figure 3-4: Instability requiring repeated maintenance attention. Forest Service Road 25, Milepost 25.
Landslide Technology 18 April 19, 2017
Table 3-5: Detailed Landslide Slope Rating – Maintenance Frequency Category Narratives
3 points Every 10 years. Events requiring maintenance intervention are relatively rare or nonrecurring and/or the repair activities can typically be completed using standard equipment with minimal impacts to traffic flow.
9 points Every 5 years. Maintenance intervention is required occasionally and/or the repair activities can usually be completed in less than a day using standard equipment but traffic flow is reduced and flagging is required.
27 points Every 2 years. Maintenance action is routinely required and/or the repair activities require non-standard equipment or more than one day to complete; or the traffic flow is significantly impeded for more than a day and flagging is required.
81 points Every year. Maintenance is required one or more times per year or wherever major events have occurred requiring several days to restore traffic. This category also applies if an outside contractor is required.
N. Movement History
The rate of slide movement per event and the frequency of events relate to public hazard and
maintenance requirements. Higher rates of movement are more likely to create unanticipated roadway
conditions that require immediate, unscheduled maintenance. This category should be rated based on
input from maintenance personnel, since it is difficult to accurately assess an annual rate of movement
from a single site visit.
Table 3-6: Detailed Landslide Slope Rating – Movement History Category Narratives
3 points Minor movement or sporadic creep. The rate of movement is low and non-continuous. Pavement disturbance is minor on an annual basis and maintenance requirements are minimal and carried out as a scheduled activity.
9 points Up to 1 inch annually or steady annual creep. The rate of movement is low but continuous. Roadway maintenance is routinely required to avoid road closures but maintenance action can generally be on a scheduled basis.
27 points Up to 3 inches per event, one event per year. The rate of movement is moderately high. Events occurring more than twice a year that require immediate and unscheduled maintenance are a persistent maintenance problem.
81 points >3 inches per event, >6 inches annually, or more than 1 event per year (includes all debris flows). The rate of movement is high with significant roadway disturbance developing quickly. Aggressive, unscheduled maintenance intervention is required to maintain traffic flow and correct unsafe conditions.
3.3 Rockfall-Specific Hazards
O. Rockfall Related Maintenance Frequency
The required frequency of maintenance is an indicator of both rockfall activity and long-term cost to the
agency. When there is little to no maintenance required and only scheduled ditch cleaning required, both
maintenance staff and the travelling public are typically not exposed to risk and little cost to the agency
is required. As rockfall activity increases at a site, additional road patrols may be warranted after storm

Landslide Technology 19 April 19, 2017
events and rockfall clean-up activities increase. An example of a rock slope requiring near daily
maintenance attention is shown in the figure below.
Figure 3-5: Constant rockfalls occur at this rock slope on the Glenn Highway in Alaska. Maintenance personnel stockpile the daily debris in this pullout for regular removal. This rock cut received a category score of 100.
Maintenance frequency can be estimated from conditions observed at the site, as in the figure above, but
category ratings should be confirmed through discussions with maintenance personnel where possible.
Table 3-7: Detailed Rock Slope Rating – Rockfall-Related Maintenance Frequency Category Narratives
3 points Normal, scheduled ditch maintenance. Only routine, scheduled ditch maintenance is required on an infrequent (3-5 year) basis. Few, if any rocks accumulate in ditch between maintenance intervals.
9 points Road Patrols conducted after storm events. Maintenance staff only actively search for rock within the ditch or roadway after extreme storm events. Ditch cleanout of rock debris is infrequently required beyond scheduled ditch cleaning.
27 points Routine seasonal road patrols. Maintenance staff routinely patrol for rock during typically high rockfall seasons (fall, winter, spring). Ditch cleanout of rock debris is occasionally required beyond scheduled ditch cleaning.
81 points Year-round road patrols. Maintenance staff routinely patrol for rock year round. Ditch cleanout of rock debris is frequently required beyond scheduled ditch cleaning.
Geologic Character
The geologic conditions of the rockfall section are evaluated with these categories. Since the conditions
that cause rockfall generally fit into two categories, Case One and Case Two rating criteria have been
developed. Case One is for slopes where joints, bedding planes, or other discontinuities, are the dominant
structural features that lead to rockfall. Case Two is for slopes where differential erosion or
oversteepening is the dominant condition that controls rockfall.

Landslide Technology 20 April 19, 2017
Whichever case best fits the slope should be used for the rating. If both situations are present, and it is
unclear which dominates, both can be scored, but only the worst case (highest score) is used in the rating.
Case 1
Rockfall from Case One slopes occurs as a result
of movement along discontinuities. The word
“joint” as applied here, represents all possible
types of discontinuities, including bedding planes,
foliations, fractures, and faults. The term
“continuous” refers to joints that are greater than
10 feet in length. The term “adverse” applies not
only to the joint's spatial relationship to the slope,
but also to such things as rock friction angle, joint
infilling, and the effects of water on slope
stability, if present. An example of a rock slope in
geologic Case 1 is shown in Figure 3-6.
P. Case 1 - Structural Condition
Jointed rock is much more prone to rockfall than
massive rock. Movement occurs along these
joints where the resistance to movement is
significantly less than the intact strength of the
rock itself. When the joints are orientated
adversely to the slope, the potential for rockfall is
greater. Adverse joints are those that singularly, or in combination with other joints, make planar, circular,
block, wedge or toppling failures kinematically possible.
Table 3-8: Detailed Rock Slope Rating – Case 1 Structural Condition Category Narratives
3 points Discontinuous joints with favorable orientations. Slope contains jointed rock with no adversely oriented joints.
9 points Discontinuous joints with random (both favorable and unfavorable) orientations. Slope contains randomly oriented joints creating a variable pattern. The slope is likely to have some scattered blocks with adversely oriented joints, but no dominant adverse pattern is present.
27 points Discontinuous joints with adverse orientations. Rock slope exhibits a prominent joint pattern with an adverse orientation. These features have less than 10 feet of continuous length.
81 points Continuous joints with adverse orientations. Rock slope exhibits a dominant joint pattern with an adverse orientation and a length greater than 10 feet.
Figure 3-6: Rock cut where failure is controlled by interaction between geologic structure and rock friction. Forest Service Road 90, Milepost 13.

Landslide Technology 21 April 19, 2017
Q. Case 1 - Rock Friction
The potential for rockfall caused by movement along discontinuities is controlled by the condition of the
joints. The condition of the joints is described in terms of micro and macro roughness.
This parameter directly affects the potential for a block to move relative to another. Friction along a joint,
bedding plane, or other discontinuity is governed by the macro and micro roughness of the surfaces.
Macro roughness is the degree of undulation of the joint relative to the direction of possible movement.
Micro roughness is the texture of the surface. On slopes where the joints contain hydrothermally altered
or weathered material, movement has occurred causing slickensides or fault gouge to form, or the joints
are open or filled with water, the rockfall potential is greater.
Table 3-9: Detailed Rock Slope Rating – Case 1 Rock Friction Category Narratives
3 points Rough. Irregular. The surface of the joints are rough and the joint planes are irregular enough to cause interlocking.
9 points Undulating Macro. Rough but without the interlocking ability.
27 points Planar. Macro smooth and micro rough joint surfaces. Friction is derived strictly from the roughness of the rock surface.
81 points Clay Infilling, Open, or Slickensides. Low friction materials separate the rock surfaces, negating any micro or macro roughness of the joint surfaces. Slickensided joints also have a lower friction angle, and belong in this category.

Landslide Technology 22 April 19, 2017
Case 2
This case is used for slopes where differential erosion
or oversteepening is the dominant condition that
leads to rockfall. Erosion features include
oversteepened slopes, unsupported rock units
(overhangs), or exposed resistant rocks on a slope,
which may eventually lead to a rockfall event. An
example of this geologic case is shown in Figure 3-7.
R. Case 2 - Structural Condition
Rockfall is commonly caused by erosion that leads to a
loss of support, either locally or throughout a slope.
The types of slopes that may be susceptible to this
condition are: layered geologic units containing more
easily erodible units that undermine more durable
rock; talus slopes; highly variable geologic units, such
as conglomerates, and mudflows, that weather
differentially, allowing resistant rocks and blocks to
fail, and rock/soil slopes that weather allowing rocks
to fall as the soil matrix material is eroded.
Table 3-10: Detailed Rock Slope Rating – Case 2 Structural Category Narratives
3 points Few Differential Erosion Features. Minor differential erosion features that are not distributed throughout the slope.
9 points Occasional Differential Erosion Features. Minor differential erosion features that are widely distributed throughout the slope.
27 points Many Differential Erosion Features. Differential erosion features that are large and numerous throughout the slope.
81 points Major Differential Erosion Features. Severe cases such as dangerous erosion-created overhangs, or significantly oversteepened soil/rock slopes or talus slopes.
S. Case 2 - Differential Erosion Rate
The materials comprised in a slope can have markedly different characteristics that control how rapidly
weathering and erosion occur. As erosion progresses, resulting in portions of the slope becoming
unsupported, the likelihood of a rockfall event increases.
The rate of erosion on a Case Two slope directly relates to the potential for a future rockfall event. As
erosion progresses, unsupported or oversteepened slope conditions develop. The impact of the common
physical and chemical erosion processes, as well as the effects of man's actions, should be considered.
Figure 3-7: Rock cut where differential erosion is the dominant cause of failure. Forest Service Road 25, Milepost 30.

Landslide Technology 23 April 19, 2017
The degree of hazard caused by erosion and thus the score given this category, should reflect the rate at
which erosion is occurring; the size of rocks, blocks, or units being exposed; the frequency of rockfall
events; and the amount of material released during an event.
Table 3-11: Detailed Rock Slope Rating – Case 2 Differential Erosion Rate Category Narratives
3 points Small Difference. Erosion features take many years to develop. Slopes that are near equilibrium with their environment are covered by this category.
9 points Moderate Difference. The difference in erosion rates allows erosion features to develop over a period of a few years.
27 points Large Difference. The difference in erosion rates allows noticeable changes in the slope to develop annually.
81 points Extreme Difference. The difference in erosion rates allows rapid and continuous development of erosion features.
Landslide Technology 24 April 19, 2017
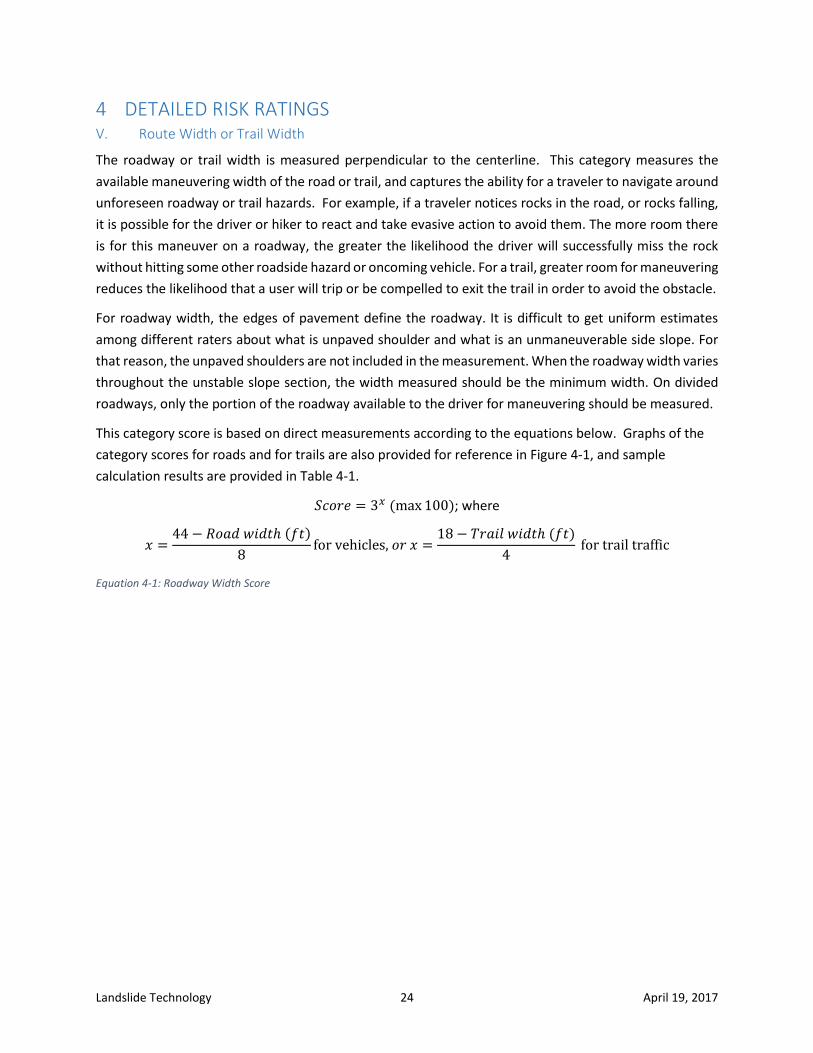
4 DETAILED RISK RATINGS V. Route Width or Trail Width
The roadway or trail width is measured perpendicular to the centerline. This category measures the
available maneuvering width of the road or trail, and captures the ability for a traveler to navigate around
unforeseen roadway or trail hazards. For example, if a traveler notices rocks in the road, or rocks falling,
it is possible for the driver or hiker to react and take evasive action to avoid them. The more room there
is for this maneuver on a roadway, the greater the likelihood the driver will successfully miss the rock
without hitting some other roadside hazard or oncoming vehicle. For a trail, greater room for maneuvering
reduces the likelihood that a user will trip or be compelled to exit the trail in order to avoid the obstacle.
For roadway width, the edges of pavement define the roadway. It is difficult to get uniform estimates
among different raters about what is unpaved shoulder and what is an unmaneuverable side slope. For
that reason, the unpaved shoulders are not included in the measurement. When the roadway width varies
throughout the unstable slope section, the width measured should be the minimum width. On divided
roadways, only the portion of the roadway available to the driver for maneuvering should be measured.
This category score is based on direct measurements according to the equations below. Graphs of the
category scores for roads and for trails are also provided for reference in Figure 4-1, and sample
calculation results are provided in Table 4-1.
𝑆𝑐𝑜𝑟𝑒 = 3𝑥 (max 100); where
𝑥 =44 − 𝑅𝑜𝑎𝑑 𝑤𝑖𝑑𝑡ℎ (𝑓𝑡)
8for vehicles, 𝑜𝑟 𝑥 =
18 − 𝑇𝑟𝑎𝑖𝑙 𝑤𝑖𝑑𝑡ℎ (𝑓𝑡)
4 for trail traffic
Equation 4-1: Roadway Width Score

Landslide Technology 25 April 19, 2017
Figure 4-1: Chart pair illustrating the relationship between the paved roadway with and the category score and between the trail width and the category score. Note that the category score for paved roadway width maxes out at a width of 10 feet, while the category score for trail width maxes out at a width of 1 foot.
Table 4-1: Risk Rating – Roadway Width Sample Calculated Scores
Roadway Width Trail Width
3 points 36 feet 14 feet
9 points 28 feet 10 feet
27 points 20 feet 6 feet
81 points 12 feet 2 feet
W. Human Exposure Factor
The Human Exposure Factor evaluates the potential for a roadway or trail user to be involved in an
unstable slope event. This risk is associated with the percentage of time a route user is present in the
evaluated section. The percentage is obtained by using the formula based on slope length, average annual
daily traffic (AADT), and the posted speed limit (or average walking speed, 2.7 mph4) at the site.
A rating of 100% means that, on average, a user will be within the defined unstable section 100% of the
time. Where high AADT's or longer slope lengths exist, calculated values can be greater than 100%,
meaning that at any particular time, more than one user is present within the measured section. The
result also reflects the significance of the route.
This category is scored using direct measurements following the equation below.
4 Knoblauch, R.L., et al, 1996, Field Studies of Pedestrian Walking Speed and Start-Up Time, Transportation Research Record: Journal of the Transportation Research Board
0
25
50
75
100
10 20 30 40 50
Ro
ute
Wid
th C
ateg
ory
Sco
re
Paved Roadway Width (feet)
0
25
50
75
100
0 5 10 15 20
Trai
l Wid
th C
ateg
ory
Sco
re
Trail Width (feet)

Landslide Technology 26 April 19, 2017
𝑆𝑐𝑜𝑟𝑒 = 3𝑥 (max 100) ; 𝑥 =
(
𝐴𝐴𝐷𝑇24
× 𝑠𝑙𝑜𝑝𝑒 𝑙𝑒𝑛𝑔𝑡ℎ (𝑚𝑖𝑙𝑒𝑠) × 100
𝑠𝑝𝑒𝑒𝑑 𝑙𝑖𝑚𝑖𝑡 𝑜𝑟 𝑤𝑎𝑙𝑘𝑖𝑛𝑔 𝑠𝑝𝑒𝑒𝑑)
12.5
Equation 4-2: Human Exposure Factor Score
Table 4-2: Risk Rating – Human Exposure Factor Sample Calculated Scores
3 points Human Exposure 12.5% of the time
9 points Human Exposure 25% of the time
27 points Human Exposure 37.5% of the time
81 points Human Exposure 50% of the time
X. Percent Decision Sight Distance (PDSD) or Avoidance Ability on Trails
The Percent Decision Sight Distance (PDSD) category compares the amount of sight distance available
through an unstable slope section to the optimal sight distance for a speed/path/direction change.
For roadways, sight distance is the shortest distance that a six-inch object is continuously visible to a driver
along a roadway. Decision sight distance (DSD) is the length of roadway, in feet, required by a driver to
perceive a problem and then bring a vehicle to a stop. The required DSD increases with increased vehicle
speed and this distance is critical when obstacles in the road surface are difficult to see, or when
unexpected or unusual maneuvers are required. Decision sight distances prescribed by AASHTO for rural
roads for typical posted speeds are presented in Table 4-3 below.
Table 4-3: AASHTO Recommended Minimum Decision Sight Distance for selected speed limits
Posted Speed Limit (mph)
AASHTO Recommended Minimum Decision Sight Distance (ft)
25 375
30 450
35 525
40 600
45 675
50 750
55 875
60 1,000
65 1,050
The DSD is critical when obstacles on the road are difficult to see, or when unexpected or unusual
maneuvers are required. Throughout an unstable slope section the sight distance can change appreciably.
Horizontal and vertical highway curves along with obstructions such as rock outcrops and vegetation can
severely limit a driver’s ability to notice and react to a rock in the road. In calculating this category score,
the sight distance is determined in both travel directions, and the most restricted sight distance is used.
Both horizontal and vertical sight distances are evaluated.
Landslide Technology 27 April 19, 2017
The measurement, generally made with a roller tape or laser range finder, is the distance required for a
six-inch object positioned on the fogline (or on the edge of pavement if there is no fogline) to disappear
from view at an eye height of 3.5 feet above the road surface. The posted speed limit throughout the
rockfall section is used because unstable slopes are often located within highway curves, where the
posted speed limit is lower than the highway design speed. Formally, AASHTO standards require placing
the object in the travel lanes and measuring it from a driver’s position near the centerline, however ratings
are typically performed under live traffic and this would be an unsafe practice for both the rater and the
public.
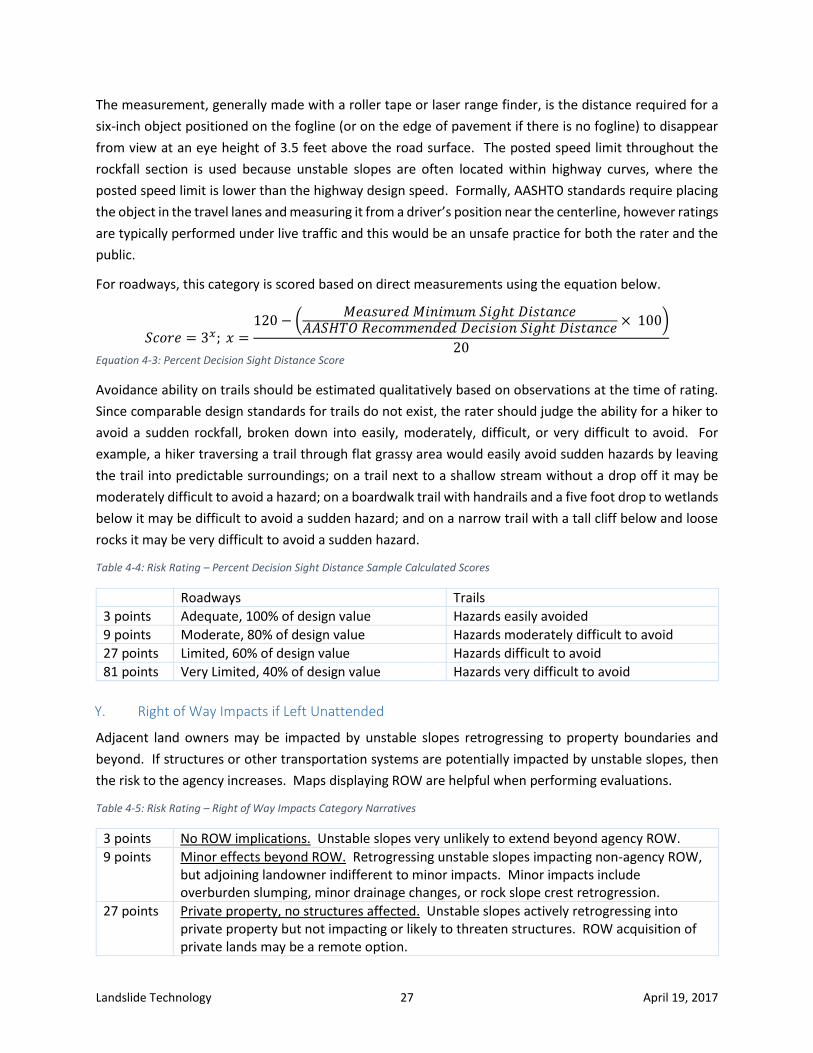
For roadways, this category is scored based on direct measurements using the equation below.
𝑆𝑐𝑜𝑟𝑒 = 3𝑥; 𝑥 =120 − (
𝑀𝑒𝑎𝑠𝑢𝑟𝑒𝑑 𝑀𝑖𝑛𝑖𝑚𝑢𝑚 𝑆𝑖𝑔ℎ𝑡 𝐷𝑖𝑠𝑡𝑎𝑛𝑐𝑒𝐴𝐴𝑆𝐻𝑇𝑂 𝑅𝑒𝑐𝑜𝑚𝑚𝑒𝑛𝑑𝑒𝑑 𝐷𝑒𝑐𝑖𝑠𝑖𝑜𝑛 𝑆𝑖𝑔ℎ𝑡 𝐷𝑖𝑠𝑡𝑎𝑛𝑐𝑒
× 100)
20
Equation 4-3: Percent Decision Sight Distance Score
Avoidance ability on trails should be estimated qualitatively based on observations at the time of rating.
Since comparable design standards for trails do not exist, the rater should judge the ability for a hiker to
avoid a sudden rockfall, broken down into easily, moderately, difficult, or very difficult to avoid. For
example, a hiker traversing a trail through flat grassy area would easily avoid sudden hazards by leaving
the trail into predictable surroundings; on a trail next to a shallow stream without a drop off it may be
moderately difficult to avoid a hazard; on a boardwalk trail with handrails and a five foot drop to wetlands
below it may be difficult to avoid a sudden hazard; and on a narrow trail with a tall cliff below and loose
rocks it may be very difficult to avoid a sudden hazard.
Table 4-4: Risk Rating – Percent Decision Sight Distance Sample Calculated Scores
Roadways Trails
3 points Adequate, 100% of design value Hazards easily avoided
9 points Moderate, 80% of design value Hazards moderately difficult to avoid
27 points Limited, 60% of design value Hazards difficult to avoid
81 points Very Limited, 40% of design value Hazards very difficult to avoid
Y. Right of Way Impacts if Left Unattended
Adjacent land owners may be impacted by unstable slopes retrogressing to property boundaries and
beyond. If structures or other transportation systems are potentially impacted by unstable slopes, then
the risk to the agency increases. Maps displaying ROW are helpful when performing evaluations.
Table 4-5: Risk Rating – Right of Way Impacts Category Narratives
3 points No ROW implications. Unstable slopes very unlikely to extend beyond agency ROW.
9 points Minor effects beyond ROW. Retrogressing unstable slopes impacting non-agency ROW, but adjoining landowner indifferent to minor impacts. Minor impacts include overburden slumping, minor drainage changes, or rock slope crest retrogression.
27 points Private property, no structures affected. Unstable slopes actively retrogressing into private property but not impacting or likely to threaten structures. ROW acquisition of private lands may be a remote option.

Landslide Technology 28 April 19, 2017
81 points Structures, roads, RR, utilities, or parks affected. Retrogressing unstable slopes actively threatening adjacent structures, transportation systems, or Federal or State Park lands. In this score range, ROW acquisition of private lands may be a viable option. Coordination of mitigation approaches with outside agency landowner(s) will likely be required.
Z. Environmental/Cultural Impacts if Left Unattended
If the unstable slope is left unattended, impacts to the environment or cultural resources may occur.
These impacts can include siltation of streams, culvert plugging, subsequent fish passage blocking, habitat
impacts, damage to historic features or sites, etc. Due to the highly variable nature of potential
environmental impacts, a range of environmental and cultural descriptions are used for this category. The
rater should select the category containing the highest environmental or cultural impact if left
unattended. If these impacts are anticipated, a review by environmental and/or cultural resource
professionals may be recommended.
Table 4-6: Risk Rating – Environmental/Cultural Impacts Category Narratives
3 points None/No potential to cause effects. No known sensitive environmental issues are present or anticipated if a probable worst case scenario occurs. Hazard does not have the potential to cause effects on historic properties, assuming such historic properties are present (36 CFR 800.3(a)(1)).
9 points Likely to affect/No historical property affected. If a probable or historically common failure occurs or the slope retrogresses, minor environmental impacts are anticipated, but adverse impacts are not anticipated. Historic properties are present but the hazard will have no effect upon them (36 CFR 800.4(d)(1))
27 points Likely to Adversely Affect/Finding of No Adverse Effect. If a probable or historically common failure occurs or the slope retrogresses adverse impacts are anticipated. Historic properties are present but the hazard will require modification or conditions imposed should the hazard continue untreated (36 CFR 800.5(a)(2)(vii)(b)).
81 points Current adverse effects/Adverse Effect. Current conditions are causing adverse environmental effects. An adverse effect is found when an undertaking may alter, directly or indirectly, any of the characteristics of a historic property (36 CFR 800.5(a)(1)).
AA. Maintenance Complexity
Complexity of maintenance following rockfall or landslide events is indicative of the maintenance costs
and associated hazards. Maintenance could be as simple as cleaning rocks off the road during routine
road patrols or as complex as the maintenance of unstable slope remediation systems such as rockfall
attenuator fences or construction of MSE walls to remediate an embankment landslide.
Table 4-7: Risk Rating – Maintenance Complexity Category Narratives
3 points Routine effort/in-house. Maintenance staff typically deal with unstable slopes with road-going equipment such as a pickup with a blade, particularly effective with rockfall incidences.
9 points In-house maintenance/special project. Maintenance of the site requires mobilization of specialized equipment such as a backhoe, excavator, paver, guardrail post driver, etc.

Landslide Technology 29 April 19, 2017
27 points Specialized equipment/contract. Maintenance requires specialized equipment to be mobilized a significant distance or requires assistance from an outside contractor. More involved maintenance may require basic engineering efforts (subgrade design, asphalt mixes, etc.).
81 points Complex or dangerous effort/location/contract. Specialty contractor is required to perform maintenance activities (i.e. maintaining rockfall attenuator fences); more complex maintenance designs (such as subgrade reinforcement, MSE walls, rockfall mitigation, etc.) requiring geotechnical design efforts; or difficult/dangerous access (rope access, spider hoe, etc.) is required.
BB. Event Cost
The estimated, or actual cost if available, to maintain or repair a probable worst case scenario or a
historically bad failure should be considered. The costs should be considered at comparable private-
sector equipment rental and operator rates. If an extreme event requires outside assistance (planning,
design, and/or construction) the costs should include both those outside costs and the agency contracting
and supervisory costs.
Table 4-8: Risk Rating – Event Costs Category Narratives
3 points $0-2k. Maintenance efforts and costs involve only agency maintenance staff using existing equipment. No design work required.
9 points $2-25k. Event cost and response is more involved and may include input from agency engineering staff.
27 points $25-100k. Costs indicate extensive, multiday efforts and likely input from engineering staff. Costs may include outside contractors and engineering costs.
81 points $>100k. Large contract with significant outside contractor and engineering costs.