Geotechnical and Seismic Risk Evaluation in Urban Areas
13
Missouri University of Science and Technology Missouri University of Science and Technology Scholars' Mine Scholars' Mine International Conferences on Recent Advances in Geotechnical Earthquake Engineering and Soil Dynamics 2010 - Fifth International Conference on Recent Advances in Geotechnical Earthquake Engineering and Soil Dynamics 28 May 2010, 2:00 pm - 3:30 pm Geotechnical and Seismic Risk Evaluation in Urban Areas Geotechnical and Seismic Risk Evaluation in Urban Areas Piera Paola Capilleri University of Catania, Italy Michele Maugeri University of Catania, Italy Erminia Raciti University of Catania, Italy Follow this and additional works at: https://scholarsmine.mst.edu/icrageesd Part of the Geotechnical Engineering Commons Recommended Citation Recommended Citation Capilleri, Piera Paola; Maugeri, Michele; and Raciti, Erminia, "Geotechnical and Seismic Risk Evaluation in Urban Areas" (2010). International Conferences on Recent Advances in Geotechnical Earthquake Engineering and Soil Dynamics. 9. https://scholarsmine.mst.edu/icrageesd/05icrageesd/session06b/9 This work is licensed under a Creative Commons Attribution-Noncommercial-No Derivative Works 4.0 License. This Article - Conference proceedings is brought to you for free and open access by Scholars' Mine. It has been accepted for inclusion in International Conferences on Recent Advances in Geotechnical Earthquake Engineering and Soil Dynamics by an authorized administrator of Scholars' Mine. This work is protected by U. S. Copyright Law. Unauthorized use including reproduction for redistribution requires the permission of the copyright holder. For more information, please contact [email protected].
Transcript of Geotechnical and Seismic Risk Evaluation in Urban Areas
Missouri University of Science and Technology Missouri University of Science and Technology
Scholars' Mine Scholars' Mine
International Conferences on Recent Advances in Geotechnical Earthquake Engineering and Soil Dynamics
2010 - Fifth International Conference on Recent Advances in Geotechnical Earthquake
Engineering and Soil Dynamics
28 May 2010, 2:00 pm - 3:30 pm
Geotechnical and Seismic Risk Evaluation in Urban Areas Geotechnical and Seismic Risk Evaluation in Urban Areas
Piera Paola Capilleri University of Catania, Italy
Michele Maugeri University of Catania, Italy
Erminia Raciti University of Catania, Italy
Follow this and additional works at: https://scholarsmine.mst.edu/icrageesd
Part of the Geotechnical Engineering Commons
Recommended Citation Recommended Citation Capilleri, Piera Paola; Maugeri, Michele; and Raciti, Erminia, "Geotechnical and Seismic Risk Evaluation in Urban Areas" (2010). International Conferences on Recent Advances in Geotechnical Earthquake Engineering and Soil Dynamics. 9. https://scholarsmine.mst.edu/icrageesd/05icrageesd/session06b/9
This work is licensed under a Creative Commons Attribution-Noncommercial-No Derivative Works 4.0 License.
This Article - Conference proceedings is brought to you for free and open access by Scholars' Mine. It has been accepted for inclusion in International Conferences on Recent Advances in Geotechnical Earthquake Engineering and Soil Dynamics by an authorized administrator of Scholars' Mine. This work is protected by U. S. Copyright Law. Unauthorized use including reproduction for redistribution requires the permission of the copyright holder. For more information, please contact [email protected].

Paper No. 6.13b 1
GEOTECHNICAL AND SEISMIC RISK EVALUATION IN URBAN AREAS
Capilleri Piera Paola University of Catania Viale A. Doria, 6, 95125, Catania (Italy)
Maugeri Michele University of Catania Viale A. Doria, 6, 95125, Catania (Italy)
Raciti Erminia University of Catania Viale A. Doria, 6, 95125, Catania (Italy)
ABSTRACT
Seismic and geotechnical hazard problems are widespread all over the world and they can cause natural disasters, damaging properties or causing human lives losses. Italian municipalities are not yet organised either to deal with the phenomena consequences, or to plan risk mitigation actions. A clear knowledge of the location and of the space and time evolution of the phenomena is needed for a vulnerability mitigation in the probably involved areas. Geo-hazard can be related with the consequences for exposed people and man made work by a microzonation. GIS technologies could play a crucial role in analysing large areas, but a good geodatabase should be designed and populated with all the available data. In this work, an approach to detect geotechnical hazard factors and vulnerability elements of urban areas is presented. A geodatabase is designed in terms of conceptual and logical model. A multy-risk analysis is carried out, pointing out geotechnical seismic and hydrogeological risk. Expressly created forms are proposed, that include specific sections regarding buildings, infrastructures and lifelines for vulnerability detection. Some applications in central Sicily (Italy) are shown. From such a analysis, Civil Defence and Local Authorities could obtain a continuous stream of information and integrate them into models for hazard knowledge, vulnerability mitigation and risk prevention.
INTRODUCTION
Seismic and geotechnical hazard problems are widespread all over the world. Since the disaster of the Val of Noto in 1693 and that of Messina in 1908, until the most recent earthquake, April 2009 in Abruzzi, we are seeing a continuous earthquake activity in Italy. Similarly, for as regards floods, it should be remembered that of Florence, Sarno, Soverato and the last that happened in Messina on October 2009. These crises caused extensive damage in many towns, with immense losses of human lives and properties. Italian municipalities are not yet organised either to deal with the phenomena consequences, or to plan risk mitigation actions. A clear knowledge of the location and of the space and time evolution of the phenomena is needed for a vulnerability mitigation in the probably involved areas. An ideal Disaster Management System should support the activities related to preparedness, prediction, damage assessment and rehabilitation. The ability of a disaster victim to prepare for, respond to, and recover from a disaster depends on a variety of factors, among which the severity and longevity of the event, the efficiency of the warning systems and the victim’s health status; but one of the most important thing is his/her access to resources and information.
Geo-hazard can be related with the consequences for exposed people and man made work by a microzonation. GIS technologies could play a crucial role in analysing large areas, but a good geodatabase should be designed and populated with all the available data. To evaluate geotechnical and seismic risk of a specific area, it is important to have as much information as possible about its hazard and its vulnerability. Current studies show that there are several problems with collection, dissemination, access and use of spatial data/information for disaster management. This paper deals with information and data collection. An approach to detect geotechnical hazard factors and vulnerability elements of urban areas is presented. A geodatabase is designed in terms of conceptual and logical model and then it is implemented in a physical model, with the aim of collecting and storing informations in a systematic way and allow an effective consultation and a continuous updating. A multy-risk analysis is carried out, pointing out geotechnical seismic and hydrogeological risk. Expressly created forms are proposed, that include specific sections regarding buildings, infrastructures and lifelines for vulnerability detection. The geo-database will be populated with data collected about three municipalities in the heart of Sicily (Italy). From such a analysis, Civil Defence and Local Authorities could obtain a continuous stream of

Paper No. 6.13b 2
information and integrate them into models for hazard knowledge, vulnerability mitigation and risk prevention.
GEOTECHNICAL AND SEISMIC RISK EVALUATION
Geotechnical and seismic risk evaluation in urban areas is very important, both during the planning and the emergency phases. It could be a useful tool to achieve sustainable development, reducing human and material losses caused by earthquakes, landslides, floods or other natural disasters. The ultimate objective of disaster management is to bring the probability that damage will occur from an event as close to zero as is possible. This requires an understanding of all of the elements contributing to a disaster. To mitigate human and property losses, natural risk evaluation and disaster risk reduction activities in urban areas should be brought about and they should be integrated and coordinated among international, national and regional organizations. To quantitatively assess geotechnical or seismic risk, an analytical procedure, widely accepted in technical literature, can be applied:
Disaster Risk = Hazard x Vulnerability (1)
So, to evaluate risks, hazards should be identified and quantified and the probability and consequences of the natural disaster occurrence should be estimated. It must be emphasised that the absolute risk is a complex, multiplicative function of the hazard level and the vulnerability of a community. Sometimes hazards are dictated only by nature (e.g., earthquakes, floods, landslides, volcanic eruptions, etc.) and exposed elements can suffer the event consequences especially if they are more vulnerable; other times human actions result in augmentation of the vulnerability, amplifying the negative effects of an event (e.g., cutting trees increase the risks for erosion, landslides, or flooding; improvements in riverbeds in an effort to prevent flooding up-stream that may worsen flooding downstream, etc.). For a vulnerability analysis, a great amount of alphanumerical and geographical information, sometimes critical, like buildings, hospitals, roads, railways, or lifeline system location, should be collected and managed. National specialized centres, like Meteorological and Hydrological Services and National Institute of Geophysics and Volcanology have responsibility for investigating geophysical hazards, including earthquakes, volcanic explosions, floods and so on [Capilleri et al. 2009] and they will need geological geo-morphological, hydrological and geotechnical data. Finally, a risk assessment will be obtained and preventive measures could be taken. Many organizations involved in disaster management, require to access to the right data in the right time to make the right decisions. It would be a great success in the disaster management if police, fire, public health, civil defense and other organizations would implement a disaster management application in a coordinated manner at both intra and inter-organization at several hierarchy levels. For example, for as regards floods, timely and reliable weather forecasts, and advance warnings could be useful to minimize loss of life and damage and facilitate
timely and effective rescue, relief and rehabilitation of the affected population. Hazard and vulnerability are usually rated on scales of 1-5. This values can be deduced analysing all the available information and assigning penalty values to each element taken into account. The compilation of a "geotechnical hazard form" should be the first step for the seismic and hydrogeological risk evaluation. The general criteria given by TC4 [1999] for Grade 2 microzonation, the semi-quantitative procedure introduced by Augusti et al. [1985, 1988], based on filling penalty form, adapted to the geologic feature of the studied zones is used in this present work. The formulation criteria of penalty form have been improved since the first studies of Augusti et al. [1985, 1988] on the basis of the experimental observations regarding the damage that occurred and geological and geotechnical conditions of the investigated area [Massimino et al., 2001]. In the present paper the last version of penalty form reported in Massimino et al. [2001] is utilised with some modifications [Capilleri et al. 2009] according to EC8 [2003], D.M. 14/01/2008 and D.lg 152/2006. The general penalty form reported in Massimino et al. [2001] considers a comprehensive seismic hazard evaluation concerning not only the site amplification phenomena, but also the seismic landslide and liquefaction. The new penalty form proposed in the present application concerns not only seismic hazard (ground motion and landslides), but also hydrogeological hazard (landslide phenomena due to hydrogeological factors). The factor taken into account in the utilised penalty form are reported in Tab.10. In particular it is possible to observe that for as regards “local slope”, "1" will be chosen for the slope foot or for a valley zone, "1.5" for a zone located in the middle of a slope, 2 for a zone near the slope crest. For as regards “landslides”, for a building near a stable slope a weight "0" will be considered. If the building is near an unstable or potentially unstable slope, "1" will be the weights to take into account.
Table 1. The penalty form (Capilleri et al. 2009)
PENAL TY
LOW MEDIUM HIGH
S UB S OIL
PARAME TE R S
S L OPE S TAB IL ITY S TAB L EQUIE S C E NT
L ANDS L IDE AC TIVA L ANDS L IDE
0 ‐ 1 2 ‐ 3 ‐ 4 4 ‐ 5 ‐ 6
L OC AL S L OPE i < 5° 5° < i < 15° i > 15°
1 1 ‐ 1.5 ‐ 2 2 ‐ 3 ‐ 4
MORPHOL OGY F L AT ARE A S L OP ING ARE A R IGDE
O.5 1 ‐ 1.5 ‐ 2 2
WATE R TAB L E d > 10 m 5 m < d < 10 m d < 5 m
DE PTH0 1 2
E XPOS URE S ‐SW S E ‐E ‐W‐NW N‐NE
0 1 2
S tratigraphy (*) Be cons idered only if evidence of Down‐Hole
HARD ROC K MEDIUM S OIL S OF T S OILTY P E OF S OIL
S HE AR WAVE VE LOC ITY VS > 500 m/s 200 < VS < 500 m/s VS < 200 m/s
DE PTH (m)
0 ‐ 5 0.5 1 ‐ 1.5 ‐ 2 25 ‐ 10 0.5 0.5 ‐ 1 ‐ 1.5 210 ‐ 25 0.5 1 2> 25 0.5 1 1.5
Moreover, it is important to define the building position in relation to a quiescent or active landslide. A weight "2" or “4” will be taken if the building is located at the periphery of the

Paper No. 6.13b 3
landslide, while weight "4" or "6" will be assigned if the building is within the landslide, "3" and "5" in other cases. For as regards exposure, a wedge "2" will be considered if the building is exposed toward north or north-east direction, "0" if towards south or south-west, "1" in all other cases. Finally, for “Down-Hole tests”, the table gives the weights in relation to the soil type and the shear wave profile (VS) (compact, medium compact, soft or loose). Based on the above factors, through the allocation of weights to the geological and conditions of the land assessed, can be obtained an Geotechnical Hazard Index (IGH) through which one can classify the level of danger of the area in question. The values of IGH are grouped in five different ranges corresponding to level hazard from low to very high. In Tab. 11 the different classes are shown.
Table 2. Hazard levels
IGH HAZARD LEVEL 2.54.0 Low I 4.56.0 Moderate II 6.58.0 Medium III
8.510.0 High IV >10.5 Very High V
For as regards vulnerability, man made works, like building, roads, railways, or other transportation networks and lifeline networks will be taken into account. To evaluate their vulnerability, surveys can be brought about and all the information can be collected using “vulnerability forms”. With the aim of quantifying the part of risk due to site and soil features, the use of a "Geotechnical hazard form" has been proposed by Augusti et al. [1985, 1989] introduce a semi-quantitative procedure given by ISSMGE - TC4 [1999] general criteria for a Grade 2 microzonation. The first model of "Geotechnical hazard form" proposed by Augusti et al. [1985, 1986] have been improved by other authors, basing on experimental observations on occurred damages and on geological and geotechnical conditions of the investigated areas. A procedure, based on compiling a "Geotechnical hazard form", adapted to geomorphologic and geologic features of the Umbria zones, was successfully used by Crespellani and Garzonio [1987,1996] Gubbio town (Umbria-Italy), by Cascone et al. [1997, 1999] for the city of Catania (Sicily - Italy) and by Massimino et al. [2001] for Sellano town (Umbria-Italy). In this paper the new version of "Geotechnical hazard form", proposed by Capilleri et al. [2009] and already applied in some test areas has been modified and then utilised. The new form has nine sections.
Section 1: General data (Tab.3). Section 2: Work identification and maintenance conditions
(Tab.4). Section 3: Soil conditions (Tab.5). Section 4: Geophysical data (Tab.6). Section 5: Geotechnical data (Tab.7). Section 6: Buildings (Tab.8). Section 7: Roads (Tab.9). Section 8: Railways (Tab.10). Section 9: Lifelines (Tab.11)
In the first section (Tab.3) general data about the survey name, identificative code and address should be inserted. In the second section (Tab.4) the visited man made work should be macroscopically identified, choosing between “building”, “road”, “railway” or “lifeline arc”, and its maintenance class should be indicated. Moreover the presence of a repair and datas of last maintenance work and scheduled maintenance work should be indicated. Finally, the data availability should be reminded, and some references should be pointed out. Notes can help for recording other important informations.
Table 3. Speditive Survey Data Collection form: Section 1 –
“General data”
Table 4. Speditive Survey Data Collection form: Section 2 –“Work identification and maintenance conditions”
Table 5. Speditive Survey Data Collection form: Section 3 –“Soil conditions”

Paper No. 6.13b 4
Table 6. Speditive Survey Data Collection form: Section 4 –“Geophisical data”
Table 7. Speditive Survey Data Collection form: Section 5 –“Geotechnical data”
Table 8. Speditive Survey Data Collection form: Section 6 –“Buildings”
In Section 3 (Tab. 5) speditive information about soil conditions, like morphologic features, average slope and exposition, local slope angle, bedrock depth, groundwater depth, cavity presence and landslide proneness will be stored. Results availability within a buffer of 50m, 100m or 300m of geophysical tests in Section 4 (Tab.6) and geotechnical tests in Section 5 (Tab.7) should be pointed out. In section 5 you can indicate also a speditive shear wave profile. The form can be compiled at different levels of accuracy. Those data can be deduced from geological and geomorphologic maps,
available geotechnical data and geophysical surveys, direct testing and mapping, field observations. Then, based on the chosen man made work type, you will compile one among Section 8, 9, 10 or 11.
Table 9. Speditive Survey Data Collection form: Section 7 –“Roads”
Table 10. Speditive Survey Data Collection form: Section 8 –
“Railways”
If you deal with buildings (Section 6 – Tab.8), you should wonder if it is a single building or is part of a building aggregate. Then the floor number and the underground floor number will be reminded. For as regards its function, you should distinguish among strategic (Police, Civil Defence, Fire Station, Public administrative offices, and Health), public (Worship, Instruction, Commercial or Sport) or private (residential or industrial) buildings. Ownership (public or private) could be a useful information for communication aim. Dealing with vulnerability, the most important information regards the building structure (masonry, horizontally reinforced masonry, reinforced concrete, steel, wood, mixed or other types) and foundation (masonry, horizontally reinforced masonry,
Paper No. 6.13b 5
isolated plinths, reinforced concrete beam framework, reinforced concrete piles, wood piles or other types). If you deal with roads (Section 7 – Tab.9), first of all you should wonder if it is a escape way. Then you should indicate its function (primary road, secondary road designated, secondary road not designated, local distributor road, local access road or other types) and its class (Motorway, trunk road or part of priority, principal road, class 1, 2 or 3 road or district road). The road ownership (Municipality, Province, Country, Private or other board) is an important information. Then the road arc site (plain, embankment, cutting, cut and fill, viaduct, tunnel or other), its structure (masonry, reinforced concrete, wood, steel, mixed or other) and its material (concrete, asphalt cement, cobblestone, sanpietrini, bolognini or other) will be reminded. If you deal with railways (Section 8 – Tab.10), you should too wonder if it is a escape way. Then you should indicate its function (high velocity, passenger transportation, goods transportation, subway, underground or other) and its weight class (light, standard or heavy). The railway ownership (Municipality, Province, Country, Private or other board) is an important information. Then the rail arc site (plain, embankment, cutting, cut and fill, viaduct, tunnel or other), its track (traditional, ballastless, obsolescent, steel, mixed or other) and its cross ties (stone block, wooden, concrete, steel, plastic/rubber composite, tubular modular track, ballastless track or other) will be reminded.
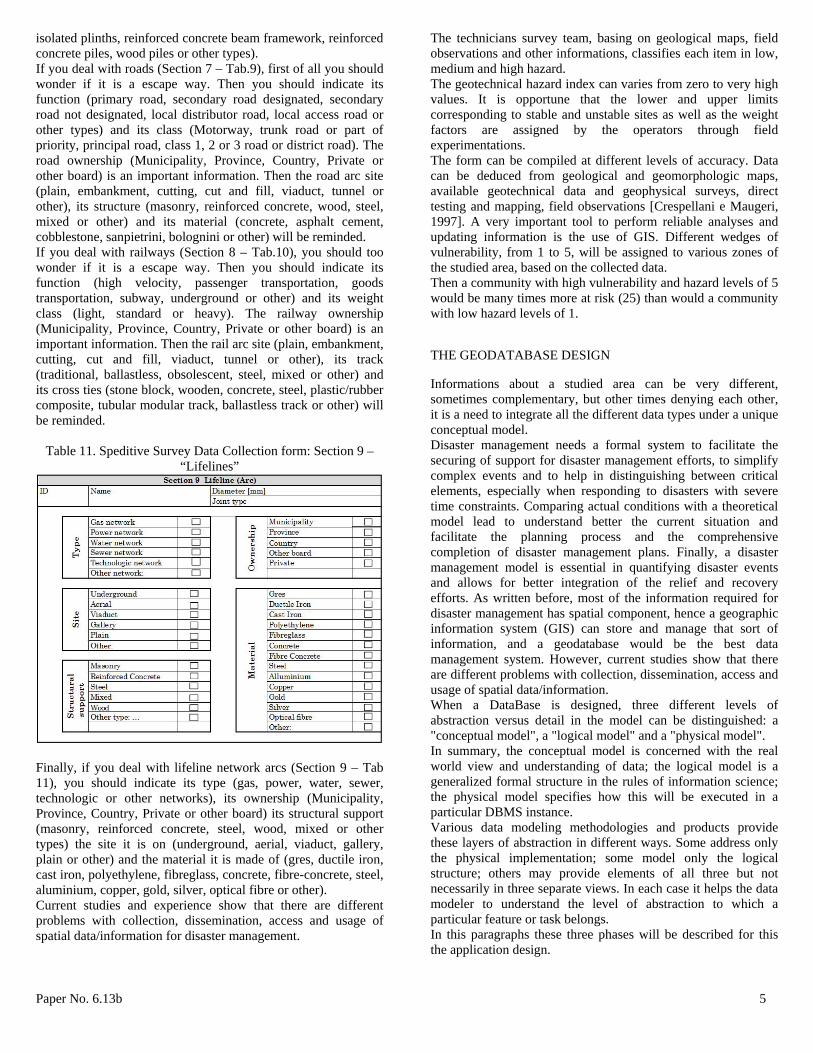
Table 11. Speditive Survey Data Collection form: Section 9 –“Lifelines”
Finally, if you deal with lifeline network arcs (Section 9 – Tab 11), you should indicate its type (gas, power, water, sewer, technologic or other networks), its ownership (Municipality, Province, Country, Private or other board) its structural support (masonry, reinforced concrete, steel, wood, mixed or other types) the site it is on (underground, aerial, viaduct, gallery, plain or other) and the material it is made of (gres, ductile iron, cast iron, polyethylene, fibreglass, concrete, fibre-concrete, steel, aluminium, copper, gold, silver, optical fibre or other). Current studies and experience show that there are different problems with collection, dissemination, access and usage of spatial data/information for disaster management.
The technicians survey team, basing on geological maps, field observations and other informations, classifies each item in low, medium and high hazard. The geotechnical hazard index can varies from zero to very high values. It is opportune that the lower and upper limits corresponding to stable and unstable sites as well as the weight factors are assigned by the operators through field experimentations. The form can be compiled at different levels of accuracy. Data can be deduced from geological and geomorphologic maps, available geotechnical data and geophysical surveys, direct testing and mapping, field observations [Crespellani e Maugeri, 1997]. A very important tool to perform reliable analyses and updating information is the use of GIS. Different wedges of vulnerability, from 1 to 5, will be assigned to various zones of the studied area, based on the collected data. Then a community with high vulnerability and hazard levels of 5 would be many times more at risk (25) than would a community with low hazard levels of 1.
THE GEODATABASE DESIGN
Informations about a studied area can be very different, sometimes complementary, but other times denying each other, it is a need to integrate all the different data types under a unique conceptual model. Disaster management needs a formal system to facilitate the securing of support for disaster management efforts, to simplify complex events and to help in distinguishing between critical elements, especially when responding to disasters with severe time constraints. Comparing actual conditions with a theoretical model lead to understand better the current situation and facilitate the planning process and the comprehensive completion of disaster management plans. Finally, a disaster management model is essential in quantifying disaster events and allows for better integration of the relief and recovery efforts. As written before, most of the information required for disaster management has spatial component, hence a geographic information system (GIS) can store and manage that sort of information, and a geodatabase would be the best data management system. However, current studies show that there are different problems with collection, dissemination, access and usage of spatial data/information. When a DataBase is designed, three different levels of abstraction versus detail in the model can be distinguished: a "conceptual model", a "logical model" and a "physical model". In summary, the conceptual model is concerned with the real world view and understanding of data; the logical model is a generalized formal structure in the rules of information science; the physical model specifies how this will be executed in a particular DBMS instance. Various data modeling methodologies and products provide these layers of abstraction in different ways. Some address only the physical implementation; some model only the logical structure; others may provide elements of all three but not necessarily in three separate views. In each case it helps the data modeler to understand the level of abstraction to which a particular feature or task belongs. In this paragraphs these three phases will be described for this the application design.
Paper No. 6.13b 6
A conceptual model is a plot that represents all the informations that should be collected with the relationships that bounds each-other, suppressing non-critical details. It typically includes only significant entities, along with their relationships. Many-to-many relationships are acceptable to represent entity associations. A conceptual model may include a few significant attributes to augment the definition and visualization of entities. No effort is made to inventory the full attribute population of such a model. A conceptual model may have some identifying concepts or candidate keys noted but it explicitly does not include a complete scheme of identity, since identifiers are logical choices made from a deeper context.
Fig. 1: A schematic plot of the data base conceptual model.
For the conceptual model design the entity-relationship model (E-R) has been used. In Fig. 1 its simplified scheme is drawn. Entities represent object classes with common properties and autonomous existence for the application aim. On the other hand, relationships represents logical links among two or more entities that are significant for the application. A complete conceptual scheme should represents all the interesting data and all the queries can be executed. So it must be taken into account its aim. In that case the studied area should be characterized and analysed, so that the more hazardous (with respect to a particular natural phenomenon) or vulnerable areas can be recognized and the risk level can be evaluated. A central entity will be chosen to connect all entities of the conceptual scheme. For all entities two attributes have been added: “Notes”, to store all additional information, and “References”, to store authors and fonts of information to evaluate the data availability. The main topic of this entity-relationship model is the “Municipality”, that is a territorial unit that obviously can be located in a precise region and in one or more hydrographical basins. The studied area is characterized by a Id, a ISTAT code, that is a primary key, its name, an administrative code, the historical center UTM N and E coordinates and some notes. Moreover it must be geographically located: a “Localization” entity has been created, where a *.doc file, describing of the main features and of morphology, is hyperlinked. The entity "ISTAT” attributes are: “code”, “municipality name”, “notes” and “references”. One entity called “topography”, will contain all raster topographic maps, at different scales, that will be collected. One
entity called “lithology” will contain all lithological units, a second entity called “geology” will contain all geological formations. Geomorphologic information, like slope, exposition, other morphological information, will be stored in another entity called “geomorphology”. One entity will represent “Land use”: those information will be acquired from Corine Land Cover or more detailed thematic maps,. The entity “General town plan” attributes are: ID (primary key), “ISTAT”, “Building plan” (when a general town plan is missing), zone, description, notes, references. To store other thematic maps a “Thematic map” entity has been introduced with the following attributes: ID (primary key), ISTAT, Date of the map plot, map name, map scale, notes, references. Information about surface hydrology will be divided in two groups, to distinguish areas and polyline entities. For each element, an Id, a name and information about maintenance and the origin of information will be stored. For as regards geotechnical information, a point entity called “geotechnical survey” will store an Id, East and North coordinates, survey type, the origin of information and some notes. For each survey, in situ and/or laboratory tests information will be stored in two other entities. For laboratory tests, the attributes will be Id, UTM E and N coordinates, Date, Font and some notes. For in situ tests Id, stratigraphy, water table depth, test type, number of samples (undisturbed, disturbed, remoulded), photos and some notes are the required information. “Geophysical tests” will be the entity that will store results of these tests. To take into account any problem of the studied area, a monitoring activity can been designed and all the acquired information will be stored in a entity called “monitoring point”, with the following attributes: ID (primary key), ISTAT, UTM E and N coordinates, monitoring type (piezometric, inclinometric, total station…), the date of start and stop of monitoring, results (inclinometric profiles, displacements plots, etc.), photos, notes, references. In a municipal area, one or more monitoring points could be found. Some entities will be devoted to transportation networks, like roads or railways, to point out escape ways: for each network arc, an Id (primary key), a name, a classification, a structural type, information about the bed location (road-bed, railway-bed), UTM E and N coordinates, information about the suffered damages, some notes and references will be stored. Other entities will be devoted to lifeline networks, like water, sewer or gas pipes, electric power, and other technological networks: for each network arc, an Id (primary key), a name, a classification, a structural type, information about the pipe bed location (in case of pipeline networks), UTM E and N coordinates, information about the maintenance class and about the suffered damages, some notes and references will be stored. A dynamic segmentation can be applied for networks. One entity called “buildings” will store information about buildings, like Address, Type (pubblic or private), Function, Foundation and Structural type (Masonry, reinforced concrete, steel, etc.), number of underground floors, suffered damage, damage cause, etc. For as regards relationships, the entity “Municipality” through the attribute “ISTAT code”, has been linked by one to one relationships to the entity “ISTAT”. Moreover, one to many relationships link the entity “Municipality to the entities:

Paper No. 6.13b 7
“surface hydrology (polyline)”, “underground hydrology (polyline)”, “geophysical test”, “geotechnical characterisation”, “monitoring point”, “road (polyline)”, “railway (polyline)”, “gas network (polyline)”, “power network (polyline)”, “water network (polyline)”, “sewer network (polyline)”, “technologic network (polyline)” and “buildings”, while many to many relationships to the entities: “General Town Plan”, “topography”, “raster thematic maps”, “geomorphology”, “lithology”, “geology”, “land use”, “hydrographic basin”, “surface hydrology (polygon)”, “underground hydrology (polygon)”. All the raster entities have been linked through many to many relationships because they represent areal intersections between the municipality area and the specific entity area. Problems could arise when more than one municipality is involved in a occurrence of a areal entity. In such a case the intersecting areas are divided. The logical model translates the conceptual model with respect to relational theory. It contains only fully normalized entities, that is they include the full population of attributes to be implemented and those attributes are defined in terms of their domains or logical data types (e.g., character, number, date, picture, etc.). Some of these may represent logical domains rather than potential physical tables. Moreover, the logical model requires a complete scheme of identifiers or candidate keys for unique identification of each occurrence in every entity. Since there are choices of identifiers for many entities, the logical model indicates the current selection of identity. Propagation of identifiers as foreign keys may be explicit or implied. Since relational storage cannot support many-to-many concepts, the logical data model resolves all many-to-many relationships into associative entities which may acquire independent identifiers and possibly other attributes as well. The physical model is a single logical model instantiated in a specific database management product, with specific parameters for data storage. It depends on the chosen data base management system. In this case, for a first application, that requested only alphanumerical data collection, Microsoft Access has been chosen, and the implementation details as well as configuration choices for that database instance have been specified. These include index construction, alternate key declarations, modes of referential integrity (declarative or procedural), constraints, views, and physical storage objects such as tablespaces. The designed geodatabase has been finally implemented by ArcGIS (ESRI) to take into account all the geographical features of the collected information and to obtain, as a final result, damage, hazard, vulnerability and risk thematic maps. The final product can be obtained creating forms, relationships and the most useful queries, that can be written by structured query language (SQL). It must be underlined that queries must be designed before the physical implementation. Otherwise it could be non more possible to filter data as necessary.
THE ANALISED TOWNS
Natural disaster do not become by accident, but it can be shown that, for a series of reasons, they often recur in the same places of the past. Of course, a short history is likely to underestimate the rate of large earthquakes or floods. Moreover, the rates of small phenomena are typically determined from the hydrological
or seismological record whereas the rates of large phenomena, are based also on witness statements, especially for as regards the remote past, as no records can be available. In every case, a careful research about specific disaster historical sequence in the studied area can be very important. For as regards landslides, they can be very different, but morphological and geological features influence the displacement kinematics. Similar slope movements happen in the same areas. It has been observed that natural disaster have often deeply influenced the urban development of human settlement. Three municipalities of the heart of Sicily have been chosen as testing areas for this project implementation. They are Caltagirone and Grammichele, in Catania province and, Niscemi, in Caltanissetta province (Fig.2). All these towns have similar problems for as regards hydrogeological and seismic risk. Eastern Sicily has been often stricken by great seismic events. Reports about 1542-1543 earthquakes, that caused widespread damages in the studied areas, can be found. But, first of all it must been remembered the great Sicilian earthquake of January 11 1693, that struck parts of southern Italy, notably Sicily, and Malta. It caused the death of over 60,000 and affected an area of 5600 square kilometers destroing at least 45 towns and cities, among which Catania, Syracuse, Ragusa, Caltagirone, Grammichele, Nicosia, Barrafranca, Scordia, Palazzolo Acreide, Modica, Comiso and Mdina on Malta. Completely destroying many buildings, the earthquake prompted a Baroque revival in architecture in the towns of Sicily and Malta known as Earthquake Baroque and many existing cathedrals and buildings can be pinpointed as being built at a similar time. After the destruction, with the aim of creating new building lands, most of the existent valleys were filled up with debris and rubble, compromising the new building stability. Also landslide can influence urban development, but they are usually localized phenomena that can involve almost one or two municipalities.
Fig. 2: The studied towns.
Caltagirone is the largest munipality in Sicily and the most important town of Calatino area. It is one of the most lively Baroque towns in central Sicily. It is located at the foot of the north-eastern Erei Mounts and north-western Mounts Iblei at an altitude between 500 and 600 meters above sea level. The territory has an area of about 380 sq km. It is bounded by the

Paper No. 6.13b 8
comuni of Acate, Gela, Grammichele, Licodia Eubea, Mazzarino, Mazzarrone, Mineo, Mirabella Imbaccari, Niscemi, Piazza Armerina, San Michele di Ganzaria. Fertile soils induce the development of agriculture (production of grapes, olives, peaches).
Fig. 3: Caltagirone, Grammichele and Niscemi location and
bordering comuni.
Fig. 4: An aerial photo of Caltagirone: the most landslide prone
areas are evidenced.
The Arabs built here a castle, which in 1030 was attacked by Ligurian troops under the Byzantine general George Maniakes, and which have left traces of Ligurian language in the current dialect. The city flourished under the Norman and Hohenstaufen domination and for the abundance of clayey soils, the city became a renowned center for production of ceramics,
particularly maiolica and terra-cotta wares. The name itself – Caltagirone – derives from an Arabic word meaning the Castle or Fortress of the vases. Caltagirone ceramics have been used for centuries to decorate parks and churches, streets and squares. The typical colours of local pottery, sage green and yellow, are the colours of Sicily itself, of its sun and breathtaking beauty. Nowadays, Caltagirone is known in Italy as “The city of Sicilian ceramics” due to its thousand-year-old tradition and to the modern artists more and more oriented to artistic production of ceramics and terra-cotta sculptures. The city suffered heavy damages for 1542-1543 earthquakes and was almost completely destroyed by the severe earthquake of 1693. Many public and private buildings have then been reconstructed in Baroque style. Primarily for this reason, the city has been inserted, together with the surrounding territory in an area protected by the UNESCO World Heritage program.
Table 9. Caltagirone landslide activity documented in AVI
Project (http://sici.irpi.cnr.it/avi.htm)
Site DateCaltagirone 30/3/1973
Caltagirone 24/12/1976
Caltagirone 4/12/1976
Caltagirone 1981
Caltagirone 1985
Caltagirone 16/1/1985
Caltagirone - Monte San Giorgio 6/3/1950
Caltagirone – Near north-eastern side of Poggio Fanales 16/1/1985
Contrada Ficuzza – Along Torrente Ficuzza
Granieri – near the inhabited area
Moreover, Caltagirone has been involved in great landslide phenomena: one of the first documented important landslide is that of 1346. It involved the inhabited area immediately downstream the actual Church – convent of San Bonaventura and destroyed the whole district. During the period from 1346 and 1693 reports about other landslide phenomena involving the western area of the present historical center can be found. The instability of the historical centre has been officially admitted since 1954: in fact, D.P.R. n. 729 of 30/06/1954 indicates that consolidation works should be charged on the National budget. Grammichele is about 60km far from Catania, and it is built on the Hyblean hills, 521 m o.s.l. The municipal area is rounded by Licodia Eubea, Mineo and Caltagirone. The first human settlement referred to Grammichele was Occhiolà. It is generally identified with Echetla, a frontier city between Syracusan and Carthaginian territory in the time of Hiero II, which appears to have been originally a Sicel city in which Greek civilization prevailed from the 5th century onwards. Risen over an ancient agricultural suburb, Grammichele is outstanding for the production of grapes, olives, Indian figs, citrus fruits, and cereals. Nowadays, agriculture is the main economic activity, but occupational problems forced over 2000 people to emigrate in foreign countries. Occhiolà was an ancient mountainous suburb rose during Middle Age, included in Prince Branciforte of Butera fief. The great 1693 earthquake completely destroyed the old town, and many other mountain centers that were definitively abandoned.

Paper No. 6.13b 9
Fig. 5: The slate blackboard on which Fra Michele da Ferla beared Grammichele new town plan in 1693.
Fig. 6: An aerial photo of Grammichele.
The new towns, rose to accommodate the survivors, in flat zones with earthquake–proof criteria, and joined the innovative urban inventions. In particular, the new town that had to house Occhiolà survivor inhabitants, was called Grammichele to invoke the protection of S. Michele, also called the "Grande" (Great), and it belonged to Carlo Maria Carafa Branciforte, prince of Butera and Roccella. Thanks to his long view and generosity, the Prince, enlighten scientist, fan of mathematics, geometry and astronomy, and evidently aware of studies about ideal towns, from 1963 earthquake tragedy, learnt that earthquake-proof criteria should be used in a town planning, and first of all, the "new town" should be founded in a flat zone. Grammichele hexagonal city plan is probably derived from Palmanova plan (1593): the main difference is that Palmanova is based on a nine facets polygon, while Grammichele has a hexagonal plan that could be potentially extended indefinitely. The hexagonal plan designed for Grammichele is divided into six sectors by six roads all converging towards the main square, that is hexagonal too, on which public offices had to overlook. Many collecting areas were to gather in case of calamity (the actual squares), equidistant and all connected by a geometrically
concentric road network toward the main hexagonal square (now “Prince Carafa Square”), have been planned. Beyond the hexagon, four rectangular district were designed. One of them had to contain the Prince Palace that was never built. The new suburb was decided after consulting many urbanists and then Frà Michele da Ferla (XVIII century), a famous architect and urbanist at that time, designed it. It is based on a concentric urban structure surrounded by an hexagonal perimeter, with a big square at its center. In Fig. 3, the slate blackboard on which Fra Michele da Ferla beared Grammichele new town plan in 1693 is plotted. Grammichele was realised following faithfully La Ferla’s plan and now is one of the few concrete applications of urbanistic theories of ideal towns (Fig. 4). Niscemi, in Caltanissetta province, has 26.541 inhabitants. Its name derives from Arab “nasciam” (elm). The town is located an altitude of 320 m. a.s.l. on a plateau overlooking the Gela Plain. This plateau has max altitude of 608 m a.s.l. towards NE, in correspondence of Caltagirone, and slopes from NE to SW toward to stream Maroglio an altitude of about 40 m. a.s.l. Niscemi is bordered by the municipalities of Butera, Gela and Mazzarino, belonging to the Caltanissetta province, and Caltagirone belonging to the of Catania province. The Niscemi territory (about 47%) is within the basin of Gela river and within the basin of Achates river. The hills surrounding the city are marked by deep ravines and engravings, produced by erosion of surface water, uncontrolled, coming from the plateau, from springs, discharges of gray and black water. The more recent urbanisation of Niscemi dates back to the XVI century. The village was founded in 1629 by Giuseppe Branciforte, Prince of Butera, made by the King Filippo IV Prince of Niscemi in 1627. The present urban center was partially rebuilt after 1693 earthquake had destroyed the old feudal district. Moreover, landslide movements involving Niscemi urban area are quite well documented. The most recent landslide happened on October 12, 1997, leaving homeless hundreds of people. The landslide occurred without any apparent connection to a significant destabilising event, at the end of a long dry season and two to three days after intense - but not exceptional - rain storms (71 mm on October 9, and 26 mm on October 10, respectively). It was a landslide of slow and moderate displacement (having an estimated maximum velocity of 1 m/h and displacement up to 2-4m). It involved a highly asymmetric unstable mass and two orthogonal slopes in a sole movement, covering a surface of about 2 km2, with a main scarp of about 2,5 km and with ill-defined lateral borders. The recent landslide has destabilised, with noticeable geometrical coincidence, an ancient landslide body, whose only mobilisation which was well documented occurred on March 18, 1790, involving the same district (SS. Croci). The old mobilisation was similarly slow, although it lasted longer (the paroxystic stage developed over two days), had a higher velocity (presumably having a maximum of about 4-6 m/h) and higher vertical displacement (about 20m along the main scarp and a similar amount of uplift along the foot, displacing a part of the valley bottom plain). It also had a base failure without toe overlap, whose morphological effects are still evident. For these three towns as for others of Sicily, investigations and inspections were carried out by private, for specific building or facilities, and often nobody know their existence. The aim of this
Paper No. 6.13b 10
work was to create a database to systematically store all the available useful data collected visiting public offices or private technicians offices and compiling the proposed speditive survey forms. Table. 9. Niscemi Landslide activity documented in AVI Project
(http://sici.irpi.cnr.it/avi.htm)
Site Date Banco 1993
Canalicchio 1993
Niscemi
Niscemi – Near the inhabited area along SP n. 10 (Ponte Olivo - Niscemi - Valle Pilieri)
7/2/1996
Niscemi - A sud dell'abitato 12/10/1997
Niscemi - Contrada Pirillo (zona a SE di Niscemi)
Niscemi – Along SP n. 12 connecting with SS n. 117 bis (4th – 5th km)
1992
Niscemi - Via Gualtiero da Caltagirone
Niscemi – Beyond Via Serbatoio on the road toward Caltagirone 1998
Niscemi - Zona Santa Croce-Canalicchio 12/10/1997
Pirillo 1993
Santa Croce 1993
SP n. 10 Niscemi-Ponte Olivo a 300 meters from the inhabited area 1997
SP n. 12 Niscemi - Passo Cerasaro (4th – 5th km)
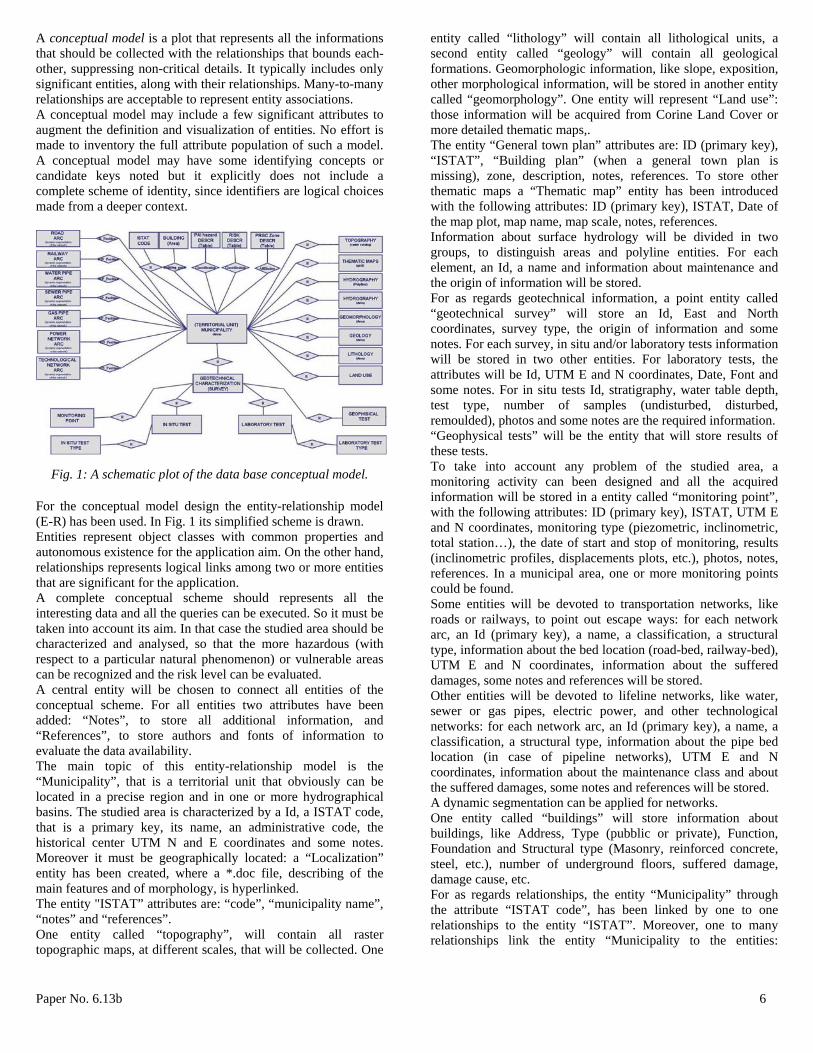
Fig. 7: Niscemi Landslide of 12/10/1997 .
Fig. 8: A vertical scarp near Niscemi inhabited center .
DATA COLLECTION
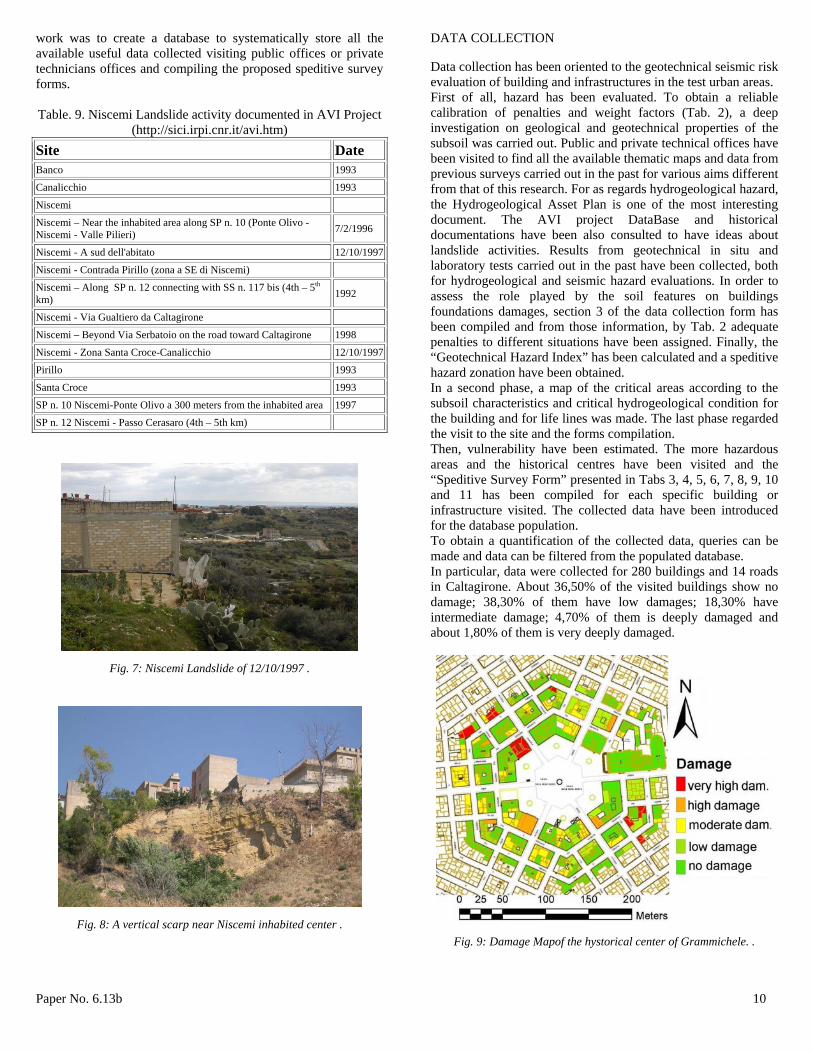
Data collection has been oriented to the geotechnical seismic risk evaluation of building and infrastructures in the test urban areas. First of all, hazard has been evaluated. To obtain a reliable calibration of penalties and weight factors (Tab. 2), a deep investigation on geological and geotechnical properties of the subsoil was carried out. Public and private technical offices have been visited to find all the available thematic maps and data from previous surveys carried out in the past for various aims different from that of this research. For as regards hydrogeological hazard, the Hydrogeological Asset Plan is one of the most interesting document. The AVI project DataBase and historical documentations have been also consulted to have ideas about landslide activities. Results from geotechnical in situ and laboratory tests carried out in the past have been collected, both for hydrogeological and seismic hazard evaluations. In order to assess the role played by the soil features on buildings foundations damages, section 3 of the data collection form has been compiled and from those information, by Tab. 2 adequate penalties to different situations have been assigned. Finally, the “Geotechnical Hazard Index” has been calculated and a speditive hazard zonation have been obtained. In a second phase, a map of the critical areas according to the subsoil characteristics and critical hydrogeological condition for the building and for life lines was made. The last phase regarded the visit to the site and the forms compilation. Then, vulnerability have been estimated. The more hazardous areas and the historical centres have been visited and the “Speditive Survey Form” presented in Tabs 3, 4, 5, 6, 7, 8, 9, 10 and 11 has been compiled for each specific building or infrastructure visited. The collected data have been introduced for the database population. To obtain a quantification of the collected data, queries can be made and data can be filtered from the populated database. In particular, data were collected for 280 buildings and 14 roads in Caltagirone. About 36,50% of the visited buildings show no damage; 38,30% of them have low damages; 18,30% have intermediate damage; 4,70% of them is deeply damaged and about 1,80% of them is very deeply damaged.
Fig. 9: Damage Mapof the hystorical center of Grammichele. .

Paper No. 6.13b 11
For as regards Grammichele, 167 buildings of the hystorical center have been visited Among them, about 60,57% of the visited buildings show no damage; 3,84% of them have low damages; 10,57% have intermediate damage; 22,11% of them is deeply damaged and about 2,88% of them is very deeply damaged.. Finally, for as regards Niscemi, 47 buildings and 15 roads have been visited, especially in the more landslide prone areas. Based on these findings, through the allocation of weights to the damage level and maintenance conditions a vulnerability index have been calculated. Risk thematic map could be obtained multiplying hazard maps and vulnerability maps by map algebra.
CONCLUSIONS
In this work, an approach to detect geotechnical hazard factors and vulnerability elements of urban areas, with the aim of calculating geotechnical and seismic risk and obtaining risk thematic maps, has been presented. A geodatabase have been designed in terms of conceptual and logical model and it has been implemented by GIS techniques. Expressly created forms, pointing out seismic and hydrogeological risk have been proposed. They include specific sections regarding buildings, infrastructures and lifelines for vulnerability detection. The aim of the work is to provide useful information in order to avoid and/or reduce geotechnical seismic risk for future natural disasters. Some applications in three town of central Sicily (Italy), chosen as test areas, have been shown. Hazard has been estimated compiling a "Geotechnical hazard form" and evaluating the “Geotechnical Hazard Index” based on the penalty form shown in Tab. 1. Then, vulnerability has been evaluated through the structures type and function, and the damage level observed on the visited buildings and roads and geological and geotechnical properties of the soil foundation. For as regards geotechnical properties, data obtained from on-site testing and laboratory equipment have been taken into account. All the collected data have been stored in a expressly designed geodatabase and GIS tools have been applied to obtain synthetic results about the visited building and roads and various thematic maps. From such a analysis, Civil Defence and Local Authorities could obtain a continuous stream of information and integrate them into models for hazard knowledge, vulnerability mitigation and risk prevention. Further developments for this work will consist in a extensive data collection for as regards the chosen test areas and for other towns where geotechnical and seismic risk have been observed.
AKNOWLEDGEMENTS
The authors wish to thank Andrea Aliotta, Giovanbattista Grimaldi, and Salvatore Sentina for their help in data collection.
REFERENCES
ATCGNH – ISSMFE (Asian Technical Committee on Geotechnology for Natural Hazards in ISSMFE) [1997]. Manual
for Zonation on Areas Susceptible to Rain Induced Slope Failure, The Japanese Geotechnical Society, July, 1997. Augusti, G., A. Borri, and T. Crespellani, [1985]- “Dynamic Maps and seismic risk reduction”. Proc. Int. Conf. on Reconstruction, Restoration and Urban Planning of Towns and Regions in Seismic Prone Areas, Skopje, pagg. 67-76, 1985. Augusti, G., A. Borri, T. Crespellani, and C.A. Garzonio [1989] “Seismic risk assessment for the preservation of historical building stocks in the city of Gubbio”. Tech. Comm TC 19, ISSMFE, Rio de Janeiro, 1989. Augusti, G., T. Crespellani and A. Borri [1988] “Dynamic maps for seismic risk reduction”, Proc. 9th World Conference on Earthquake Engineering, Tokyo, 1988. Augusti, G., T. Crespellani, and A. Borri [1988] – “Dynamic maps for seismic risk reduction and effects of soil conditions”. Proc. of the 5th ASCE Specialty Conference on Probabilistic Methods in Civil Engineering, Houston, 1988. Capilleri P.P., M. Maugeri and E. Raciti [2009]. “A procedure for the evaluation of geotechnical risk in urban areas: the case of Centuripe town”. Proc 1st International Conference on Disaster Management and Human Healt. New Forest, England, 23-25 September 2009 (pp. 357-368). Cascone E., F. Castelli, T. Crespellani, and M. Maugeri [1997]. “Geotechnical factor influence on the seismic exposition of buildings”. Proc. 8th National Meeting “Earthquake Engineering in Italy” Taormina (ME), 21-24 September 1997, pp. 887-894 (in Italian). Cascone E., F. Castelli, S. Grasso and M. Maugeri [1999]. “Seismic geotechnical hazard evaluation for the public buildings of Catania city”. Proc. 9th National Meeting “Earthquake Engineering in Italy” Turin, 23 September 1997, pp. 887-894 (in Italian). Crespellani T. and C.A. Garzonio [1987] “Critical areas and hazard index in the seismic field for territory of Gubbio”. Proc.. 3rd National Meeting “Earthquake Engineering in Italy” Rome, 30 Sept. 01 Oct 1987, pp. 285-296 (in Italian), 1987. Crespellani T. and C.A. Garzonio [1996] “Seismic risk assessment for preservation of historical buildings in the city Gubbio”. Proc. Arrigo Croce Memorial Symposium on Preservation of Historic Sites, Napoli, 3-4 Oct. 1996, pp. 177-186, 1996. Crespellani T. and M. Maugeri [1996] “Evaluation of seismic damageability of buildings including geotechnical hazard”. Fist Japan – Turkey Workshop on Earthquake Engineering, Istanbul, March 1997,Volume 2. D.M. 11.1.2008. Norme tecniche per le costruzioni. Gazz. Uff. Repubblica Italiana n. 29, 4 feb. 2008

Paper No. 6.13b 12
Decreto Legislativo 152-2006 "Testo Unico Ambientale" Aggiornato al 31 luglio 2009. ISSMGE - TC4 (Technical Committee for Earthquake Geotechnical Engineering) [1999], Manual for Zonation on Seismic Geotechnical Hazards (Revised Version), The Japanese Society of Soil Mechanics and Foundation Engineering, Tokyo, Japan. Massimino, M.R., M. Maugeri S. and Zuccarello [2001] – “The Grade 2 microzonation of Sellano”. Italian Geotechnical Journal, XXXV, n.4, pp. 79-89, 2001. Raciti, E., V. Chiessi, A. Rusconi and R. Ventura [2008] “GIS Techniques Application in Geological Hazard of Slope Instability Map Editing”. Mining and Environmental GeoEngineering, XLV, n. 1, April 2008. (In Italian). http://sici.irpi.cnr.it/avi.htm