Geosynthetic Stabilization for Wet Subgrade - Louisiana
21
Geosynthetic Stabilization for Soft Subgrade - Instrumentation and ME Approach Xiaochao Tang, Ph.D. Louisiana Transportation Research Center Murad Abu-Farsakh, Ph.D., P.E. Louisiana Transportation Research Center
Transcript of Geosynthetic Stabilization for Wet Subgrade - Louisiana

Geosynthetic Stabilization for
Soft Subgrade
- Instrumentation and ME
Approach
Xiaochao Tang, Ph.D. Louisiana Transportation Research Center
Murad Abu-Farsakh, Ph.D., P.E. Louisiana Transportation Research Center

ACKNOWLEDGEMENTS
Financial Support from LA DOTD, Tensor, TenCate
Assistance from PRF

BACKGROUND Louisiana soil: soft subgrade soil leads to excessive deformation
Treatments for soft subgrade:
o Thicker base (constraints of resources, high cost)
o Cut and fill (considerable expense of excavation and transportation)
o Chemical stabilization (lime-reactivity and environment, cement-
shrinkage cracks)
An alternative mechanical treatment: geosynthetics placed at base-
subgrade interface
Asphalt
SUBGRADE
Base

Extruded geogrids: a polypropylene (PP) or polyethylene (PE) sheet,
punched and drawn (Biaxial &Triaxial)
Woven / welded geogrids: polypropylene (PP) or polyester (PET)
yarns, woven or welded
Geogrids
Geosynthetics Manufactured from polymeric material, used with geotech engineering
projects such as slopes, retaining walls, embankments, and pavements;
Includes geotextiles, geomembranes, geonets, geocells, and geogrids.
Woven Biaxial
Geotextiles Permeable textile structures: Woven & Nonwoven
Extruded Biaxial
Extruded Triaxial
Woven Geotextile

Asphalt
SUBGRADE
Base
SUBGRADE
Asphalt
Base
No Geosynthetics With Geosynthetics
Geosynthetic Functions in Pavements
1) Separation: minimize base degradation
2) Confinement effects (interface friction, interlocking):
minimize lateral spreading, increased modulus
3) Tensioned membrane effects:
reduce vertical stress on subgrade
(Perkins, 1999)

Evaluate and quantify effectiveness of geosynthetic
reinforcements for pavements built over natural soft
subgrade
Examine pre-rut effects on geosynthetics performance
Incorporate effects of geosynthetic reinforcement into
pavement MEPDG design
RESEARCH OBJECTIVES

EXPERIMENTAL PROGRAM
Cross Section
A total of 6 test sections
Two control sections: sand embankment and unreinforced
Triaxial geogrids: double-layer & at interface
High-strength geotextiles: 12-in & 18-in base at interface
Heavy clay (A-7-6), Mexico Limestone, Level 2 Superpave mixture
Geotextiles Geogrids Geogrids
Test Sections

Pavement Instrumentation
HMA
Aggregate Base
Soil Subgrade
3''
10''
RS580 iGeotextile
CL
5''
1.5''
Potentiometer
Earth Pressure Cell
Piezometer
TDR Strain Gage
Instrument positions in Section 6(longitudinal cross section, not to scale)
LVDT
2' 2' 2'2'4'2'2'
1'
8'8'
2'2'
1'
Thermocouple (Note: thermocouple will be installed at the edge between Sections 5 and 6)
North
Load-associated:
stress, strain, & deformation
Environment-associated:
water content & temperature
What to measure ?
Where to measure ?
Critical responses:
top of subgrade, base, bottom of
AC
Pressure Cell (Top of Subgrade)
Hydraulic type with semiconductor transducer
Measures total stress and dynamic stress
Earth Pressure Cell
Pavement Instrumentation (cont’d)
Piezometer
Piezometer (Top of Subgrade)
Measures static and dynamic pore water pressure
LVDT (Top of Subgrade)
Spring-loaded type with a contact disk of 2 in diameter
Measures both elastic and permanent overall subgrade deformations
Pavement Instrumentation (cont’d)
Customized potentiometer
Potentiometer (Mid-Base)
Measures strain over the length
Both elastic and permanent
Customized LVDT

Pavement Instrumentation (cont’d)
Foil Strain Gauge on Geosynthetics
On opposite sides of geosynthetics, along transverse direction
Measures permanent and dynamic strains

Pavement Instrumentation (cont’d)
TDR (Top of Subgrade & Mid-Base)
Moisture content
Thermocouple (Subgrade, Base, & Asphalt Layer)
Spatial and temporal variations of temperature

Pavement Instrumentation (cont’d)
Cable protection and organization
Sensor labeling

Site Characterization
Subgrade and Base
LWD, Geogauge, Nuclear Gauge, DCP, and FWD
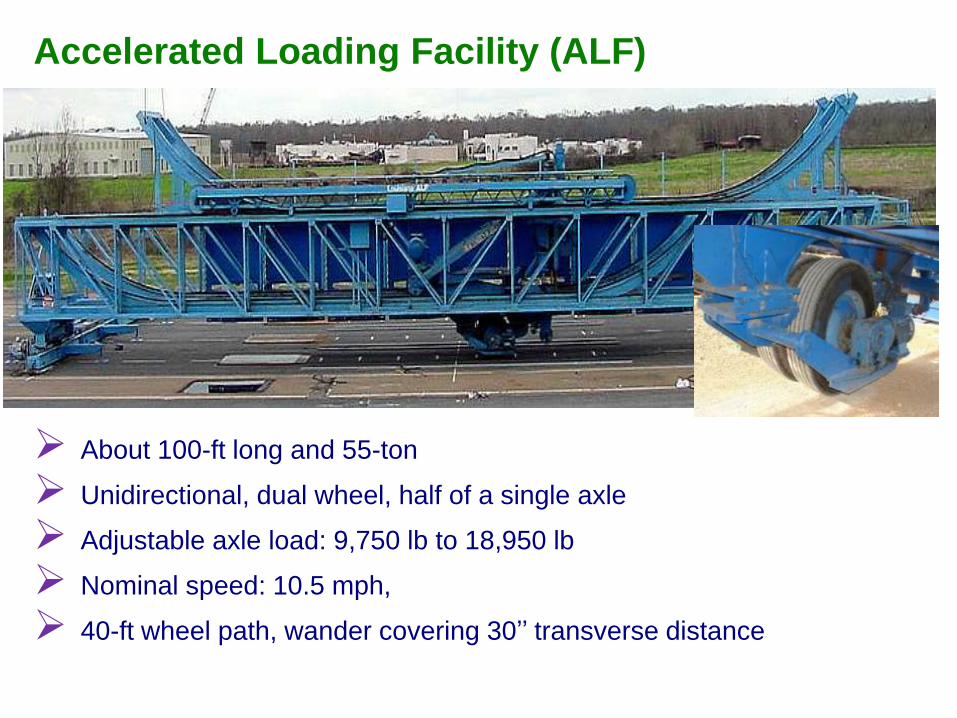
Accelerated Loading Facility (ALF)
About 100-ft long and 55-ton
Unidirectional, dual wheel, half of a single axle
Adjustable axle load: 9,750 lb to 18,950 lb
Nominal speed: 10.5 mph,
40-ft wheel path, wander covering 30’’ transverse distance

Testing and Data Collection & Processing
Pre-rut on base & APT on AC
At select intervals: transverse rut
profile, instrumentation data (static &
dynamic)
Data processing: eliminating outliers,
data smoothing, identifying peaks
and valleys
Laser Profilometer
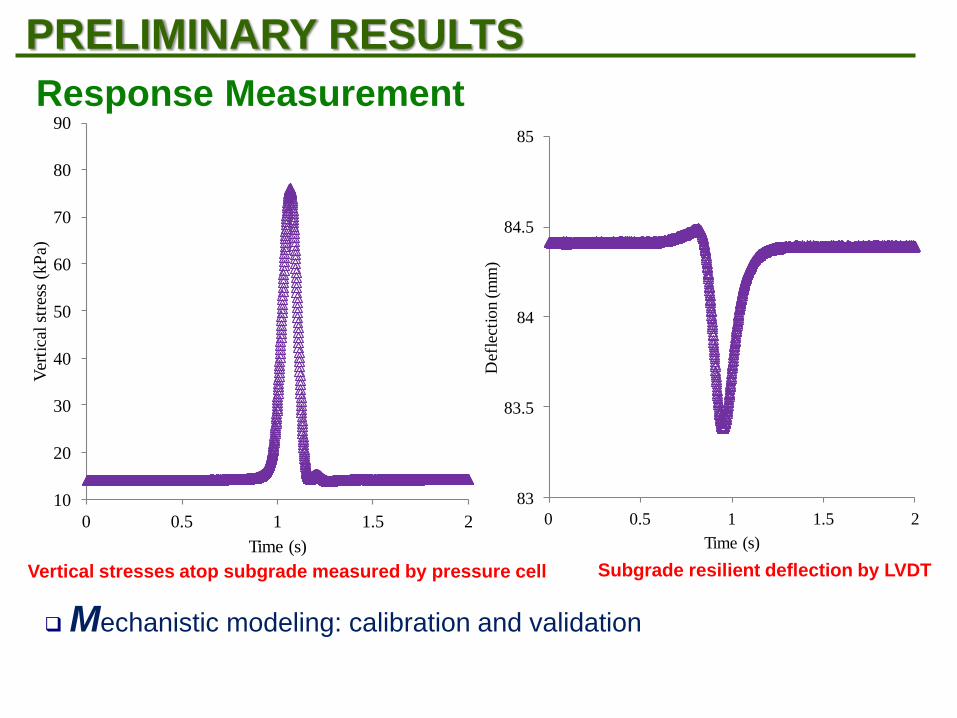
PRELIMINARY RESULTS
Mechanistic modeling: calibration and validation
Subgrade resilient deflection by LVDT
83
83.5
84
84.5
85
0 0.5 1 1.5 2
Def
lect
ion (m
m)
Time (s)
10
20
30
40
50
60
70
80
90
0 0.5 1 1.5 2
Ver
tica
l st
ress
(kP
a)
Time (s)
Vertical stresses atop subgrade measured by pressure cell
Response Measurement

Increase of dynamic vertical stress at the top of subgrade
Indication of decrease of base modulus – corresponds to LWD & Geogauge
As opposed to current MEPDG using constant modulus, possible to update
pavement layer properties along with traffic loading
Vertical stresses atop subgrade measured by pressure cell (section 6)
Response Measurement (cont’d)
0.00
10.00
20.00
30.00
40.00
50.00
60.00
70.00
80.00
0 500 1000 1500 2000 2500
Ver
tica
l st
ress
on
top
of
sub
gra
de
(kP
a)
Applications of axle load

Empirical performance prediction model: permanent deformation
model for unbound pavement layers
Accumulated surface rutting Surface rut profile at different stages of trafficking
Performance Measurement
18
23
28
33
38
43
48
53
100 120 140 160 180 200
Rel
ativ
e el
evat
ion
(m
m)
Transverse distance (cm)
0205015041960080810081208
0
5
10
15
20
0 500 1000 1500 2000 2500
Acc
um
ula
ted p
erm
anen
t def
orm
atio
n (
mm
)Applications of axle load
avg._east wheel
avg._west wheel

After 1000 passes
Majority of rutting attributed to base
Accumulated subgrade permanent deformation
Performance Measurement (cont’d)
0.00
0.20
0.40
0.60
0.80
1.00
1.20
1.40
1.60
1.80
2.00
0 500 1000 1500 2000 2500
Acc
um
ula
ted
su
bgra
de
per
man
ent
def
orm
atio
n (
mm
)
Applications of axle load

SUMMARY AND FUTURE WORK
Six test sections: geogrids and geotextiles, various structures
Pavement instrumentation
Interpretation and use of instrumentation data
Future work: continue APT testing, integrate instrumentation data in
design & analysis, incorporate effects of geosynthetic
reinforcements into MEPDG
Thank You!