Georgia Department of Public Health Healthcare … Department of Public Health Healthcare-Associated...
32
Georgia Department of Public Health Healthcare-Associated Infections Report January 1, 2014 – December 31, 2014 March 2016
Transcript of Georgia Department of Public Health Healthcare … Department of Public Health Healthcare-Associated...

Georgia Department of Public Health Healthcare-Associated Infections Report
January 1, 2014 – December 31, 2014
March 2016

i
Contents
List of Tables ............................................................................................................................................................... ii
List of Figures .............................................................................................................................................................. ii
Executive Summary ......................................................................................................................................................
Introduction ................................................................................................................................................................1
Methods .....................................................................................................................................................................3
Results ........................................................................................................................................................................7
Central Line-Associated Bloodstream Infections ................................................................................................ 10
Catheter-Associated Urinary Tract Infections ..................................................................................................... 14
Surgical Site Infections following Colon Surgery ................................................................................................. 17
Surgical Site Infections following Abdominal Hysterectomy............................................................................... 19
Laboratory-Identified Methicillin-Resistant Staphylococcus aureus ................................................................... 21
Laboratory-Identified Clostridium difficile........................................................................................................... 22
Discussion ................................................................................................................................................................ 23
Acknowledgements ................................................................................................................................................. 24
Appendix I: Acronyms .................................................................................................................................................. i
Appendix II: Additional Information on HAI Identification......................................................................................... ii
Appendix III: Methods Details .................................................................................................................................. iii
What do the numbers mean? ............................................................................................................................... iii
Where do the numbers come from? ..................................................................................................................... iii
Laboratory-Identified Infection Analyses .............................................................................................................. iv
Risk Adjustment ..................................................................................................................................................... iv
Statistical Significance ............................................................................................................................................ v
Quality Assurance and Data Validation .................................................................................................................. v

ii
List of Tables
Table 1: Number and Type of Facilities Reporting HAI Data—Georgia, 2014 ............................................................2
Table 2: 2013 HHS HAI National Reduction Goals ......................................................................................................4
Table 3: Medical Affiliation and Bed Size of Facilities with a 2014 NHSN Annual Survey—Georgia, 2014 ...............7
Table 4: Number and Type of Facility Locations Required to Report HAI Data—Georgia, 2014 ...............................8
Table 5: Overall Infection and SIR Data for Hospitals—Georgia, 2014 ......................................................................9
Table 6: Overall Infection and SIR Data for Long-Term Acute Care Hospitals—Georgia, 2014 .................................9
Table 7: Selected Characteristics of Facilities and Facility Locations Reporting CLABSI—Georgia, 2014 ............... 10
Table 8: Frequency of Resistant Bacterial Phenotypes Identified from CLABSI—Georgia, 2014 (N=64) ................ 13
Table 9: Selected Characteristics of Facilities Reporting CAUTI—Georgia, 2014 .................................................... 14
Table 10: Frequency of Resistant Bacterial Phenotypes Identified from CAUTI—Georgia, 2014 (N=82) ............... 16
Table 11: Selected Characteristics of Hospitals Reporting COLO SSI—Georgia, 2014 (N=96) ................................ 17
Table 12: Frequency of Resistant Bacterial Phenotypes Identified from COLO SSI—Georgia, 2014 (N=26) .......... 18
Table 13: Selected Characteristics of Hospitals Reporting HYST SSI—Georgia, 2014 (N=96) ................................. 19
Table 14: Selected Characteristics of Facilities Reporting LabID MRSA Infections —Georgia, 2014 (N=106) ........ 21
Table 15: Selected Characteristics of Facilities Reporting LabID C. difficile Infections—Georgia, 2014 (N=107) ... 22
List of Figures
Figure 1: Quarterly CLABSI SIR in Hospital AP ICU—Georgia, 2013-2014 ............................................................... 11
Figure 2: Quarterly CLABSI SIR in Hospital NICU—Georgia, 2013-2014 .................................................................. 12
Figure 3: Quarterly CLABSI SIR in Long-Term Acute Care Hospitals—Georgia, 2013-2014 .................................... 12
Figure 4: Frequency of Identified CLABSI Pathogens—Georgia, 2014 .................................................................... 13
Figure 5: Quarterly CAUTI SIR in Hospitals—Georgia, 2013-2014........................................................................... 15
Figure 6: Quarterly CAUTI SIR in Long-Term Acute Care Hospitals—Georgia, 2014 ............................................... 15
Figure 7: Frequency of Identified CAUTI Pathogens—Georgia, 2014 ..................................................................... 16
Figure 8: Quarterly COLO SSI SIR—Georgia, 2013-2014 ......................................................................................... 17
Figure 9: Frequency of Identified COLO SSI Pathogens—Georgia, 2014 ................................................................. 18
Figure 10: Quarterly HYST SSI SIR—Georgia, 2013-2014 ........................................................................................ 19
Figure 11: Frequency of Identified HYST Pathogens—Georgia, 2014 ..................................................................... 20
Figure 12: Quarterly MRSA SIR—Georgia, 2013-2014 ............................................................................................ 21
Figure 13: Quarterly C. difficile SIR—Georgia, 2013-2014 ...................................................................................... 22

Executive Summary
Healthcare-associated infections (HAI) are a serious public health threat, affecting 1 in 25 hospital inpatients1
and causing up to $45 billion annually in direct hospital costs2. In 2013, the HAI reportable to the Centers for
Medicaid and Medicare Services’ (CMS) Quality Reporting Program were made reportable to the Georgia
Department of Public Health (DPH) via the Centers for Disease Control and Prevention’s (CDC’s) National
Healthcare Safety Network (NHSN)—a secure, web-based HAI tracking system. This report provides aggregate
Georgia HAI data to establish 2013 baselines, to compare state performance to national and state goals, and to
measure progress between 2013 and 2014. This report provides data from 125 Georgia facilities on the
following HAI:
1. Central line-associated bloodstream infections (CLABSI)
2. Catheter-associated urinary tract infections (CAUTI)
3. Surgical site infections (SSI) following colon surgery (COLO)
4. Surgical site infections following abdominal hysterectomy (HYST)
5. Laboratory-identified (LabID) methicillin-resistant Staphylococcus aureus (MRSA) found in the bloodstream
6. Laboratory-identified Clostridium difficile (C. difficile) found in stool
Performance is assessed using the standardized infection ratio (SIR). This metric is calculated by dividing the
number of infections observed by the number of infections predicted. Lower SIR (< 1.0) indicate better
performance.
Key Findings:
Improved Areas
In adult and pediatric intensive care units (ICU) in Georgia, the CLABSI SIR decreased 21% between 2013 and
2014—a decrease of 94 infections. The Health and Human Services (HHS) reduction goal of 0.50 is well
within reach, requiring the prevention of 12 infections per year.
1 Magill SS, Edwards JR, Bamberg W, et al. Multistate Point-Prevalence Survey of Health Care–Associated Infections. N Engl J Med 2014;370:1198-208. Accessed January 14, 2016. 2 Scott RD II. The Direct Medical Costs of Healthcare-Associated Infections in U.S. Hospitals and the Benefits of Prevention. 2009. Retrieved from: http://www.cdc.gov/HAI/pdfs/hai/Scott_CostPaper.pdf. Accessed January 14, 2016.

Top Concerns—focused infection control interventions are needed
Georgia facilities reported 30% more CAUTI than predicted—an excess of 259 infections. To reach the HHS
reduction goal of 0.75, 476 infections per year must be prevented.
The C. difficile SIR increased 12% between 2013 and 2014—an increase of 240 infections. To reach the HHS
reduction goal of 0.70, 661 infections per year must be prevented.
Improvement Possible—focused infection control interventions may be needed
There were about as many CLABSI in long-term acute care hospitals as predicted, and 33 infections per year
must be prevented to reach the HHS reduction goal of 0.50. The SIR in long-term acute care hospitals is
higher than the SIR in other facility types, which may represent the need for improved infection control
efforts in these hospitals.
In Georgia, there was no significant change in SIR between 2013 and 2014 for CLABSI in neonatal ICU (NICU),
COLO SSI, HYST SSI, or MRSA. Infection control interventions may be needed to reduce these HAI.
o There were fewer CLABSI than predicted in NICU, but 19 infections per year must be prevented to
reach the HHS reduction goal of 0.50.
o There were fewer COLO SSI than predicted and as many HYST SSI as predicted. To reach the HHS
reduction goal of 0.75, 21 COLO SSI and 17 HYST SSI must be prevented per year.
o There were as many MRSA infections as predicted and 93 infections per year must be prevented to
reach the HHS reduction goal of 0.75.

1
Introduction
This report provides aggregate Georgia healthcare-associated infections (HAI) data to establish 2013 baselines,
to compare state performance to national and state goals, and to measure progress between 2013 and 2014.
Background
HAI are infections that develop during or soon after medical treatment for a separate medical condition. HAI can
result from patients’ own bacteria, be associated with surgery or invasive medical devices, or be due to
exposure to bacteria, viruses, fungi, or spores transmitted from contaminated healthcare workers' hands,
environmental surfaces, or medical equipment. Bacteria found in healthcare settings are often resistant to
commonly prescribed antibiotics, making HAI more difficult to treat.
A 2011 survey of 183 acute care hospitals across the US found that on any given day, 1 in 25 inpatients had at
least one HAI3. The direct cost of treating HAI ranges from $28.4 to $45 billion per year for US healthcare
facilities. Preventing 20% of HAI could save up to $6.8 billion, and preventing 70% of HAI could save up to $31.5
billion per year4.
In January 2013, the HAI reportable to the Centers for Medicaid and Medicare Services' (CMS) Quality Reporting
Program were added to the Georgia Department of Public Health (DPH) Notifiable Disease List. Facilities self-
report data to DPH using the Centers for Disease Control and Prevention’s (CDC’s) National Healthcare Safety
Network (NHSN), a secure, web-based HAI tracking system. Under Georgia law (O.C.G.A Sections 32-2-12 and
31-5-5), data submitted to DPH through NHSN remain confidential.
Four types of facilities in Georgia are included in this report: acute care hospitals, critical access hospitals,
children’s hospitals, and long-term acute care hospitals. Because long-term acute care hospitals have different
CMS reporting requirements and different baseline comparison periods, they will be analyzed separately from
the other facility types. Acute care, critical access, and children’s hospitals will be referred to collectively as
“hospitals.”
3 Magill SS, Edwards JR, Bamberg W, et al. Multistate Point-Prevalence Survey of Health Care–Associated Infections. N Engl J Med 2014;370:1198-208 4 Scott RD II. The Direct Medical Costs of Healthcare-Associated Infections in U.S. Hospitals and the Benefits of Prevention. 2009. Retrieved from: http://www.cdc.gov/HAI/pdfs/hai/Scott_CostPaper.pdf

2
The select HAI included in this report are:
1. Central line-associated bloodstream infections (CLABSI)
2. Catheter-associated urinary tract infections (CAUTI)
3. Surgical site infections (SSI) following colon surgeries (COLO)
4. Surgical site infections following abdominal hysterectomies (HYST)
5. Laboratory-identified (LabID) methicillin-resistant Staphylococcus aureus (MRSA) found in the bloodstream
6. Laboratory-identified Clostridium difficile (C. difficile) in stool
This report includes data from 15 long-term acute care hospitals and 110 hospitals in Georgia—including 103
acute care hospitals, 5 voluntarily reporting critical access hospitals, and 2 voluntarily reporting children’s
hospitals. These 125 facilities reported up to six HAI, depending on (1) CMS reporting requirements and (2)
applicability of the HAI measure (e.g., a facility that does not perform colon surgeries cannot report infections
following colon surgeries). Table 1 provides the number and type of reporting facilities.
Table 1: Number and Type of Facilities Reporting HAI Data—Georgia, 2014
HAI Type No. Acute Care Hospitals Reporting
No. Long-Term Acute Care Hospitals Reporting
No. Critical Access Hospitals Reporting
No. Children’s Hospitals Reporting
CLABSI 91 15 2 2
CAUTI 91 15 2 2
COLO 94 No Reporting Required 2 0
HYST 94 No Reporting Required 2 0
C. difficile 103 No Reporting Required 4 0
MRSA 103 No Reporting Required 3 0
A full list of acronyms used in this report can be found in Appendix I, and Appendix II lists references for NHSN
protocols.

3
Methods
Infection data analyzed in this report were downloaded from NHSN on December 16, 2015. Facilities that were
in operation during the full 2014 calendar year and met the CMS reporting requirements for at least one HAI
were included in the analysis.
Hospitals’ HAI data were compared to national baseline data using the standardized infection ratio (SIR) and to
the 2013 Health and Human Services (HHS) National Action Plan HAI reduction goals using the number of
infections needed to prevent (NNTP) metric. In long-term acute care hospitals, the SIR is used to compare HAI
data to 2013 NHSN data, as national baseline data is currently unavailable.
The SIR shows if the state has more, fewer, or about the same number of HAI compared to the number
predicted based on the applicable baseline data.
SIR = Number of Observed Infections
Number of Predicted Infections
The SIR is a summary measure that can be used to track HAI over time and can be calculated on a variety of
levels, including unit, facility, state, and nation. It adjusts for differences between healthcare facilities such as
types of patients and procedures, as well as other factors such as the facility’s size, and compares the number of
infections reported in a given time period to the number of infections that would be predicted using data from a
baseline time period, which varies for different infection types (see Appendix III). Lower SIR (< 1.0) indicate
better performance.
When the SIR is calculated, there are three possible results:
The SIR is less than 1.0—this indicates that there were fewer infections reported during the surveillance
period than would have been predicted given the baseline data.
The SIR is equal to 1.0—this indicates that the number of infections reported during the surveillance
period is the same as the number of infections predicted given the baseline data.
The SIR is greater than 1.0—this indicates that there were more infections reported during the
surveillance period than would have been predicted given the baseline data.
SIR and SIR confidence intervals by quarter for each HAI during 2013 and 2014 in Georgia are presented later in
the report.

4
The NNTP shows the number of infections that the state as a whole must prevent in one year to reach the 2013
HHS HAI national reduction goals (Table 2). The NNTP is also referred to as the cumulative attributable
difference (CAD) by CDC.
NNTP = Number of Observed Infections - (HHS Reduction Goal*Number of Predicted Infections)
The NNTP is part of the CDC’s Targeted Assessment for Prevention (TAP) strategy, which seeks to identify areas
in need of targeted HAI prevention activities and quality improvement. Lower NNTP indicate better
performance.
When the NNTP is calculated, there are three possible results:
The NNTP is less than 0—this indicates that the SIR was lower (better) than the HHS reduction goal and
shows how far from the goal the SIR was.
The NNTP is equal to 0—this indicates that the SIR was the same as the HHS reduction goal.
The NNTP is greater than 0—this indicates that the SIR was higher (worse) than the HHS reduction goal
and shows how far from the goal the SIR was.
Table 2: 2013 HHS HAI National Reduction Goals
2013 HAI Reduction Goal Applicable HAI Types
Reduce by 50%, SIR goal = 0.50 CLABSI
Reduce by 30%, SIR goal = 0.70 C. difficile
Reduce by 25%, SIR goal = 0.75 CAUTI, COLO, HYST, MRSA
When HAI are reported, up to three pathogens can be entered as causative agents of that HAI event. Duplicated
pathogens were deleted if they differed by susceptibility pattern or were also entered as the causative agent of
a secondary bloodstream infection.
The distribution of pathogens identified from HAI is discussed later in the report (see pages 13, 16, 18, 20).
Antimicrobial susceptibility data were available for select species and phenotypes:
1. Methicillin-resistant Staphylococcus aureus
2. Carbapenem-resistant Enterobacteriaceae
3. Carbapenem-resistant Escherichia coli
4. Carbapenem-resistant Enterobacter spp.
5. Carbapenem-resistant Klebsiella pneumonia and
K. oxytoca
6. Carbapenem-non-susceptible Pseudomonas
aeruginosa
7. Carbapenem-non-susceptible Acinetobacter spp.
8. Multidrug-resistant P. aeruginosa
9. Multidrug-resistant Acinetobacter spp.
10. Vancomycin-resistant Enterococcus faecalis
11. Vancomycin-resistant Enterococcus faecium

7
Where the same pathogen species was entered twice with different susceptibility patterns, the phenotypes
were carbapenem-non-susceptible (carbNS) and multidrug-resistant (MDR). Given that MDR includes carbNS
and is the more inclusive phenotype, the MDR was retained and the other deleted (e.g., MDR and carbNS P.
aeruginosa are listed for the same event so the carbNS P. aeruginosa is deleted).
When CAUTI and SSI are reported, one of the pathogens entered as a causative agent can be entered again as
the causative agent of a secondary bloodstream infection. In these instances, the duplicated pathogen was
deleted (e.g., E.coli was listed twice for a COLO SSI where a secondary BSI occurred so the second instance of E.
coli was deleted).
Results
Facility Characteristics
Of the 125 Georgia facilities, 124 completed the 2014 NHSN Annual Hospital Survey or the 2014 NHSN Annual
Facility Survey for Long-Term Acute Care Hospitals. The surveys provided medical affiliation and bed size, which
are two factors that may impact the number of infections reported by a facility. These factors are included in the
SIR risk adjustment performed by the CDC for CLABSI, CAUTI, and LabID infections (see Appendix III).
The majority of facilities (99, 80%) have no affiliation with a medical school. About a quarter of facilities (33,
27%) report having fewer than 50 beds; 53 (43%) report having between 50 to 199 beds; and 38 (31%) report
having at least 200 beds (Table 3).
Table 3: Medical Affiliation and Bed Size of Facilities with a 2014 NHSN Annual Survey—Georgia, 2014
Medical School Affiliation
≤ 25 Beds
26 to 49 Beds
50 to 199 Beds
200 to 499 Beds
≥ 500 Beds
Total
No Affiliation 10 21 49 15 4 99
Graduate 0 1 2 2 5 10
Major Teaching 0 0 1 3 5 9
Undergraduate 1 0 1 4 0 6
Total 11 22 53 24 14 124
Type of patient care location is another risk factor that can affect number of CLABSI and CAUTI reported by
facilities, due to the differences in patient acuity. In 2014, only intensive care units (ICU) and long-term acute
care locations were required to report CLABSI and CAUTI. Medical/surgical critical care locations reported most
often (89, 40%), followed by medical critical care locations (21, 9.3%), and level II/III neonatal critical care
locations (21, 9.3%) (Table 4).

8
Table 4: Number and Type of Facility Locations Required to Report HAI Data—Georgia, 2014
Reporting Locations N %
Medical/Surgical Critical Care 89 39.6
Medical Critical Care 21 9.3
Neonatal Critical Care (Level II/III) 21 9.3
LTAC Ward 20 8.9
Medical Cardiac Critical Care 16 7.1
Surgical Cardiothoracic Critical Care 15 6.7
Neonatal Critical Care (Level III) 13 5.8
Neurosurgical Critical Care 7 3.1
Pediatric Medical/Surgical Critical Care 5 2.2
Surgical Critical Care 5 2.2
Neurologic Critical Care 4 1.8
Trauma Critical Care 4 1.8
Burn Critical Care 2 0.9
LTAC ICU 2 0.9
Pediatric Cardiothoracic Critical Care 1 0.4
Total 225 100
Overall State Performance
In 2014, Georgia hospitals reported 4,708 HAI. There were 94 fewer ICU CLABSI with a statistically significant
21% decrease in SIR between 2013 and 2014. There were 11 fewer CLABSI in neonatal ICU (NICU), 89 fewer
CAUTI, 27 fewer COLO SSI, 14 fewer HYST SSI, and 9 fewer MRSA infections, none of which resulted in
statistically significant change in SIR between 2013 and 2014. An additional 240 C. difficile infections were
reported, with a statistically significant 12% increase in SIR between 2013 and 2014.
Georgia hospitals have not reached the HHS reduction goal for any HAI, but progress has been made. Hospitals
are close to reaching the HHS reduction goals for CLABSI and SSI. To reach the CLABSI goal of 0.50, a total of 12
ICU CLABSI and 19 NICU CLABSI in all Georgia facilities must be prevented per year. To reach the SSI goal of 0.75,
21 COLO SSI and 17 HYST SSI must be prevented per year. Reaching the HHS reduction goal of 0.75 for LabID
infections and CAUTI will be more challenging, requiring a reduction of 93 MRSA infections, 661 C. difficile
infections, and 383 CAUTI per year in Georgia hospitals (Table 5).

9
Table 5: Overall Infection and SIR Data for Hospitals—Georgia, 2014
ICU
CLABSI
NICU
CLABSI CAUTI COLO HYST MRSA C. difficile
2013 State Data
State SIR 2013 0.66* 0.70* 1.37* 0.89 1.00 1.05 0.82*
Observed Infections 2013 396 90 989 261 113 333 2,530
Predicted Infections 2013 602 129 720 292 113 317 3,082
Facility Count 2013 96 31 96 98 97 108 108
Denominator Counts Device Days Procedures Patient Days
303,212 51,709 366,402 8,917 11,692 4,579,602 4,167,557
2014 State Data
State SIR 2014 0.52* 0.66* 1.30* 0.82* 0.90 1.05 0.92*
Observed Infections 2014 302 79 900 234 99 324 2,770
Predicted Infections 2014 580 120 690 284 110 309 3,013
Facility Count 2014 95 31 95 96 96 106 107
Denominator Counts Device Days Procedures Patient Days
293,233 48,673 351,057 8,715 11,425 4,594,458 4,180,790
2013—2014 State Comparison
Infection Count Difference -94 -11 -89 -27 -14 -9 240
SIR Difference -21%* -6% -5% -8% -10% 0% 12%*
HHS—2014 SIR Comparison
HHS Reduction Goal 0.50 0.50 1.06 0.92 0.86 0.92 0.90
NNTP to Reach HHS Goal 12 19 383 21 17 93 661
*Denotes statistical significance at p = 0.05
In 2014, long-term acute care hospitals reported 303 infections. There were about as many CLABSI as predicted
and 28% more CAUTI than predicted. Reaching the HHS reduction goal in long-term acute care hospitals will
require the prevention of 33 CLABSI and 93 CAUTI per year (Table 6).
Table 6: Overall Infection and SIR Data for Long-Term Acute Care Hospitals—Georgia, 2014
CLABSI CAUTI
State SIR 0.85 1.28*
Observed Infections 80 223
Predicted Infections 94 174
Facility Count 15 15
Device Days 102,707 86,095
HHS—2014 SIR Comparison
HHS Reduction Goal 0.50 0.75
NNTP to Reach HHS Goal 33 93
*Denotes statistical significance at p = 0.05
10
Central Line-Associated Bloodstream Infections
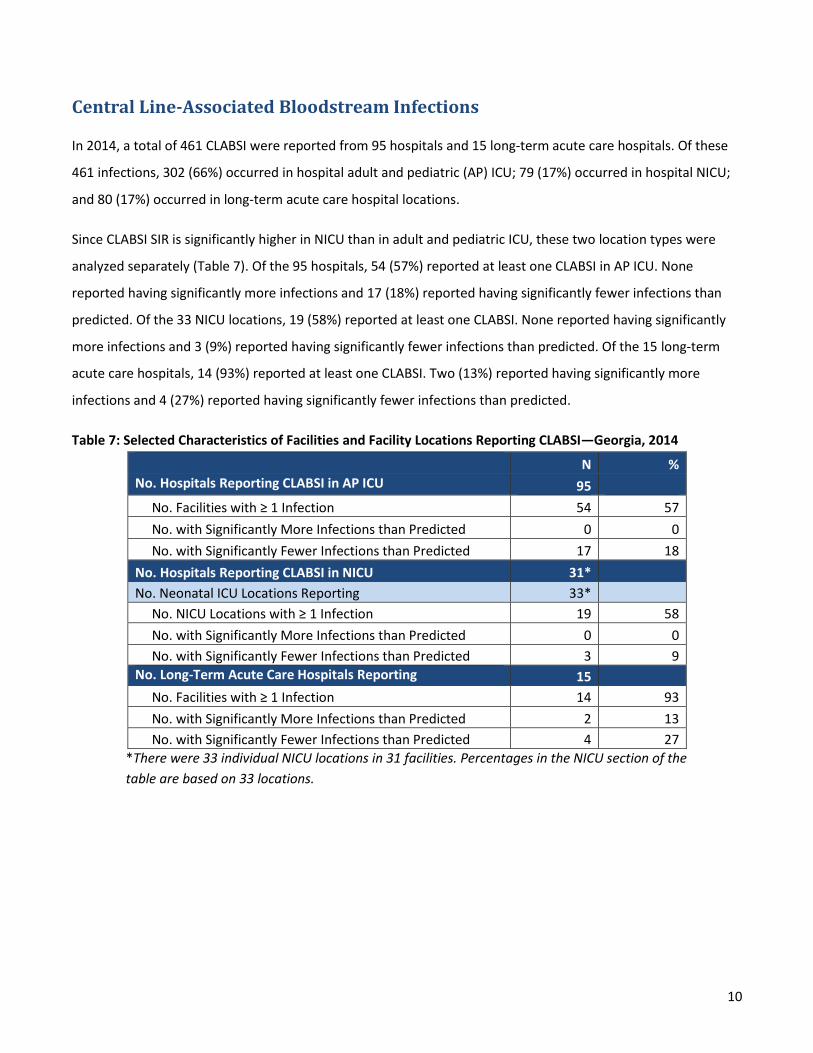
In 2014, a total of 461 CLABSI were reported from 95 hospitals and 15 long-term acute care hospitals. Of these
461 infections, 302 (66%) occurred in hospital adult and pediatric (AP) ICU; 79 (17%) occurred in hospital NICU;
and 80 (17%) occurred in long-term acute care hospital locations.
Since CLABSI SIR is significantly higher in NICU than in adult and pediatric ICU, these two location types were
analyzed separately (Table 7). Of the 95 hospitals, 54 (57%) reported at least one CLABSI in AP ICU. None
reported having significantly more infections and 17 (18%) reported having significantly fewer infections than
predicted. Of the 33 NICU locations, 19 (58%) reported at least one CLABSI. None reported having significantly
more infections and 3 (9%) reported having significantly fewer infections than predicted. Of the 15 long-term
acute care hospitals, 14 (93%) reported at least one CLABSI. Two (13%) reported having significantly more
infections and 4 (27%) reported having significantly fewer infections than predicted.
Table 7: Selected Characteristics of Facilities and Facility Locations Reporting CLABSI—Georgia, 2014
N %
No. Hospitals Reporting CLABSI in AP ICU 95
No. Facilities with ≥ 1 Infection 54 57
No. with Significantly More Infections than Predicted 0 0
No. with Significantly Fewer Infections than Predicted 17 18
No. Hospitals Reporting CLABSI in NICU 31*
No. Neonatal ICU Locations Reporting 33*
No. NICU Locations with ≥ 1 Infection 19 58
No. with Significantly More Infections than Predicted 0 0
No. with Significantly Fewer Infections than Predicted 3 9
No. Long-Term Acute Care Hospitals Reporting 15
No. Facilities with ≥ 1 Infection 14 93
No. with Significantly More Infections than Predicted 2 13
No. with Significantly Fewer Infections than Predicted 4 27
*There were 33 individual NICU locations in 31 facilities. Percentages in the NICU section of the
table are based on 33 locations.

11
Central Line-Associated Bloodstream Infections: SIR by Quarter
Between the first quarter of 2013 and the fourth quarter of 2014, the CLABSI SIR in Georgia hospital AP ICU
declined 24% from 0.67 to 0.51. The SIR remained significantly lower than the national baseline value. It was
significantly higher than the HHS reduction goal during 2013 and not significantly different during 2014 (Figure
1).
The CLABSI SIR in hospital NICU declined 7% from 0.70 to 0.65. The SIR fluctuated, being significantly lower than
the national baseline value as often as it was not significantly different from the national baseline value. The SIR
was significantly higher than the HHS reduction goal during the third quarter of 2013, but was otherwise not
significantly different (Figure 2).
Between the first and fourth quarters of 2014, the CLABSI SIR in long-term acute care hospitals increased 31%
from 0.70 to 0.92. The SIR was not significantly different from the 2013 NHSN baseline value. It was not
significantly different from the HHS reduction goal during the first two quarters and significantly higher than the
HHS reduction goal during the last two quarters (Figure 3).
Figure 1: Quarterly CLABSI SIR in Hospital AP ICU—Georgia, 2013-2014
0
0.2
0.4
0.6
0.8
1
1.2
2013Q1 2013Q2 2013Q3 2013Q4 2014Q1 2014Q2 2014Q3 2014Q4
SIR
Quarter
Central Line-Associated Bloodstream Infections (CLABSI)SIR by Quarter for Hospital Adult and Pediatric ICU
Georgia, 2013-2014
2006 to 2008 Baseline HHS Goal Georgia

12
Figure 2: Quarterly CLABSI SIR in Hospital NICU—Georgia, 2013-2014
Figure 3: Quarterly CLABSI SIR in Long-Term Acute Care Hospitals—Georgia, 2013-2014
0
0.2
0.4
0.6
0.8
1
1.2
1.4
2013Q1 2013Q2 2013Q3 2013Q4 2014Q1 2014Q2 2014Q3 2014Q4
SIR
Quarter
Central Line-Associated Bloodstream Infections (CLABSI)SIR by Quarter for Hospital Neonatal ICU
Georgia, 2013-2014
2006 to 2008 Baseline HHS Goal Georgia
0
0.2
0.4
0.6
0.8
1
1.2
1.4
1.6
2014Q1 2014Q2 2014Q3 2014Q4
SIR
Quarter
Central Line-Associated Bloodstream Infections (CLABSI)SIR by Quarter for Long-Term Acute Care Hospitals
Georgia, 2014
2013 Baseline HHS Goal Georgia

13
Central Line-Associated Bloodstream Infections: Pathogens Identified
Cultures were performed for 460 CLABSI and resulted in the identification of 497 pathogens. Of the 497
pathogens, 217 (43%) were Gram-positive bacteria, 171 (34%) were Gram-negative bacteria, and 109 (22%)
were non-bacterial pathogens. Of the 388 bacterial pathogens, 64 (17%) were antimicrobial-resistant (Figure 4).
Figure 4: Frequency of Identified CLABSI Pathogens—Georgia, 2014
Nearly half of the resistant bacteria identified (30, 47%) were methicillin-resistant. Vancomycin-resistant
bacteria accounted for 21 (33%) phenotypes. The remaining 13 (20%) phenotypes were multidrug-resistant,
carbapenem-resistant, or carbapenem-non-susceptible (Table 8).
Table 8: Frequency of Resistant Bacterial Phenotypes Identified from CLABSI—Georgia, 2014 (N=64)
Resistance Phenotype N %
Methicillin-Resistance in Staphylococcus aureus 30 47
Vancomycin-Resistance in Enterococcus faecalis/faecium 21 33
Multidrug-Resistance in Pseudomonas aeruginosa, Acinetobacter spp. 6 9
Carbapenem-Resistance in Enterobacter spp., Klebsiella pneumoniae/oxytoca 4 6
Carbapenem-non-Susceptibility in Pseudomonas aeruginosa 3 5
41 29 17 24 20 15 12
22 8
1
103
4815
30
21 98
101
0
20
40
60
80
100
120
140
Freq
uen
cy
Pathogen Genus
Pathogens Identified from Central Line-Associated Bloodstream Infections (CLABSI) by Genus and Gram Stain
Georgia, 2014 (N = 497)
Gram-negative Resistant Gram-postive Other
14
Catheter-Associated Urinary Tract Infections
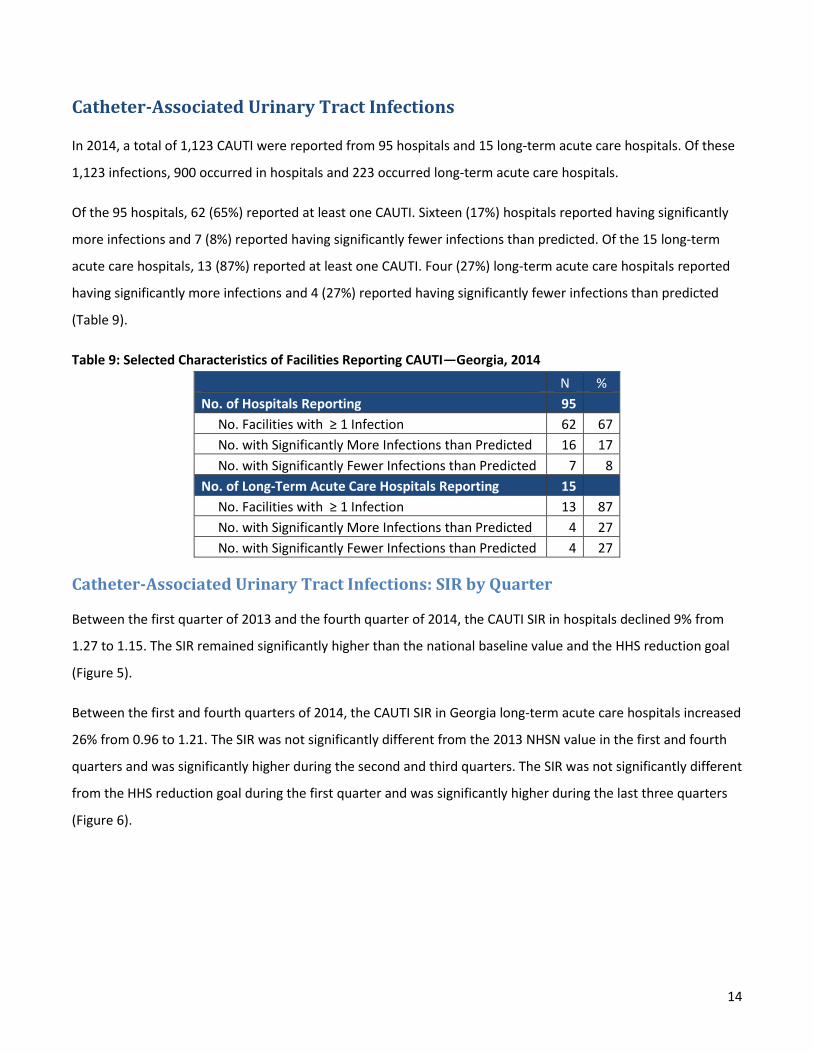
In 2014, a total of 1,123 CAUTI were reported from 95 hospitals and 15 long-term acute care hospitals. Of these
1,123 infections, 900 occurred in hospitals and 223 occurred long-term acute care hospitals.
Of the 95 hospitals, 62 (65%) reported at least one CAUTI. Sixteen (17%) hospitals reported having significantly
more infections and 7 (8%) reported having significantly fewer infections than predicted. Of the 15 long-term
acute care hospitals, 13 (87%) reported at least one CAUTI. Four (27%) long-term acute care hospitals reported
having significantly more infections and 4 (27%) reported having significantly fewer infections than predicted
(Table 9).
Table 9: Selected Characteristics of Facilities Reporting CAUTI—Georgia, 2014
N %
No. of Hospitals Reporting 95
No. Facilities with ≥ 1 Infection 62 67
No. with Significantly More Infections than Predicted 16 17
No. with Significantly Fewer Infections than Predicted 7 8
No. of Long-Term Acute Care Hospitals Reporting 15
No. Facilities with ≥ 1 Infection 13 87
No. with Significantly More Infections than Predicted 4 27
No. with Significantly Fewer Infections than Predicted 4 27
Catheter-Associated Urinary Tract Infections: SIR by Quarter
Between the first quarter of 2013 and the fourth quarter of 2014, the CAUTI SIR in hospitals declined 9% from
1.27 to 1.15. The SIR remained significantly higher than the national baseline value and the HHS reduction goal
(Figure 5).
Between the first and fourth quarters of 2014, the CAUTI SIR in Georgia long-term acute care hospitals increased
26% from 0.96 to 1.21. The SIR was not significantly different from the 2013 NHSN value in the first and fourth
quarters and was significantly higher during the second and third quarters. The SIR was not significantly different
from the HHS reduction goal during the first quarter and was significantly higher during the last three quarters
(Figure 6).

15
Figure 5: Quarterly CAUTI SIR in Hospitals—Georgia, 2013-2014
Figure 6: Quarterly CAUTI SIR in Long-Term Acute Care Hospitals—Georgia, 2014
0
0.2
0.4
0.6
0.8
1
1.2
1.4
1.6
1.8
2
2013Q1 2013Q2 2013Q3 2013Q4 2014Q1 2014Q2 2014Q3 2014Q4
SIR
Quarter
Catheter-Associated Urinary Tract Infections (CAUTI)SIR by Quarter for Hospital Adult and Pediatric ICU
Georgia, 2013-2014
2009 Baseline HHS Goal Georgia
0
0.5
1
1.5
2
2.5
2014Q1 2014Q2 2014Q3 2014Q4
SIR
Quarter
Catheter-Associated Urinary Tract Infections (CAUTI)SIR by Quarter for Long-Term Acute Care Hospitals
Georgia, 2014
2013 Baseline HHS Goal Georgia

16
Catheter-Associated Urinary Tract Infections: Pathogens Identified
Cultures were performed for 1,121 CAUTI and resulted in the identification of 1,216 pathogens. Of the 1,216
pathogens, 681 (56%) were Gram-negative bacteria, 346 (28%) were non-bacterial pathogens, and 189 (16%)
were Gram-positive bacteria. Of the 870 bacterial pathogens, 82 (9%) were antimicrobial-resistant (Figure 7).
Figure 7: Frequency of Identified CAUTI Pathogens—Georgia, 2014
About half of the resistant bacteria identified (43, 52%) were multidrug-resistant. Vancomycin-resistant bacteria
accounted for 21 (26%) phenotypes. The remaining 18 (22%) phenotypes were methicillin-resistant,
carbapenem-resistant, or carbapenem-non-susceptible (Table 10).
Table 10: Frequency of Resistant Bacterial Phenotypes Identified from CAUTI—Georgia, 2014 (N=82)
Resistance Phenotype N %
Multidrug-Resistance in Pseudomonas aeruginosa, Acinetobacter spp. 43 52
Vancomycin-Resistance in Enterococcus faecalis/faecium 21 26
Carbapenem-Resistance in Enterobacter spp., Klebsiella pneumoniae/oxytoca 8 10
Methicillin-Resistance in Staphylococcus aureus 5 6
Carbapenem-non-Susceptibility in Pseudomonas aeruginosa 5 6
278
100 11941 42 22 12 11
455
33 110
38 10 5
215
256
90
0
50
100
150
200
250
300
Freq
uen
cy
Pathogen Genus
Pathogens Identified from Catheter-Associated Urinary Tract Infections (CAUTI) by Genus and Gram Stain
Georgia, 2014 (N=1,216)
Gram-negative Resistant Gram-postive Other

17
Surgical Site Infections following Colon Surgery
In 2014, a total of 234 COLO SSI were reported from 96 Georgia hospitals. Of these, 54 (56%) hospitals reported
at least one COLO SSI. Two (2%) hospitals reported having significantly more infections and 5 (5%) reported
having significantly fewer infections than predicted (Table 11).
Table 11: Selected Characteristics of Hospitals Reporting COLO SSI—Georgia, 2014 (N=96)
No. Hospitals Reporting N %
No. with ≥1 Infection 54 56
No. with Significantly More Infections 2 2
No. with Significantly Fewer Infections 5 5
Surgical Site Infections following Colon Surgery: SIR by Quarter
Between the first quarter of 2013 and the fourth quarter of 2014, the COLO SSI SIR was nearly the same (0.81 vs.
0.82). For the majority of the quarters the SIR was not significantly different from the national baseline value or
the HHS reduction goal (Figure 8).
Figure 8: Quarterly COLO SSI SIR—Georgia, 2013-2014
0
0.2
0.4
0.6
0.8
1
1.2
1.4
2013Q1 2013Q2 2013Q3 2013Q4 2014Q1 2014Q2 2014Q3 2014Q4
SIR
Quarter
Surgical Site Infections (SSI) following Colon Surgery (COLO)SIR by Quarter for Hospitals
Georgia, 2013-2014
2009 Baseline HHS Goal Georgia

18
Surgical Site Infections following Colon Surgery: Pathogens Identified
Cultures were performed for 209 COLO SSI and resulted in the identification of 356 pathogens. Of the 356
pathogens, 197 (55%) were Gram-negative bacteria, 133 (37%) were Gram-positive bacteria, 26 (7%) were non-
bacterial pathogens. Of the 330 bacterial pathogens, 26 (8%) were antimicrobial-resistant (Figure 9).
Figure 9: Frequency of Identified COLO SSI Pathogens—Georgia, 2014
Nearly half of the resistant bacteria identified (12, 46%) were vancomycin-resistant. Methicillin-resistant
bacteria accounted for 10 (38%) phenotypes. The remaining 4 (16%) phenotypes were multidrug-resistant or
carbapenem-resistant (Table 12).
Table 12: Frequency of Resistant Bacterial Phenotypes Identified from COLO SSI—Georgia, 2014 (N=26)
Resistance Phenotype N %
Vancomycin-Resistance in Enterococcus faecalis/faecium 12 46
Methicillin-Resistance in Staphylococcus aureus 10 38
Carbapenem-Resistance in Enterobacter spp., Escherichia coli, Klebsiella pneumoniae/oxytoca 3 12
Multidrug-Resistance in Pseudomonas aeruginosa 1 4
79
33 26 2515 15
1
1
1 159
18 2311
12
1023 3
0
10
20
30
40
50
60
70
80
90
Freq
uen
cy
Pathogen Genus
Pathogens Identified from Surgical Site Infections (SSI) following Colon Surgery (COLO) by Genus and Gram Stain
Georgia, 2014 (N = 356)
Other
Gram-postive
Resistant
Gram-negative

19
Surgical Site Infections following Abdominal Hysterectomy
In 2014, a total of 99 HYST SSI were reported from 96 hospitals. Of these, 36 (38%) hospitals reported at least
one HYST SSI. Two (2%) hospitals reported having significantly more infections and 1 (1%) reported having
significantly fewer infections than predicted (Table 13).
Table 13: Selected Characteristics of Hospitals Reporting HYST SSI—Georgia, 2014 (N=96)
No. Hospitals Reporting N %
No. with ≥ 1 Infection 36 38
No. with Significantly More Infections 2 2
No. with Significantly Fewer Infections 1 1
Surgical Site Infection following Abdominal Hysterectomy: SIR by Quarter
Between the first quarter of 2013 and the fourth quarter of 2014, the HYST SSI SIR decreased 27% from 1.12 to
0.82. For the majority of quarters the SIR was not significantly different from the national baseline value or the
HHS reduction goal (Figure 10).
Figure 10: Quarterly HYST SSI SIR—Georgia, 2013-2014
0
0.2
0.4
0.6
0.8
1
1.2
1.4
1.6
1.8
2
2013Q1 2013Q2 2013Q3 2013Q4 2014Q1 2014Q2 2014Q3 2014Q4
SIR
Quarter
Surgical Site Infections (SSI) following Abdominal Hysterectomy (HYST) SIR by Quarter for Hospitals
Georgia, 2013-2014
2009 Baseline HHS Goal Georgia

20
Surgical Site Infections following Abdominal Hysterectomy: Pathogens Identified
Cultures were performed for 68 HYST SSI and resulted in the identification of 94 pathogens. Of the 94
pathogens, 49 (45%) were Gram-positive bacteria, 41 (44%) were Gram-negative bacteria, and 4 (4%) were non-
bacterial pathogens. Of the 90 bacterial pathogens, 4 (4%) were antimicrobial-resistant. All 4 were methicillin-
resistant Staphylococcus aureus (Figure 11).
Figure 11: Frequency of Identified HYST Pathogens—Georgia, 2014
25
1619
1511
4
40
5
10
15
20
25
30
Freq
uen
cy
Pathogen Genus
Pathogens Identified from Surgical Site Infections (SSI) following Abdominal Hysterectomy (HYST) by Genus and Gram Stain
Georgia, 2014 (N = 94)
Other
Resistant
Gram-postive
Gram-negative

21
Laboratory-Identified Methicillin-Resistant Staphylococcus aureus
In 2014, a total of 324 MRSA infections were reported from 106 hospitals. Of these, 49 (46%) hospitals reported
at least one LabID MRSA infection. Six (6%) hospitals reported having significantly more infections and 3 (3%)
reported having significantly fewer infections than predicted (Table 14).
Table 14: Selected Characteristics of Facilities Reporting LabID MRSA Infections —Georgia, 2014 (N=106)
No. Hospitals Reporting N %
No. with ≥ 1 Infection 49 46
No. with Significantly More Infections 6 6
No. with Significantly Fewer Infections 3 3
Laboratory-Identified Methicillin-Resistant Staphylococcus aureus: SIR by Quarter
Between the first quarter of 2013 and the fourth quarter of 2014, the MRSA SIR decreased 9% from 1.26 to 1.15.
The SIR was significantly higher than the NHSN baseline value in the first quarter of 2013 but was otherwise not
significantly different. The SIR was significantly higher than the HHS reduction goal except for the second and
third quarters of 2013 and the third quarter of 2014, where it was not significantly different (Figure 12).
Figure 12: Quarterly MRSA SIR—Georgia, 2013-2014
0
0.2
0.4
0.6
0.8
1
1.2
1.4
1.6
2013Q1 2013Q2 2013Q3 2013Q4 2014Q1 2014Q2 2014Q3 2014Q4
SIR
Quarter
Laboratory-Identified (LabID) Methicillin-Resistant Staphylococcus aureus (MRSA) SIR by Quarter for Hospitals
Georgia, 2013-2014
2010 to 2011 Baseline HHS Goal Georgia

22
Laboratory-Identified Clostridium difficile
In 2014, a total of 2,770 C. difficile infections were reported from 107 hospitals. Of these, 87 (81%) hospitals
reported at least one LabID C. difficile infection. Seven (7%) hospitals reported having significantly more
infections and 21 (20%) reported having significantly fewer infections than predicted (Table 15).
Table 15: Selected Characteristics of Facilities Reporting LabID C. difficile Infections—Georgia, 2014 (N=107)
No. Hospitals Reporting N %
No. with ≥ 1 Infection 87 81
No. with Significantly More Infections 7 7
No. with Significantly Fewer Infections 21 20
Laboratory-Identified Clostridium difficile: SIR by Quarter
Between the first quarter of 2013 and the fourth quarter of 2014, the C. difficile SIR increased 13% from 0.82 to
0.93. The SIR was significantly lower than the national baseline value, except for the first quarter of 2014 where
it was not significantly different. For all the quarters, the C. difficile SIR remained significantly higher than the
HHS reduction goal (Figure 13).
Figure 13: Quarterly C. difficile SIR—Georgia, 2013-2014
0
0.2
0.4
0.6
0.8
1
1.2
2013Q1 2013Q2 2013Q3 2013Q4 2014Q1 2014Q2 2014Q3 2014Q4
SIR
Quarter
Laboratory-Identified (LabID) Clostridium difficile SIR by Quarter for Hospitals
Georgia, 2013-2014
2010 to 2011 Baseline HHS Goal Georgia

23
Discussion
This report establishes Georgia baseline HAI data for long-term acute care hospitals and examines trends in HAI
data between 2013 and 2014 in Georgia hospitals.
There was a statistically significant 21% decrease in hospital ICU CLABSI between 2013 and 2014 in Georgia,
putting the HHS reduction goal well within reach. There was no change in CLABSI in NICU; the SIR in these
locations remains higher than the HHS reduction goal. In long-term acute care hospitals, there were about as
many CLABSI as predicted. The CLABSI SIR is higher in long-term acute care hospitals than in other types of
facilities and may represent the need for improved prevention efforts.
For all facility types, the number of observed CAUTI was significantly higher than predicted. To reach the
predicted number of CAUTI, long-term acute care hospitals would need to prevent 49 infections per year and
hospitals would need to prevent 210 infections per year. To reach the HHS reduction goal, long-term acute care
hospitals would need to prevent 93 infections per year, and hospitals would need to prevent 383 infections per
year. The high number of CAUTI in Georgia is a cause for concern and should be made the focus of improved
prevention efforts in Georgia.
Also of concern is the statistically significant 12% increase in the C. difficile SIR between 2013 and 2014. While
this may be the result of improved testing and surveillance, increases can also indicate wider C. difficile spread
and changes in antibiotic usage in hospitalized patients. C. difficile should also be made the focus of improved
prevention efforts.
For COLO, HYST, and MRSA, there was no significant change in SIR between 2013 and 2014. Few (>6%) hospitals
saw significantly more HAI than predicted. These hospitals may need targeted interventions to lower their
number of HAI.
Future Directions
Antimicrobial-resistance is a serious public health concern, causing infections that are difficult and costly to
treat. In 2014, the highest proportion of antibiotic-resistant bacteria was found in CLABSI with 16% of identified
bacteria being resistant. Nine percent of CAUTI bacteria, 8% of COLO bacteria, and 4% of HYST bacteria were
resistant. Further analysis of the role of hospital stewardship programs, monitoring of pathogen susceptibility
patterns, and exploration of trends over time is planned.

24
In January 2015, CMS reporting requirements were changed to require CLABSI and CAUTI reporting from
hospital medical, surgical, and medical/surgical wards and MRSA and C. difficile reporting from long-term acute
care hospitals. Changes in HAI definitions were also implemented in 2015, including the removal of yeast from
the definition of CAUTI. Examination of how these changes will affect Georgia’s SIR is planned.
Limitations
There may be variation between results published by the DPH and results published elsewhere (e.g., CMS
Hospital Compare). Hospitals have the ability to update their data in NHSN at any time once entered, and as
such, results may appear to vary if other sources use different data collection periods or report cutoff dates than
Georgia’s reports.
This report presents data from only a subset of possible HAI that can occur in hospitals. Likewise, the report
does not present all susceptibility data collected from cultured pathogens. Conclusions cannot be drawn about
HAI or pathogen susceptibility outside what is presented in this report.
Acknowledgements
The HAI Program would like to thank the Infection Prevention, Quality, and Information Technology Staff at
Georgia hospitals for collaborating to provide the data presented in this report.
i
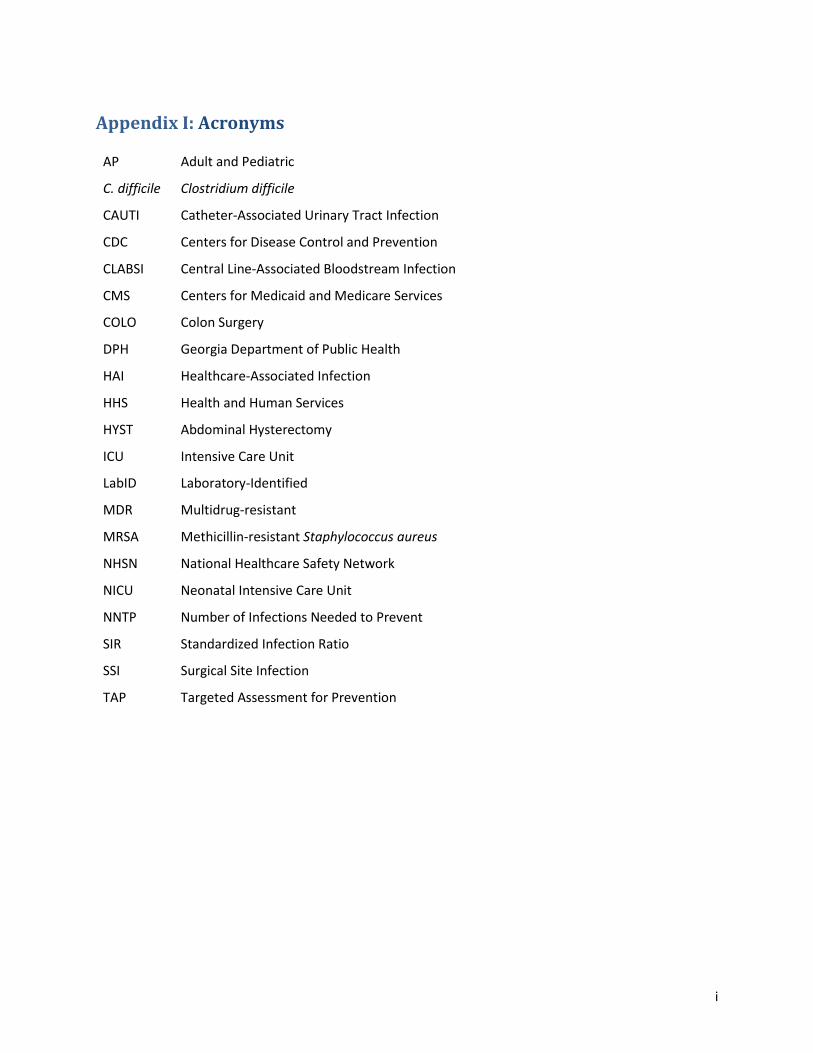
Appendix I: Acronyms
AP Adult and Pediatric
C. difficile Clostridium difficile
CAUTI Catheter-Associated Urinary Tract Infection
CDC Centers for Disease Control and Prevention
CLABSI Central Line-Associated Bloodstream Infection
CMS Centers for Medicaid and Medicare Services
COLO Colon Surgery
DPH Georgia Department of Public Health
HAI Healthcare-Associated Infection
HHS Health and Human Services
HYST Abdominal Hysterectomy
ICU Intensive Care Unit
LabID Laboratory-Identified
MDR Multidrug-resistant
MRSA Methicillin-resistant Staphylococcus aureus
NHSN National Healthcare Safety Network
NICU Neonatal Intensive Care Unit
NNTP Number of Infections Needed to Prevent
SIR Standardized Infection Ratio
SSI Surgical Site Infection
TAP Targeted Assessment for Prevention

ii
Appendix II: Additional Information on HAI Identification
Identifying Healthcare-associated Infections (HAI) for NHSN Surveillance:
http://www.cdc.gov/nhsn/PDFs/pscManual/2PSC_IdentifyingHAIs_NHSNcurrent.pdf
Urinary Tract Infection (Catheter-Associated Urinary Tract Infection [CAUTI] and Non-Catheter-
Associated Urinary Tract Infection [UTI]) and Other Urinary System Infection [USI]) Events:
http://www.cdc.gov/nhsn/PDFs/pscManual/7pscCAUTIcurrent.pdf
Bloodstream Infection Event (Central Line-Associated Bloodstream Infection and Non-central
line-associated Bloodstream Infection):
http://www.cdc.gov/nhsn/PDFs/pscManual/4PSC_CLABScurrent.pdf
Surgical Site Infection (SSI) Event:
http://www.cdc.gov/nhsn/PDFs/pscManual/9pscSSIcurrent.pdf?agree=yes&next=Accept
Multidrug-Resistant Organism & Clostridium difficile Infection (MDRO/CDI) Module:
http://www.cdc.gov/nhsn/PDFs/pscManual/12pscMDRO_CDADcurrent.pdf

iii
Appendix III: Methods Details From the CSTE/CDC HAI Data Analysis and Presentation Standardization Workgroup’s Healthcare
Associated Infection Data Analysis and Presentation Standardization Toolkit except where noted “*”
What do the numbers mean?
It’s important to understand that numbers alone won’t show how well a hospital is doing in preventing
HAI. This report shows how hospitals performed during a single year (2014), and compares each
hospital’s performance to the national baseline. It does not track the hospital’s performance over time.
SIR are calculated using a numerator (number of infections) and a denominator (population at risk).
Larger hospitals that see more patients or perform more surgeries may have more infections compared
to smaller hospitals. Therefore, it is important not only to consider the SIR interpretation for each
hospital, but to also look at the total number of procedures performed and the total number of
infections observed (or identified) in that time period.
Where do the numbers come from?
Hospitals self-report their HAI data to the CDC and DPH using the free, web-based software system
NHSN. CDC provides training to hospital staff on the appropriate use of this system and provides
guidance on how to track infections in a standard way.
Although efforts were made through education and training to improve the standardization and
understanding of NHSN surveillance guidelines, definitions, and criteria, there can be variability in
interpretation and application, leading to differences in reporting practices among hospitals.
Furthermore, hospitals with more resources and/or a robust HAI surveillance program may be able to
identify and report more infections compared to a hospital with fewer resources.
In this report, the number of predicted infections is an estimate based on infections reported to NHSN
by participating facilities nationwide during the following baseline time periods:
2006 to 2008: CLABSI and SSI
2009: CAUTI
2010 to 2011: MRSA bacteremia and C. difficile LabID infections
Once CDC updates the national baselines, Georgia will be able to publish SIR that compare infections to
a more recent time period.
These reports cover data that were collected during calendar year 2014 and were downloaded from
NHSN on December 16, 2015; any changes made to the data after this data are not reflected in this
report.
More information about NHSN can be found here: http://www.cdc.gov/NHSN.

iv
Information on how to generate a facility-level TAP report can be found here:
http://www.cdc.gov/nhsn/pdfs/ps-analysis-resources/tapreports_facilities.pdf
Laboratory-Identified Infection Analyses
Clostridium difficile and methicillin-resistant Staphylococcus aureus LabID infections rely on laboratory
data. Patients do not have to meet clinical criteria for their infections to be reported to NHSN, which
allows for a much less labor-intensive means to track C. difficile and MRSA infections. LabID infections
that occurred more than 3 calendar days after admission are included in the numerator of the SIR.
DPH would like to highlight certain caveats in using and interpreting LabID infection data. For example,
experience in other states has shown that CDI rates tend to be higher when using LabID infection data
compared to a clinical case definition. Reasons for this may include differences in how individual
facilities define and classify clinical disease, when specimens are obtained, and variations in hospital
laboratory testing methods and practices. LabID infections should be considered a ‘proxy’ measure to
estimate the number of CDI and MRSA infections actually occurring.
Despite these caveats, there are benefits to using LabID data. LabID infections do not depend on clinical
interpretation by providers and thus offer a more standardized and consistent method of collecting and
reporting CDI and MRSA surveillance data. Moreover, LabID infections are currently being used by CMS
for quality reporting programs. Improving prevention practices as described in existing clinical guidelines
should result in a decrease in the number of observed CDI and MRSA LabID infections as well as a
decrease in the number of clinical infections.
Risk Adjustment
The SIR are adjusted for risk factors that may impact the number of infections reported by a hospital,
such as type of patient care location, bed size of the hospital, patient age, and other factors. The SIR is
adjusted differently depending on the type of infection measured.
The SIR for CLABSI and CAUTI are adjusted for:
Type of patient care location
Hospital affiliation with a medical school
Bed size of the patient care location
The SIR for hospital-onset C. difficile and MRSA bloodstream infections are adjusted for:
Facility bed size
Hospital affiliation with a medical school
The number of patients admitted to the hospital who already have C. difficile or an MRSA
bloodstream infection (“community-onset” cases)
For hospital-onset C. difficile, the SIR also adjusts for the type of test the hospital laboratory uses
to identify C. difficile from patient specimens

v
*The SSI SIR are presented using the CMS risk adjustment model. The SSI reported are deep
incisional primary and organ/space infections detected during the operative hospitalization, on
readmission to the hospital where the surgery was performed or on admission to another
hospital, or through post-discharge surveillance. The CMS model adjusts for:
Patient age
Patient assessment at time of anesthesiology
However, while NHSN collects information on many important factors that may put a patient at risk for
an HAI, the system is not able to obtain every detail about every person. Each patient and healthcare
location has a different set of risks that may not be fully accounted for in the calculation of the SIR.
The data presented have a limited risk-adjustment that may not take into account patient or facility
difference that could contribute to the incidence of HAI.
Statistical Significance
The p-value and 95% confidence interval are statistical measures that describe the likelihood that what
was observed was due to random chance.
These measures tell us whether or not a facility’s SIR is significantly different from 1 (the value we would
expect if the facility performed exactly the same as what was predicted based on national data). If the p-
value was less than 0.05, we can conclude that the number of observed infections is significantly
different that the number of predicted infections (i.e., the facility’s SIR is significantly different from 1). If
the p-value is greater than 0.05, we can conclude that the number of observed infections in a facility is
not significantly different than the number predicted (i.e., the facility’s SIR is no different than 1).
DPH uses the p-value to evaluate the significance of the SIR and provide an interpretation.
Quality Assurance and Data Validation
The data are not validated by DPH. Although efforts were made by hospitals and the DPH to ensure that
the data were accurate and complete, a formal validation of the data has not yet been performed.