Georgia Case Study - Food and Agriculture Organization · Georgia case study was carried out to the...
55
Georgia Case Study Prepared for FAO as part of the State of the World’s Forests 2016 (SOFO) Written by Paata Torchinava 2015
Transcript of Georgia Case Study - Food and Agriculture Organization · Georgia case study was carried out to the...

Georgia Case Study
Prepared for FAO as part of the
State of the World’s Forests 2016 (SOFO)
Written by Paata Torchinava
2015

2
The designations employed and the presentation of material in this information product do not imply the expression of any opinion whatsoever on the part of the Food and Agriculture Organization of the United Nations (FAO) concerning the legal or development status of any country, territory, city or area or of its authorities, or concerning the delimitation of its frontiers or boundaries.
© FAO, 2016
FAO encourages the use, reproduction and dissemination of material in this information product. Except where otherwise indicated, material may be copied, downloaded and printed for private study, research and teaching purposes, or for use in non-commercial products or services, provided that appropriate acknowledgement of FAO as the source and copyright holder is given and that FAO’s endorsement of users’ views, products or services is not implied in any way.
All requests for translation and adaptation rights, and for resale and other commercial use rights should be addressed to [email protected].

3
Table of Contents
Abbreviations
Introduction
1. Country trend observation: forest condition, agriculture and food security
1.1. Forest condition
1.2. Agriculture and food security status
2. In-depth country assessment
2.1. Economic development
2.1.1. The structure of economy and income
2.1.2. Change/trends of GDP in the last 25 years
2.1.3. Major contributing sectors to GDP
2.1.4. Public investments
2.1.5. Share of agriculture value added in total Gross Domestic Product (% of GDP)
2.1.6. Share of forestry sector value added in total Gross Domestic Product (% of GDP)
2.1.7. The remittance inflow trend in the last 25 years (% of GDP)
2.2 Demography
2.2.1. General demographic information
2.2.2. Trends of migration in rural and urban population
2.3. Agricultural tenure, investment, production, productivity and trade
2.3.1. Tenure
2.3.2. Investment
2.3.3. Land productivity
2.3.4. Trade
2.4. Forest tenure, productivity and trends
2.4.1. Forest tenure
2.4.1.1. Types of forest tenure
2.4.2. Investment in Forestry Sector
2.4.3. Major changes in structure of forest institutions since 1990
2.4.4. Employees work for the forest administration
2.4.5. Forestry production and management
2.4.6. Import and export of forest products

4
2.5. Other factors
2.5.1. Natural disasters
B. Policies and institutions
2.6. Policy and legal aspects
2.6.1. Main policy documents
2.6.1.1. Forest policy
2.6.1.2. Agricultural policy
2.6.2. Main legal documents regulating forestry and agriculture
2.6.2.1. Forestry
2.6.2.2. Agriculture
2.7. Institutional frameworks for land use change governance
2.7.1. Land use planning documents
2.7.2. Stakeholder involvement in planning process
3. Summary and analysis of positive trends
3.1. Forestry sector
3.2. Agriculture
ANNEXES
Figure 1: Chain-linked volume indices of Gross Domestic Products
Figure 2. Gross National Income
Figure 3. Foreign Direct Investments in Georgia by Economic Sectors
Figure 4. Main trends of Agriculture sector in 1990-2014
Figure 5. Share of forestry sector in GDP (%)
Figure 6. Money transfers and share in GDP
Figure 7. Resident population of Georgia
Figure 8. Balance of the international migration of population
Figure 9. Land cover of Georgia
Figure 10. Output of agriculture
Figure 11. Import dynamics of major import products
Figure 12. Export dynamics of major export products
Figure 13. Dynamic of foreign trade
Figure 14. Cereal import dependency ratio
5
Figure 15. Share of food in merchandise imports and export
Figure 16: Structure of the SFD
Figure 17: Structure of NFA
Figure 18. Number of employees in Forestry Agency
Figure 19. Illegal logging
Figure 20. Volume of harvested timber
Figure 21. Export of wood and wood products
Figure 22. Import of wood and wood products
Figure 23. Mobilized amounts in Forestry Sector
Bibliography

6
Abbreviations
AF – Adaptation Fund
UNDP – United Nations Development Project
CENN – Caucasus Environmental NGO Network
WWF - World Wide Fund for Nature
IUCN - International Union for Conservation of Nature
ADA - Austrian Development Agency
BMZ - Federal Ministry for Economic Cooperation and Development of Germany
GIZ - Deutsche Gesellschaft für Internationale Zusammenarbeit
OSCE - Organization for Security and Co-Operation in Europe
ENVSEC - Environment and Security Initiative
EU - European Union
(ÖBF) AG - Österreichische Bundesforste Consulting
BFW - Federal Research and Training Centre for Forests, Natural Hazards and Landscape
FSDC - Forest Sector Development Center
WB - World Bank
FAO - Food and Agricultural Organization of the United Nations
KfW - the German Credit Bank of Reconstruction
MENR - Ministry of Environment and Natural Resources Protection of Georgia
FDA - the French Development Agency
DCFTA - Deep and Comprehensive Free Trade Area
LEPL – Legal Entity Public Low
IDP - Internally Displaced Person
MoA – Ministry of Agriculture of Georgia
NFA – National Forestry Agency
FD – Forestry Department
GeoStat – National Statistics Office of Georgia

7
Introduction The State of the World’s Forests (SOFO) 2016 “Forests and Agriculture – Land Use Challenges and Opportunities” examines the competing demands for land for forests and agriculture; and the relationship between forest cover changes and food security. In particular, forests and food security highlight the possibility to meet food security objectives while maintaining or increasing existing forests. FAO has identified about ten countries that have either significantly reduced their deforestation rate or have maintained/increased their forest cover and, at the same time, have increased food security since 1990. Georgia case study was carried out to analyze the key factors that have contributed to these positive trends.
1. Country trend observation: forest condition, agriculture and food security The goal of this document is to put together and to analyze information and materials which have played significant role in improving forest condition and food safety during last 25 years. In the limits of this short-term task it is impossible to carry out full detailed analysis. Nevertheless, the opportunity to use results of earlier researches has greatly helped correct formulation of basic problems for further discussion. 1.1. Forest condition Economic crisis of 90-ies of the XX century has caused intensive (often illegal) use of forest and, as a result, degradation of significant part of forest fund of Georgia. The balance between afforestation/reforestation and use of its resources has been disturbed. It should be mentioned that during last 15 years there had been no full inventory of forests done. This is important, because data on forest areas are based on results of forest inventory. Country,s forested area is 2822.5ha1. 97% of the forests are located in mountains; more than 80% of them are distributed on steep slopes (21 degrees and more). Approximately 600 thousand ha belong to virgin forests; according to existing inventory data funding of Georgian forests amounts to 454 million cubic meters, annual increament – 4.0 million cubic meters. Average wood fund per hectare is 161 cubic meter, forest area per person – 0.55 ha, wood fund per person – 80 cubic meters. The main part of the forest areas (almost 50%) is represented by beech species, also large areas are covered by oak, fir, hornbeam, spruce, pine, alder and other forest species (trees and shrubs). The Georgian forests are also rich in other forest resources, in particular, products of forest trees and non-timber (among them herbs, mushrooms etc.) products. In years 1990-2014 afforestation and reforestation activities were carried out on 806.7 ha of the territory of Georgian forests. It should also be mentioned that until recent period forest use in Georgia was based on the principle of short-term permits. This was causing excessive cutting of timber resources. The result has been dramatic decrease in density of forest stands and long-term exclusion of large forest areas from further timber
1 National Forestry Agency, National Statistics Office, FRA 2015

8
resource use. According to the forest inventory data, entire volume of forest areas damaged and degraded due to the improper use exceeds 200 thousand hectares2. Chart 1. Map of forest areas
Source: WWF Caucasus 1.2. Agriculture and food security status Georgia is traditional agrarian country and agriculture is considered one of leading branches of Georgian economy. Natural conditions of the country (fertile soils and climate) are very good for farming as well as fund raising. Traditional crops are grapes, wheat, corn, various fruits, citruses and tea. Traditional fund raising branches are sheep and cattle breeding; apiculture is also developed. Almost half of the population lives in the countryside, where main source of living are entirely or partly self-sufficient farms of low productivity. During the last two decades agriculture has been developing very slowly due to lack of the sector policy. The government had neglected it, which is not the same as the policy of non-interference. This approach was accompanied by steady decrease of agricultural production and crop areas. In terms of food security general approach and situation were similar. Fragmented plots, ill-conditioned infrastructure, out of date technologies, as well as other problems in agrarian sector accounted for insufficient level of food security. Georgia is very vulnerable from the point of view of food security. Combined with many social or economic factors the agriculture of the country fails to provide the population with monetary income. It should be mentioned that Georgia is not threatened by mass
2 National Forestry Agency

9
hunger only because all categories of food are produced here. Increase of food security level is possible through economic development, including step-by-step increase of agriculture productivity. The approach of the state to agriculture and food security has radically changed since 2013, when the Government declared assistance to agriculture development as one of main priorities3. The goal of the Government is to create an environment, based on principles of sustainable development, which will assist stable growth of high quality agricultural production, more competitive products, better food safety and food security, overcoming poverty in villages. 2. In-depth country assessment 2.1. Economic development 2.1.1. The structure of economy and income Regions of Georgia greatly differ from each other from the point of view of their share in gross domestic product (GDP). The same difference exists between urban and agrarian settlements. Half of the GDP of the country is produced in Tbilisi4. Besides much larger share of the GDP is produced by regions where large towns are situated (Kutaisi in Imereti, Rustavi in Kvemo Kartli, Batumi in Adjara, Poti and Zugdidi in Samegrelo), not by agrarian regions, despite their closeness to the towns and major highways. The regions also vary by structure of economy. Mainly, those are three main sectors: primary sector of the economy – agriculture, hunting5, forestry and fishing; secondary sector – industry, domestic goods production and construction and third-rate sector – trade, transport and communication, public administration, education, health protection, social security etc. 2.1.2. Change/trends of GDP in the last 25 years In 1990-1993 GDP was decreasing in average by 28% a year. It dropped from 4433 US dollars to 1437 US dollars per person6. It should also be mentioned that by the year 1995 industry had dropped by 78% compared to 1990. In fact, from all post-soviet countries, Georgia was the last – at 1995 to start peaceful building of the state and transformation of economy. After 1995 Georgian economy had started overcoming the crisis with the help of institutional reforms. In that period maximum growth of economy was achieved in 1997, when GDP growth rate was 10.7%. Afterwards the growth rate dropped dramatically. Russian economic crisis of 1998 significantly decreased economic development. In 1996 GDP in Georgia amounted to 3,868.5 million GEL (3,064.6 million US dollars), in 1999 – 5,668.7 million GEL (2,814.1 million US dollars), in 2003 – 8,564.1 million GEL
3 Annual report of the Ministry of Agriculture of Georgia, 2014 4 Program of Regional Development of Georgia for years 2015-2017 5 To my opinion, including hunting into statistical data of the agriculture database is incorrect, because according to the Law on Protection of Animal World of Georgia hunting is allowed only for sport and entertainment, while prohibited for trade. Fees from it can be considered negligible – opinion of the author of the report. 6 www. data.worldbank.org

10
(3,990.8 million US dollars)7. Gross national income in 2003 was 4 022, 1 million US dollars, or 926, 2 US dollars per person8. Besides macroeconomic and institutional reforms, effort of the government was directed towards radically cutting corruption and state interference in economy in order to improve investment environment. As a result growth of the average annual GDP indicator in 2004-2007 was 9.3%. The highest growth was clocked in 2007 and amounted to 12.3%. During the following period, in particular at the end of 2008 and in 2009 dramatic drop of economic indicators of the country could be noted, mainly caused by the 2008 Georgia-Russia war and the worldwide economic crisis. In 2008 the GDP indicator was 19 074,9 million GEL, which was 2.3 % more than similar indicator of last year, while in 2009 it was 17 986, or 3.6% less than previous year9. According to UNDP report of 2013 Georgia is 72nd (index 0.745) in the Human Development Index among 187 countries, which proves significant political and economic modernization of the country. According to adjusted data, 2012 GDP index in current prices amounted to 26 167.3 million GEL, which is 7.5% more than the last year similar indicator. In 2013 GDP was 26 824.0 million GEL (2.5%more compared to the previous year). Last year (2014) GDP indicator amounted to 29 187 million GEL (8.7% more than the last year). At this period gross national income amounted to 16 376.8 million US dollars, which was 3647 US dollars per person. 2.1.3. Major contributing sectors to GDP If we look at structural characteristic features of GDP growth in Georgia (2003 = 100), it will be possible to single out several main large groups. “Financial activities” and “Indirect assessment of financial mediator service” chain indexes are characterized by high growth rate – accordingly 490.1% and 362.6%. This points to fast growth of financial sector. Construction sector has also developed and the index is 192.2%. This is mainly connected to growth of loans given by bank sector to this one, in other words, directly related to the growth of the above mentioned financial sectors. In service sector dramatic growth of the “hotels and restaurants” branch should be mentioned – 216.7%, which is caused by special accent made by the government on construction and tourist infrastructure, also by growth of prices in this sector. The growth of “communications” – 276.1% - is result of direct use of this services. Growth in processing industries is traditionally for Georgia related to growth in ferrous and non-ferrous metals and chemical industries. This tendency was especially obvious before 2008 and was brought about by growing worldwide demand for metal production and by growth of prices. As to education, health and social security branches, their growth was mainly caused by increase of state expenses in these directions. In agriculture the tendency of alarming decrease was demonstrated and growth chain index here compared with 2003 is only 93.7%.
7 www.geostat.ge 8 www.geostat.ge 9 www.geostat.ge

11
2.1.4. Public investments Structure of investments by economy sectors demonstrates that the largest share of investment constantly goes to transport and communication – one fifth in average, while average share of investments to agriculture is 1-2%. Share of investment to energy sector was high in 2007-2008 and had dramatically dropped afterwards, in 2009-2010. According to 2013 data it has grown again and reached 244, 745, 1 thousand US dollars. Volume of investment is high is processing industries. In hotels and restaurants sector high indicators of investment are noted in various years. Although they decreased in 2009-2010, in 2014 they grew again and amounted to 124, 851, 8 thousands US dollars. In the real estate sector share of investment has especially grown since 2008 and reached its maximum in 2011 (224, 776, 3 thousand US dollars). Investment index in construction is unstable: being 105, 218, 8 thousand dollars in 2009, it dropped significantly in 2010 (4, 705, 9 thousand US dollars) then reached its maximum in 2014 and amounted to 316, 588, 1 thousand US dollars . Chart 2. Direct foreign investment in Georgia (thousand US dollars)
Source: GeoStat
725,
110,
098
2,75
6,53
8,35
0
2,01
4,84
1,55
5
1,56
3,96
2,42
5
658,
400,
593
814,
496,
572
1,11
7,24
4,14
9
911,
564,
257
941,
902,
625
1,75
8,42
2,92
7

12
2.1.5. Share of agriculture value added in total Gross Domestic Product (% of GDP) Despite the existence of favorable natural and climate conditions for development of agriculture sector in Georgia, during the recent decades the rate of development here stayed very much behind other sectors of economy. The situation after declaration of independence has made the areas taken by annual and perennial crops decrease several times. Due to small productivity agriculture was developing very slowly. Real production was decreasing. If in 2003-2012 real GDP growth was in average 6.4%, GDP in agriculture decreased by 0.5%. Practically each year brought decrease compared to the previous one. This sector was facing lots of structural difficulties. Average annual harvest varied and had a tendency to decrease. Its share in the GDP gradually decreased and in 2010 it was 8.4%, while the same indicator in 1996 amounted to 34.1%. According to 2014 data share of agriculture in gross domestic product is 9.2%. Chart 3. Added value in agriculture (mln. GEL according to current prices)10
Source: GeoStat 2.1.6. Share of forestry sector value added in total Gross Domestic Product (% of GDP) It should be mentioned that according to the existing statistical system11 forestry together with fisheries is included in general data on agriculture. All this of course makes it more difficult to determine share of forestry in the economy of the country. In the period of central planning share of forestry in GDP amounted to 4-5%12. In 90-ies, its priority directions were: forest extraction – 14%; timber processing– 69%; timber and paper industry – 17% (URS Corporation 2002). According to the State Department of Statistics, in 2002 share of forestry sector in gross domestic product was much smaller – 1.3%. Since 2005 despite general economy growth the share of forestry had not
10 Quick drop in data on crop areas is supposed to be caused by change of methodology by the Department of Statistics in 2005-2006. 11 Agriculture consists from primary producing, forestry and fisheries 12 12Forest Policy and InstitutionalChange Analysis in Central Asian and Caucasus Countries, Regional Project. FAO-FOEP/FAOSEC. Merab Machavariani. Tbilisi, 2009
0.0
5.0
10.0
15.0
20.0
25.0
30.0
35.0
40.0
1996 1997 1998 1999 2000 2001 2002 2003 2004 2005 2006 2007 2008 2009 2010 2011 2012 2013 2014

13
grown13 and in 2012 it amounted to only 0.32%, while in developed countries this indicator is 10 times higher and amounts to 3-4%. At the same time during the last 5 years the indicator for production has also dropped from 86.0 million GEL to 85.6 million GEL14. It should also be mentioned that these data do not include cost of non-timber forestry products. According to existing legislation15 population has right to gather non-timber forest products and secondary timber products for private use. Often they gather non-timber products (e.g. mushrooms, berries etc.) for commercial purposes, but this is not registered. As a result this income is not described in official GDP statistics and does not enter the exchequer. 2.1.7. The remittance inflow trend in the last 25 years (% of GDP) Significant role in Georgian economy is played by money orders from abroad, sent by Georgians working in foreign countries to their families and relatives here. Only part of these orders is sent through banks. Entire volume of such orders has been constantly growing and only decreased slightly during the global economic crisis, though had not stopped. Chart 4. Remittance inflow to Georgia (thousand US dollars)16
Source: GeoStat Chart 5. Remittance inflow to Georgia, % of GDP 13 Source: National Forestry Agency 14 RWA International, Plan for Rationalization and Institutional Development of Forestry Sector (1998-2001), the Government of Georgia, 2003. 15 Forest Code of Georgia, 1999 16 www.geostat.ge; final exact estimations for 2015 will be published on November 16, 2015
1,00
2.10
841.
8
1,05
2.20
1,26
8.10
1,33
4.20
1,47
7.00
1,44
0.80
249.
4
2008 2009 2010 2011 2012 2013 2014 2015

14
Source: GeoStat 2.2 Demography 2.2.1. General demographic information17 After Georgia has got independence in 1991, the indicator for population growth has dramatically changed due to acute political conflicts and economic crisis. In 1990-ies population reduced in whole Georgia, but most of all in mountainous regions and mono-industrial towns. After the gain of independence as a result of political tension and armed conflicts, quite large number of refugees and internally displaced persons emerged in Georgia. According to the data of the Ministry of Internally Displaced Persons from the Occupied Territories, Accommodation and Refugees of Georgia18, by April 8 2014 there were registered 253 574 IDPs – 85 177 families. Today demographic problem is one of the most acute in Georgia. Catastrophic drop of birth rate and growth of mortality rate has disturbed reproduction balance of the population and migration process has been added to it. In 1999-2008 negative balance of migration varied from -36.1 thousand persons to -10.2 thousands. High level of outflow of population was clocked as early as in 90-ies of XX century and has amounted to -790.2 thousand persons. In the period of 1990-2009 the population was reduced by 1.03 million. These were economically difficult years and the reduction happened mainly due to emigration. Russia-Georgia war of 2008 created new wave of emigration. Although by 2009 the negative balance of migration changed to positive (34.2 thousand persons), but in general rate of population flow is still negative (-0.23%).
17 http://data.worldbank.org/indicator/SP.POP.TOTL http://geostat.ge/index.php?action=page&p_id=472&lang=geo 18 Ministry of Internally Displaced Persons from the Occupied Territories, Accommodation and Refugees of Georgia
7.8 7.
8
9 8.8 8.
4 9.2
8.7
7.6
2008 2009 2010 2011 2012 2013 2014 2015

15
The reasons for migration are mainly of economic character. Insufficient jobs in the country, industrial environment not favorable enough, and unemployment make people to look for source of living outside of the country. The money sent by them is an important source of household incomes in Georgia. 2.2.2. Trends of migration in rural and urban population The most demonstrative example of unequal distribution of population of Georgia is the fact that the significant part of it is concentrated in Tbilisi. More than one quarter of the population are officially dwellers of Tbilisi and if we count also its circumference (including Rustavi and Mtskheta towns) the proportion amounts to almost one half. Nevertheless, according to official statistics after declaration of independence share of the region in the entire population of the country is mainly unchanged. It is possible that these figures express more lack of data than real situation in the regions of Georgia. During the crisis of 90-ies there was no unemployment in rural areas and there were a lot of opportunities for keeping people employed. In those years rural areas dominated employment segments. But because of labor productivity being low in villages, most families having only small land plots (less than 1 hectare) and credits for enlargement of enterprise being unavailable, intensive migration processes started from the villages. Migration was most active among young people. The majority of Georgian villages are located near forest. Besides agricultural activities an important source of income for local population was from timber and non-timber forest resources, mainly procured illegally. During the recent years forestry reforms carried out in the country have partly reduced volume of illegal lumbering. This has also intensified migration process from rural areas. 2.3. Agricultural tenure, investment, production, productivity and trade
Currently responsibility for issues related to land resources in Georgia is divided between the Ministries for Environment, for Agriculture, for Economy and Sustainable Development and for Justice. The Ministry for Environment and Natural Resources Protection is responsible for planning and coordinating activities aimed to mitigation of desertification and land degradation process caused by climatic and anthropogenic factors on the territory of Georgia. The Ministry of Agriculture functions are policy identification and assistance for implementation of activities with regard to sustainable land use, soil conservation, restoration/improvement of soil productivity. The Ministry of Economy and Sustainable Development carries out privatization of land owned by the state and approves right of ownership of the privatized state land. The task of the ministry also is to organize creation of zoning maps for ownership rights, development of towns and other settlements, and land tenure planning and carry out methodological management of the work. The main goal of the Ministry of Justice of Georgia National Agency for Public Registry is based on the need to develop real estate market in the country to create user oriented transparent, safe, unified and modern system of land registration.

16
The important role is also played by local administrations of self-governing units, which are responsible for initiation, preparation and approval of spatial and territorial development plans and general land tenure plan, also for agreement with respective offices of executive authorities. 2.3.1. Tenure19 Georgia is divided into 11 administrative regions and 22 climatic zones. The entire area of agricultural land is approximately 3 million hectares, which are distributed as follows: arable – 27%, perennial crops – 9%, fields and pastures – 64%. Results of privatization process carried out in 1990-ies (homestead lands, lands of collective and state farms) looks as following: authorized individual persons received unconditionally 0.76 million hectares agricultural land as property; 460 000 hectares remained in state ownership, from which 300 000 hectares were granted on lease. As a result approximately million hectares of land started being used by the new class of so called “farmers”. These plots were divided in a lot of small ones according to type of land. This caused intensive fragmentation of land. Besides 1.75 million hectares of grasslands remained on balance of local administrations and have been used by local population for mowing. The population also can use pastures, for which only small annual fee is required. The majority of the pastures are deteriorated and overgrazed. 75% of agricultural land is still state property, but it is allowed to sell them. The Government of Georgia sells land through public auction in the internet (www.privatization.ge , www.eauction.ge). 55% of arable lands have been already privatized. Entire land fund of Georgia is 7628.4 hectares, 39.6% of them are agricultural land, 26.5% - arable, 8.7% belongs to perennial crops, 4.8% to grasslands and 59.4% to pastures. The area of land in state ownership amounts to 87% of the whole land, one quarter of agricultural lands is private property, as well as 54.6% of arable land, 68.5% of perennial crops, 30% of grasslands and 4.7% of pastures20.
19 The second population census was conducted in 2014 and the agricultural census was a part of 2014 census. The first agricultural census in Georgia was conducted in 2004. The census covered all villages and towns (excluding occupied territories of Georgia); however 5 big cities were not included in the census. In 2014 together with the population census, agricultural census was conducted. This census covered all villages and cities (excluding the occupied territories of Georgia). The census methodology was prepared on the basis of FAO guidelines (A system of integrated agricultural censuses and surveys - World Programme for the Census of Agriculture 2010) and provides data on land use, crops, irrigation, fruits, vines, livefund, reservoirs for aquaculture, greenhouses, usage of agricultural products, and agricultural machinery and equipment. The census identifies agricultural holdings (any economic unit engaged in agricultural production (operating agricultural land, livefund, poultry or beehives) without regards to the scale of production, legal status of the unit and the tenure form of agricultural assets). In addition, Agricultural Census was conducted for legal entities (agricultural enterprises, etc.) in spring of 2015. Preliminary results of the agricultural census were published in April 2015 and the final results of the census (including agricultural census for enterprises) will be published in April 2016.
20 These data have been calculated as a result of agricultural inventory of 2004. After this the authorities have practically kept no land balance

17
Chart 6. Distribution of land cover of Georgia
Arable Perennial Grasslands and pastures Source: Agricultural census of Georgia, 2004 2.3.2. Investment During the last decades share of direct foreign investments in agriculture has been quite low compared to other branches of economy. In 2007-2012 share of agriculture in entire direct investments was 0.8%. Maximum investment in this sector was registered in 2009, when direct investment of more than 22.3 million of US dollars was made21. In 2007 the volume of investments amounted to 15.5 million US dollars. In 2008 it was in the limits of 7.8 millions, in 2010 – 8.6 million US dollars, in 2011 – 14.9 millions, in 2012 – 16.1 million, after this volume of investment reduced again and in 2013 only 11.8 million US dollars entered in agriculture sector, in 2014 – 12.2 million US dollars, while in 2015 during the first two months the investment was about 8.9 million US dollars. These statistical data demonstrate that in spite of agriculture being the priority sector in Georgia, investment to it became less active during the last years. This may be related to the decision concerning sale of land to foreign citizens22. According to data of second quarter of 2015, from the point of view of interest for foreign investors agriculture is on eighth place.
21 http://geostat.ge/ 22 During 2011-2012 in Georgia facts of land being sold to foreigners in most cases caused conflict. In number of villages it resulted in controversy between foreign investor and local population thus significantly hampering land cultivation. Protest rallies were started demanding to stop selling land to foreigners. As a result in the spring of 2012 the Parliament passed the law, according to which sale of land to foreigners, foreign legal entities or local ones, founded by foreign citizens, was prohibited. In 2014 the Constitutional Court of Georgia abolished the moratorium stated by the Parliament.
56.22%
11.93%
31.80%

18
2.3.3. Land productivity Dynamics of agricultural production in the country of 2002-2009 is changeable. Production in 2002 amounted to 2.02 milliard GEL and reached its maximum in 2005 – 2.33 milliard GEL. In subsequent years the dynamic dropped and in 2009 was close to similar indicator of 2002 – 2.07 milliard GEL. Since 2010 agricultural production in the country had grown and as a result during 2014 it amounted to 3.37 milliard GEL. As a result of processing the agricultural products the goods for 4.5 milliard GEL were produced. The entire production of agribusiness sector is by 10% more than in 2013. This is mainly caused by growth of processing sector. The indicator of the growth amounts to 13.8%. The indicator for primary production compared to the one of the previous year had grown by 5.2%. 2.3.4. Trade Together with involvement in international trade both export and import grow in Georgia. Nevertheless, the import growth tendency is much more outlined. The growth of import can be noticed since 2002, when, compared to the previous year it grew by 7 060.6 thousand US dollars and amounted to 164 055.1 thousands, while export was 104 562.8 thousand US dollars. In 2012 import of food products to Georgia exceeded 1.2 milliard US dollars, while export exceeded 500 million US dollars. Compared to previous years highest indicators for both export and import were clocked in 2014 and amounted to 1.3 milliard US dollars for import and 825 630.7 thousand US dollars for export. Chart 7. Export and import of food and agricultural products (thousand US dollars)
Source: GeoStat
-
500,000.0
1,000,000.0
1,500,000.0
2,000,000.0
2,500,000.0
2000
2001
2002
2003
2004
2005
2006
2007
2008
2009
2010
2011
2012
2013
2014
export
import

19
Dynamics of foreign trade of food and agriculture products is almost exact reflection of general picture of foreign trade of Georgia, here also for years can be observed constant negative balance of trade. Analysis of 2002-2014 dynamics of 10 main import and export groups of goods creates quite good picture for evaluation of existing situation and more or less accurately reflects international competitive position of Georgia. In the import we can see dependence on wheat, tobaccos, meat products and oils, also on cereal products. Producing most of the above mentioned products requires large land resources. There are also so called “commodities”, in producing which the opportunity of creating high value is quite small. Growth of dynamics for 10 major export products is optimistic, though it should be taken into consideration that the leading product, nuts, which is one of the most important in the export of last years, also is “commodity” type of product, success of which will strongly depend on dynamics of land and workforce costs in the nearest years. Chart 8.Food import dependency ratio
Source: GeoStat
266.7
450.2
205.1
321.9
162.3 155.3 135.7 164.3 155.8 157.9 167.2
249.1 270.3
2002 2003 2004 2005 2006 2007 2008 2009 2010 2011 2012 2013 2014
Food import dependency ratio - 2002-2014

20
Chart 9.Cereal import dependency ratio (%)
Source: FAOSTAT
Chart 10.Share of food in merchandise imports and exports
Source: http://data.worldbank.org/indicator/TM.VAL.FOOD.ZS.UN
0
10
20
30
40
50
60
70
80
1990 1995 2000 2005 2010 2015
Cereal import dependency ratio (%) (3-year average)
051015202530354045
05
10152025303540
1985 1990 1995 2000 2005 2010 2015 2020
Mer
chan
dise
exp
orts
(%)
Food imports (% of merchandise imports) Food exports (% of merchandise exports)

21
2.4. Forest tenure, productivity and trends
2.4.1. Forest tenure 2.4.1.1. Types of forest tenure Currently the forest fund of Georgia is state property23. Bodies, responsible for managing the state forest fund are: at the Ministry of Environment Protection and Natural Resources of Georgia – LEPL National Forestry Agency and LEPL Agency of Protected Areas. Forest fund located in Abkhazia and Adjara autonomous republics is managed by corresponding bodies of the republics. Green areas of trees and shrubs (former territory of the state forest fund) located in administrative borders of Tbilisi are managed by the Mayor’s Office of Tbilisi. Current Forest Code of Georgia defines “forest of local importance”, which, in the framework of authority granted by Georgian legislation and in accordance with requirements of the Code is managed by self-governing unit24. Some areas of the forest fund are managed by private entities or persons, according to long-term tenure permission granted to them. Small part of the forest fund is given for management to Patriarchy of Georgia. Chart 11. State authorities managing of Georgian forest fund - thousand hectares
Source: National Forestry Agency
23 Article 9.2, Georgian Forest Code (1999). 24 Currently there in no such practice and special legislation and resources are needed to fulfill this. Specification of forests of local importance according to ownership is planned.
1906.4
495.6
138
81.1
369 94.7
National Forestry Agency
Tskhinvali region (former Autonomous Dstrict of South Ossetia)
Autonomous Republic of Abkhazia
Uncontrolled territories
Mayor's Office of Tbilisi
Agency of Protected Areas
AdjaraForestry Agency

22
2.4.2. Investment in Forestry Sector Before 2004 the State Forestry Department, being an independent unit, received money for transaction costs from the Ministry of Finance. According to the Forest Code passed in 1999, short-term (up to 1 year, including seasonal) forest use licenses could be issued. Accordingly, persons, on entities using forest had no motivation to make investments in their territories. Since 2005, according to Regulations on Forest Use Licensing, the license is granted for term up to 20 years and legal entities have obligation to invest in forest care, protection and restoration on their territories. It has not been possible to identify entire volume of investment by owners of licenses for forest extraction on the territory of Georgian forest fund due to their confidentiality. Below are listed licenses issued within the lands controlled by the National Forestry Agency and size of their areas25:
• In 2006-2012 long-term forest extraction licenses were issued on 163.078 thousand hectares; • In 2002-2012 licenses on 116.048 thousand hectares were issued for organization of hunting
management. Chart 12. Transaction costs of the forestry department26
Source: GeoStat Since 2004 Forestry Agency has joined the Ministry of Environment Protection and Natural Resources as a structural unit. From this period financing of all state agencies has been increased including the Forestry Agency.
25 Source: National Forestry Agency 26 Specific costs of activities performed by the National Forestry Agency, such as forest tenure planning, forest restoration, creation of protection zones, protection from fire, protection from pests and diseases etc; also for keeping staff of the Natural Resources Agency.
2.081
2.813
1.659
0.940
1.545
1.119
Thousand GEL
1995
1998
1999
2000
2001
2002

23
Chart 13. Transaction costs of the National Forestry Agency
Source: GeoStat 2.4.3. Major changes in structure of forest institutions since 1990 In 1992-99 in the forestry sector still prevailed Soviet style of management, when administrative body performed forestry operations (logging, planting etc.) and received budget financing as well. According to the Forest Code of Georgia economic functions have been taken from the regional forestry units, i.e. forest extraction permission has been entirely delegated to private sector. According to the code, passing of forests from state to private ownership became allowed, with obligatory precondition of adopting special normative act. It also became possible to pass local forest fund to self-governance bodies: according to the Forest Code the state forest fund includes local forest fund, managed by local self-governance and governance bodies through corresponding offices. Nevertheless, no practical steps have been done to either privatization or decentralization. In 1999-2004 forestry operations were managed by the State Forestry Department, which accordingly issued all documents (forest extraction license, contract, ticket, export permission) related to forest use. Forest fund of protected areas was managed by the State Department of Protected Areas, Nature Reserves and Hunting Farms. The Ministry of Environment Protection and Natural Resources participated in realization of general policy and issued licenses for arrangement of hunting farms. The main form of forest use was still remained logging, carried out on the basis of permits (licenses or tickets) granted for periods up to one year. Since 2004 as a result of legislative changes27 the number of state agencies has significantly decreased. State departments have been eliminated. The Ministry of Environment and Natural Resources Protection was liquidated and the new Ministry for Environment Protection and Natural Resources was created instead. The State Forestry Department and State Department of Protected Areas, Nature Reserves and Hunting Farms went through reorganization and became part of the Ministry as the Forestry Department and Department of Protected Areas. In 2007 the Ministry of 27 In 2004 the structure of executive authorities has changed. The Government of Georgia was established as the Cabinet of Ministers headed by the Prime Minister.
3.2376.66
6.05
6.179
6.5748.512
10.524
8.007
Thousand GEL
2005
2006
2007
2008
2010
2011
2012
2013

24
Environment Protection and Natural Resources started - forestry reform, the idea of which was to free the state as much as possible from the obligation of forest management. To fulfill this goal institutional reform was started. The structure of the Forestry Department has been changed, central staff reduced, territorial bodies of the department reorganized. In March 2008 the responsibility for issuing forest use licenses was taken from the Ministry of Environment Protection and Natural Resources and passed to the Ministry of Economic Development (afterwards the Ministry of Economy and Sustainable Development). The amount (quota) of the natural resources to be obtained through licenses was defined by the Ministry of Environment Protection and Natural Resources and approved by the Ministry of Economy. In 2010 instead of the Forestry Department was created LEPL - Forestry Agency, which was granted permission to carry out certain economic activities. In spring 2011 as a result of structural changes performed by the Government of Georgia instead of the Ministry of Environment Protection and Natural Resources and the Ministry of Energy were created the Ministry of Environment and the Ministry of Energy and Natural Resources. To this one passed the Forestry Agency together with other structural units of former Ministry for Environment Protection and Natural Resources. Later LEPL Natural Resources Agency was formed. Functions of the agency include issues of forest, hunting, fishing and minerals management (defining license quotas, checking license conditions, suppression of illegal use etc). Besides, function of selling the right for using natural resources was taken from the Ministry of Economy and Sustainable Development to the Natural Resources Agency. On May 10 201328 National Forestry Agency was created, as a legal entity of public law in the system of the Ministry of Environment and Natural Resources Protection of Georgia. According to 2014 data, the agency manages the forest fund (1 895 thousand ha.) and carries out forest protection, restoration, physical defense activities, also regulation and control of forest use29. 2.4.4. Employees work for the forest administration In 1990 there were 11.7 employees working in budget organizations in forestry sector. In the beginning of 90-ies there were 600 hectares of area to be protected per one ranger (total forest fund subject to protection – 2.2 million hectares). From 1995 rapid reduction of number of employees had started and in 2003 it was 2.4 thousand persons. In 2004, when structural reorganization of forestry sector took place (see above), the number of employees amounted to 2.1 thousand persons. It should also be mentioned that on the next stage of the reorganization (2006) professional forestry stuff were replaced by non-professional personnel. This approach caused deterioration of general professional level within the branch. After 2006 the number of employees, among them rangers, was unknowingly reduced twice. Accordingly, the protection area per ranger grew in average up to 5000-7000 hectares. Currently there are 869 persons employed in the agency, 83 of them – in central staff, 786 – in regional offices. 569 of the employees are rangers. If we take into consideration the fact that Forestry Agency manages 1 906 thousand hectares, territory of one ranger is 3 350 ha in average30.
28 Decree N25 of the Minister for Environment Protection and Natural Resources of Georgia “On Approving the Statute of the LEPL National Forestry Agency” 29 Report of the LEPL National Forestry Agency activities for 2014 30 National Forestry Agency

25
Chart 14. Number of employees in Forestry Agency
Source: National Forestry Agency, GeoStat 2.4.5. Forestry production and management Forests of Georgia provide rural population with timber and fuelwood, which are necessary for their daily life, also with non-timber forest products. For rural population wood is main source of energy for heating and cooking. In 50-ies of the last century about 1.5 million cubic meters of wood was being cut in Georgian forests. After 1950 the forests were awarded the so called “1st category”31. Accordingly, volume of annually cut timber was reduced to 432 thousand cubic meters, while remaining timber was imported from Russia. In 1990 after gaining independence import of timber from Russia stopped and that caused heavy pressure on Georgian forests, especially because of procuring wood for heating and partially of high quality beech logs aimed for export. It is since this period that intensive economic use of Georgian forests has started. Also timber industry existing in soviet times has been shattered while new factories are still in the process of establishment and development. It is quite difficult to define factual volume of annual fuelwood produced since 1991 because of the frequent facts of illegal timber procurement by private businesses. According to evaluation by various international or local organizations the volume of harvested fuelwood amounts to not less than 2.5 million cubic meters, which points to large scale of illegal procurement. According to official data, volume of timber cut in 1990 amounted to 392.824 cubic meters, while in 2013 – 702.137 cubic meters32. Currently the processed timber is mainly sold on local market. The majority of Georgian forests are
31 According to forest categorization by Soviet system forests of the 1st category were defined as protective ones, limited from the point of view of industry. 32 GeoStat
1990 1995 2000 2001 2002 2003 2004 2005 2006 2007 2008 2009 2010 2011 2012 2013
11.7
3.5
7.4
3.6
3.5
2.4
21.1
21
16.9
0.67
0.67
0.68
0.68
0.46
0.59
0.59
0 0 0 0 0 0 1.05
1.06
1.05
0.47
0.52
0.47
0.47
0.22
0.35
0.35
Employed, total - thousand In which forest rangers - thousand

26
distributed in mountainous areas, so only 600.000 hectares (21%) of them can be considered as the forests for commercial use33. According to existing calculations, through all types of cutting, considering ecological balance of the environment and maintaining and improving of various useful functions of forest (water regulation, soil protection, resort and health function etc.), it is possible to procure 1.090 thousand cubic meters of wood annually, from where 470 thousands are timber (the calculation does not include Autonomous Republic of Abkhazia)34. Volumes of illegal timber revealed during the recent years vary up to 5-7 thousand cubic meters, but this does not reflect the existing reality at all. The reasons for this are still low level of life and lack of alternative energy sources. Officially, during the last years (2001 – 2013) the volume of revealed illegal logging in total amounted to 349.060 cubic meters. The largest volume was clocked in 2007 – 95.675 cubic meters. Revealed illegal cuttings in 2011 amounted to 7.451 cubic meters, in 2012 – 6.485 cubic meters35, in 2013 – 5.283 cubic meters36. According to existing data forest harvesting indicators in state forest fund for recent years give us following picture: Chart 15. Volume of harvested timber (cubic meters)
Source: GeoStat, National Forestry Agency
33 Forest Policy and Institutional Change Analysis in Central Asian and Caucasus Countries, Regional Project.FAOFOEP/FAOSEC. Merab Machavariani. 2009 34 Forestry Reforms. National Forestry Agency, 2013 35 GeoStat 36 These data are given only in statistics. Based on general observation of forest condition it can be said that they do not reflect reality and the indicator may be much higher.
0
100,000
200,000
300,000
400,000
500,000
600,000
700,000
800,000
900,000
392,
824
289,
712 44
2,14
0
380,
201
467,
603
535,
648
607,
539 81
0,61
5
558,
249
805,
423
818,
231
697,
461
876,
749
681,
669
518,
792
702,
137

27
As was mentioned above, the main part of Georgian forests is managed by the National Forestry Agency of Ministry of Environment and Natural Resources Protection37. The agency in the limits of its responsibility regulates main issues related to management of state forest fund, such as:
• Monitoring of the forest fund; • Care and restoration of the forest; • Issuing harvesting tickets; • Issuing ticket for use of forest resources; • Protection of forest from illegal logging; • Timber harvesting etc; also: • Defining various types of forest use (for example, using non-timber forest products,
running of forest plantations, using forest for agricultural purposes, resort, recreation, sports and for other cultural or health purposes, organising fisheries, organizing animal asylums and nurseries; non-agricultural use etc.)38.
2.4.6. Import and export of forest products Since independence of Georgia starts active export of timber resources. At that time the main export material was hornbeam, but there was also demand for fir and spruce timber. In 90-ies export of round wood became uncontrollable. At the same period in order to reduce pressure on forest were introduced temporary restrictions, in particular on final fellings (1998-1999) and on log export. Later (in 2001 and 2005) the Parliament of Georgia approved regulations of forest use and export of timber products39. As a result since 2006 growth of import/export volume of timber resources can be noticed. 2.5. Other factors
2.5.1. Natural disasters Georgia is located on the border of subtropical and moderate climate zones and belongs to climate region of Mediterranean, though its typical characteristics are substantially changed by mountainous landscape, and is characterized by particular variety of climate. The territory of Georgia contains 11 out of 14 existing climate zones due to very complicated merging of climate factors and vast scale circulation processes40.
37 The Law on Management of Forest fund of Georgia 38Current legislation does not grant National Forestry Agency any economic functions, so there are no regulations for some types of forest use (e.g. gathering non-timber resources, forest plantations etc.) The new Forest Code (work on which is now in progress) will grant the agency these functions. 39 Decree N1037 of the Parliament of Georgia on Urgent Measures for Regulation of Forest Use and Timber Export, July 20, 2001; Law of Georgia on ‘Licenses and Permits”, N1775, June 24, 2005 40 Second National Communication to the United Nations Framework Convention on Climate Change, results obtained in 2007. Tbilisi, 2008
28
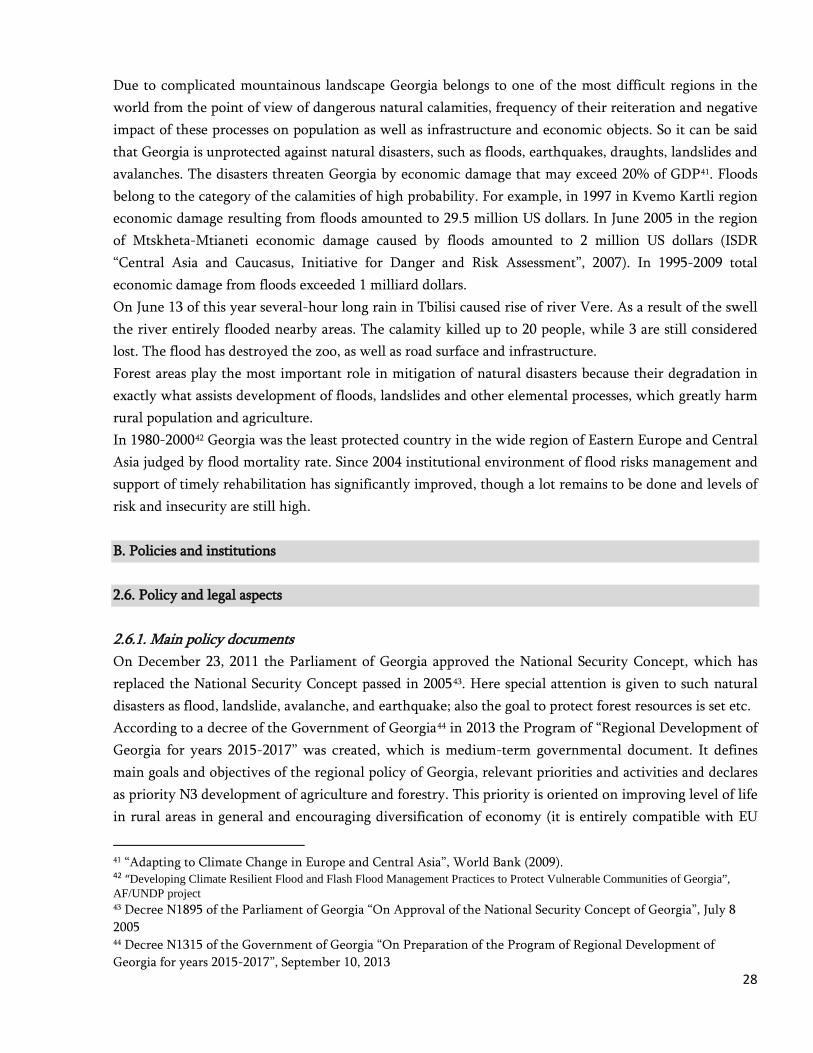
Due to complicated mountainous landscape Georgia belongs to one of the most difficult regions in the world from the point of view of dangerous natural calamities, frequency of their reiteration and negative impact of these processes on population as well as infrastructure and economic objects. So it can be said that Georgia is unprotected against natural disasters, such as floods, earthquakes, draughts, landslides and avalanches. The disasters threaten Georgia by economic damage that may exceed 20% of GDP41. Floods belong to the category of the calamities of high probability. For example, in 1997 in Kvemo Kartli region economic damage resulting from floods amounted to 29.5 million US dollars. In June 2005 in the region of Mtskheta-Mtianeti economic damage caused by floods amounted to 2 million US dollars (ISDR “Central Asia and Caucasus, Initiative for Danger and Risk Assessment”, 2007). In 1995-2009 total economic damage from floods exceeded 1 milliard dollars. On June 13 of this year several-hour long rain in Tbilisi caused rise of river Vere. As a result of the swell the river entirely flooded nearby areas. The calamity killed up to 20 people, while 3 are still considered lost. The flood has destroyed the zoo, as well as road surface and infrastructure. Forest areas play the most important role in mitigation of natural disasters because their degradation in exactly what assists development of floods, landslides and other elemental processes, which greatly harm rural population and agriculture. In 1980-200042 Georgia was the least protected country in the wide region of Eastern Europe and Central Asia judged by flood mortality rate. Since 2004 institutional environment of flood risks management and support of timely rehabilitation has significantly improved, though a lot remains to be done and levels of risk and insecurity are still high. B. Policies and institutions
2.6. Policy and legal aspects 2.6.1. Main policy documents On December 23, 2011 the Parliament of Georgia approved the National Security Concept, which has replaced the National Security Concept passed in 200543. Here special attention is given to such natural disasters as flood, landslide, avalanche, and earthquake; also the goal to protect forest resources is set etc. According to a decree of the Government of Georgia44 in 2013 the Program of “Regional Development of Georgia for years 2015-2017” was created, which is medium-term governmental document. It defines main goals and objectives of the regional policy of Georgia, relevant priorities and activities and declares as priority N3 development of agriculture and forestry. This priority is oriented on improving level of life in rural areas in general and encouraging diversification of economy (it is entirely compatible with EU
41 “Adapting to Climate Change in Europe and Central Asia”, World Bank (2009). 42 “Developing Climate Resilient Flood and Flash Flood Management Practices to Protect Vulnerable Communities of Georgia”, AF/UNDP project 43 Decree N1895 of the Parliament of Georgia “On Approval of the National Security Concept of Georgia”, July 8 2005 44 Decree N1315 of the Government of Georgia “On Preparation of the Program of Regional Development of Georgia for years 2015-2017”, September 10, 2013

29
agriculture development policy). It also includes sustainable development of forestry, which is potentially considered one of major assets from both environmental and economic point of view. Afterwards, in 2014, by a decree of the Government of Georgia45 the strategy of social and economic development of Georgia “Georgia 2020” was approved, which defines priority directions to relevant ministries. The strategy involves introduction of practice of protection and rational use of forest resources, which will significantly improve social and economic situation of the population, because development of agriculture and other sectors of economy depends on health of forest ecosystems. 2.6.1.1. Forest policy First official document of forest policy – “Main Principles of State Policy for Development of Forestry Sector of Georgia, 2002 - 2010” – was created and approved by the Government of Georgia in May 200246. The document stated that this sector is one of the most important for social and economic development of the country and declared obligation to develop it through creation of national policy. This would be in full accordance with UN requirements in the sphere of sustainable development and management of forests. The above mentioned document also was action plan for national policy of forestry sector. In 2004 Georgia became first country involved in NFPF process initiated by FAO/UNDP and started the process of working out its forestry policy and strategy. The first working version of the new policy document was ready in 2007, though it was never afterwards considered for approval by relevant state establishments. In the end of December 2013 the Parliament of Georgia approved “National Forestry Concept of Georgia”, based on which the Ministry of Environment and Natural Resources Protection started the process of working out national forestry program. The main policy documents of Georgia, which define attitude of the state towards forests: National Forestry Policy47 shall apply to all forests of Georgia irrespective of their ownership and form of management. One of its priority directions is defined as restoration of degraded forests and reforestation. A large area of the forest fund is severely degraded as a result of inadequate forest use practiced during long period of time. Degraded forest landscapes are more prone to soil erosion and landslides. According to the same document the first instance the area of degraded forests shall be specified, the areas subject to restoration and reforestation shall be identified and relevant actions need to be planned/implemented. The goal of the Forestry Concept of Georgia48 is to establish a system of sustainable forest management that will ensure: improvement of the quantitative and qualitative characteristics of Georgian forests, protection of biological diversity, effective use of the economic potential of
45 Decree N 400 of the Government of Georgia “On Approval of Strategy of Social and Economic Development of Georgia “Georgia 2020” and Activities Related to It”, June 17 2014 46 The document was signed by the State Minister 47Approved by the Parliament of Georgia on 11 December, 2013, http://w3.cenn.org/wssl/uploads/home/National%20forest%20policy%20for%20georgia%20(ENG).pdf 48Approved by the Parliament of Georgia on 11 December, 2013

30
forests taking into account their ecological value, public participation in forest management related issues, and fair distribution of derived benefits. To achieve this goal the Georgian forests should be used in a way, and at a rate, that ensures maintenance of ecological health and use of their socio-economic potential. Priority directions of the concept are:
• Forest management planning, where in the first instance the area of degraded forests should be specified, the areas subject to restoration and afforestation should be identified and relevant actions would then be planned/implemented.
• Rational use of forest resources • Forest ownership, management and use right • Adaptation to the impacts of climate change
2.6.1.2. Agricultural policy After agriculture took dominating place in political agenda of Georgia, business sector, civil society, NGOs and Orthodox Church (which owns large property and land in Georgia) started activities in order to support it. This assisted preparation of strategy of agrarian sector development for years 2015-2020. Assisting the Ministry of Agriculture in development of the strategy is also priority of European Union, formulated in EU Food Security Program (EU-FSP) 2007 and also later, in European Neighborhood Program of Agrarian and Rural Development (ENPARD) 2012. Strategic vision of development of Georgian agriculture based on principles of sustainable development includes creation of environment which will assist improvement of competitiveness in agriculture and food sector, stable growth of high quality production, food security, food safety and overcoming poverty in rural areas. The strategy also involves fulfillment of obligations taken in the framework on Deep and Comprehensive Free Trade Area Agreement between Georgia and the EU49 (according to agreed terms of approachment), which will provide for maximum proximity to international standards and norms and improvement of production. Strategy of development of agriculture in Georgia In order to put into practice the vision of the Strategy for Agricultural Development in Georgia seven main objectives have been defined:
• Enhanced competitiveness of rural entrepreneurs; • Institutional development; • Amelioration and Soil Fertility – in this direction of the strategy identified modernization of
irrigation and drainage infrastructure aims at improvement of water management, water removal from flooded areas, increase of the area covered and makes the soil fit for plant growing. The rehabilitated
49 On November 28, 2013, within the framework of the Eastern Partnership Summit in Vilnius, Initialing of the Association Agreement and a part of the agreement of Deep and Comprehensive Free Trade Area (DCFTA) between Georgia and the EU was completed, See the document at: http://eeas.europa.eu/georgia/assoagreement/assoagreement-2013_en.htm

31
irrigation and drainage infrastructure, as well as carrying out specific activities on restoration of seed-growing sector, will ensure guaranteed harvest of agricultural crops;
• Regional and sectorial development - value chain development; • Ensuring Food Security – according to this direction The MoA will continue monitoring food
security and also support subsistence farms to reduce their risks. The further encouragement will be given to the process of commercialization of subsistence farms. Special programs will be developed to increase incomes of farmworkers;
• Food safety, veterinary and plant protection; • Climate change, environment and biodiversity.
In the context of realization of these goals list of specific activities has been worked out50. According to the action plan already published by the Ministry of Agriculture for development of the branch following strategic goals have been set:
- Improvement of competitiveness of farmers and employees of agrarian sector; - Support to development of value chain development
- Institutional development and training; - Development of regional and agricultural infrastructure; - Food security; - Environment and biodiversity.
2.6.2. Main legal documents regulating forestry and agriculture 2.6.2.1. Forestry Legislation regulating forest management and forest use51 Legislation of Georgia in the sphere of forest management consists of the Constitution of Georgia, international agreements, laws “On Protection of Environment”, “On Protected Areas”, “On Protection of Animal World”, land legislation, Forest Code, Law on Forest Fund Management and other normative documents.
• Forest Code of Georgia, 1999 (with amendments and additions)52 • Law of Georgia on Licenses and Permits, 2005 (with amendments and additions) • Law of Georgia on Forest Fund Management, 2010 (with amendments) • Decree of the Government of Georgia N96 “On Taking out and Adding Areas to the State
Forest Fund”, May 10, 2007 (with amendment) • Decree of the Government of Georgia N179 “On Approval of Procedure for Forest
Inventory, Planning and Monitoring”,
50http://moa.gov.ge/ 51https://matsne.gov.ge 52 According to explanation by Head of Forestry Policy Office Karlo Amirgulashvili, working group is created, which works on new Forest Code. He supposes that the Code will be submitted to the Parliament for approval in spring.

32
• Decree of Government of Georgia N132 “On Rules and Conditions of Issuing License for Forest Use”, August 11, 2005, which establishes procedures and conditions of issuing licenses for harvesting and organizing hunting farms (with amendments);
• Decree of the Government of Georgia N242 “On Approval of Rules for Forest Use”, August 20, 2010 (with amendments);
• Law of Georgia “On Fees for Use of Natural Resources”, December 29, 2004 (with amendments)
• Law of Georgia “On Ownership of Agricultural Land”, March 22, 1996 (with amendments); • Decree of the Government of Georgia N240 “On Rules of Defining Borders of State Forest Fund”,
August 13, 2010 (with amendments); • Law of Georgia “On Public Registry”, December 19, 2008 (with amendments and additions).
2.6.2.2. Agriculture Agricultural activities are regulated by following basic legislative documents53:
• Law of Georgia on “Ownership of Agricultural Land”, March 22, 1996 (with amendments);
• Law of Georgia on “Licenses and Permits”, June 24, 2005 (with amendments and additions); • Law of Georgia on “Soil Protection”, May 12, 1994 (with amendments); • Law of Georgia on “Agricultural Cooperative”, July 12, 2013 (with amendments) • Law of Georgia on “Food/animal food Safety, Veterinary and Plant Protection”, May 8,
2012 • Law of Georgia “On State Property”, December 19, 2008 (with amendments and additions); • Law of Georgia “On Public Registry”, July 21, 2010 (with amendments and additions); • Law of Georgia on “Compensating for Substitute Land Development Value and Sustained Damage
When Allocating Agricultural Land for Non-agricultural Purposes”, 2 October, 1997, (with amendments and additions).
2.7. Institutional frameworks for land use change governance
2.7.1. Land use planning documents Land resources and category54 of agricultural land plot can be registered (or the existing registration can be changed) according to the Law on “Public Registry”55. According to the same law - land plot as agricultural or non-agricultural purpose is registered as stated in ownership document; as well is changed the purpose of the land from agricultural to non-agricultural and category of agricultural land plot 56.
53 Land Code of Georgia as complex law regulating land tenure in the country is not completed and approved yet. Last land code was passed in 1971. 54 Categories of agricultural land are pastures, grasslands, arable (taken by perennial crops, garden, vegetable garden) and homestead land. 55 Law of Georgia on Public Registry, article 15 56 Rules and conditions of change of purpose of land plot and of category of agricultural land plot are defined by instruction – Decree N4 of the Minister of Justice of Georgia on approval of the guidelines of the Public Registry, January 15, 2010

33
Legal relations concerning specification of borders of state forest fund are defined by decree of the Government of Georgia “On rules of Defining of State Forest Fund Borders”. Borders of the state forest Fund can be changed or corrected through registration on the basis of application by the Ministry of Economy and Sustainable Development of Georgia. Border can also be corrected on the basis of application by owner of the land plot57. Keeping public registry and availability of information is provided by a LEPL National Agency of Public Registry, in charge of the Ministry of Justice of Georgia, which is public legal registration body defined by law58. 2.7.2. Stakeholder involvement in planning process According to the General Administrative Code of Georgia59 public institution is obliged to deliver public information immediately. At the same time, if the information requires processing, 10- day term may be set for giving it. “Immediately”, for its part, means indefinite date, so specific and sensible conditions must be determined. For example, public information is considered to be given immediately, if this happens within 3 days from request. 3. Summary and analysis of positive trends
3.1. Forestry sector In order to solve problems related to management of Georgian forests specific activities were planned, which on various stages have been reflected in following program documents: With active participation of stakeholders “National Forestry Concept of Georgia” (2013) has been prepared. The document specifies attitude of the state towards forests of Georgia. Based on the concept and on biodiversity policy documents the Ministry of Environment and Natural Resources Protection of Georgia with support of the German Society for International Cooperation (GIZ) in spring 2013 started realization of the National Forestry Program involving all stakeholders. Currently legislative and statutory acts regulating forestry sector do not comply with principles of sustainable forest management. Shortcomings and collisions occurring in these normative acts account for their controversy with each other as well as with other legislation related to forestry. Accordingly, it is important to start working on new forestry legislation and statutory acts, which will in future assist sustainable management of forests and will be obligatory for all subjects responsible for forest management. So, based on the above mentioned policy documents, work on the new Forest Code has started in 2014. Since 2013 changes have been made to the forestry system. LEPL National Forestry Agency has been created with employing staff of 869 persons. Number of rangers employed by the agency has also increased. According to data of February 2014, there were 569 rangers working there. So the area to be
57Law of Georgia on Public Registry, article 15 58 Law of Georgia on Public Registry, article 3 59 www.matsne.gov.ge

34
protected was reduced in average to 3000 hectares per person. At the same year the Forestry Policy Office and the Environmental Supervision Department were created at the Ministry of Environment and Natural Resources Protection. The goal of the reform is to dissociate forest management, physical protection, policy and legislation provision functions from each other. The positive trend can be considered also the fact that forest inventory work is carried out on large area of the state forest fund. Currently the above mentioned work is being continued by the LEPL National Forestry Agency and the continuation is also planned for future years. It should also be mentioned that there has been no reduction of forest areas in the country at the cost of enlargement of agricultural plots. In several cases growth of forest cover can be noticed. This is caused by migration of local population, especially from mountainous regions, which has reduced pressure on natural ecosystems caused by forest cutting and excessive, mostly uncontrolled grazing. Under the influence of this factor and also of climate change, forest areas in some mountainous regions (e.g. Khevi, Racha) have increased. We should also mention separately work by the Ministry of Environment and Natural Resources Protection with support of donor organizations on legislative initiative concerning improvement of sustainable use of non-timber forest resources. According to Biodiversity Policy and Action Plan of Georgia for 2014-2020, by 2020 forest biodiversity will be protected through introducing best practices of sustainable forestry60. 3.2. Agriculture Since 2013 support of agriculture has been one of the main priorities for the Government of Georgia. The aim of the government is on the basis on the principles of sustainable development to encourage the proper environment for the reliable growth of high quality agricultural production, enhance competitiveness, provide food security and overcome poverty in rural areas. The government has started several agrarian programs in direction to improve of irrigation systems, awareness rising among farmers, better agricultural enterprises and better financial conditions for farmers. During the recent years financing of agriculture form the state budget and with additionally co-financing by grants from international foundations and loans grew significantly. Special attention is given to improve amelioration infrastructure, purchase and use of agricultural machinery, realization of assistance program for small farms, preventive measures against cattle diseases, purchasing equipped laboratories to be able to issue international accreditation, diversification of foreign markets. After signing the Association Agreement in June 2014 quality of relations between European Union and Georgia passed to completely new level. The agreement and the Deep and Comprehensive Free Trade Area (DCFTA) it involves include opportunities of future political and economic integration with EU, significant deepening of political and economic relations, proximity of Georgia to Europe. This agreement makes it possible for agricultural products exported from Georgia to make their way freely to EU market. 60 National goal C.3.2014-2020. Strategy and Action Plan of Georgian Biodiversity. Decree of the Government of Georgia N343, May 8, 2014

35
ANNEXES

36
Figure 1: Chain-linked volume indices of Gross Domestic Products (2003=100,%)61 2003 2004 2005 2006 2007 2008 2009 2010 2011 2012 2013 Agriculture, hunting and forestry; fishing
100 92.1 103.2 91.1 94.1 89.9 83.8 79.8 87.5 84.2 93.7
mining and quarrying 100 80.1 73.8 87.7 105.1 122.7 134.2 140.4 128.4 136.8 140.6 manufacturing 100 111.6 127.3 155.6 173.6 171 156.5 188.1 211.1 238.9 259.5 electricity, gas and water supply
100 96 100.9 114.5 122.2 126.7 134.6 137.3 151.9 152.9 160.7
Processing of products by households
100 98.4 110.6 113.8 145.8 139.2 136.7 130.4 141.6 137.9 147.3
Construction 100 135.9 155 168.3 192.9 171.5 166.1 176.8 181.7 214.8 192.2 Trade; repair of motor vehicles and personal and household goods
100 108.2 118.3 141.7 155.3 173.6 145.3 165.8 172.9 185.0 195.0
Hotels and restaurants 100 103.5 120.7 133.3 148.5 155.7 148.9 168.4 186.0 207.2 216.7 Transport 100 103.7 107.7 125.9 140.8 127.4 128.1 144.7 158.2 169.2 174.6 Communication 100 116.9 150.5 170.7 185.6 215 207.8 229.4 248.7 273.8 276.1 Financial intermediation 100 112.8 172.5 236.1 272.2 283.8 288.1 330.5 398.9 457.9 490.1 Real estate, renting and business activities
100 128.1 141.7 166.3 204.7 209.6 201.1 221.4 253.6 267.1 292.7
Imputed rent of own occupied dwellings
100 100.6 101.5 101.7 107.2 110.6 113.7 116.6 120.0 124.5 128.3
Public administration 100 109.7 102.8 100.4 116.3 127.9 129.4 130.4 135.3 139.8 142.8 Education 100 101.8 115.9 129.8 142.1 160.8 168.4 173.6 179.6 185.2 189.6
61 1.GeoStat; 2. Nationa Bank of Georgia; 3. Ministry of Economy and Sustainable Development of Georgia;

37
Health and social work 100 104.2 112.1 129.4 142.8 152.6 165.8 170.7 173.4 178.4 178.4 Other community, social and personal service activities
100 106.5 126 135 167.4 170 147.9 165.1 176.4 188.9 192.0
Private households employing domestic staff and undifferentiated production activities of households for own use
100 120.5 97.8 106.2 114.1 120.7 124 135.8 205.2 219.0 217.6
Financial Intermediation Services Indirectly Measured (FISIM)
100 92.1 145.1 123.4 175.8 222.1 219.8 240.9 294.9 325.0 362.6
Figure 2. Gross National Income (GNI)
2003 2004 2005 2006 2007 2008 2009 2010 2011 2012 2013 2014 Gross National Income (GNI), mil. USD
4,022,1 5,218,9 6,505,2 7,937.6 10,211.8 12,628.2 10,649.4 11,277.2 13,903.6 15,700.5 15,835.3 16,376.8
GNI per capita, USD
926,2 1 209,4 1 505,3 1,803.5 2,323.7 2,881.8 2,428.4 2,542.0 3,111.0 3490.9 3531.7 3647.0

38
Figure 3. Foreign Direct Investments in Georgia by Economic Sectors. 1000 USD 2007 2008 2009 2010 2011 2012 2013 2014 Total 2 014 841,6 1 563 962,4 658 400,6 814 496,6 1 117 244,1 911 564,3 941 902,6 1 758 422,9
of which: Agriculture, fishing 15 527,9 7 844,3 22 326,9 8 631,9 14 907,6 16 119,3 11 857,4 12 290,3
Mining 86 170,0 18 105,2 15 023,4 53 435,9 40 219,6 4 862,2 43 704,9 42 781,5 Manufacturing 312 070,9 188 287,8 124 781,7 175 334,5 120 339,7 167 906,5 99 765,1 205 417,4 Energy sector 362 581,1 294 864,8 -2 130,6 21 877,9 203 951,6 179 402,6 244 745,1 189 945,0 Construction 171 891,8 56 725,3 105 218,8 4 705,9 48 112,2 41 839,2 49 847,5 316 588,1 Hotels and restaurants 242 075,9 181 939,2 37 542,3 17 121,8 22 705,6 17 652,3 -13 360,1 124 851,8 Transport and Communication 416 694,7 422 690,0 98 432,0 215 116,2 126 517,2 72 828,9 140 104,4 433 654,7 Health and social work 458,3 550,6 289,1 1 182,4 16 827,0 17 550,8 720,0 -9 507,6 Real estate 62 30 543,9 277 837,7 147 410,3 119 253,0 224 776,3 52 805,6 42 294,6 138 654,8 Financial intermediation 63 157 723,1 10 891,7 49 663,4 107 406,4 167 701,8 162 552,2 166 386,3 115 322,6 Other sectors64 219 104,1 104 225,8 59 843,3 90 430,7 131 185,5 178 044,8 155 837,4 188 424,2
Figure 4. Main trends of Agriculture sector in 1990-2014
Year Sown areas, ha. Share of agriculture in GDP (%)
1990 701,9 31,6 1995 453,1 44,4 2000 610,8 20,2 2005 539,6 16,8 2006 330,2 11,2 2007 297,2 10,7
62 Real estate, renting and business activities; 63 Since 2009 data for the financial sector besides banks include FDI data in insurance and microfinancial companies; 64 Trade; Education; Research and experimental development; Other community, social and personal service activities.

39
2008 329,3 9,4 2009 308,3 9,4 2010 275,3 8,4 2011 281 8,8 2012 259,6 8,6 2013 310,7 9,4 2014 316,6 9,2
Figure 5. Share of forestry sector in GDP (%) mln. GEL
1998 1999 2000 2001 2005 2008 2009 2010 2011 2012 Forestry and wood processing
80.7 113.3 78.2 86.0 86.0 70.2 64.0 63.1 82.6 85.6
GDP 5,040.6 5,666.0 6,015.5 6,618.8 6, 618.8 19, 074.9 17, 986.0 20, 743.3 24, 344.0 26, 138.9 Share % 1.6 2 1.3 1.3 1.3 0.4 0.35 0.3 0.34 0.32 Figure 6. Money transfers and share in GDP
2008 2009 2010 2011 2012 2013 2014** I 201565 Inflow (mln. USD) 1 002,1 841,8 1 052,2 1 268,1 1 334,2 1 477,0 1 440,8 249,4
GDP (mln. USD) 12
800,5 10
767,1 11 636,5 14 438,5 15 846,8 16 139,9 16 528,5 3 298,9
Share of inflow money in GDP (%) 7,8 7,8 9,0 8,8 8,4 9,2 8,7 7,6
65 National Bank of Georgia, https://www.nbg.gov.ge/uploads/sagareoseqtori/money_transfers_by_systems_geo.xls

40
Figure 7. Resident population of Georgia66
Years
Total population, thousands
on which:
In total population, per cent
urban rural urban rural 1989 5400.8 2991.3 2409.5 55.4 44.6 1990 5424.4 2998.5 2425.9 55.3 44.7 1991 5453.3 3004.6 2448.7 55.1 44.9 1992 5467.4 2983.4 2484.0 54.6 45.4 1993 5345.8 2914.1 2431.7 54.5 45.5 1994 4929.9 2652.8 2277.1 53.8 46.2 1995 4794.2 2568.4 2225.8 53.6 46.4 1996 4674.5 2483.2 2191.3 53.1 46.9 1997 4558.4 2412.5 2145.9 52.9 47.1 1998 4504.9 2365.8 2139.1 52.5 47.5 1999 4469.8 2338.2 2131.6 52.3 47.7 2000 4435.2 2308.2 2127.0 52.0 48.0 2001 4401.4 2280.7 2120.7 51.8 48.2 2002 4371.5 2284.8 2086.7 52.3 47.7 2003 4342.6 2266.8 2075.8 52.2 47.8 2004 4315.2 2252.5 2062.7 52.2 47.8 2005 4321.5 2257.5 2064.0 52.2 47.8 2006 4401.3 2310.4 2090.9 52.5 47.5 2007 4394.7 2308.9 2085.8 52.5 47.5 2008 4382.1 2303.8 2078.3 52.6 47.4 2009 4385.4 2309.1 2076.3 52.7 47.3 2010 4436.4 2350.5 2085.9 53.0 47.0 2011 4469.2 2371.3 2097.9 53.1 46.9 2012 4497.6 2391.7 2105.9 53.2 46.8 2013 4483.8 2410.8 2073.0 53.8 46.2 2014 4490.5 2411.7 2078.8 53.7 46.3 66 Hereafter population data are given: for 2002– according to the Census of January 17; for 1989 – the Census of January 12, for other years – at the beginning of the year. Population for 1994-2014 is given excluding the population of Abkhazia and Tskhinvali region. http://www.geostat.ge/cms/site_images/_files/archive/yearbook/Statistical%20Yearbook%20Georgia_2009.pdf

41
Figure 8. Balance of the international migration of population (thsd. person)67 Years Net migration
1991- 1998 -790.2 1999 -36.1 2000 -35.2 2001 -32.6 2002 -27.8 2003 -27.5 2004 5.5 2005 76.3 2006 -12.1 2007 -20.7 2008 -10.2 2009 34,2 2010 18.1 2011 20.2 2012 -21.5 2013 -2.6
Figure 9. Land cover of Georgia (thsd. ha.)68
Total area
Agricultural land
Arable land
Permanent crops
Meadow Pasture
Area, total: on which:
7628,4 3025,8 801,8 263,8 143,8 1796,6
Private land 948,9 767,3 438,5 180,5 44,5 84,5 Public land 6679,5 2258,5 363,3 83,3 99,8 1712,1
67 http://www.geostat.ge/cms/site_images/_files/yearbook/Yearbook_2014.pdf 68 Natural Resources of Georgia and Environmental Protection, 2014. Statistical Publication. GeoStat. http://www.geostat.ge/cms/site_images/_files/georgian/agriculture/sakartvelos%20bunebrivi%20resursebi%20da%20garemos%20dacva_2014.pdf

42
Figure 10. Output of agriculture (mln. GEL) 2002 2003 2004 2005 2006 2007 2008 2009 2010 2011 2012 2013 201469 Plant growing 968.3 1149.7 1047.9 1184.5 911.4 1051.6 918.1 868,3 932,1 1237,9 1087,0 1405,2 1485,7 Animal husbandry 1013.0 1070.9 1095.4 1105.3 1165.3 1138.8 1227.6 1140,5 1240,3 1336,8 1610,3 1665,8 1731,8 Agricultural services 41.5 41.5 40.6 40.5 57.5 60.5 57.2 63,4 69,4 99,3 109,9 139,0 160,7 Output of agriculture, total
2022.8 2262.1 2183.9 2330.3 2134.2 2250.9 2202.9 2072,2 2241,8 2674,0 2807,2 3210,0 3378,1
Figure 11. Import dynamics of major import products – thsd. USD (2000-2006)
2000 2001 2002 2003 2004 2005 2006 Wheat and meslin 29 152,1 14 395,5 20 056,5 27 950,7 75 021,8 45 130,1 99 063,1
Cigars, cheroots, cigarillos and cigarettes
29 390,5 18 717,6 18 915,4 20 790,0 27 793,1 14 604,3 22 895,2
Sugar 25 368,9 24 137,9 34 690,2 52 959,3 50 833,8 78 194,2 65 589,1
Meat and edible offal, of the poultry, fresh, chilled or frozen
8 729,9 8 813,5 11 106,8 9 782,1 9 689,9 13 803,3 22 169,8
Sunflower-seed, safflower or cotton-seed oil and fractions thereof
3 274,6 2 699,6 3 142,8 3 501,7 15 956,9 21 889,8 23 582,8
Chocolate and other food preparations containing cocoa
1 825,5 3 293,6 5 914,9 10 393,7 19 624,9 24 820,8 33 694,4
Frozen fish 1 161,7 980,4 1 264,2 1 930,7 4 012,0 7 645,6 20 338,5 Undenatured ethyl alcohol, spirits, liqueurs and other spirituous beverages below 80% alcohol content
574,7 1 066,6 1 549,7 4 300,3 5 513,1 9 921,1 20 632,3
69 Preliminary data. GeoStat

43
Bread, pastry, cakes and the like 1 204,4 904,6 1 171,6 1 886,3 7 735,7 11 042,4 14 261,4
Meat of swine fresh, chilled, or frozen
181,7 281,6 596,5 879,8 1 469,5 2 836,8 11 778,6
Margarine 1 580,9 2 360,0 2 413,6 2 428,7 4 724,5 6 523,6 9 607,7 Import dynamics of major import products – thsd. USD (2007-2014) continue
2007 2008 2009 2010 2011 2012 2013 2014 Wheat and meslin 139 188,9 108 851,7 105 506,0 174 156,0 184 232,2 239 961,7 184 806,9 151 755,5
Cigars, cheroots, cigarillos and cigarettes
38 075,0 60 048,0 57 424,7 78 990,2 86 742,7 90 578,5 95 717,3 115 474,2
Sugar 90 457,4 66 023,6 50 407,8 74 233,4 92 947,3 84 509,7 67 382,6 63 391,1
Meat and edible offal, of the poultry, fresh, chilled or frozen
36 256,5 44 763,0 37 229,5 47 954,3 66 064,8 69 844,4 71 428,7 71 955,8
Sunflower-seed, safflower or cotton-seed oil and fractions thereof
29 334,3 45 730,8 28 788,9 46 878,2 54 179,8 51 252,7 53 782,9 37 534,1
Chocolate and other food preparations containing cocoa
41 441,1 49 735,6 42 862,9 46 615,9 50 518,6 53 087,0 61 501,2 59 594,5
Frozen fish 26 306,0 26 599,1 22 504,8 26 881,2 30 893,8 33 679,7 35 315,2 31 161,3 Undenatured ethyl alcohol, spirits, liqueurs and other spirituous beverages below 80% alcohol content
14 556,6 21 005,3 26 662,3 27 435,0 32 634,3 32 838,8 39 609,0 54 749,4

44
Bread, pastry, cakes and the like 18 580,1 25 376,8 19 221,5 22 352,4 29 223,0 30 071,5 32 695,1 34 045,5
Meat of swine fresh, chilled, or frozen
9 918,1 16 518,7 12 667,7 13 454,4 18 858,3 28 880,3 34 081,4 38 098,9
Margarine 11 667,9 16 247,7 15 814,1 20 846,5 27 280,6 28 525,1 27 372,8 28 231,7
Figure 12. Export dynamics of major export products - thsd. USD (2000-2006) 2000 2001 2002 2003 2004 2005 2006 Other nuts, fresh or dried 221,1 334,8 178,7 212,4 1 276,0 486,2 449,8 Undenatured ethyl alcohol, spirits, liqueurs and other spirituous beverages below 80% alcohol content
574,7 1 066,6 1 549,7 4 300,3 5 513,1 9 921,1 20 632,3
Wine of fresh grapes 149,8 333,9 303,6 529,3 346,9 971,2 6 952,9 Waters, natural or artificial mineral 28,0 11,1 13,8 60,8 106,1 300,0 1 123,6 Wheat and meslin 29 152,1 14 395,5 20 056,5 27 950,7 75 021,8 45 130,1 99 063,1 Live bovine animals 58,6 0,9 - 105,5 - - 52,2 Live sheep and goats 38,9 - - - - - 4,8
Waters, mineral and aerated waters, containing added sugar
184,1 150,1 159,0 326,1 785,9 1 766,2 4 002,5
Fruit and vegetable juices 568,4 410,4 671,6 1 621,9 3 007,5 4 306,1 2 829,3 Maize 5,7 6,5 1,0 170,5 177,0 1 063,1 4 554,6 Citrus fruit, fresh or dried 2 450,1 1 606,5 1 556,9 2 131,6 2 620,4 5 897,1 2 545,5

45
Export dynamics of major export products - thsd. USD (2007-2014) continue 2007 2008 2009 2010 2011 2012 2013 2014 Other nuts, fresh or dried 1 253,1 851,0 1 245,6 581,3 779,3 1 994,9 2 197,2 3 196,4 Undenatured ethyl alcohol, spirits, liqueurs and other spirituous beverages below 80% alcohol content
14 556,6 21 005,3 26 662,3 27 435,0 32 634,3 32 838,8 39 609,0 54 749,4
Wine of fresh grapes 2 087,2 393,8 1 046,3 2 036,2 738,7 1 526,6 2 066,1 2 568,9
Waters, natural or artificial mineral 323,1 339,6 379,5 246,5 344,8 223,8 360,2 480,9
Wheat and meslin 139 188,9 108 851,7 105 506,0 174 156,0 184 232,2 239 961,7 184 806,9 151 755,5 Live bovine animals 1 352,4 1 886,9 550,6 181,6 259,2 420,7 1 379,2 2 379,0 Live sheep and goats - 785,3 4,1 - 363,5 1 588,1 904,1 4 125,9 Waters, mineral and aerated waters, containing added sugar
7 114,6 11 407,9 9 291,8 11 835,3 14 419,1 17 153,5 21 605,2 24 213,7
Fruit and vegetable juices 3 599,3 3 570,7 3 188,1 2 935,3 3 102,2 3 547,8 6 288,3 6 124,6 Maize 4 064,3 1 993,1 1 096,7 2 650,3 994,8 7 677,5 12 581,8 7 790,6 Citrus fruit, fresh or dried 4 619,1 3 877,8 15 702,7 12 142,9 5 263,2 7 669,8 20 187,7 14 722,8
Figure 13. Dynamic of foreign trade (mln. USD)
Foreign trade, Total Agrarian sector Share of agrarian products (%)
Year Export Import Balance Export Import Balance Export Import
2009 1 134 4 500 -3 367 316 803 -487 27,9% 17,9% 2010 1 677 5 257 -3 580 349 968 -619 20,8% 18,4% 2011 2 189 7 065 -4 876 437 1 194 -757 19,9% 16,9% 2012 2 375 8 049 -5 674 513 1 274 -762 21,6% 15,8% 2013 2 908 8 026 -5 117 774 1 292 -517 26,6% 16,1% 2014 2 861 8 596 -5 735 826 1 306 -480 28,9% 15,2%

46
Figure 14. Cereal import dependency ratio70 Figure 15. Share of food in merchandise imports and export 71
Food imports (% of merchandise imports) Food exports (% of
merchandise exports)
Year Value Value 1990 1991 1992 1993 1994 1995 1996 36,11872427 29,29245525 1997 33,47010357 31,80958235 1998 18,67954079 33,92912213 1999 22,53344596 26,26521232 2000 23,33543779 28,02987513 2001 20,36149944 26,50202753 2002 20,47973061 32,44508394 2003 18,08921693 36,81997168 2004 20,93906945 31,96485229 2005 17,4231512 36,36262484 2006 16,37051041 26,30217299 2007 15,69030185 25,43106878 2008 15,33337597 17,69055887 2009 17,46869311 32,55151933 2010 18,16640327 21,91417911 2011 12,3389174 21,89441672 2012 13,04485871 25,56089088
2013 14,1811235 35,64148517 2014 14,81209349 40,71115568
70 http://faostat3.fao.org/download/D/FS/E 71 http://data.worldbank.org/indicator/TM.VAL.FOOD.ZS.UN
Year Graph year Value (%)
1990-1992 1991 63,5 1991-1993 1992 70,4 1992-1994 1993 57,9 1993-1995 1994 59,5 1994-1996 1995 57,3 1995-1997 1996 59,5 1996-1998 1997 58,2
1997-1999 1998 54,7 1998-2000 1999 61,5
1999-2001 2000 58,4 2000-2002 2001 59,3 2001-2003 2002 53,9 2002-2004 2003 57,5 2003-2005 2004 59,4 2004-2006 2005 65,6 2005-2007 2006 68 2006-2008 2007 68,3 2007-2009 2008 64,2 2008-2010 2009 66,5
2009-2011 2010 68,6

47
Figure 16: Structure of the SFD
Organisation Chart of the State Forest Department(as authorised by the Chairman of the SFD on 15 November 2002)
Chairman's Office
Forest RegenerationDept
Human ResourceLegal Services andAdministration Dept
First Deputy Chairman
Forest ProtectionDept
Forest ProtectionGeneral Inspectorate
Deputy Chairman
Parliamentary andPublic Relations Dept
Deputy Chairman
Economics, Financeand Accountancy
Dept
Deputy Chairman
Forest Registry andUtilisation Dept
Central Office
48 Forest Districtoffices
Forest DistrictOffices
Sakhtkprojecti
Sartichala Nursery
Forest Seed Selection
Forest Seed TestingStation
Training Centre at theDendrological Garden
Subordinate Organisations
Forest Districts
Abkhazeti ForestDepartment
Forest Districts
Adjara ForestDepartment
Joint SubordinateOrganisations
Chairman

48
Figure 17: Structure of NFA
MANAGEMENT • Head of the Agency • Deputy Head (3 Deputies)
DEPARTMENTS • Maintenance and Reforestation Department • Forest Inventory Department • Forest Use Department • Financial Department • Legal Department • Administrative Department • Department of Internal Control
REGION • Kakheti Forestry Service • Kvemo Kartli Forestry Service • Mtskheta-Mtianeti Forestry Service • Shida Kartli Forestry Service • Samtskhe-Javakheti Forestry Service • Imereti Forestry Service • Guria Forestry Service • Racha Lechkhumi-Kvemo Svaneti Forestry Serice • Samegrelo-Zemo Svaneti Forestry Service
Figure 18. Number of employees in Forestry Agency
Year Employed, total - thousand
In which forest rangers - thousand
Forest ranger’s controlled area,
average, ha. 1990 11,7 - - 1995 3,5 - - 2000 7,4 - - 2001 3,6 - - 2002 3,5 - - 2003 2,4 - - 2004 2,1 1,05 1978 2005 2,1 1,06 1960 2006 1,6 1,05 2087

49
2007 0,67 0,47 4440 2008 0,67 0,52 3953 2009 0,68 0,47 4358 2010 0,68 0,47 4358 2011 0,46 0,22 8398 2012 0,59 0,35 5310 2013 0,87 0,57 5310
Figure 19. Illegal logging (cubic meters)72
2001 2005 2006 2007 2008 2009 2010 2011 2012 2013 43 287 62 764 40 924 98 675 21 331 30 684 32 948 7 060 6 104 5 283
Figure 20. Volume of harvested timber (cubic meters)73
Year volume m3
1990 392 824 1995 289 712 2000 442 140 2001 380 201 2002 467 603 2003 535 648 2004 607 539 2004 810 615 2006 558 249 2007 805 423 2008 818 231 2009 697 461 2010 876 749 2011 681 669 2012 518 792 2013 702 137
72 GeoStat 73 Ministry of Environment and Natural Resources Protection of Georgia

50
Figure 21. Export of wood and wood products – thsd. USD 1995-2000 2001-2005 2006 2007 2008 2009 2010 2011 2012 2013 2014 Total 27 040,2 48 223,8 18669,0 22807,2 22563,6 22758,5 16902,8 20500,3 23841,4 23268,1 21788,7
of which: Fuel wood, wood waste and scrap,
briquettes, pellets or similar forms 267,7 18,8 - - 33,0 17,4 - 0,2 15,7 11,1 - Wood charcoal - 1,8 0,0 - - - 16,0 24,8 - 16,1 17,8 Wood in the rough, whether or not stripped of bark or sapwood 15 406,3 931,9 256,8 152,5 555,1 7,0 - 3,1 15,3 - 0,0 Hoopwood; split poles; piles, pickets and stakes of wood 4,3 11,5 15,8 18,6 - 4,6 - - - - - Railway or tramway sleepers of wood
3,5 356,2 73,8 - 190,9 521,1 444,8 232,1 127,3 556,4 1
091,0 Wood sawn or chipped lengthwise, sliced or peeled, sanded or finger-jointed 6 438,8 42 157,4 16407,0 20775,2 19563,1 13786,9 7480,4 8932,2 9516,3 11705,7 11331,0 Veneer sheets and sheets for plywood and other wood sawn lengthwise 813,1 1 363,8 540,5 680,6 727,3 105,9 - - 32,0 - - Planed (shaved) wood 3 479,2 2 123,9 534,5 566,4 446,3 526,0 221,5 372,6 389,9 177,4 522,8 Particle board and similar board of wood or other ligneous materials 45,0 2,7 255,7 28,6 238,4 6564,6 6833,6 8020,5 10963,7 7848,0 6457,9 Fibreboard of wood or other ligneous materials 62,6 - 35,3 8,6 50,1 693,9 1067,1 1971,4 2072,8 2071,9 1274,0 Plywood, veneered panels and similar laminated wood 8,2 321,0 218,2 65,5 - 11,6 0,1 4,2 15,7 30,6 108,7 Densified wood - 5,0 1,4 1,1 - 73,9 231,1 216,3 127,5 105,1 58,5 Wooden frames 1,8 7,0 3,7 0,3 0,6 0,7 0,1 0,2 5,3 0,2 4,8 Packing cases, boxes, drums and similar packings, cable-drums, pallets of wood 71,3 29,9 34,2 20,8 15,3 48,6 54,7 14,3 68,2 107,6 61,4 Casks, tubs and other coopers' products and parts thereof, of wood 2,6 1,7 0,0 0,2 43,1 0,1 0,1 2,5 9,5 - 0,0 Tools, tool bodies, tool handles, broom or brush bodies, of wood 5,2 - - 118,4 223,9 168,2 180,6 80,8 55,2 84,0 79,1 Builders' joinery and carpentry of 291,7 796,5 277,1 366,7 441,7 153,4 327,2 588,3 336,9 285,0 434,9

51
wood Tableware and kitchenware, of wood - 0,5 0,2 0,1 5,1 0,7 8,6 0,7 0,1 0,4 2,1 Marquetry and inlaid wood; caskets, cases and other articles, of wood 47,4 55,7 0,2 0,8 4,1 1,9 10,4 1,6 13,7 20,3 15,0 Other articles of wood 91,5 38,6 14,6 3,0 25,7 72,1 26,5 34,4 76,3 248,4 329,8
Figure 22. Import of wood and wood products – thsd. USD
1995-2000 2001-2005 2006 2007 2008 2009 2010 2011 2012 2013 2014
Total 13406,6 32013,3 22872,8 45355,2 73869,1 52051,4 55762,9 79623,8 100523,4
91199,0 107586,6 of which:
Fuel wood, wood waste and scrap, briquettes, pellets or similar forms 29,9 138,6 44,7 85,4 114,5 108,3 114,1 191,4 255,7
381,9 390,8
Wood charcoal 2,7 12,7 7,3 6,4 23,8 79,1 164,0 109,6 100,1
160,4 134,0
Wood in the rough, whether or not stripped of bark or sapwood 58,6 1 358,5 439,3 709,1 2763,8 1255,0 2222,8 4571,8 5363,0
2207,3 5788,5
Hoopwood; split poles; piles, pickets and stakes of wood 36,3 3,9 1,1 0,5 4,0 26,0 0,0 1,7 0,7
- 1,9
Wood wool; wood flour 0,5 8,0 5,0 - 0,0 0,1 - 0,4 -
- -
Railway or tramway sleepers of wood 5 749,4 2 590,2 1285,4 2377,0 286,1 1756,1 1196,2 1317,7 3026,8
1547,6 1219,9
Wood sawn or chipped lengthwise, sliced or peeled, sanded or finger-jointed 437,9 421,1 323,6 635,6 1704,4 1116,9 530,6 1303,6 4945,6
1853,4 3277,2
Veneer sheets and sheets for plywood and other wood sawn lengthwise 201,1 98,7 86,6 163,7 392,5 194,5 159,2 258,4 375,2
218,4 289,7
Planed (shaved) wood 306,7 410,3 629,0 858,6 1155,4 1119,9 1386,8 1877,6 2132,2
966,4 1442,1
Particle board and similar board of wood or other ligneous materials 2 148,3 12 447,8 8980,7 15289,9 24711,6 17368,4 20008,1 21842,8 28030,4
26704,4 27498,5
Fibreboard of wood or other ligneous 799,3 4 423,1 4011,1 9897,4 18678,2 13188,1 14839,6 21581,7 25328,0 31666,2

52
materials 30383,8 Plywood, veneered panels and similar laminated wood 893,2 3 939,2 2943,8 4776,2 6762,4 2374,1 4437,3 6560,0 8904,0
7186,4 11401,5
Densified wood 258,1 446,2 122,9 1333,4 3131,8 2182,5 1930,2 2311,6 2201,8
1953,5 1633,3
Wooden frames 31,1 88,7 64,8 94,6 164,2 83,5 66,7 79,5 147,2
122,7 353,1
Packing cases, boxes, drums and similar packings, cable-drums, pallets of wood 367,3 282,8 386,9 414,7 472,7 172,5 151,4 633,0 1408,0
1055,9 1004,2
Casks, tubs and other coopers' products and parts thereof, of wood 116,0 545,3 361,6 117,2 124,8 92,5 160,8 386,3 405,3
442,9 300,7
Tools, tool bodies, tool handles, broom or brush bodies, of wood 23,3 21,1 3,4 4,4 32,5 9,3 30,3 22,6 19,5
30,8 19,8
Builders' joinery and carpentry of wood 1 654,1 3 640,1 2704,2 6765,7 7935,6 9645,1 7217,5 14218,4 14584,9
13708,1 18898,1
Tableware and kitchenware, of wood 16,8 61,8 61,7 162,9 190,6 156,4 243,9 272,1 415,8
415,4 409,6
Marquetry and inlaid wood; caskets, cases and other articles, of wood 7,0 40,4 69,0 244,0 174,4 107,8 200,1 289,4 398,7
373,9 470,6
Other articles of wood 269,2 1 034,7 340,8 418,4 5045,7 1015,2 703,2 1794,4 2480,4
1485,8 1386,9

53
Figure 23. Mobilized amounts in Forestry Sector
Don
or
Proj
ect
Impl
emen
ter
Proj
ect T
itle
Star
t Dat
e
End
Dat
e
Tota
l Pro
ject
Bu
dget
Tota
l Gra
nt fo
r G
eorg
ia
BMZ, ADA GIZ Sustainable Management of Biodiversity, South Caucasus
September 2011
November 2015
EUR 6,500,000
EUR 6,500,000
EU, ADA WB, WWF-Caucasus, IUCN
ENPI FLEG II 01-10-2013 31-12-2016 1910429 USD 1910429 USD
ADA
CENN Sustainable Forest Governance in Georgia: Strengthening Local and National Capacity and Developing Structured Dialogue
01.07.2012 01.07.2015 USD 602,206 USD 489,691
ENVSEC OSCE Enhancing National Capacity on Fire Management and Wildfire Disaster Risk Reduction in the South Caucasus
2014 2016 EUR 283,743 EUR 283,743
BMZ, ADA GIZ Sustainable Management of Biodiversity, South Caucasus
01-06-2008 01-11-2017 EUR 20597000
EUR 6865666
(ÖBF) AG, BFW
(ÖBF) AG, BFW
Adaptive Sustainable Forest Management Planning in Borjomi-Bakuriani Forest District
2013 2015 EUR 2,000 000
EUR 1.500 000
GIZ Environmental Information and Education Centre
Improvement of awareness and capacity for staff of National Forest Agency and Bachelors on forest inventory methodologies
29-08-2014 30-11-2014 33111 GEL 33111 GEL
FDA, KfW MENR Communal Forest Pilot Project
11.07.2003 10.11.2011 EUR 1.200000
EUR 1.200000

54
Kharagauli WB FSDC Establish sound
forest management systems that maximize the contribution of Georgia's forests to economic development and rural poverty reduction on an environmentally sustainable basis.
2002 2008 USD 21.000000
USD 21.00000074
Bibliography
74 16 million USD - World Bank, 5 million USD – Government of Georgia.

55
© FAO, 2016
C0181