Georgia Annual Health Status Measures...
47
Georgia Annual Health Georgia Annual Health Status Measures Status Measures 2013 2013 2013 2013 with time-series comparisons to the U.S. and Healthy People 2000 & 2010 objectives
Transcript of Georgia Annual Health Status Measures...

Georgia Annual Health Georgia Annual Health Status MeasuresStatus Measures
2013201320132013
with time-series comparisons to the U.S. and Healthy People 2000 & 2010 objectives

Leading Causes of Death*, GeorgiaNumber of Deaths 2007 2011Number of Deaths 2007-2011
79,005Disease of Heart
18,336
18,400
75,084
Unintentional Injuries
Stroke
Cancers
8,694
9,885
18,206
Diabetes
Alzheimer's Disease
Chronic Lower Respiratory Diseases (CLRD)
7 209
7,215
8,475
,
S ti i
Influenza & Pneumonia
Kidney Disease
7,209
0 10,000 20,000 30,000 40,000 50,000 60,000 70,000 80,000 90,000
Septicemia
Number of Deaths
* Method used is the National Centers for Health Statistics (NCHS), rankable causes of deaths applied to Georgia.
Source: Georgia Department of Public Health, Office of Health Indicators for Planning (OHIP), OASIS Dashboard http://oasis.state.ga.us

Leading Causes of Premature Deaths (before age 75), GeorgiaYears of Potential Life Lost 2007-2011Years of Potential Life Lost 2007 2011
543 639
664,516
Diseases of Heart
Cancers
193,385
487,590
543,639
Perinatal Period Conditions
Unintentional Injury (incl. MVA)
Diseases of Heart
106 416
133,985
149,419
Stroke
Homicide
Suicide
52,444
86,201
106,416
Kidney Disease
Birth Defects
Stroke
38,797
0 100,000 200,000 300,000 400,000 500,000 600,000 700,000
Influenza & Pneumonia
Years of Potential Life Lost
Source: Georgia Department of Public Health, Office of Health Indicators for Planning (OHIP), OASIS Dashboard. http://oasis.state.ga.us/
* Method used is the National Centers for Health Statistics (NCHS), rankable causes of deaths applied to Georgia.

Leading Actual Causes of Death*, Georgia
12,141Tobacco
2,348
10,196
Alcohol
Poor diet & physical inactivity
1,543
2,079
Toxic agents
Microbial agents
537
805
1,207
Sexual behavior
Firearms
Motor vehicle
470
537
0 2,000 4,000 6,000 8,000 10,000 12,000 14,000
Illicit drug use
Sexual behavior
Number of deaths
Source: Georgia Department of Public Health, Vital Records Death File, 2006 – Based on methodology by Foege and McGinnis.

Infant Mortality Rate, Total and by Race, Georgia, and U.S. Total, 1994-2011
16.015.1 14 8
20.0
hs
9.4 9 2 8 9
14.813.7 13.4
13.9 13.713.2
13.7 13.8 13.9
12.4 12.8 12.813.8
13.1
10.0
11.4
10.1
10 01,00
0 Li
ve B
irt
9.2 8.7 8.5 8.2 8.5 8.5 8.9 8.5 8.5 8.0 8.1 7.9 8.07.5
6.36.8
7.16.5 6.2 6.2 6.0 6.0 6.2 6.6 6.2 6.1 5 7 6.0 5.8
7.36.5
5 7 5.8
10.0
ant D
eath
s pe
r
5.3 5.7 5.8 5.7 5.8
0.01994 1995 1996 1997 1998 1999 2000 2001 2002 2003 2004 2005 2006 2007 2008 2009 2010 2011
Infa
1994 1995 1996 1997 1998 1999 2000 2001 2002 2003 2004 2005 2006 2007 2008 2009 2010 2011
Georgia White
Black or African-American U.S.
Healthy People 2010 objective = 4.5
Sources: Centers for Disease Control, Vital Statistics System, Mortality Data. September 14, 2009 http://www.cdc.gov/nchs/deaths.htm
Online Analytical Statistical Information System (OASIS) Georgia Department of Public Health, Office of Health Indicators for Planning (OHIP). http://oasis.state.ga.us/

Percentage of Live Births born Premature (<37 weeks), Total and by Race, Georgia, and U.S. Total, 1994-2011
17.016.5
16.015.5 15.5 15.2 15.4
16.4 16.3 16.7 16.7
18.1 18.5 18.4
15.5 15.8 15.5 15.3
20.0
ths
11.9 11.7 11.6 11.7 12.0 12.112.7 12.6
13.1 12.713.6
14.2 14.113.3
12.0 12.211.6
11 5 11 612.1 11.8 12.2
12.1
er 1
00 L
ive
Birt
9.4 9.5 9.4 9.6 9.810.5 10.6 10.9 10.9
11.510.9
11.6
9.910.5
9.4
10.0
atur
e B
irths
pe
0.0
Prem
a
1994 1995 1996 1997 1998 1999 2000 2001 2002 2003 2004 2005 2006 2007 2008 2009 2010 2011
Georgia White
Black or African-American U.S.
Healthy People 2010 objective = 7.6
Source: Online Analytical Statistical Information System (OASIS), Georgia Department Public Health, Office of Health Indicators for Planning (OHIP). http://oasis.state.ga.us/

Percentage1 of Live Births Weighing Less than 2,500 Grams (Low Birthweight), U.S. and Georgia, 1994-2011
15%
9 3% 9 4% 9.6% 9 5% 9.6% 9 5% 9.8% 9 4%
15%
8.6% 8.8% 8.5% 8.8% 8.6% 8.7% 8.6% 8.8% 9.0% 9.0% 9.3% 9.4% 9.6% 9.5% 9.6% 9.5% 9.4%
8.0% 7.9% 8.1% 8.2% 8.3% 8.2% 8.2% 8.2% 8.2%7.3% 7.3% 7.4% 7.5% 7.6% 7.6% 7.6% 7.7%
10%
erce
ntag
e
5%Pe
0%1994 1995 1996 1997 1998 1999 2000 2001 2002 2003 2004 2005 2006 2007 2008 2009 2010 2011
Healthy People 2010 Goal: Reduce Low Birthweight (<2,500g) Births to 5.0%y p g ( , g)Percentage Among All Georgia WomenHealthy People 2000 Goal: Reduce Low Birthweight (<2,500g) Births to 5.0%Percentage Among US Women
1 Formula = [Total Number of Live Births under 2,500 grams / Total Number of Live Births] * 100.For race-specific percentages, both the numerator and denominator are filtered by race.
Sources: Centers for Disease Control & Prevention, CDC WONDER-DATA2010, http://wonder.cdc.gov/data2010/Online Analytical Statistical Information System (OASIS), Georgia Department Public Health, Office of Health Indicators for Planning (OHIP). http://oasis.state.ga.us/

Percentage1 of Live Births Weighing Less than 2,500 Grams(Low Birthweight) by Race, Georgia, 1994-2011
15%
12.8% 13.1%12.7% 13.0% 12.7% 12.8% 12.6% 12.9%
13.3% 13.1%13.9%
14.4% 14.4%14.0% 13.8% 13.7% 13.9%
13.5%
7.0% 7.1% 7.0% 7.1% 7.1%7.5% 7.5%
7.9%7.4%
6.8%6.7%6.6%6.7%6.4%6.6%6.4%6.5%6.3%
10%
Perc
enta
ge
5%
P
0%1994 1995 1996 1997 1998 1999 2000 2001 2002 2003 2004 2005 2006 2007 2008 2009 2010 2011
Healthy People 2010 Goal: Reduce Low Birthweight (<2500g) Births to 5 0%Healthy People 2010 Goal: Reduce Low Birthweight (<2500g) Births to 5.0%Percentage Among Georgia Black or African-American WomenPercentage Among Georgia White WomenHealthy People 2000 Goal: Reduce Low Birthweight (<2500g) Births to 5.0%
1 Formula = [Total Number of Live Births under 2,500 grams / Total Number of Live Births] * 100.For race-specific percentages, both the numerator and denominator are filtered by race.
Source: Online Analytical Statistical Information System (OASIS), Georgia Department Public Health, Office of Health Indicators for Planning (OHIP). http://oasis.state.ga.us/

Percentage1 of Live Births Weighing Less than 1,500 Grams(Very Low Birthweight), U.S. and Georgia, 1994-2011
3 0%
2.5%
3.0%
1.7% 1.7% 1.7%1.8% 1.8%
1.7%1.8%
1.7% 1.7%1.8% 1.8% 1.8% 1.8% 1.8% 1.8% 1.8%
1.9%1.8%
1 5% 1 5% 1.5% 1.5% 1.5% 1.5% 1 5% 1 5% 1 5%1 4%1 4%1 5%1 5%1 4%
1.5%
2.0%
erce
ntag
e
1.5% 1.5% 1.5% 1.5% 1.5%1.4%1.4%1.5%1.5%1.4%1.4%1.4%1.3%
0.5%
1.0%
Pe
0.0%1994 1995 1996 1997 1998 1999 2000 2001 2002 2003 2004 2005 2006 2007 2008 2009 2010 2011
Percentage Among All Georgia WomenPercentage Among All Georgia WomenPercentage Among US WomenHealthy People 2010 Goal: Reduce Very Low Birthweight (<1500g) Births to 0.9%Healthy People 2000 Goal: Reduce Very Low Birthweight (<1500g) Births to 1%
1Formula = [Total Number of Live Births under 2,500 grams / Total Number of Live Births] * 100.
Sources: Centers for Disease Control & Prevention, CDC WONDER-DATA2010, http://wonder.cdc.gov/data2010/Online Analytical Statistical Information System (OASIS). Georgia Department of Public Health, Office of Health Indicators for Planning (OHIP). http://oasis.state.ga.us/

Percentage1 of Live Births Weighing Less than 1,500 Grams(Very Low Birthweight) by Race, Georgia, 1994-2011
3.0%3.1%
2.9%3.0% 3.0%
2.9%3.0%
2.9%3.0% 3.0%
3.1%3.3%
3.1%3.2%
3.0% 3.0% 3.0% 3.0%
3%
4%
2%
3%
cent
age
1.2% 1.2%1.1%
1.2%1.1%
1.3% 1.3%1.4%
1.2%1.1%1.1%1.1%1.1%1.1%
1.2%1.1%
1.0%1.1%
1%
Perc
0%1994 1995 1996 1997 1998 1999 2000 2001 2002 2003 2004 2005 2006 2007 2008 2009 2010 2011
Percentage Among Georgia Black or African-American Women
Percentage Among Georgia White Women
Healthy People 2010 Goal: Reduce Very Low Birthweight (<1500g) Births to 0.9%
1Formula = [Total Number of Live Births under 1,500 grams / Total Number of Live Births] * 100.For race-specific percentages, both the numerator and denominator are filtered by race.
Source: Online Analytical Statistical Information System (OASIS). Georgia Department of Public Health, Office of Health Indicators for Planning (OHIP). http://oasis.state.ga.us/

Age-Specific Pregnancy1 Rate2, Females 10-14 Years of Age,Total and by Race, Georgia, 1994-2010
9.0
8.2
6.88.0
10.0
,000
6.0
5.24.6
4.2 4.23.9 3.8
6.0
fic R
ate
Per 1
,
3.33.0 2.9 3.0
2.62.9
2.2 2.0 2.0
3.32.9
2.6 2.42.1 2.2
1.8 1.6 1.7 1.7 1.5 1.61.3 1.2 1.12.0
4.0
Age
-Spe
cif
1.3 1.5 1.4 1.3 1.1 1.20.9 1.1
0.8 0.9 0.9 0.8 0.80.4 0.5 0.4
0.90.0
1994 1995 1996 1997 1998 1999 2000 2001 2002 2003 2004 2005 2006 2007 2008 2009 2010
White Georgia Females 10-14 Years of Age [Age-Specific Rate Per 1,000]Black or African-American Georgia Females 10-14 Years of Age [Age-Specific Rate Per 1,000]All Georgia Females 10-14 Years of Age [Age-Specific Rate Per 1,000]
1Pregnancies include conceptions that result in one or more Live Births, all Fetal Deaths and Induced Terminations.2The total number of pregnancies occurring to females in specified age group per 1,000 females in the specified age group. Formula = [Total number of pregnancies in age group / Total females in age group] * 1,000. For race-specific percentages, both the numerator and denominator are filtered by race.
Source: Online Analytical Statistical Information System (OASIS). Georgia Department of Public Health, Office of Health Indicators for Planning (OHIP). http://oasis.state.ga.us/

Age-Specific Pregnancy1 Rate2, Females 15-17 Years of Age, U.S. and Georgia, 1994-2010
100 0
74.570.7
66.662 5
75.0
100.0
1,00
0
62.559.6
55.9 53.546.9 44.4 42.7 41.5 40.2
60.062.767.768.3
46 850.3
53.550.0
cific
Rat
e Pe
r
40.3 39.336.4 37.2 36.9 34.9
30.8 28.0
42.444.046.8
25.0
Age
-Spe
c
0.01994 1995 1996 1997 1998 1999 2000 2001 2002 2003 2004 2005 2006 2007 2008 2009 2010
All Georgia Females 15-17 Years of Age [Age-Specific Rate Per 1,000]US Females 15-17 Years of Age [Age-Specific Rate Per 1 000]US Females 15 17 Years of Age [Age Specific Rate Per 1,000] Healthy People 2010: Reduce Pregnancies Among Teens 15-17 to 43 per 1,000Healthy People 2000: Reduce Pregnancies Among Females Age 15-17 to No More Than 50 per 1,000
1P i i l d ti th t lt i Li Bi th ll F t l D th d I d d T i ti1Pregnancies include conceptions that result in one or more Live Births, all Fetal Deaths and Induced Terminations.2The total number of pregnancies occurring to females in specified age group per 1,000 females in the specified age group. Formula = [Total number of pregnancies in age group / Total females in age group] * 1,000.
Sources: Ventura SJ, Abma JC, Mosher WD, Henshaw SK. Estimated Pregnancy Rates for the United States, 1990–2005: An Update . National vital statistics reports; vol 58 no 4. Hyattsville, MD: National Center for Health Statistics. October 2009. Online Analytical Statistical Information System (OASIS). Georgia Department of Public Health, Office of Health Indicators for Planning (OHIP). http://oasis.state.ga.us/

Age-Specific Pregnancy1 Rate2, Females 15-17 Years of Age, by Race Georgia 1994-2010by Race, Georgia, 1994 2010
103.9
95.2 92.2
110.0120.0
000
49.546.0 43 0
77.772.0
67.562.5 59.7
55.5 53.349.5 50.0 49.5 46.947.3
80.0
fic R
ate
Per 1
,0
43.0 40.7 39.1 36.7 35.4 34.2 33.0 32.4 29.9 30.8 30.0
20.5 18.4 16.2
40.8 38.140.0
Age
-Spe
cif
0.01994 1995 1996 1997 1998 1999 2000 2001 2002 2003 2004 2005 2006 2007 2008 2009 2010
White Georgia Females 15-17 Years of Age [Age-Specific Rate Per 1,000]
Black or African-American Georgia Females 15-17 Years of Age [Age-Specific Rate Per 1,000]
1Pregnancies include Conceptions that result in one or more Live Births, all Fetal Deaths and Induced Terminations.2The total number of pregnancies occurring to females in a specified age group per 1,000 females in the specified age group. Formula = [Total number of pregnancies in age group / Total females in age group] * 1,000. For race-specific percentages, both the numerator and denominator are filtered by race.
Source: Online Analytical Statistical Information System (OASIS). Georgia Department of Public Health, Office of Health Indicators for Planning (OHIP). http://oasis.state.ga.us/

Maternal Mortality, Total and by Race, Georgia, and U.S. Total, 1994-2011
70.0
80.0
Birt
hs
35 540 0
50.0
60.0
100,
000
Live
19.8
15 1
30.0
18.8
28.0
21.3
15.5 14 6 14 3
24.827.7
35.5
20 0
30.0
40.0
al D
eath
s pe
r
8.913.2
11.07.4
15.112.3
15.5 14.6 14.313.5
0.0
10.0
20.0
Mat
ern
1994 1995 1996 1997 1998 1999 2000 2001 2002 2003 2004 2005 2006 2007 2008 2009 2010 2011
Georgia GA - White
GA - Black or African-American U.S.G ac o ca e ca U S
Healthy People 2010 objective = 3.3
* Defined by ICD10 O code only.
Source: Online Analytical Statistical Information System (OASIS), Georgia Department Public Health, Office of Health Indicators for Planning (OHIP). http://oasis.state.ga.us/

Percentage of Adults 18 Years of Age and Older, who are Obese,U S and Georgia 1990-2010U.S. and Georgia, 1990 2010
27.7%
30.4%
27.8%
28.7%27.1%26.5%
24.7%25.2%23 5% 27 6%
30%
35%
13.7%15.8%
16.8%16.5%14.9%
19.2%
21.1% 21.5%22.7%23.5% 26.9% 27.6%
26.7%26.3%25.1%24.4%23.2%22.9%
22.1%21.0%20.1%19.7%
18.3%12 6%12.6%15%
20%
25%
Perc
enta
ge
10.8%9.5%
11.9%13.1% 13.3%
11.5%
14.4%11.6%
14.4%
12.6%12.6%
5%
10%
15%P
0%1990 1991 1992 1993 1994 1995 1996 1997 1998 1999 2000 2001 2002 2003 2004 2005 2006 2007 2008 2009 2010
Percentage Of Georgia Adults, 18 Years of Age and Older, Who Are Obese (BMI equal to or greater than 30.0)
HP 2010 Goal: Reduce Obesity (defined as BMI of 30 or greater) Among Adults, 20+ years of age to 15%
U.S. Percent of Adults, 18 Years of Age and Older Who Are Obese (BMI equal to or greater than 30)
Obesity is self-reported. Body Mass Index (BMI) is measured as weight in kilograms/height in meters
Source: Centers for Disease Control & Prevention, National Center for Chronic Disease Prevention and Health Promotion, Behavioral Risk Factor Surveillance System (BRFSS), http://www.cdc.gov/BRFSS/

Geographic Trends in ObesityGeographic Trends in Obesity
1993-1996 2004-20062000-20031997-1999 2007-2009
Percent of obese adults:
< 10% 10-14% 15%-19% 20-24% 25-29% 30%+
Source: Georgia BRFSS

Percentage of Adults 18 Years of Age and Older, who are Overweight,U.S. and Georgia, 1990-2010
37.6%40.1%
37.7%39.9% 40.4%
43.8%
36 4% 36 3% 36.9% 37.6%35 4%
36.7%37.9%
36.5%35 4% 35 4%40%
50%
34.8% 34.7%36.4%
34.6%36.3% 35.3%35.4%36.5%35.4%34.6% 35.4%
30%
40%
rcen
tage
10%
20%Per
0%1990 1991 1992 1993 1994 1995 1996 1997 1998 1999 2000 2001 2002 2003 2004 2005 2006 2007 2008 2009 2010
P Of G i Ad l 18 Y f A d Old Wh A O i h (BMI 25 0 29 9)Percentage Of Georgia Adults, 18 Years of Age and Older, Who Are Overweight (BMI 25.0 - 29.9)
HP 2000 Goal: Reduce Overweight (defined as BMI of 27.8 or greater) among Adults 20+ Years of Age to no more than 20%
U.S. Percentage of Adults, 18 Years of Age and Older, Who are Overweight (BMI 25.0 - 29.9)
Overweight is self-reported. Body Mass Index (BMI) is measured as weight in kilograms/height in meters
Source: Centers for Disease Control & Prevention, National Center for Chronic Disease Prevention and Health Promotion, Behavioral Risk Factor Surveillance System (BRFSS), http://www.cdc.gov/BRFSS/

Percentage of Adults 18 Years of Age and Older who have Diabetes,U S d G i 1990 2010U.S. and Georgia, 1990-2010
20%
8 3%9.1%
10.1% 9.9% 9.5% 9.7%10%
15%
enta
ge
4.9%5.6% 5.5%
3.7%4.3%
3.7% 4.1% 4.1%
5.9% 5.6%6.8% 6.9% 7.1%
7.8% 7.3%8.3%
5%
10%
Perc
e
0%1990 1991 1992 1993 1994 1995 1996 1997 1998 1999 2000 2001 2002 2003 2004 2005 2006 2007 2008 2009 2010
Healthy People 2010: Reduce the overall rate of diabetes that is clinically diagnosed no more than 25 per 1,000 people (2.5%)Percentage Georgia Adults 18+, Who Have Ever Been Told by a Doctor They Have Diabetes (self reported)Healthy People 2000 : Reduce diabetes to an incidence of no more than 25 per 1,000 people (2.5%)U.S.
Source: Centers for Disease Control & Prevention, National Center for Chronic Disease Prevention and Health Promotion, Behavioral Risk Factor Surveillance System (BRFSS), http://www.cdc.gov/BRFSS/

Age-Adjusted1 Diabetes Mortality Rates, U.S. and Georgia, 1994-2011
23 2 23.8 23.7 24.125.0 25.3 25.4 25.3
24.5 24.623 3
25.0
25 0
30.0
19.220.7
21.5 20.821.9
23.122.0
22.924.5
22.5 23.0
20.819.7
18 0 18.4
22.7 23.4
22.6 23.2 23.7 23.322.5 21.8
20.9
22.620.0
25.0
ted
Rat
e
18.0
10.0
15.0
Age
-Adj
ust
0.0
5.0
1994 1995 1996 1997 1998 1999 2000 2001 2002 2003 2004 2005 2006 2007 2008 2009 2010 2011
Georgia Age-Adjusted Diabetes Mortality Rate U.S. Age-Adjusted Diabetes Mortality Rate
1Age-Adjusted to the 2000 Standard Million.
Sources: Centers for Disease Control & Prevention, CDC WONDER, http://wonder.cdc.gov/Online Analytical Statistical Information System (OASIS). Georgia Department of Public Health, Office of Health Indicators for Planning (OHIP). http://oasis.state.ga.us/

Age-Adjusted1 Heart Attack Mortality Rates,U.S. and Georgia 1994-2011
250
300
202.3 196.3 189 6
224.5 219.7212.1
197.1 194.6186.7
177.8170.9
162.8
203.6
200
250
uste
d R
ate
189.6174.4 168.4 162.6
154.1 151.1141.8
129.9118.6
111 0
150.2 144.4135.0
126.0 122.7116.1
181.5
100
150
Age
-Adj
u
111.0101.5
93.2 91.1 86.3 84.1
50
100
1994 1995 1996 1997 1998 1999 2000 2001 2002 2003 2004 2005 2006 2007 2008 2009 2010 2011
Georgia Age-Adjusted Mortality Rate due to Obstructive Heart Disease including Heart Attack
U.S. Age Adjusted Mortality Rate due to Obstructive Heart Disease including Heart Attack
Healthy People 2010: Coronary Heart Disease 166 per 100,000 (age-adjusted)
1Age-Adjusted to the 2000 Standard Million. Obstructive Heart Disease including Heart Attack = ICD10 I20-I25 (ICD9 410-414, 429.2)
Sources: Centers for Disease Control & Prevention, CDC WONDER, http://wonder.cdc.gov/Online Analytical Statistical Information System (OASIS). Georgia Department of Public Health, Office of Health Indicators for Planning (OHIP). http://oasis.state.ga.us/

Age-Adjusted1 Stroke Mortality Rates,U S d G i 1994 2011U.S. and Georgia 1994-2011
150.0
72.8 73.5 74.569.0 70.0 72.9
67.9 66.4 65.360 6
72.6
100.0
djus
ted
Rat
e
60.654.7 52.7 49.9 49.1 46.6 44.8 42.262.6 63.1 62.5 61.1 61.6 60.8 57.9 56.2 53.5 50.0 46.6 43.6 42.2 40.7 38.9
59.350.0Age
-Ad
0.01994 1995 1996 1997 1998 1999 2000 2001 2002 2003 2004 2005 2006 2007 2008 2009 2010 2011
G SGeorgia Age-Adjusted Stroke Mortality Rate
U.S. Age-Adjusted Stroke Mortality Rate
1Age-Adjusted to the 2000 Standard Million. Stroke = ICD I60-I69 (ICD9 430-434, 436-438)
Sources: Centers for Disease Control & Prevention, CDC WONDER, http://wonder.cdc.gov/Online Analytical Statistical Information System (OASIS). Georgia Department of Public Health, Office of Health Indicators for Planning (OHIP). http://oasis.state.ga.us/

Age-Adjusted1 Cardiovascular Mortality Rates,U.S. and Georgia 1994-2011
411 9 411 3
500.0
411.9 411.3 405.8388.3 392.1 386.3
365.5 356.9 347.8327.0
309.5294 5
382.5 378.7 370.3 360.6349 3 339 7
396.5
352.0
400.0
ted
Rat
e
294.5280.7
267.8 262.6 252.1 242.5
349.3 339.7326.5 317.4 306.1
286.5 277.3261.2
249.9 243.5 234.8200 0
300.0
Age
-Adj
ust
100.0
200.0
1994 1995 1996 1997 1998 1999 2000 2001 2002 2003 2004 2005 2006 2007 2008 2009 2010 20111994 1995 1996 1997 1998 1999 2000 2001 2002 2003 2004 2005 2006 2007 2008 2009 2010 2011
Georgia Age-Adjusted Cardiovascular Mortality Rate
U.S. Age-Adjusted Cardiovascular Mortality Rate
1Age-Adjusted to the 2000 Standard Million. Cardiovascular = ICD10 I00-I78 (ICD9 390-434, 436-448)
Sources: Centers for Disease Control & Prevention, CDC WONDER, http://wonder.cdc.gov/Online Analytical Statistical Information System (OASIS). Georgia Department of Public Health, Office of Health Indicators for Planning (OHIP). http://oasis.state.ga.us/

Percentage of Adults, 18 Years of Age and Older Who Smoke, U S d G i 1990 2010U.S. and Georgia, 1990-2010
30%
21.8%22.4%
19.5%
22.1%22.8%
24.0% 23.2%23.7%23.5%23.7%23.6%22.8%23.9%
20%
25%
ntag
e
19.1%
20.5% 20.3% 20.0% 19.9%19.4%
17.7% 17.6%
15%
20%
Perc
en
10%1990 1991 1992 1993 1994 1995 1996 1997 1998 1999 2000 2001 2002 2003 2004 2005 2006 2007 2008 2009 20101990 1991 1992 1993 1994 1995 1996 1997 1998 1999 2000 2001 2002 2003 2004 2005 2006 2007 2008 2009 2010
Percentage of Georgia Adults 18+ Who SmokeHealthy People 2010 Goal: Reduce Tobacco Use by Adults, 18 Years of Age and Older to 12%Healthy People 2000 Goal: Reduce Cigarette Smoking by Adults, 18 Years of Age and Older to 15%Percentage of US Adults 18+ Who SmokePercentage of US Adults 18+ Who Smoke
Source: Centers for Disease Control & Prevention, National Center for Chronic Disease Prevention and Health Promotion, Behavioral Risk Factor Surveillance System (BRFSS), http://www.cdc.gov/BRFSS/

Age-Adjusted1 Lung Cancer Mortality Rates,U.S. and Georgia, 1994-2011
80.0
59.6
62.1 61.4 61.259.4 59.3 58 6
61.9
59.0
64.763.5
70.0
sted
Rat
e
58.656.3 55.7
54.5
51.4 51.5
48.7 48.2
57.9 57.5 57.155.3 54.9 54.1
53.2 52.651 5
55.5 56.1
58.458.6
50.0
60.0
Age
-Adj
us
51.550.6
49.548.4
40.01994 1995 1996 1997 1998 1999 2000 2001 2002 2003 2004 2005 2006 2007 2008 2009 2010 20111994 1995 1996 1997 1998 1999 2000 2001 2002 2003 2004 2005 2006 2007 2008 2009 2010 2011
Georgia Age-Adjusted Lung Cancer Mortality RateHealthy People 2010: Decrease the Rate of Lung Cancer to no More than 44.9 per 100,000 (age adjusted rate).U.S. Age-Adjusted Lung Cancer Mortality Rate Healthy People 2000: Decrease the Rate of Lung Cancer to no More than 42 per 100,000 (age adjusted rate).
1Age-Adjusted to the 2000 Standard Million.
Sources: Centers for Disease Control & Prevention, CDC WONDER, http://wonder.cdc.gov/Online Analytical Statistical Information System (OASIS). Georgia Department of Public Health, Office of Health Indicators for Planning (OHIP). http://oasis.state.ga.us/

Percentage of Middle and High School Students Who Smoke,1 g gU.S. and Georgia, 1993-2009
50%
30.5%
34.8%36.4%
34.8%
28.5%30%
40%
tage
24.3% 24.0%20.9%
17.2%18.6%
16.9% 17.0%
21.9% 23.0%20.0% 19.5%
18.1%20%Perc
ent
9.0% 9.4%7.1% 6.4% 5.3% 6.4%
0%
10%
1993 1995 1997 1999 2001 2003 2005 2007 2009 2011
Georgia Middle School (6th - 8th grades)Georgia High School (9th - 12th grades)Healthy People 2010: Reduce Cigarette Use by Adolescents (grades 9-12) to 16%U it d St t (9th 12th d )United States (9th - 12th grades)
1Sources: Georgia Youth Risk Behavior Survey (YRBS) Centers for Disease Control & Prevention, Youth Risk Behavior Survey, Trends in the Prevalence of Tobacco Use, National YRBS 1993-2011

Percentage of Adults 65 Years of Age and Older, Ever Vaccinated f P l Di G i 1995 2010for Pneumococcal Disease, Georgia, 1995-2010
80%
100%
60.2%57 9% 57 3%
60.5% 59.4%62.5% 63.1% 63.6% 63.4% 64.4%65.2%
68.8%68.5%66.9%67.2%66.8%65.7%64.6%64.5%63.0%
61.3%
55.0%50.0%60%
80%
tage
48.5% 50.4% 49.7%
57.9% 57.3% 59 %
37.8%40%Pe
rcen
0%
20%
0%1995 1996 1997 1998 1999 2000 2001 2002 2003 2004 2005 2006 2007 2008 2009 2010
Percent of Georgia Adults 65+ who have ever been Vaccinated for Pneumococcal DiseaseHealthy People 2010 Goal: Increase Proportion Adults 65+ Ever Vaccinated for Pneumococcal Disease to 90% Healthy People 2000 Goal: Increase Proportion Adults 65+ Ever Vaccinated for Pneumococcal Disease to 60%Percent of US Adults 65+ who have ever been Vaccisnated for Pneumococcal Disease
Source: Centers for Disease Control & Prevention, National Center for Chronic Disease Prevention and Health Promotion, Behavioral Risk Factor Surveillance System (BRFSS), http://www.cdc.gov/BRFSS/

Age-Adjusted1 Pneumonia Mortality Rates, U.S. and Georgia, 1994-20101U.S. and Georgia, 1994 20101
38.436.6 37.3 37.0 37.940.0
45.0
50.0
24.2
28.425.5
23.2 22.7
33.1 33.2 32.6 33.0 33.923.1
22.925 0
30.0
35.0
uste
d R
ate
20.419.1 19.4 18.6
17.4 17.221.9 22.4 21.419.4 19.7
17.516.1 16.4 15.3
22.9
18.115.0
20.0
25.0
Age
-Adj
u
0.0
5.0
10.0
1994 1995 1996 1997 1998 1999 2000 2001 2002 2003 2004 2005 2006 2007 2008 2009 2010 2011
1999 change from ICD-9to ICD-10
Coding of mortality data
1994 1995 1996 1997 1998 1999 2000 2001 2002 2003 2004 2005 2006 2007 2008 2009 2010 2011
Georgia Age-Adjusted Mortality Rate U.S. Age-Adjusted Mortality Rate
1Age-Adjusted to the 2000 Standard Million.
Sources: Centers for Disease Control & Prevention, CDC WONDER, http://wonder.cdc.gov/Online Analytical Statistical Information System (OASIS). Georgia Department of Public Health, Office of Health Indicators for Planning (OHIP). http://oasis.state.ga.us/

Percentage of Adults 65+ Years of Age, Who Have Received a Flu Vaccination within the Past 12 Months,
U.S. and Georgia, 1997-2010100%
67 6%
80%
ge
61.8%
66.6%65.2%
47.0%
58.5%
63.1%
57.0%
63.6% 62.2%59.3%
67.0%64.4%
60.8%64.8%
67.6%
60%
Perc
enta
g
40%
20%1995 1996 1997 1998 1999 2000 2001 2002 2003 2004 2005 2006 2007 2008 2009 2010
Percentage of Georgia Adults 65+ Who Have Received a Flu Vaccination Within the Past 12 MonthsHealthy People 2010 Goal: Increase Proportion of Adults 65 + Vaccinated Annually Against Influenza to 90% Healthy People 2000 Goal: Increase Proportion of Adults 65 + Vaccinated Annually Against Influenza to 60% P t f US Ad lt 65+ Wh H R i d Fl V i ti Withi th P t 12 M thPercentage of US Adults 65+ Who Have Received a Flue Vaccination Within the Past 12 Months
Source: Centers for Disease Control & Prevention, National Center for Chronic Disease Prevention and Health Promotion, Behavioral Risk Factor Surveillance System (BRFSS), http://www.cdc.gov/BRFSS/

Age-Specific Influenza Mortality Rate, Adults 65+ Years of Age,U S d G i 1994 2011U.S. and Georgia, 1994-2011
7.0
8.0
4.5 3.9
4.44.85.0
6.0
00,0
00
3.3
2.6
3.6
4.1
3.53.93.6
3.2
2 52.0
3.0
4.0
Rat
e pe
r 1
*
0.7
1.4 1.5
1.00.6
1.01.7
0.6
1.6
2.4
1.2
0.8
1.3
2.51.7
0.5
1.91.6
1.0
2.0
* *
*
0.01994 1995 1996 1997 1998 1999 2000 2001 2002 2003 2004 2005 2006 2007 2008 2009 2010 2011
Georgia Age-Specific Flu Mortality Rate U.S. Age-Specific Flu Mortality Rate
*GA rate not displayed due to < 5 events
Sources: Centers for Disease Control & Prevention, CDC WONDER, http://wonder.cdc.gov/Online Analytical Statistical Information System (OASIS). Georgia Department of Public Health, Office of Health Indicators for Planning (OHIP). http://oasis.state.ga.us/

Percentage of Women 40 Years of Age and Older, Who Have Received a M Withi th L t T Y U S d G i 1993 2010Mammogram Within the Last Two Years, U.S. and Georgia, 1993-2010
100%
67.2% 65.8%
71.5% 72.7% 72.9%70.2%
72.4%76.1% 75.5% 74.5%
78.6% 78.9% 77.2%80%
ge
60%
Perc
enta
g
40%
20%1993 1994 1995 1996 1997 1998 1999 2000 2001 2002 2003 2004 2005 2006 2007 2008 2009 2010
Percentage of Georgia Women 40 +, Who Have Had a Mammogram Within the Last Two YearsHealthy People 2010 Goal: Increase Proportion of Women Aged 40 Years and Older Receiving Mammogram w/in Past 2 Years to 70%Healthy People 2000 Goal: Increase Proportion of Women Aged 50 Years and Older Receiving Mammogram w/in Past 2 Years to 60%y p p g g gU.S.
Source: Georgia Department of Community Health, Division of Public Health, Georgia Behavioral Risk Factor Surveillance System (BRFSS)

Age-Adjusted1 Breast Cancer Mortality Rates,U S and Georgia Women by Race 1991 2011U.S. and Georgia Women by Race, 1991-2011
36.837.5 37.340.0
45.0
29.8
34.4
29.931.5 31.3
27.8
30.028.6 29.0 29.329.1
30.3
32.633.6 33.2
2 1
30.0
35.0
sted
Rat
e
27.8
23.4 23.421.6
20.4
21.1
25.1
20.721.7
23.824.024.323.9
26.0 26.0 26.124.4
20.0
25.0
Age
-Adj
u
19.4
10.0
15.0
1994 1995 1996 1997 1998 1999 2000 2001 2002 2003 2004 2005 2006 2007 2008 2009 2010
Georgia Age-Adjusted Mortality Rate Black Women U.S. Age-Adjusted Mortality Rate Black Women Georgia Age-Adjusted Mortality Rate White WomenU.S. Age-Adjusted Mortality Rate White Women
1Age-Adjusted to the 2000 Standard Million.
Sources: Centers for Disease Control & Prevention, CDC WONDER, http://wonder.cdc.gov/Online Analytical Statistical Information System (OASIS). Georgia Department of Public Health, Office of Health Indicators for Planning (OHIP). http://oasis.state.ga.us/

Percentage of Women 18 Years of Age and Older, who had a Pap S ithi th L t Th Y U S d G i 1992 2010Smear within the Last Three Years, U.S. and Georgia, 1992-2010
100%
90%
age
80%
Perc
enta
70%1992 1993 1994 1995 1996 1997 1998 1999 2000 2001 2002 2003 2004 2005 2006 2007 2008 2009 2010
Percentage Of Georgia Women 18+ Who Have Had a Pap Smear Within the Last Three YearsHealthy People 2010 Goal: Increase Proportion of Women 18+ Who Receive Pap Testing within Last 3 Years to 90%Healthy People 2000 Goal: Increase Proportion of Women 18+ Who Receive Pap Testing within Last 3 Years to 85%U.S.
Source: Georgia Department of Community Health, Division of Public Health, Georgia Behavioral Risk Factor Surveillance System (BRFSS)

Age-Adjusted1 Cervical Cancer Mortality Rates,U.S. and Georgia Women, 1994-2011
6.0
3.3
3.7
3.3 3.43.2 3.2
2 83.0 2.9 2.9
4.0
ted
Rat
e
2.7 2.8 2.7 2.6 2.6 2.7 2.6 2.6 2.5
2.0Age
-Adj
us
0.01994 1995 1996 1997 1998 1999 2000 2001 2002 2003 2004 2005 2006 2007 2008 2009 2010 2011
Georgia Age-Adjusted Mortality Rate U.S. Age-Adjusted Mortality Rate
1Age-Adjusted to the 2000 Standard Million.
Sources: Centers for Disease Control & Prevention, CDC WONDER, http://wonder.cdc.gov/Online Analytical Statistical Information System (OASIS). Georgia Department of Public Health, Office of Health Indicators for Planning (OHIP). http://oasis.state.ga.us/

Age-Adjusted Suicide Mortality Rates,1
U S and Georgia 1994-2011U.S. and Georgia, 1994-201120.0
12.0 11.7 11.7 12.010.7 11.0 10.6
11.2 11.0 11.5 11.210.2 9.9
10.6 10.311.6 11.2 11.5
10.0
Adj
uste
d R
ate
Age
-A
0.01994 1995 1996 1997 1998 1999 2000 2001 2002 2003 2004 2005 2006 2007 2008 2009 2010 2011
Georgia Age-Adjusted Suicide Mortality Rate
Healthy People 2010: 5 0 per 100 000 (Age Adjusted Rate)Healthy People 2010: 5.0 per 100,000 (Age-Adjusted Rate)
U.S. Age-Adjusted Suicide Mortality Rate
1Age-Adjusted to the 2000 Standard Million. Suicide = ICD10 X60-X84, Y87.0 (ICD9 E950-E959)
Sources: Centers for Disease Control & Prevention, CDC WISQARS, http://www.cdc.gov/injury/wisqars/Online Analytical Statistical Information System (OASIS). Georgia Department of Public Health, Office of Health Indicators for Planning (OHIP). http://oasis.state.ga.us/

Age-Adjusted Homicide Mortality Rates,1
U S d G i 1994 2011U.S. and Georgia, 1994-201120.0
10.7
9.5 9.310 0uste
d R
ate
8.0 8.07.3 7.7 7.7 7.6
8.27.3 7.0 7.0
7.97.2
6.5 6.3 6.29.0
8.37.5
7.06.4 6.1 6.0
7.16.1 6.1 5.9 6.1 6.2 6.1 5.9 5 5
10.0
Age
-Adj
u
5.5
0.01994 1995 1996 1997 1998 1999 2000 2001 2002 2003 2004 2005 2006 2007 2008 2009 2010 20111994 1995 1996 1997 1998 1999 2000 2001 2002 2003 2004 2005 2006 2007 2008 2009 2010 2011
Georgia Age-Adjusted Homicide Mortality Rate Healthy People 2010: 3.0 per 100,000 (Age-Adjusted Rate)U.S. Age-Adjusted Homicide Mortality Rate
1Age-Adjusted to the 2000 Standard Million. Homicide = ICD10 X85-Y09, Y87.1 (ICD9 E960-E969)
Sources: Centers for Disease Control & Prevention, CDC WISQARS, http://www.cdc.gov/injury/wisqars/Online Analytical Statistical Information System (OASIS). Georgia Department of Public Health, Office of Health Indicators for Planning (OHIP). http://oasis.state.ga.us/

Age-Adjusted Motor Vehicle Crash Mortality Rates,1
U S and Georgia 1994-2011U.S. and Georgia, 1994-2011
40.0
50.0
21 0 21 2 21 3 21 1 21 0
30.0
uste
d R
ate
1999 change from ICD-9to ICD-10
Coding of mortality data
21.0 21.2 21.3 21.1 21.0
16.1 16.218.3 17.8
16.3 17.3 17.8 18.4 18.015.5
13.2 12.7 12.716.2 16.3 16.2 16.0 15.8 15.3 15.5 15.4 15.8 15.4 15.3 15.2 15.0 14.5
12.910 0
20.0
Age
-Adj
12.911.7
0.0
10.0
1994 1995 1996 1997 1998 1999 2000 2001 2002 2003 2004 2005 2006 2007 2008 2009 2010 2011
Georgia Age-Adjusted Mortality RateHealthy People 2010: Reduce the Number of Deaths Caused by Crashes to 9.2 (Age-Adjusted Rate)U.S. Age-Adjusted Mortality Rate (CDC WISQARS)
1Age-Adjusted to the 2000 Standard Million.
Sources: Centers for Disease Control & Prevention, CDC WISQARS, http://www.cdc.gov/injury/wisqars/Online Analytical Statistical Information System (OASIS). Georgia Department of Public Health, Office of Health Indicators for Planning (OHIP). http://oasis.state.ga.us/

Rate of Newly Diagnosed Cases of Congenital Syphilis, Georgia 1986 2011Georgia, 1986-2011
200.0
123.3133.4150.0
Live
Birt
hs
95.088.7
57.7 61.5
100.0
e pe
r 100
,000
1990 Mandated State Reporting Began
290-5-21
4.1 6.8 7.612.7
31.6
19.512.3 14.2 15.9 17.2
11.3 8.1 4.3 1.4 6.1 6.6 7.5 9.9 13.53.8
0 0
50.0Rat
e
0.0
1986
1987
1988
1989
1990
1991
1992
1993
1994
1995
1996
1997
1998
1999
2000
2001
2002
2003
2004
2005
2006
2007
2008
2009
2010
2011
Congenital Syphilis Rate [Rate per 100,000 Live Births]Healthy People 2010: Reduce Congenital Syphilis to 1 per 100,000 Live Births
Source: Georgia Department of Public Health

Rate of Newly Diagnosed Cases of Gonorrhea Georgia 1980 2011*Georgia, 1980-2011*
931.2896.2
800 0
1,000.0
823.1 815.9
644.9
756.4
653.1
597.9
677.6682.4
750.1734.3
600.0
800.0
00 P
opul
atio
n
292 5
371.9
451.2475.6
400.0
Rat
e pe
r 100
,00
*
159.6161.3143.0170.1
191.3176.0220.2
265.2260.7246.7270.1
292.5243.4
219.6 222.8183.2
205.1
0.0
200.0
0 1 2 3 4 5 6 7 8 9 0 1 2 3 4 5 6 7 8 9 0 1 2 3 4 5 6 7 8 9 0 1
R
1980
1981
1982
1983
1984
1985
1986
1987
1988
1989
1990
1991
1992
1993
1994
1995
1996
1997
1998
1999
2000
2001
2002
2003
2004
2005
2006
2007
2008
2009
2010
2011
Healthy People 2010: Decrease the incidence of Gonorrhea to 19 per 100,000
Georgia Gonorrhea Rate per 100,000 Population
*Note: Data for 1994 are not available, rates presented are estimates.
Source: Georgia Department of Public Health

Rate of Newly Diagnosed AIDS Cases, Georgia, 1981-2008
31.1 31.6 32.230.9
35.0
24.9
28.4 28.4
20 0
21.525.0
30.0
pula
tion
11.8
16.0
19.020.0
17.916.1 15.4
14.4
16.6
19.2
11.011.912.415.0
20.0
er 1
00,0
00 P
op
0 2 0 3 0.82.0
4.1
7.1
9.5
5.0
10.0
Rat
e pe
0.2 0.3
0.0
AIDS Incidence Rate per 100,000 PopulationHealthy People 2010: Decrease the incidence of AIDS Among Adolescents and Adults (13 and Over) to 1 per 100,000
NOTE: Mandated reporting began in 1985
Source: Georgia Department of Community Health, Division of Public Health, AIDS Surveillance Program

Age-Adjusted1 Mortality Rate HIV/AIDS, U S d G i 1994 2011U.S. and Georgia, 1994-2011
19.1
20.6
20 0
25.0
16.2
16.116.015.0
20.0
sted
Rat
e
9.38.5
9.4 8.8 8.4 8.2 7.7 7.97.2 7.4 7.2
5.2 5.5 4.94 3
11.510.0
Age
-Adj
us
4.3
3.3 3.03.74.04.24.54.74.95.05.25.34.9
6.0
0.0
5.0
1994 1995 1996 1997 1998 1999 2000 2001 2002 2003 2004 2005 2006 2007 2008 2009 2010 20111994 1995 1996 1997 1998 1999 2000 2001 2002 2003 2004 2005 2006 2007 2008 2009 2010 2011
Georgia Age-Adjusted HIV/AIDS Mortality RateU.S. Age-Adjusted HIV/AIDS Mortality RateHealthy People 2010 Goal: 0.7 per 100,000
1Age-Adjusted to the 2000 Standard Million. HIV/AIDS = ICD10 B20.0-B24 (ICD9 042-044)
Sources: Centers for Disease Control & Prevention, CDC WONDER, http://wonder.cdc.gov/Online Analytical Statistical Information System (OASIS). Georgia Department of Public Health, Office of Health Indicators for Planning (OHIP). http://oasis.state.ga.us/

Immunization Coverage 4:3:1:3:3 Series, Among Children 19-35 Months of Age U S and Georgia 1999 2009Months of Age, U.S. and Georgia, 1999-2009
90 0
100.0
e
77.9 77.7 78.580.4
84.7 84.783.3
80.8
80.9 80.8 80.5 80.1
79.4
80.0
90.0
ren
Up-
To-D
ate
71.0
73.2 72.8 73.774.8
71.972.7
76.678.2
70.0
rcen
t of C
hild
r
50.0
60.0Per
50.01999 2000 2001 2002 2003 2004 2005 2006 2007 2008 2009
Georgia U.S.
Source: Centers for Disease Control & Prevention, National Immunization Survey, http://www.cdc.gov/vaccines/stats-surv/imz-coverage.htm#nis
Vaccine DTaP Polio MMR HIB Hep. B Recommended Doses 4 3 1 3 3
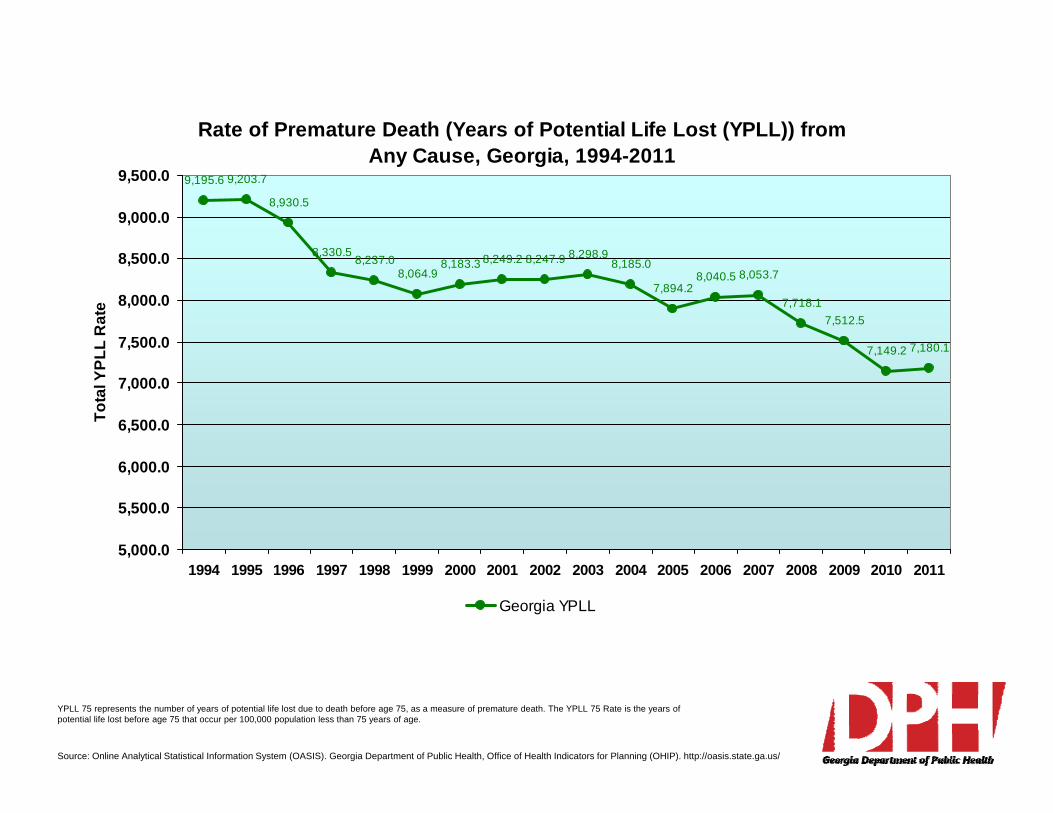
Rate of Premature Death (Years of Potential Life Lost (YPLL)) from A C G i 1994 2011Any Cause, Georgia, 1994-2011
9,195.6 9,203.7
8,930.5
8 330 5 8 298 98 500 0
9,000.0
9,500.0
8,330.58,237.0
8,064.98,183.3 8,249.2 8,247.9 8,298.9
8,185.0
7,894.28,040.5 8,053.7
7,718.17,512.5
7,149.2 7,180.17,500.0
8,000.0
8,500.0
LL R
ate
,
6,500.0
7,000.0
Tota
l YPL
5,000.0
5,500.0
6,000.0
1994 1995 1996 1997 1998 1999 2000 2001 2002 2003 2004 2005 2006 2007 2008 2009 2010 2011
Georgia YPLL
YPLL 75 represents the number of years of potential life lost due to death before age 75, as a measure of premature death. The YPLL 75 Rate is the years of potential life lost before age 75 that occur per 100,000 population less than 75 years of age.
Source: Online Analytical Statistical Information System (OASIS). Georgia Department of Public Health, Office of Health Indicators for Planning (OHIP). http://oasis.state.ga.us/

Rate of Premature Death (Years of Potential Life Lost (YPLL)) from Lung Cancer Georgia 1994 2011Lung Cancer, Georgia, 1994-2011
453.8 459.6 453.0440.2 440.2
450.0
500.0
407.9426.3 421.6 428.8
413.7 417.0403.5 402.4
388.5
362.8380.8
371.1354.3
300 0
350.0
400.0
Rat
e
200.0
250.0
300.0
YPLL
100.0
150.0
200.0
1994 1995 1996 1997 1998 1999 2000 2001 2002 2003 2004 2005 2006 2007 2008 2009 2010 2011
Georgia YPLL Rate - Lung Cancer
YPLL 75 represents the number of years of potential life lost due to death before age 75, as a measure of premature death. The YPLL 75 Rate is the years of potential life lost before age 75 that occur per 100,000 population less than 75 years of age.
Source: Online Analytical Statistical Information System (OASIS). Georgia Department of Public Health, Office of Health Indicators for Planning (OHIP). http://oasis.state.ga.us/

Rate of Years of Potential Life Lost (YPLL) from Motor Vehicle Crashes, Georgia 1994 2011Georgia, 1994-2011
771.5
814.3844.8
799.0
758.9
678 6
800.0
900.0
588.1 582.9
676.0 658.9
602.2 603.4630.5
678.6 674.9
538.6600.0
700.0
Rat
e
431.4 420.1 427.7
300 0
400.0
500.0
YPLL
100.0
200.0
300.0
1994 1995 1996 1997 1998 1999 2000 2001 2002 2003 2004 2005 2006 2007 2008 2009 2010 2011
Georgia YPLL Rate - Motor Vehicle Crashes
YPLL 75 represents the number of years of potential life lost due to death before age 75, as a measure of premature death. The YPLL 75 Rate is the years of potential life lost before age 75 that occur per 100,000 population less than 75 years of age.
Source: Online Analytical Statistical Information System (OASIS). Georgia Department of Public Health, Office of Health Indicators for Planning (OHIP). http://oasis.state.ga.us/

Rate of Premature Death (Years of Potential Life Lost (YPLL)) from Ob t ti H t Di (H t Att k) d St k G i 1994 2011Obstructive Heart Disease (Heart Attack) and Stroke, Georgia, 1994-2011
1,139.71,149.31,169.6
1,092.91,075.31 100 0
1,200.0
1,300.0
,1,034.7
1,010.1980.5
947.8 954.9
903.8
842.4 837.3808 3
900.0
1,000.0
1,100.0
Rat
e
808.3761.1
784.7735.2
700.9
700.0
800.0
YPLL
400.0
500.0
600.0
1994 1995 1996 1997 1998 1999 2000 2001 2002 2003 2004 2005 2006 2007 2008 2009 2010 2011
Georgia YPLL Rate - Heart Attack and Stroke
YPLL 75 represents the number of years of potential life lost due to death before age 75, as a measure of premature death. The YPLL 75 Rate is the years of potential life lost before age 75 that occur per 100,000 population less than 75 years of age.
Source: Online Analytical Statistical Information System (OASIS). Georgia Department of Public Health, Office of Health Indicators for Planning (OHIP). http://oasis.state.ga.us/

Rate of Premature Death (Years of Potential Life Lost (YPLL)) from C diti t i t d ith L Bi th W i ht d P t it *Conditions most associated with Low Birth Weight and Prematurity*,
Georgia, 1994-2011
621 1600 0
650.0
621.1
547.0559.5
528.3506.7 513.2
564.0543.2
561.6 570.3 572.1
512.6
556.6
497.6 489 0
500.0
550.0
600.0
e 497.6 489.0
446.3
350.0
400.0
450.0
YPLL
Rat
e
321.7
356.8
250.0
300.0
350.0
200.01994 1995 1996 1997 1998 1999 2000 2001 2002 2003 2004 2005 2006 2007 2008 2009 2010 2011
Georgia YPLL Rate - Fetal and Infant Conditions
YPLL 75 represents the number of years of potential life lost due to death before age 75, as a measure of premature death. The YPLL 75 Rate is the years of potential life lost before age 75 that occur per 100,000 population less than 75 years of age. * Certain Conditions Originating in the Perinatal Period . ICD10 P00.0 - P96.9
Source: Online Analytical Statistical Information System (OASIS). Georgia Department of Public Health, Office of Health Indicators for Planning (OHIP). http://oasis.state.ga.us/

Prepared by the Office of Health Indicators for Planning (OHIP),Prepared by the Office of Health Indicators for Planning (OHIP),Georgia Department of Public Health.
Many health indicators used in this report reside in the Department’s Health Information Repository, Many health indicators used in this report reside in the Department s Health Information Repository, and can be accessed online via the Online Analytical Statistical Information System (OASIS):
http://oasis.state.ga.us
Please direct questions to (404) 657-2854 or [email protected]
Healthy People 2010 information can be found online at http://www.healthypeople.gov
Updated 1.30.13 with Intercensal Population Estimates