
Georgia 6th District Runoff Statistical Analysis
72
Georgia 6th District Runoff Statistical Analysis October 16, 2017 Author: Garland Favorito By VoterGA This document provides a Statistical Analysis of the 6th District Runoff Election results that generated national skepticism when they were published on June 20th, 2017. Its purpose is to assess the accuracy of the reported Runoff results using intrinsic techniques that are widely accepted by election forensics analysts throughout the country. Those techniques reveal several disparities between verifiable and unverifiable vote counts that are unprecedented in the history of electronic vote count monitoring. The study considers whether or not the reported results may have been electronically altered in a manner that would explain those disparities.
Transcript of Georgia 6th District Runoff Statistical Analysis
Georgia 6th District Runoff Statistical Analysis
O c t o b e r 1 6 , 2 0 1 7
A u t h o r : G a r l a n d F a v o r i t o
By VoterGA
This document provides a Statistical Analysis of the 6th
District Runoff Election results that generated national
skepticism when they were published on June 20th, 2017.
Its purpose is to assess the accuracy of the reported Runoff
results using intrinsic techniques that are widely accepted
by election forensics analysts throughout the country.
Those techniques reveal several disparities between
verifiable and unverifiable vote counts that are
unprecedented in the history of electronic vote count
monitoring. The study considers whether or not the
reported results may have been electronically altered in a
manner that would explain those disparities.

VoterGA GA6 Runoff Election
Statistical Analysis
Page 1 of 71
Table of Contents ABOUT THE AUTHOR ..................................................................................................................................... 3
INTRODUCTION ............................................................................................................................................. 4
GEORGIA ELECTION BACKGROUND .............................................................................................................. 5
Georgia Election Equipment ..................................................................................................................... 5
Georgia Election Procedures ..................................................................................................................... 6
GA6 April 18 Special Election Background ................................................................................................ 7
GA6 June 20 Special Runoff Election Background .................................................................................... 9
Pre-Election Integrity Concerns .............................................................................................................. 12
Center for Election Systems (CES) Vulnerabilities .................................................................................. 14
RUNOFF ELECTION STATISTICS ................................................................................................................... 15
Overall GA6 Results Analysis ................................................................................................................... 15
Results by Voting Type ............................................................................................................................ 16
Precinct Deviation Analysis ..................................................................................................................... 18
RUNOFF MAIL-IN VOTING ........................................................................................................................... 20
Mail-in Voting History ............................................................................................................................. 20
Runoff Mail-in Campaign Strength: ........................................................................................................ 22
Mail-in Voter Turnout Analysis ............................................................................................................... 23
Mail-In Voter Party Affiliation ............................................................................................................. 23
Mail-in Affiliated Party Line Vote Scenario ......................................................................................... 24
Mail-In Shared Party Ratio Scenario ................................................................................................... 24
Mail-in Unaffiliated Split Vote Scenario .............................................................................................. 25
RUNOFF ELECTRONIC VOTING .................................................................................................................... 26
Early Voter Turnout Analysis ................................................................................................................... 26
Early Voter Party Affiliation ................................................................................................................ 26
Early Voter Party Line Vote Scenario .................................................................................................. 26
Early Voter Shared Party Ratio Scenario ............................................................................................. 27
Early Voter Unaffiliated Split Vote Scenario ....................................................................................... 27
Election Day Turnout Analysis ................................................................................................................ 29
Election Day Voter Party Affiliation .................................................................................................... 29

VoterGA GA6 Runoff Election
Statistical Analysis
Page 2 of 71
Election Day Affiliated Party Line Vote Scenario ................................................................................ 30
Election Day Shared Party Ratio Scenario ........................................................................................... 30
Election Day Unaffiliated Split Vote Scenario ..................................................................................... 31
OVERALL VOTING ANALYSIS ........................................................................................................................ 32
Overall Voter Party Affiliation ............................................................................................................. 32
Overall Affiliated Party Line Vote Scenario ......................................................................................... 32
Overall Shared Party Ratio Scenario ................................................................................................... 33
Overall Unaffiliated Split Vote Scenario .............................................................................................. 33
Special Election vs. Runoff Comparative Analysis ................................................................................... 34
SUMMARY OF FINDINGS ............................................................................................................................. 36
Statistics Indicating Result Correctness .................................................................................................. 36
Conditions that Support Result Correctness ........................................................................................... 36
Statistical Disparities Indicating Results are In Doubt ............................................................................ 37
Unverifiable vs. Verifiable Vote Counts .............................................................................................. 37
Precinct Deviation Analysis ................................................................................................................. 37
Mail-in Voting Analysis ........................................................................................................................ 37
Mail-in Voter Turnout Analysis ........................................................................................................... 38
Early Voter Turnout Analysis ............................................................................................................... 38
Election Day Voter Turnout Analysis ................................................................................................... 39
Overall Turnout Analysis ..................................................................................................................... 40
Conditions that Support Statistical Disparities ....................................................................................... 41
CONCLUSIONS ............................................................................................................................................. 43
EXHIBITS ...................................................................................................................................................... 49
APPENDIX .................................................................................................................................................... 69
Academic Studies on AccuVote TS and TSX Machines............................................................................ 69
History of Georgia Vote Counting Discrepancies .................................................................................... 70
Chronology of GA6 Key Events ............................................................................................................... 71
VoterGA GA6 Runoff Election
Statistical Analysis
Page 3 of 71
ABOUT THE AUTHOR Garland Favorito is a co-founder of Voters Organized for Trusted Election Results in Georgia
(VoterGA) and Elections Director of the Constitution Party of Georgia. VoterGA is a nonpartisan,
non-profit, all-volunteer organization dedicated to restoring the integrity of Georgia elections.
Its primary objective is to advocate for verifiable, auditable and recount-capable voting in
Georgia. It also advocates for fair and equal ballot access for all Georgia citizens.
Mr. Favorito is a career Information Technology professional with over 40 years of in-depth
experience in internet systems design, business systems analysis, database administration,
application development, systems integration, systems life cycle methodologies, computer
programming, project management, and multi-factor security for financial transactions. His
experience centers on medium- and large-scale mission-critical applications in nearly all facets
of American business. His industry experience includes banking, financial systems, health care,
accounting, manufacturing, inventory, purchasing, retailing, utilities, telecommunications,
insurance, software development and the service industry.
Mr. Favorito also has 15 years of volunteer involvement in regards to Georgia’s voting
machines, dating back to 2002 before the state purchased and implemented the machines. His
election integrity activities include research, analysis, documentation, and presentations
involving Georgia’s current voting systems. He is recognized throughout most of the state as a
leading expert on the usage of, and risks involved with, Georgia’s voting machines.
Mr. Favorito also provided VoterGA statistics for the 2010 South Carolina U.S. Senate
Democratic primary to the Vic Rawl campaign and notification to the South Carolina State
Election Board of VoterGA findings as discussed later in this document. The primary was one of
the most questionable elections in electronic voting monitoring history.
Mr. Favorito lives in Roswell at the epicenter of Georgia’s 6th Congressional District (GA6). His
residence is about three miles from the home of Karen and Steve Handel and one mile from
one of the Jon Ossoff campaign offices that conducted the most massive door to door
canvassing operation he had ever witnessed. Mr. Favorito is acquainted with a variety of
different Republican and Democrat leaders who were active in the 6th District races, as well as
the election officials in the GA6 counties. He integrated their knowledge into this statistical
analysis and the VoterGA Root Cause Analysis he authored. That study identified results
reporting problems that occurred during the GA6 Special Election held on April 18, 2017.
VoterGA is nationally recognized as the leading election integrity organization in Georgia.

VoterGA GA6 Runoff Election
Statistical Analysis
Page 4 of 71
INTRODUCTION
This statistical analysis culminates four months of study into reported results for the 6th District
(GA6) Runoff Election held on June 20, 2017. VoterGA initiated this study as a result of national
skepticism regarding the unverifiable results in both the GA6 Special Election and particularly
the GA6 Runoff. The document has separate sections for the statistical analysis, summary of
findings and conclusion. The Summary of Findings section contains all key statistics so that the
casual reader can skip the analysis and go straight to the Findings and Conclusions sections.
To assess the credibility of the GA6 Runoff results, the study contrasts the verifiable vote counts
from mail-in and provisional ballots with the unverifiable early voting and Election Day vote
counts. It determines actual voter party affiliation from the primary voting history of GA6 mail-
in voters and early voters based on completed ballot records for their applications. It applies
three alternative scenarios regarding unaffiliated vote counts (i.e., votes cast by voters without
a party-affiliated voting history) and projects potential Runoff election outcomes that can be
compared to the reported results. The three scenarios are:
1. Affiliated Party Line Vote - Projects unaffiliated vote counts that each candidate needs
to achieve the reported results if all affiliated voters voted for their party’s candidate;
2. Shared Party Ratio – Projects unaffiliated vote counts by extrapolating the affiliated
party ratio and identifies a crossover rate that achieves reported results by vote type;
3. Unaffiliated Vote Split – Applies an even split of unaffiliated votes to the counts for
each candidate and projects an affiliated crossover rate to achieve reported results
The combined scenarios offer a range of possibilities covering the spectrum of how unaffiliated
Runoff votes may have been cast for the candidates - including majority Republican, majority
Democratic and equal split. The scenario steps are illustrated here:
Shared Party
Ratio
Unaffiliated
Vote SplitAffiliated Party
Line Vote
Subtract Actual Party Affiliated
Votes from Actual Results to
Derive Unaffiliated Party Votes
Define Affiliated Excess for
Candidates by Subtracting
Needed from Actual Affiliated
Use Actual Party Affiliated Vote
Ratios to Project Unaffiliated
Vote Counts
Split Unaffiliated Votes Equally
Among Candidates and Define
Affiliated Needed for Results
Derive Crossover Rates from
Excess of Total Affiliated as
needed to Achieve Results
Total Affiliated Votes and
Unaffiliated Vote Counts for
Each Candidate
Derive Crossover Rates from
Totals as needed to Achieve
Actual Results
VoterGA GA6 Runoff Election
Statistical Analysis
Page 5 of 71
GEORGIA ELECTION BACKGROUND
Georgia Election Equipment
In 2001, Georgia evaluated electronic voting equipment in response to media hype concerning
the 2000 Presidential Election. In 2002, it became the first state to implement a statewide
voting system. The Secretary of State’s office chose the AccuVote TS Direct Recording Electronic
(DRE) voting machines originally produced by Global Election Management Systems (GEMS).
Diebold acquired Global before the contract with Georgia was signed in May of that year. The
contract included GEMS county election servers. The GEMS server software runs on the
Windows 2000 Operating System with Service Pack 4 installed. The DRE software runs on a
modified version of the Windows/CE operating system. The server database runs on the
Microsoft Joint Engine Technology (JET) engine. In 2011, Georgia upgraded the voting machine
software to Ballot Station version 4.5.2 and upgraded the GEMS software to GEMS Version
1.18.22 as part of a statewide voting software upgrade.
The vendor supporting Georgia’s statewide voting system implementation is Election Systems &
Software (ES&S). Both Global and ES&S originally started in 1979 as Data Mark, which was
renamed American Information Systems in 1980. Those companies were founded by brothers
Bob and Todd Urosevich, who separated to form Global Election Systems and ES&S,
respectively. In 2002, when Diebold acquired Global Election Systems, it established an election
subsidiary named Diebold Election Systems. In 2007, Diebold renamed its elections subsidiary
Premier Election Solutions after the company received negative nationwide publicity for its
voting equipment. In 2010, Premier sold its voting system hardware and software support
rights to ES&S. Premier also sold its voting system intellectual property rights to Canadian
based Dominion Voting Systems.
In 2012, Georgia Secretary of State Brian Kemp executed a contract to publish its state election
results through Clarity Elections ENR, which is produced by Tampa-based SOE Software. SOE
was a subsidiary that had just been acquired by the Spanish-owned SCYTL in January of that
year. Cobb County reported its votes using Clarity software in 2014 and Fulton County began
reporting its votes using Clarity software in 2016.
The Center for Election Systems (CES) at Kennesaw State University (KSU) prepares the Georgia
voting system for each election. In 2001 former KSU professor Britain Williams participated in a
voting system evaluation conducted by Secretary of State Cathy Cox. When the system was
purchased in 2002, Cox signed a contract with CES for election support. CES creates ballots and
election databases for each county. It also provides technical support for each election.

VoterGA GA6 Runoff Election
Statistical Analysis
Page 6 of 71
Georgia Election Procedures
The Center for Election Systems (CES) creates the ballots, poll book files and GEMS databases.
CES distributes them to each county prior to an election. Each county loads the database it
receives onto its GEMS server and programs each voting machine memory card. The memory
cards are then loaded into each voting machine to record the results for voters. Each county
loads voter data contained on the poll book file into each precinct poll book. The poll book file
is used to verify voters on Election Day and create a voter access card that voters load into the
voting machine to tell the machine that they are authorized to cast one vote. The voting
machine then displays the ballots to voters and accepts their selections from the touch screen.
(See Exhibit 7)
Poll workers also use the poll books to create voter access cards for early in-person voters.
However, CES does not load the poll book files with voter data for in-person early voting. Early
in-person voters are verified using a central database before the poll worker uses the poll book
to create a voter access card for the voter. The central database also records that the voter is
voting at the early voting location to prevent subsequent double voting at a different location.
When the poll close precinct workers print copies of the voting machine tapes that include the
vote-count totals for each contest. They post one copy of each machine tape on the door of the
precinct building where the election took place so that it can be viewed by the public. The
precinct workers remove the memory cards with the votes cast on each machine and place
them in a sealed envelope with a copy of the machine tapes. The precinct manager and
assistant then hand deliver the sealed envelopes to the county elections office for processing.
Fulton County operates three upload points. They are at the North Annex, South Annex and the
Roswell City Hall. The precinct manager and assistant take the envelopes to one of the upload
points. Each precinct card is checked in according to its assigned number and then uploaded to
the county elections database for accumulation.
County election officials accumulate the results, print out statements of votes cast and export
the results for publishing. The results then appear on the county web sites for public
consumption.

VoterGA GA6 Runoff Election
Statistical Analysis
Page 7 of 71
GA6 April 18 Special Election Background
The State of Georgia held a Special Election on April 18, 2017 to fill the seat vacated by 6th
District U.S. Congressman Tom Price. Rep. Price was appointed by President Trump as Secretary
of Health and Human Services and sworn in on February 10, 2017. A field of 18 candidates
qualified by the February 15 deadline, including 11 Republicans, five Democrats and two
Independents. If no candidate received 50 percent of the vote, the top two vote-getters would
enter a Runoff. The election, one of the first since the closely contested Presidential election in
November 2016, garnered intense national attention as a proxy on the Trump presidency.
The 6th district (GA6) spans the counties of Cobb, DeKalb, and Fulton -- Georgia’s largest and
most populous county. Fulton County experienced what was termed a “rare” error that caused
vote-count tabulation delays during Election Night, although Cobb and DeKalb did not. Fulton
had experienced one other vote-count problem with a write-in candidate in 2006. Georgia
counties, particularly Cobb, previously had experienced a variety of vote counting problems. (See Appendix Vote Count Discrepancies)
Throughout Election Night, interim reporting percentages for GA6 vote-leader, Jon Ossoff,
hovered in the 50-60 percent range but declined gradually to just over 50 percent. Once Fulton
County corrected its error just before midnight, the leader’s vote totals dropped below 50
percent, thus necessitating a Runoff with the second-place candidate according to Georgia law.
That candidate, Karen Handel, was nearly 30 points behind with 19 percent of the vote. The
results, coupled with the sequence of events for the evening, drew national skepticism about
the validity of the election. This skepticism continued a trend of national criticism that Georgia
has received since 2002, when the state implemented what national election experts call
“unverifiable elections.” (See also Exhibit 1)
VoterGA produced a Root Cause Analysis to identify why such an error occurred for the many
concerned voters in Georgia and throughout the country who were left uninformed about the
details of what actually happened. The analysis concluded that there were two root causes of
the error that caused two-hour reporting delays and a strange shift in results:
1. The state improperly combined the GA6 election on the same day as a scheduled local
Roswell Runoff election whose candidates could not be known in time to comply with
ballot lead-time regulations of the Military Overseas Voting Empower Act (MOVE). That
forced Fulton County to use redundant ballots, databases, voting machines, memory
cards and registration procedures for the federal GA6 election and Roswell Runoff.
VoterGA GA6 Runoff Election
Statistical Analysis
Page 8 of 71
2. Critical security flaws at both the voting machine and county database server levels
allowed election officials to load a voting machine card from the Roswell Runoff into the
GA6 live election results. They encountered another serious flaw when the county
server malfunctioned. That prevented export of the improperly loaded results for
publishing.
The Johns Creek City Council also failed to consider MOVE regulations and voted to improperly
combine a City Council Special Election with the GA6 race on April 18. That further caused
Fulton County to conduct triplicate redundant elections on the same night. However, the Root
Cause Analysis determined that this was not a root cause in the results reporting problems that
occurred on that Election Night.

VoterGA GA6 Runoff Election
Statistical Analysis
Page 9 of 71
GA6 June 20 Special Runoff Election Background
The State of Georgia held the 6th District (GA6) Special Election Runoff between Democrat Jon
Ossoff and Republican Karen Handel on June 20, 2017. Tom Price had won the last three
elections in the Republican-oriented district by an average margin of 63.5 to 36.5 percent. Both
campaigns increased their activities after the Special Election and throughout the Runoff
campaign period. No events occurred that were intrinsic to the Runoff or significant enough to
materially affect its outcome according to polls up to a week before the election.
When officials published results on Election Night, Karen Handel picked up all 32 percent of the
votes from the other 16 Republican, Democrat and Independent opponents who participated in
the Special Election on April 18. Ossoff’s totals remained flat and showed less than one tenth of
a percent difference. On April 18, Ossoff had 48.13 percent to 19.77 percent for Handel. On
June 20, Handel had 51.78 percent of the vote to 48.22 percent for Ossoff. (See also Exhibit 2)
The reported results again generated national skepticism. A week before the election no
current poll had projected Handel to win. Her 3.75 percent victory was outside error margins of
the polls conducted. On May 4, the first poll conducted after the Special Election showed
Handel with a 2.6 percent lead but that Landmark Communications poll was superseded by
three subsequent Landmark polls conducted for WSB-TV, all showing an Ossoff 1 to 2.5 percent
lead. Ten polls in a row had shown Ossoff leading by anywhere from 0.1 to 7 percent, with
Republican-to-Ossoff crossover margins of 7.5, 10, 12.5 and 15 percent.
The last two of those polls from Fox 5 and WSB-TV indicated that the race was tightening. A
June 18 outlier poll from the Republican-identified polling group Trafalgar showed Handel with
a 1.87 percent lead after they had shown Ossoff with a 2.76 percent lead four days earlier. The
Trafalgar June 14 poll showed Ossoff with a 12.56 percent lead in early voting and Handel with
only a 2.44 percent lead in those who had not yet voted. The reported results showed Handel
outperformed all aspects of the June 18 poll that was the only poll predicting she might win.
A few national pundits speculated that a June 15 incident in Washington, D.C., where U.S.
Congressman Steve Scalise (R-LA) was shot in the hip at a baseball practice may have reversed
the election results in the last few days. Although plausible, the speculation is unsubstantiated
and contradicted by local facts. First, polls showed the number of undecided Election Day
voters was only around 3% at that late date. Secondly, both Democratic and Republican 6th
District campaign leaders confirmed that the incident had no quantifiable effect on voters as it
VoterGA GA6 Runoff Election
Statistical Analysis
Page 10 of 71
was not directly connected to the GA6 election. Thirdly, the key disparities identified in this
statistical analysis existed during mail-in and early voting that took place before June 15. (See Exhibit 11)
The previous behavior of Handel and Secretary of State (SOS) Brian Kemp fueled additional
skepticism as to whether or not the race had been targeted for hacking. On April 19, the day
after Handel made the Runoff, Kemp posted endorsements of Handel on Facebook, Twitter and
his social media web site. They read in part: “I look forward to working with Karen in the weeks
ahead to ensure victory at the ballot box.”
As a former SOS candidate, Handel wrote a 2006 Basics Report that stated the machines were
“…already obsolete…” The System Integrity section concisely explained the need for voter
verification of their ballots, election audits and a paper audit trail as the ballot of record. Handel
pledged: “As Secretary of State I will establish a commission that includes both county and state
elections officials to make recommendations regarding new purchases of electronic voting machines.”
She explained that: “We need to move quickly and expeditiously…“and “…ensure that the system we are
putting in place is well designed and thoroughly thought out...”
However, once elected, Handel reversed her position. On Sept. 28, 2009, she told a Gwinnett Co. news
service that: “Georgia has the most secure elections in the nation...” despite the problems cited before
then, as shown in the Appendix. Ethics Commission records show that Handel received over $25,000 in
donations from family members and partners of the voting machine vendor lobbying firm, Massey
Bowers LLC. Handel hired Massey Bowers’ partner, Rob Simms, as Assistant Secretary of State and he
became a key fund raiser in her unsuccessful gubernatorial and U.S. Senate campaigns.
Runoff results showed that Ossoff won the verifiable mail-in vote by a remarkable 64 to 36
percent margin. Shockingly, Handel then won the unverifiable Election Day vote by a 58 to 42
percent margin that was unexpected and unpredicted by anyone. The Ossoff team conducted a
massive door to door campaign that intensified in the last two weeks before Election Day. On
the last two weekends the team rented dozens of vans to transport thousands of volunteers
who poured in from all over the country. Fueled by over $20 million in out-of-state funds, the
campaign reported 12,000 volunteers who knocked on nearly every door in the district, many
multiple times. The extensive Ossoff campaign was highly visible to all 6th District observers
throughout the election cycle and particularly in the last days preceding the June 20 election
when additional volunteers and vans canvassed the district.
Disparities were also found between verifiable mail-in votes and the unverifiable Election Day
votes in nearly every precinct, to an extent that election forensics analysts have not seen
VoterGA GA6 Runoff Election
Statistical Analysis
Page 11 of 71
before. All in all, there was a cluster of red flags: questionable GA6 Runoff results, security flaws
found in the GA6 Special Election, and a problematic history of Georgia election integrity issues
as described in the next section. This constellation of serious concerns led a dozen national
election monitors to write a letter to the three GA6 county election boards before the election
results were certified.
The letter began: “We the undersigned public advocates for accurate and transparent elections
are writing to alert you to early indications that hacking or other tampering may have altered
the results of the Sixth District Special Election Runoff held on June 20, 2017.” The letter also
expressed concern about vulnerabilities that existed for months at Kennesaw State University’s
(KSU) Center for Elections Systems (CES), which prepares the ballots used on every machine for
every election. The letter further explained, “…emerging statistical patterns indicate a strong
likelihood that the outcome of the Special Runoff Election was altered.” It re-emphasized the
risk that, “…it is highly likely the unofficial results of the Special Runoff Election are incorrect, to
the point that the election outcome appears to have been affected.” The letter concludes,
“Should you continue to stand by the reported results, we call upon you to prove to Georgia’s
voters that the reported results are a true and accurate measure of the votes cast by the voters
of Georgia’s Sixth Congressional District.” (See Exhibit 3)
The primary author of the present analysis delivered the letter to each county election board,
along with a similar letter on behalf of the VoterGA members. The VoterGA letter cited seven
points that cast the election results in doubt, and requested each board to conduct a basic
forensic investigation before certifying the election canvass results, in accordance with State
Election Board regulations. (See Exhibit 4)
Although all petitions appeared to be correctly submitted and none was challenged, all three
counties ignored those petitions and proceeded to certify the unverifiable results.
No verification, auditing, recount or re-canvass of the unverifiable GA6 reported Runoff results
will ever take place in response to public concern. This statistical analysis of the GA6 Runoff
results may be the only vehicle through which Georgia citizens and other concerned Americans
can ever have insight into the results of what is now recognized as the most expensive
congressional race in American history.
VoterGA GA6 Runoff Election
Statistical Analysis
Page 12 of 71
Pre-Election Integrity Concerns
Before their 2002 implementation, Georgia’s voting machines were criticized by election
officials, state legislators, political leaders and the primary author of this analysis for producing
results that cannot be verified, audited or recounted. In this flagrant trifecta of non-
transparency:
1. Voters cannot verify that their selections were recorded on the DRE memory cards that
tally the votes.
2. Election officials have no mechanism to audit totals produced before certifying an
election.
3. Candidates cannot receive a true recount since the system can only reprint previous
unverifiable results.
In their first use, the machines produced two of the most controversial elections in electronic
voting history. Rep. Saxby Chambliss upset incumbent U.S. Senator Max Cleland, a triple-
amputee Vietnam veteran, and State Senator Sonny Perdue upset incumbent Governor Roy
Barnes after having converted from a Democrat to a Republican about four years earlier.
Chambliss won by a seven point margin although all polls showed Cleland ahead by a
comparable margin. Perdue won by a five point margin although polls showed Barnes ahead by
seven. These egregious swings stood out all the more, since down-ballot races trended toward
Democrats and exhibited no such perturbations. Talk-show host Sean Hannity termed the
election the “earthquake in Georgia.”
The state certification showed that the county servers were never certified. SOS Cathy Cox had
certified only the Accuvote TS R6 voting machines. KSU Professor Britain Williams admitted
under oath in a deposition that Diebold patched Fulton and DeKalb County servers with
uncertified software. Diebold President Bob Urosevich delivered that patch to Georgia
according to witnesses. A December 3, 2002 letter from Assistant Secretary of State Robert Ray
to Urosevich explained in its “punch list” that the office was still concerned about federal
certifications and was awaiting “Confirmation that statewide voting system is appropriately
certified” a month after conducting the November election.
As early as 2003, a variety of academic institutions and state governments commissioned
studies regarding the AccuVote TS and TSx machines as well as the GEMS servers. These studies
found hacking vulnerabilities, critical security flaws, design failings, programming errors, and
other issues involving reliability. Virtually all of the studies were extremely negative with
regard to the security and accuracy of the machines. (See Appendix Studies)
VoterGA GA6 Runoff Election
Statistical Analysis
Page 13 of 71
During 15 years of use in Georgia, Georgia counties have encountered a variety of problems
with the voting systems. These include lost votes, accumulation failures, altering of votes
without audit detection, adding votes cast during machine testing into actual elections totals,
and other critical errors that can impact, and have impacted, election results. Georgia has failed
to address most of these problems even though the 15-year-old equipment is now five years
past its 10-year recommended useful life. (See Appendix Discrepancies)
In March of 2017, critical vulnerabilities on the CES public website were confirmed by
Christopher Grayson. Those vulnerabilities had been originally discovered during 2016 by Logan
Lamb, who notified CES Executive Director Merle King. Both internet security professionals
determined that the vulnerabilities publicly exposed all key election data, as described in the
next section. Mr. King did not ensure the vulnerabilities were remediated and did not notify the
Secretary of State.
Before the GA6 election, 20 computer scientists wrote a letter to Secretary of State Kemp
questioning the CES vulnerability breach, urging him to move Georgia to verifiable voting and
offering their assistance in doing so. They indicated that they never received a response. (See Exhibit 5)
After the April 18 GA6 Special Election revealed voting system security flaws, more concerns
were raised regarding certification of the voting system. The state has not produced a full
voting system certification since 2008, even though system software and components have
been upgraded and patched several times since.
When the June 20 GA6 Special Runoff Election produced highly questionable results, all three
county boards ignored the citizens who presented re-canvass petitions, although the petitions
were submitted according to State Election Board rules. A lawsuit challenging the results and
the voting machines was ultimately filed.
All of these concerns, which have festered for the last 15 years, necessitated a statistical
analysis of the GA6 Runoff results.
VoterGA GA6 Runoff Election
Statistical Analysis
Page 14 of 71
Center for Election Systems (CES) Vulnerabilities
In 2016 and 2017, all key Georgia election information managed by CES was found to be
severely compromised. On August 24, 2016 internet security professional Logan Lamb
discovered that Georgia’s key election information was installed on a CES web server exposed
to the general public rather than being placed on an internal application server protected by a
firewall. This election information included:
Georgia voter registration data containing 6.7 million personally identifiable records
GEMS county databases used to accumulate votes for elections
PDFs of election server administration documents, including supervisor passwords
Windows executables used to create databases, export election results, etc.
Training videos that explained to county users how to download files onto a memory
card and insert it into a voting system
Lamb discovered that these files had already been cached by Google from previous public
accesses. Lamb also discovered that the web server was running a version of Drupal that
contained a security flaw known as “Drupageddon.” An advisory warning had been published
since 2014 to explain that the flaw allows an attacker to execute, create, modify and delete
anything on the server. (See Exhibit 9)
Lamb emailed CES Executive Director Merle King on August 28, 2016 to explain the
vulnerabilities. King assured him that the vulnerabilities would be remediated. However, when
Lamb explained the vulnerabilities to colleague Christopher Grayson six months later in
February of 2017, Grayson determined that the vulnerabilities had not been properly
remediated and still existed.
Grayson contacted KSU security instructor Andy Green, who engaged the head of the Kennesaw
State Information Security Office. The office took action to move the server offline. Pending
litigation has restricted the release of further information about these vulnerabilities. It is
unclear how county election officials are currently accessing the server data, if at all, or for how
many years the vulnerabilities existed.

VoterGA GA6 Runoff Election
Statistical Analysis
Page 15 of 71
RUNOFF ELECTION STATISTICS
Overall GA6 Results Analysis
In the GA6 Special Election held on April 18, 48.92 percent of the voters cast a vote for one of
five Democrats in the race while 50.99 percent of voters cast a vote for one of 11 Republican
candidates in the race. The remaining 0.09 percent of voters cast votes for one of the two
independent candidates. Jon Ossoff received 48.13 percent of the overall vote to 19.77 percent
of the overall vote for Karen Handel.
In the June 20 Special Election Runoff, Handel received 51.78 percent of the vote to 48.22
percent for Ossoff. Percentage-wise, Handel picked up 32 percent. That equates to nearly all of
the votes from the other 16 opponents who participated in the GA6 Special Election. Ossoff
totals remained flat and showed less than one tenth of a percent difference.
Special Special % Runoff Votes Runoff % Net Gain
Ossoff 92,673 48.13% 124,517 48.22% .09%
Handel 38,071 19.77% 134,799 51.78% 32.01%
Other Republicans 60,121 31.22%
Other Democrats 1528 .79%
Independent 176 .09%
Total Republicans 98,192 50.99%
Total Democrats 94,201 48.92%
The reported results clearly indicate that there was a stronger Republican voter turnout
increase for the Runoff than there was for Democrats. The reported results also imply that
some Democrats may have crossed over to vote for Handel in the Runoff. The reported results
further allow for a possible combination of both scenarios. (See Exhibit 8)
VoterGA GA6 Runoff Election
Statistical Analysis
Page 16 of 71
Results by Voting Type
Georgia collects votes for an election in four different ways. Voters can:
Vote by mail when submitting a mail-in ballot application to the county after May 2,
receiving the ballot and returning it to the county by Election Day;
Vote early using an electronic voting machine at selected polling locations that were
open from May 30 to June 16 for the Runoff;
Vote at their precinct using an electronic voting machine on Election Day;
Vote at the precinct on a provisional ballot that is counted after verification of
eligibility.
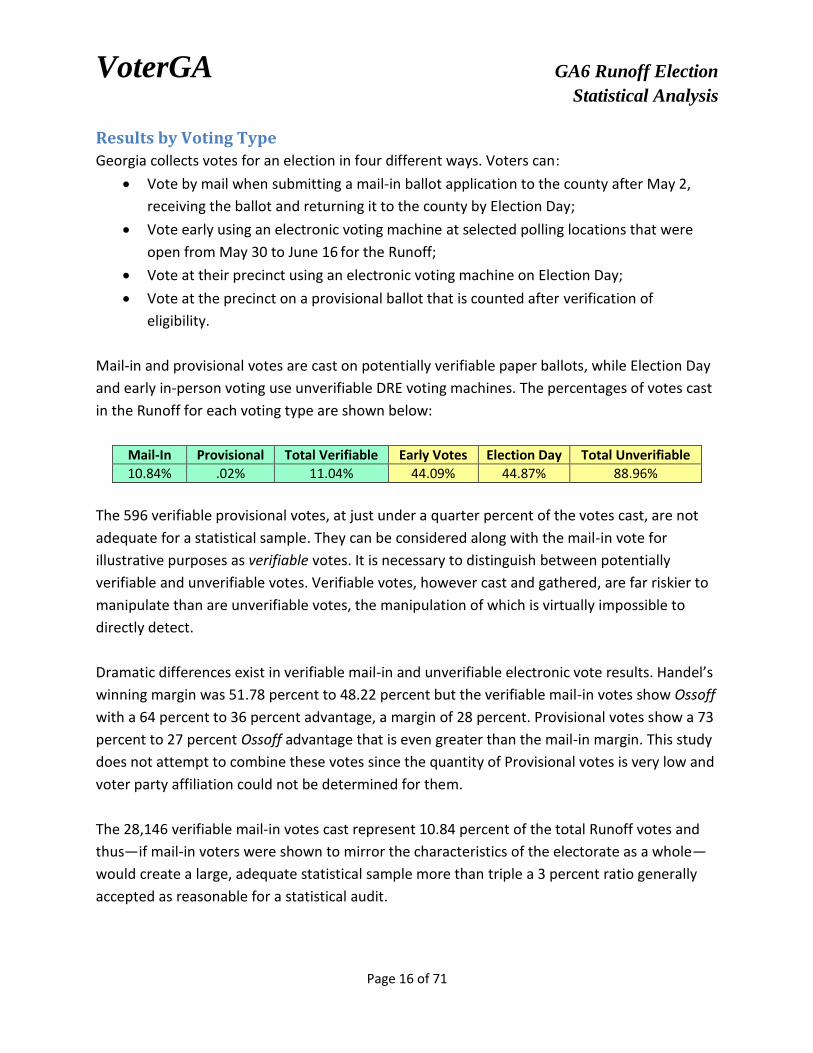
Mail-in and provisional votes are cast on potentially verifiable paper ballots, while Election Day
and early in-person voting use unverifiable DRE voting machines. The percentages of votes cast
in the Runoff for each voting type are shown below:
Mail-In Provisional Total Verifiable Early Votes Election Day Total Unverifiable
10.84% .02% 11.04% 44.09% 44.87% 88.96%
The 596 verifiable provisional votes, at just under a quarter percent of the votes cast, are not
adequate for a statistical sample. They can be considered along with the mail-in vote for
illustrative purposes as verifiable votes. It is necessary to distinguish between potentially
verifiable and unverifiable votes. Verifiable votes, however cast and gathered, are far riskier to
manipulate than are unverifiable votes, the manipulation of which is virtually impossible to
directly detect.
Dramatic differences exist in verifiable mail-in and unverifiable electronic vote results. Handel’s
winning margin was 51.78 percent to 48.22 percent but the verifiable mail-in votes show Ossoff
with a 64 percent to 36 percent advantage, a margin of 28 percent. Provisional votes show a 73
percent to 27 percent Ossoff advantage that is even greater than the mail-in margin. This study
does not attempt to combine these votes since the quantity of Provisional votes is very low and
voter party affiliation could not be determined for them.
The 28,146 verifiable mail-in votes cast represent 10.84 percent of the total Runoff votes and
thus—if mail-in voters were shown to mirror the characteristics of the electorate as a whole—
would create a large, adequate statistical sample more than triple a 3 percent ratio generally
accepted as reasonable for a statistical audit.
VoterGA GA6 Runoff Election
Statistical Analysis
Page 17 of 71
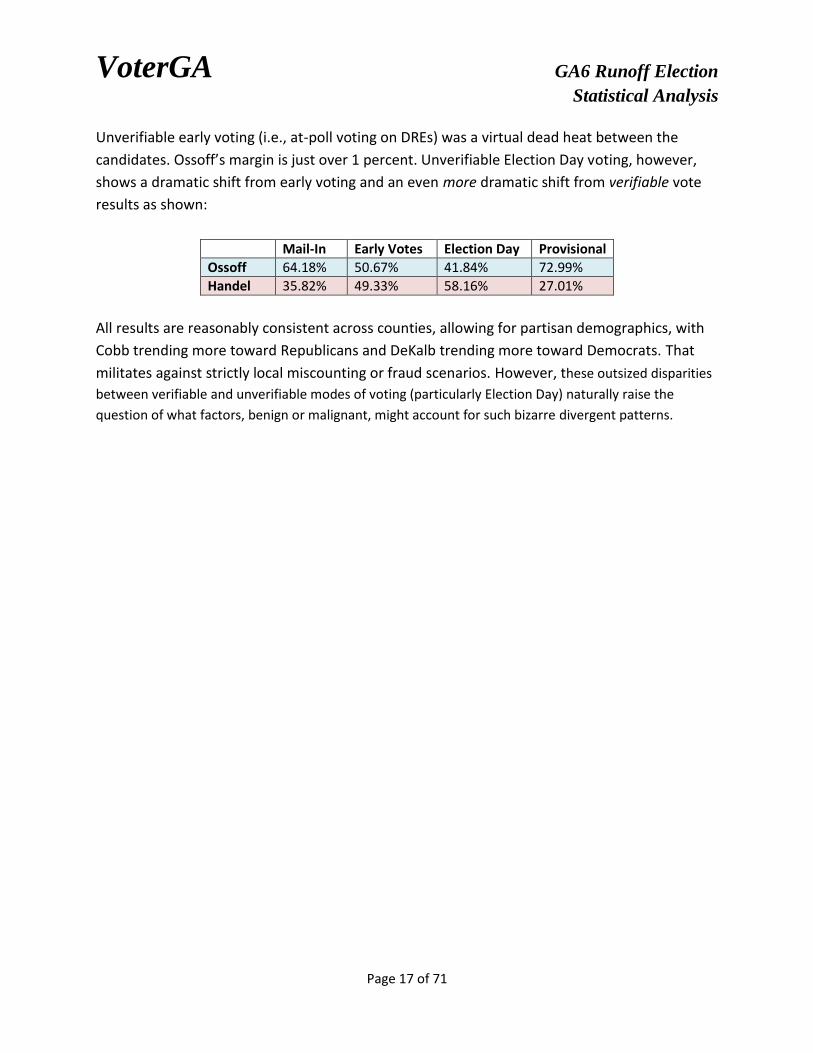
Unverifiable early voting (i.e., at-poll voting on DREs) was a virtual dead heat between the
candidates. Ossoff’s margin is just over 1 percent. Unverifiable Election Day voting, however,
shows a dramatic shift from early voting and an even more dramatic shift from verifiable vote
results as shown:
Mail-In Early Votes Election Day Provisional
Ossoff 64.18% 50.67% 41.84% 72.99%
Handel 35.82% 49.33% 58.16% 27.01%
All results are reasonably consistent across counties, allowing for partisan demographics, with
Cobb trending more toward Republicans and DeKalb trending more toward Democrats. That
militates against strictly local miscounting or fraud scenarios. However, these outsized disparities
between verifiable and unverifiable modes of voting (particularly Election Day) naturally raise the
question of what factors, benign or malignant, might account for such bizarre divergent patterns.
VoterGA GA6 Runoff Election
Statistical Analysis
Page 18 of 71
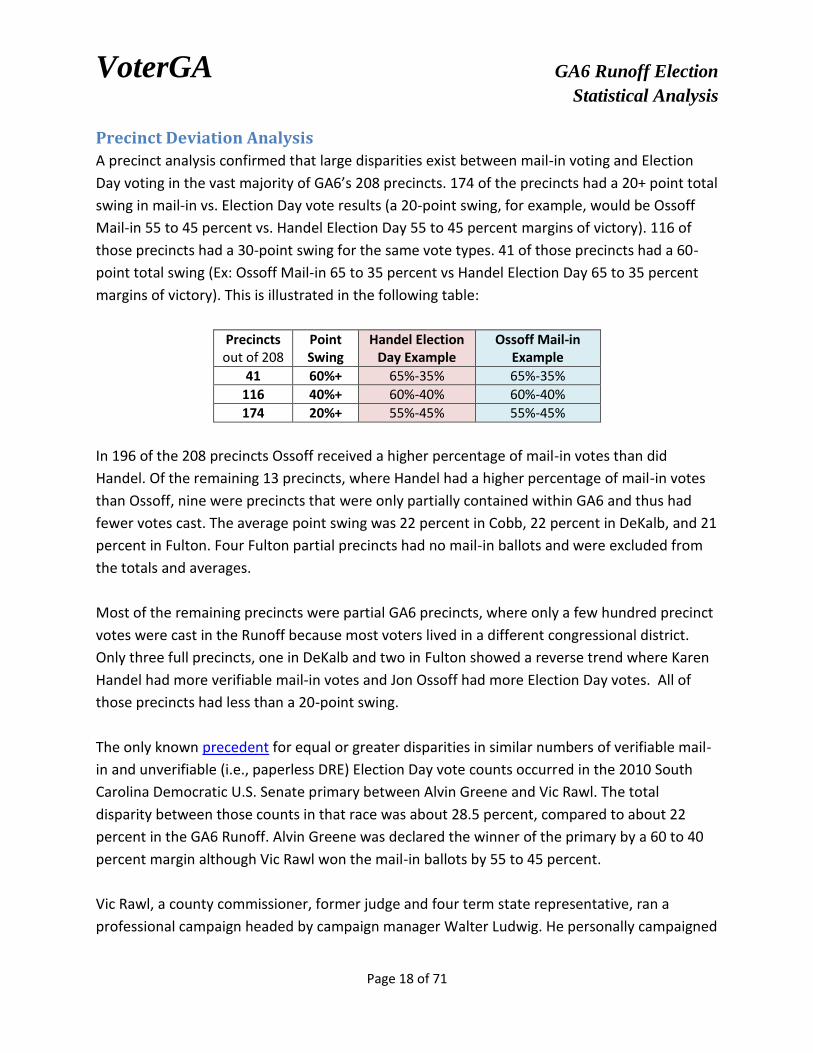
Precinct Deviation Analysis
A precinct analysis confirmed that large disparities exist between mail-in voting and Election
Day voting in the vast majority of GA6’s 208 precincts. 174 of the precincts had a 20+ point total
swing in mail-in vs. Election Day vote results (a 20-point swing, for example, would be Ossoff
Mail-in 55 to 45 percent vs. Handel Election Day 55 to 45 percent margins of victory). 116 of
those precincts had a 30-point swing for the same vote types. 41 of those precincts had a 60-
point total swing (Ex: Ossoff Mail-in 65 to 35 percent vs Handel Election Day 65 to 35 percent
margins of victory). This is illustrated in the following table:
Precincts out of 208
Point Swing
Handel Election Day Example
Ossoff Mail-in Example
41 60%+ 65%-35% 65%-35%
116 40%+ 60%-40% 60%-40%
174 20%+ 55%-45% 55%-45%
In 196 of the 208 precincts Ossoff received a higher percentage of mail-in votes than did
Handel. Of the remaining 13 precincts, where Handel had a higher percentage of mail-in votes
than Ossoff, nine were precincts that were only partially contained within GA6 and thus had
fewer votes cast. The average point swing was 22 percent in Cobb, 22 percent in DeKalb, and 21
percent in Fulton. Four Fulton partial precincts had no mail-in ballots and were excluded from
the totals and averages.
Most of the remaining precincts were partial GA6 precincts, where only a few hundred precinct
votes were cast in the Runoff because most voters lived in a different congressional district.
Only three full precincts, one in DeKalb and two in Fulton showed a reverse trend where Karen
Handel had more verifiable mail-in votes and Jon Ossoff had more Election Day votes. All of
those precincts had less than a 20-point swing.
The only known precedent for equal or greater disparities in similar numbers of verifiable mail-
in and unverifiable (i.e., paperless DRE) Election Day vote counts occurred in the 2010 South
Carolina Democratic U.S. Senate primary between Alvin Greene and Vic Rawl. The total
disparity between those counts in that race was about 28.5 percent, compared to about 22
percent in the GA6 Runoff. Alvin Greene was declared the winner of the primary by a 60 to 40
percent margin although Vic Rawl won the mail-in ballots by 55 to 45 percent.
Vic Rawl, a county commissioner, former judge and four term state representative, ran a
professional campaign headed by campaign manager Walter Ludwig. He personally campaigned

VoterGA GA6 Runoff Election
Statistical Analysis
Page 19 of 71
in at least half of the counties, made radio and TV appearances, attended the state convention,
collected official endorsements, had 600 volunteers, printed 10,000 bumper stickers,
established 180,000 database contacts, created a 104,000 email distribution list, had 3,300
Facebook Friends, sent out 300,000 emails just prior to the election, received 20,000 web site
hits on Election Day alone, was not touched by any scandal, and was more active on Twitter
than the Democratic Party candidates for other offices. He had closed to within 7 percent of
Republican incumbent Jim DeMint in tracking polls, and thus posed a credible threat in
November.
Alvin Greene, an unemployed military veteran, managed to pay a $10,000 qualifying fee by
means that are still unclear but he did not actually have a campaign. He held no fundraisers, ran
no paid advertisements, made no campaign speeches, hired no campaign manager, conducted
no state-wide tours, attended no Democratic Party county events, printed no yard signs and did
not even establish a website.
Judge Rawl unsuccessfully challenged the results of the primary (because it was a primary
contest, the South Carolina Democratic Party had jurisdiction), one of the most suspect
elections in electronic vote monitoring history.

VoterGA GA6 Runoff Election
Statistical Analysis
Page 20 of 71
RUNOFF MAIL-IN VOTING
Mail-in Voting History The outsized disparities between verifiable and unverifiable (and particularly Election Day) modes of
voting naturally raise the question of what factors, benign or malignant, might account for such bizarre
divergent patterns. To assess the election results we started by analyzing the principal verifiable
voting mode, which is mail-in voters.
The first step is an examination of trends and historical patterns exhibited for 6th District mail-in
voting with the question being whether Ossoff’s mail-in landslide can be explained simply by a
greater tendency of Democratic voters to mail in their ballots. Both general election and
primary voting history can be analyzed to determine whether more GA6 Democrats or
Republicans traditionally vote by mail. The Election Defense Alliance provided the following
GA6 historical analysis:
A Comparison of Vote-By-Mail Patterns For Voters in Georgia Sixth Congressional District 2012 - 2017
ELECTION YEAR0
%Total Vote
Margin (R win
= +)
DRE* Vote-R
DRE Vote-D
%DRE Vote-
R
%DRE Vote-
D
%DRE Vote
Margin
OPSCAN** Vote-R
OPSCAN Vote-D
%OPSCAN Vote-R
%OPSCAN Vote-D
%OPSCAN Vote
Margin
%OPSCAN Vote
Margin Minus %DRE Vote
Margin***
2012 29.0% 173,826 97,642 64.0% 36.0% 28.1% 15,250 6,060 71.6% 28.4% 43.1% 15.1%
2014 32.0% 132,143 68,265 65.9% 34.1% 31.9% 6,565 2,919 69.2% 30.8% 38.4% 6.6%
2016 23.4% 185,766 117,122 61.3% 38.7% 22.7% 15,095 7,602 66.5% 33.5% 33.0% 10.4%
2012 - 2016 Aggregate 28.1% 491,735 283,029 63.5% 36.5% 26.9% 36,910 16,581 69.0% 31.0% 38.0% 11.1%
2017 - Prelim**** 3.8% 98,177 87,387 52.9% 47.1% 5.8% 1,537 5,046 23.3% 76.7% -53.3% -59.1%
2017 - Runoff 3.8% 124,557 107,017 53.8% 46.2% 7.6% 10,081 18,065 35.8% 64.2% -28.4% -35.9%
* DRE voting includes at-poll and early in-person voting.
** OPSCAN voting includes only Vote-By-Mail voting.
*** A positive (+) percentage in this column indicates Republican performed better in OPSCAN vote than in DRE vote; i.e., Republican voters were more likely than Democratic voters to use Vote-By-Mail to cast their votes.
**** In 2017 Preliminary contest, D = Ossoff, R = All other candidates (12 R, 4D); Ossoff <50% = Runoff.
This table shows that historically more GA6 Republicans than Democrats have voted by mail. In
2012, Republicans cast 71.6% of mail-in ballots while Democrats cast 28.4%. In 2014,
VoterGA GA6 Runoff Election
Statistical Analysis
Page 21 of 71
Republicans cast 69.2% of mail-in ballots while Democrats cast 30.8%. In 2012, Republicans cast
66.5% of mail-in ballots while Democrats cast about 33.5%.
In previous election years the Republican margin of victory was substantially greater than in
2017. This chart takes into consideration the margin of victory in the last three GA6 elections,
which, as a series of relatively noncompetitive and therefore unlikely-to-be-targeted contests,
establish a sound baseline for analyzing voter behavior in GA6. The Republican candidate’s
margin of victory among mail-in voters was over 11 percent greater on average than among
voters whose votes were counted in an unverifiable manner on DREs. That demonstrates a
consistently greater propensity among Republican voters, relative to their Democratic
counterparts, to use the mail-in option.
But in the highly competitive and nationally significant 2017 Runoff now under examination,
this trend dramatically reversed. It was the Democratic candidate whose performance among
mail-in voters was a staggering 36 percent better than his performance among voters whose
votes were counted on DREs in an unverifiable manner. The fact that GA6 Democratic voters do
not appear historically to be mail-in voting enthusiasts gives rise to the question of why the
reported Runoff results show that they seem to have suddenly become so to such an
overwhelming degree in 2017.
This historical trend casts some doubt on the current reported Runoff results. The next two
sections will analyze the actual GA6 Runoff mail-voters and campaign. That will help determine
whether the dramatic reversal in mail-in versus in-person voting patterns is due to an Ossoff
campaign mail-in surge or miscounting of the larger pool of unverifiable ballots. Such
miscounting may have reduced the total Ossoff vote to an extent that the mail-in and DRE
ballot count differences were amplified by comparison.
VoterGA GA6 Runoff Election
Statistical Analysis
Page 22 of 71
Runoff Mail-in Campaign Strength:
While all mail-in votes are potentially verifiable, they can still be subject to fraud or tampering
in cases of identity theft or ballot box stuffing. No such instances of mail-in fraud by election
officials or either of the campaigns was reported for the Runoff or identified in this study. The
verifiability and availability for recount of this category of ballots imposes a significant level of
deterrence to any systemic fraud involving them.
From a statistical standpoint, both campaigns ran influential appeals for mail-in votes between
the Special Election and the Runoff. During the Special Election, the Ossoff team conducted a
highly successful mail-in campaign that garnered over 76 percent of the total mail-in vote.
Statistically his campaign increased his volume of mail-in votes by over 250 percent for the
Runoff. However, in terms of vote-share percentage, the mail-in effort was not as successful,
since his share of the mail-in vote decreased over by 10 percent.
Handel’s mail-in campaign for the Runoff may have been strengthened by a decision to include
mail-in applications attached to at least one of her flyers. The flyer included a pre-addressed
mail-in ballot application that could be filled out quickly by a recipient and mailed to the local
county office once the recipient affixed postage. Although the Ossoff team also ran a strong
mail-in campaign, they did not use this particular technique. (See Exhibit 6)
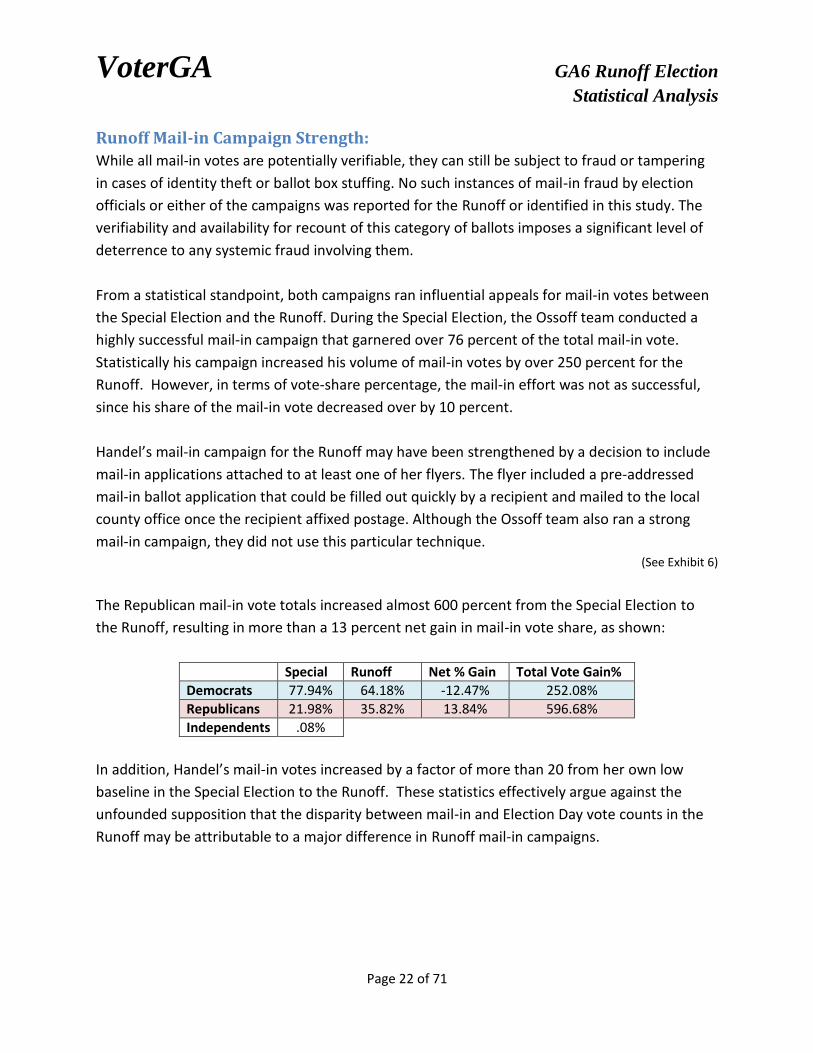
The Republican mail-in vote totals increased almost 600 percent from the Special Election to
the Runoff, resulting in more than a 13 percent net gain in mail-in vote share, as shown:
Special Runoff Net % Gain Total Vote Gain%
Democrats 77.94% 64.18% -12.47% 252.08%
Republicans 21.98% 35.82% 13.84% 596.68%
Independents .08%
In addition, Handel’s mail-in votes increased by a factor of more than 20 from her own low
baseline in the Special Election to the Runoff. These statistics effectively argue against the
unfounded supposition that the disparity between mail-in and Election Day vote counts in the
Runoff may be attributable to a major difference in Runoff mail-in campaigns.
VoterGA GA6 Runoff Election
Statistical Analysis
Page 23 of 71
Mail-in Voter Turnout Analysis
In the GA6 Runoff 28,146 mail-in votes were counted, compared to 6583 votes in the GA6
Special Election. That represents a mail-in voter turnout increase of over 327 percent. The
increase may be attributable to stronger mail-in campaigns by both parties in the Runoff and particularly
a stronger Republican mail-in campaign that nearly doubled the percentage increase for Democrats. . An
additional factor may be the heightened focus on the election and its outcome during the two-month
period between the Special on April 18 and the Runoff on June 20 during which mail-in ballots might be
cast for the Runoff.
Mail-In Voter Party Affiliation
Georgia tracks party affiliation by primary voting history. To assess party affiliation of Runoff
mail-in voters, VoterGA submitted Open Records Requests to acquire the mail-in application list
for the Runoff election and the primary voting records for the 2014 and 2016 primaries. The
mail-in application list identifies the applications processed and the accepted, canceled,
rejected and spoiled ballots that can be used to compile party affiliation statistics.
The Voter Registration ID was matched across both lists to determine the party affiliation from
the primary voting history for as many mail-in voters as possible. If any of these voters voted in
both a Democratic and Republican primary they were classified as independents. Independents
were a very small group of about 2 percent of the total affiliated. Remaining voters who voted
in at least one Democratic or Republican primary (but not the other) were categorized as a
Democrat or Republican voter, respectively.
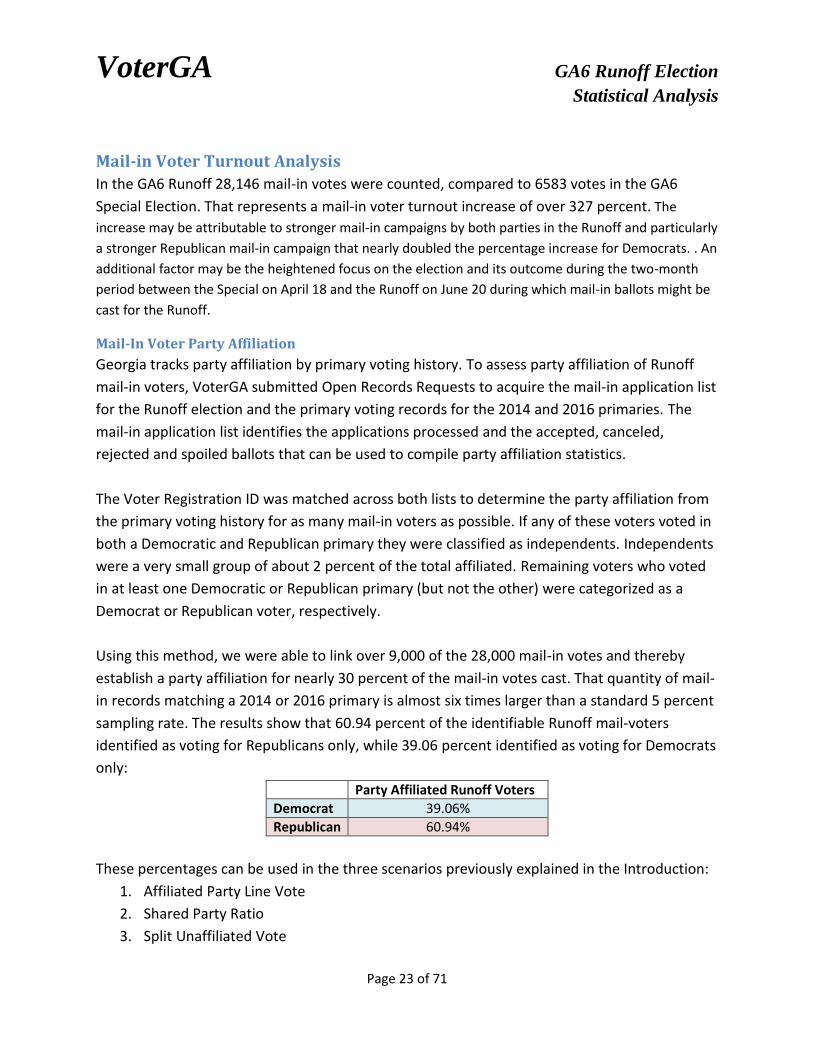
Using this method, we were able to link over 9,000 of the 28,000 mail-in votes and thereby
establish a party affiliation for nearly 30 percent of the mail-in votes cast. That quantity of mail-
in records matching a 2014 or 2016 primary is almost six times larger than a standard 5 percent
sampling rate. The results show that 60.94 percent of the identifiable Runoff mail-voters
identified as voting for Republicans only, while 39.06 percent identified as voting for Democrats
only:
Party Affiliated Runoff Voters
Democrat 39.06%
Republican 60.94%
These percentages can be used in the three scenarios previously explained in the Introduction:
1. Affiliated Party Line Vote
2. Shared Party Ratio
3. Split Unaffiliated Vote
VoterGA GA6 Runoff Election
Statistical Analysis
Page 24 of 71
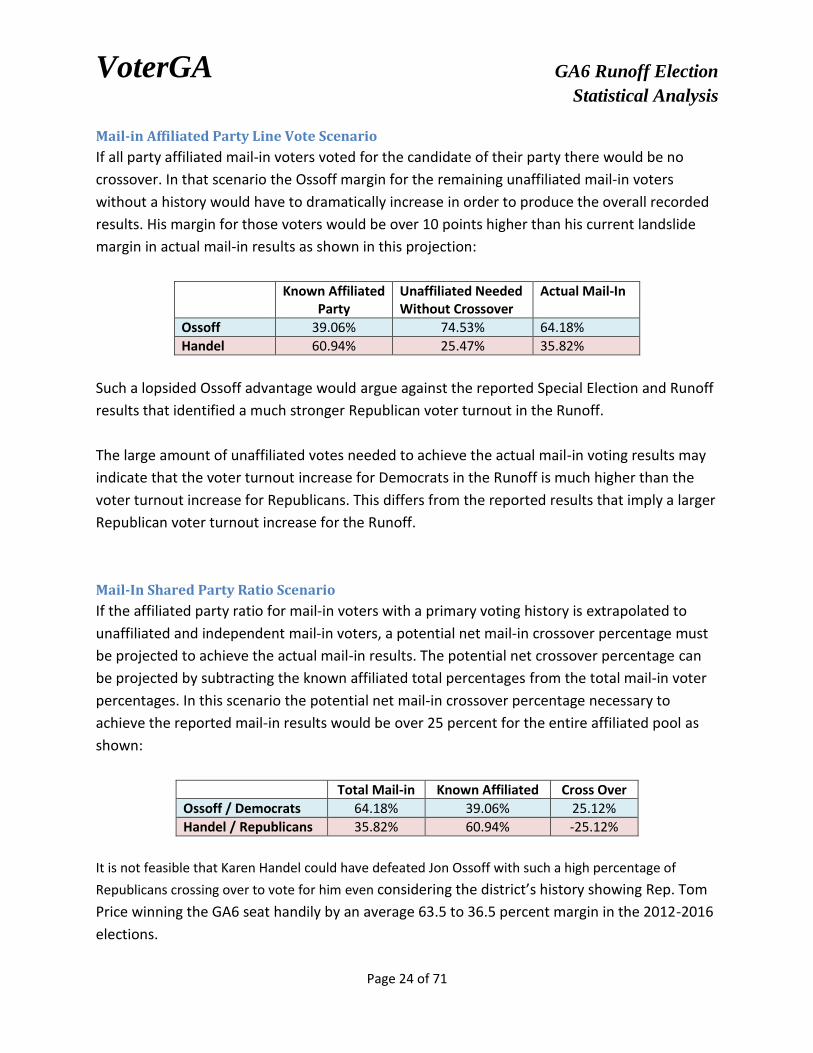
Mail-in Affiliated Party Line Vote Scenario
If all party affiliated mail-in voters voted for the candidate of their party there would be no
crossover. In that scenario the Ossoff margin for the remaining unaffiliated mail-in voters
without a history would have to dramatically increase in order to produce the overall recorded
results. His margin for those voters would be over 10 points higher than his current landslide
margin in actual mail-in results as shown in this projection:
Known Affiliated Party
Unaffiliated Needed Without Crossover
Actual Mail-In
Ossoff 39.06% 74.53% 64.18%
Handel 60.94% 25.47% 35.82%
Such a lopsided Ossoff advantage would argue against the reported Special Election and Runoff
results that identified a much stronger Republican voter turnout in the Runoff.
The large amount of unaffiliated votes needed to achieve the actual mail-in voting results may
indicate that the voter turnout increase for Democrats in the Runoff is much higher than the
voter turnout increase for Republicans. This differs from the reported results that imply a larger
Republican voter turnout increase for the Runoff.
Mail-In Shared Party Ratio Scenario
If the affiliated party ratio for mail-in voters with a primary voting history is extrapolated to
unaffiliated and independent mail-in voters, a potential net mail-in crossover percentage must
be projected to achieve the actual mail-in results. The potential net crossover percentage can
be projected by subtracting the known affiliated total percentages from the total mail-in voter
percentages. In this scenario the potential net mail-in crossover percentage necessary to
achieve the reported mail-in results would be over 25 percent for the entire affiliated pool as
shown:
Total Mail-in Known Affiliated Cross Over
Ossoff / Democrats 64.18% 39.06% 25.12%
Handel / Republicans 35.82% 60.94% -25.12%
It is not feasible that Karen Handel could have defeated Jon Ossoff with such a high percentage of
Republicans crossing over to vote for him even considering the district’s history showing Rep. Tom
Price winning the GA6 seat handily by an average 63.5 to 36.5 percent margin in the 2012-2016
elections.
VoterGA GA6 Runoff Election
Statistical Analysis
Page 25 of 71
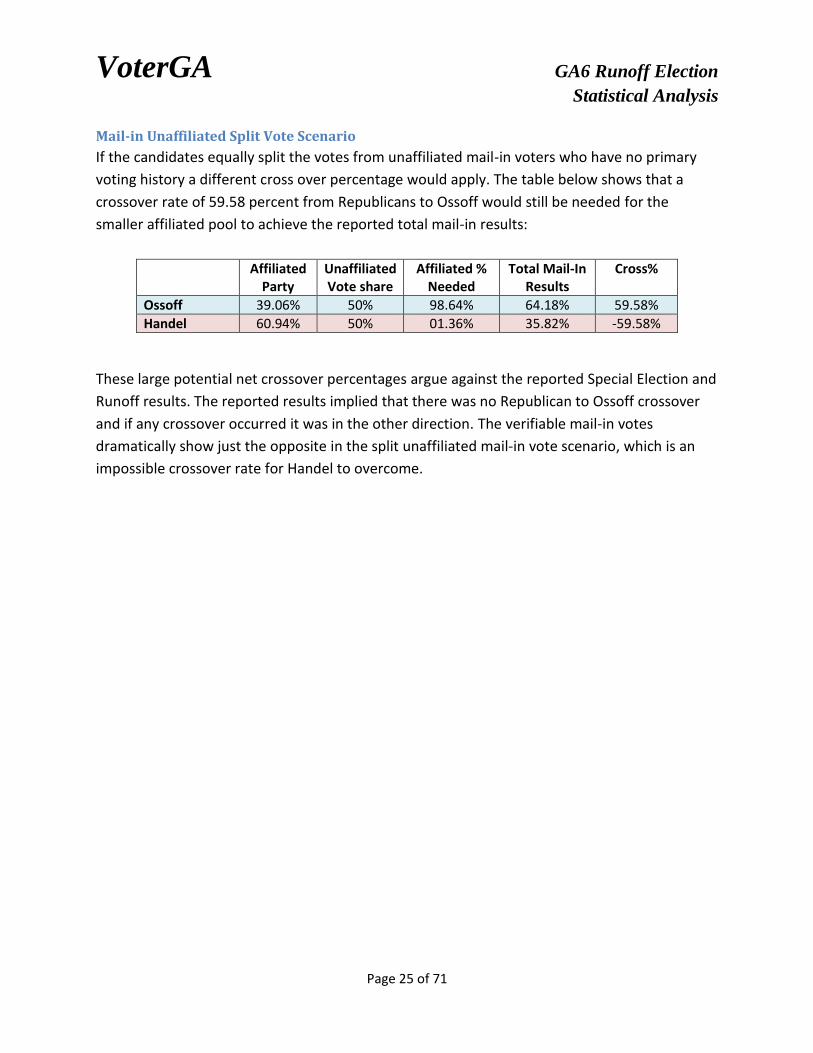
Mail-in Unaffiliated Split Vote Scenario
If the candidates equally split the votes from unaffiliated mail-in voters who have no primary
voting history a different cross over percentage would apply. The table below shows that a
crossover rate of 59.58 percent from Republicans to Ossoff would still be needed for the
smaller affiliated pool to achieve the reported total mail-in results:
Affiliated Party
Unaffiliated Vote share
Affiliated % Needed
Total Mail-In Results
Cross%
Ossoff 39.06% 50% 98.64% 64.18% 59.58%
Handel 60.94% 50% 01.36% 35.82% -59.58%
These large potential net crossover percentages argue against the reported Special Election and
Runoff results. The reported results implied that there was no Republican to Ossoff crossover
and if any crossover occurred it was in the other direction. The verifiable mail-in votes
dramatically show just the opposite in the split unaffiliated mail-in vote scenario, which is an
impossible crossover rate for Handel to overcome.
VoterGA GA6 Runoff Election
Statistical Analysis
Page 26 of 71
RUNOFF ELECTRONIC VOTING
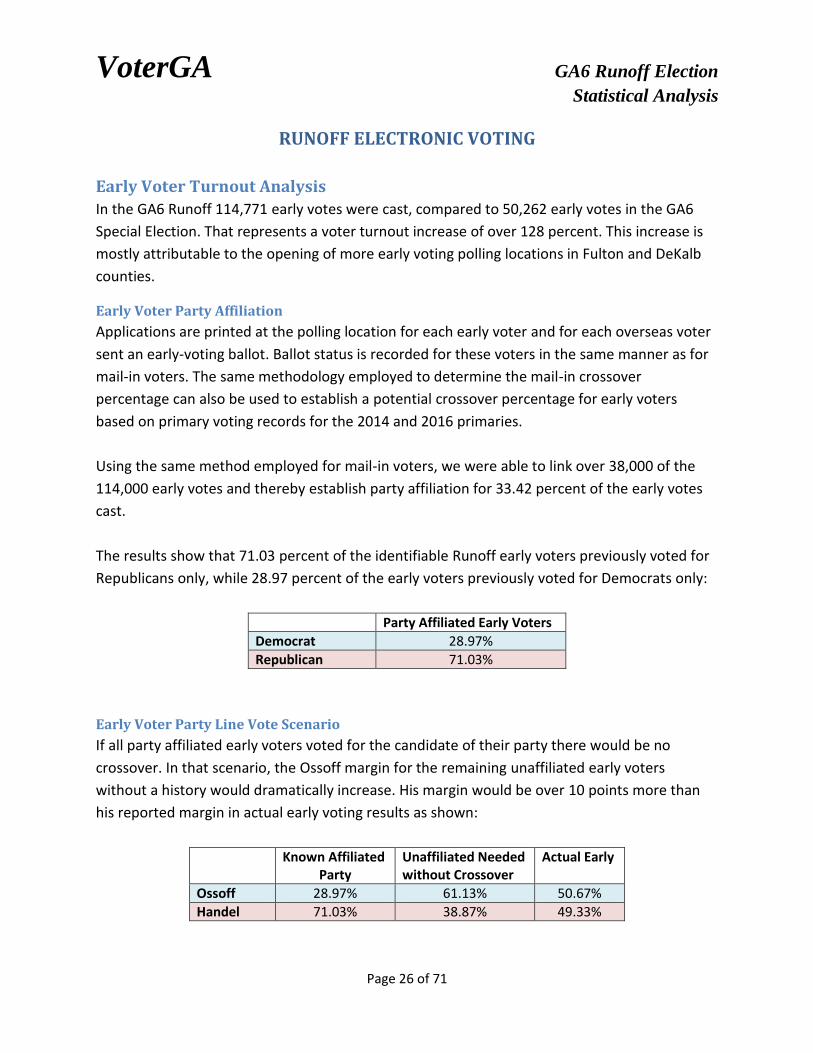
Early Voter Turnout Analysis
In the GA6 Runoff 114,771 early votes were cast, compared to 50,262 early votes in the GA6
Special Election. That represents a voter turnout increase of over 128 percent. This increase is
mostly attributable to the opening of more early voting polling locations in Fulton and DeKalb
counties.
Early Voter Party Affiliation
Applications are printed at the polling location for each early voter and for each overseas voter
sent an early-voting ballot. Ballot status is recorded for these voters in the same manner as for
mail-in voters. The same methodology employed to determine the mail-in crossover
percentage can also be used to establish a potential crossover percentage for early voters
based on primary voting records for the 2014 and 2016 primaries.
Using the same method employed for mail-in voters, we were able to link over 38,000 of the
114,000 early votes and thereby establish party affiliation for 33.42 percent of the early votes
cast.
The results show that 71.03 percent of the identifiable Runoff early voters previously voted for
Republicans only, while 28.97 percent of the early voters previously voted for Democrats only:
Party Affiliated Early Voters
Democrat 28.97%
Republican 71.03%
Early Voter Party Line Vote Scenario
If all party affiliated early voters voted for the candidate of their party there would be no
crossover. In that scenario, the Ossoff margin for the remaining unaffiliated early voters
without a history would dramatically increase. His margin would be over 10 points more than
his reported margin in actual early voting results as shown:
Known Affiliated Party
Unaffiliated Needed without Crossover
Actual Early
Ossoff 28.97% 61.13% 50.67%
Handel 71.03% 38.87% 49.33%

VoterGA GA6 Runoff Election
Statistical Analysis
Page 27 of 71
Such a landslide Ossoff advantage for nearly two thirds of the early voters would be highly
unlikely given the reported Runoff results implying that Ossoff barely edged Handel in early
voting. It also argues against the reported results that identified a much stronger Republican
early voter turnout in the Runoff.
The large amount of unaffiliated votes needed to achieve the actual early voting results may
indicate that the voter turnout increase for Democrats in the Runoff is much higher than the
voter turnout increase for Republicans. This differs from the reported results that imply a larger
Republican voter turnout increase percentage for the Runoff.
Early Voter Shared Party Ratio Scenario
If the affiliated party ratio for early voters with a primary voting history is extrapolated to
unaffiliated and independent early voters, a potential net early crossover percentage must be
projected to achieve the actual early voting results. The potential net crossover percentage can
be projected by subtracting the known affiliated total percentages from the total early voter
percentages. In this scenario the potential net early voting crossover percentage necessary to
achieve the reported early voting results would be over 21 percent for the entire affiliated pool
as shown:
Total Early Known Affiliated Cross Over
Ossoff / Democrats 50.67% 28.97% 21.70%
Handel / Republicans 49.33% 71.03% -21.70%
Crossover rates should vary only slightly by voting type. It is not feasible that Karen Handel could have
defeated Jon Ossoff with such a high percentage of Republicans crossing over to vote for him even
considering the district’s history showing Rep. Tom Price winning the GA6 seat handily by an
average 63.5 to 36.5 percent margin in the 2012-2016 elections.
Early Voter Unaffiliated Split Vote Scenario
If the candidates equally split the votes from unaffiliated early voters who have no primary
voting history a different cross over percentage would apply. The table below shows that an
implausible crossover rate of 23.08 percent from Republicans to Ossoff would still be needed
for the smaller affiliated pool to achieve the reported total early voting results:
Affiliated Party
Unaffiliated Vote share
Affiliated % Needed
Total Early Results
Crossover %
Ossoff 28.97% 50% 52.06% 50.67% 23.08%
Handel 71.03% 50% 47.94% 49.33% -23.08%
VoterGA GA6 Runoff Election
Statistical Analysis
Page 28 of 71
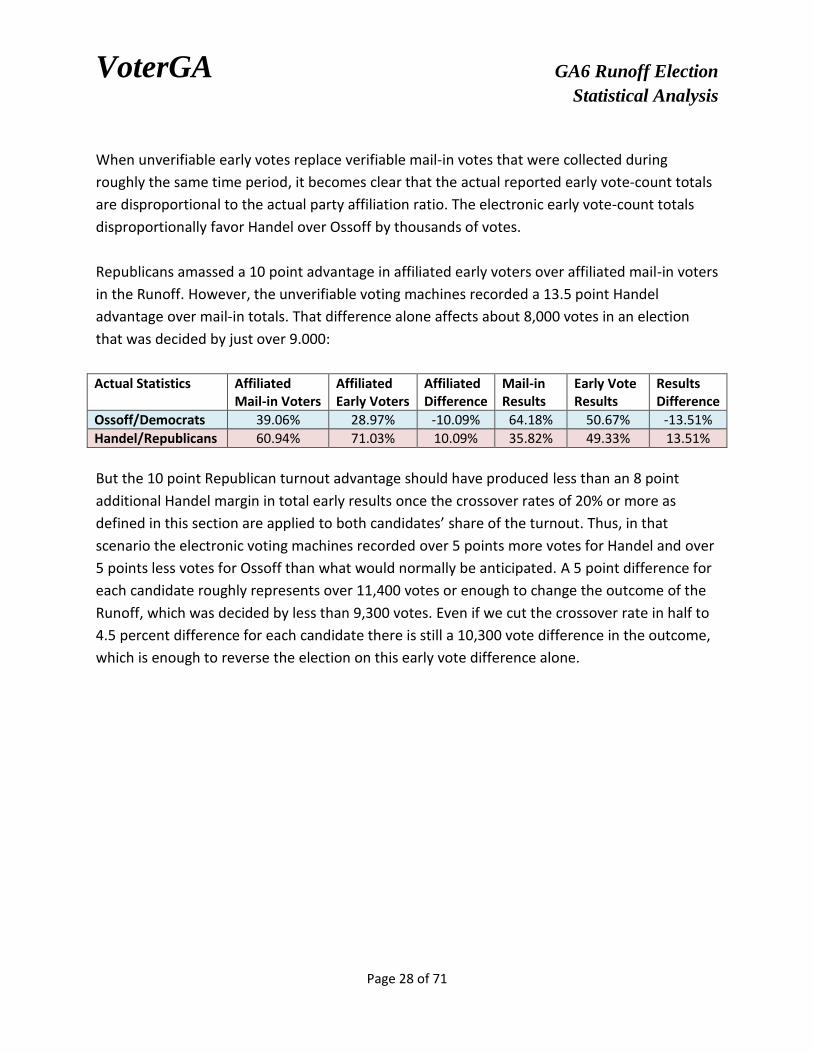
When unverifiable early votes replace verifiable mail-in votes that were collected during
roughly the same time period, it becomes clear that the actual reported early vote-count totals
are disproportional to the actual party affiliation ratio. The electronic early vote-count totals
disproportionally favor Handel over Ossoff by thousands of votes.
Republicans amassed a 10 point advantage in affiliated early voters over affiliated mail-in voters
in the Runoff. However, the unverifiable voting machines recorded a 13.5 point Handel
advantage over mail-in totals. That difference alone affects about 8,000 votes in an election
that was decided by just over 9.000:
Actual Statistics Affiliated Mail-in Voters
Affiliated Early Voters
Affiliated Difference
Mail-in Results
Early Vote Results
Results Difference
Ossoff/Democrats 39.06% 28.97% -10.09% 64.18% 50.67% -13.51%
Handel/Republicans 60.94% 71.03% 10.09% 35.82% 49.33% 13.51%
But the 10 point Republican turnout advantage should have produced less than an 8 point
additional Handel margin in total early results once the crossover rates of 20% or more as
defined in this section are applied to both candidates’ share of the turnout. Thus, in that
scenario the electronic voting machines recorded over 5 points more votes for Handel and over
5 points less votes for Ossoff than what would normally be anticipated. A 5 point difference for
each candidate roughly represents over 11,400 votes or enough to change the outcome of the
Runoff, which was decided by less than 9,300 votes. Even if we cut the crossover rate in half to
4.5 percent difference for each candidate there is still a 10,300 vote difference in the outcome,
which is enough to reverse the election on this early vote difference alone.
VoterGA GA6 Runoff Election
Statistical Analysis
Page 29 of 71
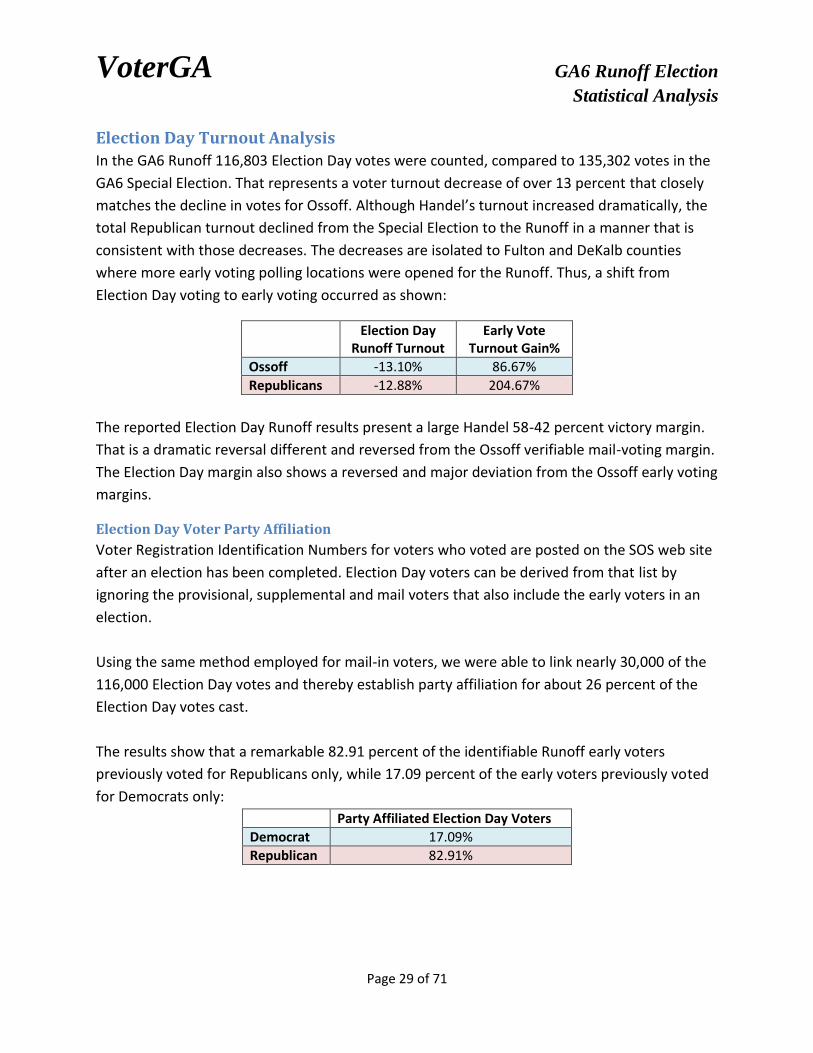
Election Day Turnout Analysis
In the GA6 Runoff 116,803 Election Day votes were counted, compared to 135,302 votes in the
GA6 Special Election. That represents a voter turnout decrease of over 13 percent that closely
matches the decline in votes for Ossoff. Although Handel’s turnout increased dramatically, the
total Republican turnout declined from the Special Election to the Runoff in a manner that is
consistent with those decreases. The decreases are isolated to Fulton and DeKalb counties
where more early voting polling locations were opened for the Runoff. Thus, a shift from
Election Day voting to early voting occurred as shown:
Election Day Runoff Turnout
Early Vote Turnout Gain%
Ossoff -13.10% 86.67%
Republicans -12.88% 204.67%
The reported Election Day Runoff results present a large Handel 58-42 percent victory margin.
That is a dramatic reversal different and reversed from the Ossoff verifiable mail-voting margin.
The Election Day margin also shows a reversed and major deviation from the Ossoff early voting
margins.
Election Day Voter Party Affiliation
Voter Registration Identification Numbers for voters who voted are posted on the SOS web site
after an election has been completed. Election Day voters can be derived from that list by
ignoring the provisional, supplemental and mail voters that also include the early voters in an
election.
Using the same method employed for mail-in voters, we were able to link nearly 30,000 of the
116,000 Election Day votes and thereby establish party affiliation for about 26 percent of the
Election Day votes cast.
The results show that a remarkable 82.91 percent of the identifiable Runoff early voters
previously voted for Republicans only, while 17.09 percent of the early voters previously voted
for Democrats only:
Party Affiliated Election Day Voters
Democrat 17.09%
Republican 82.91%

VoterGA GA6 Runoff Election
Statistical Analysis
Page 30 of 71
Election Day Affiliated Party Line Vote Scenario
If all of the party affiliated Election Day projected voters voted for the candidate of their party,
there would be no crossover. In that scenario, the Handel margin decreases by nearly 10 points
to the degree where Ossoff actually has more of the unaffiliated Election Day voters than
Handel as shown:
Affiliated Party Unaffiliated Needed without Crossover
Actual Election Day Vote Count
Ossoff 17.09% 50.32% 41.84%
Handel 82.91% 49.68% 58.16%
Such an Ossoff advantage for two thirds of those Election Day voters argues against the
reported Runoff results that show Handel with a huge Election Day margin. The large amount of
unaffiliated votes needed to achieve the actual Election Day voting results may indicate that the
voter turnout increase for Democrats in the Runoff is much higher than the voter turnout
increase for Republicans. This differs from the reported results that imply a larger Republican
voter turnout increase for the Runoff.
Election Day Shared Party Ratio Scenario
If the affiliated party ratio for Election Day voters with a primary voting history is extrapolated
to unaffiliated and independent early voters, a potential net Election Day crossover percentage
must be projected to achieve the actual Election Day voting results. The potential net crossover
percentage can be projected by subtracting the known affiliated total percentages from the
total Election Day voter percentages. In this scenario the potential net Election Day voting
crossover percentage necessary to achieve the reported Election Day results would be over 24
percent for the entire affiliated pool as shown:
Total Election Day Affiliated Party Crossover%
Ossoff 41.84% 17.09% 24.75%
Handel 58.16% 82.91% -24.75%
Crossover rates should vary only slightly by voting type. It may not be feasible that Handel could
have defeated Ossoff with such a high crossover rate of Republicans voting for him during other
types of voting.
VoterGA GA6 Runoff Election
Statistical Analysis
Page 31 of 71
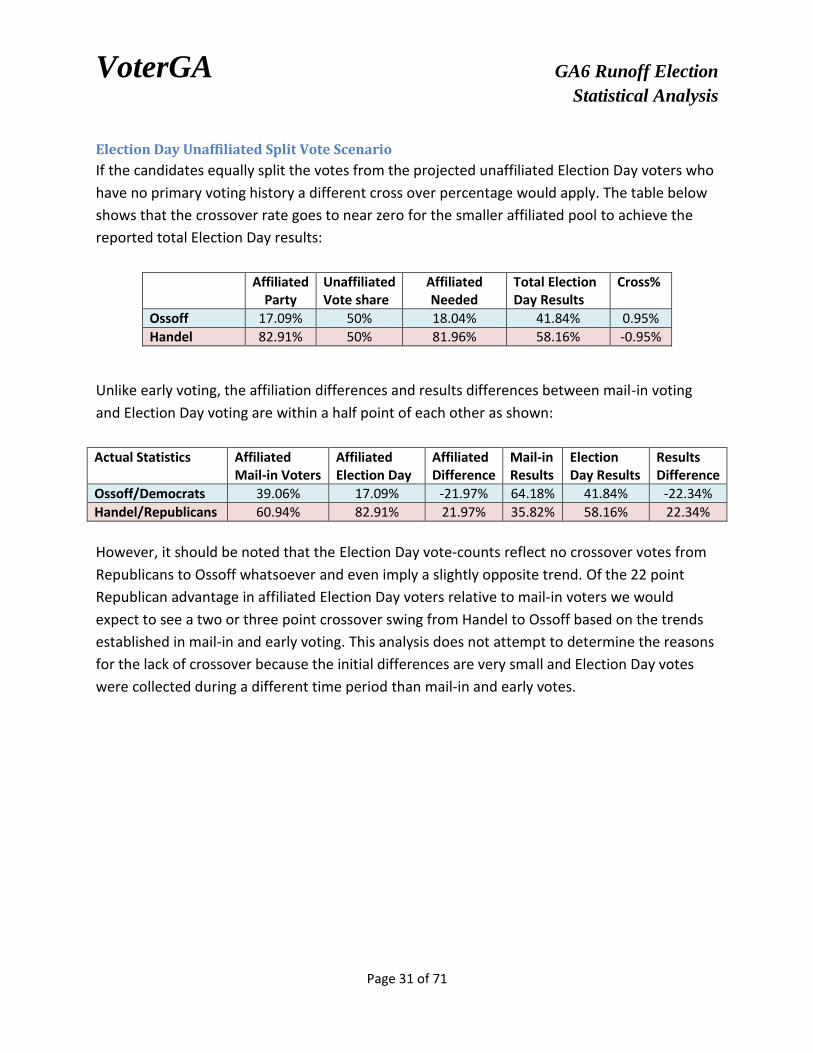
Election Day Unaffiliated Split Vote Scenario
If the candidates equally split the votes from the projected unaffiliated Election Day voters who
have no primary voting history a different cross over percentage would apply. The table below
shows that the crossover rate goes to near zero for the smaller affiliated pool to achieve the
reported total Election Day results:
Affiliated Party
Unaffiliated Vote share
Affiliated Needed
Total Election Day Results
Cross%
Ossoff 17.09% 50% 18.04% 41.84% 0.95%
Handel 82.91% 50% 81.96% 58.16% -0.95%
Unlike early voting, the affiliation differences and results differences between mail-in voting
and Election Day voting are within a half point of each other as shown:
Actual Statistics Affiliated Mail-in Voters
Affiliated Election Day
Affiliated Difference
Mail-in Results
Election Day Results
Results Difference
Ossoff/Democrats 39.06% 17.09% -21.97% 64.18% 41.84% -22.34%
Handel/Republicans 60.94% 82.91% 21.97% 35.82% 58.16% 22.34%
However, it should be noted that the Election Day vote-counts reflect no crossover votes from
Republicans to Ossoff whatsoever and even imply a slightly opposite trend. Of the 22 point
Republican advantage in affiliated Election Day voters relative to mail-in voters we would
expect to see a two or three point crossover swing from Handel to Ossoff based on the trends
established in mail-in and early voting. This analysis does not attempt to determine the reasons
for the lack of crossover because the initial differences are very small and Election Day votes
were collected during a different time period than mail-in and early votes.
VoterGA GA6 Runoff Election
Statistical Analysis
Page 32 of 71
OVERALL VOTING ANALYSIS As previously mentioned the GA6 Runoff had a voter turnout increase of 35.18 percent over the
Special Election. One of the most fundamental questions to answer about the GA6 Runoff is
who benefited from that increased turnout. This voter turnout analysis is based on intrinsic
election data with actual party affiliation voting history of Runoff voters. The overall turnout
can be analyzed for each of the three scenarios by combining the statistics from the mail-in,
Election Day and early voting vote types.
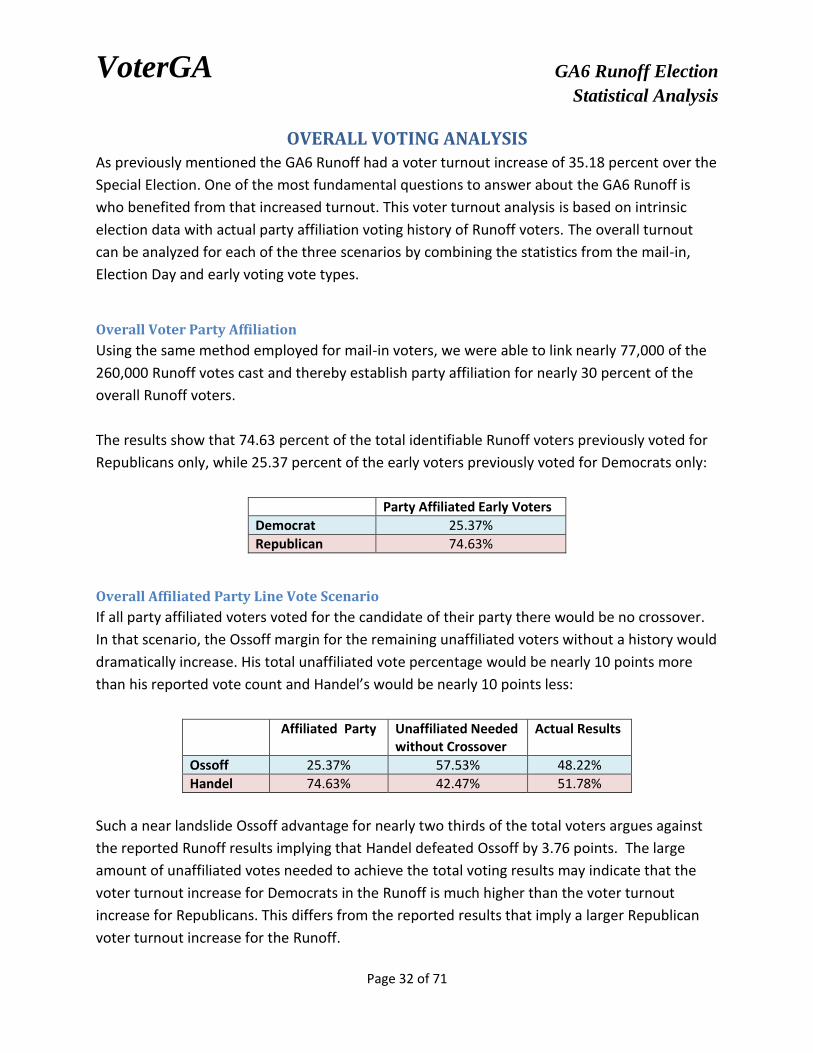
Overall Voter Party Affiliation
Using the same method employed for mail-in voters, we were able to link nearly 77,000 of the
260,000 Runoff votes cast and thereby establish party affiliation for nearly 30 percent of the
overall Runoff voters.
The results show that 74.63 percent of the total identifiable Runoff voters previously voted for
Republicans only, while 25.37 percent of the early voters previously voted for Democrats only:
Party Affiliated Early Voters
Democrat 25.37%
Republican 74.63%
Overall Affiliated Party Line Vote Scenario
If all party affiliated voters voted for the candidate of their party there would be no crossover.
In that scenario, the Ossoff margin for the remaining unaffiliated voters without a history would
dramatically increase. His total unaffiliated vote percentage would be nearly 10 points more
than his reported vote count and Handel’s would be nearly 10 points less:
Affiliated Party Unaffiliated Needed without Crossover
Actual Results
Ossoff 25.37% 57.53% 48.22%
Handel 74.63% 42.47% 51.78%
Such a near landslide Ossoff advantage for nearly two thirds of the total voters argues against
the reported Runoff results implying that Handel defeated Ossoff by 3.76 points. The large
amount of unaffiliated votes needed to achieve the total voting results may indicate that the
voter turnout increase for Democrats in the Runoff is much higher than the voter turnout
increase for Republicans. This differs from the reported results that imply a larger Republican
voter turnout increase for the Runoff.

VoterGA GA6 Runoff Election
Statistical Analysis
Page 33 of 71
Overall Shared Party Ratio Scenario
If the affiliated party ratio for all voters with a primary voting history is extrapolated to the
unaffiliated and independent voters, a potential net early crossover percentage must be
projected to achieve the actual voting results. The potential net crossover percentage can be
projected by subtracting the known affiliated total percentages from the total voter
percentages. In this scenario the potential net voting crossover percentage necessary to
achieve the overall reported results would be over 22 percent for the entire affiliated pool as
shown:
Actual
Results Actual
Affiliated Crossover
Ossoff / Democrats 48.22% 24.77% 22.85%
Handel / Republicans 51.78% 75.23% -22.85%
It is not feasible that Karen Handel could have defeated Jon Ossoff with such a high percentage of
Republicans crossing over to vote for him even considering the district’s history showing Rep. Tom
Price winning the GA6 seat handily by an average 63.5 to 36.5 percent margin in the 2012-2016
elections.
Overall Unaffiliated Split Vote Scenario
If the candidates equally split the votes from all unaffiliated voters who have no primary voting
history a different cross over percentage would apply. The table below shows that a crossover
rate of over 18 percent from Republicans to Ossoff would still be needed for the smaller
affiliated pool to achieve the reported total results which Handel reportedly won:
Affiliated Party
Unaffiliated Vote share
Affiliated Needed
Total Runoff Votes
Crossover%
Ossoff 25.37% 50% 43.66% 48.22% 18.30%
Handel 74.63% 50% 56.33% 51.78% -18.30%
It is not feasible that Karen Handel could have defeated Jon Ossoff with such a high percentage of
Republicans crossing over to vote for him.

VoterGA GA6 Runoff Election
Statistical Analysis
Page 34 of 71
Special Election vs. Runoff Comparative Analysis
In the GA6 Runoff 260,316 votes were counted, compared to 192,569 votes in the GA6 Special
Election. That represents a voter turnout increase of 35.18 percent. In the Special Election, 11
Republican candidates garnered 50.97 percent of the vote while four Democrats took 48.92
percent and two Independent candidates received 0.9 percent of the votes. In the Runoff, Jon
Ossoff’s totals remained flat and showed less than a tenth of a percentage increase from 48.13
percent to 48.22 percent. Karen Handel’s totals went from 19.77 percent to 51.78 percent.
The 1,704 other Democrat and Independent votes are statistically inadequate for analysis.
However, the block of 60,000 other Republican votes that comprise over 30 percent of the total
Special Election votes cast is more than sufficient. Reported results indicate that this block
voted exclusively for Handel in the Runoff with no crossover gain whatsoever for Ossoff. The
reported Runoff results even imply a crossover in the opposite direction if turnout was equal.
The early voting percentage for Ossoff decreased by over 11 percent in all three counties
between the Special Election and the Runoff, although he was competing against 17 candidates
in the Special Election and only one candidate in the Runoff. There was no comparable uptick in
his Mail-in or Election Day vote counts to indicate a constituent vote-type shift as an
explanation. Fulton and DeKalb counties opened several additional early voting poll locations
for the Runoff, thus increasing early voting percentages. The reported results do not reflect
these conditions and give the impression that some early votes for Ossoff just disappeared. (See Exhibit 10)
A previous section established a potential verifiable Runoff net crossover rate of up to 25
percent from Republican leaning voters to Ossoff. The crossover pattern calculations included
previous primary voters who were part of the increased voter turnout. The previous turnout
analysis sections show that if the defined crossover rate is not applied to the unaffiliated two
thirds of voters then the unaffiliated voting block must reflect unrealistic landslide margins for
Ossoff to achieve the reported election voting results. Such landslide margins would be driven
by increased Democrat voter turnout for the Runoff which argues against the reported results
that imply an increased Republican voter turnout.
Such a clean Handel sweep of opponent votes could only be achieved by a significant gain in
Republican voter turnout in the 35 percent increase for the runoff. However, the actual party
affiliation statistics, representing 30 percent of the total vote, show a 3 point Democrat to
Republican shift. Statistical evidence indicates that Ossoff was more likely than Handel to gain
a greater share of unaffiliated votes, which represent the other 70 percent of the total votes.

VoterGA GA6 Runoff Election
Statistical Analysis
Page 35 of 71
Thus, the increase in Republican Runoff turnout is somewhat dubious. If Handel and Ossoff
evenly split the “new” voters, Handel would have to pick up 105% of her Special Election
Republican opponent votes or 102% of the votes from all her Special Election opponents,
including Democrats and Independents. (See note)
Special Election Votes
Runoff Total Votes
Turnout Gain
Handel New Split
Handel Total Runoff
Handel Special Election
Special Republican Opponents
Handel Runoff - Handel Special - Handel Split
Percent Diff
192,569 260,316 67,747 33,873 134,799 38,071 60,121 62,855 105% Note: Subtract total Special Election votes from total Runoff votes to get Turnout Gain. Divide that by 2 to get the
Handel new voter split of gain. Subtract Handel new voter split and Handel Special Election votes from her total
Runoff votes. Compare that number with her Special Election total votes as a projected percentage:
As miraculous as such a feat would be, it is made still more improbable when we take into
account what the crossover analyses revealed: that either core Republican voters were crossing
over to Ossoff in large numbers or unaffiliated (i.e., new to this election or not motivated to
vote in party primaries) voters broke for Ossoff in landslide proportions. Under either of those
scenarios (some combination of which was revealed to be inescapable by the crossover analysis
of mail-in and early voting), an even split of the “new” Runoff voters (who had not participated
in the April 18 Special Election) would have been a major stretch for Handel—necessitating an
ever more impossible pick up of a proportion increasingly exceeding 100 percent of the votes
cast for all her and Ossoff’s Special Election opponents.
The well-known political strategies of the two campaigns add further to the dubious nature of
Handel picking up large blocks of unaffiliated voters. Her campaign focused on getting out the
vote for existing Republicans who had historically given former U.S. Congressman Price a near
two-to-one victory margin in the previous three GA6 elections. The Ossoff campaign ran a large
outreach program with many house parties to meet independent 6th District voters face to face.
His campaign registered roughly 100 new voters per day including about 8,000+ new voters
during the April and May court-ordered extended registration period. 6th District Republican
campaign leaders acknowledge that there was likely a net Republican loss on crossover but
were unconcerned because they only needed to focus on the existing strong Republican base.
Ossoff supporters enthusiastically campaigned into and through the Runoff as the race
intensified. Core Republican supporters were much more enthusiastic about having 11 Special
Election candidates than when their candidate did not advance to the Runoff. Many were
particularly apathetic about Handel after her series of hostile corruption allegations against
Nathan Deal during their 2010 Republican gubernatorial primary.

VoterGA GA6 Runoff Election
Statistical Analysis
Page 36 of 71
SUMMARY OF FINDINGS
The previous statistical analysis sections identify evidence indicating the reported results for
the unverifiable Election Day and early voting may be either correct or incorrect. This section
identifies supporting conditions that cannot be statistically evaluated for those alternatives.
Statistics Indicating Result Correctness
The identified statistical evidence indicating the reported unverifiable Election Day and early
voting results may be correct includes:
1. The Runoff results are reasonably consistent across county boundaries, thus indicating
that any significant localized fraud, tampering or error is unlikely;
2. The total percentages of votes cast for Democrats and Republicans in the Special
Election and the Runoff are within 1 percent of each other and thus show some
consistency although they cannot be verified;
3. The total percentages of early votes cast for Democrats and Republicans in the Runoff
decreased consistently when more early voting poll locations were opened in Fulton and
DeKalb counties;
4. Jon Ossoff’s vote percentage decreased consistently from the Special Election to the
Runoff across mail-in, early voting, and Election Day voting types and thus Handel’s
victory could be attributable to increased Republican voter turnout.
5. When actual Election Day vote totals are compared with the Election Day voter Party
Affiliation the amount of difference is closely aligned with the same comparison for
verifiable mail-in voters
6. The Republican to Democrat ration of affiliated party voters increased slightly from the
Special Election to the Runoff
Conditions that Support Result Correctness
Conditions that have no mechanism for statistical analysis but support statistics indicating that
the reported election results correct are:
1. GA6 is heavily oriented toward Republicans, as demonstrated by Tom Price winning the
last three elections by an average margin of 63.5 percent to 36.5 percent (though
Donald Trump took GA6 by only a 2 percent margin in November 2016);
2. Late polls conducted during the last few days of the Runoff campaign indicated a slight
trend in percentages from Jon Ossoff, the consistent poll leader, to Karen Handel.

VoterGA GA6 Runoff Election
Statistical Analysis
Page 37 of 71
Statistical Disparities Indicating Results are In Doubt
The statistical analysis defines serious disparities between the verifiable and unverifiable
reported results. It also cites statistical evidence that rebut unsubstantiated speculation as to
why the disparities exist. These disparities and statistical evidence that cast doubt on the
accuracy of the election results are categorized as follows:
Unverifiable vs. Verifiable Vote Counts
1. While Karen Handel was pronounced winner of the unverifiable GA6 Runoff, Jon Ossoff
won verifiable mail-in voting, representing over 10 percent of the total votes cast, by a
landslide 64.16 percent to 35.64 percent margin;
2. The only other type of verifiable votes cast, the provisional votes, corroborate the mail-
in vote totals as Ossoff won provisional voting by a landslide 73 to 27 percent margin;
3. The verifiable votes cast, representing 11.04 percent of the total votes, show Ossoff
with a 64.37 to 35.63 percent margin while the unverifiable votes, representing 88.96
percent of the votes cast show a 53.79 to 46.21 percent Handel margin;
Precinct Deviation Analysis
1. 174 of 208 precincts had 20+ point swings between the mail-in vote margin and the
Election Day vote percentage (e.g. 55 to 45 percent vs. 45 to 55 percent; 65 to 35
percent vs. 55 to 45);
2. 116 precincts had 40+ point swings between the mail-in vote margin and the Election
Day vote margin (e.g. 60 to 40 percent vs. 40 to 60 percent; 55 to 45 percent vs. 35 to 65
percent);
3. 41 precincts had 60+ point swings between the mail-in vote margin and the Election Day
vote margin (e.g. 65 to 35 percent vs. 35 to 65 percent; 75 to 25 percent vs 45 to 55
percent);
4. In only three full GA6 precincts did the swing from mail-in vote margin to Election Day
margin favor Ossoff and none reached a 20 point total swing.
Mail-in Voting Analysis
1. The historical analysis of mail-in voters shows Republicans averaged an 11 point greater
margin of victory by mail than the overall election victory margin, thus refuting
unfounded speculation that Ossoff’s large mail-in voting margin in the GA6 Runoff
reflected a normal trend of GA6 Democratic leaning voters to vote by mail;
2. The strong mail-in statistical improvement from the Special Election to the Runoff for
Karen Handel relative to both her own individual showing and the collective showing of
all Republican candidates among Special Election mail-in voters, refute unfounded
VoterGA GA6 Runoff Election
Statistical Analysis
Page 38 of 71
speculation that the Ossoff Runoff mail-in campaign was far superior to the Handel
Runoff mail-in campaign;
3. The actual primary voting history of Runoff mail-in voters shows that there were more
previous Republican affiliated voters than Democratic affiliated voters by a 58 to 41
percent margin, thus refuting speculation that Ossoff’s large mail-in voting margin was
achieved because far more Democrats than Republicans voted in the Runoff by mail;
4. The mail-in historical analysis, mail-in primary voting affiliation analysis, and mail-in
party campaign strength statistics corroborate each other’s findings;
5. There is no other known statistical evidence to explain the difference between
potentially verifiable mail-in vote counts and unverifiable electronic vote counts
Mail-in Voter Turnout Analysis
1. If unaffiliated mail-in voters had the same Republican and Democratic ratios as affiliated
mail-in voters established from their 2014 and 2016 primary voting history, a potential
net crossover rate of over 25 percent from Republican voters to Jon Ossoff would be
required for the entire affiliated pool to achieve the reported mail-in results;
2. If all affiliated mail-in voters voted according to their 2014 and 2016 primary voting
history (i.e., party line, zero crossover), Ossoff would have captured unaffiliated mail-in
voters by a 75-25 percent margin, 10 points higher than the reported mail-in results;
3. If Handel and Ossoff equally split unaffiliated mail-in voters a potential net crossover
rate of nearly 60% percent from Republican voters to Jon Ossoff would be required for
the smaller affiliated pool to achieve the reported mail-in results;
4. Based on actual Runoff results and historical GA6 elections, It is not feasible that Karen
Handel could have won the GA6 Runoff by 3.76 points with a 25 percent or higher
Republican to Ossoff verifiable crossover rate;
5. It is unlikely that Ossoff could have garnered 75 percent of all unaffiliated mail-in votes
to achieve the reported results and overcome party line voting when Republicans had a
61 to 39 percent turnout advantage among affiliated mail-in voters.
Early Voter Turnout Analysis
1. If unaffiliated early voters had the same Republican and Democratic ratios as affiliated
early voters established from their 2014 and 2016 primary voting history, a potential net
crossover rate of over 21 percent from Republican voters to Jon Ossoff would be
required for the entire affiliated pool to achieve the reported early voting results;
2. If all affiliated early voters voted according to their 2014 and 2016 primary voting
history (i.e., party line, zero crossover), Ossoff would have captured the unaffiliated
early voters by a 61 to 39 percent margin, 10 points higher than the reported early
voting results;
VoterGA GA6 Runoff Election
Statistical Analysis
Page 39 of 71
3. If Handel and Ossoff equally split unaffiliated early voters, a potential net crossover rate
of over 23 percent from Republican early voters to Ossoff would be required for the
smaller affiliated pool to achieve the reported early voting results;
4. It is not feasible that Handel could have won the Runoff if there was a 21 percent or
higher Republican to Ossoff early voting crossover rate and comparable crossover rates
for the other types of voting;
5. It is not feasible that Ossoff could have reached a 61 to 39 percent margin of unaffiliated
early votes to achieve the reported results and overcome party line voting when
Republicans had a 71 to 29 percent turnout advantage among affiliated early voters;
6. When unverifiable early votes replace verifiable mail-in votes that were collected during
the same time period the actual electronic vote-count totals change disproportionally to
the actual party affiliation in favor of Handel over Ossoff. The 7 point total swing
favoring Handel and slighting Ossoff is significant enough when crossover is applied to
indicate a potential vote manipulation that may have changed the Runoff outcome.
Election Day Voter Turnout Analysis
1. If unaffiliated Election Day voters have the same Republican and Democrat ratios as the
affiliated Election Day voters established from the 2014 and 2016 primary voting history
a potential net crossover rate of over 24 percent from Republican voters to Jon Ossoff
for the entire affiliated pool would be required to achieve reported Election Day results;
2. If the affiliated Election Day voters voted according to their 2014 and 2016 primary
voting history (i.e., party line, zero crossover), Ossoff would have captured the
unaffiliated Election Day voters with just over 50 percent of their votes or about 8.5
points higher than the reported Election Day results;
3. If Handel and Ossoff equally split the projected unaffiliated Election Day voters a
potential net crossover rate of just under 1 percent from Republican Election Day voters
to Jon Ossoff for the smaller affiliated pool would be required to achieve the reported
Election Day results;
4. It is not feasible that Handel could have won the Election Day votes by a 58 to 41
percent margin if there was a 24 percent Republican to Ossoff crossover rate;
5. It is not feasible that Handel could have won Election Day voting by a 58 to 41 percent
margin if Ossoff garnered a majority for unaffiliated Election Day voters that are
estimated to be nearly two thirds of the total Election Day voters;
6. If the candidates split unaffiliated votes equally, it is unlikely that the crossover rate
would have dropped from over 20 percent for early voting and verifiable mail-in voting
to near zero for Election Day voting;
VoterGA GA6 Runoff Election
Statistical Analysis
Page 40 of 71
Overall Turnout Analysis
1. If unaffiliated Runoff voters have the same Republican and Democratic ratios as the
affiliated voters established from 2014 and 2016 primary voting history a potential net
crossover rate of over 27 percent from Republican voters to Jon Ossoff would be
required for the entire affiliated pool to achieve the reported overall results;
2. If all affiliated Runoff voters voted according to 2014 and 2016 primary voting history
(i.e., party line, zero crossover), Ossoff would have captured the unaffiliated Runoff
voters by a 58 to 42 percent margin, 10 points higher than the reported overall results;
3. If Handel and Ossoff equally split unaffiliated early voters a potential net crossover rate
of over 18 percent percent from Republican early voters to Jon Ossoff would be
required for the smaller affiliated pool to achieve the reported overall results;
4. It is not feasible that Karen Handel could have won the Runoff if there was a 27 percent
Republican to Ossoff crossover rate;
5. It is not feasible that Handel could have won the Runoff by 3.76 points if Ossoff
overcame party line voting and achieved the results with a projected 58 to 42 percent
margin among unaffiliated voters that represent nearly two thirds of the total voters
6. Based on actual Runoff results and historical GA6 elections, It is not feasible that Karen
Handel could have won the GA6 Runoff by 3.76 points with a 18 percent or higher
Republican to Ossoff combined crossover rate for all voting types;

VoterGA GA6 Runoff Election
Statistical Analysis
Page 41 of 71
Conditions that Support Statistical Disparities
Conditions that have no mechanism for statistical analysis but support statistics indicating that
the reported election results may be incorrect are:
1. The disparities between verifiable and unverifiable votes are unprecedented in the
experience of the election forensics analysts who have reviewed these findings and
compared them with other elections throughout the country;
2. There is no clear, benign rationale to explain the disparities between the verifiable mail-
in vote-counts and unverifiable Election Day vote-counts recorded for the GA6 Runoff,
unless consideration is given to the potential manipulation of unverifiable vote-counts,
which is far easier and carries far less risk of detection than any attempt to manipulate
potentially verifiable vote counts;
3. The verifiable statistics presented in this analysis are consistent with the GA6 Runoff
polling that was conducted, while the reported results are not;
4. The reported GA6 Runoff results lack statistical support, since they are totally
dependent upon votes that were not verified by the voter, cannot be audited by
election officials, and cannot be recounted for candidates;
5. Georgia election data was vulnerable to the type of vote swapping hack that would have
produced consistently incorrect results with the types of disparities found in this
analysis across county boundaries;
6. When an internet security professional discovered the vulnerabilities of Georgia election
data on a public CES web server and reported them to the CES Executive Director, they
were neither mitigated nor reported to the office of the Secretary of State;
7. Procedures obtained from counties and CES via Open Records Requests indicate that
the election data is downloaded by the counties when each election is prepped;
8. An external or internal attacker could implement a hack for the GA6 Runoff by
compromising the exposed election data without the knowledge of state and county
election officials, or possibly even the CES staff;
9. An attacker could have determined ballot positioning for such a hack as early as
February 15, 2017, when qualifying closed. At that time, it was known that Democrat
Jon Ossoff would likely make the Runoff and all viable Republican challengers would
appear ahead of him alphabetically on the ballot.
Although not statistically relevant, this study has some obligation to mention the bizarre
behavior of state elections officials in regards to the credibility and vulnerabilities of the
Georgia voting system. In regards to the vulnerabilities, CES Executive Director Merle King:
Allowed all key election data to be placed on a public web server that was exposed for
access to virtually any bad actor operating from any foreign or domestic location;

VoterGA GA6 Runoff Election
Statistical Analysis
Page 42 of 71
Failed to remediate the exposures after being notified of them;
Chose not to inform the Secretary of State when he was notified of the exposure.
Secretary of State Brian Kemp has consistently opposed verifiable voting for years. Recently he:
Insisted that the voting system did not malfunction after Fulton County election officials
encountered system security flaws that allowed memory cards from the Roswell Runoff
to be loaded into live 6th District Special Election results;
Contended that Georgia elections are secure and refused to initiate action to replace
the outdated voting system despite evidence to the contrary from dozens of computer
scientists, election integrity advocates, local citizens and national news articles;
Posted endorsements of Handel on Facebook, Twitter and his social media web site that
read in part: “I look forward to working with Karen in the weeks ahead to ensure victory
at the ballot box.”
State Elections Director Chris Harvey testified before the House Science and Technology
Committee on October 22, 2017 where he:
Stated that there have been no issues with Georgia voting systems despite the list of
problems identified in the Appendix of this study, most of which occurred and were
investigated after 2007 when Harvey became the Chief Investigator of the SOS office;
Stated that Georgia code requires the use of DREs although Georgia code actually allows
four different types of voting equipment to be employed;
Stated he did not hear about problems with the voting system during the GA6 races
although during the Special Election there was a two hour reporting delay and a shift in
votes caused by voting machine security flaws as explained in a previous VoterGA study.
GA6 Runoff candidate Karen Handel also demonstrated bizarre behavior concerning the voting
system as both a SOS candidate, and as the former SOS in charge of the system. During that
time Handel:
Reneged on her pledge that: “As Secretary of State I will establish a commission that includes
both county and state elections officials to make recommendations regarding new purchases of
electronic voting machines”;
Reversed her position on replacing the voting system after writing a report to explain in
writing the need for voter verification of their ballots, election audits and a paper audit
trail as the ballot of record;
Received over $25,000 in donations from family members and partners of the voting machine
vendor lobbyist, Massey Bowers LLC and hired as Assistant SOS Massey Bowers partner, Rob
Simms, who became a key fund raiser in her gubernatorial and U.S. Senate campaigns.

VoterGA GA6 Runoff Election
Statistical Analysis
Page 43 of 71
CONCLUSIONS
Unverifiable Vote Verification
This analysis establishes actual party affiliation for Runoff voters by retrieving their primary
voting history. It incorporates the actual affiliation into three different verification scenarios in
an attempt to confirm the reported GA6 Runoff results are correct. The scenarios offer a range
of possibilities covering the spectrum of how unaffiliated Runoff votes may have been cast for
the candidates. The three verification scenarios --Affiliated Party Line Vote, Shared Party Ratio
and Unaffiliated Vote Split--- cover a range that includes majority Republican, majority
Democratic and an equal split of unaffiliated voters. As previously explained, no one verification
scenario can plausibly confirm the reported results of a Handel 3.76 percent victory margin.
The reported results generated skepticism from several unprecedented conditions that they
rendered. For example:
1. There is no known precedent for a Runoff participant gaining a percentage roughly
equal to that of all 16 opponents from their previous election. Handel gained all 32
percent including small shares from 4 Democrats while Ossoff totals remained near flat;
2. There is no known precedent for a candidate losing part of their vote percentage in a
county when advancing from an election with 17 opponents to a Runoff with one
opponent. Ossoff’s vote percentage decreased in Fulton and DeKalb counties after 16
of his competitors were eliminated.
The vast majority of votes for Special Election candidates who did not advance were Republican
votes that were reported as going to Handel. However, no crossover votes from that 32 percent
block of votes went to Ossoff according to the reported results. If there was no Republican
crossover to Ossoff, then he had to have won all of the unaffiliated voting, representing 70% of
the total Runoff votes, including landslide 75 to 25 percent and 61 to 39 percent margins for
mail-in and early voting, respectively.
The reported results could only be correct if the increased voter turnout in the Runoff was
decidedly more Republican and strongly favored Handel. However, the Ossoff margins of
victory for unaffiliated votes as needed to achieve the reported results without crossover would
require a heavier Democratic turnout than Republican.
VoterGA GA6 Runoff Election
Statistical Analysis
Page 44 of 71
Verifiable vs. Unverifiable Vote Disparities
Disparities identified between potentially verifiable mail-in results and unverifiable electronic
results are unprecedented in electronic vote monitoring history. For example:
1. There is no precedent for a candidate winning the verifiable mail-in voting by a 64
percent to 36 percent margin while losing an election. Runoff mail-in votes
represent over 10 percent of the total vote and thus are a more than adequate
statistical sample. The margin exceeds by almost 20 total swing points the 54.6
percent to 45.4 percent margin that Vic Rawl won in mail-in ballots when reportedly
losing the 2010 South Carolina U.S. Senate Democratic primary to Alvin Greene;
2. Results from dozens of precincts showed unprecedented 60 total point swing
reversals between potentially verifiable mail-in and unverifiable Election Day vote
margins. The closest known corollary that could be considered similar are the results
from the previously mentioned 2010 U.S. Senate Democratic primary that is
considered to be one of the most suspect electronic voting elections in U.S. history;
This analysis statically refutes in three ways unfounded speculation that attempted to justify
the disparities by assuming more Democrats voted via mail in the Runoff than Republicans:
1. About 61 percent of actual GA6 Runoff mail-in voters previously voted for Republicans
and not Democrats in the 2014 and/or 2016 primaries, while only 39 percent of those
voters voted for Democrats and not Republicans;
2. Historically, 11 percent more Republicans voters voted by mail than the margin of
victory that Republicans had over Democrats in 2012, 2014 and 2016 GA6 elections;
3. Karen Handel ran a highly successful Runoff mail-in campaign that had a 596 percent
Republican Party growth rate from the Special Election and more than doubled the
Ossoff growth rate from his very successful Special Election mail-in campaign.
Some of the disparity between verifiable mail-in vote-counts and unverifiable electronic vote-
counts recorded can be attributed to increased Republican voter turnout during early voting
and on Election Day. However, Ossoff attained a 64 to 36 percent margin in verifiable mail-in
ballots in spite of a 61 to 39 percent Republican turnout advantage in affiliated mail-in voters.

VoterGA GA6 Runoff Election
Statistical Analysis
Page 45 of 71
.
Ossoff attained a 51 to 49 percent margin in early voting ballots in spite of a 71 to 29 percent
Republican turnout advantage in affiliated early voters. When unverifiable early votes are
totaled in lieu of verifiable mail-in votes, the vote-count totals become disproportional to the
actual party affiliation. Republicans amassed a 10 point advantage in affiliated early voters
over affiliated mail-in voters in the Runoff. That advantage should have produced less than an 8
point Handel advantage in the total early results once the defined early voting crossover rates
are applied. However, the unverifiable voting machines recorded a 13.5 point Handel
advantage over mail-in totals, over 5 points more than would be expected:
Actual Statistics Affiliated Mail-in Voters
Affiliated Early Voters
Difference Mail-in Results
Early Vote Results
Difference
Ossoff/Democrats 39.06% 28.97% -10.09% 64.18% 50.67% -13.51%
Handel/Republicans 60.94% 71.03% 10.09% 35.82% 49.33% 13.51%
There is little explanation for the extra votes that the voting machines recorded for Handel and
discounted from Ossoff. Therefore, consideration must be given to the potential manipulation
of unverifiable vote-counts through a vote swapping hack. Although relatively small, the 5
point deviation for each candidate roughly represents over 11,400 votes or enough to change
the outcome of the Runoff that was decided by less than 9,300 votes. Even if we cut the
crossover rate by more than half to 10% there is still a 10,300 vote difference in the outcome,
which is enough to reverse the election on this early vote difference alone.
Vulnerabilities
The primary evidence supporting the accuracy of the results is their consistency across county
boundaries. That consistency largely rules out localized tampering, fraud or errors. However,
it fits comfortably with the broader systemic interference scenario indicating that GA6 Runoff
results may have been altered at some point in the process between the time CES prepped
the election and the time counties reported the Runoff results.
Supporting such a possibility are the facts that show the Center for Election Systems (CES) left
key election data needed to hack an election virtually exposed on their public website without
password protection. That data was vulnerable to hacking for months while the elections were
being prepped and perhaps even years before that. Such critical application data is normally
placed on an internal application server protected by a firewall. In this case, however, any
VoterGA GA6 Runoff Election
Statistical Analysis
Page 46 of 71
potential hacker could gain access to create, read, modify, delete or execute any data on the
server including the:
Georgia voter registration data containing 6.7 million personally identifiable records
GEMS county databases used to accumulate votes for elections
PDFs of election server administration documents including supervisor passwords
Windows executables used to create databases, export election results, etc.
Training videos that explained to county users how to download files onto a memory
card and insert it to update a voting system.
Although CES Executive Director Merle King was informed during the previous year about the
vulnerabilities, they were not remediated and he never informed the Secretary of State. The
Georgia voting system was vulnerable to the exact type of attack that can produce consistently
incorrect results across county boundaries and present the types of disparities found in this
analysis. Such a hack could swap votes between candidates without detection in a manner
similar to that demonstrated by Dr. Ed Felten to the U.S. House Administration Committee in
2007. An external or internal attacker could plant such a hack that would not be detectable by
state and county election officials, or possibly even CES personnel.
Open Records Requests show that counties download election information from the CES web
server for each new election. Ballot positioning for a Runoff vote swap hack was determinable
as early as February 15, 2017 when qualifying closed. At that time, it was known that Democrat
Jon Ossoff would likely make the Runoff and all viable Republican challengers would appear
alphabetically ahead of him on the ballot. Only one Republican unknown at the time was slated
to appear after Ossoff. He received less than 1 percent of the Special Election vote.
Despite the critical nature of the exposed election data, there has still been no public
accountability at the time of this writing for what has transpired. The public remains
uninformed as to:
Why CES created such an exposure that conflicts with basic internet design standards;
How many years the exposure existed;
How the vulnerabilities were remediated, if indeed they have been.
Given the potential vulnerabilities that may have existed in the Georgia voting system, there
are at least three ways in which an external hacker could plant malware to change the GA6
runoff election results without detection by state and county officials. These include:
VoterGA GA6 Runoff Election
Statistical Analysis
Page 47 of 71
Initiate precincts in the elections database with a certain amount of positive votes for
one candidate and an equal number of negative votes for another candidate
Deploy or modify a Windows executable to tell the system to swap votes from one
candidate to another after a certain number of votes are counted (Ex: every 10th vote)
Modify an express poll book file that is downloaded by the counties to flashcards used
by poll books to create voter access cards that voters use on each voting machine
Synopsis
Based on the disparities described in comparing actual party affiliation to actual reported
results for all voting type totals, it is statistically improbable that the reported results are
correct. Specifically, it is probable that an external (or internal) attacker planted malware in a
way to transfer roughly 5 percent of early votes from Ossoff to Handel. Such an attack would
explain most of the disparities uncovered in this analysis. The undetectable malware hack
would have reduced Ossoff’s early vote totals by 5 percent and increased Handel’s early vote
totals by 5 percent. That deviation represents over 11,400 votes or enough to change the
outcome of the Runoff that was decided for Handel by less than 9,300 votes.
Without forensic data it would be presumptuous to infer what method an attacker may have
employed to implement such malware. The methods could produce a vote shift that would be
reflected in the early vote totals just as we observed. They could also produce a different
residual vote shift on Election Day as we also observed. The attacker could have made the
changes directly to an elections database or file that was exposed on the public web server. The
attacker could also potentially access other CES elections databases or files through firewall
exceptions after testing the malware with the exposed elections databases and files.
Election Day reported results are also suspect due to the huge 40+ point total swing deviation
between verifiable mail-in and unverifiable Election Day results. However, there is insufficient
data to determine whether the deviation was caused by vote manipulation or simply
attributable to the remarkable Republican affiliated turnout that occurred on Election Day.
Verifying the actual affiliated turnout is outside the scope of this analysis which is limited to
determining whether or not the voting system counted correctly based on the actuals input it
received. Therefore, this analysis concludes that it is more probable that Election Day reported
results are correct and attributable to the strong 82 percent Republican affiliated turnout.
The analysis confirms early indications identified by election integrity monitors in their letter to
county election boards prior to GA6 Runoff certification. The official results of the GA6 Special
Runoff Election may be incorrect, to the point that the election outcome appears to have been
VoterGA GA6 Runoff Election
Statistical Analysis
Page 48 of 71
affected. The statistical patterns indicate a strong likelihood that the outcome of the GA6
Special Runoff Election was altered. Those alterations are to the extent that the outcome was
likely reversed.
The disparities and related evidence that have been uncovered now place the burden on state
and county election officials, and in particular Secretary of State Brian Kemp, to respond.
VoterGA members call upon Secretary Kemp to immediately establish a public forum where
the answers to detailed questions raised by this study as well as other citizens can be fully
answered. For example:
Why did CES place GEMS election databases on a public web server?
Why is there a 40+ total point swing between mail-in vote-counts and Election Day vote-
counts in the GA6 Runoff?
Why does the early vote disparity described in this study exist if the GA6 Runoff was not
hacked?
What specific answers and details can CES immediately provide to the public to prove
that the GA6 Runoff was not hacked due to CES vulnerabilities?
Why did the CES Executive Director fail to remediate the vulnerabilities and refuse to
notify the Secretary of State when the vulnerabilities were discovered?
We further call upon state and county election officials to prove to Georgians that the reported
Runoff results they have certified are actually correct and that no such attack took place. Sadly,
that may be impossible with Georgia’s current voting system.
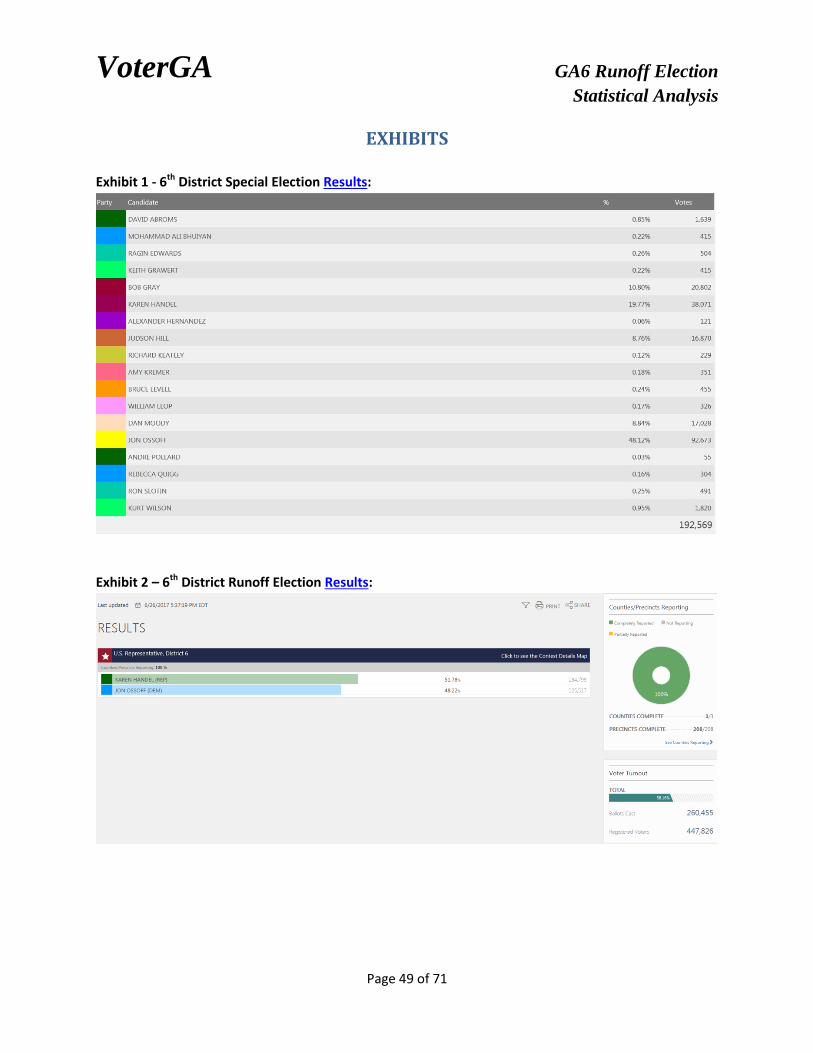
VoterGA GA6 Runoff Election
Statistical Analysis
Page 49 of 71
EXHIBITS
Exhibit 1 - 6th District Special Election Results:
Exhibit 2 – 6th District Runoff Election Results:
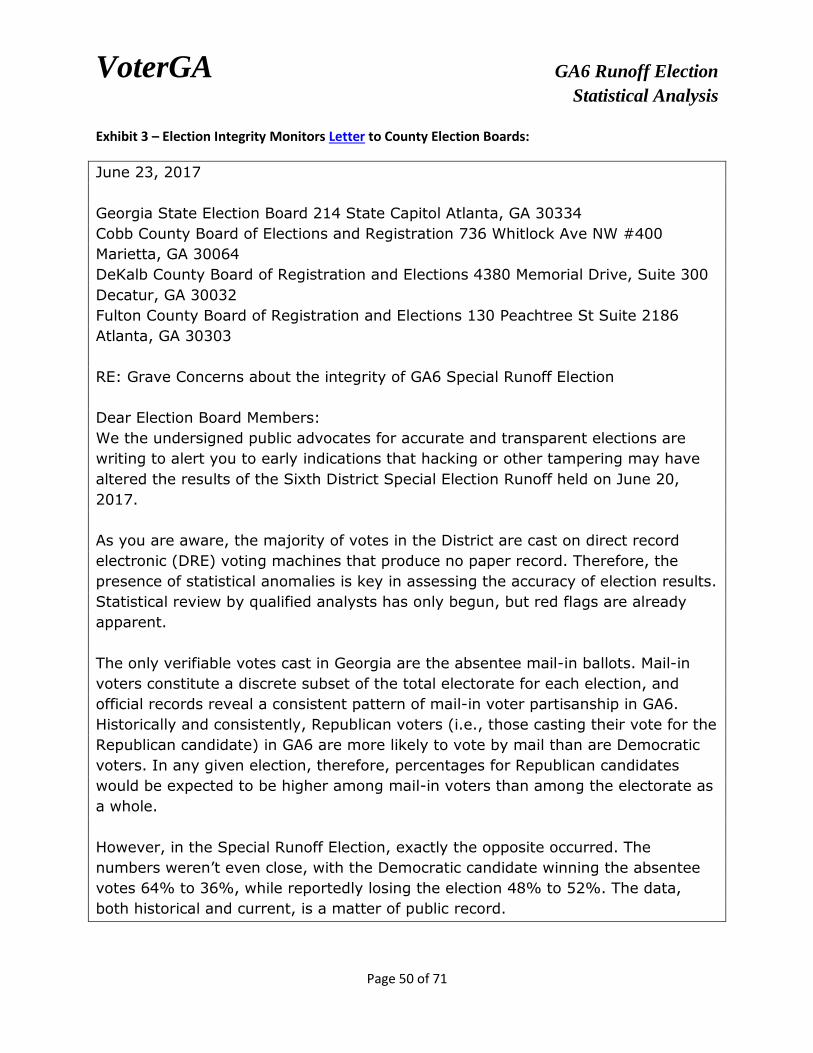
VoterGA GA6 Runoff Election
Statistical Analysis
Page 50 of 71
Exhibit 3 – Election Integrity Monitors Letter to County Election Boards:
June 23, 2017
Georgia State Election Board 214 State Capitol Atlanta, GA 30334
Cobb County Board of Elections and Registration 736 Whitlock Ave NW #400
Marietta, GA 30064
DeKalb County Board of Registration and Elections 4380 Memorial Drive, Suite 300
Decatur, GA 30032
Fulton County Board of Registration and Elections 130 Peachtree St Suite 2186
Atlanta, GA 30303
RE: Grave Concerns about the integrity of GA6 Special Runoff Election
Dear Election Board Members:
We the undersigned public advocates for accurate and transparent elections are
writing to alert you to early indications that hacking or other tampering may have
altered the results of the Sixth District Special Election Runoff held on June 20,
2017.
As you are aware, the majority of votes in the District are cast on direct record
electronic (DRE) voting machines that produce no paper record. Therefore, the
presence of statistical anomalies is key in assessing the accuracy of election results.
Statistical review by qualified analysts has only begun, but red flags are already
apparent.
The only verifiable votes cast in Georgia are the absentee mail-in ballots. Mail-in
voters constitute a discrete subset of the total electorate for each election, and
official records reveal a consistent pattern of mail-in voter partisanship in GA6.
Historically and consistently, Republican voters (i.e., those casting their vote for the
Republican candidate) in GA6 are more likely to vote by mail than are Democratic
voters. In any given election, therefore, percentages for Republican candidates
would be expected to be higher among mail-in voters than among the electorate as
a whole.
However, in the Special Runoff Election, exactly the opposite occurred. The
numbers weren’t even close, with the Democratic candidate winning the absentee
votes 64% to 36%, while reportedly losing the election 48% to 52%. The data,
both historical and current, is a matter of public record.

VoterGA GA6 Runoff Election
Statistical Analysis
Page 51 of 71
GA6 Special Election Concerns - 2
Again, this glaring disparity is especially significant because the votes cast on mail-
in ballots are the only votes that can be verified. This means they can be recounted
if any doubt exists as to their veracity. It also means mail-in votes are less likely to
be tampered with, because:
a) tampering would be much easier to detect, and
b) mail-in votes make up such a small percentage of the total vote (just over
10% in this election) that tampering with them would, given the far greater risk
factor, be neither a necessary nor desirable way to alter the results of an election.
When combined with known vulnerabilities of the systems in use, the known
extended exposure of key election data stored in the Center for Elections’ (CES)
website at Kennesaw State University, and numerous tracking polls, emerging
statistical patterns indicate a strong likelihood that the outcome of the Special
Runoff Election was altered.
In other words, the candidate for whom the most voters cast their ballots
may have been declared the loser of the Special Runoff Election.
Please understand that we are not claiming that the information in this letter proves
either that the election results were tampered with or that they are inaccurate. DRE
technology does not produce such proof. It also, notably, does not produce proof
that the election results were not tampered with or are accurate. This is precisely
why DRE voting systems should be banned from use in U.S. elections.
The information does, however, provide significant evidence that it is highly likely
the unofficial results of the Special Runoff Election are incorrect, to the point that
the election outcome appears to have been affected.
We declare that based on the above information, there is no basis for public
confidence in the election results of the GA6 Special Runoff Election. Should
you continue to stand by the reported results, we call upon you to prove to
Georgia’s voters that the reported results are a true and accurate measure
of the votes cast by the voters of Georgia’s Sixth Congressional District.
Sincerely,
John Brakey Executive Director and Co-founder, Americans United for Democracy
Integrity & Transparency (AUDIT-Arizona)
Dr. Lora Chamberlain Organizer, Clean Count Cook County

VoterGA GA6 Runoff Election
Statistical Analysis
Page 52 of 71
GA6 Special Election Concerns - 3
Bev Harris BlackBoxVoting.org
Phyllis Huster Ladies of Liberty
Mimi Kennedy Advisory Board Chair, Progressive Democrats of America
Ray Lutz Founder, Citizens' Oversight Projects
Mark Crispin Miller Professor of Media, Culture & Communication New York
University
Dr. Laura Pressley, Ph.D. Founder, Save Our Texas Vote Coalition
Jonathan D. Simon Author, CODE RED: Computerized Election Theft in the New
American Century
Jim Soper Co-Chair, Voting Rights Task Force Author, CountedAsCast.org
Paul Thomas Co-founder, Election Justice USA
Organizations listed for identification purposes only.

VoterGA GA6 Runoff Election
Statistical Analysis
Page 53 of 71
Exhibit 4 – VoterGA Letter to County Election Boards:

VoterGA GA6 Runoff Election
Statistical Analysis
Page 54 of 71
Exhibit 5 – Letter from Computer Scientists to Secretary of State Brian Kemp
March 15, 2017
The Honorable Brian Kemp
214 State Capitol
Atlanta Ga. 30334
Dear Secretary Kemp,
On March 3rd
it was reported that the Federal Bureau of Investigations is conducting a criminal
investigation into an alleged cyber attack of the Kennesaw State University Center for Election
Systems. According to the KSU Center for Election Systems’ website, “the Secretary of State
authorized KSU to create a Center for Election Systems, dedicated to assisting with the
deployment of the Direct Record Electronic (DRE) voting technology and providing ongoing
support.”[1] The Center is responsible for ensuring the integrity of the voting systems and
developing and implementing security procedures for the election management software installed
in all county election offices and voting systems.
The Center has access to most if not all voting systems and software used in Georgia. It also is
responsible for programming these systems and accessing and validating the software on these
systems. It is our understanding that the Center also programs and populates with voter records
the electronic poll books used in polling places statewide. A security breach at the Center could
have dire security consequences for the integrity of the technology and all elections carried out in
Georgia.
In order for citizens to have faith and confidence in their elections, transparency is crucial,
including about events such as the KSU breach, and its extent and severity. While we understand
that this investigation is ongoing and that it will take time for the full picture to emerge, we
request that you be as forthcoming and transparent as possible regarding critical information
about the breach and the investigation, as such leadership not only will be respected in Georgia
but also emulated in other states where such a breach could occur. We expect that you are
already pursuing questions such as the following, regarding the breach, and trust that you will
make public the results of such inquiry:
1. Can you estimate when the attacker breached KSU’s system?
2. How did the attacker breach KSU’s system?
3. How was the breach discovered?
4. Which files were accessed?
5. Were any files accessed that related to software or “hashes” for the voting machines?
6. Is there any evidence that files were modified? If so, which files?
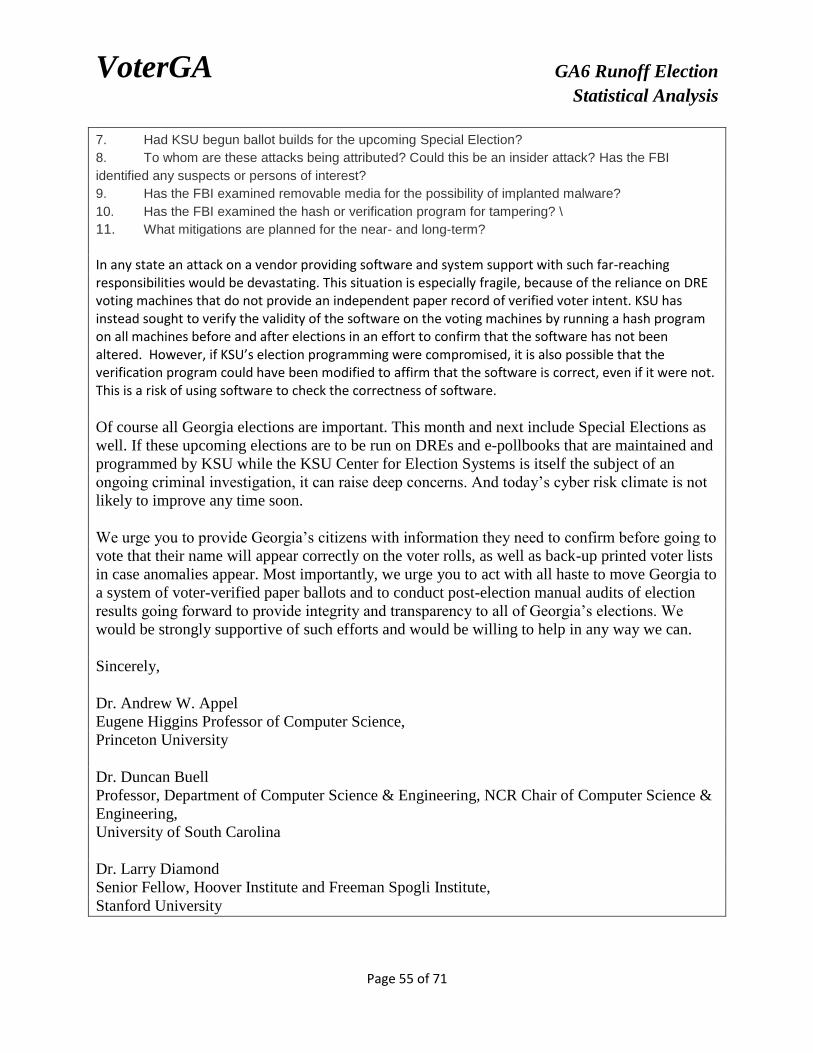
VoterGA GA6 Runoff Election
Statistical Analysis
Page 55 of 71
7. Had KSU begun ballot builds for the upcoming Special Election?
8. To whom are these attacks being attributed? Could this be an insider attack? Has the FBI
identified any suspects or persons of interest?
9. Has the FBI examined removable media for the possibility of implanted malware?
10. Has the FBI examined the hash or verification program for tampering? \
11. What mitigations are planned for the near- and long-term?
In any state an attack on a vendor providing software and system support with such far-reaching responsibilities would be devastating. This situation is especially fragile, because of the reliance on DRE voting machines that do not provide an independent paper record of verified voter intent. KSU has instead sought to verify the validity of the software on the voting machines by running a hash program on all machines before and after elections in an effort to confirm that the software has not been altered. However, if KSU’s election programming were compromised, it is also possible that the verification program could have been modified to affirm that the software is correct, even if it were not. This is a risk of using software to check the correctness of software.
Of course all Georgia elections are important. This month and next include Special Elections as
well. If these upcoming elections are to be run on DREs and e-pollbooks that are maintained and
programmed by KSU while the KSU Center for Election Systems is itself the subject of an
ongoing criminal investigation, it can raise deep concerns. And today’s cyber risk climate is not
likely to improve any time soon.
We urge you to provide Georgia’s citizens with information they need to confirm before going to
vote that their name will appear correctly on the voter rolls, as well as back-up printed voter lists
in case anomalies appear. Most importantly, we urge you to act with all haste to move Georgia to
a system of voter-verified paper ballots and to conduct post-election manual audits of election
results going forward to provide integrity and transparency to all of Georgia’s elections. We
would be strongly supportive of such efforts and would be willing to help in any way we can.
Sincerely,
Dr. Andrew W. Appel
Eugene Higgins Professor of Computer Science,
Princeton University
Dr. Duncan Buell
Professor, Department of Computer Science & Engineering, NCR Chair of Computer Science &
Engineering,
University of South Carolina
Dr. Larry Diamond
Senior Fellow, Hoover Institute and Freeman Spogli Institute,
Stanford University
VoterGA GA6 Runoff Election
Statistical Analysis
Page 56 of 71
Dr. David L. Dill
Professor of Computer Science,
Stanford University
Dr. Richard DeMillo
Charlotte B, and Roger C. Warren Professor of Computing
Georgia Institute of Technology
Dr. Michael Fischer
Professor of Computer Science,
Yale University
Dr. J. Alex Halderman
Professor, Computer Science and Engineering
Director, Center for Computer Security and Society
University of Michigan
Dr. Joseph Lorenzo Hall
Chief Technologist,
Center for Democracy & Technology
Martin E. Hellman
Professor Emeritus of Electrical Engineering,
Stanford University
Candice Hoke
Co-Director, Center for Cybersecurity & Privacy Protection and Professor of Law,
Cleveland State University
Harri Hursti
Chief Technology Officer and co-founder, Zyptonite,
founding partner, Nordic Innovation Labs
Dr. David Jefferson
Lawrence Livermore National Laboratory
Dr. Douglas W. Jones
Department of Computer Science
University of Iowa
Dr. Joseph Kiniry
Principal Investigator, Galois
Principled CEO and Chief Scientist, Free & Fair
VoterGA GA6 Runoff Election
Statistical Analysis
Page 57 of 71
Dr. Justin Moore
Software Engineer, Google
Dr. Peter G. Neumann
Senior Principal Scientist, SRI International Computer Science Lab, and moderator of the ACM
Risks Forum
Dr. Ronald L. Rivest
MIT Institute Professor
Dr. John E. Savage
An Wang Professor of Computer Science,
Brown University
Bruce Schneier
Fellow and lecturer
Harvard Kennedy School of Government
Dr. Barbara Simons
IBM Research (retired),
former President Association for Computing Machinery (ACM)
Dr. Philip Stark
Associate Dean, Division of Mathematics and Physical Sciences,
University of California, Berkeley
Dr. Vanessa Teague
Department of Computing & Information Systems,
University of Melbourne
Affiliations are for identification purposes only, they do not imply institutional endorsements.

VoterGA GA6 Runoff Election
Statistical Analysis
Page 58 of 71
Exhibit 6 – Karen Handel Flyer with Absentee Ballot Application:
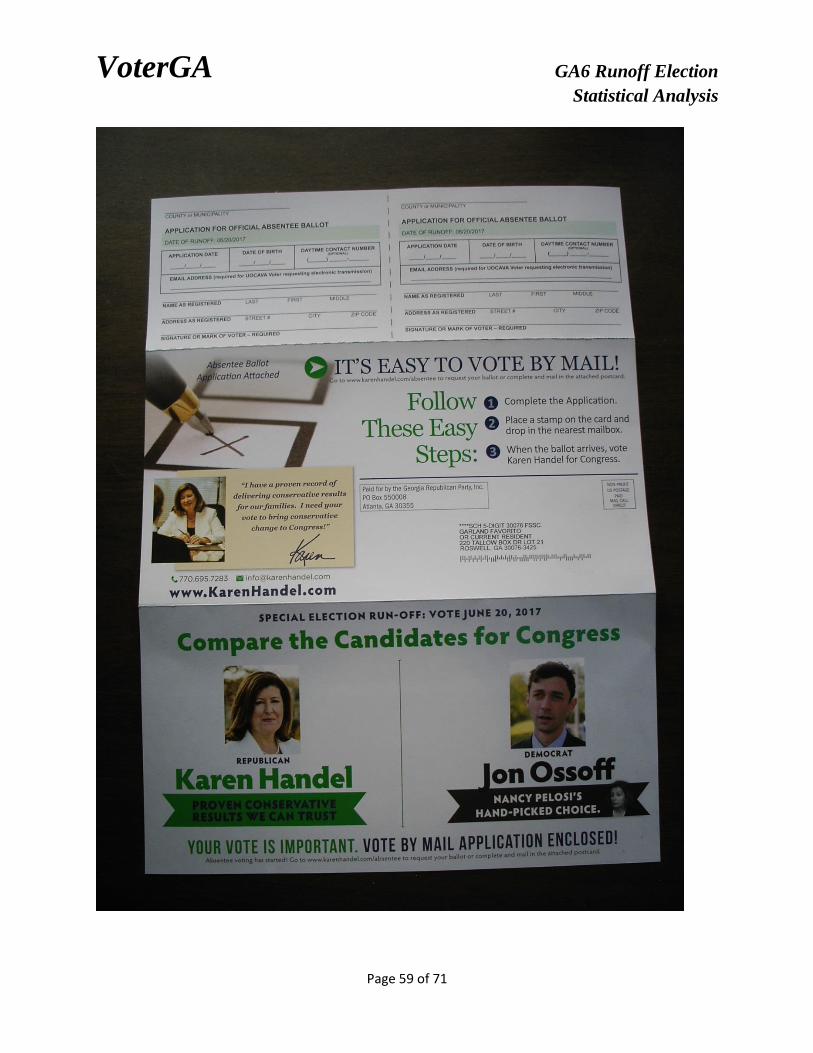
VoterGA GA6 Runoff Election
Statistical Analysis
Page 59 of 71

VoterGA GA6 Runoff Election
Statistical Analysis
Page 60 of 71
Exhibit 7 – Georgia Election Environment Support Flow from Center for Election Systems

VoterGA GA6 Runoff Election
Statistical Analysis
Page 61 of 71
Exhibit 8 – Special and Runoff Election Results Comparison:
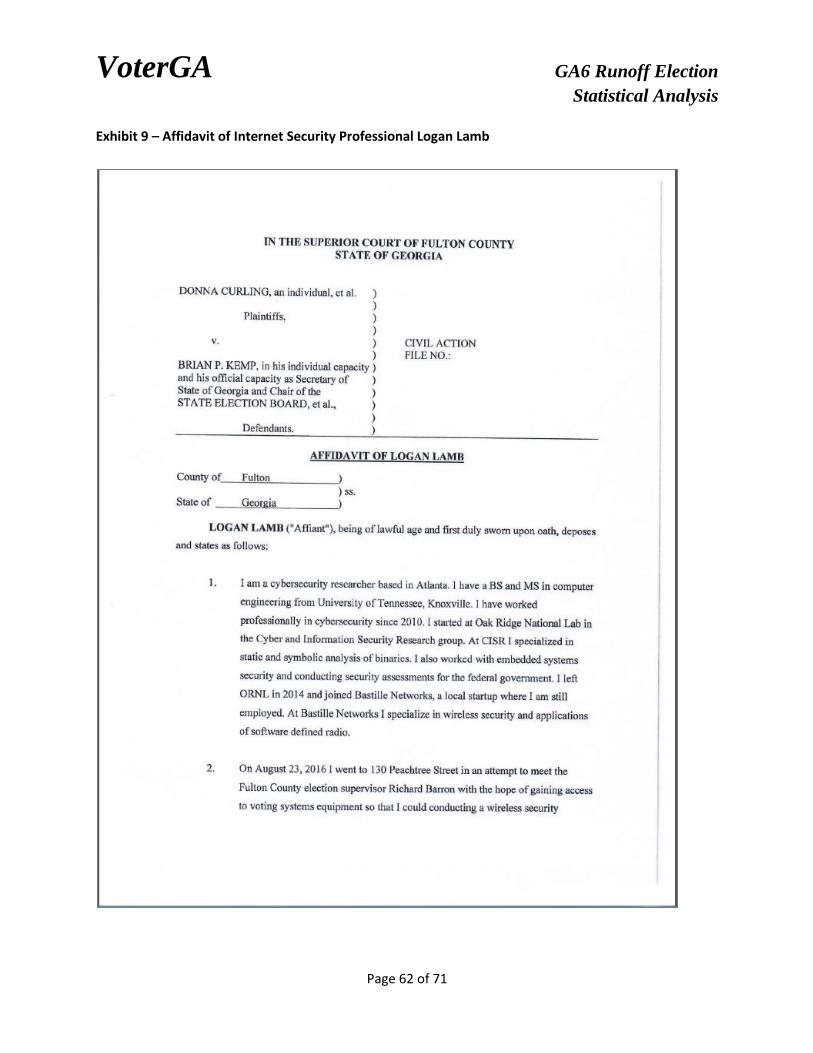
VoterGA GA6 Runoff Election
Statistical Analysis
Page 62 of 71
Exhibit 9 – Affidavit of Internet Security Professional Logan Lamb
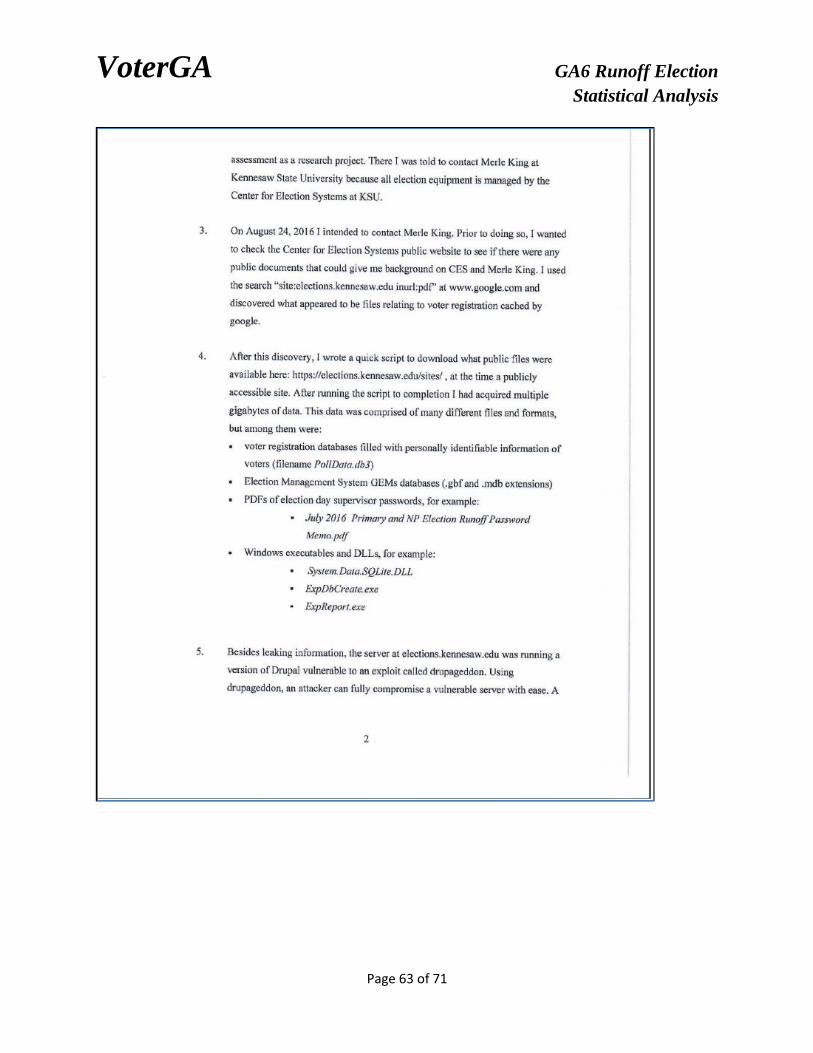
VoterGA GA6 Runoff Election
Statistical Analysis
Page 63 of 71
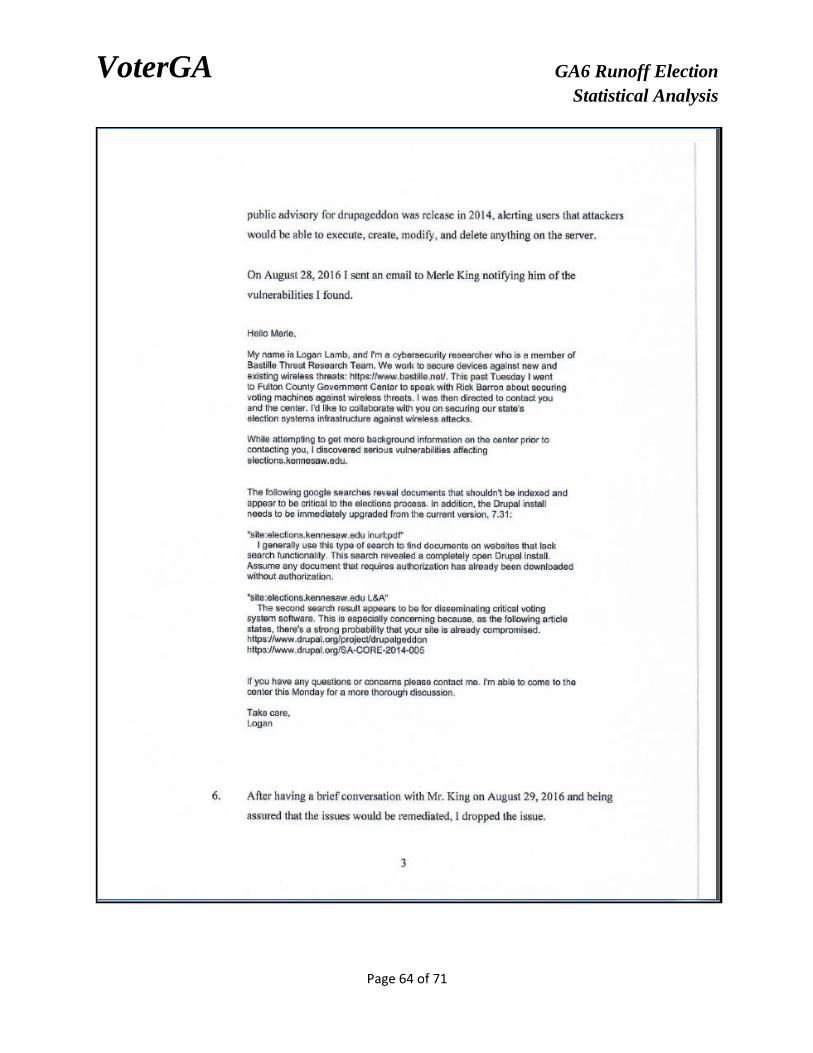
VoterGA GA6 Runoff Election
Statistical Analysis
Page 64 of 71
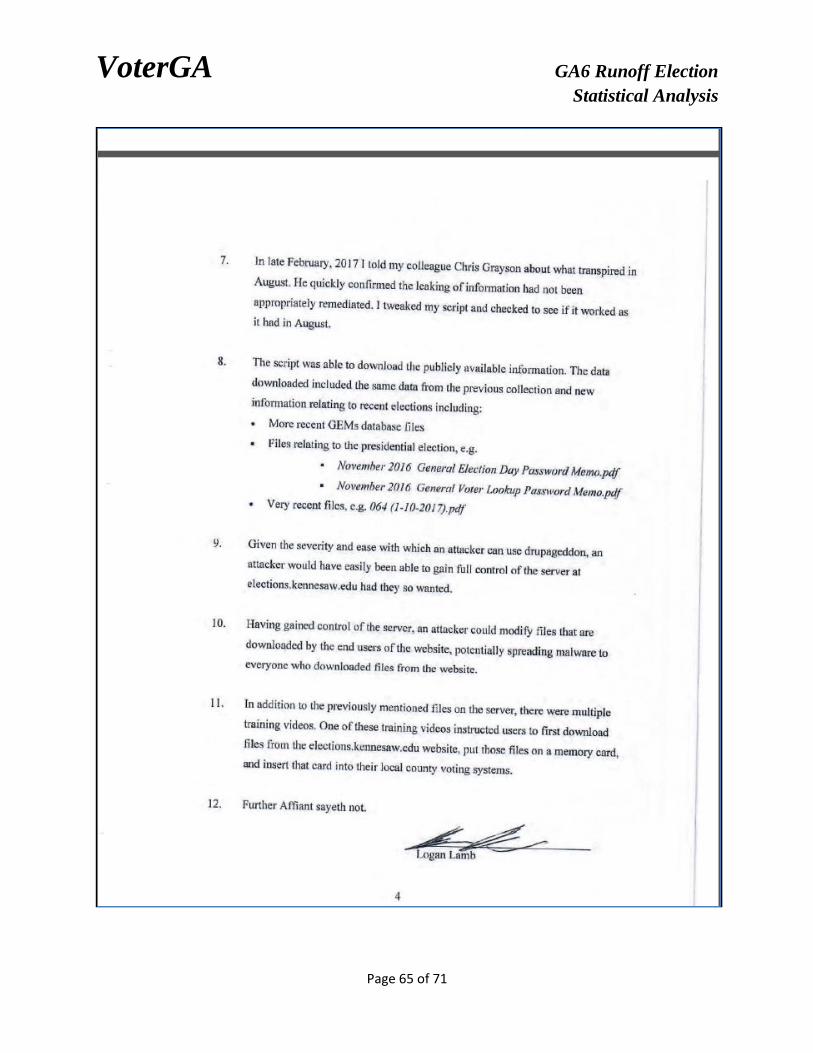
VoterGA GA6 Runoff Election
Statistical Analysis
Page 65 of 71

VoterGA GA6 Runoff Election
Statistical Analysis
Page 66 of 71
Exhibit 10 – Statistical Summary

VoterGA GA6 Runoff Election
Statistical Analysis
Page 67 of 71
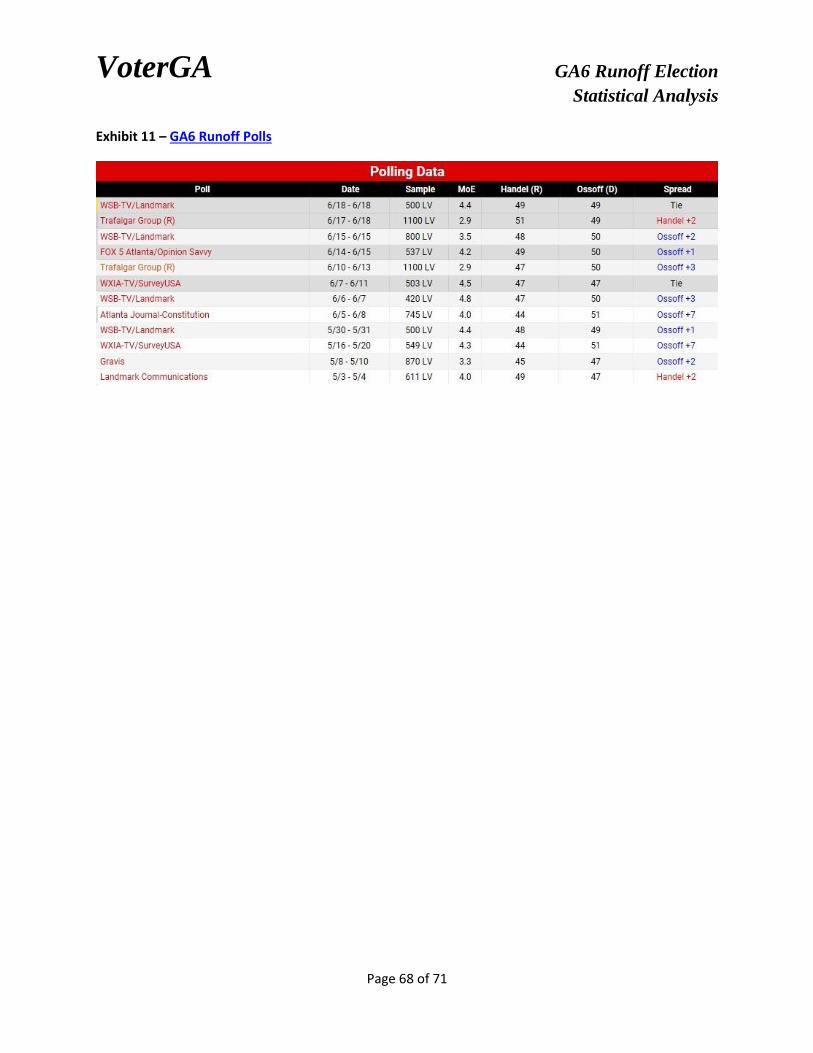
VoterGA GA6 Runoff Election
Statistical Analysis
Page 68 of 71
Exhibit 11 – GA6 Runoff Polls
VoterGA GA6 Runoff Election
Statistical Analysis
Page 69 of 71
APPENDIX
Academic Studies on AccuVote TS and TSX Machines
Virtually all academic and state commissioned studies concerning the security and accuracy of
the AccuVote TS, Accuvote TSx and GEMS server equipment that Georgia uses have produced
highly negative findings. Examples include:
In 2003, a Johns Hopkins Analysis of an Electronic Voting System report found
"significant security flaws" in the AccuVote-TS machines
In 2003, a Compuware DRE Technical Assessment commissioned by the state of Ohio
recommended discontinuing the use of Diebold Accuvote machines
In 2003, a RABA Technologies Trusted Agent Report commissioned by the state of
Maryland found that Accuvote TS flaws could seriously disrupt an election
In 2003, a SAIC Risk Assessment commissioned by the state of Maryland found 26 critical
security flaws out of 326 total for Accuvote TS voting machines and GEMS servers
In 2003, a California Secretary of State Staff Report found that Diebold had still been
unable to certify its software resulting in decertification by the Secretary of State
In 2003, a Nevada Electronic Systems Division Diebold and Sequoia Voting System
Security memorandum reported to the Secretary of State that there was a "...a real
threat to any elections using the Diebold machines"
In 2004, a Free Congress Foundation Voting System Concerns study and Election Day
Preparedness Scorecard conducted in conjunction with Verified Voting rated Georgia
last in country in system reliability and recount preparedness Georgia graded as F- on
national average of C+
In 2006, a University of California Security Analysis of the Diebold AccuBasic Interpreter
Identified security vulnerabilities in Accuvote TS machines
In 2006, a Princeton Security Analysis of the Accuvote-TS Voting Machine found it is
doubtful that DRE vendors will be able to overcome the inherent security problems and
they recommended a voter verified paper ballot audit trail. They also demonstrated
how an Accuvote TS machine could be hacked and produce fraudulent results
In 2008, a Georgia Tech Security of the Processes and Procedures Surrounding Electronic
Voting in Georgia recommended audit trails for all Georgia machines
VoterGA GA6 Runoff Election
Statistical Analysis
Page 70 of 71
History of Georgia Vote Counting Discrepancies
1. In 2005, a Cobb County Special Purpose Local Option Sales Tax (SPLOST) referendum
appeared to be headed for defeat. However, election problems halted the counting.
When the errors had been addressed, the SPLOST was declared to have passed by 114
votes even though there were 285 blank cast ballots and the SPLOST referendum was
the only contest on the ballot
2. In 2011, another Cobb County SPLOST was similarly declared passed by 79 votes with 95
blank voted ballots. There were 9 percentage points difference in verifiable mail-in votes
vs. unverifiable electronic early votes and Election Day votes. The SPOLST passed even
though it failed to capture a majority of verifiable votes
3. In 2002, Cobb County added 3,256 test votes into their live election results. Election
officials published the results before finding the error and correcting it
4. In 2004, two Bibb County machines in separate precincts lost over 200 votes when they
could not accumulate them (Rutland 2 - 79, Howard 7 -123)
5. In 2008, Lowndes County included 947 test votes in their live election results. The
Elections Director and assistant who loaded the cards and certified the results tried to
blame a voting machine technician who was not present for loading or certification
6. In 2008, the results of 25,000 Douglas Co. Election Day ballots were placed into a
spreadsheet, reviewed by an Election Board member at his home and then re-entered
the next day into the country servers. The outcome of several races changed. An
investigation was conducted but the board member and Elections Director were never
charged for this specific infraction
7. In 2008, the State of Georgia failed to count over 100 write-in votes for Constitution
Party Presidential candidate Chuck Baldwin, including 75 that were recorded by
Cherokee County election officials alone. The state never explained how this occurred or
verified the write in results with other counties despite formal inquiries by party
officials. This evidence was used in a recent ballot access lawsuit, where the U.S. District
Court and 11th Circuit Court of Appeals ruled against the state. The U.S. District court
struck down Georgia’s restrictive Presidential ballot access law as being unconstitutional
8. In 2006, Fulton County failed to count over 230 votes for Constitution Party Candidate
Woody Holmes. Woody ran for State Representative of District 65, as a write-in
candidate. Although Fulton County reported only two write-in votes for Mr. Holmes, the
elections office later located 238 more votes after Constitution party officials visited
Fulton County’s office to find out why his vote totals were wrong
VoterGA GA6 Runoff Election
Statistical Analysis
Page 71 of 71
Chronology of GA6 Key Events This chronology is established based on the VoterGA Root Cause Analysis for the GA6 Special
Election and this statistical analysis for the GA6 Special Election Runoff.
Before 2017 – Roswell City Council elections set for March 21st and Runoff for April 18
Feb 9 – U.S. Senate confirms GA6 Congressman Tom Price as Health & Human Services Secretary
Feb 10 – Ga SOS legal counsels advise Gov. Deal that April 18 is the first viable date for Special
Election without considering MOVE regulations impact tom combine ballot w/ a potential
Roswell Runoff
Feb 11 – Gov. Deal proclaims April 18 as GA6 Special Election date to replace Tom Price
Feb 27 – Johns Creek City Council calls for Special Election on April 18 w/ qualifying ending on
March 8 a deadline too late to meet MOVE regulations for overseas ballot distribution
Mar 4 – Deadline to distribute April 18 election ballots for overseas for April 18 election
Mar 8 – Johns Creek qualifying ends identifying candidates too late for overseas ballots
Mar 21 Roswell City Council elections require April 18 Runoff
Mar 27 – Special Election early voting begins as Fulton must conduct 3 concurrent redundant
elections for the first time in Georgia election history
Apr 14 – Special Election early voting ends
Apr 18 – GA6 Special Election is held with reporting delays and election results shifts occurring
Apr 20 - Fulton Election Director explains to Commissioners that Roswell Runoff card was
accidentally loaded into 6th District results
Apr 20 – Sec. Kemp announces investigation to open for why error in basic procedure occurred
May 2 - VoterGA releases Root Cause Analysis showing security flaws caused Apr 18 problems
May 2 – SOS office logs investigation into April 18 procedural errors
May 25 – Emergency lawsuit is filed by Georgia plaintiffs and Rocky Mountain Foundation in
Fulton Superior Court to use paper ballots in GA6 election
May 26 – Court invokes 5 day notice rule needed to defend lawsuit as requested by GA AG
May 30 - Runoff early voting begins
Jun 8 - Hearing on paper ballot lawsuit is held
Jun 9 - Court denies paper ballot lawsuit citing sovereign immunity and risk to early voters
Jun 16 - Runoff early voting ends
June 20 – Runoff election held
Jun 24 – Fulton Election Board certifies results while ignoring petition to recanvass
Jun 26 – Cobb and DeKalb Election Board certifies results while ignoring petitions to recanvass
Jun 26 – SOS certifies results and Karen Handel is sworn in as new U.S. 6th District
congresswomen
Jul 3 – Georgia plaintiffs and Coalition for Good Governance submit lawsuit in Fulton Superior
Court to challenge election results and permanently ban Georgia’s voting machines
Aug 8 - Defendants remove case to U.S. federal court


![Unit Hydrograph (UNIT-HG) Model · RUNOFF#0 – RUNOFF#N Where N= RUNOFF_UNIT Units for RUNOFF State Variables [mm or in] Sample States File: RUNOFF#0=0.0 RUNOFF#1=0.0 RUNOFF#2=9.0](https://static.fdocuments.in/doc/165x107/5ece307d6bbfcd2591178fc8/unit-hydrograph-unit-hg-model-runoff0-a-runoffn-where-n-runoffunit-units.jpg)


