Georgeson 2012 Annual Corporate Governance Review
60
ANNUAL CORPORATE GOVERNANCE REVIEW > Annual Meetings > Shareholder Initiatives > Proxy Contests 2012
Transcript of Georgeson 2012 Annual Corporate Governance Review
ANNUAL CORPORATEGOVERNANCE REVIEW
> Annual Meetings> Shareholder Initiatives
> Proxy Contests
2012


2012ANNUAL CORPORATE
GOVERNANCE REVIEW> Annual Meetings
> Shareholder Initiatives> Proxy Contests

This page intentionally left blank.

> 3
CONTENTS
Executive Summary 4
Methodology 9
PART 1 — CORPORATE GOVERNANCE-RELATED SHAREHOLDER PROPOSALS AND SPONSORS
Figure 1 Corporate Governance Proposals Submitted – 2008 to 2012 (Chart) 12
Figure 2 Corporate Governance Proposals Voted On – 2008 to 2012 (Chart) 12
Figure 3 Corporate Governance Proposals Voted On – 2008 to 2012 (Table) 12
Figure 4 Sponsorship of Corporate Governance Proposals – 2011 and 2012 (Table) 13
Figure 5 Corporate Governance Shareholder Proposals – 2011 and 2012 (Chart) 14
Figure 6 Corporate Governance Proposals Withdrawn or Omitted vs. Voted On – 2011 and 2012 (Chart) 15
Figure 7 Sponsors of Corporate Governance Proposals – 2011 and 2012 (Chart) 16
PART 2 — PROPOSAL VOTING RESULTS
Figure 8 Summary Average Voting Results for Selected Proposals – 2012 (Table) 18
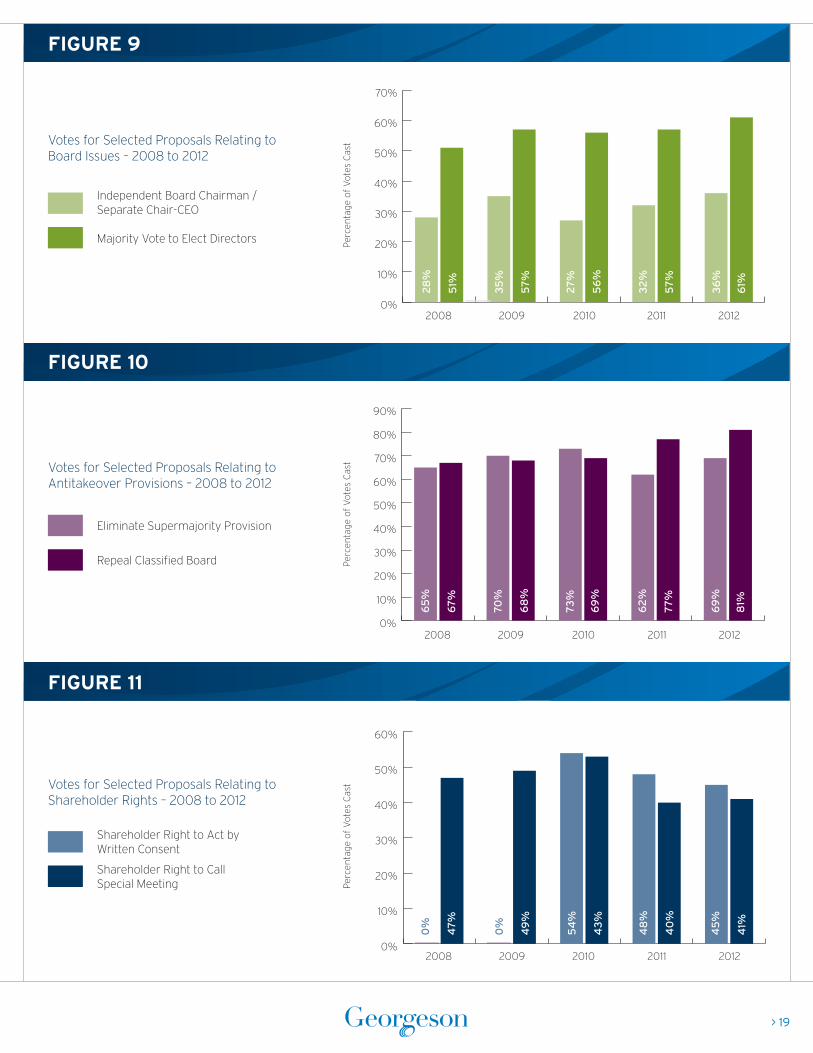
Figure 9 Votes for Selected Proposals Relating to Board Issues – 2008 to 2012 (Chart) 19
Figure 10 Votes for Selected Proposals Relating to Antitakeover Provisions – 2008 to 2012 (Chart) 19
Figure 11 Votes for Selected Proposals Relating to Shareholder Rights – 2008 to 2012 (Chart) 19
Figure 12 Binding Bylaw Provisions – 2003 to 2012 (Chart) 20
Figure 13 Binding Bylaw Provisions – 2012 (Table) 20
Figure 14 Voting Results Sorted by Company – 2012 (Table) 21
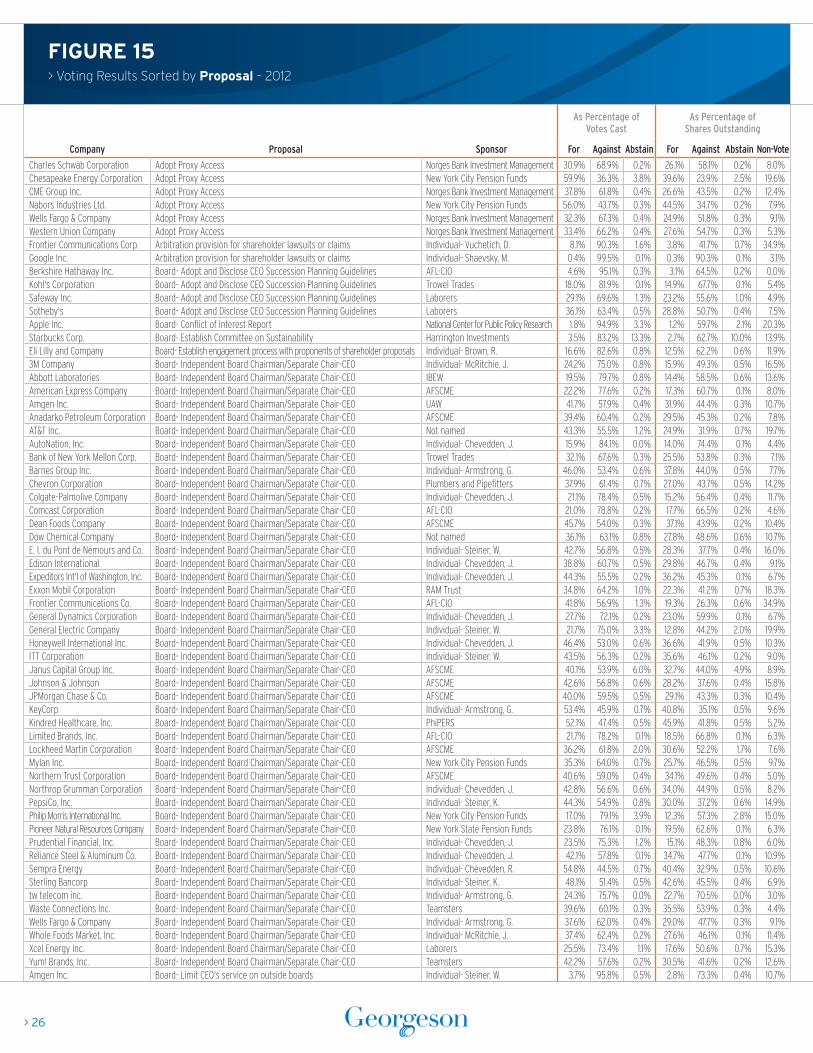
Figure 15 Voting Results Sorted by Proposal – 2012 (Table) 26
Figure 16 Voting Results Sorted by Sponsor – 2012 (Table) 31
PART 3 — SELECT SOCIAL RESOLUTIONS
Figure 17 Shareholder Proposals – Sustainability, Voting Results – 2012 (Table) 38
Figure 18 Shareholder Proposals – Political Contributions, Voting Results – 2012 (Table) 38
PART 4 — MANAGEMENT PROPOSAL – ADVISORY VOTE ON EXECUTIVE COMPENSATION
Figure 19 Voting Results for the S&P 500 Index – 2012 (Table) 42
PART 5 — MANAGEMENT PROPOSAL – REPEAL CLASSIFIED BOARD
Figure 20 Management Proposals – 2003 to 2012 (Chart) 50
Figure 21 Voting Results – 2012 (Table) 51
PART 6 — PROXY CONTESTS
Figure 22 Contested Solicitation Trend – 1981 to 2012 (Chart) 54
Figure 23 Contested Solicitations – 2012 (Table) 54
> 4
EXECUTIVE SUMMARY
The Rise of Engagement in the 2012 Proxy Season
For many years Georgeson’s Annual Corporate Governance
Review has promoted the concept of engagement between
public companies and their institutional investors. While
Georgeson has noticed increased engagement, the nature of
the engagement has generally been incremental and devoted
to specific governance and compensation issues from year
to year. After years of this slow, incremental growth, the 2012
proxy season became the Year of Engagement and witnessed
a marked increase in company/shareholder interaction —
engagement that was not limited to a few days out of the five- or
six-week period between the mailing of the corporate proxy
statement and the last days of a proxy solicitation campaign
prior to the annual meeting. The types of issues discussed
leading up to and during the 2012 proxy season ranged from
executive compensation and board structure to negotiations
with proponents over the potential withdrawal of shareholder-
sponsored ballot resolutions to just open-ended discussions to
understand each other better. The voting statistics contained
between these covers cannot fully measure that activity —
although they do make it clear that the level of communication
was more frequent and intense than in the past.
What Was the Catalyst for More Robust Engagement?
A principal factor behind increased engagement between
issuers and investors was the desire among institutions for more
dialogue. Fund complexes like BlackRock and Vanguard, by virtue
of their size and indexing strategies, are often a company’s
largest owners. Funds reached out to the portfolio companies
that represented their largest holdings, expressing their desire
to engage those companies on governance issues rather than
default to having their views — and voting decisions —
on governance issues and other ballot items shaped by the
proxy advisory firms. They were also more receptive to a wider
range of companies that reached out to them for off-season and
in-season engagement. Such funds hold shares in thousands
of companies and their increased engagement required more
resources and time. However, they nonetheless increased their
correspondence with many companies and conducted many
more meetings and calls than in the past. In many cases those
interactions led to greater understanding on both sides and
influenced votes.
Compensation Sparks an Increase in On- and Off-Season
Investor Engagement
While some companies have carried the mantle of thought
leadership and communication on governance issues in year-
round engagement with investors for a number of years, nothing
sparked the engagement of shareholders like the advent of the
required advisory vote on executive compensation, or “say-on-
pay.” To date relatively few companies have failed the say-on-
pay’s vote on executive compensation — and close to 70 percent
of companies examined in our report’s universe have achieved
favorable votes of 90 percent or greater.
However, many companies saw even modest levels of opposition
on the compensation vote as a lack of support for management,
if not their compensation committees, stock option plans and
their boards of directors as a whole. The proxy advisory firms
Institutional Shareholder Services and Glass Lewis raised the
bar for successful say-on-pay votes by establishing new ”red
zones” that redefined what it meant to achieve significant
support from shareholders. Thus, opposition votes of higher
than 20-25 percent would invite greater scrutiny by the advisory
firms of a company’s compensation practices and levels of
shareholder engagement moving forward. That reality triggered
greater outreach in and out of the traditional proxy season
and those conversations sometimes morphed into discussions
of other non-compensation issues [see Figure 19, page 42 for
management say-on-pay results].

> 5
Engagement: Not Just Before and During Meeting
Season Anymore
Off-season engagement on compensation issues provided
companies with insight into institutional views and expectations
on a wide array of factors that would ultimately determine
investors’ votes. This would include views on the mix of
awards, appropriateness of peer groups, general terms of
severance packages and the importance of linking pay vehicles
to a company’s specific strategies and performance. Some
companies continued to express reservations to us about
possible risks of off-season engagement on compensation
and other governance issues, particularly if they ultimately
disagreed with a shareholder’s viewpoint. We continue to believe
that shareholder engagement is not and should not be only
about negotiations over specific issues. The act of engaging,
active listening and “bringing the message home” for board
consideration often is a net positive, even if a shareholder’s
recommended policy on governance or compensation issues
S&P 1500 Withhold/Against Votes — 15% or Greater
2012: 526 directors at 263 companies
2011: 549 directors at 254 companies
2010: 748 directors at 314 companies
2009: 1,027 directors at 378 companies
2008: 612 directors at 253 companies
S&P 1500 Director Withhold/Against Votes
339 directors had withhold/against votes of 20% or greater
145 directors had withhold/against votes of 30% or greater
62 directors had withhold/against votes of 40% or greater
28 directors had withhold/against votes of 50% or greater
Dir
ecto
r W
ith
ho
ld/A
gai
nst
Vo
tes,
20
08
- 2
012
Nu
mb
er o
f W
ith
ho
ld/A
gai
nst
Vo
tes,
20
11 -
20
12
Director Withhold/Against Votes as % of Votes Cast
2011
2012
20% + 30% + 40% + 50% +
2008 2009 2010 2011 2012
Directors
Companies
0
100
200
300
400
0
100
200
300
400
500
600
700
800
900
1000
1100
355
191
83 2
0
339
145
62
28
612
1,027
748
549
526
253
378
314
254
263
> 6
EXECUTIVE SUMMARY
is not adopted. In some cases companies do end up adopting
recommendations suggested by their investors, often that had
already been under board consideration for some time. In other
cases their boards ultimately decide not to do so because they
sincerely believe that their fiduciary duties under state law
require them to do otherwise — for the best long-term interests
of all of their shareholders and their companies as a whole.
Make Your Story and Communications Clear the First Time
Another advantage of engagement: off-season communications
provides practical guidance for drafting the proxy statement and
enhancing a company’s corporate web site, which by necessity
remain important communication tools for the company. For
example, the Compensation Discussion & Analysis (CD&A)
is scrutinized by those same key readers who are engaged
in arriving at their advisory votes and recommendations on
executive compensation. While engagement was important
in 2012, Georgeson also observed the redesign of the CD&A
and in some cases the entire proxy statement — both in
structure and the increased use of graphics — to enhance the
ease of understanding by investors of the company’s pay-for-
performance story. Companies continued to file supplemental
proxy materials to add to or reiterate their story to investors,
particularly when proposals were deemed by management to be
misunderstood or misinterpreted by proxy advisory firms in their
vote recommendation reports. Additional materials, particularly
concerning social and environmental issues, were more easily
posted on corporate websites in order to further explain positive
steps companies were taking in these areas. All in all, however, we
found that the most effective practice was to tell the substantive
story in a clear and comprehensible way in the initial filing.
Doing so also makes any subsequent direct communication with
investors and the proxy advisory firms more productive.
Academically Powered Pension Funds Reclaim a Leadership
Role in Activism; The Value of Takeover Defenses Revisited
When companies engaged on governance issues, what, if
any, results did they achieve? In some cases engaging with
shareholder proponents and other activists sponsoring ballot
resolutions on governance issues, including proposals dealing
with environmental and social issues or with right to call
special meetings or take action by written consent, yielded
settlements that resulted in withdrawal of those proposals.
Private engagement before or after a shareholder proposal
has been submitted, via letters and telephone calls, resulted in
many proposals never even being submitted or made public. As
we have advised for many years now, picking up the telephone
simply to call and engage an investor who writes or submits a
proposal to your company can result in a win-win resolution for
both parties.
Who Were the Major Proponents with Whom
Companies Engaged?
The 2012 proxy season saw a resurgence of activity by public
pension funds, which more than doubled their total number of
governance proposals submitted to S&P 1500 companies (22
to 57). The driving force behind much of this activity was the
Harvard Shareholder Rights Project (SRP), which served as an
engine that assisted several high-profile pensions in submitting
resolutions. The SRP represented at least six public pension
funds including the most prolific filers of 2012 — the Illinois State
Board of Investment (13) and the North Carolina Retirement
System (11). The SRP proposals focused on pushing companies
to de-stagger their boards, with an emphasis on removing
that antitakeover defense from S&P 500 companies. From
SRP’s perspective the campaign was an unqualified success. In
2011-2012, 90 such proposals were submitted, resulting in 48
agreements by boards to bring de-staggering amendments

> 7
Although fewer in number, carefully watched were shareholder
proposals on “proxy access.” These were submitted in the
wake of the legal voiding of the SEC’s proxy access rule, which
would have given qualified shareholders the ability to submit a
limited number of candidates to be run on the company’s ballot
with a supporting statement in the company’s proxy. Of the 24
tracked proposals, 13 went to a vote (including 7 binding ones
with 4 from Norges averaging 34 percent of votes cast) with ISS
recommending support for 6 of the 13.1 Currently, without proxy
access activists seeking board change need to wage a formal
proxy contest and ask shareholders to vote on a competing
ballot, which limits shareholders’ ability to vote for nominees of
both slates.
The view of institutional investors on proxy access is still
developing. The long-standing campaign to encourage majority
voting has targeted companies regardless of their performance
or governance track record. The wide support among such
proposals perhaps demonstrates the acceptance of some
form of majority voting as a best practice for all companies.
On the other hand, with respect to proxy access, the targets of
the pension funds proposing these resolutions were generally
companies that had a history of struggling performance and
unpopular or questionable governance practices, as well as a
general lack of shareholder engagement. Two of these proposals
received a majority of votes cast.
The difference between the high and low vote getters on
proxy access proposals was primarily the proposed ownership
standards included in the resolutions. Institutions were less
supportive of proposed proxy access regimes that afforded
access to the proxy for investors with as little as 1 percent
ownership of a company’s stock for one year. The two proposals
attracting a majority of votes cast required 3 percent continuous
ownership for three years. Many other proposals didn’t make it
to a proxy vote, as they were deemed excludable by the SEC due
to a vote resulting in the elimination of 28 classified boards
(others presumably had not yet been put to a vote or voted
on as of SRP’s most current report as of writing this report).
The subsequent management declassification proposals that
resulted from this effort met with close to a consensus by voters,
averaging 99 percent of votes cast.
This ongoing level of support mystifies some familiar with
academic literature on the value of classified boards in
generating long-term shareholder value. Anecdotally, M&A
lawyers often point to companies like CF Industries and Airgas,
which in the past few years fended off recent high-profile
takeover battles only to see their stocks soar well past the
highest price offered in the period subsequent to each of these
hostile events. But if the record on staggered boards remains
mixed, the voting policies adopted by a large majority of
institutions is fairly well decided against them.
Proxy Process Comes Into Focus
As forecast in our last review, the debate over the process of how
directors are elected loomed large over the 2012 proxy season.
Much of the S&P 500 (90 percent) has already moved from
plurality voting to some form of majority voting in the election of
directors (that generally requires that directors failing to receive
a majority of votes cast submit an irrevocable resignation to the
board, which the board is then free to accept or reject, usually
with an explanation of the reasons therefor). As we forecasted,
the proponents of majority voting, often individuals or labor
union pension funds, shifted their focus from mostly large to
smaller cap companies. Engagement on this issue resulted most
often with capitulation on the part of companies. Within the S&P
1500 index, approximately 28 proposals produced an average
vote of 61 percent of votes cast for these proposals. It remains
to be seen whether the small caps will fall in line with their large
cap brethren and simply adapt rather than challenge investors
on this issue.
> 8
EXECUTIVE SUMMARY
to various defects. We expect proponents to address these flaws
and resubmit them to many of the same targets and similar ones
in 2013.
Activists continued to push vigorously for a different sort of
proxy access through the right to call special meetings (averaged
41 percent of votes cast) or alternatively through the right to take
shareholder action by written consent (averaged 45 percent of
votes cast). Many companies engaged with investors on these
issues and reached compromises, but success in dealing with
these proposals generally required the company to adopt such
rights in some form.
Activist Contests Prove the Benefits of Engagement
We continue to believe that increasing engagement will be the
wave of the future. The results of traditional proxy contests
from 2012 bear this out, with boards and managements winning
their share of high-profile battles, such as those fought at AOL,
Inc. (by Starboard, a spin-off of Ramius Capital) and Oshkosh
Corporation (by Carl Icahn), where shareholders did not
elect any of the proposed dissident directors. In these cases,
directors and senior management engaging with shareholders
made compelling arguments that their strategies were the
right ones and produced victories for embattled boards. This
was the case despite an environment where many observers
believe that shareholders and proxy advisory firms work
under the presumption of a “What’s the harm?” mentality in
electing at least some dissident directors to boards. Clearly
the communication programs that won the day in many of
these contests were conducted during the heat of battle and
were not the result of ongoing, year-round engagement. They
demonstrated that the right story, properly communicated,
could prevail under difficult circumstances. We believe that
more companies will continue to expand their engagement in
the months and years ahead beyond the compressed periods in
which these battles take place. By engaging their shareholders
on their business strategies and views on governance more
frequently, companies may still disagree with dissidents. However,
the dissidents will no longer be able to claim that boards have
been inattentive or incommunicative, a common complaint that
has fueled many contests and disagreements with shareholders
on a broad array of issues.
1 ISS Governance Analytics

> 9
METHODOLOGY
Management and Shareholder Proposals
Georgeson independently surveyed companies that 1) are U.S. members of the S&P 1500 Supercomposite Index as of January 2012 and 2) held annual meetings within the first six months of the calendar year. We obtained the number of votes cast for, against, withheld, abstained and broker non-vote from publically available sources.
We then calculated for each proposal: > The votes cast for and against as a percentage of shares voted in the quorum, and > The votes cast for and against as a percentage of the company’s total voting power.
Finally, we illustrated the trends in proposal sponsorship and graphed the voting results for major governance issues.
Contested Solicitations
Proxy contest information reflects Georgeson‘s best effort to track the contested elections that have taken place during the 2012 calendar year. Our search criteria is not limited to any specific benchmark index (i.e., S&P 1500 companies) or part of the calendar year (i.e., first six months). Georgeson acted as a consultant in many of these contests.
For further information on how Georgeson defines “Contested Solicitation,” please refer to the footnote in Figure 23.
Other Notes
Georgeson’s data collection and calculation methodology ensure the accuracy and comparability of our statistics from company to company and from year to year. We thereby avoid the anomalies that result from companies’ and sponsors’ inconsistent treatment of abstentions and broker non-votes. Information on shareholder proposals withdrawn or omitted was gathered with the assistance of ISS Governance Analytics. Georgeson has collected and published statistics on corporate governance proposals since 1987, the year institutional investors first sponsored shareholder proposals. If you have any questions, please call us at (212) 440-9800 or e-mail us at [email protected].

This page intentionally left blank.

PART 1> Corporate Governance-Related Shareholder Proposals and Sponsors

> 12
FIGURE 2> Corporate Governance Proposals Voted On – 2008 to 2012
FIGURE 1> Corporate Governance Proposals Submitted – 2008 to 2012
Nu
mb
er o
f P
rop
osa
ls
2011 20122008 2009 2010 2011 20122008 2009 20100
100
200
300
400
500
600
700
Nu
mb
er o
f P
rop
osa
ls
0
100
200
300
400
587
531
417
454
652
371
342
240
269
339
Nu
mb
er o
f P
rop
osa
ls
2011 20122008 2009 2010 2011 20122008 2009 20100
100
200
300
400
500
600
700
Nu
mb
er o
f P
rop
osa
ls
0
100
200
300
400
587
531
417
454
652
371
342
240
269
339
Proposal Type 2008 % 2009 % 2010 % 2011 % 2012 %
Board-Related 85 25.1% 80 21.6% 80 23.4% 62 25.8% 88 32.7%
Executive Compensation 132 38.9% 129 34.8% 116 33.9% 40 16.7% 59 21.9%
Repeal Classified Board 52 15.3% 43 11.6% 22 6.4% 33 13.8% 44 16.4%
Special Meetings 23 6.8% 51 13.7% 43 12.6% 29 12.1% 14 5.2%
Supermajority Provision 11 3.2% 14 3.8% 29 8.5% 13 5.4% 14 5.2%
Cumulative Voting 19 5.6% 28 7.5% 16 4.7% 22 9.2% 11 4.1%
Poison Pills 3 0.9% 2 0.5% 1 0.3% 1 0.4% 3 1.1%
Reincorporation 0 0.0% 15 4.0% 5 1.5% 2 0.8% 2 0.8%
Other 14 4.1% 9 2.4% 30 8.7% 38 15.8% 34 12.6%
Total 339 100.0% 371 100.0% 342 100.0% 240 100.0% 269 100.0%
FIGURE 3> Corporate Governance Proposals Voted On – 2008 to 2012

> 13
FIGURE 4> Sponsorship of Governance Proposals – 2011 and 2012
2011 2012
Labor Unions 75 70
Amalgamated Bank LongView Large Cap 500 Index Fund (LongView) 8 8
American Federation of Labor and Congress of Industrial Organizations (AFL-CIO) 12 9
American Federation of State, County & Municipal Employees (AFSCME) 8 9
Communications Workers of America (CWA) 0 1
International Brotherhood of Electrical Workers (IBEW) 5 8
International Brotherhood of Teamsters (Teamsters) 4 5
Laborers' International Union (Laborers) 9 6
Plumbers & Pipefitters 1 2
Service Employees International Union (SEIU) 4 1
Sheet Metal Workers 2 5
Trowel Trades S&P Index Fund 6 6
UAW Retiree Medical Benefits Trust (UAW) 0 1
UNITE HERE 1 0
United Brotherhood of Carpenters and Joiners of America (UBCJA) 14 9
Utility Workers of America (UWA) 1 0
Public Pensions 22 57
California Public Employees' Retirement System (CalPERS) 3 6
California State Teachers' Retirement System (CalSTRS) 4 6
Connecticut Retirement Plans 1 0
Florida State Board of Administration (FSBA) 6 0
Illinois State Board of Investment 0 13
Los Angeles County Employees Retirement Association (LACERA) 0 4
New York City Pension Funds 7 7
New York State Pension Funds 1 6
North Carolina Retirement System 0 11
Ohio Public Employees Retirement System (OPERS) 0 1
Philadelphia Public Employees' Retirement System (PhiPERS) 0 3
Religious Organizations 6 10
Missionary Oblates of Mary Immaculate 1 0
Nathan Cummings Foundation 4 10
Sisters of Charity of St. Elizabeth 1 0
Other Shareholder Groups 16 10
Association of BellTel Retirees Inc. 1 1
Calvert Investement Management, Inc. 1 0
Christopher Reynolds Foundation 1 0
Corporate Accountability International 0 1
CtW Investment Group 1 0
Harrington Investments, Inc. 3 2
Legal and General 1 0
National Center for Public Policy Research 1 1
Norges Bank 0 4
Ram Trust 2 1
Tides Foundation 3 0
United Association S&P 500 Index Fund 2 0
Individual Shareholders 120 109
Not Disclosed 1 13
Total 240 269

> 14
FIGURE 5> Corporate Governance Shareholder Proposals – 2011 and 2012
2011
2012
Other (34) 12.6%
Board-Related (88) 32.7%
Executive Compensation (59) 21.9%
Poison Pills (3) 1.1%
Cumulative Voting (11) 4.1%
Repeal Classified Board (44) 16.4%Supermajority Provision (14) 5.2%
Special Meetings (14) 5.2%
Reincorporation (2) 0.8%
Other (38) 15.8%
Board-Related (62) 25.8%
Executive Compensation (40) 16.7%
Poison Pills (1) 0.4%
Cumulative Voting (22) 9.2%
Repeal Classified Board (33) 13.8%Supermajority Provision (13) 5.4%
Special Meetings (29) 12.1%
Reincorporation (2) 0.8%

> 15
FIGURE 6> Corporate Governance Proposals Withdrawn or Omitted vs. Proposals Voted On – 2011 and 2012
2011
2012
Omitted or Withdrawn 42.4%
Proposals Voted On 57.6%
Omitted or Withdrawn 40.7%
Proposals Voted On 59.3%
Omitted or Withdrawn 42.4%
Proposals Voted On 57.6%
Omitted or Withdrawn 40.7%
Proposals Voted On 59.3%

> 16
FIGURE 7> Sponsors of Corporate Governance Proposals – 2011 and 2012
Public Pensions 21.2%
Religious Organizations 3.8%
Labor Unions 26.0%
Individual Shareholders 40.5%
Other Shareholder Groups 3.8%
Not Disclosed 4.7%
Public Pensions 9.2%
Religious Organizations 2.5%
Labor Unions 31.2%
Individual Shareholders 50.0%
Other Shareholder Groups 6.7%
Not Disclosed 0.4%
Public Pensions 21.2%
Religious Organizations 3.8%
Labor Unions 26.0%
Individual Shareholders 40.5%
Other Shareholder Groups 3.8%
Not Disclosed 4.7%
Public Pensions 9.2%
Religious Organizations 2.5%
Labor Unions 31.2%
Individual Shareholders 50.0%
Other Shareholder Groups 6.7%
Not Disclosed 0.4%
2011
2012

PART 2> Proposal Voting Results

> 18
FIGURE 8> Corporate Governance Proposals — Summary Average Voting Results for Selected Proposals, 2012 Annual Meeting Season
Proposal TypeResults
Available
As Percentage of Votes Cast As Percentage of Shares Outstanding
For Against Abstain For Against Abstain Non-Vote
Board-Related 88 of 88 41% 58% 1% 31% 44% 1% 11%
> Majority Vote to Elect Directors 28 of 28 61% 39% 0% 47% 29% 0% 11%
>> Have>Implemented>a>Form>of>Majority>Voting 12 of 12 48% 51% 1% 36% 38% 1% 11%
>> Have>Not>Implemented>a>Form>of>Majority>Voting 16 of 16 70% 30% 0% 55% 23% 0% 11%
> Independent Board Chairman/Separate Chair-CEO 46 of 46 36% 63% 1% 27% 48% 1% 11%
> Nominate Director with Environmental Expertise 3 of 3 19% 77% 4% 13% 56% 3% 12%
Executive Compensation 59 of 59 27% 72% 1% 20% 54% 1% 11%
> Require Equity to Be Retained 27 of 27 24% 75% 1% 19% 58% 0% 10%
> Award Performance-Based Equity Awards 2 of 2 28% 71% 1% 18% 46% 1% 21%
> Advisory Vote on Director Compensation 2 of 2 4% 90% 6% 3% 60% 4% 16%
> Approve/Disclose Supplemental Retirement Plans 2 of 2 31% 69% 0% 23% 52% 1% 12%
> Approve/Limit Executive Death Benefits 2 of 2 40% 59% 1% 32% 48% 1% 8%
> Eliminate Accelerated Vesting in Termination/ Change-of-Control
11 of 11 37% 62% 1% 29% 47% 1% 10%
Repeal Classified Board 44 of 44 81% 18% 1% 64% 14% 1% 9%
Shareholder Right to Act by Written Consent 20 of 20 45% 54% 1% 34% 40% 1% 11%
Shareholder Right to Call Special Meeting 14 of 14 41% 58% 1% 29% 43% 1% 13%
Cumulative Voting 11 of 11 25% 74% 1% 18% 55% 1% 11%
Eliminate or Reduce Supermajority Provision 14 of 14 69% 31% 0% 54% 25% 0% 7%
Adopt Proxy Access 6 of 6 42% 57% 1% 32% 44% 1% 10%
> 19
FIGURE 9
Votes for Selected Proposals Relating to Board Issues – 2008 to 2012
Independent Board Chairman / Separate Chair-CEO
Majority Vote to Elect Directors
Eliminate Supermajority Provision
Repeal Classified Board
Shareholder Right to Act by Written Consent
Shareholder Right to Call Special Meeting
Votes for Selected Proposals Relating to Antitakeover Provisions – 2008 to 2012
Votes for Selected Proposals Relating to Shareholder Rights – 2008 to 2012
FIGURE 10
FIGURE 11
0%
10%
20%
30%
40%
50%
60%
0%
10%
20%
30%
40%
50%
60%
70%
80%
90%
0%
10%
20%
30%
40%
50%
60%
70%
35%
57%
27%
56%
32%
57%
36%
61%
28%
51%
20122008 2009 2010 2011
48%
40%
45%
41%
2012
62%
77%
69%
81%
65%
67%
2011 20122008 2009 2010
70%
68%
73%
69%
0%
47%
2008 2009 2010 2011
0%
49%
54%
43%
Per
cen
tag
e o
f V
ote
s C
ast
Per
cen
tag
e o
f V
ote
s C
ast
Per
cen
tag
e o
f V
ote
s C
ast
0%
10%
20%
30%
40%
50%
60%
0%
10%
20%
30%
40%
50%
60%
70%
80%
90%
0%
10%
20%
30%
40%
50%
60%
70%
35%
57%
27%
56%
32%
57%
36%
61%
28%
51%
20122008 2009 2010 2011
48%
40%
45%
41%
2012
62%
77%
69%
81%
65%
67%
2011 20122008 2009 2010
70%
68%
73%
69%
0%
47%
2008 2009 2010 2011
0%
49%
54%
43%
Per
cen
tag
e o
f V
ote
s C
ast
Per
cen
tag
e o
f V
ote
s C
ast
Per
cen
tag
e o
f V
ote
s C
ast

> 20
FIGURE 12> Binding Bylaw Provisions – 2003 to 2012
5 8 9 13 12 17
2003 2004 2005 2006 2007 2008
13 7
2009 2010
2
2011
7
2012
Nu
mb
er o
f P
rop
osa
ls18
16
14
12
10
0
2
4
6
8
Company Proposal SponsorState of Inc.
As Percentage of Votes Cast As Percentage of Shares Outstanding
For Against Abstain For Against Abstain Non-Vote
Charles Schwab Corporation Adopt Proxy AccessNorges Bank Investment Management
DE 30.9% 68.9% 0.2% 26.1% 58.1% 0.2% 8.0%
CME Group Inc. Adopt Proxy AccessNorges Bank Investment Management
DE 37.8% 61.8% 0.4% 26.6% 43.5% 0.2% 12.4%
Frontier Communications Corporation
Arbitration provision for shareholder lawsuits or claims
Individual- Vuchetich, D.
DE 8.1% 90.3% 1.5% 3.8% 41.7% 0.7% 34.9%
Google Inc.Arbitration provision for shareholder lawsuits or claims
Individual- Shaevsky, M.
DE 0.4% 99.5% 0.2% 0.3% 90.3% 0.1% 3.1%
Starbucks Corp.Board- Establish Committee on Sustainability
Harrington Investments
WA 3.5% 83.2% 13.3% 2.7% 62.7% 10.0% 13.9%
Wells Fargo & Company Adopt Proxy AccessNorges Bank Investment Management
DE 32.3% 67.3% 0.4% 24.9% 51.8% 0.3% 9.1%
Western Union Company Adopt Proxy AccessNorges Bank Investment Management
DE 33.4% 66.2% 0.4% 27.6% 54.7% 0.3% 5.3%
FIGURE 13> Binding Bylaw Provisions – 2012

> 21
FIGURE 14> Voting Results Sorted by Company – 2012
As Percentage of Votes Cast
As Percentage of Shares Outstanding
Company Proposal Sponsor For Against Abstain For Against Abstain Non-Vote
3M Company Board- Independent Board Chairman/Separate Chair-CEO Individual- McRitchie, J. 24.2% 75.0% 0.8% 15.9% 49.3% 0.5% 16.5%Abbott Laboratories Board- Independent Board Chairman/Separate Chair-CEO IBEW 19.5% 79.7% 0.8% 14.4% 58.5% 0.6% 13.6%Abbott Laboratories Executive Compensation- Compliance Disclosure New York City Pension Funds 34.1% 64.8% 1.1% 25.0% 47.6% 0.8% 13.6%Abbott Laboratories Exec. Comp.- Eliminate Accelerated Vesting in Termination/Change-of-Control SEIU 38.0% 60.9% 1.1% 27.9% 44.8% 0.8% 13.6%Abbott Laboratories Executive Compensation- Establish Anti-Tax Gross-up Policy PhiPERS 37.5% 61.3% 1.2% 27.5% 45.1% 0.9% 13.6%Abbott Laboratories Executive Compensation- Require Equity to be Retained AFL-CIO 21.0% 77.6% 1.4% 15.5% 57.0% 1.0% 13.6%Advance Auto Parts Inc. Supermajority Provision- Eliminate or Reduce Individual- Chevedden, J. 68.6% 31.3% 0.1% 58.5% 26.7% 0.1% 5.9%Alaska Air Group, Inc. Executive Compensation- Require Equity to be Retained Individual- Chevedden, J. 33.4% 66.4% 0.2% 27.8% 55.3% 0.2% 6.5%Allergan, Inc. Shareholder Right to Call Special Meeting Individual- Chevedden, J. 55.2% 44.6% 0.2% 46.8% 37.8% 0.1% 3.9%American Express Company Board- Independent Board Chairman/Separate Chair-CEO AFSCME 22.2% 77.6% 0.2% 17.3% 60.7% 0.1% 8.0%American Financial Group Inc. Board- Majority Vote to Elect Directors - Not named 53.9% 46.0% 0.1% 48.1% 41.0% 0.1% 4.7%American Tower Corporation Executive Compensation- Require Equity to be Retained Individual- Chevedden, J. 26.7% 73.1% 0.2% 22.3% 61.0% 0.1% 5.1%Amgen Inc. Board- Independent Board Chairman/Separate Chair-CEO UAW 41.7% 57.9% 0.4% 31.9% 44.4% 0.3% 10.7%Amgen Inc. Board- Limit CEO's service on outside boards Individual- Steiner, W. 3.7% 95.8% 0.5% 2.8% 73.3% 0.4% 10.7%Amphenol Corporation Supermajority Provision- Eliminate or Reduce Not named 60.7% 38.6% 0.7% 54.9% 34.8% 0.7% 2.5%Anadarko Petroleum Corporation Board- Independent Board Chairman/Separate Chair-CEO AFSCME 39.4% 60.4% 0.2% 29.5% 45.3% 0.2% 7.8%Anadarko Petroleum Corporation Exec. Comp.- Eliminate Accelerated Vesting in Termination/Change-of-Control LongView 41.1% 58.4% 0.5% 30.9% 43.8% 0.4% 7.8%ANN INC. Repeal Classified Board New York State Pension Funds 92.9% 3.0% 4.1% 83.3% 2.7% 3.7% 4.5%Apache Corporation Repeal Classified Board Illinois State Board of Investment 89.0% 10.5% 0.5% 70.2% 8.3% 0.4% 7.8%Apple Inc. Board- Conflict of Interest Report National Center for Public Policy Research 1.8% 94.9% 3.3% 1.2% 59.7% 2.1% 20.3%Apple Inc. Board- Majority Vote to Elect Directors - CalPERS 80.1% 19.6% 0.3% 50.4% 12.3% 0.2% 20.3%Apple Inc. Executive Compensation- Advisory Vote on Director Compensation Individual- McRitchie, J. 3.3% 87.7% 9.0% 2.1% 55.2% 5.7% 20.3%AT&T Inc. Board- Independent Board Chairman/Separate Chair-CEO Not named 43.3% 55.5% 1.2% 24.9% 31.9% 0.7% 19.7%AutoNation, Inc. Board- Independent Board Chairman/Separate Chair-CEO Individual- Chevedden, J. 15.9% 84.1% 0.0% 14.0% 74.4% 0.1% 4.4%AutoNation, Inc. Cumulative Voting IBEW 15.1% 84.8% 0.1% 13.3% 75.0% 0.1% 4.4%Baker Hughes Incorporated Board- Majority Vote to Elect Directors + UBCJA 56.1% 43.0% 0.9% 41.3% 31.6% 0.6% 7.5%Bank of America Corporation Executive Compensation- Require Equity to be Retained Individual- Chevedden, R. 26.5% 71.2% 2.3% 13.4% 35.9% 1.2% 26.1%Bank of New York Mellon Corp. Board- Independent Board Chairman/Separate Chair-CEO Trowel Trades 32.1% 67.6% 0.3% 25.5% 53.8% 0.3% 7.1%Bank of New York Mellon Corp. Cumulative Voting Individual- Davis, E. 26.3% 73.3% 0.4% 20.9% 58.3% 0.3% 7.1%Barnes Group Inc. Board- Independent Board Chairman/Separate Chair-CEO Individual- Armstrong, G. 46.0% 53.4% 0.6% 37.8% 44.0% 0.5% 7.7%Baxter International Inc. Repeal Classified Board Nathan Cummings Foundation 98.1% 1.8% 0.1% 76.0% 1.4% 0.1% 7.9%Baxter International Inc. Supermajority Provision- Eliminate or Reduce Individual- Chevedden, J. 98.4% 1.5% 0.1% 76.3% 1.2% 0.1% 7.9%BB&T Corporation Board- Majority Vote to Elect Directors + UBCJA 47.3% 51.8% 0.9% 32.1% 35.2% 0.6% 14.4%Becton Dickinson and Company Cumulative Voting Individual- Davis, E. 25.9% 73.5% 0.6% 18.9% 53.5% 0.4% 10.7%Bemis Company, Inc. Repeal Classified Board North Carolina Retirement System 74.7% 24.7% 0.6% 53.8% 17.8% 0.4% 12.9%Berkshire Hathaway Inc. Board- Adopt and Disclose CEO Succession Planning Guidelines AFL-CIO 4.6% 95.1% 0.3% 3.1% 64.5% 0.2% 0.0%Best Buy Co., Inc. Repeal Classified Board Nathan Cummings Foundation 97.4% 1.4% 1.2% 74.6% 1.1% 0.9% 10.1%Boeing Company Executive Compensation- Approve/Disclose Supplemental Retirement Plans Not named 31.5% 67.7% 0.8% 22.7% 48.8% 0.6% 14.6%Boeing Company Executive Compensation- Require Equity to be Retained Not named 23.5% 75.5% 1.0% 16.9% 54.4% 0.7% 14.6%Boeing Company Shareholder Right to Act by Written Consent Not named 35.0% 63.8% 1.2% 25.2% 45.9% 0.9% 14.6%Boston Private Financial Holdings Inc. Supermajority Provision- Eliminate or Reduce Individual- Armstrong, G. 72.3% 27.6% 0.1% 58.7% 22.5% 0.1% 0.0%Bristol-Myers Squibb Company Shareholder Right to Act by Written Consent Individual- Steiner, K. 38.1% 61.1% 0.8% 25.6% 41.0% 0.6% 18.2%Cabot Oil & Gas Corporation Executive Compensation- Add Sustainability Performance Metrics LongView 7.1% 90.3% 2.6% 6.1% 77.4% 2.3% 4.4%CarMax, Inc. Repeal Classified Board Nathan Cummings Foundation 87.3% 12.5% 0.2% 72.9% 10.5% 0.2% 6.6%Caterpillar Inc. Board- Majority Vote to Elect Directors + UBCJA 40.2% 59.2% 0.6% 27.1% 39.9% 0.4% 17.4%Caterpillar Inc. Shareholder Right to Act by Written Consent Not named 39.2% 59.8% 1.0% 26.4% 40.3% 0.7% 17.4%Celgene Corporation Shareholder Right to Call Special Meeting Individual- Chevedden, J. 59.8% 40.0% 0.2% 43.0% 28.8% 0.2% 11.4%CenturyLink, Inc. Executive Compensation- Award Performance-Based Equity Awards Individual- Floyd, H. 27.2% 71.9% 0.9% 18.6% 49.1% 0.7% 20.1%CenturyLink, Inc. Executive Compensation- Establish bonus deferral policy CWA 28.8% 70.2% 1.0% 19.7% 47.9% 0.7% 20.1%Cerner Corporation Repeal Classified Board Illinois State Board of Investment 64.9% 34.9% 0.2% 54.4% 29.2% 0.1% 7.2%CF Industries Holdings, Inc. Board- Majority Vote to Elect Directors - Sheet Metal Workers 91.6% 8.3% 0.1% 73.9% 6.7% 0.1% 4.8%CF Industries Holdings, Inc. Repeal Classified Board LACERA 92.7% 7.2% 0.1% 74.8% 5.8% 0.1% 4.8%Charles Schwab Corporation Adopt Proxy Access Norges Bank Investment Management 30.9% 68.9% 0.2% 26.1% 58.1% 0.2% 8.0%Chesapeake Energy Corporation Adopt Proxy Access New York City Pension Funds 59.9% 36.3% 3.8% 39.6% 23.9% 2.5% 19.6%Chesapeake Energy Corporation Reincorporation- OK to DE Individual- Armstrong, G. 53.3% 43.0% 3.7% 35.2% 28.4% 2.5% 19.6%Chesapeake Energy Corporation Supermajority Provision- Eliminate or Reduce CalPERS 86.2% 12.9% 0.9% 56.9% 8.5% 0.6% 19.6%Chevron Corporation Board- Independent Board Chairman/Separate Chair-CEO Plumbers and Pipefitters 37.9% 61.4% 0.7% 27.0% 43.7% 0.5% 14.2%Chevron Corporation Board- Nominate Director with Environmental Expertise New York State Pension Funds 21.2% 77.5% 1.3% 15.1% 55.2% 0.9% 14.2%Chevron Corporation Repeal Exclusive Forum Bylaw LongView 38.7% 59.1% 2.2% 27.6% 42.1% 1.6% 14.2%Chevron Corporation Shareholder Right to Call Special Meeting Not named 30.5% 68.7% 0.8% 21.7% 48.9% 0.6% 14.2%Chipotle Mexican Grill, Inc. Repeal Classified Board Illinois State Board of Investment 89.4% 10.5% 0.1% 74.1% 8.7% 0.1% 8.1%Citigroup Inc. Executive Compensation- Require Equity to be Retained Individual- Steiner, K. 26.2% 73.4% 0.4% 15.6% 43.8% 0.2% 16.2%

> 22
FIGURE 14> Voting Results Sorted by Company – 2012
As Percentage of Votes Cast
As Percentage of Shares Outstanding
Company Proposal Sponsor For Against Abstain For Against Abstain Non-Vote
CME Group Inc. Adopt Proxy Access Norges Bank Investment Management 37.8% 61.8% 0.4% 26.6% 43.5% 0.2% 12.4%Cognizant Technology Solutions Corp. Repeal Classified Board LACERA 91.1% 8.7% 0.2% 75.8% 7.3% 0.1% 6.0%Colgate-Palmolive Company Board- Independent Board Chairman/Separate Chair-CEO Individual- Chevedden, J. 21.1% 78.4% 0.5% 15.2% 56.4% 0.4% 11.7%Comcast Corporation Board- Independent Board Chairman/Separate Chair-CEO AFL-CIO 21.0% 78.8% 0.2% 17.7% 66.5% 0.2% 4.6%Comcast Corporation Cumulative Voting Individual- Davis, E. 28.0% 71.7% 0.3% 23.6% 60.5% 0.2% 4.6%Comcast Corporation Executive Compensation- Require Equity to be Retained IBEW 11.1% 88.6% 0.3% 9.4% 74.8% 0.2% 4.6%Comcast Corporation Poison Pill- Redeem or Vote on Individual- Steiner, K. 52.0% 47.8% 0.2% 43.9% 40.3% 0.2% 4.6%Commerce Bancshares, Inc. Repeal Classified Board Individual- Armstrong, G. 45.3% 54.1% 0.6% 34.2% 40.8% 0.5% 13.2%Consolidated Edison, Inc. Executive Compensation- Greater Disclosure Individual- Davis, E. 10.4% 87.7% 1.9% 5.3% 45.0% 1.0% 30.7%DaVita Inc. Executive Compensation- Require Equity to be Retained Individual- McRitchie, J. 34.9% 64.9% 0.2% 29.4% 54.6% 0.1% 4.8%Dean Foods Company Board- Independent Board Chairman/Separate Chair-CEO AFSCME 45.7% 54.0% 0.3% 37.1% 43.9% 0.2% 10.4%Dean Foods Company Exec. Comp.- Eliminate Accelerated Vesting in Termination/Change-of-Control PhiPERS 42.1% 57.5% 0.4% 34.2% 46.8% 0.3% 10.4%Dean Foods Company Executive Compensation- Require Equity to be Retained IBEW 32.6% 67.0% 0.4% 26.5% 54.4% 0.4% 10.4%Dentsply International Inc. Repeal Classified Board LACERA 78.4% 21.4% 0.2% 64.6% 17.6% 0.2% 5.8%DIRECTV Exec. Comp.- Eliminate Accelerated Vesting in Termination/Change-of-Control IBEW 31.4% 68.4% 0.2% 23.6% 51.4% 0.2% 5.8%Dow Chemical Company Board- Independent Board Chairman/Separate Chair-CEO Not named 36.1% 63.1% 0.8% 27.8% 48.6% 0.6% 10.7%Dow Chemical Company Shareholder Right to Act by Written Consent Not named 38.3% 60.6% 1.1% 29.5% 46.7% 0.8% 10.7%Duke Energy Corporation Board- Majority Vote to Elect Directors + UBCJA 40.8% 58.3% 0.9% 22.7% 32.4% 0.5% 28.8%E. I. du Pont de Nemours and Co. Board- Independent Board Chairman/Separate Chair-CEO Individual- Steiner, W. 42.7% 56.8% 0.5% 28.3% 37.7% 0.4% 16.0%E. I. du Pont de Nemours and Co. Executive Compensation- Report on pay disparity IBEW 6.9% 89.0% 4.1% 4.6% 59.1% 2.7% 16.0%Eastman Chemical Co. Shareholder Right to Act by Written Consent Individual- Chevedden, R. 51.1% 47.8% 1.1% 40.9% 38.2% 0.8% 6.7%Ecolab Inc. Poison Pill- Redeem or Vote on Individual- Chevedden, J. 68.5% 31.0% 0.5% 56.6% 25.6% 0.3% 6.5%Edison International Board- Independent Board Chairman/Separate Chair-CEO Individual- Chevedden, J. 38.8% 60.7% 0.5% 29.8% 46.7% 0.4% 9.1%Edwards Lifesciences Corporation Repeal Classified Board Illinois State Board of Investment 97.6% 1.2% 1.2% 77.3% 0.9% 1.0% 7.6%Edwards Lifesciences Corporation Supermajority Provision- Eliminate or Reduce Individual- Chevedden, J. 82.4% 17.4% 0.2% 66.0% 14.0% 0.2% 6.6%Eli Lilly and Company Board- Establish engagement process with proponents of shareholder proposals Individual- Brown, R. 16.6% 82.6% 0.8% 12.5% 62.2% 0.6% 11.9%Emerson Electric Co. Repeal Classified Board AFSCME 76.6% 22.6% 0.8% 57.4% 16.9% 0.6% 12.7%Energen Corporation Repeal Classified Board New York City Pension Funds 82.6% 16.8% 0.6% 67.4% 13.7% 0.5% 8.7%EOG Resources, Inc. Exec. Comp.- Eliminate Accelerated Vesting in Termination/Change-of-Control LongView 42.5% 57.4% 0.1% 36.2% 49.1% 0.0% 4.0%EOG Resources, Inc. Executive Compensation- Require Equity to be Retained AFL-CIO 23.1% 76.7% 0.2% 19.7% 65.4% 0.2% 4.0%EQT Corporation Repeal Classified Board OPERS 81.0% 17.5% 1.5% 60.0% 13.0% 1.1% 12.8%Express Scripts Holding Company Shareholder Right to Act by Written Consent Not named 54.7% 44.5% 0.8% 40.6% 33.0% 0.6% 10.2%Expeditors Int'l of Washington, Inc. Board- Independent Board Chairman/Separate Chair-CEO Individual- Chevedden, J. 44.3% 55.5% 0.2% 36.2% 45.3% 0.1% 6.7%Exxon Mobil Corporation Board- Independent Board Chairman/Separate Chair-CEO RAM Trust 34.8% 64.2% 1.0% 22.3% 41.2% 0.7% 18.3%Exxon Mobil Corporation Board- Majority Vote to Elect Directors + UBCJA 42.8% 56.0% 1.2% 27.5% 35.9% 0.8% 18.3%F5 Networks, Inc. Repeal Classified Board Illinois State Board of Investment 77.2% 21.0% 1.8% 61.2% 16.6% 1.5% 8.5%First Solar, Inc. Board- Majority Vote to Elect Directors - CalSTRS 48.3% 51.6% 0.1% 34.3% 36.6% 0.1% 11.9%FirstEnergy Corp. Supermajority Provision- Eliminate or Reduce Individual- Chevedden, R. 67.5% 31.3% 1.2% 52.8% 24.5% 0.9% 11.0%FLIR Systems, Inc Board- Majority Vote to Elect Directors + Sheet Metal Workers 57.8% 41.2% 1.0% 48.9% 34.9% 0.9% 3.9%FLIR Systems, Inc Repeal Classified Board Nathan Cummings Foundation 81.9% 17.0% 1.1% 69.3% 14.4% 0.9% 3.9%FMC Corporation Repeal Classified Board Nathan Cummings Foundation 82.6% 17.1% 0.3% 70.1% 14.5% 0.2% 4.5%Ford Motor Company Cumulative Voting Individual- Davis, E. 14.2% 85.3% 0.5% 10.2% 61.0% 0.3% 19.8%Ford Motor Company Eliminate Dual Class Stock Individual- Chevedden, R. 29.9% 69.7% 0.4% 21.4% 49.8% 0.3% 19.8%Ford Motor Company Shareholder Right to Call Special Meeting Individual- Chevedden, J. 19.7% 79.9% 0.4% 14.1% 57.1% 0.3% 19.8%Franklin Street Properties Corp. Board- Majority Vote to Elect Directors - Individual- Armstrong, G. 45.8% 52.9% 1.3% 33.2% 38.3% 1.0% 16.6%Franklin Street Properties Corp. Board- Majority Vote to Elect Directors - CalSTRS 46.1% 52.6% 1.3% 33.3% 38.1% 1.0% 16.6%Freeport-McMoRan Copper & Gold Inc. Board- Nominate Director with Environmental Expertise New York State Pension Funds 31.4% 68.0% 0.6% 19.8% 42.8% 0.4% 15.3%Frontier Communications Corp. Arbitration provision for shareholder lawsuits or claims Individual- Vuchetich, D. 8.1% 90.3% 1.6% 3.8% 41.7% 0.7% 34.9%Frontier Communications Corp. Board- Independent Board Chairman/Separate Chair-CEO AFL-CIO 41.8% 56.9% 1.3% 19.3% 26.3% 0.6% 34.9%General Dynamics Corporation Board- Independent Board Chairman/Separate Chair-CEO Individual- Chevedden, J. 27.7% 72.1% 0.2% 23.0% 59.9% 0.1% 6.7%General Electric Company Board- Independent Board Chairman/Separate Chair-CEO Individual- Steiner, W. 21.7% 75.0% 3.3% 12.8% 44.2% 2.0% 19.9%General Electric Company Cumulative Voting Individual- Davis, E. 26.2% 71.8% 2.0% 15.5% 42.4% 1.2% 19.9%General Electric Company Shareholder Right to Act by Written Consent Individual- Steiner, K. 46.9% 51.7% 1.4% 27.7% 30.5% 0.8% 19.9%GEO Group, Inc. Board- Majority Vote to Elect Directors - New York City Pension Funds 64.7% 35.3% 0.0% 58.4% 31.8% 0.0% 5.1%Gilead Sciences, Inc. Poison Pill- Redeem or Vote on Individual- McRitchie, J. 79.1% 20.5% 0.4% 62.0% 16.1% 0.3% 6.2%Gilead Sciences, Inc. Shareholder Right to Act by Written Consent Individual- Chevedden, J. 52.2% 47.3% 0.5% 40.9% 37.0% 0.4% 6.2%Goldman Sachs Group, Inc. Cumulative Voting Individual- Davis, E. 24.0% 75.8% 0.2% 16.4% 51.9% 0.2% 13.1%Goldman Sachs Group, Inc. Executive Compensation- Require Equity to be Retained Harrington Investments 17.3% 81.3% 1.4% 11.8% 55.7% 1.0% 13.1%Google Inc. Arbitration provision for shareholder lawsuits or claims Individual- Shaevsky, M. 0.4% 99.5% 0.1% 0.3% 90.3% 0.1% 3.1%Google Inc. Eliminate Dual Class Stock Individual- Chevedden, J. 17.6% 82.3% 0.1% 16.0% 74.6% 0.1% 3.1%Graco Inc. Board- Majority Vote to Elect Directors - CalPERS 84.0% 15.8% 0.2% 68.3% 12.9% 0.2% 9.8%Healthcare Services Group, Inc. Board- Majority Vote to Elect Directors - CalSTRS 76.4% 22.5% 1.1% 64.8% 19.0% 1.0% 9.7%

> 23
FIGURE 14> Voting Results Sorted by Company – 2012
As Percentage of Votes Cast
As Percentage of Shares Outstanding
Company Proposal Sponsor For Against Abstain For Against Abstain Non-Vote
Healthways, Inc. Repeal Classified Board New York State Pension Funds 90.8% 9.1% 0.1% 73.5% 7.3% 0.1% 8.2%Hess Corporation Repeal Classified Board North Carolina Retirement System 77.5% 19.7% 2.8% 56.8% 14.4% 2.1% 10.0%Hewlett-Packard Company Executive Compensation- Require Equity to be Retained Individual- Chevedden, J. 24.4% 75.1% 0.5% 16.4% 50.6% 0.3% 13.0%Home Depot Inc. Shareholder Right to Act by Written Consent Individual- Chevedden, J. 25.8% 73.8% 0.4% 18.6% 53.2% 0.3% 14.6%Home Depot Inc. Shareholder Right to Call Special Meeting Individual- Steiner, K. 41.4% 58.3% 0.3% 29.9% 42.1% 0.2% 14.6%Honeywell International Inc. Board- Independent Board Chairman/Separate Chair-CEO Individual- Chevedden, J. 46.4% 53.0% 0.6% 36.6% 41.9% 0.5% 10.3%Hospitality Properties Trust Repeal Classified Board CalPERS 89.7% 9.8% 0.5% 67.6% 7.4% 0.4% 15.0%International Bancshares Corp. Board- Majority Vote to Elect Directors - CalSTRS 89.9% 10.1% 0.0% 64.9% 7.3% 0.0% 17.3%International Paper Company Shareholder Right to Act by Written Consent Individual- Steiner, K. 51.3% 48.3% 0.4% 40.3% 37.9% 0.3% 11.2%Interpublic Group of Companies, Inc. Executive Compensation- Require Equity to be Retained Individual- Steiner, K. 21.5% 78.0% 0.5% 17.4% 63.2% 0.4% 4.7%ITT Corporation Board- Independent Board Chairman/Separate Chair-CEO Individual- Steiner, W. 43.5% 56.3% 0.2% 35.6% 46.1% 0.2% 9.0%ITT Corporation Reincorporation- IN to DE Individual- Chevedden, J. 3.1% 89.2% 7.7% 2.5% 73.0% 6.3% 9.0%Janus Capital Group Inc. Board- Independent Board Chairman/Separate Chair-CEO AFSCME 40.1% 53.9% 6.0% 32.7% 44.0% 4.9% 8.9%Johnson & Johnson Board- Independent Board Chairman/Separate Chair-CEO AFSCME 42.6% 56.8% 0.6% 28.2% 37.6% 0.4% 15.8%Johnson Controls, Inc. Repeal Classified Board Individual- Armstrong, G. 84.5% 14.6% 0.9% 66.9% 11.6% 0.7% 9.3%JPMorgan Chase & Co. Board- Independent Board Chairman/Separate Chair-CEO AFSCME 40.0% 59.5% 0.5% 29.1% 43.3% 0.3% 10.4%JPMorgan Chase & Co. Executive Compensation- Require Equity to be Retained Individual- Chevedden, J. 25.7% 73.5% 0.8% 18.7% 53.5% 0.6% 10.4%JPMorgan Chase & Co. Shareholder Right to Act by Written Consent Individual- Chevedden, J. 52.3% 46.9% 0.8% 38.1% 34.1% 0.6% 10.4%Kansas City Southern Supermajority Provision- Eliminate or Reduce Individual- McRitchie, J. 69.9% 29.8% 0.3% 58.9% 25.1% 0.3% 7.8%Kellogg Company Repeal Classified Board North Carolina Retirement System 47.3% 52.4% 0.3% 37.2% 41.1% 0.2% 8.7%Kellogg Company Supermajority Provision- Eliminate or Reduce Individual- McRitchie, J. 41.9% 57.9% 0.2% 32.9% 45.4% 0.2% 8.7%KeyCorp Board- Independent Board Chairman/Separate Chair-CEO Individual- Armstrong, G. 53.4% 45.9% 0.7% 40.8% 35.1% 0.5% 9.6%Kindred Healthcare, Inc. Board- Independent Board Chairman/Separate Chair-CEO PhiPERS 52.1% 47.4% 0.5% 45.9% 41.8% 0.5% 5.2%Kohl's Corporation Board- Adopt and Disclose CEO Succession Planning Guidelines Trowel Trades 18.0% 81.9% 0.1% 14.9% 67.7% 0.1% 5.4%Kohl's Corporation Executive Compensation- Require Equity to be Retained Individual- Chevedden, J. 20.6% 79.2% 0.2% 17.0% 65.6% 0.2% 5.4%Lexmark International, Inc. Repeal Classified Board North Carolina Retirement System 92.8% 7.1% 0.1% 74.7% 5.7% 0.0% 5.0%Limited Brands, Inc. Board- Independent Board Chairman/Separate Chair-CEO AFL-CIO 21.7% 78.2% 0.1% 18.5% 66.8% 0.1% 6.3%Limited Brands, Inc. Executive Compensation- Require Equity to be Retained IBEW 19.3% 80.4% 0.3% 16.5% 68.7% 0.3% 6.3%Limited Brands, Inc. Repeal Classified Board Illinois State Board of Investment 64.5% 35.4% 0.1% 55.2% 30.2% 0.1% 6.3%Limited Brands, Inc. Shareholder Right to Call Special Meeting Individual- Chevedden, J. 33.6% 66.3% 0.1% 28.7% 56.7% 0.1% 6.3%Liz Claiborne, Inc. Shareholder Right to Call Special Meeting Not named 46.8% 51.6% 1.6% 38.2% 42.1% 1.3% 10.5%Lockheed Martin Corporation Board- Independent Board Chairman/Separate Chair-CEO AFSCME 36.2% 61.8% 2.0% 30.6% 52.2% 1.7% 7.6%Lorillard, Inc. Repeal Classified Board Illinois State Board of Investment 96.4% 2.6% 1.0% 82.0% 2.2% 0.9% 4.4%Lowe’s Companies, Inc. Executive Compensation- Require Equity to be Retained Individual- Chevedden, J. 23.2% 75.9% 0.9% 18.2% 59.6% 0.7% 11.5%Masco Corporation Executive Compensation- Require Equity to be Retained Nathan Cummings Foundation 13.3% 86.3% 0.4% 11.3% 73.0% 0.3% 5.7%Masco Corporation Repeal Classified Board Illinois State Board of Investment 84.5% 15.2% 0.3% 71.5% 12.9% 0.2% 5.7%McGraw-Hill Companies, Inc. Shareholder Right to Act by Written Consent Individual- Steiner, K. 47.1% 52.6% 0.3% 39.1% 43.6% 0.3% 5.3%MEMC Electronic Materials, Inc. Repeal Classified Board North Carolina Retirement System 95.5% 4.4% 0.1% 63.6% 2.9% 0.1% 17.3%Merck & Co., Inc. Shareholder Right to Act by Written Consent Individual- Steiner, W. 45.2% 54.2% 0.6% 32.8% 39.3% 0.4% 12.1%Merck & Co., Inc. Shareholder Right to Call Special Meeting Individual- Steiner, K. 34.0% 65.6% 0.4% 24.6% 47.6% 0.4% 12.1%Moody's Corporation Repeal Classified Board Nathan Cummings Foundation 76.9% 22.9% 0.2% 66.2% 19.7% 0.2% 5.5%Motorola Solutions, Inc. Executive Compensation- Require Equity to be Retained Individual- Steiner, K. 24.0% 75.8% 0.2% 18.8% 59.4% 0.2% 8.6%Mylan Inc. Board- Independent Board Chairman/Separate Chair-CEO New York City Pension Funds 35.3% 64.0% 0.7% 25.7% 46.5% 0.5% 9.7%Nabors Industries Ltd. Adopt Proxy Access New York City Pension Funds 56.0% 43.7% 0.3% 44.5% 34.7% 0.2% 7.9%Nabors Industries Ltd. Executive Compensation- Approve/Vote on Golden Parachutes CalPERS 66.0% 33.7% 0.3% 52.4% 26.8% 0.2% 7.9%NASDAQ OMX Group, Inc. Shareholder Right to Call Special Meeting Individual- Steiner, K. 49.0% 48.6% 2.4% 31.5% 31.2% 1.6% 5.0%NASDAQ OMX Group, Inc. Supermajority Provision- Eliminate or Reduce Individual- Steiner, W. 68.0% 31.9% 0.1% 43.7% 20.5% 0.0% 5.0%Netflix, Inc. Repeal Classified Board LACERA 74.7% 25.0% 0.3% 48.3% 16.2% 0.2% 18.3%Netflix, Inc. Shareholder Right to Call Special Meeting Individual- Chevedden, J. 53.3% 46.4% 0.3% 34.5% 30.0% 0.2% 18.3%New York Community Bancorp, Inc. Board- Majority Vote to Elect Directors - CalPERS 53.1% 45.5% 1.4% 35.3% 30.3% 0.9% 24.0%NiSource Inc. Cumulative Voting Individual- Chevedden, R. 24.6% 74.4% 1.0% 18.0% 54.4% 0.7% 9.9%Northern Trust Corporation Board- Independent Board Chairman/Separate Chair-CEO AFSCME 40.6% 59.0% 0.4% 34.1% 49.6% 0.4% 5.0%Northern Trust Corporation Exec. Comp.- Eliminate Accelerated Vesting in Termination/Change-of-Control Trowel Trades 40.9% 58.0% 1.1% 34.4% 48.8% 0.9% 5.0%Northrop Grumman Corporation Board- Independent Board Chairman/Separate Chair-CEO Individual- Chevedden, J. 42.8% 56.6% 0.6% 34.0% 44.9% 0.5% 8.2%Nucor Corporation Board- Majority Vote to Elect Directors + UBCJA 39.4% 60.2% 0.4% 29.3% 44.8% 0.3% 12.5%NYSE Euronext Shareholder Right to Call Special Meeting Individual- Steiner, K. 59.2% 39.5% 1.3% 40.0% 26.7% 0.9% 16.3%Occidental Petroleum Corporation Board- Nominate Director with Environmental Expertise New York State Pension Funds 4.1% 85.6% 10.3% 3.3% 69.3% 8.3% 5.4%OGE Energy Corp. Supermajority Provision- Eliminate or Reduce Individual- Chevedden, J. 64.3% 34.4% 1.3% 44.4% 23.8% 0.9% 17.1%Oshkosh Corporation Shareholder Right to Act by Written Consent Not named 49.1% 50.3% 0.6% 42.9% 44.0% 0.5% 0.0%Paccar Inc Board- Majority Vote to Elect Directors - Sheet Metal Workers 97.0% 2.9% 0.1% 83.4% 2.5% 0.1% 0.0%Paccar Inc Repeal Classified Board North Carolina Retirement System 49.8% 49.9% 0.3% 42.8% 42.9% 0.3% 0.0%Paccar Inc Supermajority Provision- Eliminate or Reduce Individual- Chevedden, J. 44.1% 55.5% 0.4% 38.0% 47.8% 0.3% 0.0%
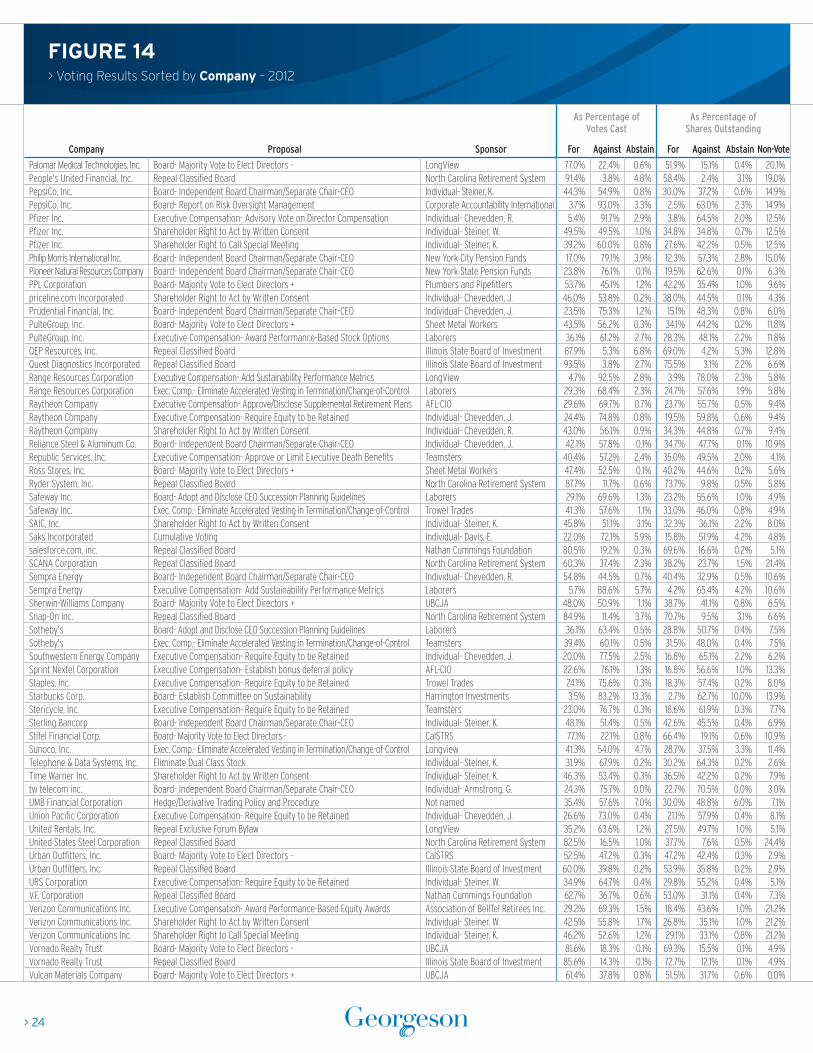
> 24
FIGURE 14> Voting Results Sorted by Company – 2012
As Percentage of Votes Cast
As Percentage of Shares Outstanding
Company Proposal Sponsor For Against Abstain For Against Abstain Non-Vote
Palomar Medical Technologies, Inc. Board- Majority Vote to Elect Directors - LongView 77.0% 22.4% 0.6% 51.9% 15.1% 0.4% 20.1%People's United Financial, Inc. Repeal Classified Board North Carolina Retirement System 91.4% 3.8% 4.8% 58.4% 2.4% 3.1% 19.0%PepsiCo, Inc. Board- Independent Board Chairman/Separate Chair-CEO Individual- Steiner, K. 44.3% 54.9% 0.8% 30.0% 37.2% 0.6% 14.9%PepsiCo, Inc. Board- Report on Risk Oversight Management Corporate Accountability International 3.7% 93.0% 3.3% 2.5% 63.0% 2.3% 14.9%Pfizer Inc. Executive Compensation- Advisory Vote on Director Compensation Individual- Chevedden, R. 5.4% 91.7% 2.9% 3.8% 64.5% 2.0% 12.5%Pfizer Inc. Shareholder Right to Act by Written Consent Individual- Steiner, W. 49.5% 49.5% 1.0% 34.8% 34.8% 0.7% 12.5%Pfizer Inc. Shareholder Right to Call Special Meeting Individual- Steiner, K. 39.2% 60.0% 0.8% 27.6% 42.2% 0.5% 12.5%Philip Morris International Inc. Board- Independent Board Chairman/Separate Chair-CEO New York City Pension Funds 17.0% 79.1% 3.9% 12.3% 57.3% 2.8% 15.0%Pioneer Natural Resources Company Board- Independent Board Chairman/Separate Chair-CEO New York State Pension Funds 23.8% 76.1% 0.1% 19.5% 62.6% 0.1% 6.3%PPL Corporation Board- Majority Vote to Elect Directors + Plumbers and Pipefitters 53.7% 45.1% 1.2% 42.2% 35.4% 1.0% 9.6%priceline.com Incorporated Shareholder Right to Act by Written Consent Individual- Chevedden, J. 46.0% 53.8% 0.2% 38.0% 44.5% 0.1% 4.3%Prudential Financial, Inc. Board- Independent Board Chairman/Separate Chair-CEO Individual- Chevedden, J. 23.5% 75.3% 1.2% 15.1% 48.3% 0.8% 6.0%PulteGroup, Inc. Board- Majority Vote to Elect Directors + Sheet Metal Workers 43.5% 56.2% 0.3% 34.1% 44.2% 0.2% 11.8%PulteGroup, Inc. Executive Compensation- Award Performance-Based Stock Options Laborers 36.1% 61.2% 2.7% 28.3% 48.1% 2.2% 11.8%QEP Resources, Inc. Repeal Classified Board Illinois State Board of Investment 87.9% 5.3% 6.8% 69.0% 4.2% 5.3% 12.8%Quest Diagnostics Incorporated Repeal Classified Board Illinois State Board of Investment 93.5% 3.8% 2.7% 75.5% 3.1% 2.2% 6.6%Range Resources Corporation Executive Compensation- Add Sustainability Performance Metrics LongView 4.7% 92.5% 2.8% 3.9% 78.0% 2.3% 5.8%Range Resources Corporation Exec. Comp.- Eliminate Accelerated Vesting in Termination/Change-of-Control Laborers 29.3% 68.4% 2.3% 24.7% 57.6% 1.9% 5.8%Raytheon Company Executive Compensation- Approve/Disclose Supplemental Retirement Plans AFL-CIO 29.6% 69.7% 0.7% 23.7% 55.7% 0.5% 9.4%Raytheon Company Executive Compensation- Require Equity to be Retained Individual- Chevedden, J. 24.4% 74.8% 0.8% 19.5% 59.8% 0.6% 9.4%Raytheon Company Shareholder Right to Act by Written Consent Individual- Chevedden, R. 43.0% 56.1% 0.9% 34.3% 44.8% 0.7% 9.4%Reliance Steel & Aluminum Co. Board- Independent Board Chairman/Separate Chair-CEO Individual- Chevedden, J. 42.1% 57.8% 0.1% 34.7% 47.7% 0.1% 10.9%Republic Services, Inc. Executive Compensation- Approve or Limit Executive Death Benefits Teamsters 40.4% 57.2% 2.4% 35.0% 49.5% 2.0% 4.1%Ross Stores, Inc. Board- Majority Vote to Elect Directors + Sheet Metal Workers 47.4% 52.5% 0.1% 40.2% 44.6% 0.2% 5.6%Ryder System, Inc. Repeal Classified Board North Carolina Retirement System 87.7% 11.7% 0.6% 73.7% 9.8% 0.5% 5.8%Safeway Inc. Board- Adopt and Disclose CEO Succession Planning Guidelines Laborers 29.1% 69.6% 1.3% 23.2% 55.6% 1.0% 4.9%Safeway Inc. Exec. Comp.- Eliminate Accelerated Vesting in Termination/Change-of-Control Trowel Trades 41.3% 57.6% 1.1% 33.0% 46.0% 0.8% 4.9%SAIC, Inc. Shareholder Right to Act by Written Consent Individual- Steiner, K. 45.8% 51.1% 3.1% 32.3% 36.1% 2.2% 8.0%Saks Incorporated Cumulative Voting Individual- Davis, E. 22.0% 72.1% 5.9% 15.8% 51.9% 4.2% 4.8%salesforce.com, inc. Repeal Classified Board Nathan Cummings Foundation 80.5% 19.2% 0.3% 69.6% 16.6% 0.2% 5.1%SCANA Corporation Repeal Classified Board North Carolina Retirement System 60.3% 37.4% 2.3% 38.2% 23.7% 1.5% 21.4%Sempra Energy Board- Independent Board Chairman/Separate Chair-CEO Individual- Chevedden, R. 54.8% 44.5% 0.7% 40.4% 32.9% 0.5% 10.6%Sempra Energy Executive Compensation- Add Sustainability Performance Metrics Laborers 5.7% 88.6% 5.7% 4.2% 65.4% 4.2% 10.6%Sherwin-Williams Company Board- Majority Vote to Elect Directors + UBCJA 48.0% 50.9% 1.1% 38.7% 41.1% 0.8% 6.5%Snap-On Inc. Repeal Classified Board North Carolina Retirement System 84.9% 11.4% 3.7% 70.7% 9.5% 3.1% 6.6%Sotheby's Board- Adopt and Disclose CEO Succession Planning Guidelines Laborers 36.1% 63.4% 0.5% 28.8% 50.7% 0.4% 7.5%Sotheby's Exec. Comp.- Eliminate Accelerated Vesting in Termination/Change-of-Control Teamsters 39.4% 60.1% 0.5% 31.5% 48.0% 0.4% 7.5%Southwestern Energy Company Executive Compensation- Require Equity to be Retained Individual- Chevedden, J. 20.0% 77.5% 2.5% 16.8% 65.1% 2.2% 6.2%Sprint Nextel Corporation Executive Compensation- Establish bonus deferral policy AFL-CIO 22.6% 76.1% 1.3% 16.8% 56.6% 1.0% 13.3%Staples, Inc. Executive Compensation- Require Equity to be Retained Trowel Trades 24.1% 75.6% 0.3% 18.3% 57.4% 0.2% 8.0%Starbucks Corp. Board- Establish Committee on Sustainability Harrington Investments 3.5% 83.2% 13.3% 2.7% 62.7% 10.0% 13.9%Stericycle, Inc. Executive Compensation- Require Equity to be Retained Teamsters 23.0% 76.7% 0.3% 18.6% 61.9% 0.3% 7.7%Sterling Bancorp Board- Independent Board Chairman/Separate Chair-CEO Individual- Steiner, K. 48.1% 51.4% 0.5% 42.6% 45.5% 0.4% 6.9%Stifel Financial Corp. Board- Majority Vote to Elect Directors - CalSTRS 77.1% 22.1% 0.8% 66.4% 19.1% 0.6% 10.9%Sunoco, Inc. Exec. Comp.- Eliminate Accelerated Vesting in Termination/Change-of-Control Longview 41.3% 54.0% 4.7% 28.7% 37.5% 3.3% 11.4%Telephone & Data Systems, Inc. Eliminate Dual Class Stock Individual- Steiner, K. 31.9% 67.9% 0.2% 30.2% 64.3% 0.2% 2.6%Time Warner Inc. Shareholder Right to Act by Written Consent Individual- Steiner, K. 46.3% 53.4% 0.3% 36.5% 42.2% 0.2% 7.9%tw telecom inc. Board- Independent Board Chairman/Separate Chair-CEO Individual- Armstrong, G. 24.3% 75.7% 0.0% 22.7% 70.5% 0.0% 3.0%UMB Financial Corporation Hedge/Derivative Trading Policy and Procedure Not named 35.4% 57.6% 7.0% 30.0% 48.8% 6.0% 7.1%Union Pacific Corporation Executive Compensation- Require Equity to be Retained Individual- Chevedden, J. 26.6% 73.0% 0.4% 21.1% 57.9% 0.4% 8.1%United Rentals, Inc. Repeal Exclusive Forum Bylaw LongView 35.2% 63.6% 1.2% 27.5% 49.7% 1.0% 5.1%United States Steel Corporation Repeal Classified Board North Carolina Retirement System 82.5% 16.5% 1.0% 37.7% 7.6% 0.5% 24.4%Urban Outfitters, Inc. Board- Majority Vote to Elect Directors - CalSTRS 52.5% 47.2% 0.3% 47.2% 42.4% 0.3% 2.9%Urban Outfitters, Inc. Repeal Classified Board Illinois State Board of Investment 60.0% 39.8% 0.2% 53.9% 35.8% 0.2% 2.9%URS Corporation Executive Compensation- Require Equity to be Retained Individual- Steiner, W. 34.9% 64.7% 0.4% 29.8% 55.2% 0.4% 5.1%V.F. Corporation Repeal Classified Board Nathan Cummings Foundation 62.7% 36.7% 0.6% 53.0% 31.1% 0.4% 7.3%Verizon Communications Inc. Executive Compensation- Award Performance-Based Equity Awards Association of BellTel Retirees Inc. 29.2% 69.3% 1.5% 18.4% 43.6% 1.0% 21.2%Verizon Communications Inc. Shareholder Right to Act by Written Consent Individual- Steiner, W. 42.5% 55.8% 1.7% 26.8% 35.1% 1.0% 21.2%Verizon Communications Inc. Shareholder Right to Call Special Meeting Individual- Steiner, K. 46.2% 52.6% 1.2% 29.1% 33.1% 0.8% 21.2%Vornado Realty Trust Board- Majority Vote to Elect Directors - UBCJA 81.6% 18.3% 0.1% 69.3% 15.5% 0.1% 4.9%Vornado Realty Trust Repeal Classified Board Illinois State Board of Investment 85.6% 14.3% 0.1% 72.7% 12.1% 0.1% 4.9%Vulcan Materials Company Board- Majority Vote to Elect Directors + UBCJA 61.4% 37.8% 0.8% 51.5% 31.7% 0.6% 0.0%

> 25
FIGURE 14> Voting Results Sorted by Company – 2012
As Percentage of Votes Cast
As Percentage of Shares Outstanding
Company Proposal Sponsor For Against Abstain For Against Abstain Non-Vote
Vulcan Materials Company Repeal Classified Board Illinois State Board of Investment 73.5% 25.8% 0.7% 61.6% 21.6% 0.6% 0.0%Vulcan Materials Company Supermajority Provision- Eliminate or Reduce Individual- Armstrong, G. 66.9% 32.3% 0.8% 56.1% 27.1% 0.7% 0.0%Walgreen Co. Executive Compensation- Require Equity to be Retained Individual- Chevedden, J. 35.6% 63.2% 1.2% 23.1% 41.0% 0.8% 17.0%Wal-Mart Stores, Inc. Board- Nominate Director with Healthcare Expertise Nathan Cummings Foundation 2.0% 94.1% 3.9% 1.7% 79.8% 3.3% 6.8%Wal-Mart Stores, Inc. Executive Compensation- Greater Disclosure Individual- Tifft, M. 9.3% 90.5% 0.2% 7.9% 76.7% 0.2% 6.8%Waste Connections Inc. Board- Independent Board Chairman/Separate Chair-CEO Teamsters 39.6% 60.1% 0.3% 35.5% 53.9% 0.3% 4.4%Waste Connections Inc. Supermajority Provision- Eliminate or Reduce Individual- McRitchie, J. 71.3% 28.7% 0.0% 63.9% 25.7% 0.0% 4.4%Waste Management, Inc. Executive Compensation- Require Equity to be Retained Individual- Steiner, K. 23.6% 76.2% 0.2% 17.5% 56.7% 0.2% 14.8%Waste Management, Inc. Shareholder Right to Call Special Meeting Individual- Steiner, W. 4.5% 95.3% 0.2% 3.3% 70.9% 0.2% 14.8%Wells Fargo & Company Adopt Proxy Access Norges Bank Investment Management 32.3% 67.3% 0.4% 24.9% 51.8% 0.3% 9.1%Wells Fargo & Company Board- Independent Board Chairman/Separate Chair-CEO Individual- Armstrong, G. 37.6% 62.0% 0.4% 29.0% 47.7% 0.3% 9.1%Wells Fargo & Company Cumulative Voting Trowel Trades 32.6% 67.0% 0.4% 25.1% 51.6% 0.3% 9.1%Western Union Company Adopt Proxy Access Norges Bank Investment Management 33.4% 66.2% 0.4% 27.6% 54.7% 0.3% 5.3%WGL Holdings, Inc. Cumulative Voting Individual- Davis, E. 33.2% 64.2% 2.6% 23.9% 46.3% 1.9% 16.4%Whirlpool Corporation Executive Compensation- Approve or Limit Executive Death Benefits AFL-CIO 38.8% 60.9% 0.3% 29.2% 45.8% 0.2% 10.9%Whole Foods Market, Inc. Board- Independent Board Chairman/Separate Chair-CEO Individual- McRitchie, J. 37.4% 62.4% 0.2% 27.6% 46.1% 0.1% 11.4%Whole Foods Market, Inc. Board- Removal of an unqualified director Individual- Chevedden, J. 58.0% 34.6% 7.4% 42.8% 25.6% 5.4% 11.4%Windstream Corporation Exec. Comp.- Eliminate Accelerated Vesting in Termination/Change-of-Control IBEW 21.9% 77.2% 0.9% 11.1% 39.3% 0.5% 35.7%Xcel Energy Inc. Board- Independent Board Chairman/Separate Chair-CEO Laborers 25.5% 73.4% 1.1% 17.6% 50.6% 0.7% 15.3%Yum! Brands, Inc. Board- Independent Board Chairman/Separate Chair-CEO Teamsters 42.2% 57.6% 0.2% 30.5% 41.6% 0.2% 12.6%Zions Bancorporation Executive Compensation- Recoup Bonuses if Restatement Individual- Armstrong, G. 31.4% 55.1% 13.5% 26.4% 46.4% 11.3% 0.0%
+ Have implemented a form of majority voting- Have not implemented a form of majority voting
> 26
FIGURE 15> Voting Results Sorted by Proposal – 2012
As Percentage of Votes Cast
As Percentage of Shares Outstanding
Company Proposal Sponsor For Against Abstain For Against Abstain Non-Vote
Charles Schwab Corporation Adopt Proxy Access Norges Bank Investment Management 30.9% 68.9% 0.2% 26.1% 58.1% 0.2% 8.0%Chesapeake Energy Corporation Adopt Proxy Access New York City Pension Funds 59.9% 36.3% 3.8% 39.6% 23.9% 2.5% 19.6%CME Group Inc. Adopt Proxy Access Norges Bank Investment Management 37.8% 61.8% 0.4% 26.6% 43.5% 0.2% 12.4%Nabors Industries Ltd. Adopt Proxy Access New York City Pension Funds 56.0% 43.7% 0.3% 44.5% 34.7% 0.2% 7.9%Wells Fargo & Company Adopt Proxy Access Norges Bank Investment Management 32.3% 67.3% 0.4% 24.9% 51.8% 0.3% 9.1%Western Union Company Adopt Proxy Access Norges Bank Investment Management 33.4% 66.2% 0.4% 27.6% 54.7% 0.3% 5.3%Frontier Communications Corp. Arbitration provision for shareholder lawsuits or claims Individual- Vuchetich, D. 8.1% 90.3% 1.6% 3.8% 41.7% 0.7% 34.9%Google Inc. Arbitration provision for shareholder lawsuits or claims Individual- Shaevsky, M. 0.4% 99.5% 0.1% 0.3% 90.3% 0.1% 3.1%Berkshire Hathaway Inc. Board- Adopt and Disclose CEO Succession Planning Guidelines AFL-CIO 4.6% 95.1% 0.3% 3.1% 64.5% 0.2% 0.0%Kohl's Corporation Board- Adopt and Disclose CEO Succession Planning Guidelines Trowel Trades 18.0% 81.9% 0.1% 14.9% 67.7% 0.1% 5.4%Safeway Inc. Board- Adopt and Disclose CEO Succession Planning Guidelines Laborers 29.1% 69.6% 1.3% 23.2% 55.6% 1.0% 4.9%Sotheby's Board- Adopt and Disclose CEO Succession Planning Guidelines Laborers 36.1% 63.4% 0.5% 28.8% 50.7% 0.4% 7.5%Apple Inc. Board- Conflict of Interest Report National Center for Public Policy Research 1.8% 94.9% 3.3% 1.2% 59.7% 2.1% 20.3%Starbucks Corp. Board- Establish Committee on Sustainability Harrington Investments 3.5% 83.2% 13.3% 2.7% 62.7% 10.0% 13.9%Eli Lilly and Company Board- Establish engagement process with proponents of shareholder proposals Individual- Brown, R. 16.6% 82.6% 0.8% 12.5% 62.2% 0.6% 11.9%3M Company Board- Independent Board Chairman/Separate Chair-CEO Individual- McRitchie, J. 24.2% 75.0% 0.8% 15.9% 49.3% 0.5% 16.5%Abbott Laboratories Board- Independent Board Chairman/Separate Chair-CEO IBEW 19.5% 79.7% 0.8% 14.4% 58.5% 0.6% 13.6%American Express Company Board- Independent Board Chairman/Separate Chair-CEO AFSCME 22.2% 77.6% 0.2% 17.3% 60.7% 0.1% 8.0%Amgen Inc. Board- Independent Board Chairman/Separate Chair-CEO UAW 41.7% 57.9% 0.4% 31.9% 44.4% 0.3% 10.7%Anadarko Petroleum Corporation Board- Independent Board Chairman/Separate Chair-CEO AFSCME 39.4% 60.4% 0.2% 29.5% 45.3% 0.2% 7.8%AT&T Inc. Board- Independent Board Chairman/Separate Chair-CEO Not named 43.3% 55.5% 1.2% 24.9% 31.9% 0.7% 19.7%AutoNation, Inc. Board- Independent Board Chairman/Separate Chair-CEO Individual- Chevedden, J. 15.9% 84.1% 0.0% 14.0% 74.4% 0.1% 4.4%Bank of New York Mellon Corp. Board- Independent Board Chairman/Separate Chair-CEO Trowel Trades 32.1% 67.6% 0.3% 25.5% 53.8% 0.3% 7.1%Barnes Group Inc. Board- Independent Board Chairman/Separate Chair-CEO Individual- Armstrong, G. 46.0% 53.4% 0.6% 37.8% 44.0% 0.5% 7.7%Chevron Corporation Board- Independent Board Chairman/Separate Chair-CEO Plumbers and Pipefitters 37.9% 61.4% 0.7% 27.0% 43.7% 0.5% 14.2%Colgate-Palmolive Company Board- Independent Board Chairman/Separate Chair-CEO Individual- Chevedden, J. 21.1% 78.4% 0.5% 15.2% 56.4% 0.4% 11.7%Comcast Corporation Board- Independent Board Chairman/Separate Chair-CEO AFL-CIO 21.0% 78.8% 0.2% 17.7% 66.5% 0.2% 4.6%Dean Foods Company Board- Independent Board Chairman/Separate Chair-CEO AFSCME 45.7% 54.0% 0.3% 37.1% 43.9% 0.2% 10.4%Dow Chemical Company Board- Independent Board Chairman/Separate Chair-CEO Not named 36.1% 63.1% 0.8% 27.8% 48.6% 0.6% 10.7%E. I. du Pont de Nemours and Co. Board- Independent Board Chairman/Separate Chair-CEO Individual- Steiner, W. 42.7% 56.8% 0.5% 28.3% 37.7% 0.4% 16.0%Edison International Board- Independent Board Chairman/Separate Chair-CEO Individual- Chevedden, J. 38.8% 60.7% 0.5% 29.8% 46.7% 0.4% 9.1%Expeditors Int'l of Washington, Inc. Board- Independent Board Chairman/Separate Chair-CEO Individual- Chevedden, J. 44.3% 55.5% 0.2% 36.2% 45.3% 0.1% 6.7%Exxon Mobil Corporation Board- Independent Board Chairman/Separate Chair-CEO RAM Trust 34.8% 64.2% 1.0% 22.3% 41.2% 0.7% 18.3%Frontier Communications Co. Board- Independent Board Chairman/Separate Chair-CEO AFL-CIO 41.8% 56.9% 1.3% 19.3% 26.3% 0.6% 34.9%General Dynamics Corporation Board- Independent Board Chairman/Separate Chair-CEO Individual- Chevedden, J. 27.7% 72.1% 0.2% 23.0% 59.9% 0.1% 6.7%General Electric Company Board- Independent Board Chairman/Separate Chair-CEO Individual- Steiner, W. 21.7% 75.0% 3.3% 12.8% 44.2% 2.0% 19.9%Honeywell International Inc. Board- Independent Board Chairman/Separate Chair-CEO Individual- Chevedden, J. 46.4% 53.0% 0.6% 36.6% 41.9% 0.5% 10.3%ITT Corporation Board- Independent Board Chairman/Separate Chair-CEO Individual- Steiner, W. 43.5% 56.3% 0.2% 35.6% 46.1% 0.2% 9.0%Janus Capital Group Inc. Board- Independent Board Chairman/Separate Chair-CEO AFSCME 40.1% 53.9% 6.0% 32.7% 44.0% 4.9% 8.9%Johnson & Johnson Board- Independent Board Chairman/Separate Chair-CEO AFSCME 42.6% 56.8% 0.6% 28.2% 37.6% 0.4% 15.8%JPMorgan Chase & Co. Board- Independent Board Chairman/Separate Chair-CEO AFSCME 40.0% 59.5% 0.5% 29.1% 43.3% 0.3% 10.4%KeyCorp Board- Independent Board Chairman/Separate Chair-CEO Individual- Armstrong, G. 53.4% 45.9% 0.7% 40.8% 35.1% 0.5% 9.6%Kindred Healthcare, Inc. Board- Independent Board Chairman/Separate Chair-CEO PhiPERS 52.1% 47.4% 0.5% 45.9% 41.8% 0.5% 5.2%Limited Brands, Inc. Board- Independent Board Chairman/Separate Chair-CEO AFL-CIO 21.7% 78.2% 0.1% 18.5% 66.8% 0.1% 6.3%Lockheed Martin Corporation Board- Independent Board Chairman/Separate Chair-CEO AFSCME 36.2% 61.8% 2.0% 30.6% 52.2% 1.7% 7.6%Mylan Inc. Board- Independent Board Chairman/Separate Chair-CEO New York City Pension Funds 35.3% 64.0% 0.7% 25.7% 46.5% 0.5% 9.7%Northern Trust Corporation Board- Independent Board Chairman/Separate Chair-CEO AFSCME 40.6% 59.0% 0.4% 34.1% 49.6% 0.4% 5.0%Northrop Grumman Corporation Board- Independent Board Chairman/Separate Chair-CEO Individual- Chevedden, J. 42.8% 56.6% 0.6% 34.0% 44.9% 0.5% 8.2%PepsiCo, Inc. Board- Independent Board Chairman/Separate Chair-CEO Individual- Steiner, K. 44.3% 54.9% 0.8% 30.0% 37.2% 0.6% 14.9%Philip Morris International Inc. Board- Independent Board Chairman/Separate Chair-CEO New York City Pension Funds 17.0% 79.1% 3.9% 12.3% 57.3% 2.8% 15.0%Pioneer Natural Resources Company Board- Independent Board Chairman/Separate Chair-CEO New York State Pension Funds 23.8% 76.1% 0.1% 19.5% 62.6% 0.1% 6.3%Prudential Financial, Inc. Board- Independent Board Chairman/Separate Chair-CEO Individual- Chevedden, J. 23.5% 75.3% 1.2% 15.1% 48.3% 0.8% 6.0%Reliance Steel & Aluminum Co. Board- Independent Board Chairman/Separate Chair-CEO Individual- Chevedden, J. 42.1% 57.8% 0.1% 34.7% 47.7% 0.1% 10.9%Sempra Energy Board- Independent Board Chairman/Separate Chair-CEO Individual- Chevedden, R. 54.8% 44.5% 0.7% 40.4% 32.9% 0.5% 10.6%Sterling Bancorp Board- Independent Board Chairman/Separate Chair-CEO Individual- Steiner, K. 48.1% 51.4% 0.5% 42.6% 45.5% 0.4% 6.9%tw telecom inc. Board- Independent Board Chairman/Separate Chair-CEO Individual- Armstrong, G. 24.3% 75.7% 0.0% 22.7% 70.5% 0.0% 3.0%Waste Connections Inc. Board- Independent Board Chairman/Separate Chair-CEO Teamsters 39.6% 60.1% 0.3% 35.5% 53.9% 0.3% 4.4%Wells Fargo & Company Board- Independent Board Chairman/Separate Chair-CEO Individual- Armstrong, G. 37.6% 62.0% 0.4% 29.0% 47.7% 0.3% 9.1%Whole Foods Market, Inc. Board- Independent Board Chairman/Separate Chair-CEO Individual- McRitchie, J. 37.4% 62.4% 0.2% 27.6% 46.1% 0.1% 11.4%Xcel Energy Inc. Board- Independent Board Chairman/Separate Chair-CEO Laborers 25.5% 73.4% 1.1% 17.6% 50.6% 0.7% 15.3%Yum! Brands, Inc. Board- Independent Board Chairman/Separate Chair-CEO Teamsters 42.2% 57.6% 0.2% 30.5% 41.6% 0.2% 12.6%Amgen Inc. Board- Limit CEO's service on outside boards Individual- Steiner, W. 3.7% 95.8% 0.5% 2.8% 73.3% 0.4% 10.7%

> 27
FIGURE 15> Voting Results Sorted by Proposal – 2012
As Percentage of Votes Cast
As Percentage of Shares Outstanding
Company Proposal Sponsor For Against Abstain For Against Abstain Non-Vote
American Financial Group Inc. Board- Majority Vote to Elect Directors - Not named 53.9% 46.0% 0.1% 48.1% 41.0% 0.1% 4.7%Apple Inc. Board- Majority Vote to Elect Directors - CalPERS 80.1% 19.6% 0.3% 50.4% 12.3% 0.2% 20.3%Baker Hughes Incorporated Board- Majority Vote to Elect Directors + UBCJA 56.1% 43.0% 0.9% 41.3% 31.6% 0.6% 7.5%BB&T Corporation Board- Majority Vote to Elect Directors + UBCJA 47.3% 51.8% 0.9% 32.1% 35.2% 0.6% 14.4%Caterpillar Inc. Board- Majority Vote to Elect Directors + UBCJA 40.2% 59.2% 0.6% 27.1% 39.9% 0.4% 17.4%CF Industries Holdings, Inc. Board- Majority Vote to Elect Directors - Sheet Metal Workers 91.6% 8.3% 0.1% 73.9% 6.7% 0.1% 4.8%Duke Energy Corporation Board- Majority Vote to Elect Directors + UBCJA 40.8% 58.3% 0.9% 22.7% 32.4% 0.5% 28.8%Exxon Mobil Corporation Board- Majority Vote to Elect Directors + UBCJA 42.8% 56.0% 1.2% 27.5% 35.9% 0.8% 18.3%First Solar, Inc. Board- Majority Vote to Elect Directors - CalSTRS 48.3% 51.6% 0.1% 34.3% 36.6% 0.1% 11.9%FLIR Systems, Inc Board- Majority Vote to Elect Directors + Sheet Metal Workers 57.8% 41.2% 1.0% 48.9% 34.9% 0.9% 3.9%Franklin Street Properties Corp. Board- Majority Vote to Elect Directors - Individual- Armstrong, G. 45.8% 52.9% 1.3% 33.2% 38.3% 1.0% 16.6%Franklin Street Properties Corp. Board- Majority Vote to Elect Directors - CalSTRS 46.1% 52.6% 1.3% 33.3% 38.1% 1.0% 16.6%GEO Group, Inc. Board- Majority Vote to Elect Directors - New York City Pension Funds 64.7% 35.3% 0.0% 58.4% 31.8% 0.0% 5.1%Graco Inc. Board- Majority Vote to Elect Directors - CalPERS 84.0% 15.8% 0.2% 68.3% 12.9% 0.2% 9.8%Healthcare Services Group, Inc. Board- Majority Vote to Elect Directors - CalSTRS 76.4% 22.5% 1.1% 64.8% 19.0% 1.0% 9.7%International Bancshares Corp. Board- Majority Vote to Elect Directors - CalSTRS 89.9% 10.1% 0.0% 64.9% 7.3% 0.0% 17.3%New York Community Bancorp, Inc. Board- Majority Vote to Elect Directors - CalPERS 53.1% 45.5% 1.4% 35.3% 30.3% 0.9% 24.0%Nucor Corporation Board- Majority Vote to Elect Directors + UBCJA 39.4% 60.2% 0.4% 29.3% 44.8% 0.3% 12.5%Paccar Inc Board- Majority Vote to Elect Directors - Sheet Metal Workers 97.0% 2.9% 0.1% 83.4% 2.5% 0.1% 0.0%Palomar Medical Technologies, Inc. Board- Majority Vote to Elect Directors - LongView 77.0% 22.4% 0.6% 51.9% 15.1% 0.4% 20.1%PPL Corporation Board- Majority Vote to Elect Directors + Plumbers and Pipefitters 53.7% 45.1% 1.2% 42.2% 35.4% 1.0% 9.6%PulteGroup, Inc. Board- Majority Vote to Elect Directors + Sheet Metal Workers 43.5% 56.2% 0.3% 34.1% 44.2% 0.2% 11.8%Ross Stores, Inc. Board- Majority Vote to Elect Directors + Sheet Metal Workers 47.4% 52.5% 0.1% 40.2% 44.6% 0.2% 5.6%Sherwin-Williams Company Board- Majority Vote to Elect Directors + UBCJA 48.0% 50.9% 1.1% 38.7% 41.1% 0.8% 6.5%Stifel Financial Corp. Board- Majority Vote to Elect Directors - CalSTRS 77.1% 22.1% 0.8% 66.4% 19.1% 0.6% 10.9%Urban Outfitters, Inc. Board- Majority Vote to Elect Directors - CalSTRS 52.5% 47.2% 0.3% 47.2% 42.4% 0.3% 2.9%Vornado Realty Trust Board- Majority Vote to Elect Directors - UBCJA 81.6% 18.3% 0.1% 69.3% 15.5% 0.1% 4.9%Vulcan Materials Company Board- Majority Vote to Elect Directors + UBCJA 61.4% 37.8% 0.8% 51.5% 31.7% 0.6% 0.0%Chevron Corporation Board- Nominate Director with Environmental Expertise New York State Pension Funds 21.2% 77.5% 1.3% 15.1% 55.2% 0.9% 14.2%Freeport-McMoRan Copper & Gold Inc. Board- Nominate Director with Environmental Expertise New York State Pension Funds 31.4% 68.0% 0.6% 19.8% 42.8% 0.4% 15.3%Occidental Petroleum Corporation Board- Nominate Director with Environmental Expertise New York State Pension Funds 4.1% 85.6% 10.3% 3.3% 69.3% 8.3% 5.4%Wal-Mart Stores, Inc. Board- Nominate Director with Healthcare Expertise Nathan Cummings Foundation 2.0% 94.1% 3.9% 1.7% 79.8% 3.3% 6.8%Whole Foods Market, Inc. Board- Removal of an unqualified director Individual- Chevedden, J. 58.0% 34.6% 7.4% 42.8% 25.6% 5.4% 11.4%PepsiCo, Inc. Board- Report on Risk Oversight Management Corporate Accountability International 3.7% 93.0% 3.3% 2.5% 63.0% 2.3% 14.9%AutoNation, Inc. Cumulative Voting IBEW 15.1% 84.8% 0.1% 13.3% 75.0% 0.1% 4.4%Bank of New York Mellon Corp. Cumulative Voting Individual- Davis, E. 26.3% 73.3% 0.4% 20.9% 58.3% 0.3% 7.1%Becton Dickinson and Company Cumulative Voting Individual- Davis, E. 25.9% 73.5% 0.6% 18.9% 53.5% 0.4% 10.7%Comcast Corporation Cumulative Voting Individual- Davis, E. 28.0% 71.7% 0.3% 23.6% 60.5% 0.2% 4.6%Ford Motor Company Cumulative Voting Individual- Davis, E. 14.2% 85.3% 0.5% 10.2% 61.0% 0.3% 19.8%General Electric Company Cumulative Voting Individual- Davis, E. 26.2% 71.8% 2.0% 15.5% 42.4% 1.2% 19.9%Goldman Sachs Group, Inc. Cumulative Voting Individual- Davis, E. 24.0% 75.8% 0.2% 16.4% 51.9% 0.2% 13.1%NiSource Inc. Cumulative Voting Individual- Chevedden, R. 24.6% 74.4% 1.0% 18.0% 54.4% 0.7% 9.9%Saks Incorporated Cumulative Voting Individual- Davis, E. 22.0% 72.1% 5.9% 15.8% 51.9% 4.2% 4.8%Wells Fargo & Company Cumulative Voting Trowel Trades 32.6% 67.0% 0.4% 25.1% 51.6% 0.3% 9.1%WGL Holdings, Inc. Cumulative Voting Individual- Davis, E. 33.2% 64.2% 2.6% 23.9% 46.3% 1.9% 16.4%Ford Motor Company Eliminate Dual Class Stock Individual- Chevedden, R. 29.9% 69.7% 0.4% 21.4% 49.8% 0.3% 19.8%Google Inc. Eliminate Dual Class Stock Individual- Chevedden, J. 17.6% 82.3% 0.1% 16.0% 74.6% 0.1% 3.1%Telephone & Data Systems, Inc. Eliminate Dual Class Stock Individual- Steiner, K. 31.9% 67.9% 0.2% 30.2% 64.3% 0.2% 2.6%Cabot Oil & Gas Corporation Executive Compensation- Add Sustainability Performance Metrics LongView 7.1% 90.3% 2.6% 6.1% 77.4% 2.3% 4.4%Range Resources Corporation Executive Compensation- Add Sustainability Performance Metrics LongView 4.7% 92.5% 2.8% 3.9% 78.0% 2.3% 5.8%Sempra Energy Executive Compensation- Add Sustainability Performance Metrics Laborers 5.7% 88.6% 5.7% 4.2% 65.4% 4.2% 10.6%Apple Inc. Executive Compensation- Advisory Vote on Director Compensation Individual- McRitchie, J. 3.3% 87.7% 9.0% 2.1% 55.2% 5.7% 20.3%Pfizer Inc. Executive Compensation- Advisory Vote on Director Compensation Individual- Chevedden, R. 5.4% 91.7% 2.9% 3.8% 64.5% 2.0% 12.5%Republic Services, Inc. Executive Compensation- Approve or Limit Executive Death Benefits Teamsters 40.4% 57.2% 2.4% 35.0% 49.5% 2.0% 4.1%Whirlpool Corporation Executive Compensation- Approve or Limit Executive Death Benefits AFL-CIO 38.8% 60.9% 0.3% 29.2% 45.8% 0.2% 10.9%Boeing Company Executive Compensation- Approve/Disclose Supplemental Retirement Plans Not named 31.5% 67.7% 0.8% 22.7% 48.8% 0.6% 14.6%Raytheon Company Executive Compensation- Approve/Disclose Supplemental Retirement Plans AFL-CIO 29.6% 69.7% 0.7% 23.7% 55.7% 0.5% 9.4%Nabors Industries Ltd. Executive Compensation- Approve/Vote on Golden Parachutes CalPERS 66.0% 33.7% 0.3% 52.4% 26.8% 0.2% 7.9%CenturyLink, Inc. Executive Compensation- Award Performance-Based Equity Awards Individual- Floyd, H. 27.2% 71.9% 0.9% 18.6% 49.1% 0.7% 20.1%Verizon Communications Inc. Executive Compensation- Award Performance-Based Equity Awards Association of BellTel Retirees Inc. 29.2% 69.3% 1.5% 18.4% 43.6% 1.0% 21.2%PulteGroup, Inc. Executive Compensation- Award Performance-Based Stock Options Laborers 36.1% 61.2% 2.7% 28.3% 48.1% 2.2% 11.8%Abbott Laboratories Executive Compensation- Compliance Disclosure New York City Pension Funds 34.1% 64.8% 1.1% 25.0% 47.6% 0.8% 13.6%
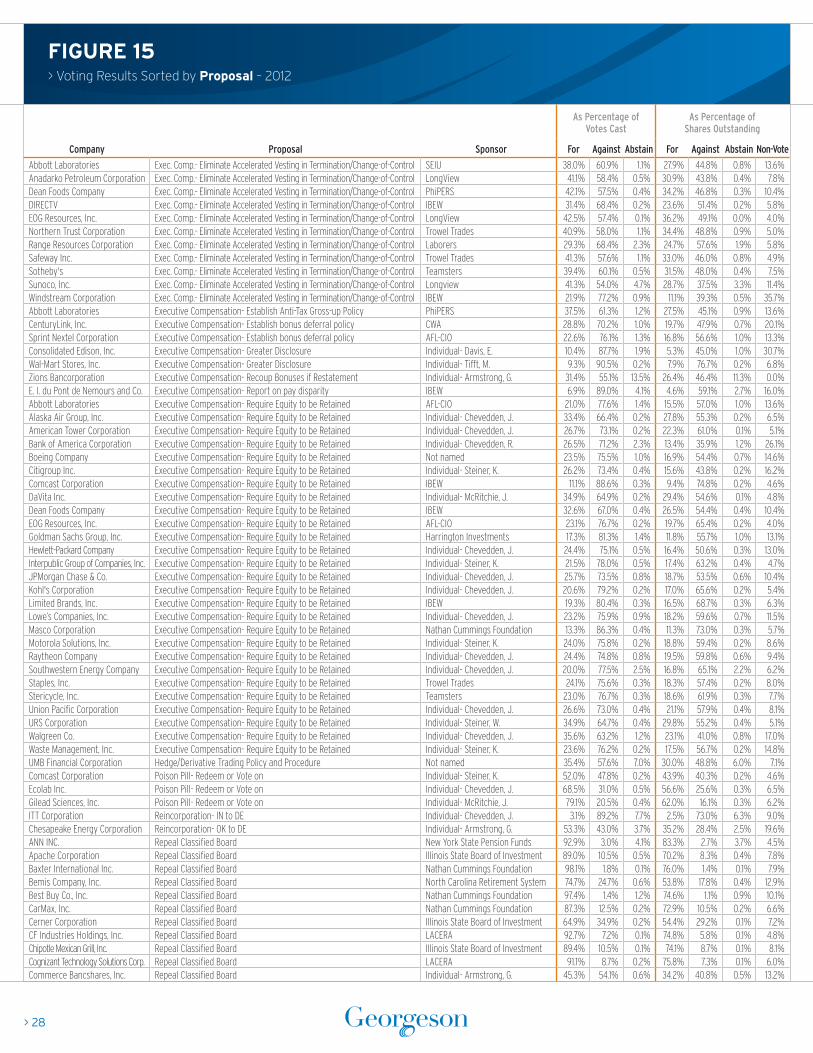
> 28
FIGURE 15> Voting Results Sorted by Proposal – 2012
As Percentage of Votes Cast
As Percentage of Shares Outstanding
Company Proposal Sponsor For Against Abstain For Against Abstain Non-Vote
Abbott Laboratories Exec. Comp.- Eliminate Accelerated Vesting in Termination/Change-of-Control SEIU 38.0% 60.9% 1.1% 27.9% 44.8% 0.8% 13.6%Anadarko Petroleum Corporation Exec. Comp.- Eliminate Accelerated Vesting in Termination/Change-of-Control LongView 41.1% 58.4% 0.5% 30.9% 43.8% 0.4% 7.8%Dean Foods Company Exec. Comp.- Eliminate Accelerated Vesting in Termination/Change-of-Control PhiPERS 42.1% 57.5% 0.4% 34.2% 46.8% 0.3% 10.4%DIRECTV Exec. Comp.- Eliminate Accelerated Vesting in Termination/Change-of-Control IBEW 31.4% 68.4% 0.2% 23.6% 51.4% 0.2% 5.8%EOG Resources, Inc. Exec. Comp.- Eliminate Accelerated Vesting in Termination/Change-of-Control LongView 42.5% 57.4% 0.1% 36.2% 49.1% 0.0% 4.0%Northern Trust Corporation Exec. Comp.- Eliminate Accelerated Vesting in Termination/Change-of-Control Trowel Trades 40.9% 58.0% 1.1% 34.4% 48.8% 0.9% 5.0%Range Resources Corporation Exec. Comp.- Eliminate Accelerated Vesting in Termination/Change-of-Control Laborers 29.3% 68.4% 2.3% 24.7% 57.6% 1.9% 5.8%Safeway Inc. Exec. Comp.- Eliminate Accelerated Vesting in Termination/Change-of-Control Trowel Trades 41.3% 57.6% 1.1% 33.0% 46.0% 0.8% 4.9%Sotheby's Exec. Comp.- Eliminate Accelerated Vesting in Termination/Change-of-Control Teamsters 39.4% 60.1% 0.5% 31.5% 48.0% 0.4% 7.5%Sunoco, Inc. Exec. Comp.- Eliminate Accelerated Vesting in Termination/Change-of-Control Longview 41.3% 54.0% 4.7% 28.7% 37.5% 3.3% 11.4%Windstream Corporation Exec. Comp.- Eliminate Accelerated Vesting in Termination/Change-of-Control IBEW 21.9% 77.2% 0.9% 11.1% 39.3% 0.5% 35.7%Abbott Laboratories Executive Compensation- Establish Anti-Tax Gross-up Policy PhiPERS 37.5% 61.3% 1.2% 27.5% 45.1% 0.9% 13.6%CenturyLink, Inc. Executive Compensation- Establish bonus deferral policy CWA 28.8% 70.2% 1.0% 19.7% 47.9% 0.7% 20.1%Sprint Nextel Corporation Executive Compensation- Establish bonus deferral policy AFL-CIO 22.6% 76.1% 1.3% 16.8% 56.6% 1.0% 13.3%Consolidated Edison, Inc. Executive Compensation- Greater Disclosure Individual- Davis, E. 10.4% 87.7% 1.9% 5.3% 45.0% 1.0% 30.7%Wal-Mart Stores, Inc. Executive Compensation- Greater Disclosure Individual- Tifft, M. 9.3% 90.5% 0.2% 7.9% 76.7% 0.2% 6.8%Zions Bancorporation Executive Compensation- Recoup Bonuses if Restatement Individual- Armstrong, G. 31.4% 55.1% 13.5% 26.4% 46.4% 11.3% 0.0%E. I. du Pont de Nemours and Co. Executive Compensation- Report on pay disparity IBEW 6.9% 89.0% 4.1% 4.6% 59.1% 2.7% 16.0%Abbott Laboratories Executive Compensation- Require Equity to be Retained AFL-CIO 21.0% 77.6% 1.4% 15.5% 57.0% 1.0% 13.6%Alaska Air Group, Inc. Executive Compensation- Require Equity to be Retained Individual- Chevedden, J. 33.4% 66.4% 0.2% 27.8% 55.3% 0.2% 6.5%American Tower Corporation Executive Compensation- Require Equity to be Retained Individual- Chevedden, J. 26.7% 73.1% 0.2% 22.3% 61.0% 0.1% 5.1%Bank of America Corporation Executive Compensation- Require Equity to be Retained Individual- Chevedden, R. 26.5% 71.2% 2.3% 13.4% 35.9% 1.2% 26.1%Boeing Company Executive Compensation- Require Equity to be Retained Not named 23.5% 75.5% 1.0% 16.9% 54.4% 0.7% 14.6%Citigroup Inc. Executive Compensation- Require Equity to be Retained Individual- Steiner, K. 26.2% 73.4% 0.4% 15.6% 43.8% 0.2% 16.2%Comcast Corporation Executive Compensation- Require Equity to be Retained IBEW 11.1% 88.6% 0.3% 9.4% 74.8% 0.2% 4.6%DaVita Inc. Executive Compensation- Require Equity to be Retained Individual- McRitchie, J. 34.9% 64.9% 0.2% 29.4% 54.6% 0.1% 4.8%Dean Foods Company Executive Compensation- Require Equity to be Retained IBEW 32.6% 67.0% 0.4% 26.5% 54.4% 0.4% 10.4%EOG Resources, Inc. Executive Compensation- Require Equity to be Retained AFL-CIO 23.1% 76.7% 0.2% 19.7% 65.4% 0.2% 4.0%Goldman Sachs Group, Inc. Executive Compensation- Require Equity to be Retained Harrington Investments 17.3% 81.3% 1.4% 11.8% 55.7% 1.0% 13.1%Hewlett-Packard Company Executive Compensation- Require Equity to be Retained Individual- Chevedden, J. 24.4% 75.1% 0.5% 16.4% 50.6% 0.3% 13.0%Interpublic Group of Companies, Inc. Executive Compensation- Require Equity to be Retained Individual- Steiner, K. 21.5% 78.0% 0.5% 17.4% 63.2% 0.4% 4.7%JPMorgan Chase & Co. Executive Compensation- Require Equity to be Retained Individual- Chevedden, J. 25.7% 73.5% 0.8% 18.7% 53.5% 0.6% 10.4%Kohl's Corporation Executive Compensation- Require Equity to be Retained Individual- Chevedden, J. 20.6% 79.2% 0.2% 17.0% 65.6% 0.2% 5.4%Limited Brands, Inc. Executive Compensation- Require Equity to be Retained IBEW 19.3% 80.4% 0.3% 16.5% 68.7% 0.3% 6.3%Lowe’s Companies, Inc. Executive Compensation- Require Equity to be Retained Individual- Chevedden, J. 23.2% 75.9% 0.9% 18.2% 59.6% 0.7% 11.5%Masco Corporation Executive Compensation- Require Equity to be Retained Nathan Cummings Foundation 13.3% 86.3% 0.4% 11.3% 73.0% 0.3% 5.7%Motorola Solutions, Inc. Executive Compensation- Require Equity to be Retained Individual- Steiner, K. 24.0% 75.8% 0.2% 18.8% 59.4% 0.2% 8.6%Raytheon Company Executive Compensation- Require Equity to be Retained Individual- Chevedden, J. 24.4% 74.8% 0.8% 19.5% 59.8% 0.6% 9.4%Southwestern Energy Company Executive Compensation- Require Equity to be Retained Individual- Chevedden, J. 20.0% 77.5% 2.5% 16.8% 65.1% 2.2% 6.2%Staples, Inc. Executive Compensation- Require Equity to be Retained Trowel Trades 24.1% 75.6% 0.3% 18.3% 57.4% 0.2% 8.0%Stericycle, Inc. Executive Compensation- Require Equity to be Retained Teamsters 23.0% 76.7% 0.3% 18.6% 61.9% 0.3% 7.7%Union Pacific Corporation Executive Compensation- Require Equity to be Retained Individual- Chevedden, J. 26.6% 73.0% 0.4% 21.1% 57.9% 0.4% 8.1%URS Corporation Executive Compensation- Require Equity to be Retained Individual- Steiner, W. 34.9% 64.7% 0.4% 29.8% 55.2% 0.4% 5.1%Walgreen Co. Executive Compensation- Require Equity to be Retained Individual- Chevedden, J. 35.6% 63.2% 1.2% 23.1% 41.0% 0.8% 17.0%Waste Management, Inc. Executive Compensation- Require Equity to be Retained Individual- Steiner, K. 23.6% 76.2% 0.2% 17.5% 56.7% 0.2% 14.8%UMB Financial Corporation Hedge/Derivative Trading Policy and Procedure Not named 35.4% 57.6% 7.0% 30.0% 48.8% 6.0% 7.1%Comcast Corporation Poison Pill- Redeem or Vote on Individual- Steiner, K. 52.0% 47.8% 0.2% 43.9% 40.3% 0.2% 4.6%Ecolab Inc. Poison Pill- Redeem or Vote on Individual- Chevedden, J. 68.5% 31.0% 0.5% 56.6% 25.6% 0.3% 6.5%Gilead Sciences, Inc. Poison Pill- Redeem or Vote on Individual- McRitchie, J. 79.1% 20.5% 0.4% 62.0% 16.1% 0.3% 6.2%ITT Corporation Reincorporation- IN to DE Individual- Chevedden, J. 3.1% 89.2% 7.7% 2.5% 73.0% 6.3% 9.0%Chesapeake Energy Corporation Reincorporation- OK to DE Individual- Armstrong, G. 53.3% 43.0% 3.7% 35.2% 28.4% 2.5% 19.6%ANN INC. Repeal Classified Board New York State Pension Funds 92.9% 3.0% 4.1% 83.3% 2.7% 3.7% 4.5%Apache Corporation Repeal Classified Board Illinois State Board of Investment 89.0% 10.5% 0.5% 70.2% 8.3% 0.4% 7.8%Baxter International Inc. Repeal Classified Board Nathan Cummings Foundation 98.1% 1.8% 0.1% 76.0% 1.4% 0.1% 7.9%Bemis Company, Inc. Repeal Classified Board North Carolina Retirement System 74.7% 24.7% 0.6% 53.8% 17.8% 0.4% 12.9%Best Buy Co., Inc. Repeal Classified Board Nathan Cummings Foundation 97.4% 1.4% 1.2% 74.6% 1.1% 0.9% 10.1%CarMax, Inc. Repeal Classified Board Nathan Cummings Foundation 87.3% 12.5% 0.2% 72.9% 10.5% 0.2% 6.6%Cerner Corporation Repeal Classified Board Illinois State Board of Investment 64.9% 34.9% 0.2% 54.4% 29.2% 0.1% 7.2%CF Industries Holdings, Inc. Repeal Classified Board LACERA 92.7% 7.2% 0.1% 74.8% 5.8% 0.1% 4.8%Chipotle Mexican Grill, Inc. Repeal Classified Board Illinois State Board of Investment 89.4% 10.5% 0.1% 74.1% 8.7% 0.1% 8.1%Cognizant Technology Solutions Corp. Repeal Classified Board LACERA 91.1% 8.7% 0.2% 75.8% 7.3% 0.1% 6.0%Commerce Bancshares, Inc. Repeal Classified Board Individual- Armstrong, G. 45.3% 54.1% 0.6% 34.2% 40.8% 0.5% 13.2%
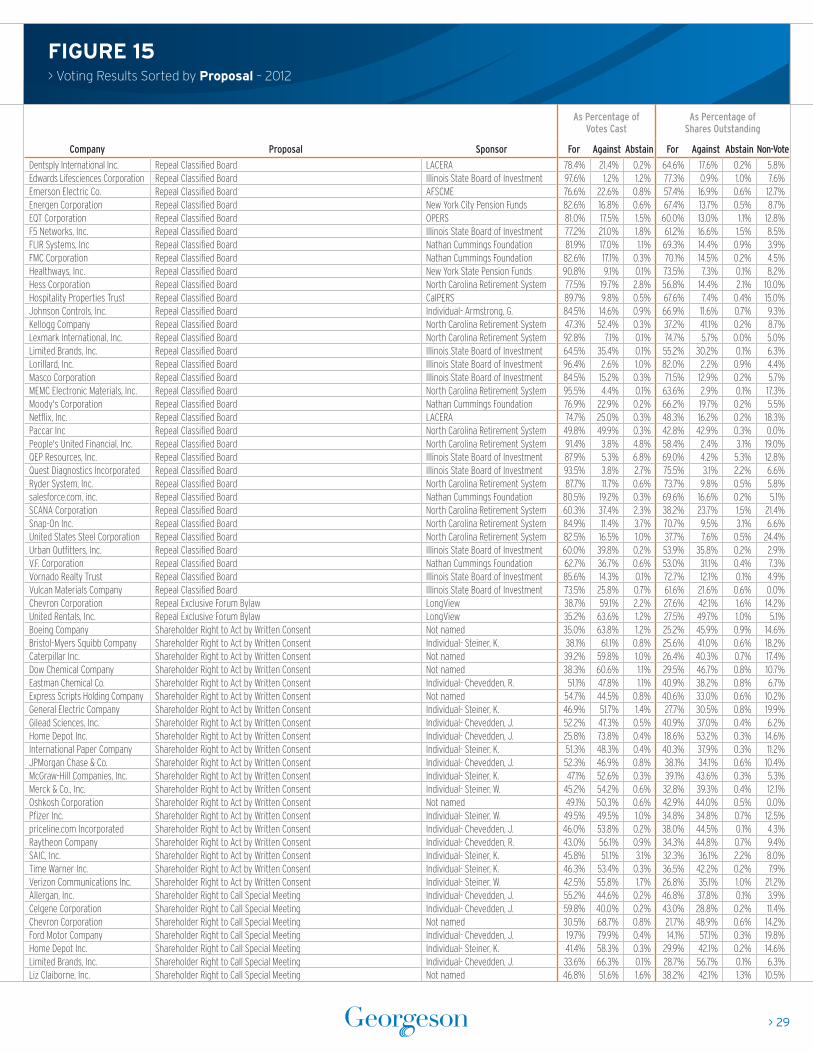
> 29
FIGURE 15> Voting Results Sorted by Proposal – 2012
As Percentage of Votes Cast
As Percentage of Shares Outstanding
Company Proposal Sponsor For Against Abstain For Against Abstain Non-Vote
Dentsply International Inc. Repeal Classified Board LACERA 78.4% 21.4% 0.2% 64.6% 17.6% 0.2% 5.8%Edwards Lifesciences Corporation Repeal Classified Board Illinois State Board of Investment 97.6% 1.2% 1.2% 77.3% 0.9% 1.0% 7.6%Emerson Electric Co. Repeal Classified Board AFSCME 76.6% 22.6% 0.8% 57.4% 16.9% 0.6% 12.7%Energen Corporation Repeal Classified Board New York City Pension Funds 82.6% 16.8% 0.6% 67.4% 13.7% 0.5% 8.7%EQT Corporation Repeal Classified Board OPERS 81.0% 17.5% 1.5% 60.0% 13.0% 1.1% 12.8%F5 Networks, Inc. Repeal Classified Board Illinois State Board of Investment 77.2% 21.0% 1.8% 61.2% 16.6% 1.5% 8.5%FLIR Systems, Inc Repeal Classified Board Nathan Cummings Foundation 81.9% 17.0% 1.1% 69.3% 14.4% 0.9% 3.9%FMC Corporation Repeal Classified Board Nathan Cummings Foundation 82.6% 17.1% 0.3% 70.1% 14.5% 0.2% 4.5%Healthways, Inc. Repeal Classified Board New York State Pension Funds 90.8% 9.1% 0.1% 73.5% 7.3% 0.1% 8.2%Hess Corporation Repeal Classified Board North Carolina Retirement System 77.5% 19.7% 2.8% 56.8% 14.4% 2.1% 10.0%Hospitality Properties Trust Repeal Classified Board CalPERS 89.7% 9.8% 0.5% 67.6% 7.4% 0.4% 15.0%Johnson Controls, Inc. Repeal Classified Board Individual- Armstrong, G. 84.5% 14.6% 0.9% 66.9% 11.6% 0.7% 9.3%Kellogg Company Repeal Classified Board North Carolina Retirement System 47.3% 52.4% 0.3% 37.2% 41.1% 0.2% 8.7%Lexmark International, Inc. Repeal Classified Board North Carolina Retirement System 92.8% 7.1% 0.1% 74.7% 5.7% 0.0% 5.0%Limited Brands, Inc. Repeal Classified Board Illinois State Board of Investment 64.5% 35.4% 0.1% 55.2% 30.2% 0.1% 6.3%Lorillard, Inc. Repeal Classified Board Illinois State Board of Investment 96.4% 2.6% 1.0% 82.0% 2.2% 0.9% 4.4%Masco Corporation Repeal Classified Board Illinois State Board of Investment 84.5% 15.2% 0.3% 71.5% 12.9% 0.2% 5.7%MEMC Electronic Materials, Inc. Repeal Classified Board North Carolina Retirement System 95.5% 4.4% 0.1% 63.6% 2.9% 0.1% 17.3%Moody's Corporation Repeal Classified Board Nathan Cummings Foundation 76.9% 22.9% 0.2% 66.2% 19.7% 0.2% 5.5%Netflix, Inc. Repeal Classified Board LACERA 74.7% 25.0% 0.3% 48.3% 16.2% 0.2% 18.3%Paccar Inc Repeal Classified Board North Carolina Retirement System 49.8% 49.9% 0.3% 42.8% 42.9% 0.3% 0.0%People's United Financial, Inc. Repeal Classified Board North Carolina Retirement System 91.4% 3.8% 4.8% 58.4% 2.4% 3.1% 19.0%QEP Resources, Inc. Repeal Classified Board Illinois State Board of Investment 87.9% 5.3% 6.8% 69.0% 4.2% 5.3% 12.8%Quest Diagnostics Incorporated Repeal Classified Board Illinois State Board of Investment 93.5% 3.8% 2.7% 75.5% 3.1% 2.2% 6.6%Ryder System, Inc. Repeal Classified Board North Carolina Retirement System 87.7% 11.7% 0.6% 73.7% 9.8% 0.5% 5.8%salesforce.com, inc. Repeal Classified Board Nathan Cummings Foundation 80.5% 19.2% 0.3% 69.6% 16.6% 0.2% 5.1%SCANA Corporation Repeal Classified Board North Carolina Retirement System 60.3% 37.4% 2.3% 38.2% 23.7% 1.5% 21.4%Snap-On Inc. Repeal Classified Board North Carolina Retirement System 84.9% 11.4% 3.7% 70.7% 9.5% 3.1% 6.6%United States Steel Corporation Repeal Classified Board North Carolina Retirement System 82.5% 16.5% 1.0% 37.7% 7.6% 0.5% 24.4%Urban Outfitters, Inc. Repeal Classified Board Illinois State Board of Investment 60.0% 39.8% 0.2% 53.9% 35.8% 0.2% 2.9%V.F. Corporation Repeal Classified Board Nathan Cummings Foundation 62.7% 36.7% 0.6% 53.0% 31.1% 0.4% 7.3%Vornado Realty Trust Repeal Classified Board Illinois State Board of Investment 85.6% 14.3% 0.1% 72.7% 12.1% 0.1% 4.9%Vulcan Materials Company Repeal Classified Board Illinois State Board of Investment 73.5% 25.8% 0.7% 61.6% 21.6% 0.6% 0.0%Chevron Corporation Repeal Exclusive Forum Bylaw LongView 38.7% 59.1% 2.2% 27.6% 42.1% 1.6% 14.2%United Rentals, Inc. Repeal Exclusive Forum Bylaw LongView 35.2% 63.6% 1.2% 27.5% 49.7% 1.0% 5.1%Boeing Company Shareholder Right to Act by Written Consent Not named 35.0% 63.8% 1.2% 25.2% 45.9% 0.9% 14.6%Bristol-Myers Squibb Company Shareholder Right to Act by Written Consent Individual- Steiner, K. 38.1% 61.1% 0.8% 25.6% 41.0% 0.6% 18.2%Caterpillar Inc. Shareholder Right to Act by Written Consent Not named 39.2% 59.8% 1.0% 26.4% 40.3% 0.7% 17.4%Dow Chemical Company Shareholder Right to Act by Written Consent Not named 38.3% 60.6% 1.1% 29.5% 46.7% 0.8% 10.7%Eastman Chemical Co. Shareholder Right to Act by Written Consent Individual- Chevedden, R. 51.1% 47.8% 1.1% 40.9% 38.2% 0.8% 6.7%Express Scripts Holding Company Shareholder Right to Act by Written Consent Not named 54.7% 44.5% 0.8% 40.6% 33.0% 0.6% 10.2%General Electric Company Shareholder Right to Act by Written Consent Individual- Steiner, K. 46.9% 51.7% 1.4% 27.7% 30.5% 0.8% 19.9%Gilead Sciences, Inc. Shareholder Right to Act by Written Consent Individual- Chevedden, J. 52.2% 47.3% 0.5% 40.9% 37.0% 0.4% 6.2%Home Depot Inc. Shareholder Right to Act by Written Consent Individual- Chevedden, J. 25.8% 73.8% 0.4% 18.6% 53.2% 0.3% 14.6%International Paper Company Shareholder Right to Act by Written Consent Individual- Steiner, K. 51.3% 48.3% 0.4% 40.3% 37.9% 0.3% 11.2%JPMorgan Chase & Co. Shareholder Right to Act by Written Consent Individual- Chevedden, J. 52.3% 46.9% 0.8% 38.1% 34.1% 0.6% 10.4%McGraw-Hill Companies, Inc. Shareholder Right to Act by Written Consent Individual- Steiner, K. 47.1% 52.6% 0.3% 39.1% 43.6% 0.3% 5.3%Merck & Co., Inc. Shareholder Right to Act by Written Consent Individual- Steiner, W. 45.2% 54.2% 0.6% 32.8% 39.3% 0.4% 12.1%Oshkosh Corporation Shareholder Right to Act by Written Consent Not named 49.1% 50.3% 0.6% 42.9% 44.0% 0.5% 0.0%Pfizer Inc. Shareholder Right to Act by Written Consent Individual- Steiner, W. 49.5% 49.5% 1.0% 34.8% 34.8% 0.7% 12.5%priceline.com Incorporated Shareholder Right to Act by Written Consent Individual- Chevedden, J. 46.0% 53.8% 0.2% 38.0% 44.5% 0.1% 4.3%Raytheon Company Shareholder Right to Act by Written Consent Individual- Chevedden, R. 43.0% 56.1% 0.9% 34.3% 44.8% 0.7% 9.4%SAIC, Inc. Shareholder Right to Act by Written Consent Individual- Steiner, K. 45.8% 51.1% 3.1% 32.3% 36.1% 2.2% 8.0%Time Warner Inc. Shareholder Right to Act by Written Consent Individual- Steiner, K. 46.3% 53.4% 0.3% 36.5% 42.2% 0.2% 7.9%Verizon Communications Inc. Shareholder Right to Act by Written Consent Individual- Steiner, W. 42.5% 55.8% 1.7% 26.8% 35.1% 1.0% 21.2%Allergan, Inc. Shareholder Right to Call Special Meeting Individual- Chevedden, J. 55.2% 44.6% 0.2% 46.8% 37.8% 0.1% 3.9%Celgene Corporation Shareholder Right to Call Special Meeting Individual- Chevedden, J. 59.8% 40.0% 0.2% 43.0% 28.8% 0.2% 11.4%Chevron Corporation Shareholder Right to Call Special Meeting Not named 30.5% 68.7% 0.8% 21.7% 48.9% 0.6% 14.2%Ford Motor Company Shareholder Right to Call Special Meeting Individual- Chevedden, J. 19.7% 79.9% 0.4% 14.1% 57.1% 0.3% 19.8%Home Depot Inc. Shareholder Right to Call Special Meeting Individual- Steiner, K. 41.4% 58.3% 0.3% 29.9% 42.1% 0.2% 14.6%Limited Brands, Inc. Shareholder Right to Call Special Meeting Individual- Chevedden, J. 33.6% 66.3% 0.1% 28.7% 56.7% 0.1% 6.3%Liz Claiborne, Inc. Shareholder Right to Call Special Meeting Not named 46.8% 51.6% 1.6% 38.2% 42.1% 1.3% 10.5%

> 30
FIGURE 15> Voting Results Sorted by Proposal – 2012
As Percentage of Votes Cast
As Percentage of Shares Outstanding
Company Proposal Sponsor For Against Abstain For Against Abstain Non-Vote
Merck & Co., Inc. Shareholder Right to Call Special Meeting Individual- Steiner, K. 34.0% 65.6% 0.4% 24.6% 47.6% 0.4% 12.1%NASDAQ OMX Group, Inc. Shareholder Right to Call Special Meeting Individual- Steiner, K. 49.0% 48.6% 2.4% 31.5% 31.2% 1.6% 5.0%Netflix, Inc. Shareholder Right to Call Special Meeting Individual- Chevedden, J. 53.3% 46.4% 0.3% 34.5% 30.0% 0.2% 18.3%NYSE Euronext Shareholder Right to Call Special Meeting Individual- Steiner, K. 59.2% 39.5% 1.3% 40.0% 26.7% 0.9% 16.3%Pfizer Inc. Shareholder Right to Call Special Meeting Individual- Steiner, K. 39.2% 60.0% 0.8% 27.6% 42.2% 0.5% 12.5%Verizon Communications Inc. Shareholder Right to Call Special Meeting Individual- Steiner, K. 46.2% 52.6% 1.2% 29.1% 33.1% 0.8% 21.2%Waste Management, Inc. Shareholder Right to Call Special Meeting Individual- Steiner, W. 4.5% 95.3% 0.2% 3.3% 70.9% 0.2% 14.8%Advance Auto Parts Inc. Supermajority Provision- Eliminate or Reduce Individual- Chevedden, J. 68.6% 31.3% 0.1% 58.5% 26.7% 0.1% 5.9%Amphenol Corporation Supermajority Provision- Eliminate or Reduce Not named 60.7% 38.6% 0.7% 54.9% 34.8% 0.7% 2.5%Baxter International Inc. Supermajority Provision- Eliminate or Reduce Individual- Chevedden, J. 98.4% 1.5% 0.1% 76.3% 1.2% 0.1% 7.9%Boston Private Financial Holdings Inc. Supermajority Provision- Eliminate or Reduce Individual- Armstrong, G. 72.3% 27.6% 0.1% 58.7% 22.5% 0.1% 0.0%Chesapeake Energy Corporation Supermajority Provision- Eliminate or Reduce CalPERS 86.2% 12.9% 0.9% 56.9% 8.5% 0.6% 19.6%Edwards Lifesciences Corporation Supermajority Provision- Eliminate or Reduce Individual- Chevedden, J. 82.4% 17.4% 0.2% 66.0% 14.0% 0.2% 6.6%FirstEnergy Corp. Supermajority Provision- Eliminate or Reduce Individual- Chevedden, R. 67.5% 31.3% 1.2% 52.8% 24.5% 0.9% 11.0%Kansas City Southern Supermajority Provision- Eliminate or Reduce Individual- McRitchie, J. 69.9% 29.8% 0.3% 58.9% 25.1% 0.3% 7.8%Kellogg Company Supermajority Provision- Eliminate or Reduce Individual- McRitchie, J. 41.9% 57.9% 0.2% 32.9% 45.4% 0.2% 8.7%NASDAQ OMX Group, Inc. Supermajority Provision- Eliminate or Reduce Individual- Steiner, W. 68.0% 31.9% 0.1% 43.7% 20.5% 0.0% 5.0%OGE Energy Corp. Supermajority Provision- Eliminate or Reduce Individual- Chevedden, J. 64.3% 34.4% 1.3% 44.4% 23.8% 0.9% 17.1%Paccar Inc Supermajority Provision- Eliminate or Reduce Individual- Chevedden, J. 44.1% 55.5% 0.4% 38.0% 47.8% 0.3% 0.0%Vulcan Materials Company Supermajority Provision- Eliminate or Reduce Individual- Armstrong, G. 66.9% 32.3% 0.8% 56.1% 27.1% 0.7% 0.0%Waste Connections Inc. Supermajority Provision- Eliminate or Reduce Individual- McRitchie, J. 71.3% 28.7% 0.0% 63.9% 25.7% 0.0% 4.4%
+ Have implemented a form of majority voting- Have not implemented a form of majority voting
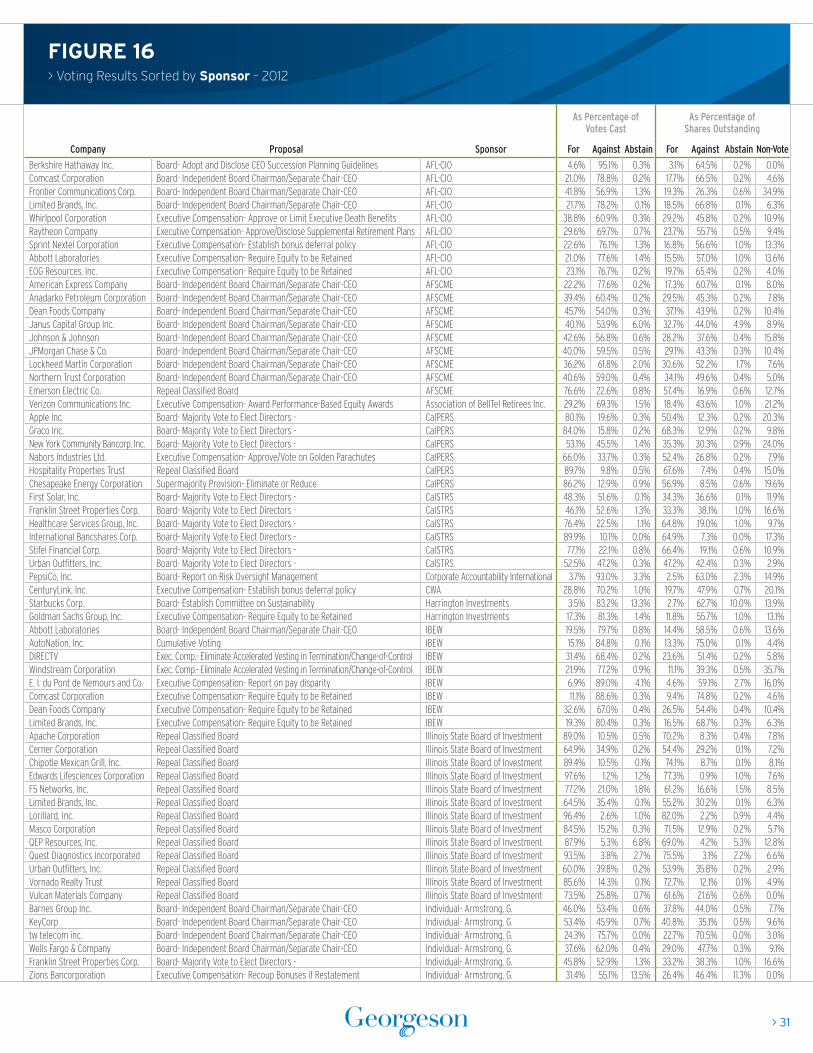
> 31
FIGURE 16> Voting Results Sorted by Sponsor – 2012
As Percentage of Votes Cast
As Percentage of Shares Outstanding
Company Proposal Sponsor For Against Abstain For Against Abstain Non-Vote
Berkshire Hathaway Inc. Board- Adopt and Disclose CEO Succession Planning Guidelines AFL-CIO 4.6% 95.1% 0.3% 3.1% 64.5% 0.2% 0.0%Comcast Corporation Board- Independent Board Chairman/Separate Chair-CEO AFL-CIO 21.0% 78.8% 0.2% 17.7% 66.5% 0.2% 4.6%Frontier Communications Corp. Board- Independent Board Chairman/Separate Chair-CEO AFL-CIO 41.8% 56.9% 1.3% 19.3% 26.3% 0.6% 34.9%Limited Brands, Inc. Board- Independent Board Chairman/Separate Chair-CEO AFL-CIO 21.7% 78.2% 0.1% 18.5% 66.8% 0.1% 6.3%Whirlpool Corporation Executive Compensation- Approve or Limit Executive Death Benefits AFL-CIO 38.8% 60.9% 0.3% 29.2% 45.8% 0.2% 10.9%Raytheon Company Executive Compensation- Approve/Disclose Supplemental Retirement Plans AFL-CIO 29.6% 69.7% 0.7% 23.7% 55.7% 0.5% 9.4%Sprint Nextel Corporation Executive Compensation- Establish bonus deferral policy AFL-CIO 22.6% 76.1% 1.3% 16.8% 56.6% 1.0% 13.3%Abbott Laboratories Executive Compensation- Require Equity to be Retained AFL-CIO 21.0% 77.6% 1.4% 15.5% 57.0% 1.0% 13.6%EOG Resources, Inc. Executive Compensation- Require Equity to be Retained AFL-CIO 23.1% 76.7% 0.2% 19.7% 65.4% 0.2% 4.0%American Express Company Board- Independent Board Chairman/Separate Chair-CEO AFSCME 22.2% 77.6% 0.2% 17.3% 60.7% 0.1% 8.0%Anadarko Petroleum Corporation Board- Independent Board Chairman/Separate Chair-CEO AFSCME 39.4% 60.4% 0.2% 29.5% 45.3% 0.2% 7.8%Dean Foods Company Board- Independent Board Chairman/Separate Chair-CEO AFSCME 45.7% 54.0% 0.3% 37.1% 43.9% 0.2% 10.4%Janus Capital Group Inc. Board- Independent Board Chairman/Separate Chair-CEO AFSCME 40.1% 53.9% 6.0% 32.7% 44.0% 4.9% 8.9%Johnson & Johnson Board- Independent Board Chairman/Separate Chair-CEO AFSCME 42.6% 56.8% 0.6% 28.2% 37.6% 0.4% 15.8%JPMorgan Chase & Co. Board- Independent Board Chairman/Separate Chair-CEO AFSCME 40.0% 59.5% 0.5% 29.1% 43.3% 0.3% 10.4%Lockheed Martin Corporation Board- Independent Board Chairman/Separate Chair-CEO AFSCME 36.2% 61.8% 2.0% 30.6% 52.2% 1.7% 7.6%Northern Trust Corporation Board- Independent Board Chairman/Separate Chair-CEO AFSCME 40.6% 59.0% 0.4% 34.1% 49.6% 0.4% 5.0%Emerson Electric Co. Repeal Classified Board AFSCME 76.6% 22.6% 0.8% 57.4% 16.9% 0.6% 12.7%Verizon Communications Inc. Executive Compensation- Award Performance-Based Equity Awards Association of BellTel Retirees Inc. 29.2% 69.3% 1.5% 18.4% 43.6% 1.0% 21.2%Apple Inc. Board- Majority Vote to Elect Directors - CalPERS 80.1% 19.6% 0.3% 50.4% 12.3% 0.2% 20.3%Graco Inc. Board- Majority Vote to Elect Directors - CalPERS 84.0% 15.8% 0.2% 68.3% 12.9% 0.2% 9.8%New York Community Bancorp, Inc. Board- Majority Vote to Elect Directors - CalPERS 53.1% 45.5% 1.4% 35.3% 30.3% 0.9% 24.0%Nabors Industries Ltd. Executive Compensation- Approve/Vote on Golden Parachutes CalPERS 66.0% 33.7% 0.3% 52.4% 26.8% 0.2% 7.9%Hospitality Properties Trust Repeal Classified Board CalPERS 89.7% 9.8% 0.5% 67.6% 7.4% 0.4% 15.0%Chesapeake Energy Corporation Supermajority Provision- Eliminate or Reduce CalPERS 86.2% 12.9% 0.9% 56.9% 8.5% 0.6% 19.6%First Solar, Inc. Board- Majority Vote to Elect Directors - CalSTRS 48.3% 51.6% 0.1% 34.3% 36.6% 0.1% 11.9%Franklin Street Properties Corp. Board- Majority Vote to Elect Directors - CalSTRS 46.1% 52.6% 1.3% 33.3% 38.1% 1.0% 16.6%Healthcare Services Group, Inc. Board- Majority Vote to Elect Directors - CalSTRS 76.4% 22.5% 1.1% 64.8% 19.0% 1.0% 9.7%International Bancshares Corp. Board- Majority Vote to Elect Directors - CalSTRS 89.9% 10.1% 0.0% 64.9% 7.3% 0.0% 17.3%Stifel Financial Corp. Board- Majority Vote to Elect Directors - CalSTRS 77.1% 22.1% 0.8% 66.4% 19.1% 0.6% 10.9%Urban Outfitters, Inc. Board- Majority Vote to Elect Directors - CalSTRS 52.5% 47.2% 0.3% 47.2% 42.4% 0.3% 2.9%PepsiCo, Inc. Board- Report on Risk Oversight Management Corporate Accountability International 3.7% 93.0% 3.3% 2.5% 63.0% 2.3% 14.9%CenturyLink, Inc. Executive Compensation- Establish bonus deferral policy CWA 28.8% 70.2% 1.0% 19.7% 47.9% 0.7% 20.1%Starbucks Corp. Board- Establish Committee on Sustainability Harrington Investments 3.5% 83.2% 13.3% 2.7% 62.7% 10.0% 13.9%Goldman Sachs Group, Inc. Executive Compensation- Require Equity to be Retained Harrington Investments 17.3% 81.3% 1.4% 11.8% 55.7% 1.0% 13.1%Abbott Laboratories Board- Independent Board Chairman/Separate Chair-CEO IBEW 19.5% 79.7% 0.8% 14.4% 58.5% 0.6% 13.6%AutoNation, Inc. Cumulative Voting IBEW 15.1% 84.8% 0.1% 13.3% 75.0% 0.1% 4.4%DIRECTV Exec. Comp.- Eliminate Accelerated Vesting in Termination/Change-of-Control IBEW 31.4% 68.4% 0.2% 23.6% 51.4% 0.2% 5.8%Windstream Corporation Exec. Comp.- Eliminate Accelerated Vesting in Termination/Change-of-Control IBEW 21.9% 77.2% 0.9% 11.1% 39.3% 0.5% 35.7%E. I. du Pont de Nemours and Co. Executive Compensation- Report on pay disparity IBEW 6.9% 89.0% 4.1% 4.6% 59.1% 2.7% 16.0%Comcast Corporation Executive Compensation- Require Equity to be Retained IBEW 11.1% 88.6% 0.3% 9.4% 74.8% 0.2% 4.6%Dean Foods Company Executive Compensation- Require Equity to be Retained IBEW 32.6% 67.0% 0.4% 26.5% 54.4% 0.4% 10.4%Limited Brands, Inc. Executive Compensation- Require Equity to be Retained IBEW 19.3% 80.4% 0.3% 16.5% 68.7% 0.3% 6.3%Apache Corporation Repeal Classified Board Illinois State Board of Investment 89.0% 10.5% 0.5% 70.2% 8.3% 0.4% 7.8%Cerner Corporation Repeal Classified Board Illinois State Board of Investment 64.9% 34.9% 0.2% 54.4% 29.2% 0.1% 7.2%Chipotle Mexican Grill, Inc. Repeal Classified Board Illinois State Board of Investment 89.4% 10.5% 0.1% 74.1% 8.7% 0.1% 8.1%Edwards Lifesciences Corporation Repeal Classified Board Illinois State Board of Investment 97.6% 1.2% 1.2% 77.3% 0.9% 1.0% 7.6%F5 Networks, Inc. Repeal Classified Board Illinois State Board of Investment 77.2% 21.0% 1.8% 61.2% 16.6% 1.5% 8.5%Limited Brands, Inc. Repeal Classified Board Illinois State Board of Investment 64.5% 35.4% 0.1% 55.2% 30.2% 0.1% 6.3%Lorillard, Inc. Repeal Classified Board Illinois State Board of Investment 96.4% 2.6% 1.0% 82.0% 2.2% 0.9% 4.4%Masco Corporation Repeal Classified Board Illinois State Board of Investment 84.5% 15.2% 0.3% 71.5% 12.9% 0.2% 5.7%QEP Resources, Inc. Repeal Classified Board Illinois State Board of Investment 87.9% 5.3% 6.8% 69.0% 4.2% 5.3% 12.8%Quest Diagnostics Incorporated Repeal Classified Board Illinois State Board of Investment 93.5% 3.8% 2.7% 75.5% 3.1% 2.2% 6.6%Urban Outfitters, Inc. Repeal Classified Board Illinois State Board of Investment 60.0% 39.8% 0.2% 53.9% 35.8% 0.2% 2.9%Vornado Realty Trust Repeal Classified Board Illinois State Board of Investment 85.6% 14.3% 0.1% 72.7% 12.1% 0.1% 4.9%Vulcan Materials Company Repeal Classified Board Illinois State Board of Investment 73.5% 25.8% 0.7% 61.6% 21.6% 0.6% 0.0%Barnes Group Inc. Board- Independent Board Chairman/Separate Chair-CEO Individual- Armstrong, G. 46.0% 53.4% 0.6% 37.8% 44.0% 0.5% 7.7%KeyCorp Board- Independent Board Chairman/Separate Chair-CEO Individual- Armstrong, G. 53.4% 45.9% 0.7% 40.8% 35.1% 0.5% 9.6%tw telecom inc. Board- Independent Board Chairman/Separate Chair-CEO Individual- Armstrong, G. 24.3% 75.7% 0.0% 22.7% 70.5% 0.0% 3.0%Wells Fargo & Company Board- Independent Board Chairman/Separate Chair-CEO Individual- Armstrong, G. 37.6% 62.0% 0.4% 29.0% 47.7% 0.3% 9.1%Franklin Street Properties Corp. Board- Majority Vote to Elect Directors - Individual- Armstrong, G. 45.8% 52.9% 1.3% 33.2% 38.3% 1.0% 16.6%Zions Bancorporation Executive Compensation- Recoup Bonuses if Restatement Individual- Armstrong, G. 31.4% 55.1% 13.5% 26.4% 46.4% 11.3% 0.0%
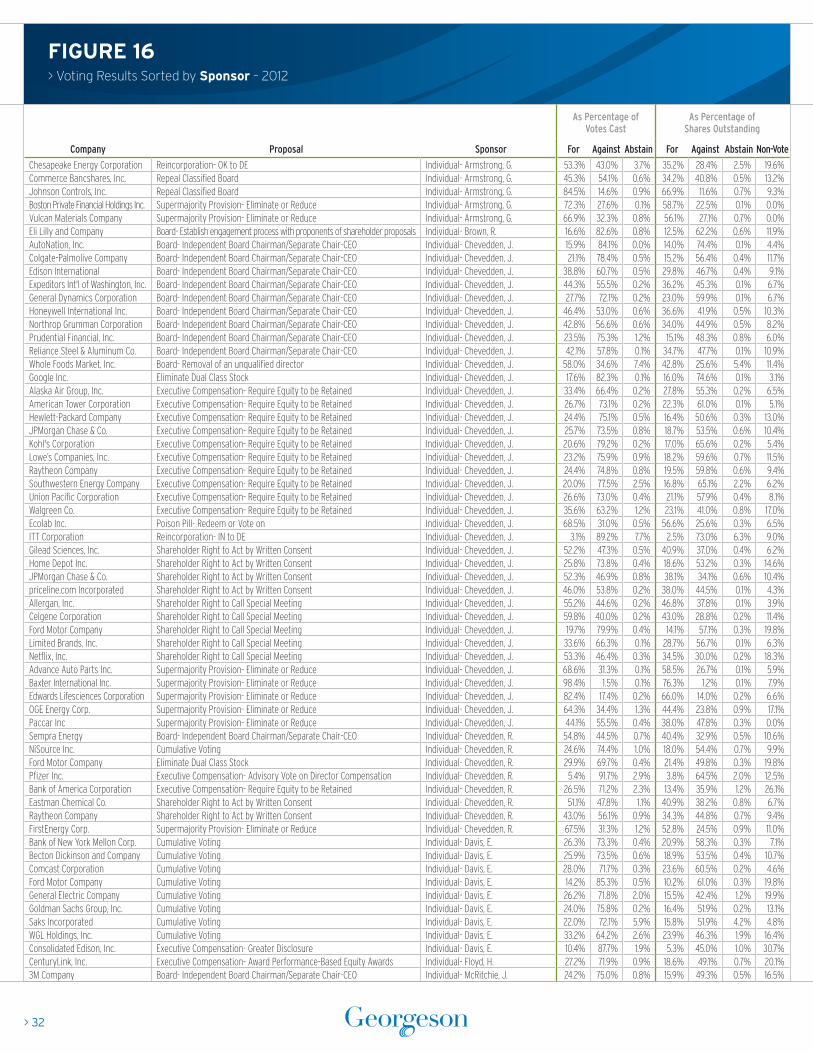
> 32
FIGURE 16> Voting Results Sorted by Sponsor – 2012
As Percentage of Votes Cast
As Percentage of Shares Outstanding
Company Proposal Sponsor For Against Abstain For Against Abstain Non-Vote
Chesapeake Energy Corporation Reincorporation- OK to DE Individual- Armstrong, G. 53.3% 43.0% 3.7% 35.2% 28.4% 2.5% 19.6%Commerce Bancshares, Inc. Repeal Classified Board Individual- Armstrong, G. 45.3% 54.1% 0.6% 34.2% 40.8% 0.5% 13.2%Johnson Controls, Inc. Repeal Classified Board Individual- Armstrong, G. 84.5% 14.6% 0.9% 66.9% 11.6% 0.7% 9.3%Boston Private Financial Holdings Inc. Supermajority Provision- Eliminate or Reduce Individual- Armstrong, G. 72.3% 27.6% 0.1% 58.7% 22.5% 0.1% 0.0%Vulcan Materials Company Supermajority Provision- Eliminate or Reduce Individual- Armstrong, G. 66.9% 32.3% 0.8% 56.1% 27.1% 0.7% 0.0%Eli Lilly and Company Board- Establish engagement process with proponents of shareholder proposals Individual- Brown, R. 16.6% 82.6% 0.8% 12.5% 62.2% 0.6% 11.9%AutoNation, Inc. Board- Independent Board Chairman/Separate Chair-CEO Individual- Chevedden, J. 15.9% 84.1% 0.0% 14.0% 74.4% 0.1% 4.4%Colgate-Palmolive Company Board- Independent Board Chairman/Separate Chair-CEO Individual- Chevedden, J. 21.1% 78.4% 0.5% 15.2% 56.4% 0.4% 11.7%Edison International Board- Independent Board Chairman/Separate Chair-CEO Individual- Chevedden, J. 38.8% 60.7% 0.5% 29.8% 46.7% 0.4% 9.1%Expeditors Int'l of Washington, Inc. Board- Independent Board Chairman/Separate Chair-CEO Individual- Chevedden, J. 44.3% 55.5% 0.2% 36.2% 45.3% 0.1% 6.7%General Dynamics Corporation Board- Independent Board Chairman/Separate Chair-CEO Individual- Chevedden, J. 27.7% 72.1% 0.2% 23.0% 59.9% 0.1% 6.7%Honeywell International Inc. Board- Independent Board Chairman/Separate Chair-CEO Individual- Chevedden, J. 46.4% 53.0% 0.6% 36.6% 41.9% 0.5% 10.3%Northrop Grumman Corporation Board- Independent Board Chairman/Separate Chair-CEO Individual- Chevedden, J. 42.8% 56.6% 0.6% 34.0% 44.9% 0.5% 8.2%Prudential Financial, Inc. Board- Independent Board Chairman/Separate Chair-CEO Individual- Chevedden, J. 23.5% 75.3% 1.2% 15.1% 48.3% 0.8% 6.0%Reliance Steel & Aluminum Co. Board- Independent Board Chairman/Separate Chair-CEO Individual- Chevedden, J. 42.1% 57.8% 0.1% 34.7% 47.7% 0.1% 10.9%Whole Foods Market, Inc. Board- Removal of an unqualified director Individual- Chevedden, J. 58.0% 34.6% 7.4% 42.8% 25.6% 5.4% 11.4%Google Inc. Eliminate Dual Class Stock Individual- Chevedden, J. 17.6% 82.3% 0.1% 16.0% 74.6% 0.1% 3.1%Alaska Air Group, Inc. Executive Compensation- Require Equity to be Retained Individual- Chevedden, J. 33.4% 66.4% 0.2% 27.8% 55.3% 0.2% 6.5%American Tower Corporation Executive Compensation- Require Equity to be Retained Individual- Chevedden, J. 26.7% 73.1% 0.2% 22.3% 61.0% 0.1% 5.1%Hewlett-Packard Company Executive Compensation- Require Equity to be Retained Individual- Chevedden, J. 24.4% 75.1% 0.5% 16.4% 50.6% 0.3% 13.0%JPMorgan Chase & Co. Executive Compensation- Require Equity to be Retained Individual- Chevedden, J. 25.7% 73.5% 0.8% 18.7% 53.5% 0.6% 10.4%Kohl's Corporation Executive Compensation- Require Equity to be Retained Individual- Chevedden, J. 20.6% 79.2% 0.2% 17.0% 65.6% 0.2% 5.4%Lowe’s Companies, Inc. Executive Compensation- Require Equity to be Retained Individual- Chevedden, J. 23.2% 75.9% 0.9% 18.2% 59.6% 0.7% 11.5%Raytheon Company Executive Compensation- Require Equity to be Retained Individual- Chevedden, J. 24.4% 74.8% 0.8% 19.5% 59.8% 0.6% 9.4%Southwestern Energy Company Executive Compensation- Require Equity to be Retained Individual- Chevedden, J. 20.0% 77.5% 2.5% 16.8% 65.1% 2.2% 6.2%Union Pacific Corporation Executive Compensation- Require Equity to be Retained Individual- Chevedden, J. 26.6% 73.0% 0.4% 21.1% 57.9% 0.4% 8.1%Walgreen Co. Executive Compensation- Require Equity to be Retained Individual- Chevedden, J. 35.6% 63.2% 1.2% 23.1% 41.0% 0.8% 17.0%Ecolab Inc. Poison Pill- Redeem or Vote on Individual- Chevedden, J. 68.5% 31.0% 0.5% 56.6% 25.6% 0.3% 6.5%ITT Corporation Reincorporation- IN to DE Individual- Chevedden, J. 3.1% 89.2% 7.7% 2.5% 73.0% 6.3% 9.0%Gilead Sciences, Inc. Shareholder Right to Act by Written Consent Individual- Chevedden, J. 52.2% 47.3% 0.5% 40.9% 37.0% 0.4% 6.2%Home Depot Inc. Shareholder Right to Act by Written Consent Individual- Chevedden, J. 25.8% 73.8% 0.4% 18.6% 53.2% 0.3% 14.6%JPMorgan Chase & Co. Shareholder Right to Act by Written Consent Individual- Chevedden, J. 52.3% 46.9% 0.8% 38.1% 34.1% 0.6% 10.4%priceline.com Incorporated Shareholder Right to Act by Written Consent Individual- Chevedden, J. 46.0% 53.8% 0.2% 38.0% 44.5% 0.1% 4.3%Allergan, Inc. Shareholder Right to Call Special Meeting Individual- Chevedden, J. 55.2% 44.6% 0.2% 46.8% 37.8% 0.1% 3.9%Celgene Corporation Shareholder Right to Call Special Meeting Individual- Chevedden, J. 59.8% 40.0% 0.2% 43.0% 28.8% 0.2% 11.4%Ford Motor Company Shareholder Right to Call Special Meeting Individual- Chevedden, J. 19.7% 79.9% 0.4% 14.1% 57.1% 0.3% 19.8%Limited Brands, Inc. Shareholder Right to Call Special Meeting Individual- Chevedden, J. 33.6% 66.3% 0.1% 28.7% 56.7% 0.1% 6.3%Netflix, Inc. Shareholder Right to Call Special Meeting Individual- Chevedden, J. 53.3% 46.4% 0.3% 34.5% 30.0% 0.2% 18.3%Advance Auto Parts Inc. Supermajority Provision- Eliminate or Reduce Individual- Chevedden, J. 68.6% 31.3% 0.1% 58.5% 26.7% 0.1% 5.9%Baxter International Inc. Supermajority Provision- Eliminate or Reduce Individual- Chevedden, J. 98.4% 1.5% 0.1% 76.3% 1.2% 0.1% 7.9%Edwards Lifesciences Corporation Supermajority Provision- Eliminate or Reduce Individual- Chevedden, J. 82.4% 17.4% 0.2% 66.0% 14.0% 0.2% 6.6%OGE Energy Corp. Supermajority Provision- Eliminate or Reduce Individual- Chevedden, J. 64.3% 34.4% 1.3% 44.4% 23.8% 0.9% 17.1%Paccar Inc Supermajority Provision- Eliminate or Reduce Individual- Chevedden, J. 44.1% 55.5% 0.4% 38.0% 47.8% 0.3% 0.0%Sempra Energy Board- Independent Board Chairman/Separate Chair-CEO Individual- Chevedden, R. 54.8% 44.5% 0.7% 40.4% 32.9% 0.5% 10.6%NiSource Inc. Cumulative Voting Individual- Chevedden, R. 24.6% 74.4% 1.0% 18.0% 54.4% 0.7% 9.9%Ford Motor Company Eliminate Dual Class Stock Individual- Chevedden, R. 29.9% 69.7% 0.4% 21.4% 49.8% 0.3% 19.8%Pfizer Inc. Executive Compensation- Advisory Vote on Director Compensation Individual- Chevedden, R. 5.4% 91.7% 2.9% 3.8% 64.5% 2.0% 12.5%Bank of America Corporation Executive Compensation- Require Equity to be Retained Individual- Chevedden, R. 26.5% 71.2% 2.3% 13.4% 35.9% 1.2% 26.1%Eastman Chemical Co. Shareholder Right to Act by Written Consent Individual- Chevedden, R. 51.1% 47.8% 1.1% 40.9% 38.2% 0.8% 6.7%Raytheon Company Shareholder Right to Act by Written Consent Individual- Chevedden, R. 43.0% 56.1% 0.9% 34.3% 44.8% 0.7% 9.4%FirstEnergy Corp. Supermajority Provision- Eliminate or Reduce Individual- Chevedden, R. 67.5% 31.3% 1.2% 52.8% 24.5% 0.9% 11.0%Bank of New York Mellon Corp. Cumulative Voting Individual- Davis, E. 26.3% 73.3% 0.4% 20.9% 58.3% 0.3% 7.1%Becton Dickinson and Company Cumulative Voting Individual- Davis, E. 25.9% 73.5% 0.6% 18.9% 53.5% 0.4% 10.7%Comcast Corporation Cumulative Voting Individual- Davis, E. 28.0% 71.7% 0.3% 23.6% 60.5% 0.2% 4.6%Ford Motor Company Cumulative Voting Individual- Davis, E. 14.2% 85.3% 0.5% 10.2% 61.0% 0.3% 19.8%General Electric Company Cumulative Voting Individual- Davis, E. 26.2% 71.8% 2.0% 15.5% 42.4% 1.2% 19.9%Goldman Sachs Group, Inc. Cumulative Voting Individual- Davis, E. 24.0% 75.8% 0.2% 16.4% 51.9% 0.2% 13.1%Saks Incorporated Cumulative Voting Individual- Davis, E. 22.0% 72.1% 5.9% 15.8% 51.9% 4.2% 4.8%WGL Holdings, Inc. Cumulative Voting Individual- Davis, E. 33.2% 64.2% 2.6% 23.9% 46.3% 1.9% 16.4%Consolidated Edison, Inc. Executive Compensation- Greater Disclosure Individual- Davis, E. 10.4% 87.7% 1.9% 5.3% 45.0% 1.0% 30.7%CenturyLink, Inc. Executive Compensation- Award Performance-Based Equity Awards Individual- Floyd, H. 27.2% 71.9% 0.9% 18.6% 49.1% 0.7% 20.1%3M Company Board- Independent Board Chairman/Separate Chair-CEO Individual- McRitchie, J. 24.2% 75.0% 0.8% 15.9% 49.3% 0.5% 16.5%

> 33
FIGURE 16> Voting Results Sorted by Sponsor – 2012
As Percentage of Votes Cast
As Percentage of Shares Outstanding
Company Proposal Sponsor For Against Abstain For Against Abstain Non-Vote
Whole Foods Market, Inc. Board- Independent Board Chairman/Separate Chair-CEO Individual- McRitchie, J. 37.4% 62.4% 0.2% 27.6% 46.1% 0.1% 11.4%Apple Inc. Executive Compensation- Advisory Vote on Director Compensation Individual- McRitchie, J. 3.3% 87.7% 9.0% 2.1% 55.2% 5.7% 20.3%DaVita Inc. Executive Compensation- Require Equity to be Retained Individual- McRitchie, J. 34.9% 64.9% 0.2% 29.4% 54.6% 0.1% 4.8%Gilead Sciences, Inc. Poison Pill- Redeem or Vote on Individual- McRitchie, J. 79.1% 20.5% 0.4% 62.0% 16.1% 0.3% 6.2%Kansas City Southern Supermajority Provision- Eliminate or Reduce Individual- McRitchie, J. 69.9% 29.8% 0.3% 58.9% 25.1% 0.3% 7.8%Kellogg Company Supermajority Provision- Eliminate or Reduce Individual- McRitchie, J. 41.9% 57.9% 0.2% 32.9% 45.4% 0.2% 8.7%Waste Connections Inc. Supermajority Provision- Eliminate or Reduce Individual- McRitchie, J. 71.3% 28.7% 0.0% 63.9% 25.7% 0.0% 4.4%Google Inc. Arbitration provision for shareholder lawsuits or claims Individual- Shaevsky, M. 0.4% 99.5% 0.1% 0.3% 90.3% 0.1% 3.1%PepsiCo, Inc. Board- Independent Board Chairman/Separate Chair-CEO Individual- Steiner, K. 44.3% 54.9% 0.8% 30.0% 37.2% 0.6% 14.9%Sterling Bancorp Board- Independent Board Chairman/Separate Chair-CEO Individual- Steiner, K. 48.1% 51.4% 0.5% 42.6% 45.5% 0.4% 6.9%Telephone & Data Systems, Inc. Eliminate Dual Class Stock Individual- Steiner, K. 31.9% 67.9% 0.2% 30.2% 64.3% 0.2% 2.6%Citigroup Inc. Executive Compensation- Require Equity to be Retained Individual- Steiner, K. 26.2% 73.4% 0.4% 15.6% 43.8% 0.2% 16.2%Interpublic Group of Companies, Inc. Executive Compensation- Require Equity to be Retained Individual- Steiner, K. 21.5% 78.0% 0.5% 17.4% 63.2% 0.4% 4.7%Motorola Solutions, Inc. Executive Compensation- Require Equity to be Retained Individual- Steiner, K. 24.0% 75.8% 0.2% 18.8% 59.4% 0.2% 8.6%Waste Management, Inc. Executive Compensation- Require Equity to be Retained Individual- Steiner, K. 23.6% 76.2% 0.2% 17.5% 56.7% 0.2% 14.8%Comcast Corporation Poison Pill- Redeem or Vote on Individual- Steiner, K. 52.0% 47.8% 0.2% 43.9% 40.3% 0.2% 4.6%Bristol-Myers Squibb Company Shareholder Right to Act by Written Consent Individual- Steiner, K. 38.1% 61.1% 0.8% 25.6% 41.0% 0.6% 18.2%General Electric Company Shareholder Right to Act by Written Consent Individual- Steiner, K. 46.9% 51.7% 1.4% 27.7% 30.5% 0.8% 19.9%International Paper Company Shareholder Right to Act by Written Consent Individual- Steiner, K. 51.3% 48.3% 0.4% 40.3% 37.9% 0.3% 11.2%McGraw-Hill Companies, Inc. Shareholder Right to Act by Written Consent Individual- Steiner, K. 47.1% 52.6% 0.3% 39.1% 43.6% 0.3% 5.3%SAIC, Inc. Shareholder Right to Act by Written Consent Individual- Steiner, K. 45.8% 51.1% 3.1% 32.3% 36.1% 2.2% 8.0%Time Warner Inc. Shareholder Right to Act by Written Consent Individual- Steiner, K. 46.3% 53.4% 0.3% 36.5% 42.2% 0.2% 7.9%Home Depot Inc. Shareholder Right to Call Special Meeting Individual- Steiner, K. 41.4% 58.3% 0.3% 29.9% 42.1% 0.2% 14.6%Merck & Co., Inc. Shareholder Right to Call Special Meeting Individual- Steiner, K. 34.0% 65.6% 0.4% 24.6% 47.6% 0.4% 12.1%NASDAQ OMX Group, Inc. Shareholder Right to Call Special Meeting Individual- Steiner, K. 49.0% 48.6% 2.4% 31.5% 31.2% 1.6% 5.0%NYSE Euronext Shareholder Right to Call Special Meeting Individual- Steiner, K. 59.2% 39.5% 1.3% 40.0% 26.7% 0.9% 16.3%Pfizer Inc. Shareholder Right to Call Special Meeting Individual- Steiner, K. 39.2% 60.0% 0.8% 27.6% 42.2% 0.5% 12.5%Verizon Communications Inc. Shareholder Right to Call Special Meeting Individual- Steiner, K. 46.2% 52.6% 1.2% 29.1% 33.1% 0.8% 21.2%E. I. du Pont de Nemours and Co. Board- Independent Board Chairman/Separate Chair-CEO Individual- Steiner, W. 42.7% 56.8% 0.5% 28.3% 37.7% 0.4% 16.0%General Electric Company Board- Independent Board Chairman/Separate Chair-CEO Individual- Steiner, W. 21.7% 75.0% 3.3% 12.8% 44.2% 2.0% 19.9%ITT Corporation Board- Independent Board Chairman/Separate Chair-CEO Individual- Steiner, W. 43.5% 56.3% 0.2% 35.6% 46.1% 0.2% 9.0%Amgen Inc. Board- Limit CEO's service on outside boards Individual- Steiner, W. 3.7% 95.8% 0.5% 2.8% 73.3% 0.4% 10.7%URS Corporation Executive Compensation- Require Equity to be Retained Individual- Steiner, W. 34.9% 64.7% 0.4% 29.8% 55.2% 0.4% 5.1%Merck & Co., Inc. Shareholder Right to Act by Written Consent Individual- Steiner, W. 45.2% 54.2% 0.6% 32.8% 39.3% 0.4% 12.1%Pfizer Inc. Shareholder Right to Act by Written Consent Individual- Steiner, W. 49.5% 49.5% 1.0% 34.8% 34.8% 0.7% 12.5%Verizon Communications Inc. Shareholder Right to Act by Written Consent Individual- Steiner, W. 42.5% 55.8% 1.7% 26.8% 35.1% 1.0% 21.2%Waste Management, Inc. Shareholder Right to Call Special Meeting Individual- Steiner, W. 4.5% 95.3% 0.2% 3.3% 70.9% 0.2% 14.8%NASDAQ OMX Group, Inc. Supermajority Provision- Eliminate or Reduce Individual- Steiner, W. 68.0% 31.9% 0.1% 43.7% 20.5% 0.0% 5.0%Wal-Mart Stores, Inc. Executive Compensation- Greater Disclosure Individual- Tifft, M. 9.3% 90.5% 0.2% 7.9% 76.7% 0.2% 6.8%Frontier Communications Corp. Arbitration provision for shareholder lawsuits or claims Individual- Vuchetich, D. 8.1% 90.3% 1.6% 3.8% 41.7% 0.7% 34.9%Safeway Inc. Board- Adopt and Disclose CEO Succession Planning Guidelines Laborers 29.1% 69.6% 1.3% 23.2% 55.6% 1.0% 4.9%Sotheby's Board- Adopt and Disclose CEO Succession Planning Guidelines Laborers 36.1% 63.4% 0.5% 28.8% 50.7% 0.4% 7.5%Xcel Energy Inc. Board- Independent Board Chairman/Separate Chair-CEO Laborers 25.5% 73.4% 1.1% 17.6% 50.6% 0.7% 15.3%Sempra Energy Executive Compensation- Add Sustainability Performance Metrics Laborers 5.7% 88.6% 5.7% 4.2% 65.4% 4.2% 10.6%PulteGroup, Inc. Executive Compensation- Award Performance-Based Stock Options Laborers 36.1% 61.2% 2.7% 28.3% 48.1% 2.2% 11.8%Range Resources Corporation Exec. Comp.- Eliminate Accelerated Vesting in Termination/Change-of-Control Laborers 29.3% 68.4% 2.3% 24.7% 57.6% 1.9% 5.8%CF Industries Holdings, Inc. Repeal Classified Board LACERA 92.7% 7.2% 0.1% 74.8% 5.8% 0.1% 4.8%Cognizant Technology Solutions Corp. Repeal Classified Board LACERA 91.1% 8.7% 0.2% 75.8% 7.3% 0.1% 6.0%Dentsply International Inc. Repeal Classified Board LACERA 78.4% 21.4% 0.2% 64.6% 17.6% 0.2% 5.8%Netflix, Inc. Repeal Classified Board LACERA 74.7% 25.0% 0.3% 48.3% 16.2% 0.2% 18.3%Palomar Medical Technologies, Inc. Board- Majority Vote to Elect Directors - LongView 77.0% 22.4% 0.6% 51.9% 15.1% 0.4% 20.1%Cabot Oil & Gas Corporation Executive Compensation- Add Sustainability Performance Metrics LongView 7.1% 90.3% 2.6% 6.1% 77.4% 2.3% 4.4%Range Resources Corporation Executive Compensation- Add Sustainability Performance Metrics LongView 4.7% 92.5% 2.8% 3.9% 78.0% 2.3% 5.8%Anadarko Petroleum Corporation Exec. Comp.- Eliminate Accelerated Vesting in Termination/Change-of-Control LongView 41.1% 58.4% 0.5% 30.9% 43.8% 0.4% 7.8%EOG Resources, Inc. Exec. Comp.- Eliminate Accelerated Vesting in Termination/Change-of-Control LongView 42.5% 57.4% 0.1% 36.2% 49.1% 0.0% 4.0%Sunoco, Inc. Exec. Comp.- Eliminate Accelerated Vesting in Termination/Change-of-Control Longview 41.3% 54.0% 4.7% 28.7% 37.5% 3.3% 11.4%Chevron Corporation Repeal Exclusive Forum Bylaw LongView 38.7% 59.1% 2.2% 27.6% 42.1% 1.6% 14.2%United Rentals, Inc. Repeal Exclusive Forum Bylaw LongView 35.2% 63.6% 1.2% 27.5% 49.7% 1.0% 5.1%Wal-Mart Stores, Inc. Board- Nominate Director with Healthcare Expertise Nathan Cummings Foundation 2.0% 94.1% 3.9% 1.7% 79.8% 3.3% 6.8%Masco Corporation Executive Compensation- Require Equity to be Retained Nathan Cummings Foundation 13.3% 86.3% 0.4% 11.3% 73.0% 0.3% 5.7%Baxter International Inc. Repeal Classified Board Nathan Cummings Foundation 98.1% 1.8% 0.1% 76.0% 1.4% 0.1% 7.9%Best Buy Co., Inc. Repeal Classified Board Nathan Cummings Foundation 97.4% 1.4% 1.2% 74.6% 1.1% 0.9% 10.1%

> 34
FIGURE 16> Voting Results Sorted by Sponsor – 2012
As Percentage of Votes Cast
As Percentage of Shares Outstanding
Company Proposal Sponsor For Against Abstain For Against Abstain Non-Vote
CarMax, Inc. Repeal Classified Board Nathan Cummings Foundation 87.3% 12.5% 0.2% 72.9% 10.5% 0.2% 6.6%FLIR Systems, Inc Repeal Classified Board Nathan Cummings Foundation 81.9% 17.0% 1.1% 69.3% 14.4% 0.9% 3.9%FMC Corporation Repeal Classified Board Nathan Cummings Foundation 82.6% 17.1% 0.3% 70.1% 14.5% 0.2% 4.5%Moody's Corporation Repeal Classified Board Nathan Cummings Foundation 76.9% 22.9% 0.2% 66.2% 19.7% 0.2% 5.5%salesforce.com, inc. Repeal Classified Board Nathan Cummings Foundation 80.5% 19.2% 0.3% 69.6% 16.6% 0.2% 5.1%V.F. Corporation Repeal Classified Board Nathan Cummings Foundation 62.7% 36.7% 0.6% 53.0% 31.1% 0.4% 7.3%Apple Inc. Board- Conflict of Interest Report National Center for Public Policy Research 1.8% 94.9% 3.3% 1.2% 59.7% 2.1% 20.3%Chesapeake Energy Corporation Adopt Proxy Access New York City Pension Funds 59.9% 36.3% 3.8% 39.6% 23.9% 2.5% 19.6%Nabors Industries Ltd. Adopt Proxy Access New York City Pension Funds 56.0% 43.7% 0.3% 44.5% 34.7% 0.2% 7.9%Mylan Inc. Board- Independent Board Chairman/Separate Chair-CEO New York City Pension Funds 35.3% 64.0% 0.7% 25.7% 46.5% 0.5% 9.7%Philip Morris International Inc. Board- Independent Board Chairman/Separate Chair-CEO New York City Pension Funds 17.0% 79.1% 3.9% 12.3% 57.3% 2.8% 15.0%GEO Group, Inc. Board- Majority Vote to Elect Directors - New York City Pension Funds 64.7% 35.3% 0.0% 58.4% 31.8% 0.0% 5.1%Abbott Laboratories Executive Compensation- Compliance Disclosure New York City Pension Funds 34.1% 64.8% 1.1% 25.0% 47.6% 0.8% 13.6%Energen Corporation Repeal Classified Board New York City Pension Funds 82.6% 16.8% 0.6% 67.4% 13.7% 0.5% 8.7%Pioneer Natural Resources Company Board- Independent Board Chairman/Separate Chair-CEO New York State Pension Funds 23.8% 76.1% 0.1% 19.5% 62.6% 0.1% 6.3%Chevron Corporation Board- Nominate Director with Environmental Expertise New York State Pension Funds 21.2% 77.5% 1.3% 15.1% 55.2% 0.9% 14.2%Freeport-McMoRan Copper & Gold Inc. Board- Nominate Director with Environmental Expertise New York State Pension Funds 31.4% 68.0% 0.6% 19.8% 42.8% 0.4% 15.3%Occidental Petroleum Corporation Board- Nominate Director with Environmental Expertise New York State Pension Funds 4.1% 85.6% 10.3% 3.3% 69.3% 8.3% 5.4%ANN INC. Repeal Classified Board New York State Pension Funds 92.9% 3.0% 4.1% 83.3% 2.7% 3.7% 4.5%Healthways, Inc. Repeal Classified Board New York State Pension Funds 90.8% 9.1% 0.1% 73.5% 7.3% 0.1% 8.2%Charles Schwab Corporation Adopt Proxy Access Norges Bank Investment Management 30.9% 68.9% 0.2% 26.1% 58.1% 0.2% 8.0%CME Group Inc. Adopt Proxy Access Norges Bank Investment Management 37.8% 61.8% 0.4% 26.6% 43.5% 0.2% 12.4%Wells Fargo & Company Adopt Proxy Access Norges Bank Investment Management 32.3% 67.3% 0.4% 24.9% 51.8% 0.3% 9.1%Western Union Company Adopt Proxy Access Norges Bank Investment Management 33.4% 66.2% 0.4% 27.6% 54.7% 0.3% 5.3%Bemis Company, Inc. Repeal Classified Board North Carolina Retirement System 74.7% 24.7% 0.6% 53.8% 17.8% 0.4% 12.9%Hess Corporation Repeal Classified Board North Carolina Retirement System 77.5% 19.7% 2.8% 56.8% 14.4% 2.1% 10.0%Kellogg Company Repeal Classified Board North Carolina Retirement System 47.3% 52.4% 0.3% 37.2% 41.1% 0.2% 8.7%Lexmark International, Inc. Repeal Classified Board North Carolina Retirement System 92.8% 7.1% 0.1% 74.7% 5.7% 0.0% 5.0%MEMC Electronic Materials, Inc. Repeal Classified Board North Carolina Retirement System 95.5% 4.4% 0.1% 63.6% 2.9% 0.1% 17.3%Paccar Inc Repeal Classified Board North Carolina Retirement System 49.8% 49.9% 0.3% 42.8% 42.9% 0.3% 0.0%People's United Financial, Inc. Repeal Classified Board North Carolina Retirement System 91.4% 3.8% 4.8% 58.4% 2.4% 3.1% 19.0%Ryder System, Inc. Repeal Classified Board North Carolina Retirement System 87.7% 11.7% 0.6% 73.7% 9.8% 0.5% 5.8%SCANA Corporation Repeal Classified Board North Carolina Retirement System 60.3% 37.4% 2.3% 38.2% 23.7% 1.5% 21.4%Snap-On Inc. Repeal Classified Board North Carolina Retirement System 84.9% 11.4% 3.7% 70.7% 9.5% 3.1% 6.6%United States Steel Corporation Repeal Classified Board North Carolina Retirement System 82.5% 16.5% 1.0% 37.7% 7.6% 0.5% 24.4%AT&T Inc. Board- Independent Board Chairman/Separate Chair-CEO Not named 43.3% 55.5% 1.2% 24.9% 31.9% 0.7% 19.7%Dow Chemical Company Board- Independent Board Chairman/Separate Chair-CEO Not named 36.1% 63.1% 0.8% 27.8% 48.6% 0.6% 10.7%American Financial Group Inc. Board- Majority Vote to Elect Directors - Not named 53.9% 46.0% 0.1% 48.1% 41.0% 0.1% 4.7%Boeing Company Executive Compensation- Approve/Disclose Supplemental Retirement Plans Not named 31.5% 67.7% 0.8% 22.7% 48.8% 0.6% 14.6%Boeing Company Executive Compensation- Require Equity to be Retained Not named 23.5% 75.5% 1.0% 16.9% 54.4% 0.7% 14.6%UMB Financial Corporation Hedge/Derivative Trading Policy and Procedure Not named 35.4% 57.6% 7.0% 30.0% 48.8% 6.0% 7.1%Boeing Company Shareholder Right to Act by Written Consent Not named 35.0% 63.8% 1.2% 25.2% 45.9% 0.9% 14.6%Caterpillar Inc. Shareholder Right to Act by Written Consent Not named 39.2% 59.8% 1.0% 26.4% 40.3% 0.7% 17.4%Dow Chemical Company Shareholder Right to Act by Written Consent Not named 38.3% 60.6% 1.1% 29.5% 46.7% 0.8% 10.7%Express Scripts Holding Company Shareholder Right to Act by Written Consent Not named 54.7% 44.5% 0.8% 40.6% 33.0% 0.6% 10.2%Oshkosh Corporation Shareholder Right to Act by Written Consent Not named 49.1% 50.3% 0.6% 42.9% 44.0% 0.5% 0.0%Chevron Corporation Shareholder Right to Call Special Meeting Not named 30.5% 68.7% 0.8% 21.7% 48.9% 0.6% 14.2%Liz Claiborne, Inc. Shareholder Right to Call Special Meeting Not named 46.8% 51.6% 1.6% 38.2% 42.1% 1.3% 10.5%Amphenol Corporation Supermajority Provision- Eliminate or Reduce Not named 60.7% 38.6% 0.7% 54.9% 34.8% 0.7% 2.5%EQT Corporation Repeal Classified Board OPERS 81.0% 17.5% 1.5% 60.0% 13.0% 1.1% 12.8%Kindred Healthcare, Inc. Board- Independent Board Chairman/Separate Chair-CEO PhiPERS 52.1% 47.4% 0.5% 45.9% 41.8% 0.5% 5.2%Dean Foods Company Exec. Comp.- Eliminate Accelerated Vesting in Termination/Change-of-Control PhiPERS 42.1% 57.5% 0.4% 34.2% 46.8% 0.3% 10.4%Abbott Laboratories Executive Compensation- Establish Anti-Tax Gross-up Policy PhiPERS 37.5% 61.3% 1.2% 27.5% 45.1% 0.9% 13.6%Chevron Corporation Board- Independent Board Chairman/Separate Chair-CEO Plumbers and Pipefitters 37.9% 61.4% 0.7% 27.0% 43.7% 0.5% 14.2%PPL Corporation Board- Majority Vote to Elect Directors + Plumbers and Pipefitters 53.7% 45.1% 1.2% 42.2% 35.4% 1.0% 9.6%Exxon Mobil Corporation Board- Independent Board Chairman/Separate Chair-CEO RAM Trust 34.8% 64.2% 1.0% 22.3% 41.2% 0.7% 18.3%Abbott Laboratories Exec. Comp.- Eliminate Accelerated Vesting in Termination/Change-of-Control SEIU 38.0% 60.9% 1.1% 27.9% 44.8% 0.8% 13.6%CF Industries Holdings, Inc. Board- Majority Vote to Elect Directors - Sheet Metal Workers 91.6% 8.3% 0.1% 73.9% 6.7% 0.1% 4.8%FLIR Systems, Inc Board- Majority Vote to Elect Directors + Sheet Metal Workers 57.8% 41.2% 1.0% 48.9% 34.9% 0.9% 3.9%Paccar Inc Board- Majority Vote to Elect Directors - Sheet Metal Workers 97.0% 2.9% 0.1% 83.4% 2.5% 0.1% 0.0%PulteGroup, Inc. Board- Majority Vote to Elect Directors + Sheet Metal Workers 43.5% 56.2% 0.3% 34.1% 44.2% 0.2% 11.8%Ross Stores, Inc. Board- Majority Vote to Elect Directors + Sheet Metal Workers 47.4% 52.5% 0.1% 40.2% 44.6% 0.2% 5.6%

> 35
FIGURE 16> Voting Results Sorted by Sponsor – 2012
As Percentage of Votes Cast
As Percentage of Shares Outstanding
Company Proposal Sponsor For Against Abstain For Against Abstain Non-Vote
Waste Connections Inc. Board- Independent Board Chairman/Separate Chair-CEO Teamsters 39.6% 60.1% 0.3% 35.5% 53.9% 0.3% 4.4%Yum! Brands, Inc. Board- Independent Board Chairman/Separate Chair-CEO Teamsters 42.2% 57.6% 0.2% 30.5% 41.6% 0.2% 12.6%Republic Services, Inc. Executive Compensation- Approve or Limit Executive Death Benefits Teamsters 40.4% 57.2% 2.4% 35.0% 49.5% 2.0% 4.1%Sotheby's Exec. Comp.- Eliminate Accelerated Vesting in Termination/Change-of-Control Teamsters 39.4% 60.1% 0.5% 31.5% 48.0% 0.4% 7.5%Stericycle, Inc. Executive Compensation- Require Equity to be Retained Teamsters 23.0% 76.7% 0.3% 18.6% 61.9% 0.3% 7.7%Kohl's Corporation Board- Adopt and Disclose CEO Succession Planning Guidelines Trowel Trades 18.0% 81.9% 0.1% 14.9% 67.7% 0.1% 5.4%Bank of New York Mellon Corp. Board- Independent Board Chairman/Separate Chair-CEO Trowel Trades 32.1% 67.6% 0.3% 25.5% 53.8% 0.3% 7.1%Wells Fargo & Company Cumulative Voting Trowel Trades 32.6% 67.0% 0.4% 25.1% 51.6% 0.3% 9.1%Northern Trust Corporation Exec. Comp.- Eliminate Accelerated Vesting in Termination/Change-of-Control Trowel Trades 40.9% 58.0% 1.1% 34.4% 48.8% 0.9% 5.0%Safeway Inc. Exec. Comp.- Eliminate Accelerated Vesting in Termination/Change-of-Control Trowel Trades 41.3% 57.6% 1.1% 33.0% 46.0% 0.8% 4.9%Staples, Inc. Executive Compensation- Require Equity to be Retained Trowel Trades 24.1% 75.6% 0.3% 18.3% 57.4% 0.2% 8.0%Amgen Inc. Board- Independent Board Chairman/Separate Chair-CEO UAW 41.7% 57.9% 0.4% 31.9% 44.4% 0.3% 10.7%Baker Hughes Incorporated Board- Majority Vote to Elect Directors + UBCJA 56.1% 43.0% 0.9% 41.3% 31.6% 0.6% 7.5%BB&T Corporation Board- Majority Vote to Elect Directors + UBCJA 47.3% 51.8% 0.9% 32.1% 35.2% 0.6% 14.4%Caterpillar Inc. Board- Majority Vote to Elect Directors + UBCJA 40.2% 59.2% 0.6% 27.1% 39.9% 0.4% 17.4%Duke Energy Corporation Board- Majority Vote to Elect Directors + UBCJA 40.8% 58.3% 0.9% 22.7% 32.4% 0.5% 28.8%Exxon Mobil Corporation Board- Majority Vote to Elect Directors + UBCJA 42.8% 56.0% 1.2% 27.5% 35.9% 0.8% 18.3%Nucor Corporation Board- Majority Vote to Elect Directors + UBCJA 39.4% 60.2% 0.4% 29.3% 44.8% 0.3% 12.5%Sherwin-Williams Company Board- Majority Vote to Elect Directors + UBCJA 48.0% 50.9% 1.1% 38.7% 41.1% 0.8% 6.5%Vornado Realty Trust Board- Majority Vote to Elect Directors - UBCJA 81.6% 18.3% 0.1% 69.3% 15.5% 0.1% 4.9%Vulcan Materials Company Board- Majority Vote to Elect Directors + UBCJA 61.4% 37.8% 0.8% 51.5% 31.7% 0.6% 0.0%
+ Have implemented a form of majority voting- Have not implemented a form of majority voting

This page intentionally left blank.

PART 3> Select Social Resolutions

> 38
FIGURE 17> Shareholder Proposals – Sustainability, Voting Results – 2012
As Percentage of Votes Cast
As Percentage of Shares Outstanding
Company Proposal Sponsor For Against Abstain For Against Abstain Non-Vote
AvalonBay Communities, Inc. Social- Issue Sustainability Report New York City Pension Funds 44.5% 48.9% 6.6% 39.1% 43.0% 5.8% 3.2%C.R. Bard, Inc. Social- Issue Sustainability Report Walden Asset Management 28.8% 65.5% 5.7% 24.0% 54.6% 4.7% 6.3%Cabot Oil & Gas Corporation Social- Issue Sustainability Report Miller/Howard Investments, Inc. 32.9% 50.1% 17.0% 28.2% 43.0% 14.6% 4.4%Cleco Corporation Social- Issue Sustainability Report Calvert Asset Management 28.9% 56.1% 15.0% 24.1% 46.7% 12.5% 9.7%Emerson Electric Co. Social- Issue Sustainability Report Walden Asset Management 29.2% 53.6% 17.2% 21.9% 40.2% 12.9% 12.7%Equity Residential Social- Issue Sustainability Report New York City Pension Funds 41.2% 50.2% 8.6% 36.0% 43.9% 7.5% 3.0%Gentex Corporation Social- Issue Sustainability Report Walden Asset Management 30.4% 63.2% 6.4% 25.1% 52.2% 5.3% 10.2%Kraft Foods Inc. Social- Issue Sustainability Report Domini Social Investments 7.4% 82.8% 9.8% 5.2% 58.2% 6.9% 13.1%Motorola Solutions, Inc. Social- Issue Sustainability Report New York City Pension Funds 5.6% 75.3% 19.1% 4.4% 59.0% 15.0% 8.6%R.R. Donnelley & Sons Company Social- Issue Sustainability Report Domini Social Investments 24.3% 66.8% 8.9% 18.4% 50.4% 6.7% 14.8%Yum! Brands, Inc. Social- Issue Sustainability Report Trillium Asset Management Corp. 29.8% 50.6% 19.6% 21.5% 36.6% 14.2% 12.6%
As Percentage of Votes Cast
As Percentage of Shares Outstanding
Company Proposal Sponsor For Against Abstain For Against Abstain Non-Vote
3M Company Social- Report on Lobbying Walden Asset Management 34.7% 53.7% 11.6% 22.8% 35.3% 7.6% 16.5%3M Company Social- Prohibit Political Contributions Trillium Asset Management Corp. 4.6% 83.1% 12.3% 3.0% 54.6% 8.1% 16.5%Abbott Laboratories Social- Report on Lobbying AFSCME 32.4% 56.0% 11.6% 23.8% 41.2% 8.5% 13.6%Aetna Inc. Social- Report on Political Contributions SEIU 9.0% 80.9% 10.1% 7.4% 66.6% 8.3% 5.6%Allstate Corporation Social- Report on Political Contributions PhiPERS 10.0% 76.1% 13.9% 7.7% 58.8% 10.8% 9.9%Altria Group, Inc. Social- Report on Lobbying Province of St. Joseph of the Capuchin Order 19.5% 75.8% 4.7% 12.7% 49.1% 3.0% 22.0%Amazon.com, Inc. Social- Report on Political Contributions Investor Voice 22.0% 65.8% 12.2% 17.6% 52.6% 9.8% 8.4%Amgen Inc. Social- Report on Lobbying Pax World Mutual Funds 19.3% 58.4% 22.3% 14.8% 44.7% 17.1% 10.7%Anadarko Petroleum Corporation Social- Report on Political Contributions New York State Pension Funds 36.4% 41.7% 21.9% 27.3% 31.3% 16.4% 7.8%AT&T Inc. Social- Report on Political Contributions Domini Social Investments 36.9% 58.8% 4.3% 21.2% 33.8% 2.4% 19.7%AutoNation, Inc. Social- Report on Political Contributions New York State Pension Funds 11.1% 86.7% 2.2% 9.8% 76.7% 2.0% 4.4%Bank of America Corporation Social- Report on Lobbying AFSCME 29.5% 65.4% 5.1% 14.9% 33.0% 2.6% 26.1%Bank of America Corporation Social- Report on Political Contributions Trillium Asset Management Corp. 4.6% 90.2% 5.2% 2.3% 45.5% 2.6% 26.1%Bank of America Corporation Social- Disclose Prior Government Employment Individual- Davis, E. 4.4% 90.0% 5.6% 2.2% 45.4% 2.8% 26.1%BB&T Corporation Social- Report on Political Contributions Laborers 28.1% 63.0% 8.9% 19.1% 42.8% 6.0% 14.4%Boeing Company Social- Report on Political Contributions Newground Social Investment 25.7% 61.7% 12.6% 18.5% 44.4% 9.0% 14.6%Carnival Corporation Social- Report on Political Contributions Individual- Kurte, R. 23.8% 70.0% 6.2% 23.3% 68.4% 6.1% 2.2%Caterpillar Inc. Social- Report on Political Contributions New York State Pension Funds 9.0% 77.7% 13.3% 6.1% 52.4% 9.0% 17.4%CenturyLink, Inc. Social- Report on Political Contributions Trillium Asset Management Corp. 37.7% 54.1% 8.2% 25.8% 37.0% 5.5% 20.1%Charles Schwab Corporation Social- Report on Political Contributions New York City Pension Funds 19.8% 64.4% 15.8% 16.7% 54.4% 13.3% 8.0%Chesapeake Energy Corporation Social- Report on Lobbying SEIU 36.3% 45.0% 18.7% 24.0% 29.7% 12.4% 19.6%Chevron Corporation Social- Report on Lobbying AFL-CIO 21.9% 72.1% 6.0% 15.6% 51.4% 4.3% 14.2%Chubb Corporation Social- Report on Political Contributions NorthStar Asset Management 3.1% 90.0% 6.9% 2.5% 71.5% 5.5% 8.0%Citigroup Inc. Social- Report on Political Contributions Firefighters’ Pension System of the City of Kansas City 8.5% 74.8% 16.7% 5.1% 44.6% 10.0% 16.2%Citigroup Inc. Social- Disclose Prior Government Employment Individual- Davis, E. 3.3% 84.4% 12.3% 1.9% 50.3% 7.3% 16.2%ConocoPhillips Social- Report on Lobbying Tides Foundation 22.1% 66.0% 11.9% 15.4% 45.9% 8.3% 15.4%Coventry Health Care, Inc. Social- Report on Political Contributions New York City Pension Funds 34.0% 35.9% 30.1% 29.5% 31.2% 26.2% 4.2%CVS Caremark Corporation Social- Report on Political Contributions Green Century Capital Management, Inc. 34.4% 49.7% 15.9% 27.4% 39.5% 12.6% 6.8%Devon Energy Corporation Social- Report on Lobbying Mercy Investment Services, Inc. 28.9% 63.5% 7.6% 22.5% 49.6% 6.0% 10.0%DTE Energy Company Social- Report on Political Contributions New York City Pension Funds 28.0% 69.4% 2.6% 18.5% 46.0% 1.7% 13.8%Ecolab Inc. Social- Report on Political Contributions NorthStar Asset Management 4.3% 85.2% 10.5% 3.5% 70.3% 8.7% 6.5%Express Scripts Holding Company Social- Report on Political Contributions Miami Fire Fighters’ Relief & Pension Fund 27.6% 59.8% 12.6% 20.5% 44.3% 9.3% 10.2%Exxon Mobil Corp. Social- Report on Political Contributions Laborers 22.4% 72.8% 4.8% 14.4% 46.7% 3.0% 18.3%GEO Group, Inc. Social- Report on Lobbying Province of St. Joseph of the Capuchin Order 15.6% 69.6% 14.8% 14.1% 62.8% 13.3% 5.1%Goldman Sachs Group, Inc. Social- Report on Lobbying Needmor Fund 7.4% 81.3% 11.3% 5.1% 55.6% 7.7% 13.1%Google Inc. Social- Report on Political Contributions NorthStar Asset Management 0.8% 96.7% 2.5% 0.8% 87.8% 2.2% 3.1%Home Depot Inc. Social- Report on Political Contributions NorthStar Asset Management 2.8% 94.6% 2.6% 2.1% 68.2% 1.8% 14.6%Honeywell International Inc. Social- Report on Political Contributions Individual- Revuluri, V. 24.6% 59.7% 15.7% 19.4% 47.1% 12.4% 10.3%Intel Corporation Social- Report on Political Contributions NorthStar Asset Management 6.2% 81.4% 12.4% 3.8% 49.5% 7.5% 19.7%International Business Machines Corp. Social- Report on Lobbying Green Century Capital Management, Inc. 9.4% 86.3% 4.3% 6.1% 55.8% 2.8% 15.4%International Business Machines Corp. Social- Report on Political Contributions Walden Asset Management 9.3% 86.5% 4.2% 6.0% 55.9% 2.7% 15.4%
FIGURE 18> Shareholder Proposals – Political Contributions, Voting Results – 2012
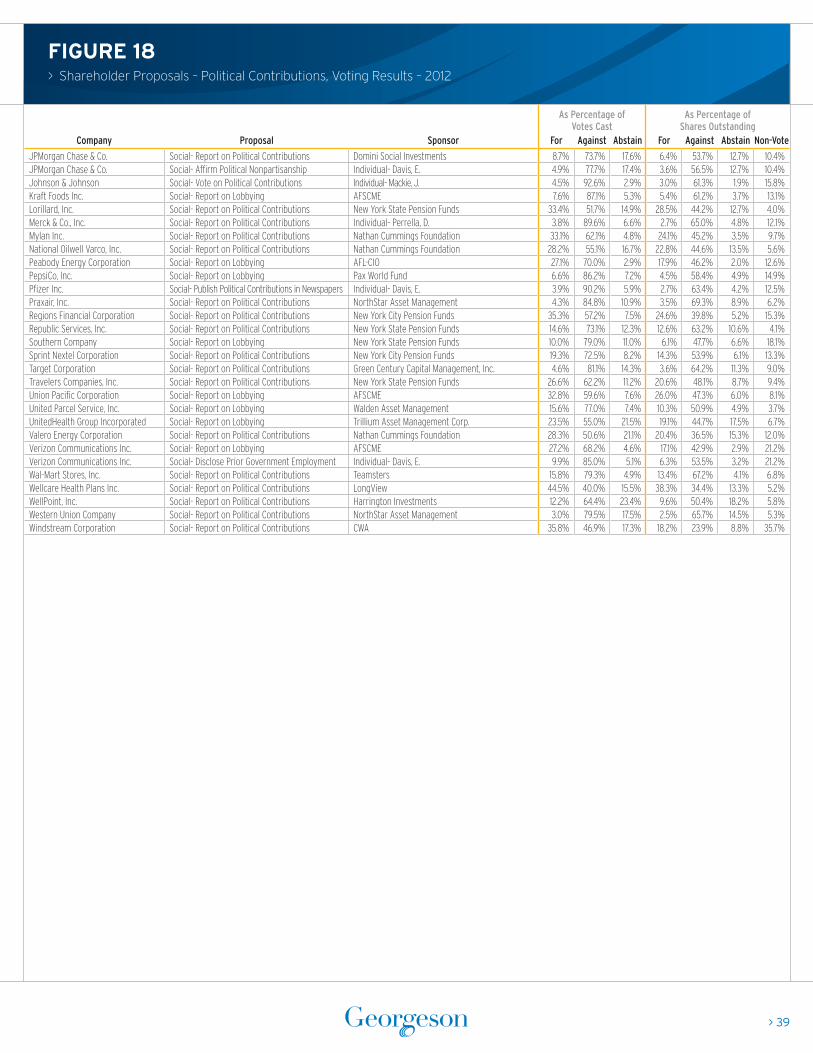
> 39
FIGURE 18> Shareholder Proposals – Political Contributions, Voting Results – 2012
As Percentage of Votes Cast
As Percentage of Shares Outstanding
Company Proposal Sponsor For Against Abstain For Against Abstain Non-Vote
JPMorgan Chase & Co. Social- Report on Political Contributions Domini Social Investments 8.7% 73.7% 17.6% 6.4% 53.7% 12.7% 10.4%JPMorgan Chase & Co. Social- Affirm Political Nonpartisanship Individual- Davis, E. 4.9% 77.7% 17.4% 3.6% 56.5% 12.7% 10.4%Johnson & Johnson Social- Vote on Political Contributions Individual- Mackie, J. 4.5% 92.6% 2.9% 3.0% 61.3% 1.9% 15.8%Kraft Foods Inc. Social- Report on Lobbying AFSCME 7.6% 87.1% 5.3% 5.4% 61.2% 3.7% 13.1%Lorillard, Inc. Social- Report on Political Contributions New York State Pension Funds 33.4% 51.7% 14.9% 28.5% 44.2% 12.7% 4.0%Merck & Co., Inc. Social- Report on Political Contributions Individual- Perrella, D. 3.8% 89.6% 6.6% 2.7% 65.0% 4.8% 12.1%Mylan Inc. Social- Report on Political Contributions Nathan Cummings Foundation 33.1% 62.1% 4.8% 24.1% 45.2% 3.5% 9.7%National Oilwell Varco, Inc. Social- Report on Political Contributions Nathan Cummings Foundation 28.2% 55.1% 16.7% 22.8% 44.6% 13.5% 5.6%Peabody Energy Corporation Social- Report on Lobbying AFL-CIO 27.1% 70.0% 2.9% 17.9% 46.2% 2.0% 12.6%PepsiCo, Inc. Social- Report on Lobbying Pax World Fund 6.6% 86.2% 7.2% 4.5% 58.4% 4.9% 14.9%Pfizer Inc. Social- Publish Political Contributions in Newspapers Individual- Davis, E. 3.9% 90.2% 5.9% 2.7% 63.4% 4.2% 12.5%Praxair, Inc. Social- Report on Political Contributions NorthStar Asset Management 4.3% 84.8% 10.9% 3.5% 69.3% 8.9% 6.2%Regions Financial Corporation Social- Report on Political Contributions New York City Pension Funds 35.3% 57.2% 7.5% 24.6% 39.8% 5.2% 15.3%Republic Services, Inc. Social- Report on Political Contributions New York State Pension Funds 14.6% 73.1% 12.3% 12.6% 63.2% 10.6% 4.1%Southern Company Social- Report on Lobbying New York State Pension Funds 10.0% 79.0% 11.0% 6.1% 47.7% 6.6% 18.1%Sprint Nextel Corporation Social- Report on Political Contributions New York City Pension Funds 19.3% 72.5% 8.2% 14.3% 53.9% 6.1% 13.3%Target Corporation Social- Report on Political Contributions Green Century Capital Management, Inc. 4.6% 81.1% 14.3% 3.6% 64.2% 11.3% 9.0%Travelers Companies, Inc. Social- Report on Political Contributions New York State Pension Funds 26.6% 62.2% 11.2% 20.6% 48.1% 8.7% 9.4%Union Pacific Corporation Social- Report on Lobbying AFSCME 32.8% 59.6% 7.6% 26.0% 47.3% 6.0% 8.1%United Parcel Service, Inc. Social- Report on Lobbying Walden Asset Management 15.6% 77.0% 7.4% 10.3% 50.9% 4.9% 3.7%UnitedHealth Group Incorporated Social- Report on Lobbying Trillium Asset Management Corp. 23.5% 55.0% 21.5% 19.1% 44.7% 17.5% 6.7%Valero Energy Corporation Social- Report on Political Contributions Nathan Cummings Foundation 28.3% 50.6% 21.1% 20.4% 36.5% 15.3% 12.0%Verizon Communications Inc. Social- Report on Lobbying AFSCME 27.2% 68.2% 4.6% 17.1% 42.9% 2.9% 21.2%Verizon Communications Inc. Social- Disclose Prior Government Employment Individual- Davis, E. 9.9% 85.0% 5.1% 6.3% 53.5% 3.2% 21.2%Wal-Mart Stores, Inc. Social- Report on Political Contributions Teamsters 15.8% 79.3% 4.9% 13.4% 67.2% 4.1% 6.8%Wellcare Health Plans Inc. Social- Report on Political Contributions LongView 44.5% 40.0% 15.5% 38.3% 34.4% 13.3% 5.2%WellPoint, Inc. Social- Report on Political Contributions Harrington Investments 12.2% 64.4% 23.4% 9.6% 50.4% 18.2% 5.8%Western Union Company Social- Report on Political Contributions NorthStar Asset Management 3.0% 79.5% 17.5% 2.5% 65.7% 14.5% 5.3%Windstream Corporation Social- Report on Political Contributions CWA 35.8% 46.9% 17.3% 18.2% 23.9% 8.8% 35.7%

This page intentionally left blank.

PART 4> Management Proposal — Advisory Vote on Executive Compensation
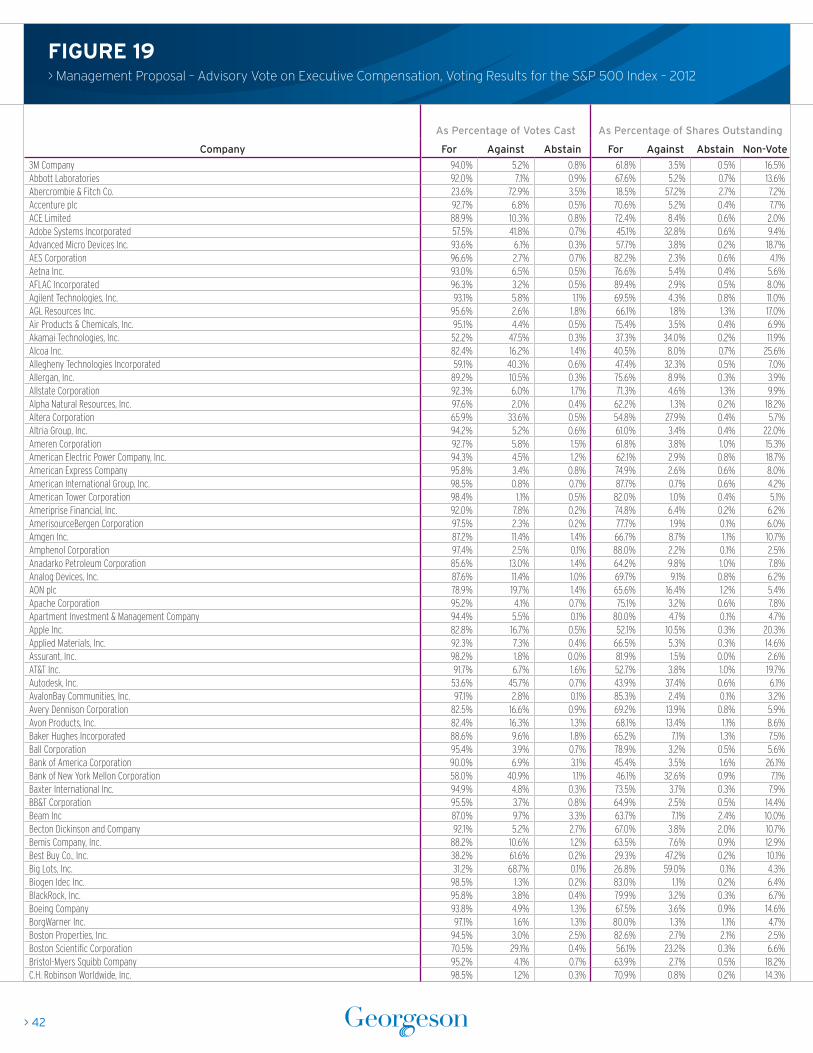
> 42
As Percentage of Votes Cast As Percentage of Shares Outstanding
Company For Against Abstain For Against Abstain Non-Vote
3M Company 94.0% 5.2% 0.8% 61.8% 3.5% 0.5% 16.5%Abbott Laboratories 92.0% 7.1% 0.9% 67.6% 5.2% 0.7% 13.6%Abercrombie & Fitch Co. 23.6% 72.9% 3.5% 18.5% 57.2% 2.7% 7.2%Accenture plc 92.7% 6.8% 0.5% 70.6% 5.2% 0.4% 7.7%ACE Limited 88.9% 10.3% 0.8% 72.4% 8.4% 0.6% 2.0%Adobe Systems Incorporated 57.5% 41.8% 0.7% 45.1% 32.8% 0.6% 9.4%Advanced Micro Devices Inc. 93.6% 6.1% 0.3% 57.7% 3.8% 0.2% 18.7%AES Corporation 96.6% 2.7% 0.7% 82.2% 2.3% 0.6% 4.1%Aetna Inc. 93.0% 6.5% 0.5% 76.6% 5.4% 0.4% 5.6%AFLAC Incorporated 96.3% 3.2% 0.5% 89.4% 2.9% 0.5% 8.0%Agilent Technologies, Inc. 93.1% 5.8% 1.1% 69.5% 4.3% 0.8% 11.0%AGL Resources Inc. 95.6% 2.6% 1.8% 66.1% 1.8% 1.3% 17.0%Air Products & Chemicals, Inc. 95.1% 4.4% 0.5% 75.4% 3.5% 0.4% 6.9%Akamai Technologies, Inc. 52.2% 47.5% 0.3% 37.3% 34.0% 0.2% 11.9%Alcoa Inc. 82.4% 16.2% 1.4% 40.5% 8.0% 0.7% 25.6%Allegheny Technologies Incorporated 59.1% 40.3% 0.6% 47.4% 32.3% 0.5% 7.0%Allergan, Inc. 89.2% 10.5% 0.3% 75.6% 8.9% 0.3% 3.9%Allstate Corporation 92.3% 6.0% 1.7% 71.3% 4.6% 1.3% 9.9%Alpha Natural Resources, Inc. 97.6% 2.0% 0.4% 62.2% 1.3% 0.2% 18.2%Altera Corporation 65.9% 33.6% 0.5% 54.8% 27.9% 0.4% 5.7%Altria Group, Inc. 94.2% 5.2% 0.6% 61.0% 3.4% 0.4% 22.0%Ameren Corporation 92.7% 5.8% 1.5% 61.8% 3.8% 1.0% 15.3%American Electric Power Company, Inc. 94.3% 4.5% 1.2% 62.1% 2.9% 0.8% 18.7%American Express Company 95.8% 3.4% 0.8% 74.9% 2.6% 0.6% 8.0%American International Group, Inc. 98.5% 0.8% 0.7% 87.7% 0.7% 0.6% 4.2%American Tower Corporation 98.4% 1.1% 0.5% 82.0% 1.0% 0.4% 5.1%Ameriprise Financial, Inc. 92.0% 7.8% 0.2% 74.8% 6.4% 0.2% 6.2%AmerisourceBergen Corporation 97.5% 2.3% 0.2% 77.7% 1.9% 0.1% 6.0%Amgen Inc. 87.2% 11.4% 1.4% 66.7% 8.7% 1.1% 10.7%Amphenol Corporation 97.4% 2.5% 0.1% 88.0% 2.2% 0.1% 2.5%Anadarko Petroleum Corporation 85.6% 13.0% 1.4% 64.2% 9.8% 1.0% 7.8%Analog Devices, Inc. 87.6% 11.4% 1.0% 69.7% 9.1% 0.8% 6.2%AON plc 78.9% 19.7% 1.4% 65.6% 16.4% 1.2% 5.4%Apache Corporation 95.2% 4.1% 0.7% 75.1% 3.2% 0.6% 7.8%Apartment Investment & Management Company 94.4% 5.5% 0.1% 80.0% 4.7% 0.1% 4.7%Apple Inc. 82.8% 16.7% 0.5% 52.1% 10.5% 0.3% 20.3%Applied Materials, Inc. 92.3% 7.3% 0.4% 66.5% 5.3% 0.3% 14.6%Assurant, Inc. 98.2% 1.8% 0.0% 81.9% 1.5% 0.0% 2.6%AT&T Inc. 91.7% 6.7% 1.6% 52.7% 3.8% 1.0% 19.7%Autodesk, Inc. 53.6% 45.7% 0.7% 43.9% 37.4% 0.6% 6.1%AvalonBay Communities, Inc. 97.1% 2.8% 0.1% 85.3% 2.4% 0.1% 3.2%Avery Dennison Corporation 82.5% 16.6% 0.9% 69.2% 13.9% 0.8% 5.9%Avon Products, Inc. 82.4% 16.3% 1.3% 68.1% 13.4% 1.1% 8.6%Baker Hughes Incorporated 88.6% 9.6% 1.8% 65.2% 7.1% 1.3% 7.5%Ball Corporation 95.4% 3.9% 0.7% 78.9% 3.2% 0.5% 5.6%Bank of America Corporation 90.0% 6.9% 3.1% 45.4% 3.5% 1.6% 26.1%Bank of New York Mellon Corporation 58.0% 40.9% 1.1% 46.1% 32.6% 0.9% 7.1%Baxter International Inc. 94.9% 4.8% 0.3% 73.5% 3.7% 0.3% 7.9%BB&T Corporation 95.5% 3.7% 0.8% 64.9% 2.5% 0.5% 14.4%Beam Inc 87.0% 9.7% 3.3% 63.7% 7.1% 2.4% 10.0%Becton Dickinson and Company 92.1% 5.2% 2.7% 67.0% 3.8% 2.0% 10.7%Bemis Company, Inc. 88.2% 10.6% 1.2% 63.5% 7.6% 0.9% 12.9%Best Buy Co., Inc. 38.2% 61.6% 0.2% 29.3% 47.2% 0.2% 10.1%Big Lots, Inc. 31.2% 68.7% 0.1% 26.8% 59.0% 0.1% 4.3%Biogen Idec Inc. 98.5% 1.3% 0.2% 83.0% 1.1% 0.2% 6.4%BlackRock, Inc. 95.8% 3.8% 0.4% 79.9% 3.2% 0.3% 6.7%Boeing Company 93.8% 4.9% 1.3% 67.5% 3.6% 0.9% 14.6%BorgWarner Inc. 97.1% 1.6% 1.3% 80.0% 1.3% 1.1% 4.7%Boston Properties, Inc. 94.5% 3.0% 2.5% 82.6% 2.7% 2.1% 2.5%Boston Scientific Corporation 70.5% 29.1% 0.4% 56.1% 23.2% 0.3% 6.6%Bristol-Myers Squibb Company 95.2% 4.1% 0.7% 63.9% 2.7% 0.5% 18.2%C.H. Robinson Worldwide, Inc. 98.5% 1.2% 0.3% 70.9% 0.8% 0.2% 14.3%
FIGURE 19> Management Proposal – Advisory Vote on Executive Compensation, Voting Results for the S&P 500 Index – 2012

> 43
FIGURE 19> Management Proposal – Advisory Vote on Executive Compensation, Voting Results for the S&P 500 Index – 2012
As Percentage of Votes Cast As Percentage of Shares Outstanding
Company For Against Abstain For Against Abstain Non-Vote
C.R. Bard, Inc. 60.1% 39.7% 0.2% 50.0% 33.0% 0.2% 6.3%Cabot Oil & Gas Corporation 95.2% 3.5% 1.3% 81.7% 3.0% 1.1% 4.4%Cameron International Corporation 97.5% 1.5% 1.0% 85.6% 1.4% 0.8% 2.9%Capital One Financial Corporation 85.5% 13.9% 0.6% 68.3% 11.1% 0.5% 7.0%CarMax, Inc. 96.7% 2.6% 0.7% 80.8% 2.2% 0.5% 6.6%Carnival Corporation 93.4% 6.0% 0.6% 93.4% 6.0% 0.7% 0.0%Caterpillar Inc. 96.4% 2.9% 0.7% 65.0% 2.0% 0.4% 17.4%CBRE Group, Inc 93.9% 5.9% 0.2% 81.0% 5.1% 0.2% 4.6%Celgene Corporation 95.4% 4.5% 0.1% 68.6% 3.2% 0.1% 11.4%CenterPoint Energy, Inc. 95.1% 4.2% 0.7% 69.3% 3.1% 0.5% 12.8%CenturyLink, Inc. 96.6% 2.9% 0.5% 66.0% 2.0% 0.3% 20.1%Cerner Corporation 97.7% 2.1% 0.2% 81.9% 1.8% 0.1% 7.2%CF Industries Holdings, Inc. 93.9% 6.0% 0.1% 75.8% 4.8% 0.1% 4.8%Charles Schwab Corporation 96.7% 2.6% 0.7% 81.6% 2.2% 0.6% 8.0%Chesapeake Energy Corporation 19.9% 79.6% 0.5% 13.2% 52.6% 0.3% 19.6%Chevron Corporation 93.9% 5.1% 1.0% 66.9% 3.6% 0.7% 14.2%Chipotle Mexican Grill, Inc. 78.8% 21.1% 0.1% 65.4% 17.5% 0.1% 8.1%Chubb Corporation 95.6% 4.3% 0.1% 76.0% 3.4% 0.1% 8.0%Cigna Corporation 98.0% 1.7% 0.3% 78.1% 1.4% 0.2% 5.3%Cincinnati Financial Corporation 98.2% 1.1% 0.7% 72.8% 0.8% 0.6% 11.1%Citigroup Inc. 45.1% 54.6% 0.3% 26.9% 32.6% 0.2% 16.2%Citrix Systems, Inc. 97.7% 2.2% 0.1% 81.5% 1.9% 0.1% 5.1%Cliffs Natural Resources Inc. 97.0% 2.6% 0.4% 65.9% 1.8% 0.3% 12.3%CME Group Inc. 96.2% 3.4% 0.4% 67.7% 2.4% 0.3% 12.4%CMS Energy Corporation 97.0% 2.6% 0.4% 79.4% 2.1% 0.3% 8.1%Coca-Cola Co. 96.4% 2.9% 0.7% 68.8% 2.1% 0.5% 13.0%Coca-Cola Enterprises, Inc. 97.5% 2.4% 0.1% 81.7% 2.0% 0.1% 3.9%Cognizant Technology Solutions Corporation 96.7% 2.7% 0.6% 80.5% 2.3% 0.4% 6.0%Colgate-Palmolive Company 96.3% 3.2% 0.5% 69.2% 2.3% 0.4% 11.7%Comerica Incorporated 93.3% 6.3% 0.4% 76.3% 5.2% 0.3% 7.6%ConocoPhillips 80.1% 19.3% 0.6% 55.7% 13.4% 0.4% 15.4%Consol Energy Inc. 54.0% 45.7% 0.3% 44.8% 37.9% 0.3% 5.7%Consolidated Edison, Inc. 89.6% 8.3% 2.1% 46.0% 4.3% 1.1% 30.7%Cooper Industries plc 28.9% 69.5% 1.6% 24.2% 58.2% 1.3% 3.7%Corning Incorporated 93.9% 5.0% 1.1% 66.4% 3.5% 0.8% 15.2%Costco Wholesale Corporation 97.6% 2.1% 0.3% 72.6% 1.6% 0.2% 12.3%Coventry Health Care, Inc. 74.4% 25.5% 0.1% 64.7% 22.2% 0.1% 4.2%Covidien plc 94.3% 5.4% 0.3% 77.1% 4.4% 0.2% 5.8%CSX Corporation 97.2% 2.3% 0.5% 68.5% 1.6% 0.3% 14.8%Cummins Inc. 94.7% 4.2% 1.1% 74.7% 3.3% 0.8% 8.6%CVS Caremark Corporation 94.7% 4.5% 0.8% 75.3% 3.6% 0.6% 6.8%D.R. Horton Inc. 99.1% 0.7% 0.2% 82.9% 0.6% 0.1% 6.5%Danaher Corporation 94.9% 5.0% 0.1% 80.4% 4.2% 0.1% 4.7%DaVita Inc. 79.5% 20.4% 0.1% 66.8% 17.2% 0.1% 4.8%Dean Foods Company 80.2% 18.9% 0.9% 65.2% 15.4% 0.7% 10.4%Deere & Company 95.8% 2.4% 1.8% 64.9% 1.6% 1.2% 16.1%Denbury Resources Inc. 97.6% 2.2% 0.2% 82.2% 1.9% 0.1% 5.9%Dentsply International Inc. 95.8% 3.7% 0.5% 79.0% 3.0% 0.4% 5.8%Devon Energy Corporation 59.5% 39.5% 1.0% 46.5% 30.8% 0.8% 10.0%Diamond Offshore Drilling, Inc. 98.7% 1.1% 0.2% 82.3% 0.9% 0.2% 6.6%DIRECTV 95.7% 2.4% 1.9% 72.0% 1.8% 1.4% 5.8%Discover Financial Services 94.9% 4.7% 0.4% 76.6% 3.8% 0.3% 6.7%Dollar Tree, Inc. 98.2% 1.4% 0.4% 80.8% 1.2% 0.3% 6.1%Dominion Resources Inc. 94.0% 5.1% 0.9% 59.3% 3.2% 0.6% 16.2%Dover Corporation 95.3% 4.4% 0.3% 76.8% 3.5% 0.2% 6.8%Dow Chemical Company 82.2% 16.9% 0.9% 63.3% 13.0% 0.8% 10.7%Dr Pepper Snapple Group, Inc. 85.7% 3.6% 10.7% 69.5% 2.9% 8.7% 3.4%DTE Energy Company 91.7% 7.1% 1.2% 60.7% 4.7% 0.8% 13.8%Duke Energy Corporation 92.4% 6.4% 1.2% 51.4% 3.6% 0.6% 28.8%Dun & Bradstreet Corporation 64.4% 34.9% 0.7% 53.7% 29.1% 0.6% 5.5%E*TRADE Financial Corporation 81.7% 15.2% 3.1% 59.3% 11.0% 2.2% 13.8%E. I. du Pont de Nemours and Company 94.5% 4.6% 0.9% 62.7% 3.1% 0.6% 16.0%

> 44
FIGURE 19> Management Proposal – Advisory Vote on Executive Compensation, Voting Results for the S&P 500 Index – 2012
As Percentage of Votes Cast As Percentage of Shares Outstanding
Company For Against Abstain For Against Abstain Non-Vote
Eastman Chemical Co. 95.4% 4.3% 0.3% 76.3% 3.5% 0.2% 6.7%Eaton Corporation 93.0% 6.9% 0.1% 72.4% 5.4% 0.1% 10.7%eBay Inc. 95.2% 2.6% 2.2% 78.3% 2.2% 1.8% 5.7%Ecolab Inc. 97.8% 1.6% 0.6% 80.7% 1.3% 0.5% 6.5%Edison International 93.6% 5.3% 1.1% 72.0% 4.1% 0.9% 9.1%Edwards Lifesciences Corporation 96.3% 3.5% 0.2% 77.2% 2.8% 0.1% 6.6%Eli Lilly and Company 93.2% 6.1% 0.7% 70.2% 4.6% 0.5% 11.9%EMC Corporation 96.3% 3.4% 0.3% 68.5% 2.4% 0.2% 12.5%Emerson Electric Co. 95.8% 3.4% 0.8% 71.9% 2.6% 0.6% 12.7%Entergy Corporation 95.2% 3.7% 1.1% 74.1% 2.9% 0.9% 8.3%EOG Resources, Inc. 83.8% 13.5% 2.7% 71.5% 11.5% 2.3% 4.0%EQT Corporation 93.1% 5.1% 1.8% 69.1% 3.8% 1.3% 12.8%Equifax Inc. 76.9% 22.6% 0.5% 58.5% 17.2% 0.4% 9.4%Equity Residential 95.6% 3.2% 1.2% 83.5% 2.8% 1.1% 3.0%Exelon Corporation 74.9% 24.0% 1.1% 46.7% 15.0% 0.7% 17.9%Expeditors International of Washington, Inc. 89.5% 10.0% 0.5% 73.0% 8.1% 0.4% 6.7%Express Scripts Holding Company 98.0% 1.6% 0.4% 72.6% 1.2% 0.3% 10.2%Exxon Mobil Corp. 76.4% 21.9% 1.7% 49.1% 14.0% 1.1% 18.3%F5 Networks, Inc. 98.3% 1.7% 0.0% 77.9% 1.4% 0.0% 8.5%Family Dollar Stores, Inc. 98.2% 1.6% 0.2% 80.9% 1.3% 0.1% 7.7%Fastenal Company 99.1% 0.7% 0.2% 77.0% 0.5% 0.2% 14.1%Fidelity National Information Services, Inc. 89.9% 9.3% 0.8% 72.4% 7.5% 0.6% 8.2%Fifth Third Bancorp 95.5% 4.0% 0.5% 74.6% 3.1% 0.4% 9.3%First Horizon National Corporation 92.8% 5.1% 2.1% 71.9% 3.9% 1.7% 12.5%FirstEnergy Corp. 59.9% 36.0% 4.1% 46.8% 28.1% 3.2% 11.0%Fiserv, Inc. 93.6% 5.5% 0.9% 74.4% 4.4% 0.7% 9.6%Flowserve Corporation 93.9% 2.2% 3.9% 78.8% 1.8% 3.3% 6.0%Fluor Corporation 85.5% 14.2% 0.3% 66.5% 11.1% 0.2% 9.1%FMC Corporation 95.6% 3.7% 0.7% 81.1% 3.2% 0.6% 4.5%FMC Technologies, Inc. 98.6% 1.2% 0.2% 84.0% 1.0% 0.2% 3.4%Ford Motor Company 95.6% 3.8% 0.6% 68.3% 2.7% 0.4% 19.8%Fossil, Inc. 99.6% 0.4% 0.0% 88.0% 0.3% 0.0% 4.1%Freeport-McMoRan Copper & Gold Inc. 67.5% 32.2% 0.3% 42.5% 20.3% 0.2% 15.3%Frontier Communications Corporation 86.7% 11.7% 1.6% 40.0% 5.4% 0.7% 34.9%GameStop Corp. 96.9% 2.5% 0.6% 82.0% 2.1% 0.5% 5.4%Gannett Co., Inc. 92.2% 6.9% 0.9% 64.8% 4.8% 0.6% 11.9%Gap, Inc. 98.2% 1.6% 0.2% 86.0% 1.4% 0.2% 4.7%General Dynamics Corporation 77.1% 21.8% 1.2% 64.0% 18.1% 1.0% 6.7%General Electric Company 90.6% 7.3% 2.1% 53.6% 4.3% 1.3% 19.9%Genuine Parts Company 92.3% 3.3% 4.4% 70.6% 2.5% 3.4% 11.5%Genworth Financial, Inc. 93.7% 5.0% 1.3% 73.9% 4.0% 1.0% 10.5%Gilead Sciences, Inc. 75.7% 23.7% 0.6% 59.3% 18.5% 0.5% 6.2%Goldman Sachs Group, Inc. 94.0% 5.1% 0.9% 64.4% 3.5% 0.6% 13.1%Goodyear Tire & Rubber Company 81.2% 18.4% 0.4% 56.2% 12.7% 0.3% 14.9%Halliburton Company 97.0% 2.3% 0.7% 63.1% 1.5% 0.4% 13.2%Harley-Davidson, Inc. 96.9% 2.7% 0.4% 74.5% 2.1% 0.2% 10.9%Hartford Financial Services Group, Inc. 95.0% 3.3% 1.7% 72.2% 2.5% 1.3% 10.7%Hasbro, Inc. 93.4% 6.0% 0.6% 75.1% 4.8% 0.5% 6.9%HCP, Inc. 95.2% 3.5% 1.3% 79.2% 2.9% 1.1% 7.6%Health Care REIT, Inc. 63.7% 36.0% 0.3% 46.8% 26.5% 0.3% 13.8%Helmerich & Payne, Inc. 94.6% 1.3% 4.1% 78.1% 1.1% 3.4% 5.7%Hershey Company 98.9% 1.0% 0.1% 92.9% 0.9% 0.1% 3.0%Hess Corporation 57.4% 41.9% 0.7% 43.2% 31.5% 0.5% 8.0%Hewlett-Packard Company 77.2% 20.8% 2.0% 52.0% 14.0% 1.3% 13.0%Home Depot Inc. 97.7% 1.9% 0.4% 70.5% 1.4% 0.3% 14.6%Honeywell International Inc. 89.9% 7.7% 2.4% 71.0% 6.1% 1.9% 10.3%Hospira, Inc. 84.3% 14.8% 0.9% 69.7% 12.2% 0.7% 6.3%Host Hotels & Resorts, Inc. 98.9% 1.1% 0.0% 84.8% 0.9% 0.0% 2.6%Hudson City Bancorp, Inc. 73.8% 25.6% 0.6% 53.6% 18.6% 0.5% 13.2%Humana Inc. 94.3% 5.5% 0.2% 74.7% 4.4% 0.2% 5.9%Huntington Bancshares Incorporated 60.5% 38.6% 0.9% 44.6% 28.5% 0.6% 13.8%Illinois Tool Works Inc. 94.3% 2.9% 2.8% 77.1% 2.3% 2.3% 8.3%

> 45
As Percentage of Votes Cast As Percentage of Shares Outstanding
Company For Against Abstain For Against Abstain Non-Vote
Eastman Chemical Co. 95.4% 4.3% 0.3% 76.3% 3.5% 0.2% 6.7%Eaton Corporation 93.0% 6.9% 0.1% 72.4% 5.4% 0.1% 10.7%eBay Inc. 95.2% 2.6% 2.2% 78.3% 2.2% 1.8% 5.7%Ecolab Inc. 97.8% 1.6% 0.6% 80.7% 1.3% 0.5% 6.5%Edison International 93.6% 5.3% 1.1% 72.0% 4.1% 0.9% 9.1%Edwards Lifesciences Corporation 96.3% 3.5% 0.2% 77.2% 2.8% 0.1% 6.6%Eli Lilly and Company 93.2% 6.1% 0.7% 70.2% 4.6% 0.5% 11.9%EMC Corporation 96.3% 3.4% 0.3% 68.5% 2.4% 0.2% 12.5%Emerson Electric Co. 95.8% 3.4% 0.8% 71.9% 2.6% 0.6% 12.7%Entergy Corporation 95.2% 3.7% 1.1% 74.1% 2.9% 0.9% 8.3%EOG Resources, Inc. 83.8% 13.5% 2.7% 71.5% 11.5% 2.3% 4.0%EQT Corporation 93.1% 5.1% 1.8% 69.1% 3.8% 1.3% 12.8%Equifax Inc. 76.9% 22.6% 0.5% 58.5% 17.2% 0.4% 9.4%Equity Residential 95.6% 3.2% 1.2% 83.5% 2.8% 1.1% 3.0%Exelon Corporation 74.9% 24.0% 1.1% 46.7% 15.0% 0.7% 17.9%Expeditors International of Washington, Inc. 89.5% 10.0% 0.5% 73.0% 8.1% 0.4% 6.7%Express Scripts Holding Company 98.0% 1.6% 0.4% 72.6% 1.2% 0.3% 10.2%Exxon Mobil Corp. 76.4% 21.9% 1.7% 49.1% 14.0% 1.1% 18.3%F5 Networks, Inc. 98.3% 1.7% 0.0% 77.9% 1.4% 0.0% 8.5%Family Dollar Stores, Inc. 98.2% 1.6% 0.2% 80.9% 1.3% 0.1% 7.7%Fastenal Company 99.1% 0.7% 0.2% 77.0% 0.5% 0.2% 14.1%Fidelity National Information Services, Inc. 89.9% 9.3% 0.8% 72.4% 7.5% 0.6% 8.2%Fifth Third Bancorp 95.5% 4.0% 0.5% 74.6% 3.1% 0.4% 9.3%First Horizon National Corporation 92.8% 5.1% 2.1% 71.9% 3.9% 1.7% 12.5%FirstEnergy Corp. 59.9% 36.0% 4.1% 46.8% 28.1% 3.2% 11.0%Fiserv, Inc. 93.6% 5.5% 0.9% 74.4% 4.4% 0.7% 9.6%Flowserve Corporation 93.9% 2.2% 3.9% 78.8% 1.8% 3.3% 6.0%Fluor Corporation 85.5% 14.2% 0.3% 66.5% 11.1% 0.2% 9.1%FMC Corporation 95.6% 3.7% 0.7% 81.1% 3.2% 0.6% 4.5%FMC Technologies, Inc. 98.6% 1.2% 0.2% 84.0% 1.0% 0.2% 3.4%Ford Motor Company 95.6% 3.8% 0.6% 68.3% 2.7% 0.4% 19.8%Fossil, Inc. 99.6% 0.4% 0.0% 88.0% 0.3% 0.0% 4.1%Freeport-McMoRan Copper & Gold Inc. 67.5% 32.2% 0.3% 42.5% 20.3% 0.2% 15.3%Frontier Communications Corporation 86.7% 11.7% 1.6% 40.0% 5.4% 0.7% 34.9%GameStop Corp. 96.9% 2.5% 0.6% 82.0% 2.1% 0.5% 5.4%Gannett Co., Inc. 92.2% 6.9% 0.9% 64.8% 4.8% 0.6% 11.9%Gap, Inc. 98.2% 1.6% 0.2% 86.0% 1.4% 0.2% 4.7%General Dynamics Corporation 77.1% 21.8% 1.2% 64.0% 18.1% 1.0% 6.7%General Electric Company 90.6% 7.3% 2.1% 53.6% 4.3% 1.3% 19.9%Genuine Parts Company 92.3% 3.3% 4.4% 70.6% 2.5% 3.4% 11.5%Genworth Financial, Inc. 93.7% 5.0% 1.3% 73.9% 4.0% 1.0% 10.5%Gilead Sciences, Inc. 75.7% 23.7% 0.6% 59.3% 18.5% 0.5% 6.2%Goldman Sachs Group, Inc. 94.0% 5.1% 0.9% 64.4% 3.5% 0.6% 13.1%Goodyear Tire & Rubber Company 81.2% 18.4% 0.4% 56.2% 12.7% 0.3% 14.9%Halliburton Company 97.0% 2.3% 0.7% 63.1% 1.5% 0.4% 13.2%Harley-Davidson, Inc. 96.9% 2.7% 0.4% 74.5% 2.1% 0.2% 10.9%Hartford Financial Services Group, Inc. 95.0% 3.3% 1.7% 72.2% 2.5% 1.3% 10.7%Hasbro, Inc. 93.4% 6.0% 0.6% 75.1% 4.8% 0.5% 6.9%HCP, Inc. 95.2% 3.5% 1.3% 79.2% 2.9% 1.1% 7.6%Health Care REIT, Inc. 63.7% 36.0% 0.3% 46.8% 26.5% 0.3% 13.8%Helmerich & Payne, Inc. 94.6% 1.3% 4.1% 78.1% 1.1% 3.4% 5.7%Hershey Company 98.9% 1.0% 0.1% 92.9% 0.9% 0.1% 3.0%Hess Corporation 57.4% 41.9% 0.7% 43.2% 31.5% 0.5% 8.0%Hewlett-Packard Company 77.2% 20.8% 2.0% 52.0% 14.0% 1.3% 13.0%Home Depot Inc. 97.7% 1.9% 0.4% 70.5% 1.4% 0.3% 14.6%Honeywell International Inc. 89.9% 7.7% 2.4% 71.0% 6.1% 1.9% 10.3%Hospira, Inc. 84.3% 14.8% 0.9% 69.7% 12.2% 0.7% 6.3%Host Hotels & Resorts, Inc. 98.9% 1.1% 0.0% 84.8% 0.9% 0.0% 2.6%Hudson City Bancorp, Inc. 73.8% 25.6% 0.6% 53.6% 18.6% 0.5% 13.2%Humana Inc. 94.3% 5.5% 0.2% 74.7% 4.4% 0.2% 5.9%Huntington Bancshares Incorporated 60.5% 38.6% 0.9% 44.6% 28.5% 0.6% 13.8%Illinois Tool Works Inc. 94.3% 2.9% 2.8% 77.1% 2.3% 2.3% 8.3%
FIGURE 19> Management Proposal – Advisory Vote on Executive Compensation, Voting Results for the S&P 500 Index – 2012
As Percentage of Votes Cast As Percentage of Shares Outstanding
Company For Against Abstain For Against Abstain Non-Vote
Ingersoll-Rand Public Limited Company 81.0% 15.2% 3.8% 62.6% 11.7% 2.9% 6.2%Integrys Energy Group, Inc. 91.1% 6.2% 2.7% 52.3% 3.5% 1.6% 21.1%Intel Corporation 96.9% 2.7% 0.4% 58.9% 1.6% 0.3% 19.7%IntercontinentalExchange, Inc. 98.5% 1.3% 0.2% 78.8% 1.1% 0.2% 4.2%International Business Machines Corporation 95.3% 3.8% 0.9% 61.6% 2.4% 0.6% 15.4%International Flavors & Fragrances Inc. 94.0% 3.1% 2.9% 73.9% 2.5% 2.2% 4.4%International Game Technology 44.1% 55.3% 0.6% 34.2% 42.8% 0.5% 11.5%International Paper Company 97.1% 2.0% 0.9% 76.2% 1.6% 0.6% 11.2%Interpublic Group of Companies, Inc. 92.3% 6.4% 1.3% 74.8% 5.2% 1.1% 4.7%Intuit Inc. 92.6% 6.7% 0.7% 78.2% 5.7% 0.6% 5.8%Intuitive Surgical, Inc. 80.8% 19.0% 0.2% 65.1% 15.3% 0.1% 10.8%INVESCO Ltd. 96.3% 3.6% 0.1% 78.0% 2.9% 0.1% 4.3%Iron Mountain Incorporated 98.4% 1.5% 0.1% 84.5% 1.2% 0.1% 5.6%J.C. Penney Company, Inc. 56.9% 42.4% 0.7% 45.4% 33.8% 0.6% 7.0%Jabil Circuit, Inc. 93.1% 6.8% 0.1% 73.1% 5.3% 0.1% 12.4%Jacobs Engineering Group Inc. 96.2% 2.1% 1.7% 69.2% 1.5% 1.3% 12.8%Johnson & Johnson 55.4% 42.2% 2.4% 36.7% 27.9% 1.6% 15.8%Johnson Controls, Inc. 57.6% 41.3% 1.1% 45.6% 32.7% 0.9% 9.3%Joy Global Inc. 96.7% 2.9% 0.4% 73.3% 2.2% 0.2% 9.7%JPMorgan Chase & Co. 91.5% 7.2% 1.3% 66.6% 5.2% 0.9% 10.4%Juniper Networks, Inc. 66.8% 33.1% 0.1% 54.3% 26.9% 0.1% 6.8%Kellogg Company 96.8% 2.9% 0.3% 76.0% 2.2% 0.3% 8.7%KeyCorp 95.6% 4.0% 0.4% 73.1% 3.1% 0.3% 9.6%Kimberly-Clark Corporation 95.1% 4.2% 0.7% 64.1% 2.8% 0.5% 19.3%Kimco Realty Corporation 96.1% 2.4% 1.5% 80.6% 2.0% 1.3% 5.7%Kohl's Corporation 95.7% 4.0% 0.3% 79.1% 3.3% 0.3% 5.4%Kraft Foods Inc. 95.6% 3.6% 0.8% 67.2% 2.6% 0.6% 13.1%Kroger Co. 95.3% 4.3% 0.4% 74.9% 3.4% 0.3% 7.3%L-3 Communications Holdings, Inc. 89.9% 9.0% 1.1% 74.0% 7.4% 0.9% 9.0%Laboratory Corporation of America Holdings 72.2% 25.6% 2.2% 58.0% 20.6% 1.8% 6.5%Leggett & Platt, Incorporated 90.7% 8.8% 0.5% 66.2% 6.4% 0.4% 14.3%Lennar Corporation 83.5% 14.9% 1.6% 69.5% 12.4% 1.3% 9.4%Leucadia National Corporation 63.6% 35.6% 0.8% 51.9% 29.1% 0.6% 10.0%Lexmark International, Inc. 93.0% 6.1% 0.9% 74.9% 4.9% 0.7% 5.0%Life Technologies Corporation 76.0% 22.4% 1.6% 60.8% 17.9% 1.3% 7.2%Limited Brands, Inc. 92.5% 6.7% 0.8% 79.1% 5.7% 0.7% 6.3%Lincoln National Corporation 86.8% 12.6% 0.6% 66.2% 9.6% 0.5% 9.6%Lockheed Martin Corporation 64.4% 30.2% 5.4% 54.5% 25.5% 4.6% 7.6%Loews Corporation 98.1% 1.5% 0.4% 85.8% 1.3% 0.3% 5.9%Lorillard, Inc. 93.4% 6.1% 0.5% 79.8% 5.2% 0.5% 4.0%Lowe’s Companies, Inc. 95.5% 4.1% 0.4% 74.9% 3.2% 0.3% 11.5%LSI Corporation 81.6% 16.7% 1.7% 56.4% 11.6% 1.2% 13.9%M&T Bank Corporation 97.4% 1.6% 1.0% 75.6% 1.3% 0.7% 9.6%Macy's, Inc. 97.1% 1.9% 1.0% 78.7% 1.5% 0.8% 3.9%Marathon Oil Corporation 90.6% 8.7% 0.7% 66.7% 6.4% 0.5% 10.4%Marathon Petroleum Corporation 92.8% 6.6% 0.6% 70.4% 5.0% 0.5% 8.9%Marriott International, Inc. 87.3% 12.4% 0.3% 69.5% 9.8% 0.3% 8.1%Marsh & McLennan Companies, Inc. 79.8% 19.3% 0.9% 65.0% 15.7% 0.8% 6.4%Masco Corporation 94.8% 4.9% 0.3% 80.2% 4.1% 0.3% 5.7%MasterCard Incorporated 95.8% 3.2% 1.0% 79.3% 2.7% 0.9% 4.7%Mattel, Inc. 94.7% 4.9% 0.4% 78.5% 4.1% 0.3% 5.6%McDonald's Corporation 94.4% 5.1% 0.5% 63.5% 3.4% 0.4% 16.1%McGraw-Hill Companies, Inc. 97.1% 2.4% 0.5% 80.6% 2.0% 0.5% 5.3%Mead Johnson Nutrition Company 96.8% 1.7% 1.5% 80.2% 1.4% 1.2% 2.4%MeadWestvaco Corporation 91.2% 8.5% 0.3% 77.5% 7.3% 0.2% 5.6%Merck & Co., Inc. 96.5% 2.8% 0.7% 70.1% 2.0% 0.5% 12.1%MetLife, Inc. 97.2% 2.6% 0.2% 80.5% 2.2% 0.2% 4.0%Micron Technology, Inc. 90.8% 9.0% 0.2% 61.4% 6.1% 0.1% 16.7%Monsanto Company 84.7% 13.2% 2.1% 65.0% 10.1% 1.6% 7.7%Monster Beverage Corporation 97.5% 2.3% 0.2% 79.1% 1.8% 0.2% 6.1%Moody's Corporation 98.1% 1.8% 0.1% 84.4% 1.5% 0.1% 5.5%Morgan Stanley 94.0% 5.2% 0.8% 76.7% 4.3% 0.6% 7.7%

> 46
FIGURE 19> Management Proposal – Advisory Vote on Executive Compensation, Voting Results for the S&P 500 Index – 2012
As Percentage of Votes Cast As Percentage of Shares Outstanding
Company For Against Abstain For Against Abstain Non-Vote
Motorola Solutions, Inc. 58.5% 41.0% 0.5% 45.8% 32.1% 0.5% 8.6%Murphy Oil Corporation 95.9% 4.1% 0.0% 75.7% 3.2% 0.0% 5.2%Mylan Inc. 47.4% 51.6% 1.0% 34.5% 37.5% 0.7% 9.7%Nabors Industries Ltd. 25.0% 74.5% 0.5% 19.9% 59.2% 0.3% 7.9%NASDAQ OMX Group, Inc. 96.9% 3.0% 0.1% 62.2% 1.9% 0.1% 5.0%National Oilwell Varco, Inc. 96.0% 3.8% 0.2% 77.6% 3.1% 0.2% 5.6%Netflix, Inc. 95.5% 4.2% 0.3% 61.8% 2.7% 0.2% 18.3%Newell Rubbermaid Inc. 76.4% 23.3% 0.3% 60.6% 18.5% 0.2% 8.5%Newfield Exploration Company 86.8% 13.1% 0.1% 70.4% 10.6% 0.1% 7.3%Newmont Mining Corporation 94.6% 4.0% 1.4% 69.1% 2.9% 1.0% 7.6%NextEra Energy, Inc. 73.9% 24.7% 1.4% 50.2% 16.8% 1.0% 17.2%NiSource Inc. 94.7% 3.8% 1.5% 69.3% 2.8% 1.1% 9.9%Noble Corporation 52.7% 46.6% 0.7% 40.2% 35.6% 0.6% 7.5%Noble Energy, Inc. 90.9% 9.0% 0.1% 80.6% 7.9% 0.1% 3.8%Nordstrom, Inc. 98.7% 1.0% 0.3% 80.5% 0.8% 0.2% 8.2%Norfolk Southern Corporation 92.9% 6.3% 0.8% 62.5% 4.3% 0.5% 2.3%Northern Trust Corporation 75.3% 23.5% 1.2% 63.3% 19.7% 1.0% 5.0%Northrop Grumman Corporation 70.7% 28.8% 0.5% 56.1% 22.8% 0.4% 8.2%NRG Energy, Inc. 44.1% 54.1% 1.8% 36.3% 44.6% 1.5% 2.7%NVIDIA Corporation 96.2% 3.0% 0.8% 64.4% 2.0% 0.5% 15.0%NYSE Euronext 56.7% 42.8% 0.5% 38.3% 28.9% 0.3% 16.3%Occidental Petroleum Corporation 92.8% 6.7% 0.5% 75.1% 5.4% 0.4% 5.4%Omnicom Group Inc. 81.8% 17.8% 0.4% 67.2% 14.6% 0.3% 6.0%ONEOK, Inc. 94.4% 3.6% 2.0% 73.2% 2.8% 1.5% 11.8%O'Reilly Automotive, Inc. 93.9% 4.1% 2.0% 78.7% 3.4% 1.6% 6.9%Owens-Illinois, Inc. 97.0% 2.8% 0.2% 81.8% 2.3% 0.2% 4.8%Peabody Energy Corporation 96.4% 3.2% 0.4% 63.7% 2.1% 0.3% 12.6%People's United Financial, Inc. 94.3% 5.0% 0.7% 62.2% 3.3% 0.4% 16.9%Pepco Holdings, Inc. 89.2% 9.0% 1.8% 50.0% 5.0% 1.0% 21.3%PepsiCo, Inc. 92.1% 7.0% 0.9% 62.4% 4.7% 0.6% 14.9%PerkinElmer, Inc. 78.1% 16.6% 5.3% 63.5% 13.5% 4.4% 7.8%Pfizer Inc. 95.8% 3.3% 0.9% 67.3% 2.3% 0.7% 12.5%PG&E Corporation 80.0% 19.2% 0.8% 34.4% 8.2% 0.3% 5.7%Philip Morris International Inc. 96.5% 2.6% 0.9% 69.8% 1.9% 0.7% 15.0%Pinnacle West Capital Corporation 94.5% 4.3% 1.2% 67.6% 3.1% 0.8% 11.7%Pioneer Natural Resources Company 92.4% 3.1% 4.5% 76.0% 2.6% 3.7% 6.3%Pitney Bowes Inc. 34.8% 64.1% 1.1% 22.7% 41.9% 0.7% 19.2%Plum Creek Timber Company, Inc. 95.4% 3.6% 1.0% 57.5% 2.2% 0.6% 25.3%PNC Financial Services Group, Inc. 95.9% 3.4% 0.7% 75.1% 2.6% 0.5% 8.0%PPG Industries, Inc. 94.3% 5.3% 0.4% 63.7% 3.6% 0.3% 12.6%PPL Corporation 93.0% 6.0% 1.0% 73.1% 4.7% 0.8% 9.6%Praxair, Inc. 94.7% 4.7% 0.6% 77.5% 3.9% 0.4% 6.2%priceline.com Incorporated 97.3% 2.6% 0.1% 80.4% 2.1% 0.1% 4.3%Principal Financial Group, Inc. 92.9% 6.1% 1.0% 55.1% 3.6% 0.6% 5.9%Progressive Corporation 98.6% 0.9% 0.5% 84.3% 0.7% 0.4% 5.1%Prologis, Inc. 96.8% 3.1% 0.1% 84.3% 2.8% 0.0% 2.7%PRUDENTIAL FINANCIAL, INC. 95.0% 4.1% 0.9% 60.9% 2.6% 0.6% 6.0%Public Service Enterprise Group Incorporated 96.1% 2.6% 1.3% 69.6% 1.9% 0.9% 13.6%Public Storage 98.4% 0.6% 1.0% 84.1% 0.5% 0.8% 4.4%PulteGroup, Inc. 85.5% 14.2% 0.3% 67.2% 11.1% 0.2% 11.8%QEP Resources, Inc. 94.3% 3.4% 2.3% 74.0% 2.7% 1.8% 12.8%QUALCOMM Incorporated 68.5% 31.1% 0.4% 51.7% 23.5% 0.3% 11.9%Quanta Services, Inc. 97.8% 1.6% 0.6% 79.4% 1.3% 0.5% 4.9%Quest Diagnostics Incorporated 61.6% 35.4% 3.0% 50.8% 29.2% 2.5% 4.9%R.R. Donnelley & Sons Company 84.1% 15.2% 0.7% 63.5% 11.4% 0.6% 14.8%Range Resources Corporation 95.2% 3.7% 1.1% 80.2% 3.1% 1.0% 5.8%Raytheon Company 94.2% 4.7% 1.1% 75.3% 3.8% 0.8% 9.4%Regions Financial Corporation 95.2% 3.8% 1.0% 66.1% 2.6% 0.7% 15.3%Republic Services, Inc. 91.6% 7.0% 1.4% 79.2% 6.0% 1.3% 4.1%Reynolds American Inc. 98.6% 1.2% 0.2% 74.3% 0.9% 0.1% 7.9%Robert Half International Inc. 82.6% 15.1% 2.3% 67.6% 12.4% 1.8% 8.8%Rockwell Automation, Inc. 94.8% 3.4% 1.8% 66.1% 2.3% 1.3% 12.0%
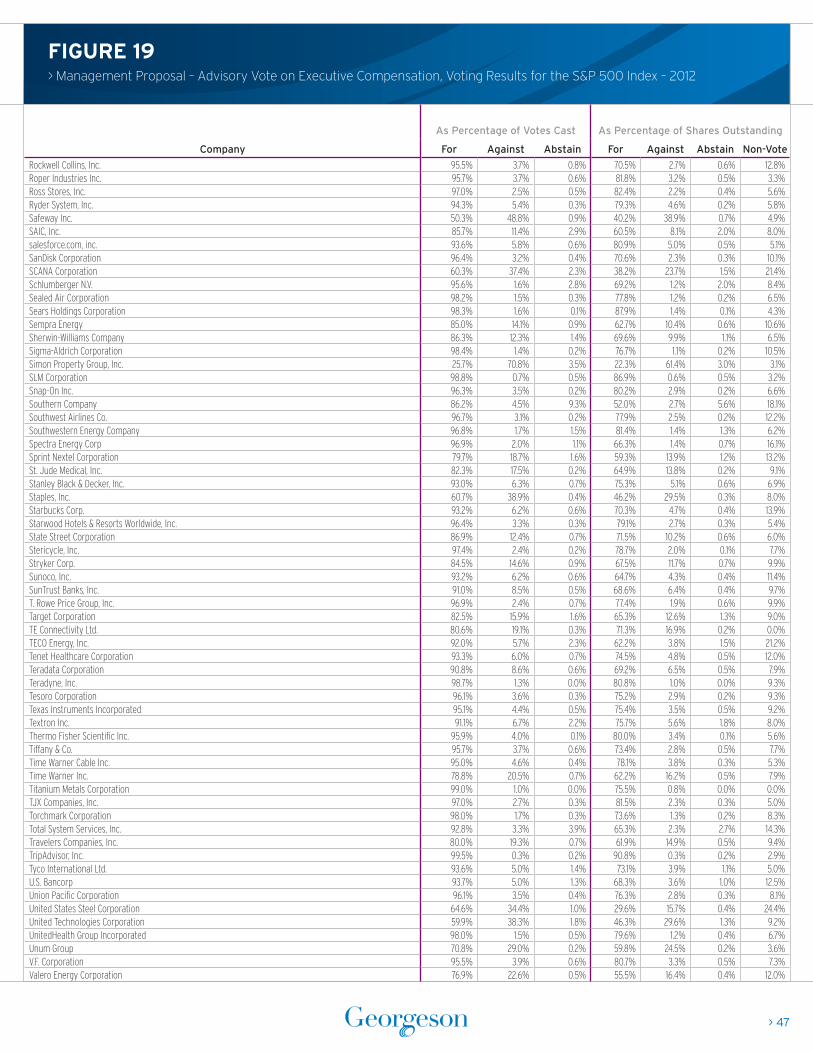
> 47
FIGURE 19> Management Proposal – Advisory Vote on Executive Compensation, Voting Results for the S&P 500 Index – 2012
As Percentage of Votes Cast As Percentage of Shares Outstanding
Company For Against Abstain For Against Abstain Non-Vote
Rockwell Collins, Inc. 95.5% 3.7% 0.8% 70.5% 2.7% 0.6% 12.8%Roper Industries Inc. 95.7% 3.7% 0.6% 81.8% 3.2% 0.5% 3.3%Ross Stores, Inc. 97.0% 2.5% 0.5% 82.4% 2.2% 0.4% 5.6%Ryder System, Inc. 94.3% 5.4% 0.3% 79.3% 4.6% 0.2% 5.8%Safeway Inc. 50.3% 48.8% 0.9% 40.2% 38.9% 0.7% 4.9%SAIC, Inc. 85.7% 11.4% 2.9% 60.5% 8.1% 2.0% 8.0%salesforce.com, inc. 93.6% 5.8% 0.6% 80.9% 5.0% 0.5% 5.1%SanDisk Corporation 96.4% 3.2% 0.4% 70.6% 2.3% 0.3% 10.1%SCANA Corporation 60.3% 37.4% 2.3% 38.2% 23.7% 1.5% 21.4%Schlumberger N.V. 95.6% 1.6% 2.8% 69.2% 1.2% 2.0% 8.4%Sealed Air Corporation 98.2% 1.5% 0.3% 77.8% 1.2% 0.2% 6.5%Sears Holdings Corporation 98.3% 1.6% 0.1% 87.9% 1.4% 0.1% 4.3%Sempra Energy 85.0% 14.1% 0.9% 62.7% 10.4% 0.6% 10.6%Sherwin-Williams Company 86.3% 12.3% 1.4% 69.6% 9.9% 1.1% 6.5%Sigma-Aldrich Corporation 98.4% 1.4% 0.2% 76.7% 1.1% 0.2% 10.5%Simon Property Group, Inc. 25.7% 70.8% 3.5% 22.3% 61.4% 3.0% 3.1%SLM Corporation 98.8% 0.7% 0.5% 86.9% 0.6% 0.5% 3.2%Snap-On Inc. 96.3% 3.5% 0.2% 80.2% 2.9% 0.2% 6.6%Southern Company 86.2% 4.5% 9.3% 52.0% 2.7% 5.6% 18.1%Southwest Airlines Co. 96.7% 3.1% 0.2% 77.9% 2.5% 0.2% 12.2%Southwestern Energy Company 96.8% 1.7% 1.5% 81.4% 1.4% 1.3% 6.2%Spectra Energy Corp 96.9% 2.0% 1.1% 66.3% 1.4% 0.7% 16.1%Sprint Nextel Corporation 79.7% 18.7% 1.6% 59.3% 13.9% 1.2% 13.2%St. Jude Medical, Inc. 82.3% 17.5% 0.2% 64.9% 13.8% 0.2% 9.1%Stanley Black & Decker, Inc. 93.0% 6.3% 0.7% 75.3% 5.1% 0.6% 6.9%Staples, Inc. 60.7% 38.9% 0.4% 46.2% 29.5% 0.3% 8.0%Starbucks Corp. 93.2% 6.2% 0.6% 70.3% 4.7% 0.4% 13.9%Starwood Hotels & Resorts Worldwide, Inc. 96.4% 3.3% 0.3% 79.1% 2.7% 0.3% 5.4%State Street Corporation 86.9% 12.4% 0.7% 71.5% 10.2% 0.6% 6.0%Stericycle, Inc. 97.4% 2.4% 0.2% 78.7% 2.0% 0.1% 7.7%Stryker Corp. 84.5% 14.6% 0.9% 67.5% 11.7% 0.7% 9.9%Sunoco, Inc. 93.2% 6.2% 0.6% 64.7% 4.3% 0.4% 11.4%SunTrust Banks, Inc. 91.0% 8.5% 0.5% 68.6% 6.4% 0.4% 9.7%T. Rowe Price Group, Inc. 96.9% 2.4% 0.7% 77.4% 1.9% 0.6% 9.9%Target Corporation 82.5% 15.9% 1.6% 65.3% 12.6% 1.3% 9.0%TE Connectivity Ltd. 80.6% 19.1% 0.3% 71.3% 16.9% 0.2% 0.0%TECO Energy, Inc. 92.0% 5.7% 2.3% 62.2% 3.8% 1.5% 21.2%Tenet Healthcare Corporation 93.3% 6.0% 0.7% 74.5% 4.8% 0.5% 12.0%Teradata Corporation 90.8% 8.6% 0.6% 69.2% 6.5% 0.5% 7.9%Teradyne, Inc. 98.7% 1.3% 0.0% 80.8% 1.0% 0.0% 9.3%Tesoro Corporation 96.1% 3.6% 0.3% 75.2% 2.9% 0.2% 9.3%Texas Instruments Incorporated 95.1% 4.4% 0.5% 75.4% 3.5% 0.5% 9.2%Textron Inc. 91.1% 6.7% 2.2% 75.7% 5.6% 1.8% 8.0%Thermo Fisher Scientific Inc. 95.9% 4.0% 0.1% 80.0% 3.4% 0.1% 5.6%Tiffany & Co. 95.7% 3.7% 0.6% 73.4% 2.8% 0.5% 7.7%Time Warner Cable Inc. 95.0% 4.6% 0.4% 78.1% 3.8% 0.3% 5.3%Time Warner Inc. 78.8% 20.5% 0.7% 62.2% 16.2% 0.5% 7.9%Titanium Metals Corporation 99.0% 1.0% 0.0% 75.5% 0.8% 0.0% 0.0%TJX Companies, Inc. 97.0% 2.7% 0.3% 81.5% 2.3% 0.3% 5.0%Torchmark Corporation 98.0% 1.7% 0.3% 73.6% 1.3% 0.2% 8.3%Total System Services, Inc. 92.8% 3.3% 3.9% 65.3% 2.3% 2.7% 14.3%Travelers Companies, Inc. 80.0% 19.3% 0.7% 61.9% 14.9% 0.5% 9.4%TripAdvisor, Inc. 99.5% 0.3% 0.2% 90.8% 0.3% 0.2% 2.9%Tyco International Ltd. 93.6% 5.0% 1.4% 73.1% 3.9% 1.1% 5.0%U.S. Bancorp 93.7% 5.0% 1.3% 68.3% 3.6% 1.0% 12.5%Union Pacific Corporation 96.1% 3.5% 0.4% 76.3% 2.8% 0.3% 8.1%United States Steel Corporation 64.6% 34.4% 1.0% 29.6% 15.7% 0.4% 24.4%United Technologies Corporation 59.9% 38.3% 1.8% 46.3% 29.6% 1.3% 9.2%UnitedHealth Group Incorporated 98.0% 1.5% 0.5% 79.6% 1.2% 0.4% 6.7%Unum Group 70.8% 29.0% 0.2% 59.8% 24.5% 0.2% 3.6%V.F. Corporation 95.5% 3.9% 0.6% 80.7% 3.3% 0.5% 7.3%Valero Energy Corporation 76.9% 22.6% 0.5% 55.5% 16.4% 0.4% 12.0%

> 48
FIGURE 19> Management Proposal – Advisory Vote on Executive Compensation, Voting Results for the S&P 500 Index – 2012
As Percentage of Votes Cast As Percentage of Shares Outstanding
Company For Against Abstain For Against Abstain Non-Vote
Varian Medical Systems, Inc. 91.5% 3.9% 4.6% 68.6% 2.9% 3.4% 8.2%Ventas, Inc. 65.2% 32.8% 2.0% 56.2% 28.3% 1.7% 4.2%VeriSign Inc. 98.8% 1.2% 0.0% 83.3% 1.0% 0.0% 5.7%Verizon Communications Inc. 85.6% 13.0% 1.4% 53.9% 8.2% 0.9% 21.2%Visa Inc. 98.3% 1.1% 0.6% 70.2% 0.8% 0.4% 8.1%Vornado Realty Trust 96.0% 3.9% 0.1% 81.5% 3.3% 0.1% 4.9%Vulcan Materials Company 93.5% 5.9% 0.6% 78.4% 4.9% 0.6% 0.0%W.W. Grainger, Inc. 96.7% 2.6% 0.7% 82.5% 2.2% 0.6% 5.4%Walgreen Co. 93.4% 5.4% 1.2% 60.5% 3.5% 0.8% 17.0%Wal-Mart Stores, Inc. 98.6% 1.1% 0.3% 83.6% 1.0% 0.2% 6.8%Walt Disney Company 56.6% 42.8% 0.6% 41.9% 31.7% 0.4% 11.3%Washington Post Company 100.0% 0.0% 0.0% 100.0% 0.0% 0.0% 0.0%Waste Management, Inc. 96.1% 3.0% 0.9% 71.5% 2.2% 0.7% 14.8%Waters Corporation 94.2% 3.3% 2.5% 79.3% 2.8% 2.0% 4.3%Watson Pharmaceuticals, Inc. 93.7% 5.9% 0.4% 69.7% 4.4% 0.3% 9.4%WellPoint, Inc. 96.1% 3.2% 0.7% 75.1% 2.5% 0.5% 5.8%Wells Fargo & Company 96.0% 3.4% 0.6% 73.9% 2.6% 0.5% 9.1%Western Union Company 98.3% 1.6% 0.1% 81.3% 1.3% 0.1% 5.3%Weyerhaeuser Company 97.0% 2.6% 0.4% 75.6% 2.0% 0.3% 9.7%Whirlpool Corporation 86.9% 12.6% 0.5% 65.4% 9.5% 0.3% 10.9%Whole Foods Market, Inc. 92.6% 7.0% 0.4% 68.3% 5.2% 0.3% 11.4%Williams Companies, Inc. 98.6% 1.2% 0.2% 71.3% 0.8% 0.2% 12.1%Windstream Corporation 92.2% 6.8% 1.0% 47.0% 3.5% 0.5% 35.7%Wisconsin Energy Corporation 88.6% 9.7% 1.7% 66.0% 7.2% 1.3% 10.9%Wyndham Worldwide Corporation 97.4% 1.8% 0.8% 83.2% 1.6% 0.7% 6.7%Xcel Energy Inc. 92.0% 6.9% 1.1% 63.4% 4.7% 0.8% 15.3%Xerox Corporation 95.0% 4.8% 0.2% 74.4% 3.7% 0.2% 10.2%XL Group plc 98.4% 1.6% 0.0% 82.9% 1.3% 0.0% 3.5%Xylem Inc. 93.3% 3.0% 3.7% 70.9% 2.3% 2.8% 8.3%Yum! Brands, Inc. 70.3% 29.0% 0.7% 50.8% 20.9% 0.5% 12.6%Zimmer Holdings Inc. 93.5% 5.8% 0.7% 69.2% 4.3% 0.5% 10.1%Zions Bancorporation 97.7% 2.3% 0.0% 71.5% 1.7% 0.0% 11.0%

PART 5> Management Proposal — Repeal Classified Board

> 50
FIGURE 20> Management Proposal – Repeal Classified Board – 2003 to 2012
23
37
32
46
35
43
29
45
2003 2004 2005 2006 2007 2008 2009 2010
36 41
2011 2012
0
10
20
30
40
50
Nu
mb
er o
f P
rop
osa
ls

> 51
FIGURE 21> Management Proposal – Repeal Classified Board, Voting Results – 2012
As Percentage of Votes Cast As Percentage of Shares Outstanding
Company Vote RequirementMgmt. Rec.
For Against Abstain For Against Abstain Non-Vote
Accenture plc 75% of shares cast For 99.3% 0.3% 0.4% 83.3% 0.3% 0.3% 0.0%
Alcoa Inc. 80% of outstanding shares For 96.9% 2.5% 0.6% 47.6% 1.2% 0.3% 25.6%
Amphenol Corporation 80% of outstanding shares For 99.9% 0.1% 0.0% 90.3% 0.0% 0.0% 2.5%
BlackRock, Inc. Majority of outstanding shares For 99.8% 0.1% 0.1% 83.2% 0.1% 0.0% 6.7%
C.H. Robinson Worldwide, Inc. Two-thirds of outstanding shares For 99.4% 0.4% 0.2% 71.6% 0.3% 0.1% 14.3%
C.R. Bard, Inc. 75% of outstanding shares For 99.5% 0.3% 0.2% 82.9% 0.2% 0.2% 6.3%
Cabot Oil & Gas Corporation Majority of outstanding shares For 99.8% 0.1% 0.1% 85.6% 0.1% 0.1% 4.4%
Cameron International Corporation 80% of outstanding shares For 98.6% 0.9% 0.5% 86.6% 0.8% 0.5% 2.9%
CenturyLink, Inc. Majority of outstanding shares For 98.6% 1.1% 0.3% 67.3% 0.8% 0.2% 20.1%
Charles Schwab Corporation 80% of outstanding shares For 81.4% 18.5% 0.1% 68.7% 15.6% 0.1% 8.0%
Cigna Corporation 80% of outstanding shares None 95.1% 1.3% 3.6% 72.0% 1.0% 2.8% 9.3%
CME Group Inc. Two-thirds of outstanding shares For 98.9% 0.7% 0.4% 69.7% 0.5% 0.2% 12.4%
Coventry Health Care, Inc. 75% of outstanding shares For 99.0% 0.8% 0.2% 86.1% 0.7% 0.1% 4.2%
Dean Foods Company Majority of outstanding shares For 99.1% 0.7% 0.2% 80.5% 0.6% 0.2% 10.4%
Dr Pepper Snapple Group, Inc. Two-thirds of outstanding shares For 99.7% 0.1% 0.2% 80.9% 0.1% 0.1% 3.4%
E*TRADE Financial Corporation Two-thirds of outstanding shares For 96.4% 0.5% 3.1% 70.0% 0.4% 2.2% 13.8%
eBay Inc. Majority of outstanding shares For 99.9% 0.1% 0.0% 82.2% 0.1% 0.0% 5.7%
Eli Lilly and Company 80% of outstanding shares For 83.3% 16.2% 0.5% 62.8% 12.2% 0.3% 11.9%
Fidelity National Information Services, Inc. Majority of outstanding shares For 98.7% 0.7% 0.6% 79.5% 0.6% 0.4% 8.2%
Fiserv, Inc. Majority of votes cast For 98.9% 0.5% 0.6% 78.7% 0.4% 0.5% 9.6%
Flowserve Corporation Majority of outstanding shares For 99.8% 0.2% 0.0% 83.7% 0.2% 0.0% 6.0%
FMC Technologies, Inc. 80% of outstanding shares For 99.8% 0.1% 0.1% 85.1% 0.1% 0.1% 3.4%
Helmerich & Payne, Inc. Majority of outstanding shares For 99.7% 0.2% 0.1% 82.3% 0.1% 0.1% 5.7%
Hospira, Inc. Majority of outstanding shares For 99.4% 0.4% 0.2% 82.1% 0.3% 0.2% 6.3%
Hudson City Bancorp, Inc. Majority of outstanding shares For 97.1% 2.0% 0.9% 70.6% 1.5% 0.6% 13.2%
Intuitive Surgical, Inc. Two-thirds of outstanding shares For 99.7% 0.2% 0.1% 91.0% 0.2% 0.1% 0.0%
Juniper Networks, Inc. Two-thirds of outstanding shares For 99.6% 0.3% 0.1% 81.0% 0.2% 0.1% 6.8%
McDonald's Corporation Majority of outstanding shares For 98.8% 0.9% 0.3% 66.5% 0.6% 0.3% 16.1%
Nabors Industries Ltd. Majority of outstanding shares For 94.7% 5.1% 0.2% 75.2% 4.0% 0.2% 7.9%
Newell Rubbermaid Inc. Majority of outstanding shares For 99.7% 0.3% 0.0% 79.1% 0.2% 0.1% 8.5%
NRG Energy, Inc. Two-thirds of outstanding shares For 98.4% 1.6% 0.0% 81.2% 1.3% 0.0% 2.7%
Owens-Illinois, Inc. 80% of outstanding shares For 99.3% 0.6% 0.1% 83.8% 0.5% 0.1% 4.8%
Pioneer Natural Resources Company Two-thirds of outstanding shares For 99.5% 0.5% 0.0% 81.9% 0.3% 0.0% 6.3%
PPG Industries, Inc. 80% of outstanding shares For 99.4% 0.4% 0.2% 67.1% 0.3% 0.1% 12.6%
Progressive Corporation 75% of outstanding shares For 99.8% 0.2% 0.0% 85.3% 0.1% 0.0% 5.1%
St. Jude Medical, Inc. 80% of outstanding shares For 98.8% 1.1% 0.1% 77.8% 0.9% 0.1% 9.1%
Stanley Black & Decker, Inc. Majority of votes cast For 98.3% 1.1% 0.6% 79.6% 0.9% 0.5% 6.9%
TECO Energy, Inc. Majority of votes cast For 97.8% 1.4% 0.8% 66.1% 0.9% 0.6% 21.2%
Teradata Corporation 80% of outstanding shares For 99.6% 0.3% 0.1% 75.9% 0.2% 0.1% 7.9%
Western Union Company Majority of outstanding shares For 99.8% 0.1% 0.1% 82.5% 0.1% 0.1% 5.3%
Wyndham Worldwide Corporation 80% of outstanding shares For 100.0% 0.0% 0.0% 85.4% 0.0% 0.0% 6.7%

This page intentionally left blank.

PART 6> Proxy Contests

> 54
FIGURE 22> Contested Solicitation Trend – 1981 to 2012
Company Dissident Contested Issues Winner
AOL Inc. Starboard Value and Opportunity Master Fund Ltd Directors Management
BMC Software, Inc. Elliot Associates Directors Settled
Cardinal Bankshares Corporation Schaller Equity Partners Directors Dissident
ChinaCast Education Corporation Ned Sherwood et al Directors Dissident
Commercial Metals Company Carl C. Icahn and affiliated entities Directors; Redeem poison pill Withdrawn
Comverse Technology, Inc. Cadian Capital Management, LLC Directors Settled
Cross Border Resources, Inc.Red Mountain Resources, Inc. a wholly owned subsidiary, Black Rock Capital, Inc.
Consent to fix and increase size of the board; Directors Settled
Cryo-Cell International, Inc. Ki Yong Choi Directors; Against 2012 incentive plan Management
First Financial Northwest, Inc. Joseph Stilwell Director; Against say-on-pay proposal Management
Forest Laboratories, Inc. Carl C. Icahn and affiliated entities Directors Split
Greektown Superholdings, Inc. Brigade Leveraged Capital Structures Fund Ltd. Director Management
Harvard Illinois Bancorp, Inc. Joseph Stilwell Director Management
Illumina, Inc. CKH Acquisition Corporation, an indirect wholly owned subsidiary of Roche Holding Ltd.
Directors Management
Imperial Holdings, Inc. Bulldog Investors General Partnership Increase size of the board; Directors Settled
InfuSystem Holdings, Inc. Concerned InfuSystem Stockholders Consent to call a special meeting Dissident
ITEX Corporation Polonitza Group Directors Management
Macquarie Global Infrastructure Total Return Fund Inc. Western Investment LLC Director None
Microwave Filter Company, Inc. Furlong Financial, LLC Directors Withdrawn
ModusLink Global Solutions, Inc. Peerless Systems Corporation Directors Split
Myers Industries, Inc. GAMCO Asset Management Inc. Directors; Against say-on-pay proposal Management
Nabi Biopharmaceuticals The Mangrove Partners Fund, L.P. Vote against transaction proposals at the special meeting Withdrawn
Onvia, Inc. Symphony Technology Group Directors Management
Oshkosh Corporation Carl C. Icahn and affiliated entities Directors Management
PIMCO Income Strategy Fund and PIMCO Income Strategy Fund II Brigade Capital Management, LLC Director Pending
FIGURE 23> Contested Solicitations – 2012*
Contested Solicitations 5-Year Moving Average
28
198
1
26
198
2
24
198
3
198
420
198
531
198
628
198
721
198
836
198
941
199
035
199
122
199
216 3
199
3
199
419
199
519
199
628
199
729
199
820
199
930
200
030
200
140
200
238
200
337
200
428
200
523
200
631
200
746
200
856
200
957
2010
35
2011
20
2012
34N
um
ber
of C
on
test
ed S
olic
itatio
ns
0
10
20
30
40
50
60

> 55
FIGURE 23> Contested Solicitations – 2012*
Other Activist Campaigns, 2012**
Company Dissident Contested Issues
3M Company Trillium Asset Management, LLC Vote for shareholder proposal
Allscripts Healthcare Solutions, Inc. HealthCor Management, L.P. Vote against director
Ameren Corporation As You Sow Vote for shareholder proposal
Apple Inc. CalPERS Vote for shareholder proposal
Aqua America, Inc. NorthStar Asset Management, Inc. Vote for shareholder proposal
AT&T Inc. Trillium Asset Management, LLC Vote for shareholder proposal
Bank of America Corporation Trillium Asset Management, LLC Vote for shareholder proposal
Bank of New York Mellon Corporation CtW Investment Group Vote for shareholder proposal
Cabot Oil & Gas Company Miller/Howard Investments, Inc. Vote for shareholder proposal
CenturyLink, Inc. Association of US West Retirees Vote for shareholder proposal
Charles Schwab Corporation Norges Bank Vote for shareholder proposal
Chervron Corporation Green Century Capital Management Vote for shareholder proposal
Chesapeake Energy Corp. CalPERS Vote for shareholder proposal
Chesapeake Energy Corp. New York City Pension Funds Vote against directors
Chevron Corporation LongView Vote for shareholder proposal
Chubb Corporation NorthStar Asset Management Vote for shareholder proposal
Cigna Corporation CtW Investment Group Vote against management proposal
CME Group, Inc. Norges Bank Vote for shareholder proposal
Corrections Corporation of America Human Rights Defense Center Vote for shareholder proposal
Domino’s Pizza, Inc. Humane Society Vote for shareholder proposal
Duke Energy Corporation As You Sow Vote for shareholder proposal
Ecolab Inc. NorthStar Asset Management, Inc. Vote for shareholder proposal
Exxon Mobil Corporation As You Sow Vote for shareholder proposal
Fossil, Inc. Calvert Investment Management, Inc. Vote for shareholder proposal
Gentex Corporation Walden Asset Management Vote for shareholder proposal
Google, Inc. NorthStar Asset Management, Inc. Vote for shareholder proposal
Graco Inc. CalPERS Vote for shareholder proposal
Health Management Associates, Inc. CtW Investment Group Vote against director
Home Depot, Inc. NorthStar Asset Management, Inc. Vote for shareholder proposal
Hospitality Properties Trust CalPERS Vote for shareholder proposal
Hospitality Properties Trust CalPERS Vote against directors
Company Dissident Contested Issues Winner
Power REIT Paul M. Dorsey Directors Management
Progress Software Corporation Starboard Value and Opportunity Master Fund Ltd Directors Withdrawn
Quality Systems, Inc. Ahmed D. Hussein Directors Split
Qualstar Corporation BKF Capital Group, Inc. Remove Directors; Elect Directors Management
Sigma Designs, Inc. Potomac Capital Partners III, L.P. Directors Settled
Signature Group Holdings, Inc. James A. McIntyreDirectors; Against increase in authorized common; Against 2006 Performance Incentive Plan
Management
Sorrento Therapeutics, Inc. Ernst-Günter Afting, Ph.D., M.D. Directors Dissident
USA Technologies, Inc. S.A.V.E. Partners IV, LLC Directors Management
Vulcan Materials Company Martin Marietta Materials, Inc. Directors Withdrawn
Wet Seal, Inc. Clinton Group, Inc. Consent to remove directors; Elect Directors Dissident

> 56
FIGURE 23> Contested Solicitations – 2012*
* Contested Solicitations are defined as campaigns where dissidents distribute a separate proxy card. Also, only solicitation where materials were filed under Section 14 of the United States Securities Exchange Act of 1934 were included, so that the proxy fights in foreign jurisdictions were excluded.
** Other activist campaigns include publicized disputes where persons attempted to influence the results of a proxy solicitation without distributing opposition proxy material
Company Dissident Contested Issues
Intel Corporation NorthStar Asset Management, Inc. Vote for shareholder proposal
Nabors Industries Ltd. CalPERS Vote for shareholder proposal
Nabors Industries Ltd. New York City Pension Funds Vote for shareholder proposal
New York Community Bancorp Inc. CalPERS Vote for shareholder proposal
Praxair, Inc. NorthStar Asset Management, Inc. Vote for shareholder proposal
Procter & Gamble Company NorthStar Asset Management, Inc. Vote for shareholder proposal
Rowan Companies Inc. C.R. Palmer Vote against management proposal
Seaboard Corporation Humane Society Vote for shareholder proposal
Sotheby's CtW Investment Group Vote against directors
Southern Company Green Century Capital Management Vote for shareholder proposal
Staples, Inc. Norges Bank Vote for shareholder proposal
Target Corporation Green Century Capital Management Vote for shareholder proposal
Ultra Petroleum As You Sow Vote for shareholder proposal
United Rentals, Inc. LongView Vote for shareholder proposal
Verizon Communications, Inc. Association of BellTel Retirees Inc. Vote against management proposal and for shareholder proposal
Verizon Communications, Inc. Trillium Asset Management, LLC Vote for shareholder proposal
Wal-Mart Stores, Inc. New York City Pension Funds Vote against directors
Wal-Mart Stores, Inc. UAW Vote for shareholder proposal
WellPoint Inc. CtW Investment Group Vote against directors
Wells Fargo & Co. Norges Bank Vote for shareholder proposal
Western Union Company Norges Bank Vote for shareholder proposal
Western Union Company NorthStar Asset Management, Inc. Vote for shareholder proposal


ANNUAL CORPORATEGOVERNANCE REVIEW
> Annual Meetings> Shareholder Initiatives
> Proxy Contests
2012