Geophysical modeling of Valle de Banderas graben and its ...
15
184 Geophysical modeling of Valle de Banderas graben and its structural relation to Bahía de Banderas, Mexico Jorge A. Arzate 1,* , Román Álvarez 2 , Vsevolod Yutsis 3 , Jesús Pacheco 1 , and Héctor López-Loera 4 1 Centro de Geociencias, Universidad Nacional Autónoma de México, Campus Juriquilla, 76230 Querétaro, Qro., Mexico 2 Instituto de Investigaciones en Matemáticas Aplicadas y en Sistemas (IIMAS), Universidad Nacional Autónoma de México, Circuito Escolar, Ciudad Universitaria, Del. Coyoacán, 04510, México D.F., Mexico 3 Universidad Autónoma de Nuevo León, Facultad de Ciencias de la Tierra, Ex Hacienda de Guadalupe, Carr. a Cerro Prieto Km. 8, Linares N.L., Mexico 4 Instituto Potosino de Investigaciones en Ciencia y Tecnología, Camino a la Presa San José 2055 Col. Lomas 4a sección, 78216 San Luis Potosí, S.L.P., Mexico * [email protected] ABSTRACT A gravimetric survey consisting of five lines and 483 stations, as well as a magnetotelluric (MT) survey consisting of 17 observation sites, were made in the Valle de Banderas region for the determination of the structural characteristics of the valley. Additionally, data from a previous aeromagnetic survey were analyzed to correlate them with our geophysical measurements. The gravimetric and MT models confirm that the valley corresponds to a graben structure with slumped blocks that vary from ~2000 m deep close to Bahía de Banderas to shallow burial depths (~100 m) toward the NE end of the valley. Faults flanking the valley, inferred from the gravity and magnetic models, trend toward offshore faults in Bahía de Banderas, indicating a structural connection between land and sea. From the MT measurements we conclude that a 2-D resistivity behavior is observed within the graben whereas outside of the graben the behavior is 1-D, in spite of the rough topography of this region. Our gravimetric models also indicate the occurrence of basin-like structures within the graben, coinciding with similar structures reported offshore in the Bahía de Banderas, suggesting that such structures may be typical erosional features of the graben. The aeromagnetic analysis correlates with the gravimetric and MT models, and suggests that the graben structure is an extensional zone on granitic crust; it also indicates that the extensional zone continues to the NE, beyond the topographic limits of Valle de Banderas on land and towards Bahía de Banderas seawards. We propose that this region belongs to the same tectonic structure in spite of an approximate change in orientation of 30° between the bay and the valley, and strengthen the idea that this graben constitutes part of the NW limit of the Jalisco Block. A tectonic model for the region is presented at various stages, from around 100–75 Ma to the Present. We propose that initiation of the Bahía de Banderas structure started at ~14 Ma along an E-W trend, and that at ~5 Ma the graben axis was reoriented to a SW-NE direction, that induced the formation of Valle de Banderas. Key words: geophysical modeling, gravity, magnetotellurics, Valle de Banderas, Jalisco Block, Mexico. RESUMEN Un levantamiento gravimétrico que incluye 483 estaciones distribuidas en 5 líneas, así como un levantamiento magnetotelúrico (MT) que incluye 17 sondeos se efectuaron en la región del Valle de Banderas con el propósito de determinar las características estructurales del valle. Además, se Revista Mexicana de Ciencias Geológicas, v. 23, núm. 2, 2006, p. 184-198
Transcript of Geophysical modeling of Valle de Banderas graben and its ...
Arzate et al.184
Geophysical modeling of Valle de Banderas graben and its structural relation to Bahía de Banderas, Mexico
Jorge A. Arzate1,*, Román Álvarez2, Vsevolod Yutsis3, Jesús Pacheco1, and Héctor López-Loera4
1Centro de Geociencias, Universidad Nacional Autónoma de México, Campus Juriquilla, 76230 Querétaro, Qro., Mexico 2Instituto de Investigaciones en Matemáticas Aplicadas y en Sistemas (IIMAS), Universidad Nacional Autónoma de México,
Circuito Escolar, Ciudad Universitaria, Del. Coyoacán, 04510, México D.F., Mexico 3Universidad Autónoma de Nuevo León, Facultad de Ciencias de la Tierra,
Ex Hacienda de Guadalupe, Carr. a Cerro Prieto Km. 8, Linares N.L., Mexico4Instituto Potosino de Investigaciones en Ciencia y Tecnología, Camino a la Presa San José 2055
Col. Lomas 4a sección, 78216 San Luis Potosí, S.L.P., Mexico * [email protected]
ABSTRACT
A gravimetric survey consisting of fi ve lines and 483 stations, as well as a magnetotelluric (MT) survey consisting of 17 observation sites, were made in the Valle de Banderas region for the determination of the structural characteristics of the valley. Additionally, data from a previous aeromagnetic survey were analyzed to correlate them with our geophysical measurements. The gravimetric and MT models confi rm that the valley corresponds to a graben structure with slumped blocks that vary from ~2000 m deep close to Bahía de Banderas to shallow burial depths (~100 m) toward the NE end of the valley. Faults fl anking the valley, inferred from the gravity and magnetic models, trend toward offshore faults in Bahía de Banderas, indicating a structural connection between land and sea. From the MT measurements we conclude that a 2-D resistivity behavior is observed within the graben whereas outside of the graben the behavior is 1-D, in spite of the rough topography of this region. Our gravimetric models also indicate the occurrence of basin-like structures within the graben, coinciding with similar structures reported offshore in the Bahía de Banderas, suggesting that such structures may be typical erosional features of the graben. The aeromagnetic analysis correlates with the gravimetric and MT models, and suggests that the graben structure is an extensional zone on granitic crust; it also indicates that the extensional zone continues to the NE, beyond the topographic limits of Valle de Banderas on land and towards Bahía de Banderas seawards. We propose that this region belongs to the same tectonic structure in spite of an approximate change in orientation of 30° between the bay and the valley, and strengthen the idea that this graben constitutes part of the NW limit of the Jalisco Block. A tectonic model for the region is presented at various stages, from around 100–75 Ma to the Present. We propose that initiation of the Bahía de Banderas structure started at ~14 Ma along an E-W trend, and that at ~5 Ma the graben axis was reoriented to a SW-NE direction, that induced the formation of Valle de Banderas.
Key words: geophysical modeling, gravity, magnetotellurics, Valle de Banderas, Jalisco Block, Mexico.
RESUMEN
Un levantamiento gravimétrico que incluye 483 estaciones distribuidas en 5 líneas, así como un levantamiento magnetotelúrico (MT) que incluye 17 sondeos se efectuaron en la región del Valle de Banderas con el propósito de determinar las características estructurales del valle. Además, se
Revista Mexicana de Ciencias Geológicas, v. 23, núm. 2, 2006, p. 184-198

Geophysical modeling of Valle de Banderas graben 185
INTRODUCTION
The limits between the Jalisco Block (JB) in western Mexico and the North American (NAM) plate are graben structures (Figure 1); to the northeast, the JB is bounded by the Tepic-Zacoalco graben (Luhr et al., 1985; Ferrari et al., 1994), and to the east by the Colima graben (Allan, 1986; Bandy et al., 1995). The northwestern limit of the Jalisco Block may also be a graben; Johnson and Harrison (1990) proposed that a major branching of the Tepic-Zacoalco graben, 90 km in length, trending W-SW along the Río Ameca, starting south of Volcán Ceboruco and ending in Valle de Banderas, in the limits between Jalisco and Nayarit states, could represent such a boundary. Using new and available echo sounding data, Alvarez (2002) constructed a digital elevation model of Bahía de Banderas, which is the offshore continuation of Valle de Banderas, and suggested that this region is also a graben and that together with the above structure represents a 150 km long graben that may constitute the northwestern limit of the JB. More recently Álvarez-Béjar (2005) suggested that the faults defi ning Bahía de Banderas canyon extend down to the trench, near the north end of the Middle American Trench (MAT), in a way similar to that observed in the Colima graben, in which its offshore continuation, the Manzanillo graben, extends beyond the MAT, ending in El Gordo graben (Bourgois et al., 1988; Khutorskoy et al., 1994). The southwestern limit of the JB may consist of a fault, the Barra de Navidad fault proposed by Bourgois et al. (1988), that extends from the Tres Marías Escarpment (TME) to El Gordo graben
(EGG) running subparallel to, and crossing the MAT in that region.
The bathymetry of Bahía de Banderas was reconstruct-ed with depth echo soundings that led to a digital terrain model of the area. In Bahía de Banderas, a series of closed depressions, or basins, were observed within the graben (Alvarez, 2002; Álvarez-Béjar, 2004) (see Figure 2). Up to now it was not known whether similar structures extended under the sedimentary fi lling. Another intriguing question is the change in trend between the bay’s main structure and the valley’s graben, which is of about 30°. To help clarify these questions, in this work we build cross-sectional models of the valley’s sediment thicknesses based on gravimetric and magnetotelluric surveys, supported by the analysis of an aeromagnetic survey of the area.
GEOLOGICAL BACKGROUND
The opening of Bahía de Banderas has been associ-ated with the separation of Baja California from mainland Mexico in the middle Miocene (Lyle and Ness, 1991). Ferrari and Rosas-Elguera (2000) placed the origin of the Valle de Banderas graben in late-Miocene to early-Pliocene times, and associated it with the same extensional tectonic framework of the Tepic-Zacoalco graben zone. Álvarez-Béjar (2005) suggested that the change in canyon’s direction was associated with a regional tectonic episode occurring ~5 Ma. Bönhel et al. (1992) showed that the age and the isotopic composition of the Los Cabos and the Puerto
analizaron los datos aeromagnéticos existentes de la zona y se correlacionaron con los datos geofísicos medidos. Los modelos gravimétricos y de MT obtenidos a partir de ellos confi rman que, en general, el valle corresponde a una estructura de graben, con bloques caídos, cuyas profundidades varían desde aproximadamente 2000 m cerca de la costa hasta unos 100 m, en el extremo NE del valle. Las fallas que limitan el valle, inferidas a partir de los modelos gravimétricos y los datos magnéticos, se pueden conectar con fallas ubicadas en el mar, indicando una conexión estructural entre la bahía y el valle de Banderas. A partir de las mediciones MT se deduce que dentro del graben prevalece una estructura de resistividad 2-D, en tanto que fuera del graben se observa un comportamiento 1-D a pesar del carácter montañoso de la región. Los modelos gravimétricos sugieren la ocurrencia de subcuencas dentro del graben, entendidas como hundimientos locales rellenos de sedimentos, que coinciden morfológicamente con estructuras similares reportadas anteriormente en la bahía, indicando que éstas pueden ser un rasgo erosivo típico del graben. El análisis aeromagnético se correlaciona con los modelos gravimétricos y MT y sugiere que la estructura del graben es una zona de extensión que separa bloques de granito con una fi rma magnética similar; también sugiere que la zona de extensión continúa hacia el NE, más allá de los límites del valle. Estos resultados tienden a confi rmar que tanto la Bahía de Banderas como el Valle de Banderas pertenecen a la misma estructura tectónica a pesar de que la orientación de sus ejes difi ere 30º, y apoyan la idea de que estas estructuras constituyen parte del límite NW del Bloque de Jalisco Proponemos que la estructura de Bahía de Banderas inició hace ~14 Ma a lo largo de una tendencia E-W y que a ~5 Ma el eje del graben se reorientó en una dirección SW-NE, lo que indujo la formación del Valle de Banderas.
Palabras clave: modelado geofísico, gravedad, estudios magnetotelúricos, Valle de Banderas, bloque Jalisco, México.
Arzate et al.186
Bahía de Banderas bathymetry
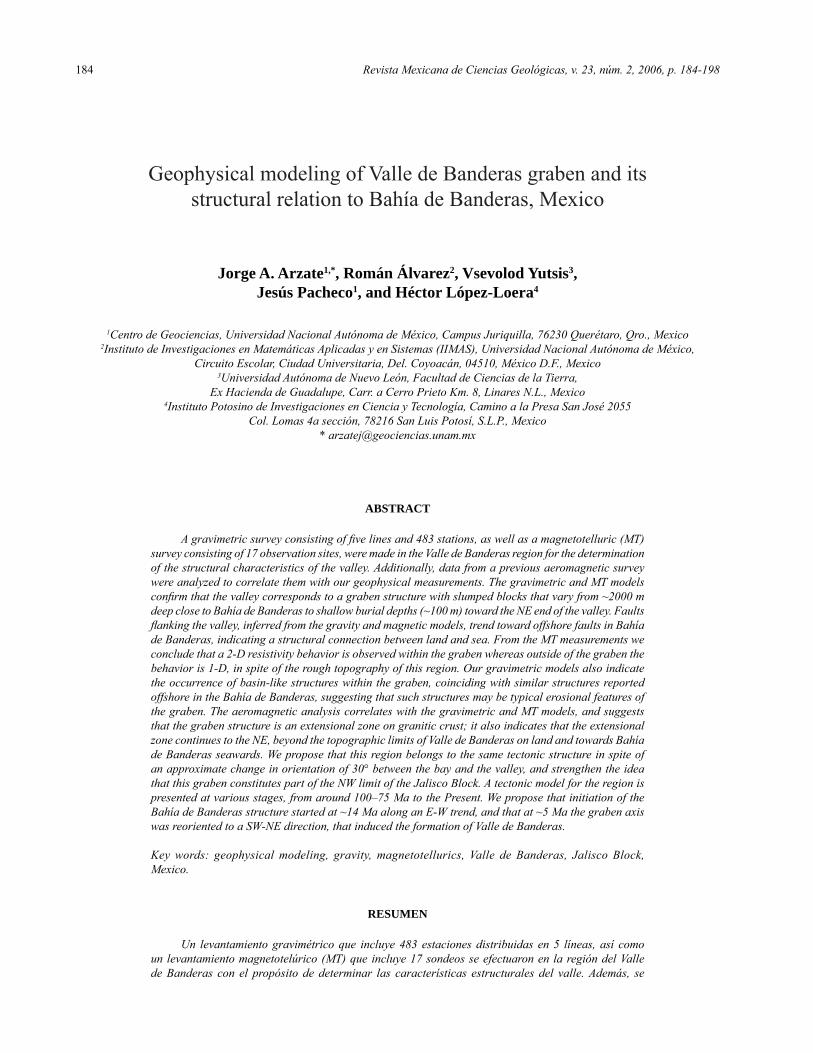
The fi rst contour representation of the bay’s depths was probably that of Fisher (1961); he proposed the exis-tence of a fault along the canyon. After gathering additional bathymetry data Alvarez (2002, 2005) elaborated a digital elevation model (DEM) of the bay. The northern portion of the bay corresponds to a wide platform (Figure 2), while the south fl ank attains depths of 1,200 to 1,500 m close to the shoreline. Erosional processes induced by faulting af-fect the northern fl ank of the canyon, and occur mainly as landslides. Several basins have been identifi ed in and around the canyon, which suggests that the graben development is accompanied by the formation of such structures.
Of particular interest to the present paper is the ob-servation that Banderas canyon changes from an E-W trend along the southern fl ank of the bay to a NE trending portion close to the eastern shore of the bay, which coincides with the trend of the axis of Valle de Banderas. The change in trend initiates within the bay, as observed above, and con-tinues into the valley (Figure 2). This change in trend can be interpreted as linked to a major tectonic activation; the change is probably contemporaneous with the beginning of the northwestward drifting of Baja California, at about 6–5 Ma. Lyle and Ness (1991) suggested that the formation of Banderas canyon was induced by the opening of the Gulf of California, at ~14 Ma, and associated it with slow rifting in the NW-SE direction. If these models are correct, the
Vallarta batholiths are quite similar, which suggest that they were close together before the separation of the peninsula took place. The Jalisco Block has also been identifi ed with a structural uplifted domain constituted by exposed crystal-line basement (Fenby and Gastil, 1991).
The granitic basement in the Jalisco Block has been dated around 100–75 Ma (Zimmerman et al., 1988; Schaaf et al., 1995). Moore et al. (1994) studied the San Cristóbal plateau basalts near Guadalajara City, which fi lled a pre-existing extensional basin in the area, at around 10 Ma; they speculated that this may be one of the fi rst indications of separation of the Jalisco Block from NAM. Rosas-Elguera et al. (1996) reported that the mid-crustal rock assemblage of the Puerto Vallarta batholith is presently exposed at 1,000 to 2,500 m of elevation, indicating that it has undergone a signifi cant uplift since its emplacement. The lack of ash fl ow tuffs from the Sierra Madre Occidental in the Jalisco Block (Ferrari et al., 1994) was considered by Rosas-Elguera et al. (1996) as an indication that most of the uplift occurred in the Paleogene; the fi ssion track fi ndings of Calmus et al. (1995) indicate that the batholith was at a depth greater than 1,000 m by Eocene times, supporting the above statement.
The Valle de Banderas graben was called “Puerto Vallarta graben” by Ferrari and Rosas-Elguera (2000); we think the name used herein corresponds better with the geographic location and connects intuitively with Bahía de Banderas. In their description of the graben they reported that it is bounded by two main 25°– 45° striking fault sys-tems, with vertical offset of around 600 m; furthermore, they also identifi ed a northeast trending extension direction. Based on the existence of a faulted conglomerate in the eastern part of the graben, they assumed that this extensional pattern has continued until Recent times.
Figure 1. Tectonic setting in the vicinity of the study area (after Ferrari and Rosas-Elguera, 2000). According with their interpretation, the Jalisco Block (JB) is limited to the north by the Tepic-Zacoalco graben (TZG), and to the east by the Colima Graben zone (CG). BNF: Barra de Navidad Fault Zone; EFZ: Esplandian Fault Zone; EGG: El Gordo Graben; EPR: East Pacifi c Rise; MAT: Middle American Trench; MB: Michoacán Block; MG: Manzanillo graben; PV: Puerto Vallarta; TCR: Tamayo Canyon Rift; TFZ: Tamayo Fault Zone; TME: Tres Marías Escarpment.
Cocos Plate
Pacific Plate
Rivera Plate
North AmericaPlate
PV
Pac
ific
-Riv
era
Ris
e
Rivera Transform fault
TFZ
JB
MB
TZGAmeca river
CGMAT
TCR
EFZTME
MG
BNF
EGG
EP
R
Volcanos
22
80
00
0
480000
Figure 2. Digital elevation model of Bahía de Banderas canyon merged with the inland DEM, suggesting its continuation towards the Valle de Banderas graben after a NE change in trend toward the E end of the canyon (after Álvarez, 2005b).

Geophysical modeling of Valle de Banderas graben 187
formation of the canyon probably began around 14 Ma and the change in trend initiated around 5 Ma. A more detailed discussion about the origin of Banderas canyon will be made ahead, in connection with a tectonic model of the area.
GRAVITY SURVEY
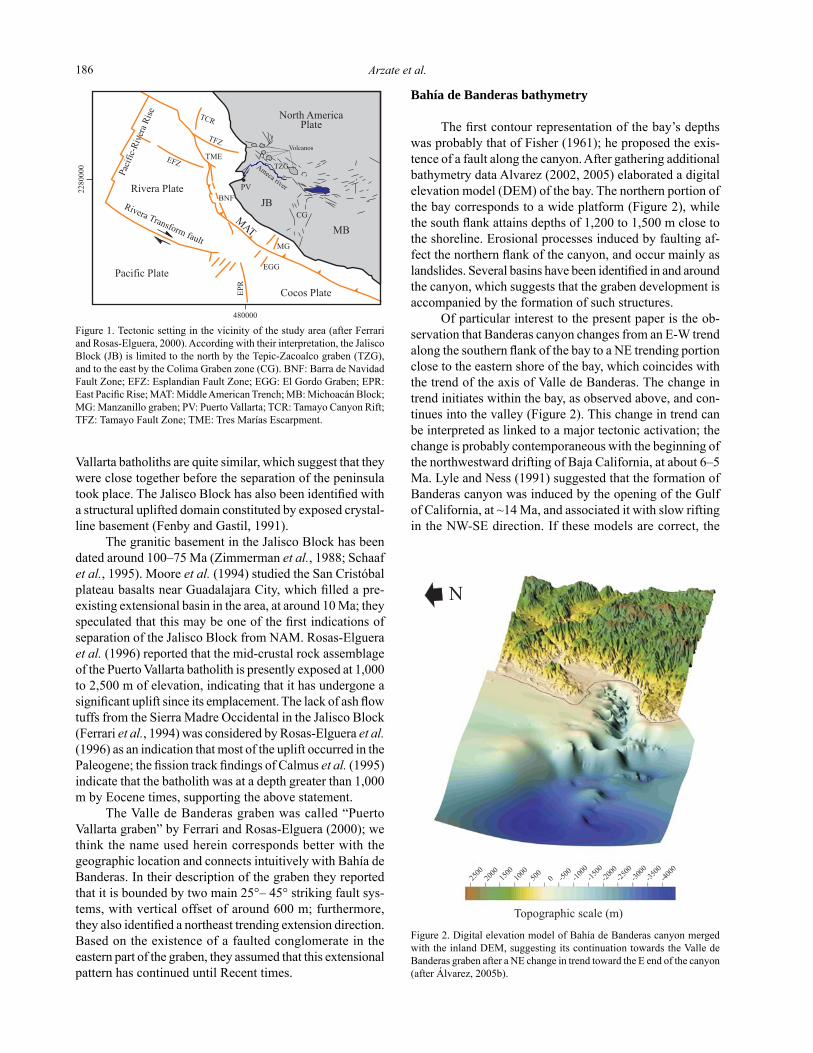
A gravity survey was carried out in the Valle de Banderas area with the purpose of modeling the basement and tracking any possible inland continuation of the faults observed offshore (Figure 3). The extent of the surveyed lines is about 150 km with 483 gravity stations. The el-evation of the stations was measured with a total station with subcentimeter accuracy; the gravity meter used was a Scintrex CG-3, measuring to an accuracy of 0.01 mGal. The location of stations were determined with a GPS, with an estimated horizontal accuracy of 7 m. Drift and tidal corrections to the data were done automatically by the in-strument using appropriate base station measurements and preprogrammed tidal variations. Other corrections to the data set included: standard latitude, free air, and Bouguer slab compensations. Figure 4 shows the complete Bouguer anomaly map of the zone, which includes also terrain cor-rections applied to each station using an automated Hammer (1939) type approach. A low reaching -90 mGals is revealed in the vicinity of the coast, at the southwestern portion of the valley.
A second-degree polynomial fi tting was used to fi nd out the suitable regional fi eld prevailing in the study area. Then, the residual fi eld was obtained (Figure 5) from the
difference between the complete Bouguer anomaly map and the fi tted regional fi eld. The resulting residual fi eld shows a rather well defi ned elongated minimum along an axis whose azimuth is about 30 degrees (letters B and C), coinciding with the Valle de Banderas axis. Its absolute amplitude ranges from 8 to 10 mGals, and although the data set has limited coverage, it appears that, instead of a continuous elongated basin, there are separated basin-like structures (letters A, E and D); the residual fi eld probably refl ects the distribution of fl uvial deposits. The northernmost portion of the surveyed area also discloses a negative anomaly, appar-ently interrupted from the main gravity low by locally high values. In general, a series of gravity highs with maximum amplitudes of up to 20 mGals are observed surrounding the main elongated negative anomaly, particularly in the W-NW region. A steep gravity gradient is observed along the NW portion of the surveyed area, which extends from MT Station 12 (see Figure 6) to the shoreline with a SW trend. Cross-sectional models based on these gravity charts will be discussed further ahead.
2-D gravity sections
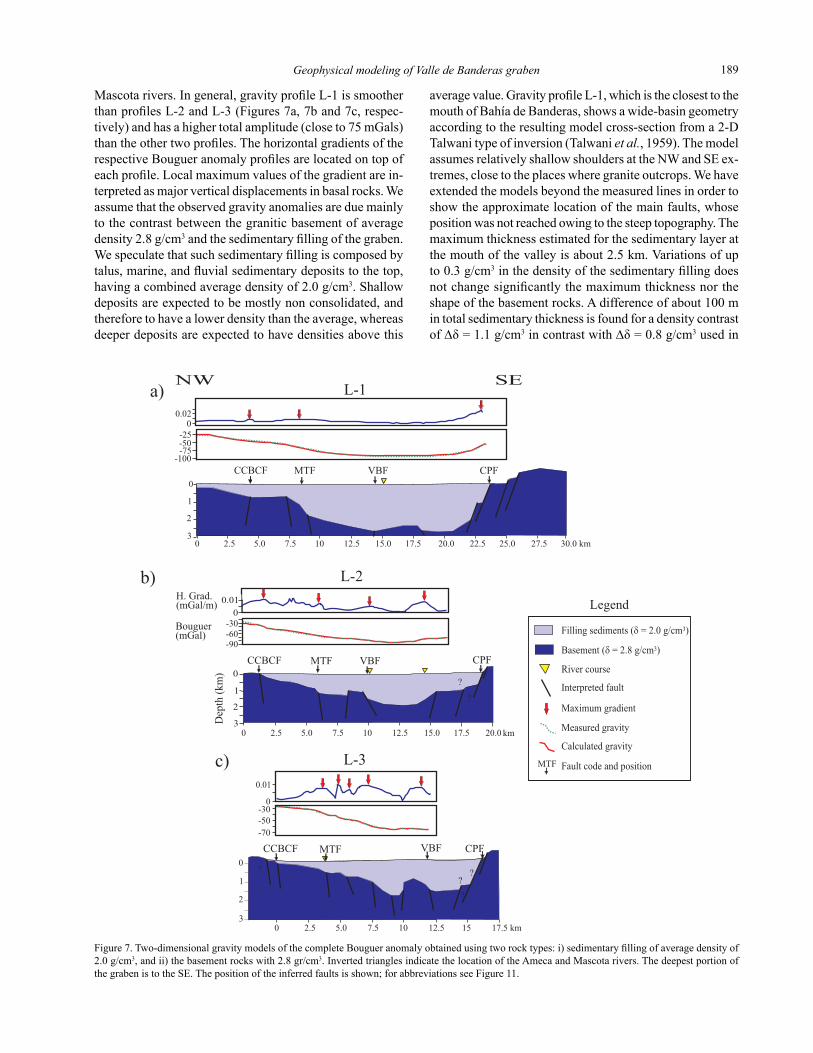
Three gravity profi les L-1, L-2, and L-3 were se-lected for two-dimensional modeling across the Valle de Banderas. The profi les were extracted from the complete Bouguer anomaly chart and are located close to the roads along which the gravity measurements were done (Figure 3). The resulting models obtained are shown in Figure 7. Inverted triangles indicate the location of the Ameca and
Figure 3. Gravimetric (dots) and magnetotelluric stations (circles) measured in Valle de Banderas.
Arzate et al.188
Figure 4. Complete Bouguer anomaly map of the zone, with terrain cor-rections. Black dots are gravity stations, white circles are MT locations, wandering blue line indicates the trace of the Ameca river within the valley, and L-1, L-2, and L-3 are the modeled gravity profi les.
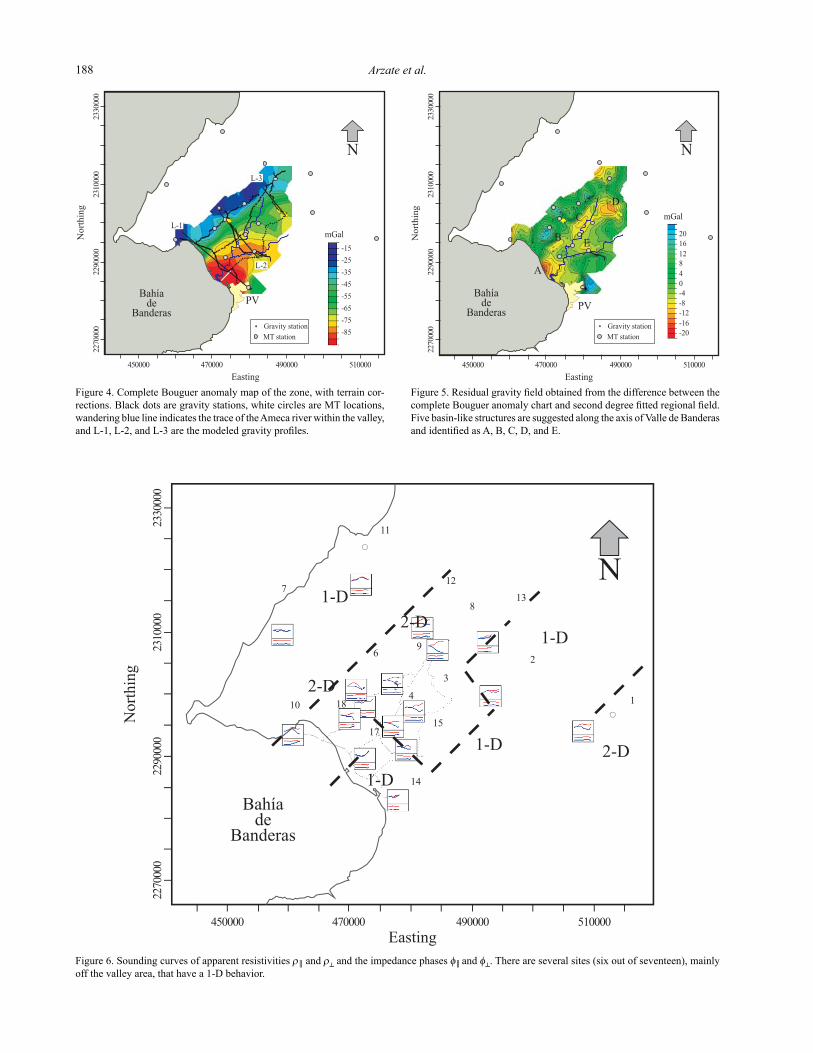
Figure 6. Sounding curves of apparent resistivities ρ║ and ρ┴ and the impedance phases φ║ and φ
┴. There are several sites (six out of seventeen), mainly
off the valley area, that have a 1-D behavior.
Figure 5. Residual gravity fi eld obtained from the difference between the complete Bouguer anomaly chart and second degree fi tted regional fi eld. Five basin-like structures are suggested along the axis of Valle de Banderas and identifi ed as A, B, C, D, and E.
Geophysical modeling of Valle de Banderas graben 189
Mascota rivers. In general, gravity profi le L-1 is smoother than profi les L-2 and L-3 (Figures 7a, 7b and 7c, respec-tively) and has a higher total amplitude (close to 75 mGals) than the other two profi les. The horizontal gradients of the respective Bouguer anomaly profi les are located on top of each profi le. Local maximum values of the gradient are in-terpreted as major vertical displacements in basal rocks. We assume that the observed gravity anomalies are due mainly to the contrast between the granitic basement of average density 2.8 g/cm3 and the sedimentary fi lling of the graben. We speculate that such sedimentary fi lling is composed by talus, marine, and fl uvial sedimentary deposits to the top, having a combined average density of 2.0 g/cm3. Shallow deposits are expected to be mostly non consolidated, and therefore to have a lower density than the average, whereas deeper deposits are expected to have densities above this
L-3
0
0.01
-70
-50
-30
c)
0
1
2
30 2.5 5.0 7.5 10 12.5
VBFMTF
15 17.5 km
?
?
??
CPFCCBCF
NW SEL-1a)
CCBCF MTF VBF CPF
0
1
2
30 2.5 5.0 7.5 10 12.5 15.0 17.5 20.0 22.5 25.0 27.5 30.0 km
-100
-25
0
-50-75
0.02
L-2b)
20.0
Dep
th(k
m)
0 2.5 5.0 7.5 10 12.5 15.0
0
1
2
3
CCBCF VBF CPFMTF
17.5 km
?
?
H. Grad.( /m)mGal
0
0.01
Bouguer(mGal)
-90-60
-30Filling sediments ( = 2.0 g/cm )� 3
Basement ( = 2.8 )� g/cm3
River course
Interpreted fault
Maximum gradient
Measured gravity
Calculated gravity
Legend
Fault code and positionMTF
Figure 7. Two-dimensional gravity models of the complete Bouguer anomaly obtained using two rock types: i) sedimentary fi lling of average density of 2.0 g/cm3, and ii) the basement rocks with 2.8 gr/cm3. Inverted triangles indicate the location of the Ameca and Mascota rivers. The deepest portion of the graben is to the SE. The position of the inferred faults is shown; for abbreviations see Figure 11.
average value. Gravity profi le L-1, which is the closest to the mouth of Bahía de Banderas, shows a wide-basin geometry according to the resulting model cross-section from a 2-D Talwani type of inversion (Talwani et al., 1959). The model assumes relatively shallow shoulders at the NW and SE ex-tremes, close to the places where granite outcrops. We have extended the models beyond the measured lines in order to show the approximate location of the main faults, whose position was not reached owing to the steep topography. The maximum thickness estimated for the sedimentary layer at the mouth of the valley is about 2.5 km. Variations of up to 0.3 g/cm3 in the density of the sedimentary fi lling does not change signifi cantly the maximum thickness nor the shape of the basement rocks. A difference of about 100 m in total sedimentary thickness is found for a density contrast of Δδ = 1.1 g/cm3 in contrast with Δδ = 0.8 g/cm3 used in

Arzate et al.190
our models. The curve fi tting accuracy seems to be more sensitive to the shape of the basement (i.e., the positions of topographic highs and lows) than to variations of the density contrast. The same observations are valid for profi le L-2 where the estimated maximum depth to the basement is close to 2 km and the graben width is about 17 km. In essence, the Valle de Banderas graben is about 23 km wide at the shoreline and narrows toward the NE down to about 12 km at the location of profi le L-3, where the sedimentary thickness drops to about 1.5 km. A common feature of the three profi les is a horst type structure about 2.5 km width at the bottom of the sedimentary fi lling. On the basis of these models and the resulting basement topography, a series of faults are associated with these cross sections. Faults designated CCBCF (Cabo Corrientes-Bucerías-El Colomo Fault), VBF (Valle de Banderas Fault), and CPF (Cucharitas-Pitillal Fault) correspond to faults previously identifi ed in the bay (Álvarez-Béjar, 2005) whose trace can now be extended into the valley. Fault MTF (Mezcales-Tebelchía Fault) is inferred in this work and appears to be concealed by the valley sediments. A joint representation of the bay and valley faults is presented ahead.
MAGNETOTELLURIC SURVEY
A total of 18 magnetotelluric soundings were mea-sured in Valle de Banderas with the purpose of fi nding out possible anomalous conductors related to faulted basement. Fifteen MT soundings were carried out within the valley and three in the surroundings. One of the sites (16) in the valley was too noisy to be useful, for this reason it was not included in the interpretation process. The location of sites (Figure 3) was chosen according to accessibility and space availability to spread out the electrode arrays, always trying to have a good coverage of the valley. A full MT sounding measurement took between 8 to 14 hours. The survey was carried out in two stages; in the fi rst fi eldwork campaign we used two Phoenix V5, while in the second campaign we used two Phoenix MTU-2000, both fi ve channel systems. MT soundings from 1 to 11 were measured with the V5 systems, whereas the last 7 were acquired with the MTU-2000. The resistivity data of the fi rst measuring campaign is of varying quality whereas the data of the second campaign is generally better.
The fi ve channel systems recorded two horizontal components of the electric and two horizontal components of the magnetic fi elds (Ex, Ey, Hx, and Hy) as well as the vertical component of the magnetic fi eld Hz, in the period range from 0.0025 to 100 seconds. However, Hz is not ana-lyzed in this work. Standard processing of the data included FFT of the acquired time series and robust estimation of the impedance tensor Z (r,ω). The impedance tensor, often termed the Transfer Function, refl ects the earth´s conductiv-ity distribution. When rotated to the principal axis (i.e., to the axis of the main geologic structure), and in the absence
of local current scatters, the magnetic (Hx , Hy) and the electric fi elds (Ex , Ey) are related to Z, through the linear equation system
(1)
where Zxy and Zyx are the off diagonal components of Z, a rank-two, complex tensor, and s1, s2 are real multipliers representing near-surface galvanic shift. Here it is assumed that, to the scale of the Valle de Banderas graben, three-dimensional structures are all inductively weak, so that they do not distort signifi cantly the measured electric and magnetic fi elds. In the studied area, major fi eld scatterers can be sharp coastal lines, and conducting intrusives. Although local faults diagonal to the graben strike can also behave as scatterers, special attention was paid to locate MT stations away from such features when there was surface evidence of its presence. In addition, the coastal line only affects sites located within a skin depth (Vozoff, 1989) distance of 5 km, which corresponds to sampling fi eld periods larger than 1 Hz for a ground average resistivity of 100 ohm·m. Figure 6 shows that only soundings 7, 10, and 11 are within this distance, and of these only site 10 is located within this distance to the Bahía de Banderas sharp coastal line. Sites 7 and 11 are located over a marine platform that extends tens of kilometers west of the shoreline (see Fig. 2). Thus, the coastal effect is regarded negligible for most of the MT soundings at least down to about 1 Hz.
Resistivity maps
The principal impedances Zxy and Zyx are either perpen-dicular (Z┴) or parallel (Z║) to the strike of the two dimen-sional structure. Z┴ is the impedance associated with the two dimensional mode containing only currents perpendicular to the strike, and Z║ is the impedance associated with the mode containing only current parallel to the strike. Accordingly, the apparent resistivities ρ║ and ρ┴ and the impedance phases φ║ and φ┴, as a function of frequency, are calculated from the complex elements Zxy and Zyx respectively using (e.g., Vozoff, 1989)
(2)and
, (3)
where ij are either xy or yx; μ0 is the permeability of free space and ω the angular frequency. From these expressions, the sounding curves were obtained for the principal axes. The apparent resistivity curves were corrected by static shift, which consisted of shifting the curves by factors s1, s2 at those sites where vertical displacements were off the 100 ohm·m level. This value is regarded as the normal resistivity level at the near surface in the studied area, because 13 out of 17 sites showed sounding curves starting at this resistivity.
⎟⎟⎠
⎞⎜⎜⎝
⎛⎟⎟⎠
⎞⎜⎜⎝
⎛=⎟⎟
⎠
⎞⎜⎜⎝
⎛
y
x
yx
xy
y
x
HH
ZZ
EsEs
00
2
1
⎟⎟⎠
⎞⎜⎜⎝
⎛⎟⎟⎠
⎞⎜⎜⎝
⎛=⎟⎟
⎠
⎞⎜⎜⎝
⎛
y
x
yx
xy
y
x
HH
ZZ
EsEs
00
2
1
2
0
)(1)( ωμω
ωρ ijij Z=2
0
)(1)( ωμω
ωρ ijij Z=
)(Re)(Im
tan)( 1
ωω
ωφij
ijij Z
Z−=)(Re)(Im
tan)( 1
ωω
ωφij
ijij Z
Z−=

Geophysical modeling of Valle de Banderas graben 191
In some cases, the orthogonal apparent resistivities curves of ρ║ and ρ┴ are equal, which refl ects the one-dimensional (1-D) character of the ground for the measured frequency band. Theoretically, when both resistivity curves overlap and are invariant under any rotation of Z, then we say that the site is 1-D. On the other hand, typical 2-D sites are characterized by having unequal apparent resistivity curves in part, or for all the sampling frequency bands. Figure 6 shows that there are several sites (six out of seventeen), mainly off the valley area, having one-dimensional behav-ior, except sounding 1 which is outside the valley and has a 2-D response. In this fi gure, ρ║, also known as transverse magnetic or TM resistivity, is plotted in blue while ρ┴ , also known as transverse electric or TE resistivity, is plotted in red. The stations 14 and 17 to the SE, 2 and 13 to the NE, and 7 and 11 to the NW of the valley are 1-D sites. The rest of the stations, predominantly located within the valley, are clearly affected by the graben structure and refl ect a 2-D earth at least. This behavior appears contrary to what might be expected, however deep rooted massive granite units fl anking a highly faulted graben can explain the observed behavior. The granites are apparently quite homogeneous for a wide frequency band (down to 0.1 Hz), hence the 1-D response, while the fault structures within the graben promote current polarization at frequencies below 10 Hz. Figure 8 shows the resistivity distributions at depths of 1 km, 2.5 km, and 10 km (a, b, and c charts respectively) calculated by using Bostick transfom (Bostick, 1977), which produces smoothly varying resistivity-depth profi les. The plots give an idea about the distribution of the conduc-tive fi lling sediments and the resistive granite at different depths. For example, in Figure 8a it is observed that the conductor has the same SW-NE trend as the graben. This trend seems to prevail down to 2.5 km as shown in Figure 8b, however at this depth and down to 10 km (Figure 8c) the background resistivity is higher. To this depth, the high conductivity distribution appears to change from a SW-NE direction (Figures 8a and 8b) to a more NW-SE orientation (Figure 8c) although the central part of the valley remains as a good conductor at depth.
2-D magnetotelluric models
Three magnetotelluric cross sections were modeled (inset Figure 9) by using 2-D Rodi and Mackie (2001) smooth inversion algorithm. The three magnetotelluric electrical sections are formed by stations in some cases separated far apart. Even though, the section provides an idea of the electric structure down to about 10 km deep into the ground. The MT profi les comprising a total of 13 stations were rotated to the structural axis of the graben using a mean rotation angle of 40 degrees in the induction band of 102–10-1 Hz. The resistivity and phases of the TE and TM modes were simultaneously inverted using a mesh that incorporated topography, extending laterally and down-
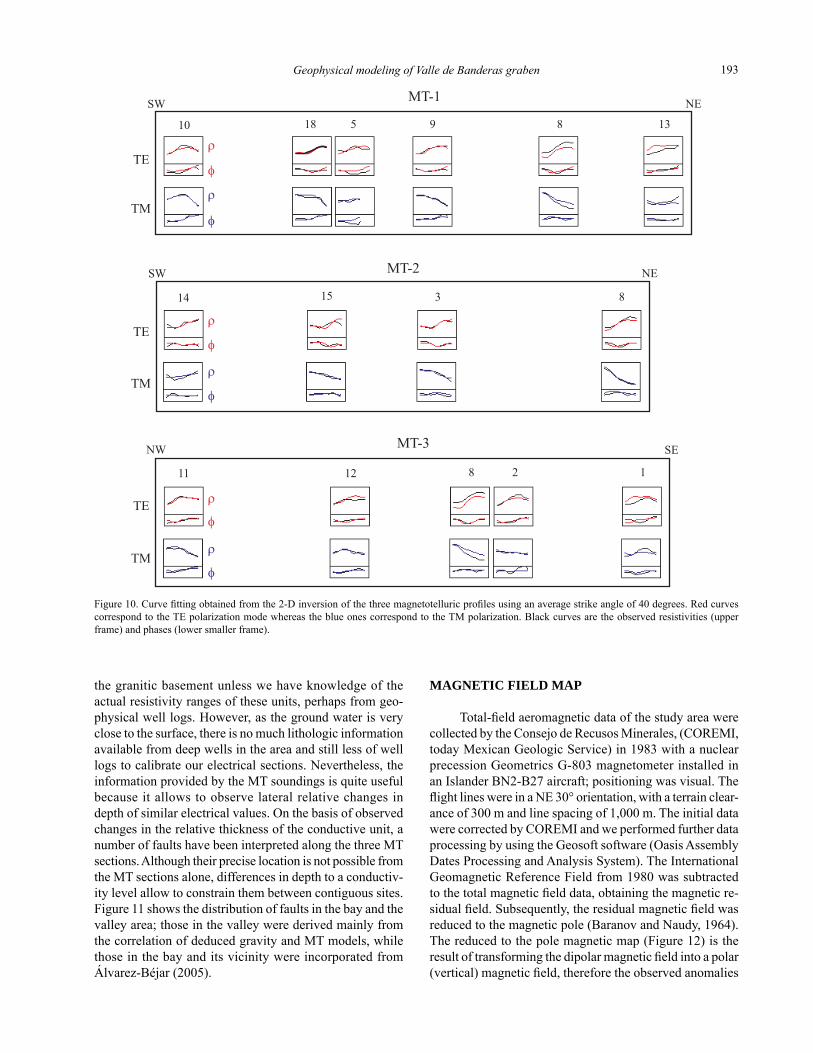
wards beyond the end site locations. The obtained resistivity sections after 25 iterations are shown in Figure 9 and were named MT-1, MT-2, and MT-3 respectively. The misfi ts between observed and calculated apparent resistivities and phases are presented graphically in Figure 10 for all the sites and profi les. In general both the TE and TM curve fi ttings are in reasonably good agreement for most of the sites and for the resistivity and phase. The horizontal scale of plots range from 103 to 10-2 Hz and the resistivity ranges from 100 to 104 ohm·m.
Section MT-1 comprises six MT sites covering a total length of about 40 km and having an orientation roughly S50E. Except at the location of station 18, the profi le is characterized by a shallow fl at conductor that suggests a constant sediment thickness, that would be expected as the profi le is approximately parallel to the northern edge of the graben. The wide conductivity anomaly observed at site 18 is an artifact of the interpolation algorithm, which is emphasized by the ample separation between contiguous sites. However, the anomalous conductor appears to be real and it is probably associated to the presence of a fault (LQ) just bellow the site location.
Section MT-2 comprises four sites, cuts diagonally the graben basin, and extends for a total distance of about 30 km with an approximate S20E orientation. Site 14 is located in the southern extreme of the profi le, close to Puerto Vallarta, and suggests a thicker sedimentary layer than at the loca-tion of site 8. In the central part of the profi le, sites 15 and 3 reveal a thicker sedimentary layer than at the other sites. However, at the station 15, the basement appears deeper than at site 3 implying that this difference in depth to the basement has been induced by faulting.
Section MT-3 comprises fi ve stations and has a total length of about 50 km; it cuts the graben to the east of gravity profi le L-3, close to the zone where it becomes narrower. The electrical structure along this section reveals a relatively shallow resistive basement, particularly at sites 11 and 1, located at the extremes of the profi le. The high conductivity layer associated with the sedimentary fi lling of the valley was detected only at the location of site 8, which evidences that at this latitude the graben becomes shallower. The verti-cal displacements within the graben along the interpreted faults seem to be negligible in this zone, in contrast with what is observed towards the coastal plain, where according to gravity results they can be larger than 1 km. Observed differences in depth to the basement between the three in-verted MT sections at site 8 are due to differences in curve fi tting. In sections MT-1 and MT-3, the calculated TE and TM resistivity curves are shifted downwards the measured resistivity curves producing an artifi cially thicker conduc-tive layer. In section MT-2, no curve shifting is observed at station 8 and the match between the measured and calculated resistivity curves is better, which suggests that the electrical structure bellow this site is better defi ned here.
There is not a direct way to defi ne with accuracy the depth to the interface between the sedimentary fi lling and

Arzate et al.192
Figure 9. Two-dimensional magnetotelluric models along profi les MT-1, MT-2, and MT-3. Red color is associated with the sedimentary fi lling of the graben, except at site 18 where the conductor appears to be related to the presence of a fault (La Quebrada Fault or LQF) just below the measuring site probably in a different direction that CCBCF fault. Blue and green tones are associated to the presence of the granitic resistive basement. Black lines are interpreted faults; although their position is not accurate, their existence is assured by differences in depth to a common conductive horizon. For faults abbreviations see Figure 11.
1700
900
1250
660
480
350
260
190
140
100
RHO (ohm m)�
MT-1
SW NE10 18 5 9 8 13
0
5
100 5 10 15 20 25 30 35 40
Dep
th(k
m)
MT-2
SW NE814 15 3
0
5
100 5 10 15 20 25 30
Dep
th(k
m)
CP
F
VB
F
MT
F
Distance (km)
MT-3
NW
0
5
100 5 10 15 20 25 30 35 40 45 50
Dep
th(k
m)
1281211 C
CB
CF
MT
F?
VB
F?
CP
F
CC
BC
F
MT
FLQ
SE
MT-1
MT-3
MT-2
2320000
2300000
2280000Profile location
N
450000 480000 510000
Figure 8. Resistivity maps of Valle de Banderas at 1, 2.5, and 10 km depth. Conductors along a NE direction dominate the response at 1 and 2.5 km, whereas an apparent change in the conductor direction towards the NW is observed at larger depths (10km).
a) b)
c)
Geophysical modeling of Valle de Banderas graben 193
MAGNETIC FIELD MAP
Total-fi eld aeromagnetic data of the study area were collected by the Consejo de Recusos Minerales, (COREMI, today Mexican Geologic Service) in 1983 with a nuclear precession Geometrics G-803 magnetometer installed in an Islander BN2-B27 aircraft; positioning was visual. The fl ight lines were in a NE 30° orientation, with a terrain clear-ance of 300 m and line spacing of 1,000 m. The initial data were corrected by COREMI and we performed further data processing by using the Geosoft software (Oasis Assembly Dates Processing and Analysis System). The International Geomagnetic Reference Field from 1980 was subtracted to the total magnetic fi eld data, obtaining the magnetic re-sidual fi eld. Subsequently, the residual magnetic fi eld was reduced to the magnetic pole (Baranov and Naudy, 1964). The reduced to the pole magnetic map (Figure 12) is the result of transforming the dipolar magnetic fi eld into a polar (vertical) magnetic fi eld, therefore the observed anomalies
TE
TM
MT-1
1810 5 9 8 13
SW NE
�
�
�
�
14 15 3 8
MT-2
�
�
�
�
SW NE
TE
TM
1281211
NW SEMT-3
�
�
�
�
TE
TM
Figure 10. Curve fi tting obtained from the 2-D inversion of the three magnetotelluric profi les using an average strike angle of 40 degrees. Red curves correspond to the TE polarization mode whereas the blue ones correspond to the TM polarization. Black curves are the observed resistivities (upper frame) and phases (lower smaller frame).
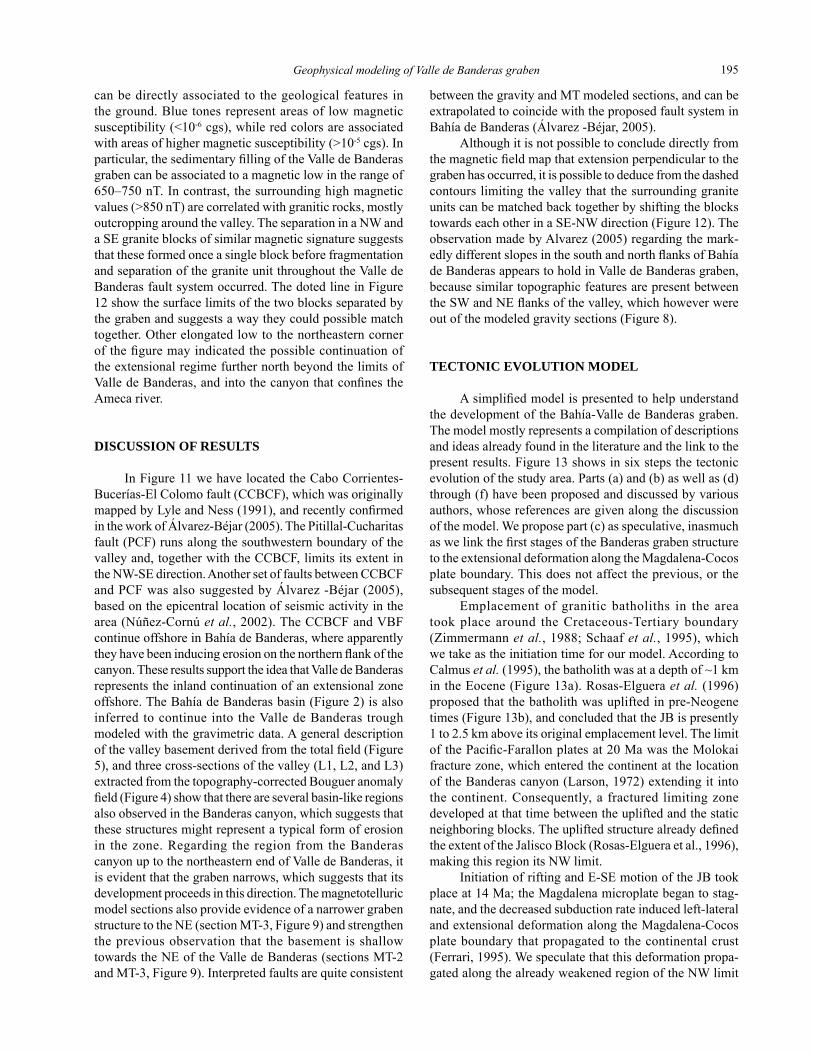
the granitic basement unless we have knowledge of the actual resistivity ranges of these units, perhaps from geo-physical well logs. However, as the ground water is very close to the surface, there is no much lithologic information available from deep wells in the area and still less of well logs to calibrate our electrical sections. Nevertheless, the information provided by the MT soundings is quite useful because it allows to observe lateral relative changes in depth of similar electrical values. On the basis of observed changes in the relative thickness of the conductive unit, a number of faults have been interpreted along the three MT sections. Although their precise location is not possible from the MT sections alone, differences in depth to a conductiv-ity level allow to constrain them between contiguous sites. Figure 11 shows the distribution of faults in the bay and the valley area; those in the valley were derived mainly from the correlation of deduced gravity and MT models, while those in the bay and its vicinity were incorporated from Álvarez-Béjar (2005).

Arzate et al.194
Figure 12. Magnetic anomaly map reduced to the pole of the study area deduced from the total fi eld aeromagnetic map. The region of Valle de Banderas corresponds to a magnetic NE trending low. Dashed line within the valley suggests that the granite unit, showing high magnetization values, can be matched together implying that segmentation has occurred in the past.
Figure 11. Fault distribution in Valle de Banderas as obtained in this study. The faults shown in the bay were taken from Álvarez (2005b); there is a good correlation between the faults that are located in the bay and the valley. Mezcales-Tebelchía fault (MTF), Valle de Banderas fault (VBF), Pitillal-Cucharitas fault (PCF), Cabo Corrientes-Bucerías-El Colomo fault (CCBCF), Banderas fault (BF), and La Quebrada fault (LQF).
Geophysical modeling of Valle de Banderas graben 195
can be directly associated to the geological features in the ground. Blue tones represent areas of low magnetic susceptibility (<10-6 cgs), while red colors are associated with areas of higher magnetic susceptibility (>10-5 cgs). In particular, the sedimentary fi lling of the Valle de Banderas graben can be associated to a magnetic low in the range of 650–750 nT. In contrast, the surrounding high magnetic values (>850 nT) are correlated with granitic rocks, mostly outcropping around the valley. The separation in a NW and a SE granite blocks of similar magnetic signature suggests that these formed once a single block before fragmentation and separation of the granite unit throughout the Valle de Banderas fault system occurred. The doted line in Figure 12 show the surface limits of the two blocks separated by the graben and suggests a way they could possible match together. Other elongated low to the northeastern corner of the fi gure may indicated the possible continuation of the extensional regime further north beyond the limits of Valle de Banderas, and into the canyon that confi nes the Ameca river.
DISCUSSION OF RESULTS
In Figure 11 we have located the Cabo Corrientes-Bucerías-El Colomo fault (CCBCF), which was originally mapped by Lyle and Ness (1991), and recently confi rmed in the work of Álvarez-Béjar (2005). The Pitillal-Cucharitas fault (PCF) runs along the southwestern boundary of the valley and, together with the CCBCF, limits its extent in the NW-SE direction. Another set of faults between CCBCF and PCF was also suggested by Álvarez -Béjar (2005), based on the epicentral location of seismic activity in the area (Núñez-Cornú et al., 2002). The CCBCF and VBF continue offshore in Bahía de Banderas, where apparently they have been inducing erosion on the northern fl ank of the canyon. These results support the idea that Valle de Banderas represents the inland continuation of an extensional zone offshore. The Bahía de Banderas basin (Figure 2) is also inferred to continue into the Valle de Banderas trough modeled with the gravimetric data. A general description of the valley basement derived from the total fi eld (Figure 5), and three cross-sections of the valley (L1, L2, and L3) extracted from the topography-corrected Bouguer anomaly fi eld (Figure 4) show that there are several basin-like regions also observed in the Banderas canyon, which suggests that these structures might represent a typical form of erosion in the zone. Regarding the region from the Banderas canyon up to the northeastern end of Valle de Banderas, it is evident that the graben narrows, which suggests that its development proceeds in this direction. The magnetotelluric model sections also provide evidence of a narrower graben structure to the NE (section MT-3, Figure 9) and strengthen the previous observation that the basement is shallow towards the NE of the Valle de Banderas (sections MT-2 and MT-3, Figure 9). Interpreted faults are quite consistent
between the gravity and MT modeled sections, and can be extrapolated to coincide with the proposed fault system in Bahía de Banderas (Álvarez -Béjar, 2005).
Although it is not possible to conclude directly from the magnetic fi eld map that extension perpendicular to the graben has occurred, it is possible to deduce from the dashed contours limiting the valley that the surrounding granite units can be matched back together by shifting the blocks towards each other in a SE-NW direction (Figure 12). The observation made by Alvarez (2005) regarding the mark-edly different slopes in the south and north fl anks of Bahía de Banderas appears to hold in Valle de Banderas graben, because similar topographic features are present between the SW and NE fl anks of the valley, which however were out of the modeled gravity sections (Figure 8).
TECTONIC EVOLUTION MODEL
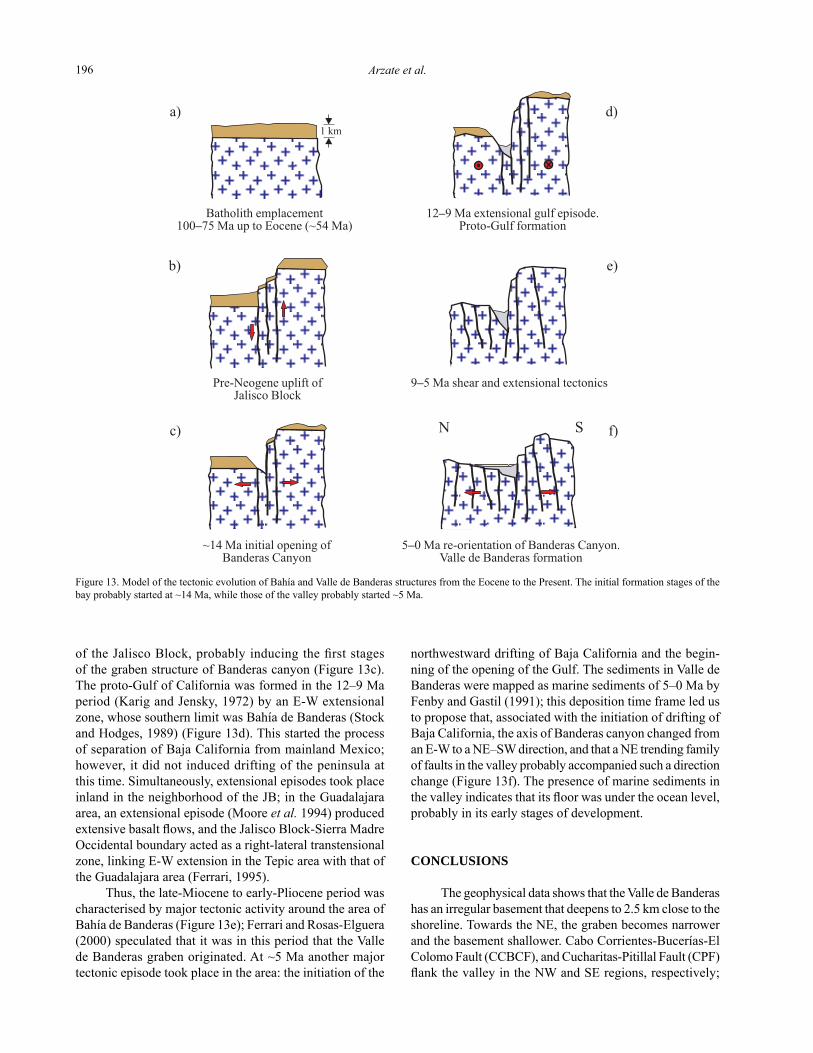
A simplifi ed model is presented to help understand the development of the Bahía-Valle de Banderas graben. The model mostly represents a compilation of descriptions and ideas already found in the literature and the link to the present results. Figure 13 shows in six steps the tectonic evolution of the study area. Parts (a) and (b) as well as (d) through (f) have been proposed and discussed by various authors, whose references are given along the discussion of the model. We propose part (c) as speculative, inasmuch as we link the fi rst stages of the Banderas graben structure to the extensional deformation along the Magdalena-Cocos plate boundary. This does not affect the previous, or the subsequent stages of the model.
Emplacement of granitic batholiths in the area took place around the Cretaceous-Tertiary boundary (Zimmermann et al., 1988; Schaaf et al., 1995), which we take as the initiation time for our model. According to Calmus et al. (1995), the batholith was at a depth of ~1 km in the Eocene (Figure 13a). Rosas-Elguera et al. (1996) proposed that the batholith was uplifted in pre-Neogene times (Figure 13b), and concluded that the JB is presently 1 to 2.5 km above its original emplacement level. The limit of the Pacifi c-Farallon plates at 20 Ma was the Molokai fracture zone, which entered the continent at the location of the Banderas canyon (Larson, 1972) extending it into the continent. Consequently, a fractured limiting zone developed at that time between the uplifted and the static neighboring blocks. The uplifted structure already defi ned the extent of the Jalisco Block (Rosas-Elguera et al., 1996), making this region its NW limit.
Initiation of rifting and E-SE motion of the JB took place at 14 Ma; the Magdalena microplate began to stag-nate, and the decreased subduction rate induced left-lateral and extensional deformation along the Magdalena-Cocos plate boundary that propagated to the continental crust (Ferrari, 1995). We speculate that this deformation propa-gated along the already weakened region of the NW limit
Arzate et al.196
a)
1 km
Batholith emplacement100 75 Ma up to Eocene (~54 Ma)–
12 9 Ma extensional gulf episode.Proto-Gulf formation
–
d)
b)
Pre-Neogene uplift ofJalisco Block
9 5 Ma shear and extensional tectonics–
e)
f)c)
~14 Ma initial opening ofBanderas Canyon
5 0 Ma re-orientation of Banderas Canyon.Valle de Banderas formation
–
N S
Figure 13. Model of the tectonic evolution of Bahía and Valle de Banderas structures from the Eocene to the Present. The initial formation stages of the bay probably started at ~14 Ma, while those of the valley probably started ~5 Ma.
of the Jalisco Block, probably inducing the fi rst stages of the graben structure of Banderas canyon (Figure 13c). The proto-Gulf of California was formed in the 12–9 Ma period (Karig and Jensky, 1972) by an E-W extensional zone, whose southern limit was Bahía de Banderas (Stock and Hodges, 1989) (Figure 13d). This started the process of separation of Baja California from mainland Mexico; however, it did not induced drifting of the peninsula at this time. Simultaneously, extensional episodes took place inland in the neighborhood of the JB; in the Guadalajara area, an extensional episode (Moore et al. 1994) produced extensive basalt fl ows, and the Jalisco Block-Sierra Madre Occidental boundary acted as a right-lateral transtensional zone, linking E-W extension in the Tepic area with that of the Guadalajara area (Ferrari, 1995).
Thus, the late-Miocene to early-Pliocene period was characterised by major tectonic activity around the area of Bahía de Banderas (Figure 13e); Ferrari and Rosas-Elguera (2000) speculated that it was in this period that the Valle de Banderas graben originated. At ~5 Ma another major tectonic episode took place in the area: the initiation of the
northwestward drifting of Baja California and the begin-ning of the opening of the Gulf. The sediments in Valle de Banderas were mapped as marine sediments of 5–0 Ma by Fenby and Gastil (1991); this deposition time frame led us to propose that, associated with the initiation of drifting of Baja California, the axis of Banderas canyon changed from an E-W to a NE–SW direction, and that a NE trending family of faults in the valley probably accompanied such a direction change (Figure 13f). The presence of marine sediments in the valley indicates that its fl oor was under the ocean level, probably in its early stages of development.
CONCLUSIONS
The geophysical data shows that the Valle de Banderas has an irregular basement that deepens to 2.5 km close to the shoreline. Towards the NE, the graben becomes narrower and the basement shallower. Cabo Corrientes-Bucerías-El Colomo Fault (CCBCF), and Cucharitas-Pitillal Fault (CPF) fl ank the valley in the NW and SE regions, respectively;

Geophysical modeling of Valle de Banderas graben 197
the SE fl ank of the valley rapidly drops to 2 km, while towards the NW it raises more gently; a similar behavior has been observed in the Banderas canyon (Alvarez, 2005; Álvarez-Béjar, 2005). A possible explanation for the origin of the asymmetry is the uplift of the Jalisco Block, which created a sharp drop at the uplifted fl ank versus the fl ank that apparently was not uplifted. This structure evokes that of a half-graben. The classifi cation of the valley materials as marine sediments (Gastil et al., 1979; Fenby and Gastil, 1991) suggests that the valley was below sea level, probably at the early stages of its formation.
The 2-D resistivity distribution at different depths sug-gests that the observed anomalous conductivity at shallow and deeper depths respond to different causes. The shallow conductor is associated to the sedimentary fi lling the graben, part of which may be of marine origin. The deep conductor (10 km) might be related to the dehydration process (Jödicke et al., in press) of the Rivera Plate under the Jalisco Block. However, at this point this argument is regarded as a hy-pothesis that has to be further analyzed. The magnetic data suggest that the graben structure corresponds to an exten-sional zone, which continues to the NE of the valley. This extensional zone apparently divides a granitic formation that constituted a single unit before extension started. Major branching to the SW from the Tepic-Zacoalco graben zone suggested by Johnson and Harrison (1990) may effectively connect with the Valle de Banderas and Bahía de Banderas fault zone hinted by the results shown here.
The structural results obtained in this work support (1) the graben structure of Valle de Banderas, (2) the strike change of Banderas canyon in the direction of the valley axis, and (3) the continuation of Banderas canyon inland into Valle de Banderas.
ACKNOWLEDGEMENTS
The authors would like to thank participants in the fi rst and second fi eldwork campaigns: students and staff of the Universidad Autónoma de Guadalajara, Campus Puerto Vallarta. Also, Fernando Corbo, Antonio del Rosal, and Ienisei Peña of the Centro de Geociencias,UNAM, and Antonio Tamez from the Facultad de Ciencias de la Tierra,UANL. We also acknowledge the fi nancial support of the UNAM-PAPIIT program, through projects IX121704 and IN120905-2.
REFERENCES
Allan, J.F., 1986, Geology of the northern Colima and Zacoalco grabens, southwest Mexico; Late Cenozoic rifting in the Mexican Volcanic Belt: Gological Society of America Bulletin, 97, 473-485.
Alvarez, R., 2002, Banderas Rift Zone; A plausible NW limit of the Jalisco Block: Geophysical Research Letters, 29(20), DOI:10.1029/2002GL016089.
Alvarez, R., 2005, Bahía de Banderas México; evidence of on going submarine erosion induced by faulting (abstract): European
Geosciences Union, Geophysical Research Abstracts, 7, 02877, SRef-ID: 1607-7962/gra/EGU05-A-02877.
Álvarez-Béjar, R., 2004, Actualización de la topografía submarina de Bahía de Banderas y su modelo digital de elevación (abstract), in IV Reunión Nacional de Ciencias de la Tierra, november 1-5, 2004, Juriquilla, Qro., Mexico, Libro de Resúmenes: Sociedad Geológica Mexicana, p. 64.
Álvarez-Béjar, R. 2005, El sistema de fallas de Bahía de Banderas (ab-stract), in Unión Geofísica Mexicana, Reunión Anual, 30 october-4 november, Puerto Vallarta, Jal., Mexico: GEOS, 25, p. 90.
Bandy, W., Mortera-Gutierrez, C., Urrutia-Fucugauchi, J., Hilde, T.W.C., 1995, The subducted Rivera-cocos plate boundary; Where is it, what is it, and what is its relationship to the Colima rift ?: Geophysical Research Letters, 22, 3075-3078.
Baranov, V., Naudy, H., 1964, Numerical calculation of the formula of reduction to the magnetic pole: Geophysics, 29, 67-79.
Böhnel, H.D., Morán-Zenteno, D.J., Schaaf P., Urrutia-Fucugauchi, J., 1992, Paleomagnetism and isotope data from southern Mexico and the controversy over the pre-Neogene position of Baja California: Geofísica Internacional, 31, 253-261.
Bostick, F.X., 1977, A simple almost exact method of MT analysis, in Ward, S. (ed.), Workshop on Electrical Methods in Geothermal Exploration: Snowbird, Utah, University of Utah, USGS contract 14-08-001-6-359, 174-183.
Bourgois, J., Renard, V., Aubouin, J., Bandy, W., Barrier, E., Calmus, T., Carfantan, J-C., Guerrero, J., Mammerickx, J., Mercier de Lepinay, B., Michaud, F., Sosson, M, 1988, Active fragmentation of the North American plate; offshore boundary of the Jalisco Block off Manzanillo: Comptes Rendus de l’Académie des Sciences, Paris, serie II, 307, 1121-1130.
Calmus, T., Poupeau, G., Mercier de Lepinay, B., Michaud, F., Bourgois, J., 1995, Apatite fi ssion-track ages of plutonic rocks sampled along the active margin off Manzanillo and in the Puerto Vallarta batho-lith, Mexico: GEOS, Boletín de la Unión Geofísica Mexicana, 15, 63-64.
Fenby, S., Gastil, G., 1991, Geologic-Tectonic map of the Gulf of California and surrounding areas, in Dauphin J.P., Simoneit, B.R.T. (eds.), The Gulf and Peninsular Province of the Californias: American Association of Petroleum Geologists, Memoir, 47, 79-83.
Ferrari, L., 1995, Miocene shearing along the northern boundary of the Jalisco block and the opening of the southern Gulf of California: Geology, 23, 751-754.
Ferrari, L., Pasquarè, G., Venegas, S., Castillo, D., Romero, F., 1994, Regional tectonics of western Mexico and its implications for the northern boundary of the Jalisco block: Geofísica Internacional, 33, 139-151.
Ferrari, L., Rosas-Elguera, J., 2000, Late Miocene to Quaternary extension at the northern boundary of the Jalisco block, western Mexico; The Tepic-Zacoalco rift revisited in Delgado-Granados, H., Aguirre-Díaz, G., Stock, J.M. (eds.), Cenozoic Tectonics and Volcanism of Mexico: Boulder, Colorado, Geological Society of America, Special Paper, 334 41-63.
Fisher, R.L., 1961, Middle America Trench; topography and structure: Geological Society of America Bulletin, 72, 703-720.
Gastil, G., Krummenacher, D., Jensky, W.A., 1979, A reconnaissance geologic map of the west-central part of the state of Nayarit, Mexico-Summary: Geological Society of America Bulletin, 90, p. 15-18.
Hammer, S., 1939, Terrain corrections for gravimeter stations: Geophysics, 4, 184-194.
Jödicke, H., Jording, A., Ferrari, L., Arzate, J.A., Mezger, K., Rüpke, L., in press, Fluids release from the subducted Cocos plate and partial melting of the crust deduced from magnetotelluric studies in Southern Mexico: Implications for the generation of volcanism and subduction dynamics: Journal of Geophysical Research.
Johnson, C.A., Harrison, C.G.A., 1990, Neotectonics in central Mexico: Physics of the Earth and Planetary Interiors, 64, 187-210.
Karig, D., Jensky, W., 1972, The Proto-Gulf of California: Earth and Planetary Science Letters, 17, 169-174.
Khutorskoy, M.D., Delgado-Argote, L.A., Fernández, R., Konokov, V.I.,
Arzate et al.198
Polyak, V.G., 1994, Tectonics of the offshore Manzanillo and Tecpan basins, Mexican Pacifi c, from heat fl ow, bathymetric and seismic data: Geofísica Internacional, 33, 161-185.
Larson, R.L., 1972, Bathymetry, magnetic anomalies, and plate tectonic history of the mouth of the Gulf of California: Geological Society of America Bulletin, 83, 3345-3360.
Luhr, J.F., Nelson, S.A., Allan, J.F., Carmichael, I.S.E., 1985, Active rift-ing in southwest Mexico; Manifestations of an incipient eastward spreading ridge jump: Geology, 13, 54-57.
Lyle, M., Ness, G.E., 1991, The opening of the southern Gulf of California, in Dauphin, J.P., Simoneit, B.R.T., The Gulf and Peninsular Province of the Californias: American Association of Petroleum Geologists, Memoir, 47, 403-423.
Moore, G., Marone, C., Carmichael, I.S.E., Renne, P., 1994, Basaltic vol-canism and extension near the intersection of the Sierra Madre volcanic province and the Mexican volcanic belt: Geological Society of America Bulletin, 106, 383-394.
Núñez-Cornú, F.J., Rutz L., M., Nava P., A.F., Reyes-Dávila, G., Suárez-Plascencia, C., 2002, Characteristics of seismicity in the coast and north of Jalisco block, Mexico: Physics of the Earth and Planetary Interiors, 132, 141-155.
Rodi, W., Mackie, R.L., 2001, Nonlinear conjugate gradients algorithm for 2D magnetotelluric inversions: Geophysics, 66, 174-187
Rosas-Elguera, J., Ferrari, L., Garduño-Monroy, V.H., Urrutia-Fucugauchi, J., 1996, Continental boundaries of the Jalisco Block and their influence in the Pliocene-Quaternary kinematics of western Mexico: Geology, 24, 921-924.
Schaaf, P., Morán-Zenteno, D., Hernández-Bernal, M.S., 1995, Paleogene continental margin truncation in southwestern Mexico; Geochronological evidence: Tectonics, 14, 1339-1350.
Stock, J.M., Hodges, K.V., 1989, Pre-Pliocene extension around the Gulf of California and the transfer of Baja California to the Pacifi c plate: Tectonics, 8, 99-115.
Talwani, M., Worzel, J.L., Landisman M., 1959, Rapid computations for two-dimensional bodies with application to the Mendocino submarine fracture zone: Journal of Geophysical Research, 64, 49-59.
Vozoff, K., 1989, The magnetotelluric method, in Nabigian, M.N. (ed.), Electromagnetic Methods in Applied Geophysics, v. 1: Tulsa, Society of Exploration Geophysicists, 641-711.
Zimmermann, J-L., Stussi, J.M., González-Partida, E., Arnold, M., 1988, K-Ar evidence for age and compositional zoning in the Puerto Vallarta-Río Santiago batholith (Jalisco, Mexico): Journal of South American Earth Sciences, 1, 267-274.
Manuscript received: September 05, 2005Corrected manuscript received: April 3, 2006Manuscript accepted: April 10, 2006