
Geomorphic/Tectonic Control of Sediment Discharge to...
20
Geomorphic/Tectonic Control of Sediment Discharge to the Ocean: The Importance of Small Mountainous Rivers1 John D. Milliman and James P. M. Syvitski2 Woods Hole Oceanographic Institution, Woods Hole, MA 02543 ABSTRACT Analysis of data from 280 rivers discharging to the ocean indicates that sediment loadslyields are a log-linear function of basin area and maximum elevation of the river basin. Other factors controlling sediment discharge (e.g., climate, runoff) appear to have secondary importance. A notable exception is the influence of human activity, climate, and geology on the rivers draining southern Asia and Oceania. Sediment fluxes from small mountainous rivers, many of which discharge directly onto active margins (e.g.,western South and North America and most high-standing oceanic islands), have been greatly underestimated in previous global sediment budgets, perhaps by as much as a factor of three. In contrast, sediment fluxes to the ocean from large rivers (nearly all of which discharge onto passive margins or marginal seas) have been overestimated, as some of the sediment load is subaerially sequestered in subsiding deltas. Before the proliferation of dam construction in the latter half of this century, rivers probably discharged about 20 billion tons of sediment annually to the ocean. Prior to widespread farming and deforestation (beginning 2000-2500 yr ago), however, sediment discharge probably was less than half the present level. Sediments discharged by small mountainous rivers are more likely to escape to the deep sea during high stands of sea level by virtue of a greater impact of episodic events (i.e., flash floods and earthquakes) on small drainage basins and because of the narrow shelves associated with active margins. The resulting deltalfan deposits can be distinctly different than the sedimen- tary deposits derived from larger rivers that discharge onto passive margins. Introduction Estimating the flux and fate of fluvial sediments discharged to the ocean has proved to be difficult, as rivers for which we have at least some data ac- count for only about two-thirds of the land area draining into the ocean. Small rivers (drainage ba- sins <10,000 km2) drain only about 20% of the land area, but they number in the many thousands (figure 1) and, as will be seen in this paper, collec- tively they may contribute much more sediment than previously estimated. Previous attempts (e.g., Holeman 1968; Milliman and Meade 1983) as- sumed that global sediment flux could be calcu- lated by extrapolating the yield of large and medium-sized rivers over large regions. By failing to take into account adequately smaller rivers, however, this assumption led to mistaken conclu- sions regarding seaward flux of fluvial sediment. ' Manuscript received June 28, 1991, accepted March 18, 1992. Atlantic Geoscience Centre, Bedford Institute of Oceanog- raphy, Dartmouth, NS, B2Y4A2, Canada. To predict the sediment load of a small river, we need to understand the interaction of numerous factors, including climate, precipitation (both aver- age and peak), discharge (volume and velocity), ba- sin geology, human impact, and the size of the drainage basin. Many workers have tried relating sediment load (or yield-load normalized for basin area) to net and/or gross precipitation, with varying results (see review by Walling and Webb 1983).For small basins in the western United States, Lang- bein and Schumm (1958) showed that yields are high with low precipitation (where vegetation is too sparse to retard the erosive capacity of heavy rain and runoff), decrease in areas of medium pre- cipitation, and then increase with higher levels of precipitation. A better relationship was seen be- tween the annual variability of rainfall and sedi- ment transport (Douglas 1967), with basin relief also having an effect (Fournier 1960). Other work- ers, however, have noted a variety of sediment transport trends relative to precipitation (e.g., Ah- nert 1970))leading Walling and Webb (1983, p. 84) [The Journal of Geology, 1992, volume 100, p. 525-5441 O 1992 by The University of Chicago. All rights reserved. 0022-1376/92/10005-00$1.00
Transcript of Geomorphic/Tectonic Control of Sediment Discharge to...

Geomorphic/Tectonic Control of Sediment Discharge to the Ocean: The Importance of Small Mountainous Rivers1
John D. Milliman and James P. M. Syvitski2 Woods Hole Oceanographic Institution, Woods Hole, MA 02543
A B S T R A C T
Analysis of data from 280 rivers discharging to the ocean indicates that sediment loadslyields are a log-linear function of basin area and maximum elevation of the river basin. Other factors controlling sediment discharge (e.g., climate, runoff) appear to have secondary importance. A notable exception is the influence of human activity, climate, and geology on the rivers draining southern Asia and Oceania. Sediment fluxes from small mountainous rivers, many of which discharge directly onto active margins (e.g., western South and North America and most high-standing oceanic islands), have been greatly underestimated in previous global sediment budgets, perhaps by as much as a factor of three. In contrast, sediment fluxes to the ocean from large rivers (nearly all of which discharge onto passive margins or marginal seas) have been overestimated, as some of the sediment load is subaerially sequestered in subsiding deltas. Before the proliferation of dam construction in the latter half of this century, rivers probably discharged about 20 billion tons of sediment annually to the ocean. Prior to widespread farming and deforestation (beginning 2000-2500 yr ago), however, sediment discharge probably was less than half the present level. Sediments discharged by small mountainous rivers are more likely to escape to the deep sea during high stands of sea level by virtue of a greater impact of episodic events (i.e., flash floods and earthquakes) on small drainage basins and because of the narrow shelves associated with active margins. The resulting deltalfan deposits can be distinctly different than the sedimen- tary deposits derived from larger rivers that discharge onto passive margins.
Introduction
Estimating the flux and fate of fluvial sediments discharged to the ocean has proved to be difficult, as rivers for which we have at least some data ac- count for only about two-thirds of the land area draining into the ocean. Small rivers (drainage ba- sins <10,000 km2) drain only about 20% of the land area, but they number in the many thousands (figure 1) and, as will be seen in this paper, collec- tively they may contribute much more sediment than previously estimated. Previous attempts (e.g., Holeman 1968; Milliman and Meade 1983) as- sumed that global sediment flux could be calcu- lated by extrapolating the yield of large and medium-sized rivers over large regions. By failing to take into account adequately smaller rivers, however, this assumption led to mistaken conclu- sions regarding seaward flux of fluvial sediment.
' Manuscript received June 28, 1991, accepted March 18, 1992.
Atlantic Geoscience Centre, Bedford Institute of Oceanog- raphy, Dartmouth, NS, B2Y4A2, Canada.
To predict the sediment load of a small river, we need to understand the interaction of numerous factors, including climate, precipitation (both aver- age and peak), discharge (volume and velocity), ba- sin geology, human impact, and the size of the drainage basin. Many workers have tried relating sediment load (or yield-load normalized for basin area) to net and/or gross precipitation, with varying results (see review by Walling and Webb 1983). For small basins in the western United States, Lang- bein and Schumm (1958) showed that yields are high with low precipitation (where vegetation is too sparse to retard the erosive capacity of heavy rain and runoff), decrease in areas of medium pre- cipitation, and then increase with higher levels of precipitation. A better relationship was seen be- tween the annual variability of rainfall and sedi- ment transport (Douglas 1967), with basin relief also having an effect (Fournier 1960). Other work- ers, however, have noted a variety of sediment transport trends relative to precipitation (e.g., Ah- nert 1970)) leading Walling and Webb (1983, p. 84)
[The Journal of Geology, 1992, volume 100, p. 525-5441 O 1992 by The University of Chicago. All rights reserved. 0022-1376/92/10005-00$1.00

526 J O H N D . M I L L I M A N A N D jAMES P . M . SYVITSKI
to conclude that, "Current evidence concerning the relationship between climate and sediment yield emphasizes that no simple relationship exists."
In this paper we explore fluvial sediment dis- charge with respect to basin area and basin eleva- tion. Both of these factors have been analyzed pre- viously, but separately. For example, Ruxton and McDougall (1967) found that denbdation rates in the Hydrographers Range (Papua New Guinea) are directly related to local relief. Pinet and Souriau (1988) found that the solid load of a river correlated well with mean basin elevation but not with envi- ronmental factors (such as rainfall). Potter (1978)) Inman and Nordstrom (1971), and Audley-Charles et al. (1977, 1979) showed that large rivers (and their deltas) drain orogenic belts, but mostly dis- charge into intracratonic basins and trailing edge margins (see Dickinson 1988, for a detailed re- view). These latter papers seem to have been over- looked by most geologists and oceanographers.
An inverse relationship between sediment yield and drainage basin area also has been noted (e.g., Schumm and Hadley 1961), and Wilson (1973) sug- gested that sediment yield depends mainly on land use and basin area (not precipitation). Milliman and Meade (1983) reported that sediment yield in- creases by about seven-fold for every order of mag- nitude decrease in drainage basin area, but this cor- relation considered only rivers with sediment loads > 15 million tons (mt)/yr, thereby excluding rivers with smaller sediment loads.
Figure 1. Cumulative drainage ba-
River Data
sin area of the world's 400 largest rivers with decreasing basin size. Data from Unesco (1978), this paper, 80 and various IAHS publications. The ,-
E largest river basin (Amazon) ac- 5 counts for about G x lo6 km2 of the % - 90 x lo6 km2 land area (estimated g 60 by Milliman and Meade 1983) drain- Z ing into the oceans; the next nine % largest rivers drain an additional 32 .z x lo6 km2. Because many smaller .g40- river basins are not listed in the lit- .: erature, we can only estimate that f: the next 390 largest rivers basins $ drain an additional 40 x lo6 km2 of 9 20- land. (Numbers by- the dots indicate _I
the drainage basin area of that par-
ticular lo6 km2 river.) of the The land remaining surface are 20 prob- x ably drained more than 10,000 small
We began by assuming that the topographicltec- tonic character of a river basin plays the major role in determining its sediment loadlyield, and that sediment yield was partly determined by basin area. Rather than using mean basin elevation as the topographic parameter, we used maximum headwater elevation, because in many rivers much of the sediment load comes from mountains where the river originates. The Amazon is a widely cited example, in which >80% of the sediment load is derived from the Andes, which constitute only about 10% of the river basin area (Gibbs 1965; Meade et al. 1985). Also, maximum elevations can be estimated quickly from a topographic map. Ahnert (1970) pointed out the strong correlation between local relief and denudation (see review by Summerfield 1991)) but such a calculation be- comes difficult when dealing with the number and diversity of rivers cited here.
We subdivided river basins into five categories based on the maximum elevation within the hin- terland: high mountain (headwaters at elevations >3000 m), mountain (1000-3000 m), highland (500-1000 m), lowland (100-500 m ) and coastal plain (<lo0 m). Based on a preliminary analysis of the yields, mountainous rivers, comprising the largest data set, were subdivided into three catego- ries: Asia and Oceania (generally with very high sediment l~ads/yields)~ the high Arctic and non- alpine Europe (with low sediment loads/yields);
- - - -?-- _-----
- - - * - C - - c -.
,;/ "10,000 Km2 (Kusm R.) ./a " .** 40 ,000 Km2 (Mbom R.) -
a' / "100,000 l(mt( Hw,t R , ) .' - 500,000 Kmt (Hoilo R.)
Ip00,000 Km2(Orinoco R.) .
- 1,850,000 Kmt (Amur R.)
:/a: L 6,160,000Kmt(Amozon R.) , , , , , , 10 40 100 200 400 1000 10,000
rivers. Cumulative Number of River Basins (with decreasing basin size)

Journal of Geology S E D I M E N T D I S C H A R G E T O T H E O C E A N 527
and the rest of the world (i.e., North and South America, Africa, the Alps, and Asia Minor, Austra- lia, etc.). Clearly this classification is not without problems. For example, in terms of relief, a small island with elevations of 800-900 m probably should be considered mountainous, not upland. Still, as seen in the following analysis, our eleva- tion-based classification seems valid.
Geomorphologists and hydrologists often use the terms "yield," "sediment yield," or "specific yield" to compare sediment loads between dispa- rate river basins by normalizing sediment load rela- tive to size of the river basin (t/km2/yr). Way- thomas and Williams (1988) argue, however, that statistically the comparison of yield vs. basin area can give spurious results, since area is common to both axes; they propose the comparison of sedi- ment load and basin area instead. In this paper, data are presented in terms of both yield and load.
Our data base consists of the loads and yields for 280 rivers (table 1). Collectively these rivers account for >62 x lo6 km2, or about two-thirds of the land surface draining into the ocean (Milliman and Meade 1983). Basin sizes range from <200 lzm2 to >6,000,000 km2, and loads vary from <0.02 to >lo00 mtlyr. Where discharge values are avail- able, we have converted them to runoff (discharge1 basin area). The data come from many sources and from a wide variety of techniques, and therefore the quality is variable. Moreover, many of the data are recycled: for example, some of the data used by Lisitzin (1971) are from Strakov (1961), some of which came from Lopatin (1950) and early IAHSI Unesco compilations.
Modern river sediment loads seldom represent natural loads. Sediment discharge changes as ero- sion levels change or sediment is stored (i.e., river diversion projects). With the exception of Arctic rivers, where human civilization has had minimal impact, most rivers reflect the results of human activity on the erosional capacity of the rivers, both through deforestation and poor soil conserva- tion (see Milliman et al. 1987) and urbanization (Meade 1982). In contrast, the increased diversion and damming of many rivers has decreased sedi- ment discharge dramatically. The Nile and Colo- rado deliver no sediment to the ocean, and many other rivers, such as the Mississippi, Zambesi, and Indus, have experienced markedly decreased sedi- ment discharges in recent years. Sediment loads of other rivers have decreased because of other hu- man activities; for example, present-day bed loads of some northeast Italian rivers are 1.5 to 20 times lower than they were in the early 1950s because of legal and illegal riverbed dredging (Idrosser 1983;
I. N. McCave written comm. 1991). Often these human impacts work in conflicting ways: dams on the Ganges have decreased sediment discharge, whereas increased erosion in the mountains of Ne- pal (from deforestation) has increased the load of the confluent Brahmaputra (Hossain 1991). In this paper we cite sediment loads of rivers prior to river diversion (at least, where data are available). How- ever, the values given in this paper still reflect in- creased soil erosion and thus probably are higher than they would be in natural conditions.
Results
Plots of runoff vs. basin area, load vs, runoff, and loadlyield vs. basin area (figure 2) show a variety of trends. Runoff decreases with increased basin area (figure 2a), probably because larger river basins tend to include a greater proportion of "lowland," with reduced precipitation and increased evapo- transpiration (D. Walling written comm. 1991). Also, our data for smaller rivers are biased toward rivers with high runoff, as small rivers with low runoff are seldom gauged. With respect to sedi- ment load vs. runoff, we find the same random re- lationship noted by Walling and Webb (1985) for load vs. precipitation (figure 2b). In contrast, load/ yield vary directlylindirectly with basin area, al- though the scatter is considerable (figure 2c, d).
When we divide the rivers into the seven topo- graphic categories, a number of trends show much better correlation. For example, the orographic control of precipitation can be seen from the fact that higher elevation rivers have greater maximum values of runoff vs. basin area (figure 3). The greater scatter of runoff with decreasing basin size reflects the influence of local climate (i.e., precipitation vs. evaporation) in small basins. While the trends of sediment loadlyield vs. runoff vary with topogra- phy (figure 4), the correlation coefficients (r2) be- tween loadlyield and runoff within any topo- graphic category are not meaningful (table 2).
Log-linear trends within our seven topographic categories were determined from best-fit regres- sion analysis. In accordance with the well-accepted method for not allowing spurious data to influence the slope of the regression, points that fell more than one standard deviation from the determinant (y axis as load or yield) were plotted but not consid- ered in determining the variance accounted for by the best-fit curve (table 2). Our philosophy was simple: we could not be sure of what errors were hidden within sediment load data, we assumed lit- tle error in the x-axis (drainage basin area), and we wished to discount as few data points as possible.
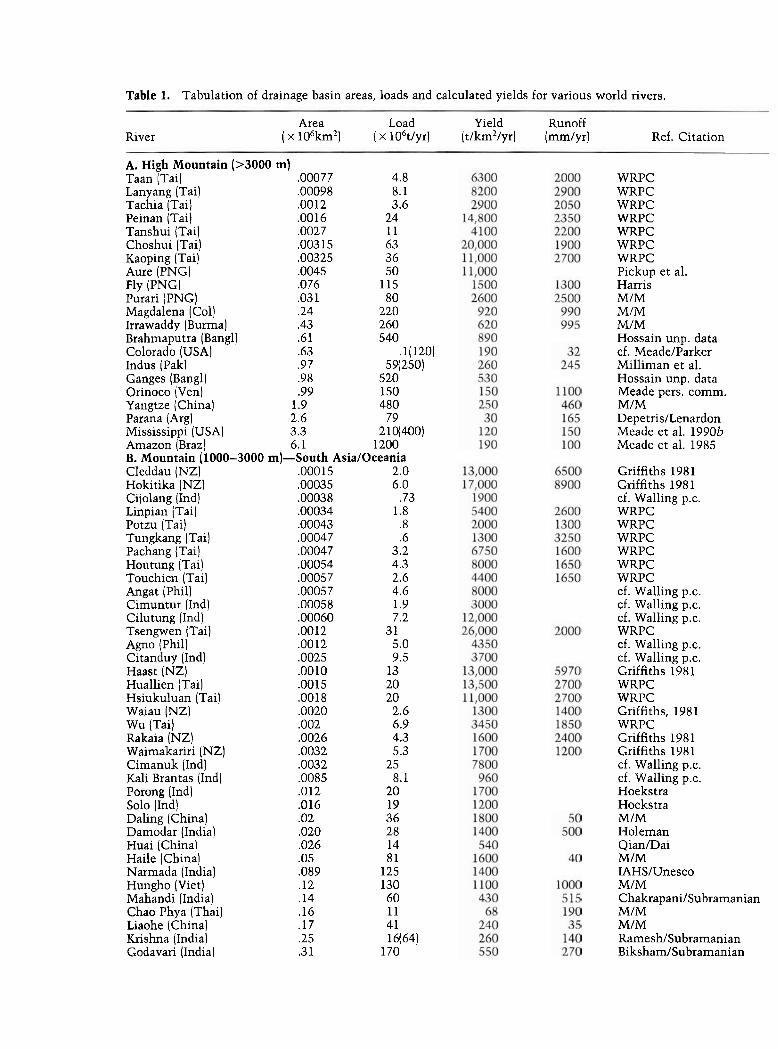
Table 1. Tabulation of drainage basin areas, loads and calculated yields for various world rivers.
River Area Load Yield Runoff
( x 106km2) ( x lO6tIyr) (t/km2/yr) (mmlyr) Ref. Citation
A. High Mountain (>3000 m) Taan (Tai) .00077 4.8 Lanyang (Tai) ,00098 8.1 Tachia (Tai) .0012 3.6 Peinan (Tai) ,001 6 24 Tanshui (Tai) .0027 11 Choshui (Tai) ,003 15 63 Kaoping (Tai) .00325 36 Aure (PNG) .0045 50 Fly (PNG) .076 115 Purari (PNG) .03 1 80 Magdalena (Col) .24 220 Irrawaddy (Burma) .43 260 Brahmaputra (Bangl) .61 540 Colorado (USA) .63 .1(120) Indus (Pak) .97 59(250) Ganges (Bangl) .98 520 Orinoco (Ven) .99 150 Yangtze (China) 1.9 480 Parana (Arg) 2.6 79 Mississippi (USA) 3.3 2 1 q400) Amazon (Braz) 6.1 1200 B. Mountain (1000-3000 m)-South AsiaIOceania Cleddau (NZ) ,00015 2.0 Hokitika (NZ) ,00035 6.0 Cijolang (Ind) .00038 .73 Linpian (Tai) .00034 1.8 Potzu (Tai) .00043 .8 Tungkang (Tai) .00047 .6 Pachang (Tai) .00047 3.2 Houtung (Tai) .00054 4.3 Touchien (Tai) .00057 2.6 Angat (Phil) .00057 4.6 Cimuntur (Ind) .00058 1.9 Cilutung (Ind) .00060 7.2 Tsengwen (Tai) .0012 3 1 Agno (Phil) .0012 5.0 Citanduy (Ind) .0025 9.5 Haast (NZ) .0010 13 Huallien (Tai) .OO 15 20 Hsiukuluan (Tai) .0018 20 Waiau (NZ) ,0020 2.6 Wu (Tai) .002 6.9 Rakaia (NZ) .0026 4.3 Wairnakariri (NZ) .0032 5.3 Cimanuk (Ind) ,0032 25 Kali Brantas (Ind) .0085 8.1 Porong (Ind) .012 20 Solo (Ind) .016 19 Daling (China) .02 36 Damodar (India) .020 28 Huai (China) ,026 14 Haile (China) .05 81 Narmada (India) .089 125 Hungho (Viet) .12 130 Mahandi (India) .14 60 Chao Phya (Thai) .16 11 Liaohe (China) .17 4 1 Krishna (India) .25 16(64) Godavari (India) .3 1 170
WRPC WRPC WRPC WRPC WRPC WRPC WRPC Pickup et al. Harris MIM MIM MIM Hossain unp. data cf. MeadelParker Milliman et al. Hossain unp. data Meade pers. comm. MIM DepetrisILenardon Meade et al. 1990b Meade et al. 1985
Griffiths 198 1 Griffiths 1981 cf. Walling p.c. WRPC WRPC WRPC WRPC WRPC WRPC cf. Walling p.c. cf. Walling p.c. cf. Walling p.c. WRPC cf. Walling p.c. cf. Walling p.c. Griffiths 1981 WRPC WRPC Griffiths, 1981 WRPC Griffiths 1981 Griffiths 1981 cf. Walling p.c. cf. Walling p.c. Hoekstra Hoekstra MIM Holeman QianIDai MIM IAHSIUnesco MIM Chakrapanilsubrarnanian MIM M/M RameshISubramanian BikshamISubramanian

Table 1. Continued
River Area Load Yield
( x 106km2) ( x 106t/yr) (t/km2/yr) Runoff
(mmlyr) Ref. Citation
Pearl (China) Huanghe (China) Mekong (Viet) C. Mountain (1000- Aso (Italy) Djer (Alg) El Harrach (Alg) Tenna (Italy) Lamone (Italy) Savio (Italy) Carmel (NA) Foglia (Italy) Redwood Cr. (USA) Puntenza (Italy) Hii (Japan) Mad (USA) Tronto (Italy) Esino (Italy) Bifemo (Italy) Metauro (Italy) Tarsus (Tur) Simento (Italy) Shkumbini (Alb) Nagara (Japan) Osumi (Alb) Bou Sellem (Mor) Maticora (Ven) Bradano (Italy) Pescara (Italy) Reno (Italy) Squamish (Can) Isser (Alg) Santa Clara (USA) Morondava (Mad) Ord (Austr) Semani (Alb) Lamone (Italy) Homathko (Can) Savio (Italy) Kliniklim (Can) Tuy (Ven) Eel (USA) Arno (Italy) Kuem (Korea) Gsksu (Tur) Drini (Alb) Ishikari (Japan) Rioni (USSR) Filyos (Tur) Tiber (Italy) Sous (Mor) Churokh (Tur) Stekine (Can) Seyhan (Tur) Ceyhan (Tur) Chira (Peru) Coruh (Tur) Meddjerdah (Alg) Cheliff (Alg) Klamath (USA)
.44 69 160
.77 1100 1400
.79 160 200 -3000 m)-NIS America, Africa, Alpine Europe, etc.
.00028 .18 600 ,00039 .68 1700 ,00039 .63 1600 .00049 .45 900 .00052 1.3 2400 .00060 1.1 1900 .00063 .40 63 5 .00070 1 .O 1200 .00073 1.2 1700 .00077 .45 600 .00092 .90 980 .0012 2.4 2000 .0012 1.1 900 .0012 .90 800 .0013 2.2 1700 .0014 1.2 870 .0014 .13 93 .0018 4.0 2000 .OO 19 6.8 3600 .0020 .4 210 .DO20 5.7 2800 .0023 .22 100 .0025 5.4 2200 .0027 2.8 1000 .003 1 .9 295 .0034 2.7 800 .0036 1.8 580 .0036 6.1 1700 .0042 6.0 1400 .0042 6.7 1600 .046 20 630 .0052 22 4200 .0052 12 2400 .0057 4.3 750 .0060 11 1900 .0065 5.0 770 .0066 12 1800 .008 14 1700 .008 1 2.2 270 .010 5.6 560 .010 2.5 250 ,012 15 1200 .013 1.8 150 .013 3.5 630 .013 4.2 320 .016 6.8 350 .016 1.6 260 .017 15 880 .018 20 1100 .019 5.2 270 .020 5.5 275 .02 20 1000 .020 8.1 400 .021 13 620 .022 3.1 140 ,022 2.4 160
Aquater cf. Walling p.c. cf. Walling p.c. Aquater IAHSIUnesco IAHSIUnesco
Aquater Nolan et al. Aquater IAHSIUnesco JandaINolan Aquater Aquater IAHSIUnesco IAHSIUnesco D.J.W. Piper p.c. cf. Holeman IAHSIUnesco cf. Walling 1985 IAHSIUnesco cf. Walling p.c. IAHSIUnesco IAHSIUnesco IAHSIUnesco IAHSIUnesco Hickin 1989 cf. Walling 1985 cf. Meade 1991 cf. Walling p.c. Kata cf. Holeman IAHSIUnesco SyvitskiIFarrow IAHSIUnesco SyvitskiIFarrow IAHSIUnesco MIM cf. Holeman ChoughIKim D.J.W. Piper p.c. MIM Jansen et al. cf. Hay Hay p.c. IAHSIUnesco Snoussi et al. cf. Hay Syvitski 1992 D.J.W. Piper p.c. D.J.W. Piper p.c. MIM Hay unp. data Tixeront Tixeront JandaINolan

Table 1. Continued
River Area Load Yield
( x 106km2) ( x 106t/yr) (t/km2Iyr) Runoff (mmlyr) Ref. Citation
Colorado (Arg) .023 6.9 300 Nakdong (Korea) .024 10 400 Han (Korea) .026 3(> 10) >400 San Juan (USA) .03 1 4.9 160 Tana (Kenya) .032 32 1000 Russian (USA) .036 24 680 Yesil-Irmak (Tur) .034 0.36(19) 560 Sebou (Mor) .040 26 930 Skeena (Can) .042 11 260 Sakarya (Tur) .046 6.2(8.8) 200 Kuban (USSR) .048 7.7 160 Susitna (USA) .05 25 500 Moulouya (Mor] .05 1 6.6 130 Copper (USA) .06 70 1200 Po (Italy) .054 13 280 Kizil-Irmak (Tur) .074 0.46(23) 310 Ebro (Spain) .085 1.5(18) 210 Rhone (Fra) .09 3 1 340 Negro (Arg) .10 13 140 Brazos (USA) . l l 16 140 Rhine (Ger) .17 0.72 4 Rufiji (Tanz) .18 17 95 Kura (USSR) .18 37 200 Fraser (Can) .22 20 9 1 Limpopo (Mozam) .4 1 33 80 Columbia (USA) .67 lO(15) 22 Rio Grande (USA) .67 0.8(20) >30 Danube (Rom) .81 6 7 83 Orange (SA) .89 17(89) 100 Yukon (USA) .84 60 71 Tigris-Euphrates (Iraq) 1.05 >53(?) >52(?) Murray [Austr) 1.06 30 29 Zambesi (Mozam) 1.4 20(481 35 MacKenzie (Can) 1.8 42 23 Amur (USSR) 1.8 52 28 Nile (Egypt) 3.0 o(120) 40 Zaire (Zaire) 3.8 43 11 D. Mountain (1000-3000 m)-Non-Alp Europe and High Arctic Lewis (Can) .00020 .01 730 Ekalvgad Fjord (Can)
South .0009 .05 590 Middle .00011 .064 600 North .00019 .14 720
Ardour (Fra) .016 .24 18 Colville (USA) .05 6 120 Babbage (Can) .05 3.5 70 Garonne (Fra) ,055 2.2 44 Kuskokwim (USA) .08 5-lo(?) 100 Loire [Fra) .115 1.5 13 E. Upland (500-1000 m) Arzilla (Italy) .00010 .13 1300 Tesino (Italy) .OOO 1 1 .12 1100 Gurabo (PR) .OOO 16 .26 1700 Ete Vivo (Italy) .00018 .29 1600 Grande (PR) ,00023 .42 1800 Esk (NZ) .00025 .27 1100 Erhian (Tai) .00035 12.5 36,000 Misa (Italy) .00038 .47 1300 Waioeka (NZ) .00064 .38 590 Ruamahanga (NZ) .00064 .23 360
cf. Holeman LeeIChough Schubel et al. cf. Holeman M/M JandaINolan Hay unp. data Snoussi et al. Binda et al. Hay unp. data cf. Lisitzin cf. MeadelParker cf. Walling p.c. cf. MeadelParker IAHSIUnesco Hay unp. data Palanques et al. MIM cf. Holeman JudsonIRitter Lisitzin MIM Lisitzin MIM M/M Meade et al. 1990b MeadelParker MIM RooseboomIHarmse MeadelParker MIM MIM MIM Syvitski 1992 MIM Sestini MIM
Church
Church Church Church Snoussi et al. MIM Forbes cf. Probst cf. Syvitski Manikam et al.
Aquater Aquater SimonIGuzman-Rios Aquater SimonIGuzman-Rios Griffiths 1982 WRPCITaiwan 1988 Aquater Griffiths 1982 Griffiths 1982
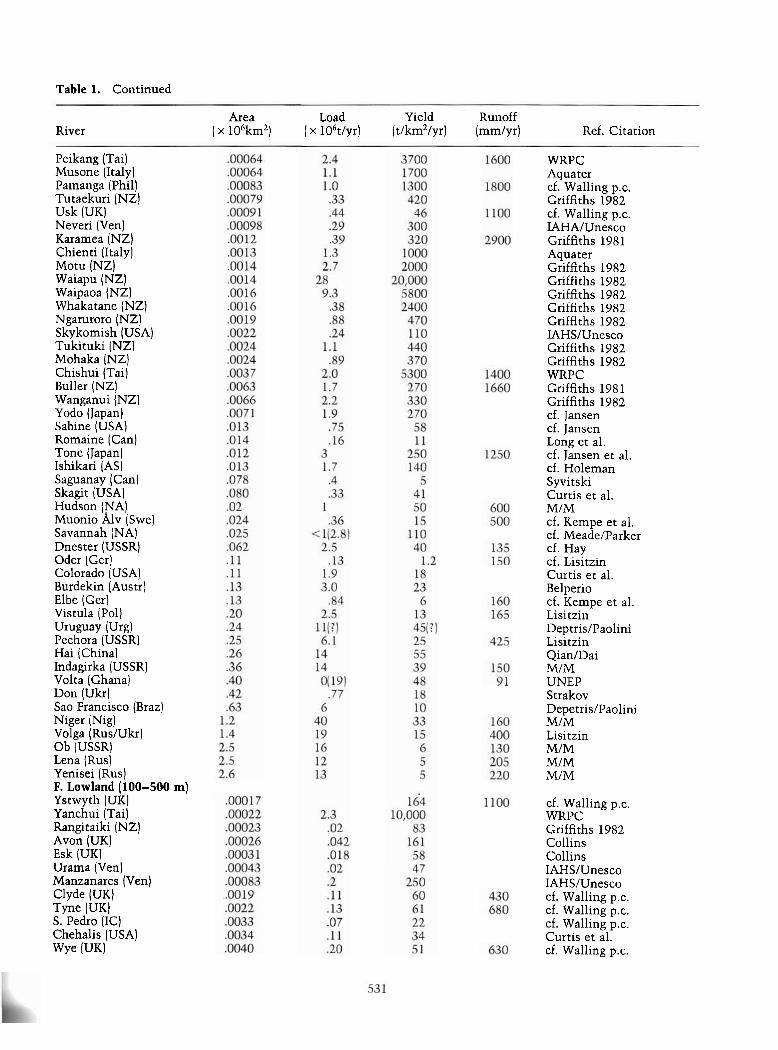
Table 1. Continued
River Area
( x 106km2) Load Yield Runoff
( x 106t/yr) (t/km2/yr) (mmlyr) Ref. Citation
Peikang (Tai) Musone (Italy) Pamanga (Phil) Tutaekuri (NZ) Usk (UK) Neveri (Ven) Karamea (NZ) Chienti (Italy) Motu (NZ) Waiapu (NZ) Waipaoa (NZ) Whakatane (NZ) Ngaruroro (NZ) Skykomish (USA) Tukituki (NZ) Mohaka (NZ) Chishui (Tai) Buller (NZ) Wanganui (NZ) Yodo (Japan) Sabine (USA) Romaine (Can) Tone (Japan) Ishikari (AS) Saguanay (Can) Skagit (USA) Hudson (NA) Muonio Alv (Swe) Savannah (NA) Dnester (USSR) Oder (Ger) Colorado (USA) Burdekin (Austr) Elbe (Ger) Vistula (Pol) U W ~ Y (Urg) Pechora (USSR) Hai (China) Indagirka (USSR) Volta (Ghana) Don (Ukr) Sao Francisco (Braz) Niger (Nig) Volga (RusIUkr) Ob (USSR) Lena (Rus) Yenisei (Rus) F. Lowland (100-500 m) Ystwyth (UK) Yanchui (Tai) Rangitaiki (NZ) Avon (UK) Esk (UK) Urama (Ven) Manzanares (Ven) Clyde (UK) Tyne (UK) S. Pedro (IC) Chehalis (USA) W Y ~ (UKJ
WRPC Aquater cf. Walling p.c. Griffiths 1982 cf. Walling p.c. IAHA/Unesco Griffiths 1981 Aquater Griffiths 1982 Griffiths 1982 Griffiths 1982 Griffiths 1982 Griffiths 1982 IAHSIUnesco Griffiths 1982 Griffiths 1982 WRPC Griffiths 1981 Griffiths 1982 cf. Jansen cf. Jansen Long et al. cf. Jansen et al. cf. Holeman Syvitski Curtis et al. MIM cf. Kempe et al. cf. MeadelParker cf. Hay cf. Lisitzin Curtis et al. Belperio cf. Kempe et al. Lisitzin DeptrisIPaolini Lisitzin QianIDai M/M UNEP Strakov DepetrisIPaolini M/M Lisitzin M/M M/M M/M
cf. Walling p.c. WRPC Griffiths 1982 Collins Collins IAHSIUnesco IAHSIUnesco cf. Walling p.c. cf. Walling p.c. cf. Walling p.c. Curtis et al. cf. Walling p.c.

Table 1. Continued
River Area Load Yield Runoff
( x 106km2) ( x lO6tIyr) (t/km2/yr) (mmlyr) Ref. Citation
St. Jean (Can) Severn (UK) Cape Fear (USA) Rappahannock (USA) Tano (Ghana) Delaware (USA) Pearl (USA) Scheldt (Bel) Abitibi (Can) Potomac (USA) Roanoke (USA) Santee (USA) Meuse (Neth) Altamaha (USA) Attawapiskat (Can) Weser (Ger) Mbam (Ghana) Tombigbee (USA) Y. Bug (USSR) Alabama (USA) Susquehanna (USA) Moose (Can) Seine (Fra) Nottaway (Can) Sanaga (Cam) Yana (USSR) Senegal (Sen) Severnay Dvina (USSR) Dnieper (USSR) Kolyma (USSR) Sao Francisco (Braz) St. Lawrence (Can) G. Coastal Plain (<lo0 m) Creedy (UK) Welland (UK) Exe (UK) Bristol Avon (UK) Swale (UK) Nene (UK) Ely Ouse (UK) Neuse (USA) Ogeechee (USA) Pamlico (USA) Peedee (USA) Kalkkinen (Fin) Kymi joki (Fin) Apalachicola (USA) Tar (USA)
Syvitski cf. Walling p.c. Simmons Meade et al. 1990a AkrasiIAyibotele JudsonIRitter Curtis et al. SalomonsIMook Syvitski JudsonIRitter cf. MeadelParker cf. MeadelParker IAHSIUnesco cf. MeadelParker Syvitski cf. Kempe et al. AkrasiIAyibotele Curtis et al. cf. Hay Curtis et al. cf. MeadelParker Syvitski cf. Manickam et al. KranckIRufman UNEP cf. Lisitzin MartinsIProbst cf. Lisitzin cf. Hay cf. Lisitzin M/M M/M
cf. Walling p.c. WilmotICollins cf. Walling p.c. cf. Walling p.c. Collins Wilmot/Collins Wilmot/Collins Simmons Curtis et al. Curtis et al. Curtis et al. cf. Kempe et al. cf. Kempe et al. JudsonIRitter Meade et al. 1990b
Note. In most cases loads and yields have been rounded to the second digit. Load value in parentheses indicates pre-dam values, which have been used in compiling the loadlyield vs. basin area trends (figures 4-8). Y and L designate rivers whose yields (Y) or loads (L] are >1 s.d. from the computed mean; therefore they have not been used in calculating the equations and correlation coefficients in table 2. Alb = Albania; Alg = Algeria; Arg = Argentina; Austr = Australia; Bang1 = Bangladesh; Belg = Belgum; Braz = Brazil; Can = Canada; Col = Colombia; Fin = Finland; Fran = France; Ger = Germany; IC = Ivory Coast; Ind = Indonesia; Mad = Madagascar; Mor = Morocco; Mozam = Mozambique; NZ = New Zealand; Nig = Nigeria; Pak = Pakistan; PNG = Papua New Guinea; Phil = Philippines; Pol = Poland; PR = Puerto Rico; Rom = Romania; SAf = South Africa; Sen = Senegal; Swe = Sweden; Tai = Taiwan; Tanz = Tanzania; Thai = Thailand; Tun = Tunisia; Tur = Turkey; Urg = Uruguay; Ven = Venezuela; Viet = Viet Nam. MM: cf. MillimanIMeade

Journal of Geology S E D I M E N T DISCHARGE T O THE O C E A N 533
. 10 " a . . ... ".I . . ..... .l . r . . .0001 ,001 .01 .1 1 10
BASIN AREA x 106(km2)
. a
10 100 lo00 10000
RUNOFF (mmlyr)
h
10 0 . . . e . 8
1 . P . a
.1 """A " " -- .0001 .001 .01 .1 1 10 .0001 .001 .01 .1 1 10
BASIN AREA x 1 06(km 2, BASIN AREA x 1 06(km *) Figure 2. Runoff vs. basin area (A); sediment yield vs. runoff (B); and load (C); and yield (D) vs. basin area for the rivers listed in table 2. Note the generally inverse relationship between runoff and yield with basin area, the strongly positive correlation between load and basin area, and the great amount of scatter for yield vs. runoff.
As can be seen in table 2, <lo% of the rivers were discounted on the basis of having either load or yield values more than 1 standard deviation from the mean. In fact, deviations from the predicted norm often reflect either unique fluvialldrainage basin conditions or possible erroneous data bases; various examples are discussed below.
For loadlyield vs. basin area, the correlations with the various topographic categories are gener- ally good, ranging from 0.70 to 0.82 (load vs. area) and 0.62 to 0.89 (yield vs. area) (figures 5 and 6; table 2). The relatively poor correlation coefficients (r2 = 0.81 for load, but 0.32 for yield) for coastal plain rivers, however, suggest that basin area plays little or no role in determining sediment discharge from these low-lying rivers.
Mountainous rivers have greater loads and yields than do upland rivers, which in turn have greater loads and yields than lowland rivers (figures 5 and 6), although there is some overlap in values. For example, mountainous rivers with basin areas
of about 10,000 km2 have sediment yields between 140 and 1700 t/km2/yr (e.g., Negro, Porong), whereas yields for similar-sized upland rivers are 60-250 (e.g., Sabine, Tone), and lowland rivers 20-60 (e.g., Cape Fear River). With the exception of two rivers (Waiapu and Niger), no upland, low- land or coastal plain river has a sediment load >20 mt, even though more than 25 upland and lowland rivers have drainage basin areas >100,000 km2. In contrast, nearly 60 mountainous rivers have loads 1 2 0 mt (table 1). Mountainous rivers draining South Asia and Oceania have much greater yields (2-3 fold) than rivers draining other mountainous areas of the world, and an order of magnitude greater than rivers draining high-Arctic and non- alpine European mountains (figure 5).
The trend of increasing sediment yield with de- creasing size of mountainous rivers becomes less pronounced in river basins less than about 4000 km2 in area, as seen by the relative number of riv- ers that fall > 1 standard deviation from the mean

iU J O H N D . M I L L I M A N A N D J A M E S P. M . SYVITSKI
lorno HIGH MOUNTAIN RIVERS . MOUNTAIN RIVERS (1000-3000 m)
lorn UPLAND RIVERS LOWLAND & COASTAL PLAIN RIVERS
10 11 .0001 .001 .O1 1 1 10 .mo1 .001 .01 .1 1 10
AREA x 10'(km2) AREA x 10'(km2) Figure 3. Variation of runoff vs. basin area for rivers within four topographic categories. Note the decreasing maxi- mum runoff values with increased river basin area and with lower elevations.
(table 1). Some very small rivers in New Zealand and Taiwan, for example, have yields much lower than expected, while others have much higher yields; together they account for one-third of the deviating rivers designated in table 1. Slaymaker (1987) noted a decreased sediment yield in rivers <lo00 km in western Canada. This variance of sediment yield in very small river basins probably reflects the dominance of single types of geology or microclimate in small basins, whereas larger river basins are modulated by a greater range of condi- tions.
With the exception of the high Arctic, latitude does not appear important. Equatorial rivers (e.g., the Tana in Kenya) do not have significantly higher yields than rivers of similar size in higher latitudes e.g., the Susitna in Alaska). High-Arctic mountain- ous rivers whose headwaters rise in the Arctic (e.g., Colville, Babbage), however, have much lower yields than Arctic rivers whose headwaters are in lower latitudes (e.g., Copper, Yukon, MacKenzie). The reason is not clear, but i t may be related to lower levels of precipitation and shorter periods
during which the rivers can transport sediment (Milliman and Syvitski, unpub. data).
Discharge of Sediment by World Rivers
North America. Most rivers draining eastern North America are upland, lowland, or coastal plain rivers, with correspondingly low sediment loads. Much of the sediment leaving the contigu- ous United States and Canada comes from three large rivers-the Mississippi, MacKenzie, and Col- orado (now dammed)-and smaller west coast riv- ers (e.g., Eel, Columbia, Fraser), most of which drain mountains. Large discharges of sediment also come from rivers draining western Canada and Alaskaj the Susitna, Cooper, and Stekine rivers, for example, collectively drain an area <4% that of the Mississippi, but discharge nearly a third as much sediment (table 1); the many other rivers along this coast also must contribute large amounts of sediment: the average thickness of Ho- locene sediment on the southeast Alaskan shelf is 55 m (Molnia et al. 1978) and fjords into which

11 I I I 10 100 1000 10000
RUNOFF (mrnlyr)
10 100 1000 10000
RUNOFF (mmlyr)
A = HlGH MOUNTAIN (>3000m) B = SOUTH ASIA/OCEANIA (1000-3000m) C = NIS AMERICA, AFRICA 8 ALPINE EUROPE (1000-3000m) D = NON-ALPINE EUROPE & HlGH ARCTIC (1000-3000m) E =UPLAND (500-1000m) F = LOWLAND (100-500m) G = COASTAL PLAIN (<100m)
Figure 4. Relation of sediment yield and runoff for the seven topographic categories of river basins listed in table 1. The equations for the slope plus the correlation coefficients are given in table 2. In nearly all instances, the correlation coefficients are poor and the deviations from the trend are numerous.

536 J O H N D . M I L L I M A N A N D TAMES P . M . S Y V I T S K I
Table 2. Equations and Correlation Coefficients (R2) for LoadIYield versus Runoff and Basin Area.
Y = aRb Q, = cAd Y = cAf
River System (m) a b r2 c d r2 c f r Nd
>3000 .5 1.16 .66 280 .46 .80 280 - .54 .84 21 1000-3000
area l a 20 .65 .40 170 .52 .70 210 - .46 .76 41 area 2b 10 .56 .19 65 .56 .74 65 - .46 .70 90 area 3' . . . . . . . . . 50 .73 .78 25 - .39 .89 10
500- 1000 .002 1.74 .56 12 .42 .82 12 - .59 .89 55 100-500 .002 1.67 .49 8 .66 .8 1 8 - .34 .62 43 <lo0 .001 1.57 .36 1 .64 .8 1 5 - .20 .32 ,15
Note. R = runoff (mmfa); A = area (km2 x lo6); Q, = load (tla x lo6); Y yield (t/km2a). a, b, c, d, e, f = regression coefficients. rz = data variance accounted. " Area 1 = NIS America, Africa, Alpine Europe.
Area 2 = South Asia and Oceania. Area 3 = Non-alpine Europe and High Arctic. N = number of rivers.
many of these rivers discharge have Quaternary sediment thicknesses >500 m (Syvitski et al. 1987).
South America. Eastern South America is drained by four major rivers (Magdalena, Orinoco, Amazon, Parana) all having their headwaters in the Andes Mountains. Collectively they drain more than half the continent (10 of 17 million km2). In contrast, rivers draining the western Andes are less known, but collectively their sediment discharge may be of the same magnitude as the larger rivers draining eastward (smaller area but higher yields). If the average river draining the western sides of the mountains is 15,000 km2, then the average sed- iment yield would be about 1200 t/km2/yr (figure 6c), equaling a sediment discharge of 2.4 btlyr (1200 multiplied by an area of 2 x lo6 km2). This calculated sediment flux may be unrealistically high, as the arid parts of the western slope may contribute little sediment to the sea; nevertheless, the total sediment discharge from western South American rivers probably is much higher than the 168 mt estimated by Milliman and Meade (1983). At present we can cite only one west coast river, the Chira (Peru), and the data represent only two years of measurement, for one of which, however, the load was 75 mt (yield 3700 t/km2: Burz 1977).
Europe. Europe is generally regarded as having the lowest sediment flux to the sea (e.g., Holeman 1969; Milliman and Meade 1983). However, the Alps (a collision orogen) are a major sediment source, and the short rivers draining south into the Mediterranean have high to very high yields, gen- erally 500 to >I000 t/km2/yr (table 2). For exam- ple, the little known Semani River (Albania) has
more than twice the annual discharge (22 mt) of the collective sediment discharges of the well- known north-flowing rivers Garonne, Loire, Seine, Rhine, Weser, Elbe, Oder, and Vistula, most of which drain upland or lowland terrain. Many rivers draining north from the Alps are tributaries to the Danube, the largest river in Europe. The Rhine is the only large alpine river that drains north to the sea, but most of its sediment load is trapped in Lake Constance; upstream of Lake Constance, the river has a sediment yield consistent with other alpine rivers, but downstream of the lake, its yield is similar to a lowland/coastal plain river (Hole- man 1968).
USSR and Asia Minor. The large rivers of the for- mer Soviet Union draining north to the Arctic Sea (Ob, Lena, and Yenesi) are generally considered to have anomalously low sediment yields (see Milli- man and Meade 1983). However, their sediment yields and those of other Russian rivers correlate well with other upland and lowland rivers through- out the world (table 1; figure 6). Russian and Ukrai- nian rivers draining south into the Black Sea are considered lowland rivers, with correspondingly low sediment loads.
Although poorly documented in western litera- ture, the rivers draining the Caucasus Mountains and the Anatolian and Taurus mountains in Tur- key have high sediment yields, which is to be ex- pected from rivers draining the same collision oro- gen as the Alps. Before dam construction in the 1950s, the three largest Turkish rivers emptying into the Black Sea discharged an estimated 50 mt of sediment annually (Hay 1992). Collectively, in fact, the rivers draining northern Turkey and the

HIGH MOUNTAIN
S .01
MOUNTAIN 2 .Ol ASIA-OCEANIA
10000 - C MOUNTAIN 1000 - NIS AMERICA, AFRICA,
ALPINE EUROPE
a 0 .or . J
,001 I I I
E UPLAND
1 ' LOWLAND
[ G COASTAL PLAIN
lorno[ D MOUNTAIN r h
1000 - NON-ALPINE EUROPE, L 3 100 - HIGH ARCTIC Y
,001 I I 1
0.00001 .OO 1 1 10 0.00001 .001 .1 10
AREA x lo6 ( k d ) AREA x 10' (krn2)
Figure 5. Variation of sediment load with basin area for the seven topographic categories of river basins listed in table 1. For all river types the correlation is strong (r2 ranging from 0.70 to 0.82). Note that only 13 rivers deviate by more than one standard deviation from the computed means.

W . HlGH MOUNTAIN
LOWLAND .. MOUNTAIN ASIA-OCEANIA
MOUNTAIN NIS AMERICA. AFRICA.
COASTAL PLAIN
I I I I I I I I I 0.00001 ,001 1 10 0.00001 ,001 .1 10
AREA x 10'(km2) AREA x 106(km2)
100000'
h L ,, 10000- \ (Y
Figure 6. Variation of sediment yield with basin area for the seven topographic categories of river basins listed in table 1. For all river types, except lowland and coastal plain rivers, the correlation is strong (r2 ranging from 0.70 to 0.89).
D MOUNTAIN NON-ALPINE EUROPE, HlGH ARCTIC
0 100- J w
10 '

Journal of Geology SEDIMENT DISCHARGE T O T H E OCEAN 539
western Caucasus Mountains may contribute more sediment to the Black Sea than the Danube and southwestern Russian and Ukranian rivers.
Africa. Rivers draining Africa discharge a dis- proportionately small amount of sediment to the sea, although the discharge calculated by Milliman and Meade (1983) is probably low (Walling 1985). At first it seems incongruous that Africa, one of the highest-standing continents (in terms of aver- age elevation), has a low sediment flux. Only when viewed in terms of drainage basin morphology does the discharge pattern make sense; some large riv- ers with low loads (e.g., Senegal, Niger) are non- mountainous, and many small rivers in western Africa are lowland rivers, with correspondingly low sediment loadslyields. The major sediment discharge comes from rivers draining the rift mountains in eastern Africa (Nile, Zambesi, Lim- popo, Rufiji) or rivers draining the mountains in Morocco, Algeria, and Tunisia (e.g., Mouloura, Sebou, Cheliff). The loads and yields of these rivers compare well with other mountainous rivers of similar size. The lack of rainfall throughout most of central Africa contributes to the low discharge rates (Walling 1985).
Asia and Oceania. With the notable exception of the loess-imparted Yellow River basin, the high sediment yield in Asia is restricted to rivers drain- ing the Himalayan Mountains in southern Asia. These loads and yields are substantially higher than all other mountainous rivers of the world (save Oceania). Rivers draining eastern Asia have normal (Korea) or low (Japan) sediment loads rela- tive to other mountainous rivers; dams in Japan may be important in these values. The Chao Phya has a much smaller load (11 mt) and yield (68 t/ km2/yr) than other south Asian rivers of similar size; one wonders if the river basin has anomalous erosion patterns or if the data are erroneous.
Milliman and Meade (1983) used data from Tai- wan and New Zealand to suggest that rivers drain- ing the high-standing islands between Australia and Asia have unusually high sediment yields. As- suming a sediment yield of 1000 t/km2/yr, they calculated that these high-standing islands may ac- count for 20% of the global sediment flux to the oceans. In fact, new data from New Guinea, the Philippines, Java, New Zealand and Taiwan (table 1) suggest average yields closer to 3000!
Australia. While Australia is nearly as large in area (2.2 x lo6 km2) as the islands in Oceania, the continent is generally low standing. Only rivers draining mountainous areas in the north (e.g., Ord) and east (e.g., Murray) appear to have high loads. The fact that much of Australia has an arid climate
accentuates the low discharge from rivers, al- though the yields from the Ord, Murray, and Bur- dekin compare favorably with other rivers of simi- lar size (table 1).
Implications
Factors Controlling Sediment Discharge. The data presented in tables 1 and 2 and figures 5 and G clearly show the importance of basin size and to- pography in terms of sediment discharge. Because sediment yields are strongly dependent upon the size of the drainage basin, they cannot be portrayed accurately on a map; global displays of sediment yields (e.g., Milliman and Meade 1983; Walling 1987) essentially reflect topography (as well as ba- sin size)-high yields equate to mountainous ar- eas, low yields to lowlands.
While many of our data need to be re-evaluated and updated, we suggest that topography and basin area have order-of-magnitude control over sedi- ment discharge of most rivers. In contrast, average net precipitation and runoff generally affect sedi- ment discharge to a lesser extent. For example, the Orange, Sous, and Isser rivers, which drain arid ba- sins, have similar or slightly lower sediment yields than mountainous rivers with moderate rainfall, whereas rivers draining areas with very heavy pre- cipitation (e.g., Solo, Purari, Cooper) have slightly higher yields (see table 1).
The role of sediment erodability (mainly a func- tion of geology, vegetation cover and human activ- ity) clearly cannot be discounted. High erosion rates throughout much of southern Asia partly re- flect poor soil conservation, the result of deforesta- tion and over-farming. Milliman et al. ( 1987) con- cluded that the Huanghe's sediment load was an order of magnitude lower before humans began farming the loess hills of northern China. (Saun- ders and Young [1983] suggested that moderate land use can increase sediment yield by a factor of 2-3, while intensive land use can increase it an order of magnitude.) In contrast, the anomalously low sediment yields of rivers northern European and English rivers at least partly reflect river chan- nel management (see Petts et al. 1989) combined with extensive vegetation cover and relatively low soil erodibility (D. Walling 1991 written comm.). The Oder, for example, has the lowest yield (1.2) of any river cited in this paper.
We should emphasize that elevation or relief is, in some ways at least, only a surrogate variable for tectonism. This paper and others (e.g., Hay et al. 1989) that have emphasized the correlation be- tween topography and sediment yield, relief or ele-

540 J O H N D. M I L L I M A N A N D TAMES P . M . SYVITSKI
vation is used, because it is easily expressed nu- merically and therefore can be manipulated as a statistical variable. However, the strong correla- tion between sediment and topographic relief may not indicate that the second is the cause of the first, but rather that both are caused by another factor less susceptible to numerical description- namely, tectonism. It is probably the entire tec- tonic milieu of fractured and brecciated rocks, oversteepened slopes, seismic and volcanic activ- ity, rather than simple elevation/relief, that pro- motes the large sediment yields from active oro- genic belts.
What Is the Sediment Flux to the Sea3 This ques- tion really has two parts: how much sediment is carried by rivers, and how much escapes the present-day land/estuarine environment? The an- swer to both is more or less the same-we don't know. The sediment discharged, however, may be more than previously estimated. Milliman and Meade (1983) calculated an annual global discharge of 13.5 bt by extrapolating average sediment yields for documented rivers over large regions with simi- lar topography. However, since the data used by Milliman and Meade came mostly from large riv- ers, the yields were necessarily lower than if they also had included smaller rivers. In addition, con- strained by the lack of data, Milliman and Meade conservatively estimated the yields for mountain- ous coastal rivers to be 1000 t/km2/yr. The new data presented in this paper suggest that the yields for rivers draining Oceania are probably r30001 km2/yr, meaning that the high-standing islands of Oceania (approximate area of 3 x lo6 km2) may be closer to 9 bt than the 3 bt estimated by Milliman and Meade! Similar percentage increases might hold for southeastern Alaska, western South America, the southern Alps-Caucasus orogen and NW Africa (e.g., Walling 1985).
There is another way to calculate the flux: The rivers listed in table 1 >10,000 km2 account for a combined 62 x lo6 km2 in drainage basin area, and collectively they discharge (before dam construc- tion) slightly more than 8 bt of sediment annually. River basins <10,000 km2 account for slightly >20% of the total drainage area to the ocean (20 x lo6 km2; figure 1). Assuming that the mean drainage basin area of these rivers is 1000 km2, an additional 20,000 rivers would be required to ac- count for the entire 20 x lo6 km2. If we assume that 10% of these rivers (i.e., 2000) are mountain- ous and that of these half drain high mountains and or AsiaIOceania and the other half drain mountains exclusive of the Arctic and non-alpine European, the combined loads of these rivers
would be (8mtlriverlyr x 1000 rivers) + (1.5 mt/ riverlyr x 1000 rivers) (see figure 5), or a total of 9.5 btlyr. This number is surprisingly close to our estimate for the rivers (mostly small) draining Oce- ania, but since it does not include southern Asia or western North and South America, our calculation may be too conservative. Although the yields for similar-sized upland and lowland rivers are sig- nificantly lower (900 and 90 t/km2/yr, respec- tively), there are more of them, and the combined small upland and lowland rivers might contribute another 1-2 bt annually. Adding undocumented rivers larger than 10,000 km2 probably would add another 1-2 bt. The combined total suspended dis- charge conservatively might be 20 bt.
A regional example of the influence of small mountainous rivers in sediment discharge can be seen in southern Europe. Milliman and Meade (1983) pointed out that the rivers draining south from the Alps have much higher yields than those rivers draining northern Europe. Assuming a yield of 120 t/km2/yr and a combined drainage area of 0.55 x lo6 km2, Milliman and Meade calculated that the southern rivers discharge 66 mt/yr to the Mediterranean Sea. In fact, the sediment loads of southern alpine rivers are much greater: the 24 mountainous rivers listed in table 1 drain only 0.22 x lo6 km2, but collectively they discharge more than 140 mt of sediment annually. If the values are similar for the remainder of the combined drainage area, total sediment discharge would be 350 mtlyr, five times the value calculated by Milliman and Meade.
Unfortunately, calculating world-wide dis- charge is more complicated, because not all sedi- ment carried by large rivers reaches the sea: some is stored along the lower reaches of rivers and ad- joining deltas. If subsidence rates in the Bengal Delta are 1-2 cm/yr (cf. Milliman et al. 1989; J.R. Curray oral communication 199 1 ), for example, 40-80% of the sediment load carried by the Gan- ges/Brahmaputra may be sequestered in the subaer- ial portion of the delta, perhaps explaining the rela- tive lack of Holocene sediment accumulating on the adjacent shelf (Kuehl et al. 1989) and the lack of net progradation of the delta front (Alam 1987). As a result, it is entirely possible that the present sediment discharge of large rivers has been overes- timated.
Because rivers are being dammed at an increas- ing rate, many of the numbers given in this paper are probably out of date. Pearce (1991) states that 13% of all fluvial discharge is presently dammed. Ironically, with their high sediment yields and therefore (at least relatively) high sediment loads,

Journal of Geology S E D I M E N T D I S C H A R G E T O T H E O C E A N 541
Asian rivers can fill their dammed reservoirs quickly, thereby shortening the lives of these dams more quickly than calculated by the engineers who designed them. But since pre-dam sediment loads for most rivers were artificially high due to human activities in the drainage basins, dam construction, for example on the southeastern US rivers, proba- bly has offset anthropogenically enhanced erosion, and post-dam discharges may not be too different from those prior to European colonization (Meade and Parker 1985).
Even if the present global flux of river sediment could be calculated, the significance of such a number to either future or past river discharge is questionable. Mid-twentieth century river dis- charge (to the sea) may have been about 20 btlyr, nearly half of this amount coming from Oceania and another third from southern Asia. But because sediment loads may have increased by a factor of 2-10 since humans began farming (see Saunders and Young 1983; Berner and Berner 1987), the an- nual sediment discharge 2000-2500 yr ago may have been considerably <10 bt. Extensive human influence in Oceania and southern Asia suggests that sediment loads in this area are disproportion- ately elevated.
Active vs. Passive Margin Rivers. All rivers with large sediment loads originate in mountains. Most large rivers discharge to the sea along passive conti- nental margins, and they act as point-sources for sediment influx; as a result, large deltas (e.g., Mis- sissippi, Nile, Amazon, Ganges, Indus, Yangtze) form on passive margins or in marginal seas (Audley-Charles et al. 1977; Inman and Nordstrom 1971; Potter 1978).
In contrast, rivers that drain mountainous is- lands and the active edges of continental margins (e.g., western North and South America) or colli- sion margins (southern Europe, southern Asia) are generally much smaller, but collectively they may transport similar amounts of sediment as do pas- sive margin rivers. In most instances, however, classic deltas do not form, although coalescing del- taiclfan deposits may form along the outer con- tinental margins (e.g., Thornberg et al. 1990). Because these small rivers empty onto active mar- gins, the deposits may be subducted, such that the sedimentary sequences are neither thick nor old. The sedimentary sequences also should experience an accelerated thermal history, thus complicating petroleum maturation.
These calculated trends still may underestimate the relative importance of small rivers in terms of sediment delivery to the sea: smaller rivers often have no estuaries, are more susceptible to periodic
floods and (because of their steeper gradients and proximity to source material) have larger contribu- tions from bedload material, which seldom is in- cluded in the sediment load values reported in the literature (e.g., Syvitski and Farrow 1983). In addi- tion, along active margins earthquakes and volca- nic eruptions can result in mudslides and floods that can increase the sediment loads of adjacent rivers. In the four months following the eruption of Mount St. Helens (Washington State), for exam- ple, the sediment load of the Cowlitz River (a trib- utary of the Columbia) was 140 mt, compared to a normal annual load for the Columbia of 10 mt (Hubbell et al. 1983); for the few years after the eruption, the Columbia River discharged an esti- mated 35 mtlyr (Meade and Parker 1985).
Smaller mountainous rivers are therefore more likely to discharge larger percentages of their sedi- ment loads directly to the sea than do larger rivers. Moreover, the sediment is more likely to escape the narrow shelves to deeper basins during both high and low stands of sea level.
The Santa Clara River (southern California) serves as an example of both the episodicity and shelf-escape possible with small rivers. During 18 yr of monitoring, more than half the total sediment transported by the Santa Clara was carried in three floods, lasting a total of seven days (Milliman 1991, after Meade 1992). Following a major flood in 1969, Drake et al. (1972) traced the fate of the discharged sediment as it entered the Santa Barbara Basin and ultimately was dispersed there by a series of slumps and turbidity currents.
If sediment discharged from small mountainous rivers can by-pass active margins during high stands of sea level, then standard models of se- quence stratigraphy, which have been so successful in determining the position of eustatic sea level in older sedimentary deposits (e.g., Haq et al. 1987), may have less application off active margins. On the other hand, active margin deposits appear to be far less common in the geological record, probably because about of them are subducted back into the arclorogens that border the active margins (von Huene and Scholl 1991 I.
A C K N O W L E D G M E N T S
We thank G. A. Griffiths, D. Walling, R. H. Meade, B. J. Hay, M. B. Collins, and I. N. McCave for sup- plying unpublished data and pointing out pub- lished sources. Meade, McCave, and Walling, as well as M. G. Gross, B. U. Haq, and S. A. Schumm, helped considerably with their comments on ear- lier versions of this paper. A special thanks to
542 J O H N D . M I L L I M A N A N D J A M E S P . M . S Y V I T S K I
K. W. G. LeBlanc of the Geological Survey of Can- the Office of Naval Research for long-term support ada for his liaison and data manipulation. JDM ac- through which many of the data and insights re- knowledges the National Science Foundation and garding rivers were collected.
R E F E R E N C E S C I T E D
Ahnert, F., 1970, Functional relationships between denu- dation, relief, and uplift in large mid-latitude drainage basins: Am. Jour. Sci, v. 268, p. 243-263.
Akrasi, S. A., and Ayibotele, N. B., 1984, An appraisal of sediment transport measurement in Ghanian rivers: Int. Assoc. Hydrol. Sci. Publ. 144, p. 301-312.
Alam, M., 1987, Bangladesh, in Fairbridge, R. W., ed., The Encyclopedia of World R e ~ o n a l Geology 11: Stroudsburg, PA, van Nostrand Reinhold.
Aquater, 1982, Regione Marche. Studio general per la difesa della costa primera fase: San Lorenzo in Campo, Rapporti di Settore, vol. 2, 706 p.
Audley-Charles, M. G.; Curray, J. R. and Evans, G., 1977, Location of major deltas: Geology, v. 5, p. 341-344.
I , and - , 1979, Significance and origin of big rivers: a Discussion: Jour. Geology, v. 87, p. 122-123.
Belperio, A. P., 1979, The combined use of washload and bed material load rating curves for the calculation of total load: an example from the Burdekin River, Aus- tralia: Catena, v. 6, p. 317-329.
Berner, E. K., and Berner, R. A., 1987, The Global Water Cycle: Geochemistry and Environment: Englewood Cliffs, N.J., Prentice-Hall, 397 p.
Biksham, G., and Subramanian, V., 1988, Sediment transport of the Godavari Basin and its controlling factors: Jour. Hydrol., v. 101, p. 275-290.
Binda, G. G.; Day, T. J.; and Syvitski, J. P. M., 1986. Terrestrial sediment transport into the marine envi- ronment of Canada. Annotated bibliography and data: Environ. Canada, Sediment. Survey Section Rept. IWD-HQ-WRB-SS-86-1, 85 p.
Burz, J., 1977, Suspended-load discharge in the semiarid region of northern Peru: Int. Assoc. Hydrol. Sci. Pub. 122, p. 269-277.
Chakrapani, G. J., and Subramanian, V., 1990, Factors controlling sediment discharge in the Mahandi River basin, India: Jour. Hydrol., v. 117, p. 169-185.
Chough, S. K., and Kim, D. C., 1981, Dispersal of fine- grained sediments in the southeastern Yellow Sea: Sed. Geology, v. 41, p. 159-172.
Church, M., 1971, Baffin Island Sandurs: as study of arc- tic fluvial process: Geol. Survey Canada Bull. 216, 208 p.
Collins, M. B., 1981, Sediment yield studies of headwater catchments in Sussex, SE England: Earth Surf. Proc. Landforms, v. 6, p. 517-539.
Curtis, W. F.; Culbertson, J. K.; and Chase, E. B., 1973, Fluvial-sediment discharge to the oceans from the conterminous United States: U.S. Geol. Survey Circ. 670, 17 p.
Depetris, P. J., and Lenardon, A. M. L., 1982, Particulate
and dissolved phases in the Parana River: Mitt. Geo1.-Palaont. Inst. Univ. Hamburg, v. 52, p. 385- 395.
, and Paolini, J. E., 1991, Biogeochemical aspects of South American Rivers: the Parana and Orinoco, in Degens, E. T.; Kempe, S.; and Richey, J. E., eds., Biogeochemistry of Major World Rivers, SCOPE-42: Chichester, Wiley, p. 103-125.
Dickinson, W. R., 1988, Provenance and sediment dis- persal in relation to paleotectonics and paleogeogra- phy of sedimentary basins, in Kleinspehn, K. L., and Paola, C., ed., New Perspectives in Basin Analysis: New York, Springer-Verlag, p. 3-25.
Douglas, I., 1967, Man, vegetation, and the sediment yield of rivers: Nature, v. 215, p. 925-928.
Drake, D. E.; Kolpack, R. L.; and Fischer, P. J., 1972, Sediment transport on the Santa Barbara-Oxnard shelf, Santa Barbara Channel, California, in Swift, D. J. P.; Duane, D. B.; and Pilkey, 0. H., eds., Shelf Sedi- ment Transport: Process and Pattern: Stroudsburg, Pa., Dowden, Hutchinson and Ross, p. 207-331.
Forbes, D. L., 1981, Babbage River delta and lagoon: hy- drology and sedimentology of an arctic estuarine sys- tem: Unpub. Ph.D. thesis, Univ. British Columbia, 554 p.
Fournier, F., 1960, Climat et Erosion: Presses Universi- taires de France, Paris, 201 p.
Gibbs, R. J., 1965, The geochemistry of the Amazon River system: part I. The factors that control the sa- linity and the composition and concentration of the suspended solids: Geol. Soc. America Bull., v. 78, p. 1203-1232.
Griffiths, G. A., 1981, Some suspended sediment yields from South Island catchments, New Zealand: Water Res. Bull., v. 17, p. 662-671.
, 1982, Spatial and temporal variability in sus- pended sediment yields of North Island basins, New Zealand: Water Res. Bull., v. 18, p. 575-584.
Haq, B. U.; Hardenbol, J.; and Vail, P., 1987, Chronology of fluctuating sea levels since the Triassic: Science, v. 235, p. 1156-1 167.
Harris, P. T., 1991, Sedimentation at the junction of the Fly River in the northern Great Barrier Reef, in Law- rence, D., and Cansvield-Smith, T., eds., Sustainable Development for Traditional Inhabitants of the Tor- res Strait Region: Townsville, Queensland, Great Bar- rier Reef Marine Park Authority, p. 59-85.
Hay, B. J., 1987, Particle flux in the western Black Sea in the present and over the last 5000 years: tempo- ral variability, source, and transport mechanisms: Unpub. Ph.D. thesis, WHOI-MIT, Cambridge, MA, 201 p.

Journal of Geology S E D I M E N T D I S C H A R G E T O THE O C E A N 3.3
Hay, W. W.; Shaw, C. A.; and Wold, C. N., 1989, Bal- anced paleogeographic maps: Geol. Rundshau, v. 78, 207-242.
Hiclun, E. J., 1989, Contemporary Squamish River sedi- ment flux to Howe Sound, British Columbia: Can. Jour. Earth Sci., v. 26, p. 1953-1963.
Hoekstra, P., 1990, River outflow, depositional processes and coastal morphodynamics in a monsoon- dominated deltaic environment, East Java, Indonesia: Unpub. Ph.D. thesis, Univ. Utrecht, 215 p.
Holeman, J. N., 1968, The sediment yield of major rivers of the world: Water Resources Res., v. 4, p. 737-747.
Hossain, M. M., 1991, Total sediment load in the lower Ganges and Jumuna: Bangladesh Univ, of Engineering and Technology, 15 p.
Hubbell, D. M.; Laenen, J. M.; and McKenzie, S. W., 1983, Characteristics of Columbia River sediment fol- lowing the eruption of Mount St. Helens on May 18, 1980: U.S. Geol. Survey Circ. 850-J, 21 p.
Int. Assoc. Hydrol. Sci./Unesco, 1974, Gross sediment transport into the oceans, preliminary Edition: Un- esco SC. 4lWS133, 4 p. plus 6 tables and 2 maps.
Idroser, 1983, Piano progettuale per la difesa della costa adriatica Emiliano-Romagnola: Vol. IV. I1 transport solido fluviale nei bacini tributari dell'adriatico. Bo- logna, 429 p.
Inman, D. L., and Nordstrom, C. E., 1971, On the tec- tonic and morphologic classification of coasts: Jour. Geology, v. 79, p. 1-21.
Izdar, E.; Konuk, T.; Ittekot, V.; Kempe, S.; and Degens, E. T., 1987, Particle flux in the Black Sea: nature of organic matter, in Degens, E. T., et al., eds., Particle flux in the ocean: Mitteil. Geol. Pal. Inst. Univ. Ham- burg, v. 62, p. 1-8.
Janda, R. J., and Nolan, K. M., 1979, Stream sediment discharge in northwestern Califomia, in Guidebook for a Field Trip to Observe Natural and Management- Related Erosion in Franciscan Terrane of Northern Califomia: Geol. Soc. America, Cordilleran Section, p. IV-1-27.
Jansen, P. Ph.; van Bendegom, L.; van den Berg, J.; De Vries, M.; and Zanen, A., 1979, Principles of River Engineering: London, Pitman, 509 p.
Judson, S., and Ritter, D. F., 1964, Rates of regional denu- dation in the U.S.: Jour. Geophys. Res., v. 69, p. 3395-3401.
Kata, P., 1978, Ord River. Sediment Study 1978: Water Res. Sect., Public Works Dept., Australia, Unpub. rept., 56 p.
Kempe, S.; Pettine, M.; and Cauwet, C., 1991, Bio- geochemistry of European rivers, in Degens, E. T.; Kempe, S.; and Richey J.E., eds., Biogeochemistry of Major World Rivers, SCOPE-42: Chichester, Wiley, p. 169-211.
Kranck, K., and Ruffman, A., 1981, Sedimentation in James Bay: Naturaliste Canadien, v. 109, p. 353-361.
Kuehl, S. A.; Hariu, T. M.; and Moore, W. S., 1989, Shelf sedimentation off the Ganges-Brahmaputra river sys- tem: evidence for sediment bypassing to the Bengal fan: Geology, v. 17, p. 1132-1 135.
Langbein, W. B., and Schumm, S. A. 1958, Yield of sedi- ment in relation to mean annual precipitation: Trans. Am. Geophys. Union, v. 39, 1076-1084.
Lee, H. J., and Chough, S. K., 1989, Sediment distribu- tion, dispersal and budget in the Yellow Sea: Marine Geol., v. 87, p. 195-205.
Lisitzin, A. P., 1972, Sedimentation in the world ocean: Soc. Econ. Paleont. Mineral. Spec. Pub. 17, 218 p.
Long, B. F.; Morissette, F.; and Lebel, J., 1982, Etude du material particulaire en suspension et du material dis- sous des rivieres Romaine et Saint-Jean durant un cy- cle saisonnier: Hydro-Quebec Contract No. PC-82- CE-14, 119 p.
Lopatin, G. W., 1950, Erozia y stok nanosov: Priroda no. 7.
Manickam, S.; Barbaroux, L.; and Ottmann, F., 1985, Composition and mineraology of suspended sediment in the fluvio-estuarine zone of the Loire River, France: Sedimentology, v. 32, p. 721-741.
Martins, O., and Probst, J.-L., 1991, Biogeochemistry of major African rivers: carbon and mineral transport, in Degens, E. T.; Kempe, S.; and Richey J. E., eds., Biogeochemistry of Major World Rivers, SCOPE-42: Chichester, Wiley, p. 127-155.
Meade, R. H., 1982, Sources, sinks, and storage of river sediment in the Atlantic drainage of the United States: Jour. Geology, v. 90, p. 235-252.
, 1992, River-sediment inputs to major deltas, in Milliman, J.D., ed., Rising Sea Level and Subsiding Coasts, New York, Wiley, in press.
-. , Dunne, T.; Richey, J. E.; Santos, U. deM., and Salati, E., 1985, Storage and remobilization of sus- pended sediment in the lower Amazon River of Brazil: Science, v. 228, p. 488-490.
-. , Nordin, C. F., Jr.; Curtis, W. F.; Rodigues, F. M.; do Vale, C. M.; and Edmond, J. M., 1979, Sediment loads in the Amazon River: Nature, v. 278, p. 161-163.
, and Parker, R. S., 1985, Sediment in rivers of the United States: U.S. Geol. Survey Water-Supply Pap. 2275, p. 49-60.
-. , Yuzyk, T. R.; and Day, T. J., 1990b, Movement and storage of sediment in rivers of the United States and Canada: in Wolman, M. G., and Riggs, H. C., eds., The Geology of North America, vol. 1, Surface Water Hydrology: Boulder, Geol. Soc. America, p. 255-280.
Milliman, J. D., and Meade, R. H., 1983, World-wide de- livery of river sediment to the oceans: Jour. Geology: v. 91, p. 1-21.
-. , Qin, Y. S.; Ren, M. E.; and Saito, Y., 1987, Man's influence on the erosion and transport of sediment by Asian rivers: the Yellow River (Huanghe) example: Jour. Geology, v. 95, p. 751-762.
Molnia, B. F.; Carlson, P. R.; and Levy, W. P., 1978, Holo- cene sediment volume and modem sediment yield, northeast Gulf of Alaska (abs): Am. Assoc. Petrol. Geol. Bull., v. 62, p. 545.
Nolan, K. M.; Lisle, T. E.; and Kelsey, H. M., 1987, Bank- ful discharge and sediment transport in northwestern California: Int. Assoc. Hydrol. Sci. Pub. 165, p. 439-449.

544 J O H N D. M I L L I M A N A N D J A M E S P . M . SYVITSKI
Palanques, A.; Plana, F.; and Maldonado, A., 1990, Re- cent influence of man on the Ebro margin sediment system, northwestern Mediterranean Sea: Marine Geol., v. 95, p. 247-263.
Pearce, F., 1991, A dammed fine mess: New Scientist, May 4, p. 36-39.
Petts, G. E.; M~lller, H.; and Roux, A. L. (eds.), 1989, Historical changes of large alluvial rivers: western Eu- rope: Chichester, Wiley, 365 p.
Pickup, G.; Higgins, R. J.; and Warner, R. F., 1981, Ero- sion and sediment yield in Fly River drainage basins, Papua New Guinea: Int. Asso. Hydrol. Sci. Pub. 132, p. 438-456.
Pinet, P.; and Souriau, M., 1988, Continental erosion and large-scale relief: Tectonics, v. 7, p. 563-582.
Potter, P. E., 1978, Significance and origin of big rivers: Jour. Geology, v. 86, p. 13-33.
Qian, N., and Dai, D. Z., 1980, The problems of river sedimentation and the present status of its research in China: Chinese Soc. Hydraul. Eng., Proc. Int. River Sedimentation, v. 1, p. 1-39.
Ramesh, R., and Subramanian, V., 1988, Temporal, spa- tial and size variation in the sediment transport in the Krishna River Basin: Jour. Hydrol., v. 98, p. 53-65.
Rooseboom, A., and von M. Harmse, H. J., 1979, Changes in the sediment load of the Orange River during the period 1929-1969: Int. Assoc. Hydrol. Sci. Pub. 128, p. 459-470.
Ruxton, R. P., and McDougall, I., 1967, Denudation rates in northeast Papua from potassium-argon dating of lavas: Am. Jour. Sci., v. 265, p. 545-561.
Salomons, W., and Mook, W. G., 1981, Field observa- tions of isotopic composition of particulate organic carbon in the southern North Sea and adjacent estuar- ies: Marine Geol., v. 41, p. 11-20.
Saunders, I., and Young, A., 1983, Rates of surface pro- cesses on slopes, slope retreat, and denudation: Earth Surf. Proc. Landforms, v. 8, p. 473-501.
Schubel, J. R.; Shen, H. T.; and Park, M. J., 1984, A com- parison of some characteristic sedimentation pro- cesses of estuaries entering the Yellow Sea, in Park, Y. A,; Pilkey, 0 . H.; and Kim, S. W.; eds, Marine Geology and Physical Processes of the Yellow Sea: Proc. Korea-U.S. Seminar and Workshop, Seoul, p. 282-308.
Schumm, S. A., and Hadley, R. F., 1961, Progress in the application of landform analysis in studies of semiarid erosion: U.S. Geol. Survey Circ. 437, 14 p.
Sestini, G., 1991, Implications of climatic changes for the Nile delta, in Jeftic, L.; Milliman, J. D.; and Ses- tini G., eds., Edward Arnold Publ, UK, in press.
Simon, A., and Guzman-Rios, S., 1990, Sediment dis- charge from a montane basin, Puerto Rico. Implica- tions of erosion processes and rates in the humid trop- ics: Int. Assoc. Hydrol. Sci. Pub. 192, p. 35-47.
Simmons, C. E., 1988, Sediment characteristics of North Carolina streams: U.S. Geol. Survey Open-File Rept. 87-701, 130 p.
Slaymaker, O., 1987, Sediment and solute yields in Brit- ish Columbia and Yukon: their geomorphic signifi- cance reexamined, in Gardiner, V. et al., eds., Int.
Geomorph. 1986, Part I, Chichester, Wiley p. 925-945.
Snoussi, M.; Jouanneau, J. M.; and Latouche, C., 1990, Flux de matieres issues de bassins versants de zones semi-arides (Bassins du Sebou et du Souss, Maroc). Importance dans le bilan global des apports d'origine continentale pavenant a liOcCan Mondial: Jour. Afri- can Earth Sciences, v. 11, p. 43-54.
Strakhov, N. M., 1961, Onekotroykh zakonomemosti- akh denudatsii i perenosa osadochnogo materiala na ploshchadyakh gymidnykh klimatov, in Strakov, N. M.; Bezrykov, P. L.; and Yablokov, V. S., eds., Sovrem- ennye osadki moei i oceanov: Moscow, Izdatelstovo Akademia Nauk SSSR, p. 5-27.
Summerfield, M. A., 1991, Global Geomorphology: Essex (England), Longman Scientific and Technical, 537 p.
Syvitski, J. P. M., 1992, Fluvial sediments and marine interactions in Canada. An overview: Can. Jour. Wa- ter Res., in press.
, and Farrow, G. E., 1983, Structures and processes in bayhead deltas: Knight and Butte Inlets, British Co- lumbia: Sed. Geology, v. 36, p. 217-244.
-. , Burrell, D. C.; and Skei, J., 1987, Fjords: pro- cesses and products: New York, Springer-Verlag, 379 p.
Thornberg, T. M.; Kulm, L. D.; and Hussong, D. M., 1990. Submarine fan development in the southern Chile Trench: a dynamic interplay of tectonics and sedimentation: Geol. Soc. America Bull., v. 102, p. 1658-1680.
Tixeront, J., 1960, Debit solide des cours d'eau en Algerie et en Tunisie: Int. Assn. Sci. Hydrol., Gen Assembly, Helsinki, p. 26-41.
UNEP, 1982, River inputs to the west and central Afri- can marine environment: UNEP Regional Seas Re- ports and Studies No. 5, 000 p.
von Huene, R., and Scholl, D. W., 1991, Observations at convergent margins concerning sediment subduction, subduction erosion, and the growth of continental crust: Rev. Geophysics, v. 29, p. 279-316.
Walling, D. E., 1985, The sediment yields of African riv- ers: Int. Assoc. Hydrol. Sci. Pub. 144, p. 265-283.
, 1987, Rainfall, runoff, and erosion of the land: a global view, in Gregory, K. J., ed., Energetics of Physi- cal Environment: London, Wiley, p. 89-117.
, and Webb, B. W., 1983, Patterns of sediment yield, in Gregory, K. J., Background to Palaeohydrol- ogy: Chichester, Wiley, p. 69-100.
Water Resources Planning Commission (WRPC), 1988, Hydrological yearbook of Taiwan, Taiwan, 000 p.
Waythomas, C. F., and Williams, G. P., 1988, Sediment yield and spurious correlation-toward a better por- trayal of the annual suspended-sediment load of riv- ers: Geomorphology, v. 1, p. 309-316.
Wilmot, R. D., and Collins, M. B., 1981, Contemporary fluvial sediment supply to the Wash: Spec. Pub. Int. Assoc. Sedimentologists, v. 5, p. 99-1 10.
Wilson, L., 1973, Variations in mean annual sediment yield as a function of mean annual precipitation: Am. Jour. Sci., v. 273, p. 335-349.


