Geometric Calibration of Head-Mounted Displays … · Geometric Calibration of Head-Mounted...
8
Geometric Calibration of Head-Mounted Displays and its Effects on Distance Estimation Falko Kellner, Benjamin Bolte, Gerd Bruder, Ulrich Rautenberg, Frank Steinicke, Markus Lappe, and Reinhard Koch Abstract—Head-mounted displays (HMDs) allow users to observe virtual environments (VEs) from an egocentric perspective. How- ever, several experiments have provided evidence that egocentric distances are perceived as compressed in VEs relative to the real world. Recent experiments suggest that the virtual view frustum set for rendering the VE has an essential impact on the user’s estimation of distances. In this article we analyze if distance estimation can be improved by calibrating the view frustum for a given HMD and user. Unfortunately, in an immersive virtual reality (VR) environment, a full per user calibration is not trivial and manual per user adjustment often leads to mini- or magnification of the scene. Therefore, we propose a novel per user calibration approach with optical see-through displays commonly used in augmented reality (AR). This calibration takes advantage of a geometric scheme based on 2D point – 3D line correspondences, which can be used intuitively by inexperienced users and requires less than a minute to complete. The required user interaction is based on taking aim at a distant target marker with a close marker, which ensures non-planar measurements covering a large area of the interaction space while also reducing the number of required measurements to five. We found the tendency that a calibrated view frustum reduced the average distance underestimation of users in an immersive VR environment, but even the correctly calibrated view frustum could not entirely compensate for the distance underestimation effects. Index Terms—Optical see-through, HMD calibration, distance perception. 1 I NTRODUCTION Virtual environments (VEs) are often characterized by head-mounted displays (HMDs) and a tracking system for measuring a user’s po- sition and orientation. Such head- or helmet-mounted displays are head-worn devices, which present different images for the left and right eye of the user by employing two miniature display units. Com- mercially available HMDs typically have fields of view (FOVs) which range from 20 to 80 degrees diagonally. Whereas, the effective visual field of humans is approximately 200 degrees horizontally and 150 de- grees vertically [34]. In contrast to the display’s field of view (DFOV), the geometric field of view (GFOV) defines the horizontal and vertical boundaries of the virtual viewing volume along with the aspect ratio. Usually, user movements measured by the tracking system are mapped one-to-one to the position and orientation of the virtual camera. This allows users to explore a VE similar to the real world. The projection of the virtual camera defines the camera view frustum, which is used for rendering, whereas the display view frustum refers to its physical equivalent in real world. For simplicity, usually the horizontal and vertical GFOVs of the camera view frustum are chosen in a way that the view frustum is arranged symmetrically around the view direction according to the DFOV as specified by the HMD manufacturer. How- ever, usually such a setup does not reflect the real viewing situation, and in the optimal case the camera view frustum should match the dis- play view frustum of the HMD. Only then, the viewport is mapped from virtual space onto the physical display in such a way that users are presented with imagery that will have “correct” perspective. • Falko Kellner, University of Kiel, E-mail: [email protected]. • Benjamin Bolte, University of Muenster, E-mail: [email protected]. • Gerd Bruder, University of Wuerzburg, E-mail: [email protected]. • Ulrich Rautenberg, Group Research Virtual Technologies Volkswagen AG, E-mail: [email protected]. • Frank Steinicke, University of Wuerzburg, E-mail: [email protected]. • Markus Lappe, University of Muenster, E-mail: [email protected]. • Reinhard Koch, University of Kiel, E-mail: [email protected]. Manuscript received 15 September 2011; accepted 3 January 2012; posted online 4 March 2012; mailed on 27 February 2012. For information on obtaining reprints of this article, please send email to: [email protected]. Several experiments provide evidence that subjects judge egocen- tric distances as significantly compressed in VEs — in some cases up to 50% — relative to distance judgments in the real world [17, 20, 23, 25, 35]. Sources for parts of the observed distance compression effects have been identified in experiments, but an explanation for all the effects remains unknown. In the main body of literature on dis- tance estimation, the camera view frustum was not completely cali- brated to the display view frustum, which may be one reason for the significantly different spatial perception of a virtual world through a HMD in contrast to the real world. To achieve such a complete cali- bration, the virtual camera needs to be calibrated both intrinsically and extrinsically relatively to the tracked head position. In augmented re- ality (AR) systems, in which the real world environment is enriched with computer generated graphics, this calibration can be done and evaluated on a per user basis. Here, the individual user can calibrate the virtual camera by aligning tracked real world markers with virtual target positions. This calibration allows for a perfect overlap of real and virtual objects in an AR environment, which can be validated by the user directly. In such augmented reality systems, so called optical see-through head mounted displays (OSTHMDs) are used. Such dis- plays do not present the images to the user directly, but typically the images are projected into the natural view of the user by, for instance, semi-transparent mirrors. In this article we introduce a novel calibration scheme for OST- HMDs with short and intuitive user interaction, which can be used for both VR and AR environments. We evaluated the quality of the calibration and time required to perform a calibration using theoreti- cal calculations and user studies. Afterwards, we conducted a blind walking experiment and used our method to calibrate the camera view frustum for each individual user in order to analyze if the often ob- served distance underestimation in VR environments is mainly caused by miscalibration of the camera view frustum. Section 2 recalls work related to our approach. Section 3 describes and evaluates the geomet- ric calibration technique that we developed to determine the display view frustum of a given HMD. Section 4 explains the distance estima- tion experiments. Section 5 concludes the paper. 2 RELATED WORK 2.1 Scene Perception Since most commercially available HMDs have a relatively narrow field of view in comparison to the effective visual field of humans, HMD users can only see a rather restricted portion of the virtual world 589 1077-2626/12/$31.00 © 2012 IEEE Published by the IEEE Computer Society IEEE TRANSACTIONS ON VISUALIZATION AND COMPUTER GRAPHICS, VOL. 18, NO. 4, APRIL 2012
Transcript of Geometric Calibration of Head-Mounted Displays … · Geometric Calibration of Head-Mounted...
Geometric Calibration of Head-Mounted Displaysand its Effects on Distance Estimation
Falko Kellner, Benjamin Bolte, Gerd Bruder, Ulrich Rautenberg, Frank Steinicke, Markus Lappe, and Reinhard Koch
Abstract—Head-mounted displays (HMDs) allow users to observe virtual environments (VEs) from an egocentric perspective. How-ever, several experiments have provided evidence that egocentric distances are perceived as compressed in VEs relative to the realworld. Recent experiments suggest that the virtual view frustum set for rendering the VE has an essential impact on the user’sestimation of distances. In this article we analyze if distance estimation can be improved by calibrating the view frustum for a givenHMD and user. Unfortunately, in an immersive virtual reality (VR) environment, a full per user calibration is not trivial and manualper user adjustment often leads to mini- or magnification of the scene. Therefore, we propose a novel per user calibration approachwith optical see-through displays commonly used in augmented reality (AR). This calibration takes advantage of a geometric schemebased on 2D point – 3D line correspondences, which can be used intuitively by inexperienced users and requires less than a minuteto complete. The required user interaction is based on taking aim at a distant target marker with a close marker, which ensuresnon-planar measurements covering a large area of the interaction space while also reducing the number of required measurementsto five. We found the tendency that a calibrated view frustum reduced the average distance underestimation of users in an immersiveVR environment, but even the correctly calibrated view frustum could not entirely compensate for the distance underestimation effects.
Index Terms—Optical see-through, HMD calibration, distance perception.
1 INTRODUCTION
Virtual environments (VEs) are often characterized by head-mounteddisplays (HMDs) and a tracking system for measuring a user’s po-sition and orientation. Such head- or helmet-mounted displays arehead-worn devices, which present different images for the left andright eye of the user by employing two miniature display units. Com-mercially available HMDs typically have fields of view (FOVs) whichrange from 20 to 80 degrees diagonally. Whereas, the effective visualfield of humans is approximately 200 degrees horizontally and 150 de-grees vertically [34]. In contrast to the display’s field of view (DFOV),the geometric field of view (GFOV) defines the horizontal and verticalboundaries of the virtual viewing volume along with the aspect ratio.Usually, user movements measured by the tracking system are mappedone-to-one to the position and orientation of the virtual camera. Thisallows users to explore a VE similar to the real world. The projectionof the virtual camera defines the camera view frustum, which is usedfor rendering, whereas the display view frustum refers to its physicalequivalent in real world. For simplicity, usually the horizontal andvertical GFOVs of the camera view frustum are chosen in a way thatthe view frustum is arranged symmetrically around the view directionaccording to the DFOV as specified by the HMD manufacturer. How-ever, usually such a setup does not reflect the real viewing situation,and in the optimal case the camera view frustum should match the dis-play view frustum of the HMD. Only then, the viewport is mappedfrom virtual space onto the physical display in such a way that usersare presented with imagery that will have “correct” perspective.
• Falko Kellner, University of Kiel, E-mail:[email protected].
• Benjamin Bolte, University of Muenster, E-mail: [email protected].• Gerd Bruder, University of Wuerzburg, E-mail:
[email protected].• Ulrich Rautenberg, Group Research Virtual Technologies Volkswagen AG,
E-mail: [email protected].• Frank Steinicke, University of Wuerzburg, E-mail:
[email protected].• Markus Lappe, University of Muenster, E-mail: [email protected].• Reinhard Koch, University of Kiel, E-mail: [email protected].
Manuscript received 15 September 2011; accepted 3 January 2012; postedonline 4 March 2012; mailed on 27 February 2012.For information on obtaining reprints of this article, please sendemail to: [email protected].
Several experiments provide evidence that subjects judge egocen-tric distances as significantly compressed in VEs — in some cases upto 50% — relative to distance judgments in the real world [17, 20,23, 25, 35]. Sources for parts of the observed distance compressioneffects have been identified in experiments, but an explanation for allthe effects remains unknown. In the main body of literature on dis-tance estimation, the camera view frustum was not completely cali-brated to the display view frustum, which may be one reason for thesignificantly different spatial perception of a virtual world through aHMD in contrast to the real world. To achieve such a complete cali-bration, the virtual camera needs to be calibrated both intrinsically andextrinsically relatively to the tracked head position. In augmented re-ality (AR) systems, in which the real world environment is enrichedwith computer generated graphics, this calibration can be done andevaluated on a per user basis. Here, the individual user can calibratethe virtual camera by aligning tracked real world markers with virtualtarget positions. This calibration allows for a perfect overlap of realand virtual objects in an AR environment, which can be validated bythe user directly. In such augmented reality systems, so called opticalsee-through head mounted displays (OSTHMDs) are used. Such dis-plays do not present the images to the user directly, but typically theimages are projected into the natural view of the user by, for instance,semi-transparent mirrors.
In this article we introduce a novel calibration scheme for OST-HMDs with short and intuitive user interaction, which can be usedfor both VR and AR environments. We evaluated the quality of thecalibration and time required to perform a calibration using theoreti-cal calculations and user studies. Afterwards, we conducted a blindwalking experiment and used our method to calibrate the camera viewfrustum for each individual user in order to analyze if the often ob-served distance underestimation in VR environments is mainly causedby miscalibration of the camera view frustum. Section 2 recalls workrelated to our approach. Section 3 describes and evaluates the geomet-ric calibration technique that we developed to determine the displayview frustum of a given HMD. Section 4 explains the distance estima-tion experiments. Section 5 concludes the paper.
2 RELATED WORK
2.1 Scene Perception
Since most commercially available HMDs have a relatively narrowfield of view in comparison to the effective visual field of humans,HMD users can only see a rather restricted portion of the virtual world
589
1077-2626/12/$31.00 © 2012 IEEE Published by the IEEE Computer Society
IEEE TRANSACTIONS ON VISUALIZATION AND COMPUTER GRAPHICS, VOL. 18, NO. 4, APRIL 2012
if the camera view frustum matches the view frustum of the HMD.In the real world, a narrow field of vision has been shown to degradespatial awareness and human performance in navigation and manip-ulation tasks [15, 19] as well as visual search tasks [3]. Similarly,in the virtual world a restricted FOV may lead to perceptual, visual,and motor decrements in various kinds of performance tasks [1, 13].Deviation between the camera and display view frustum occurs, forexample, when the actual display view frustum varies from the nomi-nal values specified by the HMD manufacturers. A deviation can alsobe induced intentionally. An increased view frustum allows for theinclusion of more information in the 3D view like a larger physicaldisplay would. A larger view frustum is essential in some applicationsand has the potential to improve and increase the user’s sense of pres-ence [2, 28]. On the other hand, a large GFOV may be unnecessaryfor tasks, which are localized within a small spatial region of inter-est [15], and it may aggravate simulator sickness effects, particularlythose caused by visual-vestibular mismatch [28, 29].
Researchers have found evidence that distances in virtual worldsare underestimated in comparison to the real world [16, 17, 23], thatvisual speed during walking is underestimated in VEs [5] and that thedistance one has traveled is also underestimated [7]. As experimentshave shown, only a small portion of the observed compression can becaused by hardware issues, and an explanation for the larger portion ofthe effect remains unknown. It is often assumed that the human visualsystem would be most comfortable with HMD viewing conditions thatmatch natural viewing of the real world [27]. However, recent insightinto subjective judgment of natural FOVs used for rendering virtualscenes on HMDs showed desired discrepancies of up to 50% comparedto such projections that are calibrated to match the correct FOV of theHMD [30]. Furthermore, it has been shown that different fields ofview have a significant impact on distance estimation [22, 30].
Such results lead to the conclusion that calibrating not only the fieldof view, but the entire camera view frustum may be required for usersto correctly judge distances in VEs. A great body of literature moti-vated that even if the distal size and depth of objects match, people’sperceptions and actions in a VE may differ from those perceived andperformed in an equivalent real environment.
2.2 Calibration Techniques
The FOV of an immersive HMD can be determined, for instance,with the psychophysical calibration method proposed by Steinicke etal. [30] or Kuhl et al. [22], where subjects have to compare a real-world object with a virtual object by raising and lowering the HMD.This technique incorporates a psychophysical two-alternative forced-choice task to accurately measure the relation between stimulus inten-sity and perception reported by a human observer. Another approachwas proposed by Ellis and Nemire [6], who displayed vertical polesin the HMD, with the subjects’ task to point at the perceived loca-tion of the poles in the real world, allowing to compute the angulardifference between visual cues and proprioceptive responses for esti-mating the actual FOV of the HMD. However, full calibration of theview frustum both intrinsically and extrinsically as well as its valida-tion per user is difficult without directly visible correspondences fromreal and virtual environment. For OSTHMDs, calibration methods forthe view frustum can be roughly split into multi-point and single-pointapproaches. In multi-point approaches, the user of the display is askedto align a multi-dimensional calibration object of known size with a2D target projection which he sees on one or both displays [18, 24].Then, the 2D-3D correspondences are used to deduce all parametersof the system. A notable break-through in usability and generalityhas been achieved with the “Single Point Active Alignment Method”(SPAAM), presented by Tuceryan et al. [32]. Here, the alignment isreduced to one marker per shot and the user aligns it multiple timesfrom different viewpoints. Different variants of calibration methods,focusing on SPAAM variants, were evaluated by Tang et al. [31]. Gencet al. [10] extend this approach to directly calibrate the displays forboth eyes, but at the cost of a more demanding user interaction wherethe user aligns a stereoscopically presented disc with a real world 3Dpoint. Genc et al. [11] later split the SPAAM approach into an offline
and online phase, where the user is presented with pre-calculated cal-ibrations from many alignments and chooses the most suitable. Theuser then only needs to record a few more measurements to completecalibration. In 2004, Owen et al. [26] presented another two phasecalibration for OSTHMDs, in which most characteristics of the dis-play are calibrated offline in the first phase, further reducing measure-ments conducted by the individual user. Recently, Gilson et al. [12]presented a calibration method based on photogrammetry related tothe approach by Owen et al. [26], which they say is independent ofthe user currently wearing the display as long as the display is notmanipulated. The latter two methods require additional hardware likecameras, rigs and calibration patterns but can achieve high precisionwith respect to the reprojection error. The method we propose is mostclosely related to Fuhrmann et al. [8, 9], who also use three dimen-sional lines as geometric entities to deduce the camera center and anup-vector. All other parameters are fixed guesses which serve as afirst approximation. This approximation is then refined by numericalmethods. In contrast, we deduce all camera parameters directly fromthe geometrical model, showing that OSTHMD camera calibration canbe done without iterative optimization of the parameters.
3 GEOMETRIC CALIBRATION
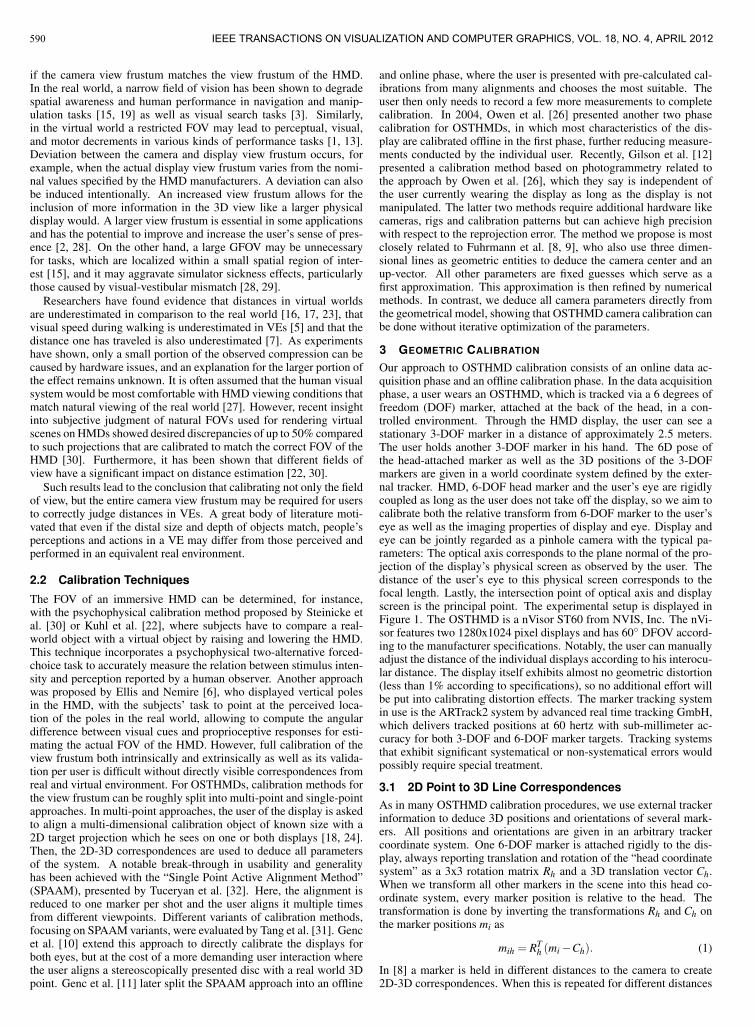
Our approach to OSTHMD calibration consists of an online data ac-quisition phase and an offline calibration phase. In the data acquisitionphase, a user wears an OSTHMD, which is tracked via a 6 degrees offreedom (DOF) marker, attached at the back of the head, in a con-trolled environment. Through the HMD display, the user can see astationary 3-DOF marker in a distance of approximately 2.5 meters.The user holds another 3-DOF marker in his hand. The 6D pose ofthe head-attached marker as well as the 3D positions of the 3-DOFmarkers are given in a world coordinate system defined by the exter-nal tracker. HMD, 6-DOF head marker and the user’s eye are rigidlycoupled as long as the user does not take off the display, so we aim tocalibrate both the relative transform from 6-DOF marker to the user’seye as well as the imaging properties of display and eye. Display andeye can be jointly regarded as a pinhole camera with the typical pa-rameters: The optical axis corresponds to the plane normal of the pro-jection of the display’s physical screen as observed by the user. Thedistance of the user’s eye to this physical screen corresponds to thefocal length. Lastly, the intersection point of optical axis and displayscreen is the principal point. The experimental setup is displayed inFigure 1. The OSTHMD is a nVisor ST60 from NVIS, Inc. The nVi-sor features two 1280x1024 pixel displays and has 60◦ DFOV accord-ing to the manufacturer specifications. Notably, the user can manuallyadjust the distance of the individual displays according to his interocu-lar distance. The display itself exhibits almost no geometric distortion(less than 1% according to specifications), so no additional effort willbe put into calibrating distortion effects. The marker tracking systemin use is the ARTrack2 system by advanced real time tracking GmbH,which delivers tracked positions at 60 hertz with sub-millimeter ac-curacy for both 3-DOF and 6-DOF marker targets. Tracking systemsthat exhibit significant systematical or non-systematical errors wouldpossibly require special treatment.
3.1 2D Point to 3D Line CorrespondencesAs in many OSTHMD calibration procedures, we use external trackerinformation to deduce 3D positions and orientations of several mark-ers. All positions and orientations are given in an arbitrary trackercoordinate system. One 6-DOF marker is attached rigidly to the dis-play, always reporting translation and rotation of the “head coordinatesystem” as a 3x3 rotation matrix Rh and a 3D translation vector Ch.When we transform all other markers in the scene into this head co-ordinate system, every marker position is relative to the head. Thetransformation is done by inverting the transformations Rh and Ch onthe marker positions mi as
mih = RTh (mi−Ch). (1)
In [8] a marker is held in different distances to the camera to create2D-3D correspondences. When this is repeated for different distances
590 IEEE TRANSACTIONS ON VISUALIZATION AND COMPUTER GRAPHICS, VOL. 18, NO. 4, APRIL 2012
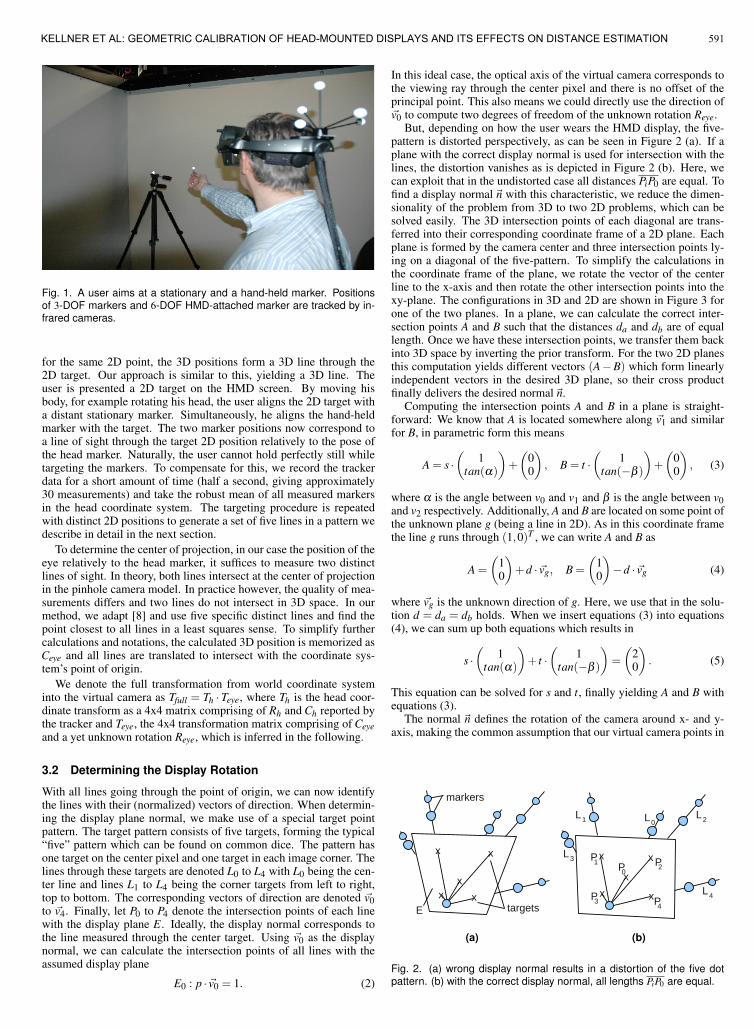
Fig. 1. A user aims at a stationary and a hand-held marker. Positionsof 3-DOF markers and 6-DOF HMD-attached marker are tracked by in-frared cameras.
for the same 2D point, the 3D positions form a 3D line through the2D target. Our approach is similar to this, yielding a 3D line. Theuser is presented a 2D target on the HMD screen. By moving hisbody, for example rotating his head, the user aligns the 2D target witha distant stationary marker. Simultaneously, he aligns the hand-heldmarker with the target. The two marker positions now correspond toa line of sight through the target 2D position relatively to the pose ofthe head marker. Naturally, the user cannot hold perfectly still whiletargeting the markers. To compensate for this, we record the trackerdata for a short amount of time (half a second, giving approximately30 measurements) and take the robust mean of all measured markersin the head coordinate system. The targeting procedure is repeatedwith distinct 2D positions to generate a set of five lines in a pattern wedescribe in detail in the next section.
To determine the center of projection, in our case the position of theeye relatively to the head marker, it suffices to measure two distinctlines of sight. In theory, both lines intersect at the center of projectionin the pinhole camera model. In practice however, the quality of mea-surements differs and two lines do not intersect in 3D space. In ourmethod, we adapt [8] and use five specific distinct lines and find thepoint closest to all lines in a least squares sense. To simplify furthercalculations and notations, the calculated 3D position is memorized asCeye and all lines are translated to intersect with the coordinate sys-tem’s point of origin.
We denote the full transformation from world coordinate systeminto the virtual camera as Tfull = Th ·Teye, where Th is the head coor-dinate transform as a 4x4 matrix comprising of Rh and Ch reported bythe tracker and Teye, the 4x4 transformation matrix comprising of Ceyeand a yet unknown rotation Reye, which is inferred in the following.
3.2 Determining the Display Rotation
With all lines going through the point of origin, we can now identifythe lines with their (normalized) vectors of direction. When determin-ing the display plane normal, we make use of a special target pointpattern. The target pattern consists of five targets, forming the typical“five” pattern which can be found on common dice. The pattern hasone target on the center pixel and one target in each image corner. Thelines through these targets are denoted L0 to L4 with L0 being the cen-ter line and lines L1 to L4 being the corner targets from left to right,top to bottom. The corresponding vectors of direction are denoted ~v0to ~v4. Finally, let P0 to P4 denote the intersection points of each linewith the display plane E. Ideally, the display normal corresponds tothe line measured through the center target. Using ~v0 as the displaynormal, we can calculate the intersection points of all lines with theassumed display plane
E0 : p · ~v0 = 1. (2)
In this ideal case, the optical axis of the virtual camera corresponds tothe viewing ray through the center pixel and there is no offset of theprincipal point. This also means we could directly use the direction of~v0 to compute two degrees of freedom of the unknown rotation Reye.
But, depending on how the user wears the HMD display, the five-pattern is distorted perspectively, as can be seen in Figure 2 (a). If aplane with the correct display normal is used for intersection with thelines, the distortion vanishes as is depicted in Figure 2 (b). Here, wecan exploit that in the undistorted case all distances PiP0 are equal. Tofind a display normal~n with this characteristic, we reduce the dimen-sionality of the problem from 3D to two 2D problems, which can besolved easily. The 3D intersection points of each diagonal are trans-ferred into their corresponding coordinate frame of a 2D plane. Eachplane is formed by the camera center and three intersection points ly-ing on a diagonal of the five-pattern. To simplify the calculations inthe coordinate frame of the plane, we rotate the vector of the centerline to the x-axis and then rotate the other intersection points into thexy-plane. The configurations in 3D and 2D are shown in Figure 3 forone of the two planes. In a plane, we can calculate the correct inter-section points A and B such that the distances da and db are of equallength. Once we have these intersection points, we transfer them backinto 3D space by inverting the prior transform. For the two 2D planesthis computation yields different vectors (A−B) which form linearlyindependent vectors in the desired 3D plane, so their cross productfinally delivers the desired normal~n.
Computing the intersection points A and B in a plane is straight-forward: We know that A is located somewhere along ~v1 and similarfor B, in parametric form this means
A = s ·(
1tan(α)
)+
(00
), B = t ·
(1
tan(−β )
)+
(00
), (3)
where α is the angle between v0 and v1 and β is the angle between v0and v2 respectively. Additionally, A and B are located on some point ofthe unknown plane g (being a line in 2D). As in this coordinate framethe line g runs through (1,0)T , we can write A and B as
A =
(10
)+d · ~vg, B =
(10
)−d · ~vg (4)
where ~vg is the unknown direction of g. Here, we use that in the solu-tion d = da = db holds. When we insert equations (3) into equations(4), we can sum up both equations which results in
s ·(
1tan(α)
)+ t ·
(1
tan(−β )
)=
(20
). (5)
This equation can be solved for s and t, finally yielding A and B withequations (3).
The normal ~n defines the rotation of the camera around x- and y-axis, making the common assumption that our virtual camera points in
x
x
x
x x
markers
targetsE
(a)
x
x
x
x x
P0P1 P2
P3 P4L4
L3
L2L1 L0
(b)
Fig. 2. (a) wrong display normal results in a distortion of the five dotpattern. (b) with the correct display normal, all lengths PiP0 are equal.
591KELLNER ET AL: GEOMETRIC CALIBRATION OF HEAD-MOUNTED DISPLAYS AND ITS EFFECTS ON DISTANCE ESTIMATION
x
x
x
x x
A
B
d
da
b
E0
(a)
A
B
d
d v = x0
v1
v2
g
β
αa
b
x=1
y
(b)
Fig. 3. (a) points on one diagonal and camera center form a plane. (b)In the plane, we look for the line g through (1,0)T for which da = db. Forthis, we calculate the intersection points A and B of g with ~v1 and ~v2.
z-direction. The wanted rotation therefore consists of rotating ~n onto~z = (0,0,1)T . Since both vectors are normalized, the cosine of therotation angle φxy is computed as the scalar product of the two vectorsand the rotation axis ~v is the cross product of the vectors. We nowtransform all lines with this rotation such that their intersections withthe plane E0 have the correct distances PiP0 = d.
From these intersections, the missing rotation around the z-axis canbe computed using each horizontal and vertical line of the target pat-tern individually (see Figure 4 (a)). The mean angle from the resultingangles is used as the missing rotation. Each of the angles is computedas in the following example: ~x being the vector (1,0,0)T , we computethe angle between~x and the segment P1P2 from
~vr =P2−P1
‖P2−P1‖, φz = arccos(~xT ·~vr). (6)
yΦ
xΦP1
P2
(a)
L0
L1
L0
d0
dn
dp
d
v0
fz.
1
hd
(b)
Fig. 4. (a) Computing rotation angle of z-axis from x-axis and y-axis. (b)Computation of focal length and principal point by intercept theorems.
Composition of the rotations on x-, y- and z-axis yields the finalrotation matrix Reye, completing the calculation of the external cali-bration in the head coordinate system, represented as the 4x4 transfor-mation matrix Teye.
3.3 Determining Focal Length and Principal PointNow that translation and rotation of the display are known, we willestimate focal length and principal point of the virtual camera. Thefocal length is equivalent to the distance of eye to display, the principalpoint is the intersection of optical axis and display. Both measures canbe estimated in pixel without knowledge of physical display or pixelsize.
After applying the transformations in section 3.2, the optical axiscorresponds to the z-axis and the intersection point of all lines withthe plane at z = 1 are known. Looking at pairs of rays L0, Li, wecan compute the focal length in pixel by intercept theorems. With thenomenclature of Figure 4 (b)
d = d0 ·dp
dn(7)
where dp is the distance of 2D points in pixel. dn is the distance ofthe 3D points from intersecting the rays with the z = 1 plane. d0 is thedistance of the intersection point of line L0 to the camera center. Wedefine a plane in 3D with normal~z that includes (d · ~v0). This plane is
intersected with the line f ·~z, giving the focal length f as the distanceof the intersection point to the camera center:
f =d
~zT · ~v0(8)
The distance of this intersection point to the intersection point ofL0 with this plane gives the displacement ~hd of the principal point inpixel,
~hd = d · ~v0− f ·~z. (9)
For our specific device the pixel coordinates of the principle point aretherefore~h = (1280/2,1024/2)T − ~hd . To represent the internal cam-era calibration, we use the camera calibration matrix K, which maps3D coordinates onto 2D pixel positions on the image plane. K is a3x3 matrix with the parameters focal length f , principal point (hx,hy)and skew s, which we set to s = 0. The K matrix together with theextrinsics can be used to form a projection matrix P according to [14]
P = K · (Tfull 3x4), (10)
which defines a mapping from 3D world coordinates into the virtualcamera view. This representation is used in the following validation onsynthetic data to measure reprojection errors. For the actual renderingof augmented or virtual environments, the K matrix and extrinsic ma-trix are transformed into projection matrix and model view matrix ofan OpenGL renderer.
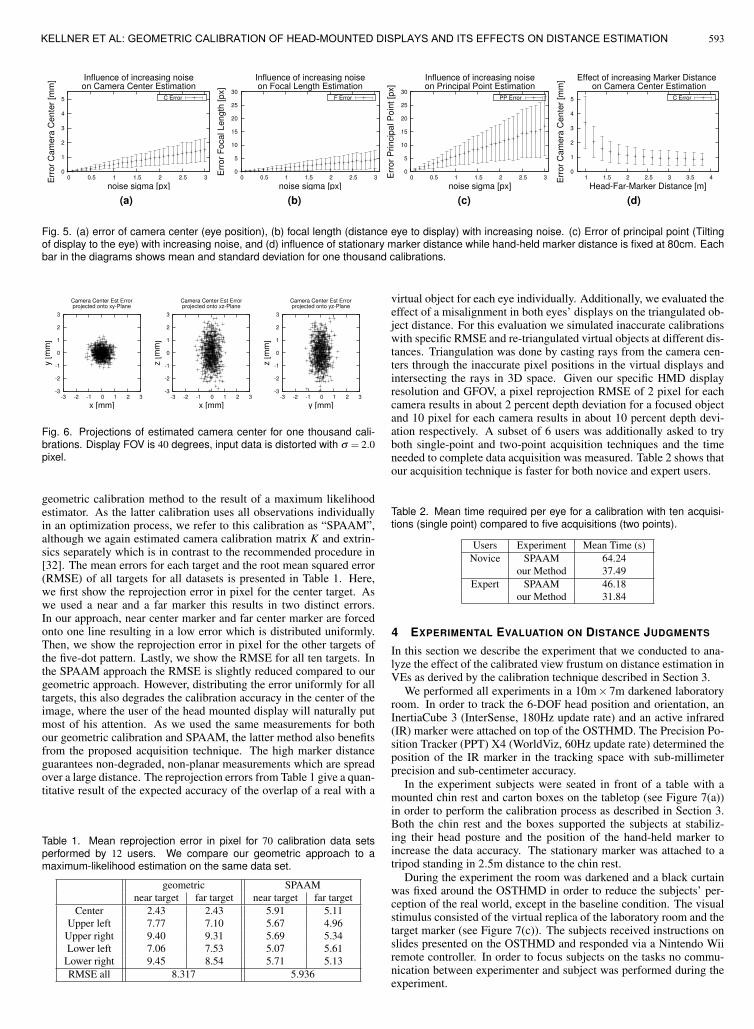
3.4 Validation on Synthetic and Real DataTo validate our approach and to evaluate the influence of noise on thesystem, we generated input data with synthetic camera parameters.The camera parameters were used to generate ground-truth and noisy3D points, where normal distributed noise was added. The influenceof distorted data was evaluated in one thousand trials per noise ampli-tude. Figure 5 shows the influence of noisy measurements on differentparameters of the calibration. On the x-axis one can see the chosen σ
that is used to distort the data. On the y-axis mean and standard de-viation of a thousand calibrations is shown in the respective measure.The marker distances were fixed at 80cm for the near marker and 2.5mfor the far marker. The synthetic camera’s field of view was set to 40degrees. Notably, noisy measurements have little influence on the es-timation of the focal length and camera center estimation, but higherinfluence on the calculation of the principal point as can be seen inFigure 5 (c). This is justified by the fact that a small error in rotationestimation results in large pixel errors given the small display size.
Figure 5 (d) shows the influence of increasing stationary and hand-held marker distance on the camera center estimation. The hand-heldmarker thereby had a fixed distance to the head of 80cm. The distanceto the stationary marker was increased in steps of 20cm in a range ofone to four meters. The evaluation shows that after 2.5m the error isnot reduced significantly. We therefore consider a distance of 2.5m asoptimal.
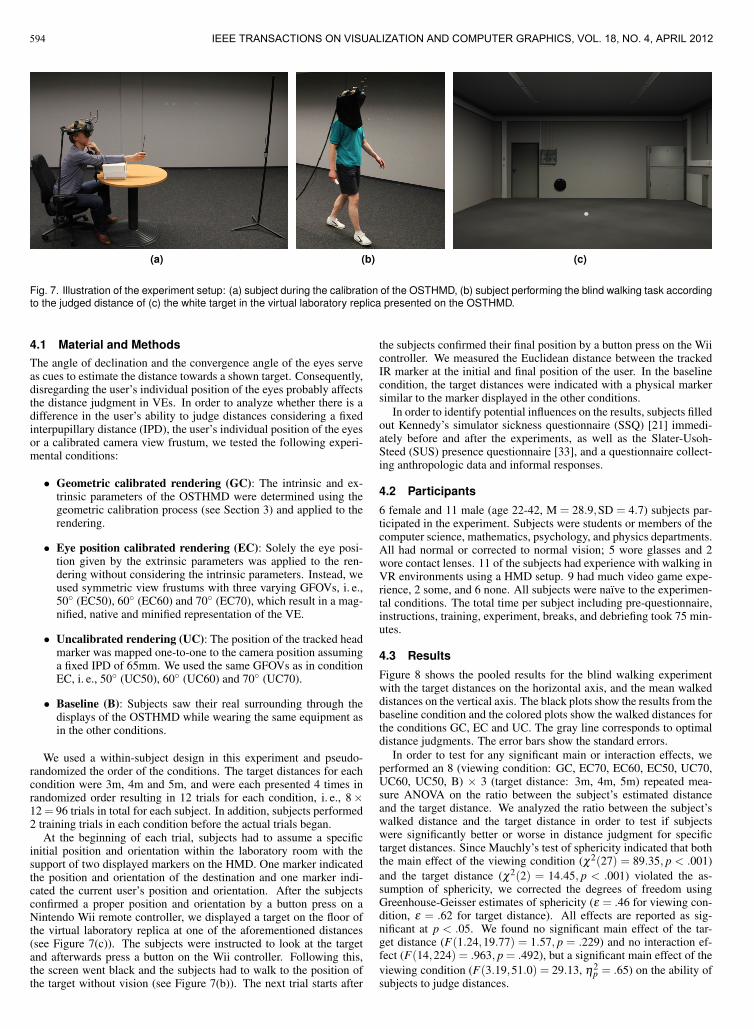
Finally, Figure 6 shows scatter plots of the estimated camera centersof a thousand calibrations, projected onto the xy-, xz- and yz- planes.A principal component analysis shows mean and standard deviationof 0.32mm and 0.39mm in x- and y- axis directions. We clearly seethat the z-component is the most error prone with mean and standarddeviation of 0.79mm and 0.95mm. This is clear intuitively consideringthe influence of a small error in the xy-plane on the intersection pointof two lines in 3D. Comparable simulations of user calibration tasksconducted by Axholt et al. [4] show much higher errors for calibrationswith such a minimal number of correspondence points. This is due toour constraints on high marker distance and the unique method of lineof sight intersection.
To evaluate our method in real data experiments, we conducted auser study with 12 individual persons. The group comprises of bothexpert users, who are familiar with wearing HMD gear and the cali-bration method, and novice users who use such a system for the firsttime. Each user conducts two or three acquisitions per eye, result-ing in 70 data sets in total. At first, this data is used to compare our
592 IEEE TRANSACTIONS ON VISUALIZATION AND COMPUTER GRAPHICS, VOL. 18, NO. 4, APRIL 2012
0
1
2
3
4
5
0 0.5 1 1.5 2 2.5 3Err
or
Ca
me
ra C
en
ter
[mm
]
noise sigma [px]
Influence of increasing noiseon Camera Center Estimation
C Error
(a)
0
5
10
15
20
25
30
0 0.5 1 1.5 2 2.5 3
Err
or
Fo
ca
l L
en
gth
[p
x]
noise sigma [px]
Influence of increasing noiseon Focal Length Estimation
F Error
(b)
0
5
10
15
20
25
30
0 0.5 1 1.5 2 2.5 3Err
or
Prin
cip
al P
oin
t [p
x]
noise sigma [px]
Influence of increasing noiseon Principal Point Estimation
PP Error
(c)
0
1
2
3
4
5
1 1.5 2 2.5 3 3.5 4Err
or
Ca
me
ra C
en
ter
[mm
]
Head-Far-Marker Distance [m]
Effect of increasing Marker Distance on Camera Center Estimation
C Error
(d)
Fig. 5. (a) error of camera center (eye position), (b) focal length (distance eye to display) with increasing noise. (c) Error of principal point (Tiltingof display to the eye) with increasing noise, and (d) influence of stationary marker distance while hand-held marker distance is fixed at 80cm. Eachbar in the diagrams shows mean and standard deviation for one thousand calibrations.
-3
-2
-1
0
1
2
3
-3 -2 -1 0 1 2 3
y [
mm
]
x [mm]
Camera Center Est Errorprojected onto xy-Plane
-3
-2
-1
0
1
2
3
-3 -2 -1 0 1 2 3
z [
mm
]
x [mm]
Camera Center Est Errorprojected onto xz-Plane
-3
-2
-1
0
1
2
3
-3 -2 -1 0 1 2 3
z [
mm
]
y [mm]
Camera Center Est Errorprojected onto yz-Plane
Fig. 6. Projections of estimated camera center for one thousand cali-brations. Display FOV is 40 degrees, input data is distorted with σ = 2.0pixel.
geometric calibration method to the result of a maximum likelihoodestimator. As the latter calibration uses all observations individuallyin an optimization process, we refer to this calibration as “SPAAM”,although we again estimated camera calibration matrix K and extrin-sics separately which is in contrast to the recommended procedure in[32]. The mean errors for each target and the root mean squared error(RMSE) of all targets for all datasets is presented in Table 1. Here,we first show the reprojection error in pixel for the center target. Aswe used a near and a far marker this results in two distinct errors.In our approach, near center marker and far center marker are forcedonto one line resulting in a low error which is distributed uniformly.Then, we show the reprojection error in pixel for the other targets ofthe five-dot pattern. Lastly, we show the RMSE for all ten targets. Inthe SPAAM approach the RMSE is slightly reduced compared to ourgeometric approach. However, distributing the error uniformly for alltargets, this also degrades the calibration accuracy in the center of theimage, where the user of the head mounted display will naturally putmost of his attention. As we used the same measurements for bothour geometric calibration and SPAAM, the latter method also benefitsfrom the proposed acquisition technique. The high marker distanceguarantees non-degraded, non-planar measurements which are spreadover a large distance. The reprojection errors from Table 1 give a quan-titative result of the expected accuracy of the overlap of a real with a
Table 1. Mean reprojection error in pixel for 70 calibration data setsperformed by 12 users. We compare our geometric approach to amaximum-likelihood estimation on the same data set.
geometric SPAAMnear target far target near target far target
Center 2.43 2.43 5.91 5.11Upper left 7.77 7.10 5.67 4.96
Upper right 9.40 9.31 5.69 5.34Lower left 7.06 7.53 5.07 5.61
Lower right 9.45 8.54 5.71 5.13RMSE all 8.317 5.936
virtual object for each eye individually. Additionally, we evaluated theeffect of a misalignment in both eyes’ displays on the triangulated ob-ject distance. For this evaluation we simulated inaccurate calibrationswith specific RMSE and re-triangulated virtual objects at different dis-tances. Triangulation was done by casting rays from the camera cen-ters through the inaccurate pixel positions in the virtual displays andintersecting the rays in 3D space. Given our specific HMD displayresolution and GFOV, a pixel reprojection RMSE of 2 pixel for eachcamera results in about 2 percent depth deviation for a focused objectand 10 pixel for each camera results in about 10 percent depth devi-ation respectively. A subset of 6 users was additionally asked to tryboth single-point and two-point acquisition techniques and the timeneeded to complete data acquisition was measured. Table 2 shows thatour acquisition technique is faster for both novice and expert users.
Table 2. Mean time required per eye for a calibration with ten acquisi-tions (single point) compared to five acquisitions (two points).
Users Experiment Mean Time (s)Novice SPAAM 64.24
our Method 37.49Expert SPAAM 46.18
our Method 31.84
4 EXPERIMENTAL EVALUATION ON DISTANCE JUDGMENTS
In this section we describe the experiment that we conducted to ana-lyze the effect of the calibrated view frustum on distance estimation inVEs as derived by the calibration technique described in Section 3.
We performed all experiments in a 10m× 7m darkened laboratoryroom. In order to track the 6-DOF head position and orientation, anInertiaCube 3 (InterSense, 180Hz update rate) and an active infrared(IR) marker were attached on top of the OSTHMD. The Precision Po-sition Tracker (PPT) X4 (WorldViz, 60Hz update rate) determined theposition of the IR marker in the tracking space with sub-millimeterprecision and sub-centimeter accuracy.
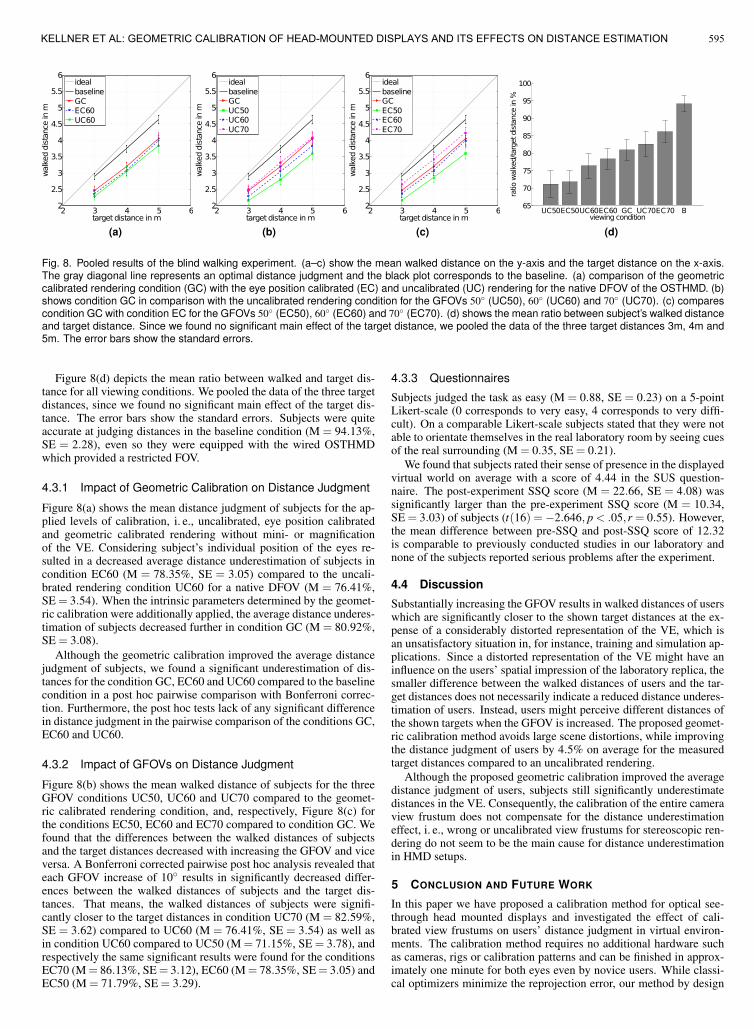
In the experiment subjects were seated in front of a table with amounted chin rest and carton boxes on the tabletop (see Figure 7(a))in order to perform the calibration process as described in Section 3.Both the chin rest and the boxes supported the subjects at stabiliz-ing their head posture and the position of the hand-held marker toincrease the data accuracy. The stationary marker was attached to atripod standing in 2.5m distance to the chin rest.
During the experiment the room was darkened and a black curtainwas fixed around the OSTHMD in order to reduce the subjects’ per-ception of the real world, except in the baseline condition. The visualstimulus consisted of the virtual replica of the laboratory room and thetarget marker (see Figure 7(c)). The subjects received instructions onslides presented on the OSTHMD and responded via a Nintendo Wiiremote controller. In order to focus subjects on the tasks no commu-nication between experimenter and subject was performed during theexperiment.
593KELLNER ET AL: GEOMETRIC CALIBRATION OF HEAD-MOUNTED DISPLAYS AND ITS EFFECTS ON DISTANCE ESTIMATION
(a) (b) (c)
Fig. 7. Illustration of the experiment setup: (a) subject during the calibration of the OSTHMD, (b) subject performing the blind walking task accordingto the judged distance of (c) the white target in the virtual laboratory replica presented on the OSTHMD.
4.1 Material and MethodsThe angle of declination and the convergence angle of the eyes serveas cues to estimate the distance towards a shown target. Consequently,disregarding the user’s individual position of the eyes probably affectsthe distance judgment in VEs. In order to analyze whether there is adifference in the user’s ability to judge distances considering a fixedinterpupillary distance (IPD), the user’s individual position of the eyesor a calibrated camera view frustum, we tested the following experi-mental conditions:
• Geometric calibrated rendering (GC): The intrinsic and ex-trinsic parameters of the OSTHMD were determined using thegeometric calibration process (see Section 3) and applied to therendering.
• Eye position calibrated rendering (EC): Solely the eye posi-tion given by the extrinsic parameters was applied to the ren-dering without considering the intrinsic parameters. Instead, weused symmetric view frustums with three varying GFOVs, i. e.,50◦ (EC50), 60◦ (EC60) and 70◦ (EC70), which result in a mag-nified, native and minified representation of the VE.
• Uncalibrated rendering (UC): The position of the tracked headmarker was mapped one-to-one to the camera position assuminga fixed IPD of 65mm. We used the same GFOVs as in conditionEC, i. e., 50◦ (UC50), 60◦ (UC60) and 70◦ (UC70).
• Baseline (B): Subjects saw their real surrounding through thedisplays of the OSTHMD while wearing the same equipment asin the other conditions.
We used a within-subject design in this experiment and pseudo-randomized the order of the conditions. The target distances for eachcondition were 3m, 4m and 5m, and were each presented 4 times inrandomized order resulting in 12 trials for each condition, i. e., 8×12 = 96 trials in total for each subject. In addition, subjects performed2 training trials in each condition before the actual trials began.
At the beginning of each trial, subjects had to assume a specificinitial position and orientation within the laboratory room with thesupport of two displayed markers on the HMD. One marker indicatedthe position and orientation of the destination and one marker indi-cated the current user’s position and orientation. After the subjectsconfirmed a proper position and orientation by a button press on aNintendo Wii remote controller, we displayed a target on the floor ofthe virtual laboratory replica at one of the aforementioned distances(see Figure 7(c)). The subjects were instructed to look at the targetand afterwards press a button on the Wii controller. Following this,the screen went black and the subjects had to walk to the position ofthe target without vision (see Figure 7(b)). The next trial starts after
the subjects confirmed their final position by a button press on the Wiicontroller. We measured the Euclidean distance between the trackedIR marker at the initial and final position of the user. In the baselinecondition, the target distances were indicated with a physical markersimilar to the marker displayed in the other conditions.
In order to identify potential influences on the results, subjects filledout Kennedy’s simulator sickness questionnaire (SSQ) [21] immedi-ately before and after the experiments, as well as the Slater-Usoh-Steed (SUS) presence questionnaire [33], and a questionnaire collect-ing anthropologic data and informal responses.
4.2 Participants
6 female and 11 male (age 22-42, M = 28.9,SD = 4.7) subjects par-ticipated in the experiment. Subjects were students or members of thecomputer science, mathematics, psychology, and physics departments.All had normal or corrected to normal vision; 5 wore glasses and 2wore contact lenses. 11 of the subjects had experience with walking inVR environments using a HMD setup. 9 had much video game expe-rience, 2 some, and 6 none. All subjects were naıve to the experimen-tal conditions. The total time per subject including pre-questionnaire,instructions, training, experiment, breaks, and debriefing took 75 min-utes.
4.3 Results
Figure 8 shows the pooled results for the blind walking experimentwith the target distances on the horizontal axis, and the mean walkeddistances on the vertical axis. The black plots show the results from thebaseline condition and the colored plots show the walked distances forthe conditions GC, EC and UC. The gray line corresponds to optimaldistance judgments. The error bars show the standard errors.
In order to test for any significant main or interaction effects, weperformed an 8 (viewing condition: GC, EC70, EC60, EC50, UC70,UC60, UC50, B) × 3 (target distance: 3m, 4m, 5m) repeated mea-sure ANOVA on the ratio between the subject’s estimated distanceand the target distance. We analyzed the ratio between the subject’swalked distance and the target distance in order to test if subjectswere significantly better or worse in distance judgment for specifictarget distances. Since Mauchly’s test of sphericity indicated that boththe main effect of the viewing condition (χ2(27) = 89.35, p < .001)and the target distance (χ2(2) = 14.45, p < .001) violated the as-sumption of sphericity, we corrected the degrees of freedom usingGreenhouse-Geisser estimates of sphericity (ε = .46 for viewing con-dition, ε = .62 for target distance). All effects are reported as sig-nificant at p < .05. We found no significant main effect of the tar-get distance (F(1.24,19.77) = 1.57, p = .229) and no interaction ef-fect (F(14,224) = .963, p = .492), but a significant main effect of theviewing condition (F(3.19,51.0) = 29.13, η2
p = .65) on the ability ofsubjects to judge distances.
594 IEEE TRANSACTIONS ON VISUALIZATION AND COMPUTER GRAPHICS, VOL. 18, NO. 4, APRIL 2012
2 3 4 5 62
2.5
3
3.5
4
4.5
5
5.5
6
targetdistance inm
walkeddistance
inm
idealbaselineGCEC60UC60
(a)
2 3 4 5 62
2.5
3
3.5
4
4.5
5
5.5
6
targetdistance inm
walkeddistance
inm
idealbaselineGCUC50UC60UC70
(b)
2 3 4 5 62
2.5
3
3.5
4
4.5
5
5.5
6
targetdistance inm
walkeddistance
inm
idealbaselineGCEC50EC60EC70
(c)
UC50EC50UC60EC60 GC UC70EC70 B65
70
75
80
85
90
95
100
viewing condition
ratio
walked/targetdistance
in%
(d)
Fig. 8. Pooled results of the blind walking experiment. (a–c) show the mean walked distance on the y-axis and the target distance on the x-axis.The gray diagonal line represents an optimal distance judgment and the black plot corresponds to the baseline. (a) comparison of the geometriccalibrated rendering condition (GC) with the eye position calibrated (EC) and uncalibrated (UC) rendering for the native DFOV of the OSTHMD. (b)shows condition GC in comparison with the uncalibrated rendering condition for the GFOVs 50◦ (UC50), 60◦ (UC60) and 70◦ (UC70). (c) comparescondition GC with condition EC for the GFOVs 50◦ (EC50), 60◦ (EC60) and 70◦ (EC70). (d) shows the mean ratio between subject’s walked distanceand target distance. Since we found no significant main effect of the target distance, we pooled the data of the three target distances 3m, 4m and5m. The error bars show the standard errors.
Figure 8(d) depicts the mean ratio between walked and target dis-tance for all viewing conditions. We pooled the data of the three targetdistances, since we found no significant main effect of the target dis-tance. The error bars show the standard errors. Subjects were quiteaccurate at judging distances in the baseline condition (M = 94.13%,SE = 2.28), even so they were equipped with the wired OSTHMDwhich provided a restricted FOV.
4.3.1 Impact of Geometric Calibration on Distance Judgment
Figure 8(a) shows the mean distance judgment of subjects for the ap-plied levels of calibration, i. e., uncalibrated, eye position calibratedand geometric calibrated rendering without mini- or magnificationof the VE. Considering subject’s individual position of the eyes re-sulted in a decreased average distance underestimation of subjects incondition EC60 (M = 78.35%, SE = 3.05) compared to the uncali-brated rendering condition UC60 for a native DFOV (M = 76.41%,SE = 3.54). When the intrinsic parameters determined by the geomet-ric calibration were additionally applied, the average distance underes-timation of subjects decreased further in condition GC (M = 80.92%,SE = 3.08).
Although the geometric calibration improved the average distancejudgment of subjects, we found a significant underestimation of dis-tances for the condition GC, EC60 and UC60 compared to the baselinecondition in a post hoc pairwise comparison with Bonferroni correc-tion. Furthermore, the post hoc tests lack of any significant differencein distance judgment in the pairwise comparison of the conditions GC,EC60 and UC60.
4.3.2 Impact of GFOVs on Distance Judgment
Figure 8(b) shows the mean walked distance of subjects for the threeGFOV conditions UC50, UC60 and UC70 compared to the geomet-ric calibrated rendering condition, and, respectively, Figure 8(c) forthe conditions EC50, EC60 and EC70 compared to condition GC. Wefound that the differences between the walked distances of subjectsand the target distances decreased with increasing the GFOV and viceversa. A Bonferroni corrected pairwise post hoc analysis revealed thateach GFOV increase of 10◦ results in significantly decreased differ-ences between the walked distances of subjects and the target dis-tances. That means, the walked distances of subjects were signifi-cantly closer to the target distances in condition UC70 (M = 82.59%,SE = 3.62) compared to UC60 (M = 76.41%, SE = 3.54) as well asin condition UC60 compared to UC50 (M = 71.15%, SE = 3.78), andrespectively the same significant results were found for the conditionsEC70 (M = 86.13%, SE = 3.12), EC60 (M = 78.35%, SE = 3.05) andEC50 (M = 71.79%, SE = 3.29).
4.3.3 Questionnaires
Subjects judged the task as easy (M = 0.88, SE = 0.23) on a 5-pointLikert-scale (0 corresponds to very easy, 4 corresponds to very diffi-cult). On a comparable Likert-scale subjects stated that they were notable to orientate themselves in the real laboratory room by seeing cuesof the real surrounding (M = 0.35, SE = 0.21).
We found that subjects rated their sense of presence in the displayedvirtual world on average with a score of 4.44 in the SUS question-naire. The post-experiment SSQ score (M = 22.66, SE = 4.08) wassignificantly larger than the pre-experiment SSQ score (M = 10.34,SE = 3.03) of subjects (t(16) =−2.646, p < .05,r = 0.55). However,the mean difference between pre-SSQ and post-SSQ score of 12.32is comparable to previously conducted studies in our laboratory andnone of the subjects reported serious problems after the experiment.
4.4 Discussion
Substantially increasing the GFOV results in walked distances of userswhich are significantly closer to the shown target distances at the ex-pense of a considerably distorted representation of the VE, which isan unsatisfactory situation in, for instance, training and simulation ap-plications. Since a distorted representation of the VE might have aninfluence on the users’ spatial impression of the laboratory replica, thesmaller difference between the walked distances of users and the tar-get distances does not necessarily indicate a reduced distance underes-timation of users. Instead, users might perceive different distances ofthe shown targets when the GFOV is increased. The proposed geomet-ric calibration method avoids large scene distortions, while improvingthe distance judgment of users by 4.5% on average for the measuredtarget distances compared to an uncalibrated rendering.
Although the proposed geometric calibration improved the averagedistance judgment of users, subjects still significantly underestimatedistances in the VE. Consequently, the calibration of the entire cameraview frustum does not compensate for the distance underestimationeffect, i. e., wrong or uncalibrated view frustums for stereoscopic ren-dering do not seem to be the main cause for distance underestimationin HMD setups.
5 CONCLUSION AND FUTURE WORK
In this paper we have proposed a calibration method for optical see-through head mounted displays and investigated the effect of cali-brated view frustums on users’ distance judgment in virtual environ-ments. The calibration method requires no additional hardware suchas cameras, rigs or calibration patterns and can be finished in approx-imately one minute for both eyes even by novice users. While classi-cal optimizers minimize the reprojection error, our method by design
595KELLNER ET AL: GEOMETRIC CALIBRATION OF HEAD-MOUNTED DISPLAYS AND ITS EFFECTS ON DISTANCE ESTIMATION
shows the smallest error in the center of the image and forces consis-tency along the center viewing ray. The error is therefore distributedin a way which fits better to the natural demands of viewing through ahead mounted display.
In the conducted experiment to analyze the effect of the calibratedview frustums on users’ distance judgment, we found the trend thatthe calibrated view frustum improves the distance estimation of userson average. However, the distance estimation of users still differs sig-nificantly from the real world baseline, which indicates that wrong oruncalibrated view frustums are probably not the main cause for dis-tance underestimation in VR environments.
In the future we will investigate possible improvements of the cal-ibration method to further reduce the needed user interaction and tomake the calibration more robust against noise in the user acquireddata. In addition, we will examine if the combination of calibratedview frustum with more realistically rendered virtual environments ac-count for a greater extent of the distance underestimation effect.
ACKNOWLEDGMENTS
Authors of this work are supported by the Deutsche Forschungsge-meinschaft (DFG 29160962).
REFERENCES
[1] P. L. Alfano and G. F. Michel. Restricting the field of view: perceptualand performance effects. Perceptual and Motor Skills, 70:35–45, 1996.
[2] R. S. Allison, I. P. Howard, and J. E. Zacherx. Effect of field size, headmotion and rotational velocity on roll vection and illusory self-tilt in atumbling room. Perception, 28:299–306, 1999.
[3] K. Arthur. Effects of field of view on task performance with head-mounted displays. In Proceedings of the Conference on Human Factorsin Computing Systems (CHI), pages 29–30, 1996.
[4] M. Axholt, M. Skoglund, S. D. Peterson, M. D. Cooper, T. B. Schoen,F. Gustafsson, A. Ynnerman, and S. R. Ellis. Optical see-through headmounted display direct linear transformation calibration robustness in thepresence of user alignment noise. Human Factors and Ergonomics Soci-ety Annual Meeting Proceedings (HFES), 54(28):2427–2431, 2010.
[5] T. Banton, J. Stefanucci, F. Durgin, A. Fass, and D. Proffitt. The percep-tion of walking speed in a virtual environment. Presence: Teleoperatorsand Virtual Environments, 14(4):394–406, 2005.
[6] S. Ellis and K. Nemire. A subjective technique for calibration of lines ofsight in closed virtual environment viewing systems. Proceedings of theSociety for Information Display, 1993.
[7] H. Frenz, M. Lappe, M. Kolesnik, and T. Buhrmann. Estimation of traveldistance from visual motion in virtual environments. ACM Transactionson Applied Perception (TAP), 4(1):1–18, 2007.
[8] A. Fuhrmann, D. Schmalstieg, and W. Purgathofer. Fast calibration foraugmented reality. In Proceedings of the Symposium on Virtual RealitySoftware and Technology (VRST), pages 166–167, 1999.
[9] A. Fuhrmann, D. Schmalstieg, and W. Purgathofer. Fast calibration foraugmented reality. Technical Report TR-186-2-99-16, Institute of Com-puter Graphics and Algorithms, Vienna University of Technology, Fa-voritenstrasse 9-11/186, A-1040 Vienna, Austria, May 1999.
[10] Y. Genc, F. Sauer, F. Wenzel, M. Tuceryan, and N. Navab. Optical see-through HMD calibration: A stereo method validated with a video see-through system. In Proceedings of IEEE/ACM International Symposiumon Augmented Reality (ISAR), pages 165–174, 2000.
[11] Y. Genc, M. Tuceryan, and N. Navab. Practical solutions for calibra-tion of optical see-through devices. In Proceedings of the InternationalSymposium on Mixed and Augmented Reality (ISMAR), pages 169–175,2002.
[12] S. J. Gilson, A. W. Fitzgibbon, and A. Glennerster. Spatial calibration ofan optical see-through head-mounted display. Journal of NeuroscienceMethods, 173(1):140–146, 2008.
[13] M. A. Hagen, R. K. Jones, and E. Reed. On a neglected variable in theo-ries of pictorial perception: truncation of the visual field. Perception andPsychophysics, 23:326–330, 1978.
[14] R. I. Hartley and A. Zisserman. Multiple View Geometry in ComputerVision. Cambridge University Press, ISBN: 0521540518, second edition,2004.
[15] S. Hassan, J. Hicks, L. Hao, and K. Turano. What is the minimum fieldof view required for efficient navigation? Vision Research, 47(16):2115–2123, 2007.
[16] V. Interrante, L. Anderson, and B. Ries. Distance perception in immersivevirtual environments, revisited. In Proceedings of Virtual Reality (VR),pages 3–10. IEEE Press, 2006.
[17] V. Interrante, B. Ries, J. Lindquist, and L. Anderson. Elucidating thefactors that can facilitate veridical spatial perception in immersive virtualenvironments. In Proceedings of Virtual Reality (VR), pages 11–18. IEEEPress, 2007.
[18] A. Janin, D. Mizell, and T. Caudell. Calibration of head-mounted displaysfor augmented reality applications. In Proceedings of the Virtual RealityAnnual International Symposium (VRAIS), pages 246–255, 1993.
[19] S. E. M. Jansen, A. Toet, and N. J. Delleman. Effects of horizontal field-of-view restriction on manoeuvring performance through complex struc-tured environments. In Proceedings of the Symposium on Applied Percep-tion in Graphics and Visualization (APGV), pages 189–189. ACM Press,2008.
[20] J. A. Jones, J. E. Swan II, G. Singh, and S. R. Ellis. Peripheral visualinformation and its effect on distance judgments in virtual and augmentedenvironments. In Proceedings of ACM SIGGRAPH Applied Perception inGraphics and Visualization (APGV), pages 29–35, 2011.
[21] R. S. Kennedy, N. E. Lane, K. S. Berbaum, and M. G. Lilienthal. Simula-tor sickness questionnaire: an enhanced method for quantifying simulatorsickness. International Journal of Aviation Psychology, 3(3):203–220,1993.
[22] S. Kuhl, W. Thompson, and S. Creem-Regehr. HMD calibration andits effects on distance judgments. In Proceedings of the Symposium onApplied Perception in Graphics and Visualization (APGV). ACM Press,2008.
[23] J. M. Loomis and J. M. Knapp. Virtual and Adaptive Environments, chap-ter Visual Perception of Egocentric Distance in Real and Virtual Environ-ments, pages 21–46. Lawrence Erlbaum Associates, Mahwah, NJ., 2003.
[24] E. McGarrity and M. Tuceryan. A method for calibrating see-throughhead-mounted displays for AR. In Proceedings of the IEEE/ACM In-ternational Workshop on Augmented Reality (IWAR), pages 75–84. IEEEComputer Society, 1999.
[25] R. Messing and F. H. Durgin. Distance perception and the visual hori-zon in head-mounted displays. ACM Transactions on Applied Perception(TAP), 3(2005):234–250, 2.
[26] C. B. Owen, J. Zhou, A. Tang, and F. Xiao. Display-relative calibrationfor optical see-through head-mounted displays. In Proceedings of theIEEE/ACM International Symposium on Mixed and Augmented Reality(ISMAR), pages 70–78. IEEE Computer Society, 2004.
[27] W. Robinett and J. P. Rolland. A computational model for the stereo-scopic optics of a head-mounted display. Presence: Teleoperators andVirtual Environments, 1(1):45–62, 1992.
[28] A. F. Seay, D. M. Krum, L. Hodges, and W. Ribarsky. Simulator sicknessand presence in a high field-of-view virtual environment. In Proceedingsof the Conference on Human Factors in Computing Systems (CHI), pages784–785. ACM Press, 2002.
[29] K. M. Stanney and R. S. Kennedy. The psychometrics of cybersickness.Communications of the ACM, 40(8):66–68, 1997.
[30] F. Steinicke, G. Bruder, M. Lappe, S. Kuhl, P. Willemsen, and K. H.Hinrichs. Natural perspective projections for head-mounted displays.IEEE Transactions on Visualization and Computer Graphics (TVCG),17(7):888–899, 2011.
[31] A. Tang, J. Zhou, and C. B. Owen. Evaluation of calibration proceduresfor optical see-through head-mounted displays. In Proceedings of theIEEE/ACM International Symposium on Mixed and Augmented Reality(ISMAR), pages 161–168, 2003.
[32] M. Tuceryan, Y. Genc, and N. Navab. Single-point active alignmentmethod (SPAAM) for optical see-through HMD calibration for aug-mented reality. Presence: Teleoperators and Virtual Environments,11:259–276, June 2002.
[33] M. Usoh, E. Catena, S. Arman, and M. Slater. Using presence ques-tionaires in reality. Presence: Teleoperators and Virtual Environments,9(5):497–503, 1999.
[34] R. Warren and A. H. Wertheim. Perception & Control of Self-Motion.Lawrence Erlbaum Associates, 1990.
[35] P. Willemsen and A. A. Gooch. Perceived egocentric distances in real,image-based, and traditional virtual environments. In Proceedings of Vir-tual Reality (VR), pages 275–276. IEEE Press, 2002.
596 IEEE TRANSACTIONS ON VISUALIZATION AND COMPUTER GRAPHICS, VOL. 18, NO. 4, APRIL 2012


![Head-Mounted Displays for Mobile Systems Researchers...head-mounted display June Volume Issue GetMobile 11 [MOBILE PLATFORMS ] experiences where the user is sitting or standing without](https://static.fdocuments.in/doc/165x107/5f8368b567352f565c48b1ae/head-mounted-displays-for-mobile-systems-researchers-head-mounted-display-june.jpg)