Geology, development, & economics of zeolite mining in ... · PDF fileN2 and CO2 adsorption...
68
GEOLOGY, DEVELOPMENT, & ECONOMICS OF ZEOLITE MINING IN AUSTRALIA STEVEN ALAN COOPER B.Sc.(Hons) Submitted in fulfilment of the requirements for the degree of Master of Economic Geology CENTRE FOR ORE DEPOSIT AND EXPLORATION STUDIES UNIVERSITY OF TASMANIA December 1993
-
Upload
nguyenthuy -
Category
Documents
-
view
217 -
download
0
Transcript of Geology, development, & economics of zeolite mining in ... · PDF fileN2 and CO2 adsorption...
GEOLOGY, DEVELOPMENT, & ECONOMICS OF ZEOLITE MINING IN AUSTRALIA
STEVEN ALAN COOPER B.Sc.(Hons)
Submitted in fulfilment of the requirements for the degree of
Master of Economic Geology
CENTRE FOR ORE DEPOSIT AND EXPLORATION STUDIES UNIVERSITY OF TASMANIA
December 1993

!!
oleuin oepiH lo Asepnoo Licietolotid -wri os Aleiewixoidde si eq oleos
'M'S'N Vaio spaem 'Gum emioeZ no3s3 1.110.11 uogoes .spaeus sseib 6upeicieJ pue ow! 6uvitor6 sielsifuo emou4dou!p-e0

DECLARATIVE STATEMENT
To the best knowledge and belief of the writer, this thesis
contains no work previously published, or written by another
party, without having made due reference to them in the text of
this thesis. Nor does this thesis contain material which has been
accepted for the award of any other higher degree or graduate
diploma at this, or any other, tertiary institution.
Steven Alan Cooper
15 December 1993
ABSTRACT
Zeolite mining in Australia has been developing at a steady, if slow pace since late 1987, when
the first Australian zeolite mine commenced operation at Escott. This inaugural economic
deposit, likely to be joined by others, is situated in altered ignimbrite, air fall pyroclastic, and
volcaniclastic lacustrine sediments of the Late Carboniferous Currabubula Formation in north-
eastern New South Wales. The Early Carboniferous Ducabrook Formation of the Drummond
Basin in central Queensland is another zeolite deposit with good economic potential. While
generally the regional geology for each deposit is relatively simple and understood,
characterisation of the zeolitic mineralisation has been determined by a wide range of
geochemical, petrological, physical, SEM, and recently thermal XRD and nuclear magnetic
resonance (NMR) methods. Studies have confirmed that the prominent zeolite mineral mined at
Escott is low thermal stability. Ca-clinoptilolite, and that this zeolite mineral is likely at the other
prospects.
This Characterisation is important as the natural zeolitic rock produced has physical properties
(density, hardness, age, etc.) different from most overseas zeolitic rocks, thereby requiring
specific trials to be developed to examine the application of its different properties. Also, different
deposits show physical and chemical variations that might play an unknown part in performance
for particular markets. The aim of this study is to compile and obtain new information of the
characterisation of the Australian natural zeolites, in the manner outlined by Sheppard (1983).
Such determination is essential for establishing a rational basis for the commercial use and
application research of natural zeolites. No systematic compilation or examination had been
made to date on the increasingly large amount of laboratory and exploration material collected
over six years. It is hoped that this thesis provides a reference source, both for geological and
other disciplines utilising zeolites. A starting point for any new zeolite deposit is the established
characterisation methods for natural zeolitic rocks developed by the New South Wales
Department of Mineral Resources (Fredrickson, 1986).
Sale and marketing information gained in' Australian over its six year history has shown the
importance of working with clients, and the development of innovative technology for the
utilisation of natural zeolites (Stephen & Gout, 1993). Product development has ranged over
packaging, particle sizing and selective high grade mining, with strong encouragement for
bilateral communication with potential clients during trialing. Main barriers to expanded growth in
some markets are milling and freight costs, which are currently being addressed. Future
developments will include chemical and physical modification of the natural zeolite to meet
iv

certain client requirements. One threat to market development is the potential health implications
of the fibrous zeolite erionite currently mined overseas.
The natural zeolite industry in Australia is established, with total invoiced sales to date of over a
million dollars, but growth is slow and difficult due to volume related inefficiencies resulting in
high costs and slow consumer appreciation of the products. Geological studies have been
minimal due to the need for low cost development, but this has changed with the realisation that
detailed characterisation is essential. The role of the geologist has thus also changed, from that
of active exploration, to technical coordinator for a mineral group with extremely wide product
applications.
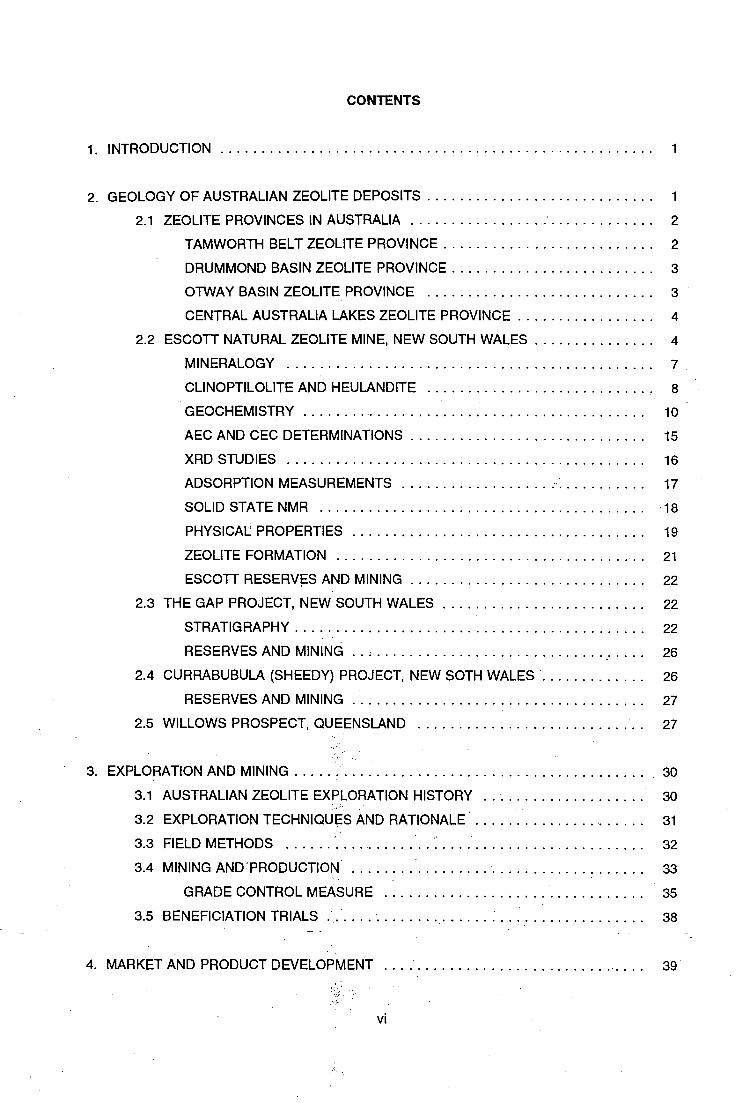
CONTENTS
1. INTRODUCTION 1
2. GEOLOGY OF AUSTRALIAN ZEOLITE DEPOSITS 1
2.1 ZEOLITE PROVINCES IN AUSTRALIA 2
TAMWORTH BELT ZEOLITE PROVINCE 2
DRUMMOND BASIN ZEOLITE PROVINCE 3
OTWAY BASIN ZEOLITE PROVINCE 3 CENTRAL AUSTRALIA LAKES ZEOLITE PROVINCE 4
2.2 ESCOTT NATURAL ZEOLITE MINE, NEW SOUTH WALES 4 MINERALOGY 7 CLINOPTILOLITE AND HEULANDITE 8 GEOCHEMISTRY 10
AEC AND CEC DETERMINATIONS 15 XRD STUDIES 16 ADSORPTION MEASUREMENTS 17 SOLID STATE NMR 18
PHYSICAL PROPERTIES 19
ZEOLITE FORMATION 21 ESCOTT RESERVES AND MINING 22
2.3 THE GAP PROJECT, NEW SOUTH WALES 22 STRATIGRAPHY 22 RESERVES AND MINING 26
2.4 CURRABUBULA (SHEEDY) PROJECT, NEW SOTH WALES 26 RESERVES AND MINING 27
2.5 WILLOWS PROSPECT, QUEENSLAND 27
3. EXPLORATION AND MINING 30
3.1 AUSTRALIAN ZEOLITE EXPLORATION HISTORY 30
• 3.2 EXPLORATION TECHNIQUES AND RATIONALE 31 3.3 FIELD METHODS 32 3.4 MINING AND"PRODUCTION 33
GRADE CONTROL MEASURE 35
3.5 BENEFICIATION TRIALS 38
4. MARKET AND PRODUCT DEVELOPMENT 39
vi

4.1 ZEOLITE APPLICATIONS AND MARKETS 39
4.2 HEALTH STUDIES 41
4.3 PRICING AND COSTS 42
4.4 MARKETING 43
RESEARCH AND DEVELOPMENT 44
4.5 ECONOMICS OF THE AUSTRALIAN ZEOLITE MARKET 45
5. CONCLUSIONS 47
6. ACKNOWLEDGMENT 48
7. REFERENCES 49
FIGURES
Frontispiece. Ca-clinoptilolite crystals growing into glass shards, Escott Zeolite Mine ii
1. Documented authigenic Zeolite Provinces in Australia 3
2. Geology Escott Private Minerals Agreement area 5
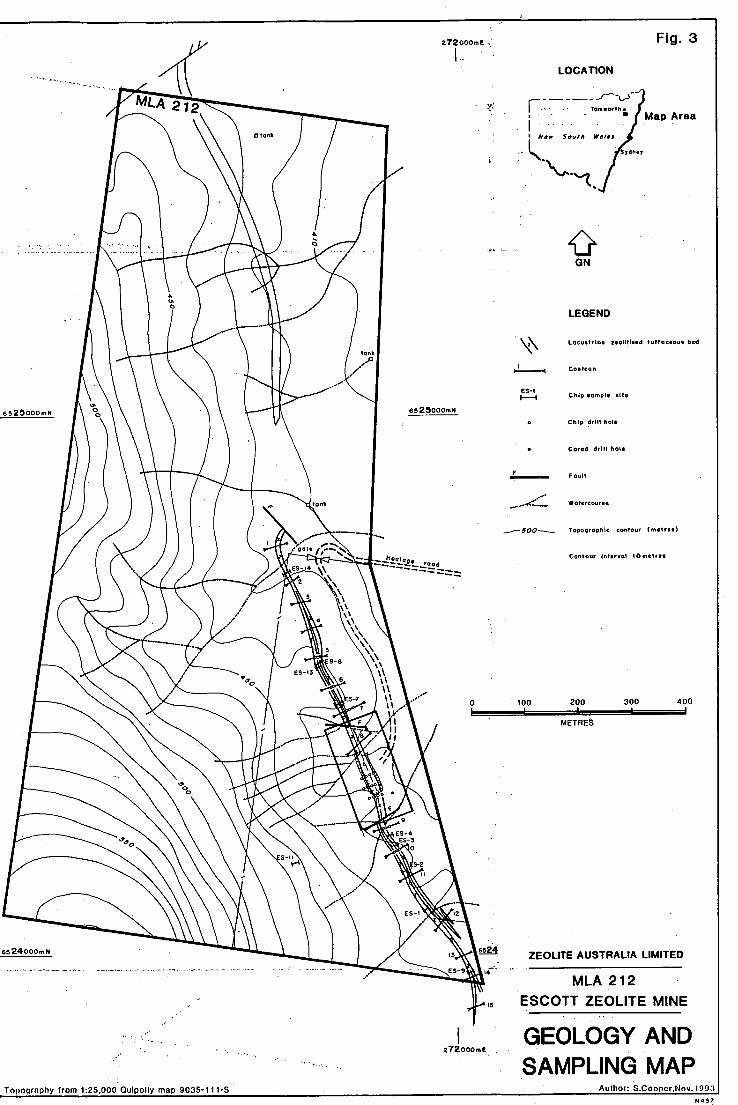
3. Geology and samples in Mining Lease Application over Escott 6
4. Cross section of the Escott Zeolite Mine 7
5. SEM picture of lath clinoptilolite crystals from Escott 8
6. (Ca+Mg)-Na-K plot of zeolite from New South Wales and Queensland 9
7. Changes in means of major & trace elements with zeolitisation, Currabubula Formation 11
8. Plot of Sr and LOI verses AEC for Currabubula Formation samples 12
9. Zr/Ti-NbN plot of Currabubula Formation rhyolite ignimbrite and zeolite units 14
10. Principal thermal XRD difference between Ca-clinoptilolite and heulandite 16
11. Different XRF patterns by heating powder from Escott • 16
12. N2 and CO2 adsorption and thermogravimetric curves for Escott Natural Zeolite 17
13. Static NMR wideline spectrum of heulandite and Escott samples 18
14. Wet Attrition test for synthetic and natural zeolites 20
15. Geological sketch map of The Gap location 22
16. Thin section of main zeolite unit and typical samples from The Gap 24
17. Thin sections from The Gap showing Ca-clinoptilolite 25
18. Zeolite units within the Currabubula (SheedY's) MLA, with cross section 28
19. Example of pink zeolitised unit from near Willows, Queensland 29
vii

20. Photograph looking south along strike into the Escott Zeolite Mine 33
21. Some of factors that influence AEC determination 37
22. SEM photograph of Escott ultrafine powder 41
23. Tonnes sold Escott Natural Zeolite per quarter, for first six years 45
24. Percentage tonnes sold by market and location for first six years 46
TABLES
1. Trace element means (standard deviations) for Escott Natural Zeolite 13
2. AEC, CEC, exchanged cations, assays, and conductivity of tabled fractions 38
3. Applications of zeolites 40
4. Marketing channels used by Zeolite Australia Limited for Escott Natural Zeolite 44
APPENDICES
1. Major element analysis of Currabubula Formation zeolitic samples.
2. Trace element analysis of Currabubula Formation zeolite samples.
3. Whole rock analysis of Currabubula Formation ignimbrites by McPhie, 1984.
4. Whole rock analysis of zeolite samples from Ducabrook Formation, Drummond Basin, Old.
5. Microprobe analysis of zeolite sample from Ducabrook Formation, Drummond Basin, ad.
6. Microprobe analysis of zeolite crystals from Otway Basin by Duddy, 1983.
viii
1. INTRODUCTION
Zeolite mining in Australia commenced in December 1987 as a 15 tonne test bulk sample taken
at Escott, New South Wales. Subsequently, similar to most non-communist zeolite deposits,
growth and development has been slow and steady. Much of this trend can be attributed to the
lack of an existing market, combined with lack of experience, both on the part of the producer
and of the consumer, in dealing with and utilising natural zeolites.
This thesis summarise the geological setting, exploration techniques, production, marketing and
the sale of natural zeolites in Australia. It presents a case study of a completely new mineral
product that has been launched into a sophisticated market environment by a single mining
company. This has generated problems not normally encountered in mining and associated
marketing. The geology and mineralogy are sufficiently different from current zeolite production
in overseas countries to make it necessary to precisely characterise each zeolite occurrence.
Until recently, minimum effort was devoted to documenting the geology and characteristics,
because the major efforts were directed at market development. Sheppard (1983) outlined the
problem of the lack of zeolite characterisation, and it is hoped that this thesis goes towards
addressing this area.
The reliance on overseas trials for predicting the potential uses has been hampered by the lack
of published papers, that actually give characterisation details about the zeolitic materials being
trialed or tested. As will be shown, without details on a range of other variables, comparisons of
quoted Cation Exchange Capacities (CEC) I , for most applications are not possible. Yet cation
exchange capacity is the so-called standard measure of grade for zeolite deposits. This has all
combined to make comparisons between zeolite deposits very difficult for the consumers.
2. GEOLOGY OF AUSTRALIAN ZEOLITE DEPOSITS
The literature abounds with papers detailing trials in agriculture and animal feed, plus some
geological papers, that often give only a zeolite mineral species name, and maybe a chemical
analysis (through often what exactly is assayed is not specified) concerning the zeolitic product
under discussion (Sheppard, 1983). The same can be said of the standard measurement of
usefulness of zeolites, the CEC, but this measurement is often not even quoted. For tests to be
comparative and useful, more information is required regarding the zeolitic mineral or rock being
used.
The CEC is a relative measure of the number of cations present within a zeolite crystal available for exchange.
1

This chapter attempts to provide a characterisation of Australian zeolites so as to assist other
professions in their trials and studies. The following criteria are desirable for characterisation
(modified from Sheppard, 1983);
1. Zeolite species name,
2. Suppliers name, address, product code,
3. Deposit name and location,
4. Particle sizing used (in millimetres),
5. Mineralogical composition of zeolitic material,
6. Chemical analysis of the zeolite mineral and material,
7. Homogeneity of the zeolitic material,
8. Crystal size and habit of zeolite,
9. Cation exchange or adsorption properties, and measurement method,
10. Any modifications to natural zeolite product.
In the following discussions, samples referred to as zeolitic are those with an Ammonia Exchange
Capacity (AEC) 2 greater, than 70 meq/100 g 3, unless zeolite content has been confirmed by
other procedures. Experience shows that above this arbitrary value (after checking smectite or
kaolinite contents are insignificant) there must be a reasonable proportion (>20%) of zeolite
minerals (Fredrickson & Dowswell, 1988).
2.1 ZEOLITE PROVINCES IN AUSTRALIA
Four authigenic Zeolite Provinces are currently known within Australia (Fig. 1). The first
embraces Late Carboniferous rocks in the Tamworth Belt of north-eastern New South Wales
(Flood & Taylor, 1991). The second covers the Early Carboniferous rocks from the Drummond
Basin in central Queensland. The third Early Cretaceous rocks from the Otway Basin, western
Victoria. The fourth documented area is in central Australia, and consists of an example of
zeolites forming in Tertiary-Quaternary saline, alkaline lake deposits.
TAMWORTH BELT ZEOLITE PROVINCE
The Tamworth Belt Zeolite Province, as described by Flood & Taylor (1991), extends for 290
kilometres and is composed of Late Carboniferous volcanic braided stream conglomerates. Thin
and widespread silicic ignimbrite sheets and are typical of the Province (McPhie, 1986). Zeolite
2
AEC is a method of determining the CEC by using ammonia as the measured exchanged cation.
The unit of measurement for CEC and AEC is milliequivalents per 100 grams (meq/100 g).
2

Mann
DRUMMOND BASIN Early Carboniferous
CENTRAL LAKES aSsOuaternary
Brisbane
Wertle,Syneline
• TAMWORTH BELT Late Carboniferous
Adelaide Sydney
OTWAY BASIN
300 ern
Lower reteeeous
Melbourne
Fig. 1 Documented in Australia.
authigenic Zeolite Provinces
seems to be restricted to silicic tephra
units, generally associated with lacustrine
or interpreted water-associated
environments. Numerous units are known,
but generally thickness is too thin (<2
metres), or too low grade (<120 meg/100 g)
for commercial development. Currently one
site is being actively mined (Escott),
another planned (Sheedy), and a third site
under consideration (The Gap).
DRUMMOND BASIN ZEOLITE PROVINCE
The second Province also contains non-
marine, water-lain silicic tephra sheets.
These shallow-dipping, gently-folded units
within the Early Carboniferous (Visean)
Ducabrook Formation outcrop in the
eastern Drummond Basin and are
zeolitised. During 1988, an independent
exploration company, Burgundy Exploration
Pty Ltd (Harms, 1990), provided Zeolite Australia Limited with a suite of samples that physically
resembled hand specimens of zeolite currently mined at Escott. Testing by Zeolite Australia
confirmed high AEC and zeolitic mineralogy.
Generally the tephras are relatively flat-lying units interbedded with feldspathic-lithic sandstones
and green mudstones of the Ducabrook Formation. The depositional environment is non-marine
and shallow water (Drysdale, 1992), with indications of glacial conditions (Pinchin, 1978), within a
back-arc setting (Johnson & Henderson, 1991). The area of known zeolitic outcrop is a 130
kilometre belt running from exposures located in the Mistake Creek syncline, west of Claremont,
south-east to within various local synclines, south of the township of Anakie. Generally the units
are thin and not well exposed, but units south-west of Anakie, in the Willows area, have
economic potential.
OTWAY BASIN ZEOLITE PROVINCE
The third Province, the Lower Cretaceous Otway Group within the Otway Basin, has been well
documented by Duddy (1983). He outlined the distribution of clinoptilolite-heulandite within pores
3

representing up to 10-15 percent of this fluviatile volcaniclastic sequence. The Otway Group,
over 1200 m in thickness and extending 800 kilometres, is not expected to be economic due to
the lack of higher grade zeolitic material within the sequence, together with the lack of outcrop.
The Otway Group is conspicuous for its lack of primary volcanic material, yet the sandstones and
mudstone sequence is composed of material derived from contemporaneous pyroclastic
volcanism (Duddy, 1983). While chemical and thermal conditions were suitable for uniform
zeolite formation over a large interval, the sediments were composed of too much lithic and
crystal material to form other than low grade zeolites.
CENTRAL AUSTRALIA LAKES ZEOLITE PROVINCE
The same lack of siliceous feed material is probably the reason that the zeolitic content (around
10%) of the current saline-alkaline lakes in central Australia, the fourth province, is low. The
formation and distinctive features of saline-alkaline lake zeolite deposits are well documented by
Surdam (1977), and Surdam & Sheppard (1978). Arakel (1987), published the first description of
Australian zeolites in this setting within authigenic pore fillings in a dolomitic groundmass beneath
current saline lakes near Curtin Springs, Central Australia (Fig. 1). Dominant zeolite mineral is
analcime, with minor phillipsite, mordenite and chabazite. However, "the possibility of a•
commercial zeolite deposit is increased by a high content of glass and a low content of crystal
and rock fragments" (Sudam & Sheppard, 1978, p.172). It is apparent that most of central
Australia lacks abundant volcanic glass content. Thus while the chemical environment is
favourable for zeolite formation, generally the playa lakes lack sufficient siliceous material to
generate high grade zeolite deposits.
2.2 ESCOTT NATURAL ZEOLITE MINE, NEW SOUTH WALES
At Escott the unit mined occurs within the Currabubula Formation, south west of the township of
Werris Creek. The unit was first mapped by geology students from the University of New
England, Armidale, with sampling by the New South Wales Department of Mineral Resources
later confirming the zeolitisation (P. Flood,' personal communication). The area being mined is
within, a Private Minerals Agreement (PMA) area (Fig. 2), surrounded by a larger Mining Lease
Application (MLA 212, Fig. 3). Following an initial two deep drillholes (Flood, 1987), the deposit
was subsequently costeaned and air-track drilled to confirm the tonnage and grade, and a 15
tonne bulk sample was then collected. Later detailed mapping was completed by contract
geologist R. Hill (Fig. 2) within the PMA area.
4

Private Minerals Agreement Boundary
614
—•0 111 eND Z
Floral Fosal
VOL Owe"
col
Private Minerals Agreement Boundary OW —
Ceonte Boulder
8°. Oicesictite
-- col eel
rn Toe RO V GPO ear
OF I col
v es -r z ss
F, 4
00 1„,i
Fig. 2
Nigh Quality BWE FG Per ZT
Bedding facing facing overturned Fault - up/down slip
a
-
BnoS df iancin sgtrike and dip Joint and dip
- Bedding strike and vertical 1---1 Cleavage trend and vertical
1--1 Cleavage trend and dip =-- Strike of bed tie
- Strike and dip direction Fracture plane
7-- -r Quarry bench A 1--1 Quarry bench- B
Sleep slope - bank --- Disturbance boundary
,Zeolitic ms Mudstone FG Fine grained
cal Conglomerate SED Sedimentary ms Medium grained
✓ Voicanoclaslic BREC Breccia CG Coarse grained
VIT Vitreous ss Sandstone sr Speckled
GOT Grits OTZ Quartz Orr Spotted
BND Banded - finely bedded ONK Pink r Tuff
SSD Soft sedimentary deporIlt RD Red WAS Massive
ZNF Zeolite healed fracture se Brown Elio Biotite
R Reworked GR Green K -SPAR Potash feldspar
cr Crystal tuff Cu. Cleaved -
10 20 30
metres
ZEOLITE AUSTRALIA LIMITED
ESCOTT ZEOLITE DEPOSIT
--- Drainage / Unit boundary (Approx. boundary)
• Fault (Approx. position) ?—? Questionable boundary
I Jif Shear
A1 t4. Air track hole Pi - North —South W SE I • Percussion hole
GEOLOGY Geology by R. Hill PRIVATE MINERALS AGREEMENT AREA
N 403
Topography from 1:25,000 Ouipolly map 9035-111-S Author: S.Cooper,Nov.1993 N457
Fig. 3 2 2 0 0 0 m E ,
LOCATION
LEGEND
Laculstrin• seolitlsed tuff aceous bed
Co•tean
ES-I Chip sample site
• Chip drill hole
• Corad drill hole
Foul?
• WOlirCOLIrse
500 Topographic contour (m•tres)
Contour I I lOmetre•
O 100 200 300 400
METRES
ZEOLITE AUSTRALIA LIMITED
MLA 212 ESCOTT ZEOLITE MINE
GEOLOGY AND SAMPLING MAP
6524000m N
272000me .

Ph/ell:lets 1_ voleanieloe114
Pyroelastie deposition Into locustrin•
, Flue elite - !Gensler. voicanielostles
. • • • 79 • k •I.: .
Voice.!elastic% „Pr itty
Pith I sandstones mwfstone I . • sande..
106
I
I snanive end
32.115
Red-preen banded elude one
Wee@ bonded
pink tuff
56•22
-230n
460.5 31 • IS
-111011 ,
104 AEC nee/100g
• (45) Other laboratory
11715 Al, track &Whole
WSE2 RE drillholo
56+6 Clinoptiloilto stoed•nite /
30+•
• + feldspar % by 29 2
Fig. 4 Cross section of the Escott Zeolite Mine showing the main units involved, and AEC grades measured along drillholes.
The sequence has only been
mapped in detail around the
mine (R. Hill, unpublished map,
1989). The extensions north
and south have been mapped in
a reconnaissance manner only.
The western basal sequence to
the area is coarse fluviatile
volcaniclastic sandstones,
overlain by green weakly zeolitic
lacustrine mudstone (Flood,
1991). This is overlain by pink
volcaniclastic sandstone
displaying basal scour channels
and abundant basal clasts of
the underlying mudstone. The
next unit is mappable for some
distance and consists of a
massive, red with green
speckles, zeolitised vitric air- fall tuff, 5 to 7 metres thick. This is termed Unit A by Flood (1991)
and thin section petrography confirms uniform grain size. Unit A has a thin green zeolitic unit
lying above reworked volcaniclastic sands; it wedges out to the south. The next unit, Unit B, is a
laminated mudstone with 1 to 5 mm thick normal graded beds showing individual grading from
red at the base, to green in the uppermost layers. The thin layers also display planar and
current cross bedding and bioturbation. This is followed by a four metre thick red, crystal vitric
air-fall tuff, Unit C. This is overlain by Unit D, a pink volcaniclastic mudstone to fine sandstone,
together with gritty sandstones and mildly zeolitic volcanic mudstones. Near the eastern margin
of the Private Mining Agreement Area the coarsening up sequence becomes a pebbly diamictite,
grading still further to coarse boulder diamictite, before disappearing below the black soil. All
contacts appear conformable. The units mined are A and B. Zeolitisation has replaced both
glass shards and the fine groundmass within most units, with lower grades being due to
excessive crystal fragments.
MINERALOGY
XRD studies (Fredrickson & Pecover, 1987) showed the mineralogy of Escott as dominant
quartz, moderate clinoptilolite, and small amount feldspars. Flood & Taylor (1991) confirmed that
7

Fig. 5 SEM picture of lath clinoptilolite crystals from Escott. Normally the crystals are not so well developed. Scale bar 0.05 mm.
the mined section contains 60 percent zeolite (minor mordenite), 30 percent quartz, 4 percent
feldspar, trace amount biotite and clays. The ratios for drillhole WSE-2 are shown in Figure 4.
Microprobe analysis and detailed
microscopy have shown that the interior
of the large shard pseudomorphs is
composed of relatively large, blocky
crystals of Ca-clinoptilolite. Mordenite is
present in the Fe-enriched rims of the
replaced shards (Flood, 1991, see
frontispiece photograph), and the Ca-
clinoptilolite appears to have grown
inward from this layer. An SEM picture
of the thin, monoclinic zeolite crystals is
provided in Figure 5.
Numerous thin sections supplied by P.
Flood have shown that phenocrysts
including quartz, albite, orthoclase
(sanidine), and smaller biotite flakes, are
present in a glass shard dominated background. The quartz is mainly angular and widely
distributed in the air-fall tuffs.
CLINOPTILOLITE AND HEULANDITE
Heulandite was proposed by Brooke (1822), and clinoptilolite by Schaller in 1932. The two are
close to isostructural, therefore confusion has resulted in the nomenclature (Gottardi & Galli,
1985). It has even been proposed that the name clinoptilolite be discontinued (i.e. Tschernich,
1992). Which mineral present is important as most research for commercial applications is
performed using clinoptilolite, and to have heulandite would cause confusion for those with little
mineralogy. The Heulandite Group (Gottari & Galli, 1985) has the general formulae of
(Ca,Na2 ,K2 ,Mg,Ba,Sr) 8(A1 8 ,Si28 ,072).24H 20 (Tschernich, 1992), and are monoclinic. Clinoptilolite is
now considered one of the most common authigenic silicates to be found in sedimentary rocks
(Mumpton, 1978).
A common method of chemical definition proposed by Mason and Sand (1960) requires that
clinoptilolite have Ca<(Na+K). Gottari & Galli (1985) also accepted the nomenclature of Mason
8
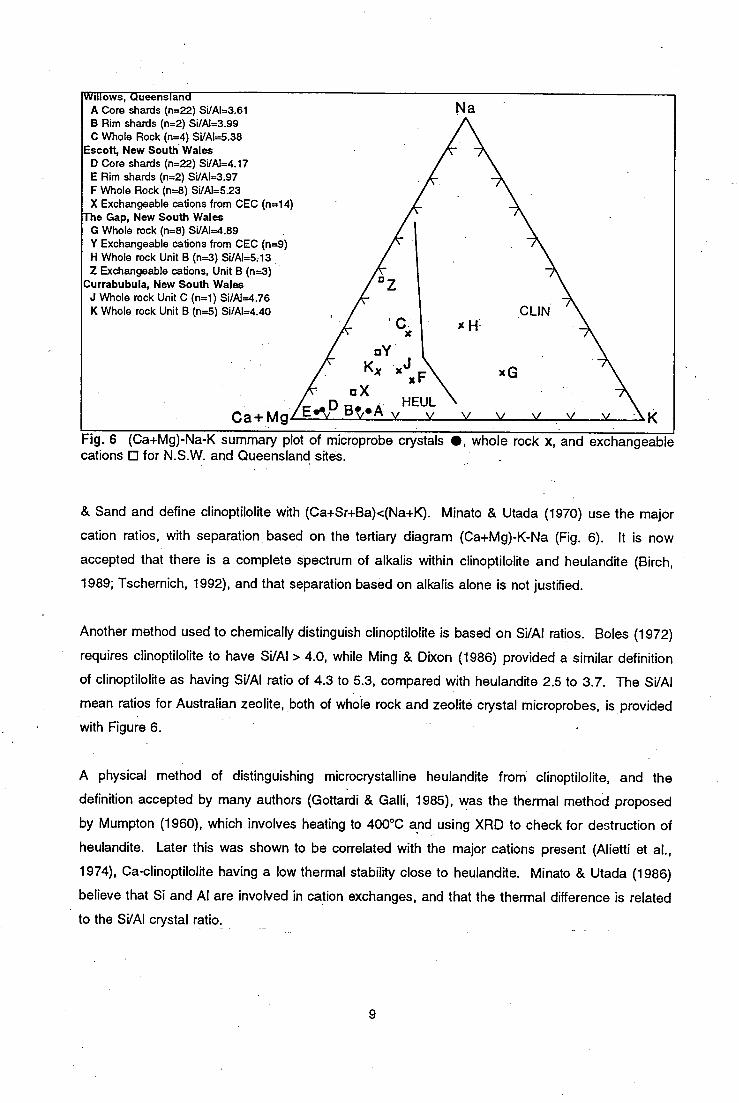
'Willows, Queensland A Core shards (n=22) SVAI=3.61 B Rim shards (n=2) Si/AI=3.99 C Whole Rock (n=4) Si/AI=5.38
Escott, New South Wales D Core shards (n=22) Si/AI=4.17 E Rim shards (n=2) Si/AI=3.97 F Whole Rock (n=8) SVAI=5.23 X Exchangeable cations from CEC (n=14)
The Gap, New South Wales G Whole rock (n=8) SVAI=4.89 Y Exchangeable cations from CEC (n=9) H Whole rock Unit B (n=3) Si/AI=5:13 Z Exchangeable cations, Unit B (n=3)
Currabubula, New South Wales J Whole rock Unit C (n=1) SUAI=4.76 K Whole rock Unit B (n=5) Si/AI=4.40
Ca+Mg Fig. 6 (Ca+Mg)-Na-K summary plot of microprobe crystals •, whole rock x, and exchangeable cations 0 for N.S.W. and Queensland sites.
& Sand and define clinoptilolite with (Ca+Sr+Ba)<(Na+K). Minato & Utada (1970) use the major
cation ratios, with separation based on the tertiary diagram (Ca+Mg)-K-Na (Fig. 6). It is now
accepted that there is a complete spectrum of alkalis within clinoptilolite and heulandite (Birch,
1989; Tschernich, 1992), and that separation based on alkalis alone is not justified.
Another method used to chemically distinguish clinoptilolite is based on Si/Al ratios. Boles (1972)
requires clinoptilolite to have SVAI > 4.0, while Ming & Dixon (1986) provided a similar definition
of clinoptilolite as having Si/Al ratio of 4.3 to 5.3, compared with heulandite 2.5 to 3.7. The Si/Al
mean ratios for Australian zeolite, both of whole rock and zeolite crystal microprobes, is provided
with Figure 6.
A physical method of distinguishing microcrystalline heulandite from clinoptilolite, and the
definition accepted by many authors (Gottardi & Galli, 1985), was the thermal method proposed
by Mumpton (1960), which involves heating to 400°C and using XRD to check for destruction of
heulandite. Later this was shown to be correlated with the major cations present (Alietti et al.,
1974), Ca-clinoptilolite having a low thermal stability close to heulandite. Minato & Utada (1986)
believe that Si and Al are involved in cation exchanges, and that the thermal difference is related
to the Si/Al crystal ratio.
9

Minato & Utada (1986) provide the follow distinguishing features of clinoptilolite, compared to
heulandite;
1. Genesis: clinoptilolite is diagenetic and found in sedimentary-tephra rocks by the
alteration of volcanic glass or fills grain boundaries. Heulandite is not only in sediments,
but also in vugs and hydrothermal veins in basaltic and andesitic rocks.
2. Optical Properties: clinoptilolite has refractive index lower than 1.484, and heulandite is
higher than 1.488. One of the characteristic features of clinoptilolite is its
microcrystallinity (Gottardi, 1978), and this makes optical properties hard to determine.
3. Chemical: clinoptilolite is more alkalic and more silicic than heulandite. Minato & Utadu
(1986) suggest that Al and Si are possibly involved in cation exchanges.
4. Crystal Structure: Both have similar crystal structure, but clinoptilolite does not transform
into B-type, regardless of exchangeable cations.
When using chemical composition for identification, it is often not clear whether many published
assay values are microprobes of the zeolite crystals, or other analytical methods on zeolite
concentrates, or are whole rock analyses, the last two naturally containing other impurities. The
plot of whole rock chemistry is very different from that observed for microprobe analysis of zeolite
crystals as can be clearly seen in Figure 6, where both crystal and whole rock means are plotted.
Current study involving both thermal XRD and experimental NMR on Escott samples, combined
with the distinguishing features listed by Minato & Utada (1986), confirm that the zeolites are
predominantly Ca-clinoptilolite.
GEOCHEMISTRY
Assays of whole rock samples have been completed on many samples of zeolitic rocks. For the
zeolitic rocks from the Currabubula Formation, a useful suite of comparison analyses is provided
by the twenty-two samples of relatively unaltered rhyolite ignimbrite from the Currabubula
Formation (and from the same 1:100,000 Tamworth 9035 map sheet) by McPhie (1984). As
these unaltered samples, and the zeolitic samples, are part of the same eruptive sequence
(McPhie, 1983), it will be assumed that there is a cogenetic relationship between them. Some of
the samples by McPhie (i.e., Nos. 9, 10, 28, & 29) do show signs of alteration reflected chemically
in low Si, high Ca, and Loss On Ignition (L01) values greater than 5 percent, which could indicate
calcite alteration (Davidson & Dashlooty, 1993), or slight zeolitisation (see below).
Thirty samples from the Currabubula Formation with AEC greater than 70 meq/100 g (most
analysis are from Fredrickson & Pecover, 1987, combined with additional samples from Escott,
10
o cr 0
•_0
1 o 0 0 cD Tr cv
peieileun/poioliv x !
co
0 2
0 CV
0 _
0 c c
5 -J
I I J
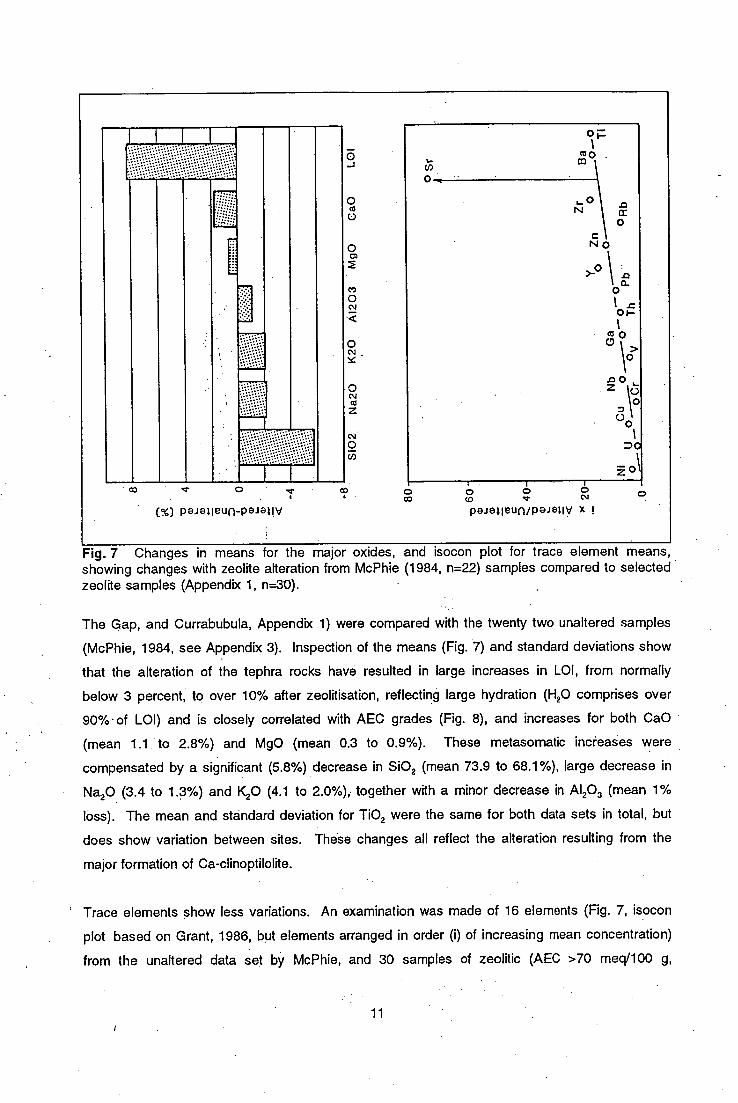
Fig. 7 Changes in means for the major oxides, and isocon plot for trace element means, showing changes with zeolite alteration from McPhie (1984, n=22) samples compared to selected zeolite samples (Appendix 1, n=30).
The Gap, and Currabubula, Appendix 1) were compared with the twenty two unaltered samples
(McPhie, 1984, see Appendix 3). Inspection of the means (Fig. 7) and standard deviations show
that the alteration of the tephra rocks have resulted in large increases in LOI, from normally
below 3 percent, to over 10% after zeolitisation, reflecting large hydration (H 20 comprises over
90%•of L01) and is closely correlated with AEC grades (Fig. 8), and increases for both CaO
(mean 1.1 to 2.8%) and MgO (mean 0.3 to 0.9%). These metasomatic increases were
compensated by a significant (5.8%) decrease in Si0 2 (mean 73.9 to 68.1%), large decrease in
Na20 (3.4 to 1.3%) and K20 (4.1 to 2.0%),. together with a minor decrease in Al203 (mean 1%
loss). The mean and standard deviation for TiO 2 were the same for both data sets in total, but
does show variation between sites. These changes all reflect the alteration resulting from the
major formation of Ca-clinoptilolite.
Trace elements show less variations. An examination was made of 16 elements (Fig. 7, isocon
plot based on Grant, 1986, but elements arranged in order (i) of increasing mean concentration)
from the unaltered data set by McPhie, and 30 samples of zeolitic (AEC >70 meq/100 g,
11
0 8 co
0
0
0
o
o° o 0
og 0
o • 0 8 0
0
•
0 0
o
.
o
.
o
o c
0 cp
o o
co
• (9 .,
o
0 0
o
•
•
o
o
o 0
•
o o co
o n
° 0
o ° o 0 0
o
IS
o o q9
1—.--1
• 0 o o E • o U) a o •- a ,....
CO 0 0
0 0.
tf) 0
cJ
••••■
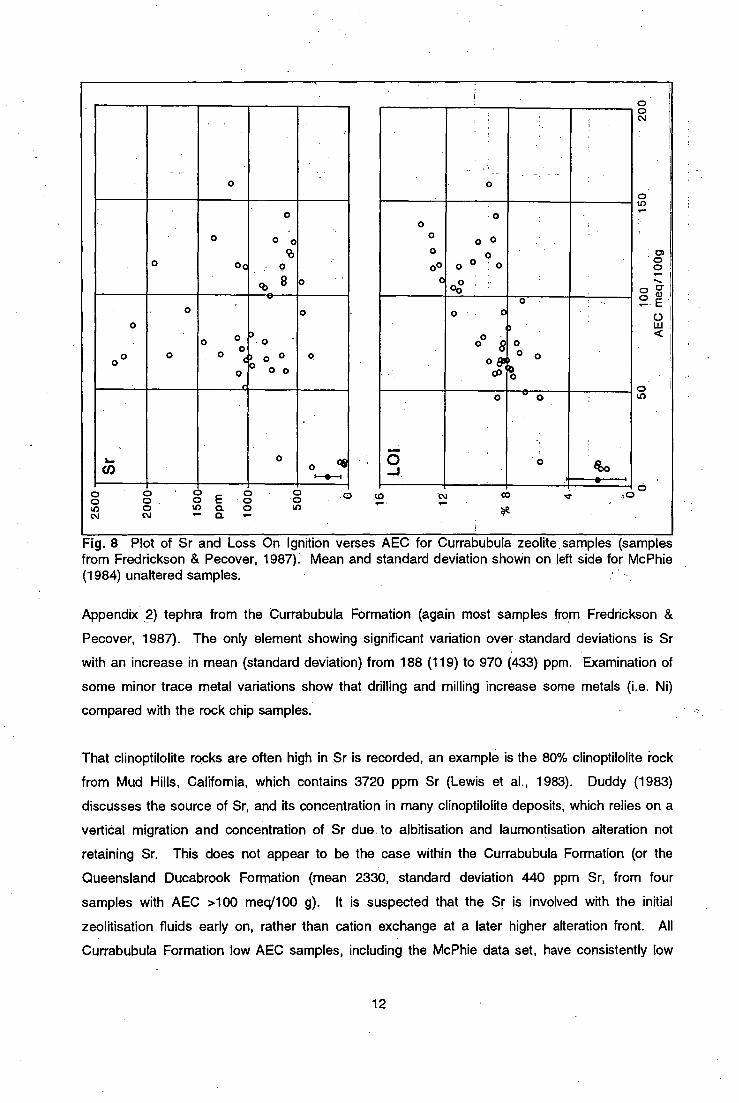
Fig. 8 Plot of Sr and Loss On Ignition verses AEC for Currabubula zeolite samples (samples from Fredrickson & Pecover, 1987). Mean and standard deviation shown on left side for McPhie (1984) unaltered samples.
Appendix 2) tephra from the Currabubula Formation (again most samples from Fredrickson &
Pecover, 1987). The only element showing significant variation over standard deviations is Sr
with an increase in mean (standard deviation) from 188 (119) to 970 (433) ppm. Examination of
some minor trace metal variations show that drilling and milling increase some metals (i.e. Ni)
compared with the rock chip samples.
That clinoptilolite rocks are often high in Sr is recorded, an example is the 80% clinoptilolite rock
from Mud Hills, California, which contains 3720 ppm Sr (Lewis et al., 1983). Duddy (1983)
discusses the source of Sr, and its concentration in many clinoptilolite deposits, which relies on a
vertical migration and concentration of Sr due to albitisation and laumontisation alteration not
retaining Sr. This does not appear to be the case within the Currabubula Formation (or the
Queensland Ducabrook Formation (mean 2330, standard deviation 440 ppm Sr, from four
samples with AEC >100 meq/100 g). It is suspected that the Sr is involved with the initial
zeolitisation fluids early on, rather than cation exchange at a later higher alteration front. All
Currabubula Formation low AEC samples, including the McPhie data set, have consistently low
12
(PPm) (PPm)
Ag <2 Lu 0.64
As 11 (1) Mn 222 (134)
Au <0.03 Mo <5
B <100 Nb 14 (4)
Ba 884 (642) Nd 37 (4)
Be 3.8 (2.9) Ni 2.3 (1.0)
Bi <2 Pb 20 (7)
Cd <5 Pr 11
Ce 77 (8) Rb 60 (26)
Cl <100 S <400
Co <2 Sb 3.9 (1.2)
Cr 3.1 (3.5) Sc 4.1 (1.1)
Cs 5.5 (0.8) Sm 8.85
Cu 6.1 (6.0) Sn 4.9 (2.5)
Dy 8.35 Sr 770 (267)
Er 5.21 Tb 1.23
Eu 1.50 Th 17 (3)
F 123 (57) Tm 0.71
Ga 14 (2) U 3(1.3)
Gd 8.75 V 11 (3)
Hf <3 V 46 (13)
Hg 0.02 (0.01) Yb 4.80
Ho 1.55 Zn 54 (17)
La 36 (5) Zr 212 (38)
Li 14 (2)
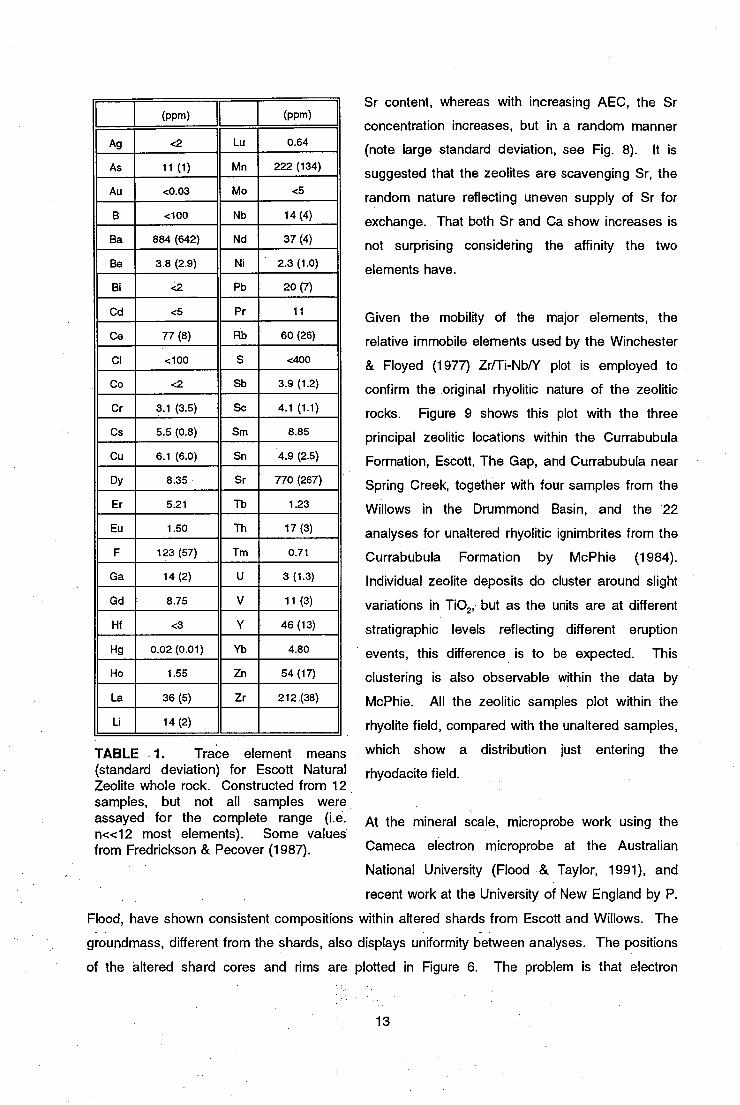
TABLE 1. Trace element means (standard deviation) for Escott Natural Zeolite whole rock. Constructed from 12 samples, but not all samples were assayed for the complete range (i.e. n«12 most elements). Some values from Fredrickson & Pecover (1987).
Sr content, whereas with increasing AEC, the Sr
concentration increases, but in a random manner
(note large standard deviation, see Fig. 8). It is
suggested that the zeolites are scavenging Sr, the
random nature reflecting uneven supply of Sr for
exchange. That both Sr and Ca show increases is
not surprising considering the affinity the two
elements have.
Given the mobility of the major elements, the
relative immobile elements used by the Winchester
& Floyed (1977) ZriTi-NbN plot is employed to
confirm the original rhyolitic nature of the zeolitic
rocks. Figure 9 shows this plot with the three
principal zeolitic locations within the Currabubula
Formation, Escott, The Gap, and Currabubula near
Spring Creek, together with four samples from the
Willows in the Drummond Basin, and the 22
analyses for unaltered rhyolitic ignimbrites from the
Currabubula Formation by McPhie (1984).
Individual zeolite deposits do cluster around slight
variations in Ti02 , but as the units are at different
stratigraphic levels reflecting different eruption
events, this difference is to be expected. This
clustering is also observable within the data by
McPhie. All the zeolitic samples plot within the
rhyolite field, compared with the unaltered samples,
which show a distribution just entering the
rhyodacite field.
At the mineral scale, microprobe work using the
Cameca electron microprobe at the Australian
National University (Flood & Taylor, 1991), and
recent work at the University of New England by P.
Flood, have shown consistent compositions within altered shards from Escott and Willows. The
groundmass, different from the shards, also displays uniformity between analyses. The positions
of the altered shard cores and rims are plotted in Figure 6. The problem is that electron
13

0•l
• •••
Basani Is
Nophs Units
Rhyedaelts
Daelts
AndssIts
•
Andasits / Basalt Alkali
Basalt
Sub — alkaline
• Basel}
0.01
Nb/Y
0.001 0.01 0•1
C com•nd II
Pants hints Phew:tilts
•
Rhyollto 0•• • .g %a
x t e e x 0
4+ te Ira ehyts
'Zr/Ti
microprobe analysis of zeolites can be difficult, mainly due to the ease with which structural
water, and sodium are boiled and lost by the electron beam (Birch, 1989). Indeed the
microprobe analysis of the shard core and rims from Escott and the Willow site all fall outside the
ratio criteria of [Al203+Fe203] : [Mg0+Ca0+Na20+K20] within 5 percent used by Surdam &
Sheppard (1978) to indicate acceptable analyses. These analyses also do not conform to the
charge balance error formula within 10 percent used by Birch (1978) for pure zeolite crystals.
Thus, these analyses are considered only generalised analyses, and deviations from the
idealised zeolite formulae caused by minor amounts of other minute minerals, together with the
inherent difficulties with microprobing of microscopic zeolites, is to be expected.
Fig. 9 ZrM-NbN plot of Currabubula Formation rhyolite ignimbrite (•, McPhie, 1984, n=22) compared with zeolitised samples from Escott (o, n=9), Sheedy site (A, n=2), The Gap (x, n=8), and Willows (+, Q1d., n=4).
Microprobe analysis confirms the back-scattered electron images (fig. 6 of Flood & Taylor, 1991)
which indicate that the potassium distribution is concentrated in the groundmass and the calcium
is preferentially localised in the zeolitic shards (core mean 4.80% Ca0), especially towards the
peripheral portions (rim mean 4.98% CaO).
Being able to exchange cations depending on the environmental potential without altering the
crystal structure makes zeolites useful, but difficult to characterise chemically. This is
14

compounded by the fact that whole rock analyses of ignimbritic rocks generally do not represent
primary magma composition due to volcanic fractionation by crystal concentration and pumice
mixing, together with contamination by lithics from the vent walls and the ground surface. Thus,
any interpretation of the zeolite bearing tephra chemistry must be made with these considerations
in mind.
AEC AND CEC DETERMINATIONS
The exchangeable cation content of a zeolite needs to be known as it often influences the final
determination of potential use. Indeed zeolites with high dominant exchangeable sodium should
not be used with plants that are very sensitive to salt. Another example is clinoptilolites with a
low potassium content, which seem to have high ammonium exchange capacity, making them
good for agricultural applications. While high potassium clinoptilolites have a low ammonium
exchange capacity, apparently because potassium is difficult to exchange out of clinoptilolite
(Sheppard, 1983; see also Minato et al., 1984).
The following are the in situ exchangeable cations, mean (Standard Deviation), for zeolitic
samples from Escott, the main unit at The Gap, and the minor zeolite unit B at The Gap:
Na : K : Ca : Mg Total
Escott (AEC>70, n=14) 10(8) 12(8) 64(7) 13(3) 100(10)
The Gap (AEC>70, n=9) 19(18) 14(12) 49(10) 6(2) 87(21)
The Gap Unit B (AEC>70, n=3) 44(6) 3(2) 42(20) 8(3) 96(21)
The above are the mean (standard deviation) meq/100 g of cations released from the natural
zeolite after exchange with ammonium acetate in the first part of the Standard AEC determination
(Fredrickson, 1986).
The mean values above are plotted on the (Ca+Mg)-Na-K tertiary plot (Fig. 6) and can be
compared with the whole rock and zeolite crystal cation ratios. The exchangeable cations
position on the (Ca+Mg)-Na side relative' to the respective whole rock assays confirm that
potassium is retained within the rock, probably in orthoclase crystals, and not exchanged. This
can be compared with the zeolite crystals (data only available from Escott) which shows
approximately equal Na and K are exchanged out, combined with a larger proportion of Ca+Mg.
15

600. C
Original. material_
XRD STUDIES
Early X-ray powder diffraction (XRD) studies on the samples from Escott showed the zeolite
became X-ray amorphous near 400°C, which was interpreted according to the paper by Mumpton
(1960), to imply heulandite. This, combined with the high divalent cation content, resulted in the
previously published papers on Escott mineralogy (Flood, 1R91; Flood & Taylor, 1991; Flood et
al., 1993). to specify heulandite.
500
ig 400 c,
300 2 a. 2 is! I- 200 0 la t- tli 1 00 x
Original
(Cu
B
IN
MIA
B- lip.
1111
IN
tis tarp-.
10 15 . 20
5 10 15 Ko4)
Fig. 10 Principal thermal X RD difference between Ca-clinoptilolite (A) and heulandite (B). Adapted from Minato & Namba, 1984.
Early this year further thermal XRF work was completed by H.
Minato (University of Tokyo), based on the study of Minato et
al. (1984). This requires subjecting a powdered sample to an
elevated temperature for 4 hours, followed by XRD. This is
repeated with duplicate samples and increasing temperatures,
generally in 100°C steps. The resulting curves show the
transition to B-type heulandite if heulandites are present (Fig.
10), and is considered diagnostic by Minato & Namba (1984).
The resultant XRD patterns are shown in Figure 11 for Escott.
Note the peak at 9.6 does not shift to the right on the 300°C
curve indicating no B-type Heulandite, and it finally diminishes
10 20
29 (Cu Ko-t)
30 40 .
Fig. 11 Different XRF patterns by heating powder sample from Escott. Analysis courtesy of Prof. Hideo Minato, University of Tokyo.
16

80 40 60
P (kPa) 20
0
-4
Temperature C 100 300 600 900
co Co
D.T.G. Curve
cn
-8 T.G. Curve
12
60
N2; H (NH )
50
CO2; H(N114) 40
20
CO2; original J o
Ne; original
near, and is just visible at 400°C, thus indicating the sample contains Ca-clinoptilolite. The main
peak at 22.4 as expected for Ca-clinoptilolite also becomes subdued by 400°C.
ADSORPTION MEASUREMENTS
The dehydration properties of zeolites are important in evaluating adsorbent applications.
Thermogravimetric (TG) and Differential Thermogravimetric (DTG) analysis have been completed
- on an Escott sample by H. Minato (unpublished data, Tokyo University). The resultant curves
(Fig. 12) resemble those provided by Gottardi & Galli (1985) for clinoptilolite, and does not show
the prominent sharp TDG peak at 280°C resulting from the inversion to heulandite B. The Escott
thermal curves show one continuous water loss from 50°C, but there are minor aberrations at
170°C and at 320°C reflecting the high calcium content of the clinoptilolite (Gottardi & Galli,
1985), and corresponds to thermal behaviour type 2.
Fig. 12 N2 and CO2 adsorption and thermogravimetric curves for Escott Natural Zeolite.
Provided also (Fig. 12) are CO 2 and N2 adsorption capacity curves for Escott Natural Zeolite.
They show, as expected by the study of Yucel & Culfaz (1988), greatly decreased capacity of the
Ca rich clinoptilolite, relative to the NH 4 exchanged form of clinoptilolite.
The adsorption of N2 is related to the surface area of the zeolite. Due to the compact nature of
the rock, (i.e. grain density virtually equals rock solid bulk density) the natural Ca form gave no
useful results. But after exchange with NH 4+, and subsequent deammoniation by heating to
17
-
—100 000
Elruker MSL— 400 spectrometer
Powdered samples at room temp.
Static 'H frequency 400 MHz
Field 9•4 Tesio
Sample numbers from Museum
of Victoria.
Iceland
(P.4 27802)
Escott , NSW
50000 100000 0 HERTZ
—50000
350°C, the adsorption increased dramatically, with an estimated area of 190 re/g (J. Papp & D.
Kallo, personal communication). This compares with an internal specific surface of 300 to 600
reg for Hungarian 'Hydrolite' clinoptilolite (unpublished data sheet by Hydro-Trade, Hungary).
SOLID STATE NMR
The nature of the water within the Escott Mine zeolite material was also investigated by solid
state Nuclear Magnetic Resonance (NMR) carried out by the CSIRO Division of Materials
Science and Technology (Clayton, Victoria). Following the investigation by Ward & McKague
Ref: Tetramethyl Shone (TMS)
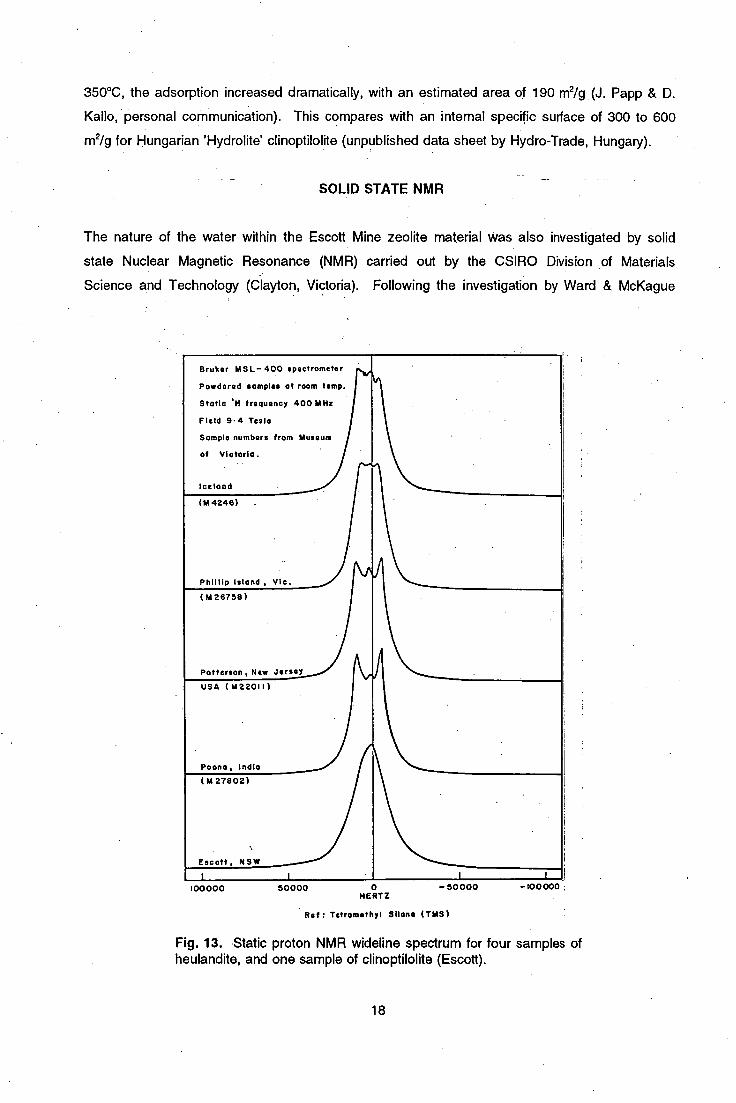
Fig. 13. Static proton NMR wideline spectrum for four samples of heulandite, and one sample of clinoptilolite (Escott).
18

(1993), heulandite at room temperature is expected to exhibit a classical Pake doublet pattern, in
contrast to a Gaussian shaped curve for clinoptilolite. The Gaussian curve is indicative of
randomly dispersed water molecules, whereas the Pake doublet pattern is indicative of more rigid
localised water (Pake, 1948). Thus the water in heulandite is more ordered than clinoptilolite,
until above 175°C when the transformation to Heulandite B (Boles, 1972) results in water similar
to clinoptilolite (Ward & McKague, 1993).
A sample of Escott regular powder (ground to -100 gm) with no pre-heating, was examined using
the CSIRO's Bruker MSL-400 solid state NMR spectrometer. The resultant curve (Fig. 13)
showed a near Gaussian distribution. As a comparison, samples of crystalline heulandite
obtained from Poona, India; Patterson, New Jersey; Phillip Island, Victoria, and unspecified
location from Iceland, were examined after powdering. As expected from Ward & McKague
(1993), the heulandite samples displayed a Pake doublet pattern indicative of hindered rotating
water.
All four heulandites, but more pronounced with the Paterson and Phillip Island samples,
displayed a third middle peak. This is possibly reflecting a portion (relative to the area under the
curve, about 5%) of the sample having more random hydroxyls. A possible further consideration
which still needs to be resolved is the effect of iron oxides and clays (Dr. T. Bastow, personal
communication), which are present in most zeolite bearing rocks (around 1% total Fe and 5%
clay minerals in Escott), compared to the relative pure crystal samples of heulandite tested.
This study seems to confirm the observation made by Ward & McKague (1993) regarding the
proton NMR static wideline spectrums for clinoptilolite and heulandite. This method has potential
to provide a cost effective (compared with thermal XRD) method of distinguishing the two
separate minerals. Further work using this technology could involve the study of the dehydration
of the zeolites providing information on the structural frameworks (as outlined by Ward &
McKague). Another avenue of study is to also test the zeolite structure after major cation
exchanges.
PHYSICAL PROPERTIES
One of the distinct differences between Australian Carboniferous zeolitic rocks, and most zeolitic
rocks mined overseas, is the physical appearance relating to its whole rock density and
hardness. The Brinell hardness test performed on a sample from Escott and The Gap both gave
approximate' measurements of 30. This is comparable with quartz cemented sandstone (ranges
19

15
0
1 2 3 4 6 7 8
1. Commercial pool sand filter. Clinoptilolite rocks from 2. Akvaro-Sorb, Hungarian, 3. Java Indonesian, 4. Escott, N.S.W., 5. Hector, U.S.A. & 6. New Mexico, U.S.A. Also synthetic 7. Linde AW-500 chabazite, & 8. Zeolon mordenite. Samples 5 to 8 from Mercer & Ames, 1978.
Fig. 14 Wet Attrition Test results for synthetic and natural zeolites, and for a normal pool filter sand.
25 to 40, ACS Laboratories Pty Ltd, 1993). In contrast a sample of white Indonesian zeolitic rock
from Java completely failed the test.
The results of density measurements are also just as different, as is illustrated with the following
density data:
Bulk Solid Density Apparent Crystal Density
Escott Mine Site 2.23 2.23
The Gap (G300) 2.32 2.33
Indonesian (Java) 1.41 2.20
The similar apparent grain density reflects the mineralogy of the sample. All samples are
composed of similar minerals with comparable densities, the Indonesian containing slightly less
amounts of denser quartz and feldspars gangue. The bulk rock density was determined from the
measured porosity (by Helium injection) and apparent crystal density (from porosity and volume
determined by mercury immersion). The closeness of the Werris Creek bulk and crystal densities
reflects the 'tight' interlocking nature of these samples, reflected in the high resistance to
deformation as tested by the Brinell hardness test. The solid rock density of the Java Indonesian
sample (typical of most Recent overseas zeolitic rocks) reflects the open nature of the constituent
crystal grains, but owing to weakly cemented grains fails the Brinell test.
Another physical property currently
being measured is the Wet Attrition
Test by Mercer & Ames (1978) which
evaluates the zeolites ability to
withstand repeated hydraulic lifting
during backwashing in zeolite
columns or beds. This test is
required by those evaluating zeolite
ion exchange columns. The results to
date indicate that Escott zeolite is far
superior in withstanding attrition
compared to overseas natural and
synthetic zeolites (Fig. 14).
Resistance to attrition is also important in turf applications.
20

ZEOLITE FORMATION
Zeolites can form in a wide range of geological environments including crystallisation from
hydrothermal fluids, contact or low grade burial regional metamorphism, alteration of volcanic
materials in closed saline-lake systems, alkaline soils, or open freshwater-lake or groundwater
systems, and deep marine settings. The exact mechanisms of formation are not well understood,
but zeolites in the sedimentary rocks probably formed by dissolution-reprecipitation reactions
(Mumpton, 1978).
The Ca-clinoptilolite within the Tamworth Belt and the Drummond Basin has all formed in
waterlain rhyolite tephra under non-marine, open hydrological conditions, in contrast to the closed
systems (Surdam, 1977) present in saline alkaline lakes like the current Central Australian lakes.
This is shown by the zeolitisation crossing lithological boundaries, both vertically and laterally.
Which units are altered is constrained by the amount and activation of silica available (i.e. the
lithic sandstones are only weakly zeolitic), or by sufficient initial porosity for water saturation (i.e.
the welded ignimbrite below the main Gap unit not zeolitised).
The expected vertical zonation for open systems (Hay, 1978) is not shown due to the relatively
thin units suitable for hydrolysis and solution of silicic glass to form zeolites, also the zeolitic units
are separated by relatively impervious units (welded ignimbrites). In comparison the vertical
zonation is observed over a 1.8 kilometre thick sequence of zeolitic Tertiary tuff at the Nevada
Test Site (Sheppard, 1973). The two previous published papers on the Escott mineralogy, Flood
(1991), and Flood & Taylor (1991), also discussed the formation within an open system.
There appears to be an imprint of burial metamorphism on the Tamworth Belt zeolite units, as
indicated by the prevalence of clinoptilolite and mordenite in the top of the sequence, and
laumontite content increase towards the base (New South Wales Dept. of Mineral Resources,
1986b)., Zeolite formation, in particular sediments containing volcanic debris, generally favour the
formation of clinoptilolite (Gottardi & Galli, 1985), and the clinoptilolite-heulandite group can be
formed at temperatures as low as 65°C in areas of silica saturation (Kristmannsdottir &
Tomasson, 1978). It is concluded that the zeolite formation within the Currabubula Formation
was by zeolite crystallisation at the expense of dissolving volcanic glass (Hay, 1978; Gottardi &
Galli, 1985) within a open hydrological system to begin with, and continued to develop as the
sediments were buried. Zeolitised units were dependent on silicic content, combined with
porosity and availability of water (the deposits all appear to be originally topographic lows).
. 21
tali a
21 • P.m samela Ills
•W36 OrIllItele
— — Collect Island
0 IAN
ESCOTT RESERVES AND MINING
The composite unit mined at Escott has a proven reserve based on drilling, costeaning, and
mapping of 132,000 tonnes, down to 15 metres depth, with minimum grade of 120 meg/100 g. --
There is a probable 50,000 additional tonnes along strike that have not been drill tested. The
units have been shown by the RC drilling to extend down at least to 30 metres, but this extra
depth is not being considered currently due to the excessive waste to ore ratio (2:1) required for
extraction. It is planned to complete a more detailed pit optimisation assessment to possibly
economically recover this deeper material. There is an extension along strike (Fig. 3) of the
zeolite units within the Mining Lease Application, but these have not been systematically tested to
date.
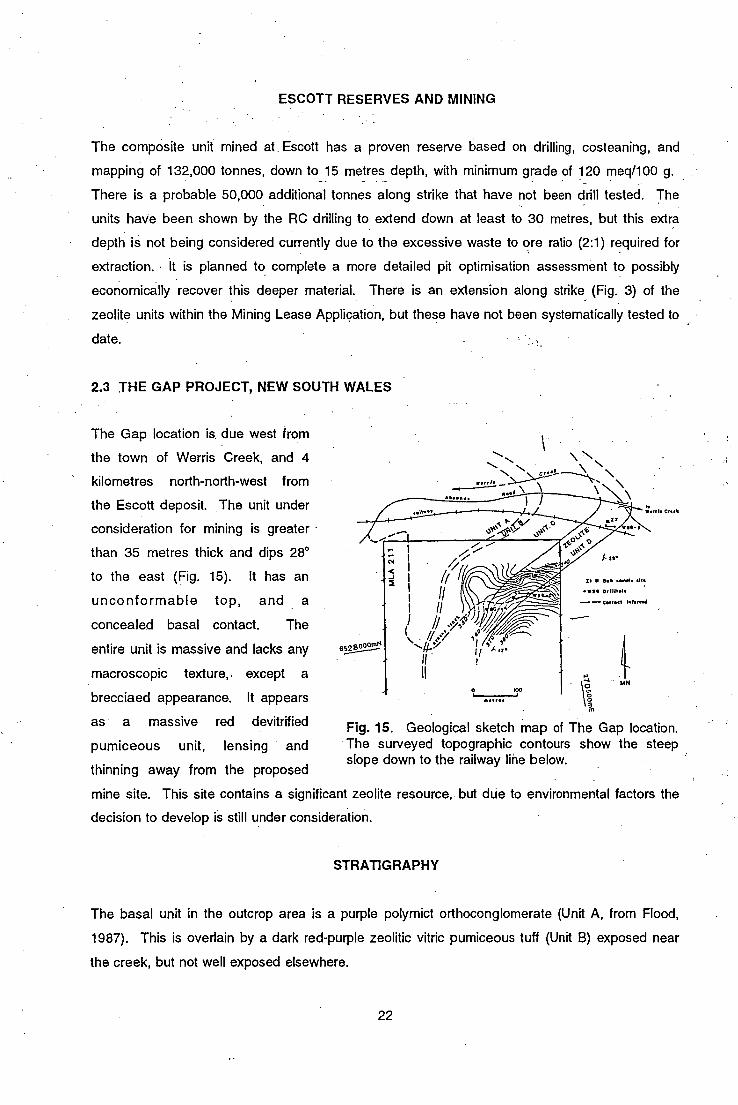
2.3 THE GAP PROJECT, NEW SOUTH WALES
The Gap location is due west from
the town of Werris Creek, and 4
kilometres north-north-west from
the Escott deposit. The unit under
consideration for mining is greater
than 35 metres thick and dips 28°
to the east (Fig. 15). It has an
unconformable top, and a
concealed basal contact. The
entire unit is massive and lacks any 6528000,-N
macroscopic texture,. except a 100
brecciaed appearance. It appears
as a massive red devitrified Fig. 15. Geological sketch map of The Gap location. pumiceous unit, lensing and
The surveyed topographic contours show the steep
thinning away from the proposed slope down to the railway line below.
mine site. This site contains a significant zeolite resource, but due to environmental factors the
decision to develop is still under consideration.
STRATIGRAPHY
The basal unit in the outcrop area is a purple polymict orthoconglomerate (Unit A, from Flood,
1987). This is overlain by a dark red-purple zeolitic vitric pumiceous tuff (Unit B) exposed near
the creek, but not well exposed elsewhere.
N N
I
to*
22

The next unit is a welded ignimbrite (Unit C) below the main zeolitic unit. It is about 15 metres
thick, pale pink to cream and composed of approximately 75 percent glass shards, 20 percent
phenocrysts, and 2 percent opaques. Most of the phenocrysts are extensively altered
plagioclase crystals showing major resorption and sericitisation. Smaller anhedral quartz grains
are present. Towards the top alteration is more intense, plagioclase is reduced to skeletal
grains, and the groundmass shows extensive fine grained sericite alteration. There are also
minor lithic fragments containing glass shard textures. It is not certain that this is one complete
unit, due to the lack of continuous outcrop. The groundmass does not show zeolite alteration as
confirmed by low AEC measurements (11 meq/100 g).
The main zeolite body, and that being examined for mining, is Unit D, about 35 metres thick. It is
a pink light red lithic vitric pumiceous mass flow deposit. Minerals present include angular
phenocrysts of plagioclase, albite and oligoclase, that are undergoing alteration to biotite and
sericitic micas. Orthoclase occurs as rounded euhedral crystals resulting from resorption. Clasts
of other pyroclastic rocks are present, often showing flow textures (Fig. 16) and containing
feldspars phenocrysts. Zeolite minerals are restricted to the matrix, specifically in the alteration
of the glass shards which are very abundant.
The geometry of the base is not visible due to scree, but the boundary is tentatively picked from
aerial photographs and ground mapping. The unit appears to be a lens shaped body, the
thickest part outcropping up the side of the hill.
Overlying the main zeolite unit is a distinctive light emerald-green coloured welded volcaniclastic
sandstone (Unit E, Fig. 16) about three metres thick, that is black when fresh. This unit contains
50-60 percent phenocrysts composed of older ignimbritic slice fragments, phenocrysts of
fragmented plagioclase, mainly andesine with altered cores and resorbed rims, sericite altered
orthoclase anhedral phenocrysts, minor biotite, in a matrix of fine grained chloritic minerals.
Celadonite has also been observed in the altered groundmass.
Overlying the green unit is a crystal rich ignimbrite dominated by plagioclase phenocrysts. This
in turn underlies a series of thinly bedded pale brown welded ignimbrites and volcaniclastic
sandstones. The welded glass shard matrix of the ignimbrites are slightly devitrified with minor
zeolite and clay minerals nucleating. This sequence then appears to be covered by typical
fluviatile conglomerates and sandstones of the Currabubula Formation.
23

-
-
Fig. 16 TOP: Thin section of sample from near the base of the main zeolite unit (D) at The Gap showing typical clast and shards. Scale bar 1 mm. BOTTOM: Samples across the sequence at The Gap.
24

Fig. 17 TOP: Sample (G260) from The Gap, near the top of unit D, showing glass shards. Scale bar 0.5 mm. BOTTOM: Enlargement of top photograph showing Ca-clinoptilolite crystals growing into, and replacing, the glass shards. Scale bar 0.1 mm.
25

RESERVES AND MINING
The recoverable reserves, based on the drilling and mapping, indicate that possibly 50,000
tonnes should be recoverable from The Gap Mining Lease Application. This is far less than the
250,000 tonnes indicated resource reported in 1987 (Pecover, 1987) due mainly to the difficulties
of mining without risking the railway line below the main exposure. Currently, different open pit
designs are being considered, and the decision to mine has not been finalised.
2.4 CURRABUBULA (SHEEDY) PROJECT, NEW SOTH WALES
The Currabubula Zeolite Project (also called Sheedy's or Kappmm area) deposit is located near
Spring Creek, west of the town of Currabubula. It was first isolated when rockchip samples
returned very high AEC values. Subsequent drilling (Cooper, 1992) confirmed the grade and
thickness of two units. The vitric, non-welded, zeolitic tuff units, up to five metres true thickness,
with at least five individual units, outcrop within a 750 metre thick sequence of terrestrial
conglomerates and sandstones. Due to thickness limitations, only two of these units are planned
for mining. The main unit is laterally continuous for over 3 kilometres and is overlain by
conglomerates. The units are near the northern end of the synclinal axis, on the west limb
dipping 30° east, striking north south.
The units are non-welded vitric ignimbrite showing 80 to 90 per cent groundmass with the
remaining crystal phenocrysts and occasional lithic fragments. The phenocrysts are homblende
and resorbed biotite as the major phase, followed by orthoclase and plagioclase sparsely in the
rock. In section the dominant feature is the glass shards occurring interstitially between the
phenocrysts. There is occasional zonation in which areas are richer in glass shards, together
with fine aggregates of plagioclase that may reflect blobs of crystallising flow. In a sample
collected further to the south, schistose clasts, together with sedimentary inherited quartz clasts
occur within bands (B. Mapanu, 1993, personal communication).
The units are enclosed within a sequence of pebble conglomerates grading upward into siltstone
and fine sandstones. These are interpreted to be fluvial grading up to lacustrine facies. There is
local minor lateral strike faults, which generally are preferred locations for current drainage.
SEM images have confirmed that the zeolite occurs as thin plate crystals of clinoptilolite showing
no preferred orientation. While the natural exchangeable cations have not been measured,
calcium, followed by potassium are the likely cations based on the whole rock chemistry
(Appendix 1).
26

RESERVES AND MINING
Following percussion drilling and surface mapping, the opencut reserves are 280,000 tonnes at
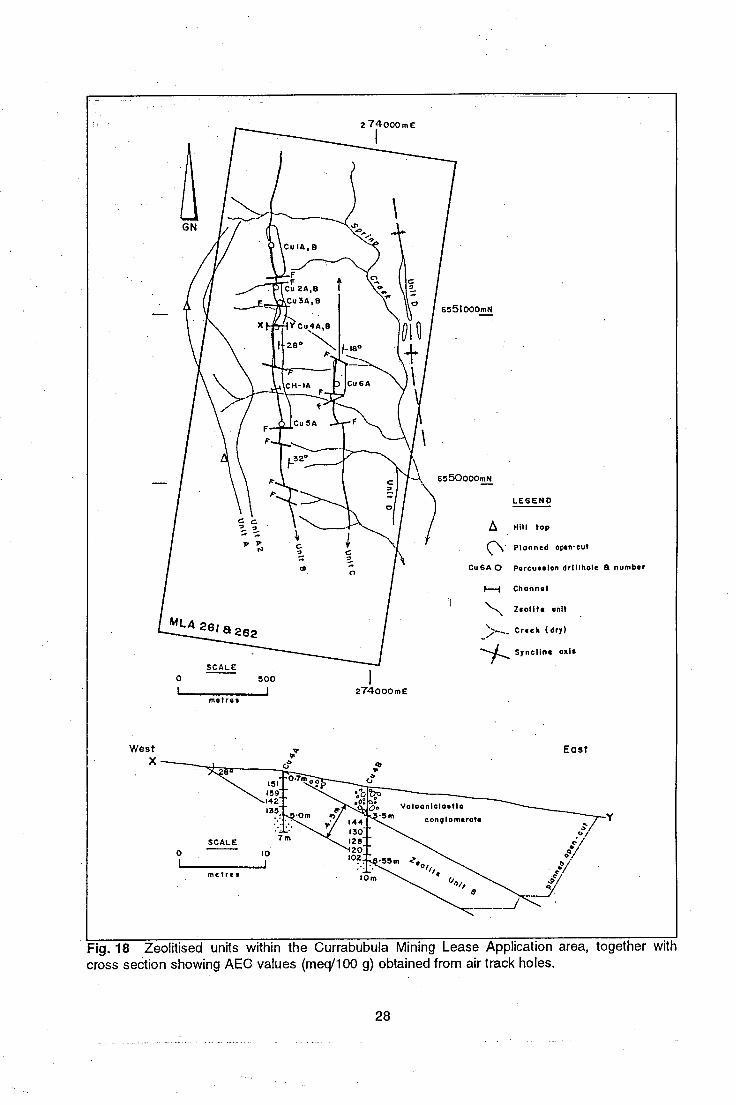
135 meq/100 g indicated, with another 250,000 tonnes inferred by surface mapping (Fig. 18).
This opencut tonnage would have a waste to ore ratio of 1.4:1 and a maximum depth of 13
metres. Given the market conditions, a single bench pit following the strike, with a lower waste
to ore ratio will be commissioned initially.
Some of the highest AECs in Australia with values of 146 meq/100 g over 4.3 metres have been
recorded from the main zeolite unit within the two adjacent Mining Lease Applications (MLA 261
& 262).
2.5 WILLOWS PROSPECT, QUEENSLAND
This potential zeolite mining area is within the Drummond Zeolite Province, in the area south
west of the township of Anakie. Incomplete reconnaissance has delineated several zeolite units
within the Ducabrook Formation which were known to contain numerous tuffs (Pinchin, 1978).
This Formation is near the top of the Drummond Basin sequence. Outcrop is restricted to creek
and road cuttings, due to overlying gravels (mined locally for sapphire) and very shallow dips.
Problems with lack of outcrop result in correlation difficulties.
The area is within the Scholfield Syncline, with a gentle fold axis running northeast, plunging to
the south. Generally the altered tuff and tephra are relative flat lying units interbedded with
felspathic-lithic sandstones and green mudstones of the Ducabrook Formation (Harms, 1990)
representing fluvial and lacustrine environments. Plots of Zr/Ti-NbN (Fig. 9) confirms the rhyolitic
nature of the original rock source. While generally the zeolite units are red to pink, at least one
unit is white in colour. Detail on the individual units is restricted to very preliminary descriptions
provided by Harms (1990) who has conducted reconnaissance mapping and sampling. Figure
19 shows one typical location, along the Highway, where the 2.4 metres true thick composite unit
returned AEC of 91 meq/100 g (sample QZ40). This site shows the lack of prominent outcrop for
these units, and would not have been visible without the road cutting.
• Recent thin section examinations and microprobe analysis (sample W2) by P. Flood (personal
communication) on samples from the Willows area showed similarity to Escott in that they are
generally either fine-grained, red to pink pyroclastic or laminated silicic mudstones and siltstones.
The units show well preserved vitroclastic texture and the glass shards are now altered to Ca-
clinoptilolite. Early XRD and SEM work by Zeolite Australia confirmed the zeolite mineralogy as
27
0 500
LEGEND
A Hill top
(–\\ Planned open-cut
Cu 6A 0 Percussion drIllhole a number
l—f Channel
\--N Zeolite unit
Creek (Cry)
-"J... Syncline axis
SCALE
274000mE metres
West X
151 159 142 135
•
SCALE
10
metre $
East
t70
Volcaniolostla 5m conglomerate
10m
144 130 128 20
102
7m
Fig. 18 Zeolitised units within the Currabubula Mining Lease Application area, together with cross section showing AEC values (meq/100 g) obtained from air track holes.
28

Fig. 19 Example of pink zeolitic unit, 2.4 meters thick, exposed along the Capricorn Highway, west of Willows Gemfield turn off. Internal bedding structure is visible (photo from Harms, 1990).
consisting of platey crystals of similar habit to Escott. While CEC has not been determined, from
the whole rock analysis it can be expected that the Drummond Basin clinoptilolites are Ca based.
This has been confirmed by P. Flood, as his work shows the Drummond Basin samples become
amorphous above 400 °C as expected for Ca-clinoptilolite. Microprobe work shows the
Drummond Basin shards are similar to Escott, with the altered shards richer in calcium than the
groundmass, but here they also show more potassium. Whole rock chemistry, together with the
microprobe analysis are provided in Appendix 4 and 5.
RESERVES AND ECONOMIC POTENTIAL
The AEC values to date, confirmed by petrological and chemical analysis, suggest that the
zeolitic beds are suitable chemically for development. Further work requires drilling and
delineation of the reserves before the economic potential can be given with confidence. The
area is close to a major highway, and railway line which head towards the large horticultural area
of central coastal Queensland. This economic factor will determine, once geological
considerations have been met, whether development will continue.
29
3. EXPLORATION AND MINING
Economic exploitation of zeolites in Australia is currently active only in New South Wales, with
mining occurring at one site, and proposed at a further two sites.
3.1 AUSTRALIAN ZEOLITE EXPLORATION HISTORY
Bramlette & Posnjak (1933) over sixty years ago observed that clinoptilolite is a very common
and intense alteration products of pyroclastics in a study of Californian Miocene pyroclastics.
Scientific reports on Australian authigenic zeolites commenced with Coombs (1958) reporting the
complete zeolitisation of tuffs near Seaham, N.S.W. The occurrence of zeolitic pyroclastic tuffs
within the Currabubula Formation was noted by Wilkinson & Whetten (1964), with Whetten
(1965) further recording the extensive development of zeolites, including analcime, heulandite,
clinoptilolite, and laumonite within the tuffs and volcaniclastic rocks from the Werrie Basin. This
was followed by Loughnan (1966) with the report of up to 35 percent analcite within thin (15 cm),
silica rich tuffaceous units in the Permian Newcastle Coal Measures. At the same time McKelvey
(1966) in his Ph.D. thesis thoroughly documented both clinoptilolite and laumontite within a 2000
metre stratigraphic section of the Rocky Creek Syncline, outlining both diagenetic and burial
zeolitisation.
In 1973, MacNevin completed probably the first economic review of known Australian zeolite
occurrences, with brief descriptions of zeolitic rich rocks in New South Wales. An early attempt
at obtaining an economic resource of Australian zeolites was made by beneficiation of zeolites
from basalt breccia voids in Tasmania, but this was abandoned due to the perceived prohibitive
cost of crushing and processing (Askins, 1980).
The belt extending from Tamworth to Newcastle was considered to contain significant
occurrences of natural zeolites (Holmes, Lismund, & Oaks, 1982), and considerable potential was
given for discovery of an economic deposit according to the State Government Geological
Survey. Following up on this opinion, the N.S.W. Department of Mineral Resources commenced
the Zeolite Project in 1985. By the end of 1987, the Department had sampled and investigated
extensively across eastern New South Wales and had confirmed the existence of potentially
economic reserves of natural zeolite. In conjunction, research students from the University of
New England also assisted in delineating potential zeolite outcrops, primarily around the northern
Tamworth Belt.
30

An important phase of company exploration followed the Zeolite Project initiated by the N.S.W.
Department of Mineral resources with exploration companies actively searching for authigenic
sedimentary zeolite deposits. Exploration Licences were granted to JM Stephen Pty Ltd in early
1987 over large delineated areas. In late 1987 a Joint Venture agreement was drawn up
between JM Stephen and Mount Gipps Limited, a public mining company, to develop the zeolite
Licences. In December 1987, zeolite mining began, followed in middle 1988 with the first
commercial sales by the Joint Venture of Escott Natural Zeolite.
The Department of Mineral Resources Zeolite Project concluded with the issue of an Information
Package for Exploration and Development of Natural Zeolite (Holmes & Pecover, 1987) and the
Proceedings of a Seminar on Zeolites in New South Wales (NSW Department of Mineral
Resources, 1987) designed to initiate commercial interest in exploration and mining for natural
zeolites.
Other companies also followed the initiative in NSW and conducted exploration, but most have
fallen by the way due to either lack of suitable material, lack of institutional funding support, or
lack of experience with marketing zeolites. Many were small companies which quickly obtained
areas with outcropping zeolitic rocks, but then became disillusioned when no markets suddenly
appeared for their product. An example is International Mining Corporation NL which drilled and
collected small bulk samples (Hawley, 1991) and even publicly reported large tonnages (Roskill
Information Services Ltd, 1990), but finally abandoned the area due to reported lack of market
development. Later review has also shown that the 'tonnage' was inferred and not amenable to
low cost mining and thus the deposit would not have lived up to the market's perception.
Currently in Australia, only one company, Zeolite Australia Limited, is producing zeolite from a
small single open cut mine (Escott). A handful of other companies still hold title over ground
prospective for zeolites, including Centenary International Mining Ltd and Commercial Minerals
Limited.
3.2 EXPLORATION TECHNIQUES AND RATIONALE
Zeolite exploration in Australia began when the N.S.W. Department of Mineral Resources
commenced their Zeolite Project aimed at investigating and encouraging the development of
zeolite mining within the State. Following literature reviews, the Department conducted a wide
ranging rock chip sampling program over any known or potential areas based on regional
mapping. Close to one thousand samples were collected and examined, but the most useful
31

information has been the development of standard laboratory techniques and characterisation of
the Australian zeolite rocks recovered. This included comparing these same laboratory
techniques on overseas zeolite samples.
This time consuming and expensive laboratory work would have been extremely difficult for a
mining company to undertake as it needed to be completed, even before a economic site could
be proven to exist in Australia. The N.S.W. Department must be commended for providing such
incentive to private mining companies.
3.3 FIELD METHODS
It is recognised that subduction related (as can be seen from the Winchester & Floyd plot)
volcanic arcs on continental margins are required, and as outlined by Flood (1991), the flanks
adjacent to these ignimbritic centres form the most prospective zone for zeolite exploration.
Within this zone large lacustrine, or water saturated environments containing silicic'tephra are
prime sites for inspection.
Initial exploration indicated that significant zeolitic mineralisation is constrained to tephra
lithologies. Features considered useful as an indicator of suitable volcaniclastic beds included
the following field descriptions;
1. Persistent outcrop along strike, reflecting the strong cementation of the zeolitised
units,
2. Little vegetation other than lichens growing over outcrop.
3. Conchoidal fracture, easily shattering and breaking with sharp edges,
4. Vitric lustre.
5. Red to pinkish colour, not always present and may be green. In Queensland a
white zeolite bed has been sampled.
Not all of these features are visible in any one outcrop.
While field testing kits for zeolite exploration have been advocated (e.g. Hellferich, 1964; NSW
Department of , Mineral Resource, 1986a), these have not been utilised mainly due to the
problems in organising the necessary chemicals. This opinion was also expressed with "... it is
better suited to the laboratory than the field" by Sheppard (1973, page 692).
Generally rockchip or' channel samples are collected during reconnaissance mapping. The first
test is to determine the Standard AEC. If this is positive (>70 meq/100g) then the sample is
petrologically and XRD examined, and if the presence of zeolites is confirmed, then whole rock
32

assay may be completed. Generally with this information, a site can be considered potential, and
worthy of more detailed mapping, sampling, and depending on continuing positive results, RAB
drilling to confirm thickness and vertical grade. RAB drilling has proved effective and cheap.
While tonnage is not a problem with massive zeolite deposits, the availability of close markets, or
competitive freight is more influential in deciding if a site can be developed.
The cost per sample for Ammonium Exchange Capacity is approximately $30/sample, minimum
six samples per batch. The determination of exchangeable cations is more expensive. But for a
first pass approximation it is possible to determine the amount of individual cations exchanged
from the natural state by comparing the whole rock geochemistry of the sample. Using the AEC
as a measure of the total potential exchange, then the ratio can be determined from the whole
rock assay.
3.4 MINING AND PRODUCTION
Fig. 20 Looking south, along strike, into the Escott Zeolite Mine, Werris Creek. Photograph taken February 1993 when pit was approximately 50 metres long.
National zeolite mining in Australia is restricted to the Escott Zeolite Mine (Fig. 20), 5.5 kilometres
south west of the rural township of Werris Creek. The zeolite is currently mined on a regular
basis from the Escott site by conventional open cut methods (Marx et al., 1993). All mining and
33

transportation from Escott mine site to processing facilities has been by local contractors as
required. Airtrack drilling and blasting using nitropril and electric detonators is used to blast up to
1500 tonne shots.
Grade control is conducted using face channel sampling, together with the results of the detailed
exploration drilling. As the zeolite units mined can be visibly distinguished, the sampling serves
to confirm overall grade. Lower grade but still zeolitic units occur in the hanging and footwalls.
The broken ore is loaded by excavator onto trucks which carry it some 240 kilometres south to
Mudgee on a campaign basis, where it is crushed and screened to produce various sizing's.
Other processing plants in Melbourne, Newcastle, and Sydney, have also been utilised when
necessary. During 1993 a screening plant was installed by Zeolite Australia to offer the company
greater ability to economically produce new sizing's for market development.
The raw run-of-mine material is crushed in a primary jaw crusher to yield minus 50 mm product,
followed by a secondary gyratory crusher producing minus 6 mm chips. This is the feed for the
screening plant, or if powder is required, it is fed into a Bradley, vertical-shaft roller-mill. Storage
space at the custom milling operation is limited to approximately 100 tonnes with a further 50
tonne warehouse in Melbourne.
Current operations produce zeolite in the sizes -6.0+2.0 mm; -2+0.5 mm; -1.0 mm; -1.0+0.25
mm; minus 100 gm and minus 50 jam. These sizing's are in line with market requirements and
are available in bulk, 1 tonne bulker bags, 40 kg and 20 kg plastic coated woven polypropylene
bags and 20 kg double walled paper sacks on pallets. A range of retail packs are also available
as 2 kg, 5 kg and 10 kg plastic bags. These products are different from those listed in Flood et
al. (1993) and reflect the continuing adjustment of product specifications to meet market
requirements. To date two grades have also been produced, the regular grade collected across
strike, together with selective mining of premium grade material to meet individual clients
requirements for a higher grade material.
All movements of zeolite material, whether internal transfers (mine to mill, mill to store etc), sales,
or free of charge samples, are currently all databased using an in house developed program
running under Microsoft Access. Due to the wide product range (sizing x package) and
extensive range of market and clients, this program was required to keep track of sales and
provide marketing information for categories based on zeolite application. The program also
produces invoices, stock control statements, production statistics, and the statutory reports
required by the Department of Mineral Resources.
34

Many of the smaller orders are of a trial or experimental nature resulting in frequent requests for
different specifications. This results in difficulty in planning the upcoming production, often
resulting in more expensive shorter production runs for many products. Accurate forecasting is
essential in providing a "just in time" production system. New business from the expansion of
markets also poses problems in this area as little notice is often given. This unavoidable
inefficiency in production is similar to the problems faced by American Resources Corporation's
zeolite deposit at Ash Meadows, California (Shelton, 1993).
GRADE CONTROL MEASURE
Grade or the measure of usefulness of zeolites is usually determined by the Cation Exchange
Capacity (CEC) quoted in milliequivalents per 100 grams (meq/100 g). An equivalent is a
measure of the relative ion concentration, and is the weight concentration divided by the
equivalent weight (atomic weight divided by the valency) for that cation. The CEC is a measure
of the number of cations per weight, or volume, available for exchange. Ammonium Exchange
Capacity (AEC) is an approximation of CEC using ammonium as the measured exchanged
cation. Unfortunately CEC is inherently difficult to replicate with natural zeolites, and this is
compounded by lack of an Australian or International Standard for zeolite analysis. Numerous
publications exist detailing the determination of CEC in zeolites including Busenbury and
Clemency (1970), Mercer & Ames (1978), Noda (1979), Mian & Hilchie (1982), Semmens (1984),
Ming & Dixon (1987), Lieu et al., (1988), Fredrickson & Dowswell (1988), Ming et al., (1991);
together with many more dealing with CEC determination of soils.
The method adopted by Zeolite Australia Limited for measuring CEC and AEC is the batch
method (described herein as the 'Standard' method) developed by the NSW Department of
Mineral Resources (Fredrickson, 1986). While batch methods are not as effective as column
methods for cation exchanges (Semmens, 1984), the Standard technique has been
demonstrated to produce reproducible results from a wide range of physically different natural
zeolites (Fredrickson & Dowswell, 1988) and confirms that strict control of sample preparation
and exchange capacity test conditions is essential for precise and reproducible results.
Properties that influence the CEC and AEC readings include temperature (ions diffusion
increases with temperature), particular saturation cations used (ion size, valency and hydration
energy are important), cation concentration, exchange time (time is needed for ions to physically
diffuse into the crystals), particle size (smaller particles have larger surface area and shorter —
diffusion paths), particular releasing cations used (related to selectivity coefficient of saturation
cation), cation release and washing technique, and any previous pre-treatments (heating, acid
35

washing, etc.). Figure 21 shows the differences caused by altering some variables on the
Standard AEC of Fredrickson (1986). These variables lead to potential differences in exchange
capacity determinations. A further example is soil CEC tests, with exchange times of only a
couple hours, compared with the equilibration time for the zeolite analcime which can be as long
as three days (Ames, 1966)
The Standard procedure provides an AEC, and if necessary can provide CEC of individual
cations released. The procedure involves replacing the current exchangeable cations with NH 4
by treatment with 1M NH40Ac for 18 hours, washing excess surface ammonium away, then
replacing the exchanged NH4 by treatment with 1M KCI for about 18 hours. The amount of NH 4+
released is determined using an ion selective electrode, and the AEC calculated for the amount
released by the 1 gram zeolite sample. The procedure takes three days, but batches of 24
samples are run concurrently, and is considered reasonably quick (Fredrickson & Dowswell,
1988). The cost per sample is approximately $30. The repeatability of AEC in high grade (>100)
results is better than 8 meq/100 g, with precision decreasing as AEC increases.
If the exchangeable cations are required, the solution obtained from the initial NH 40Ac exchange
is kept, and analysed for major cations. The sum of the cations released is equated to the CEC.
If the CEO is higher than the measured AEC, then it is probably due to dissolving of salts (i.e.
NaCI) raising the amount of measured cations released. Usually it is lower indicating that other
cations not measured, usually Sr and Ba, are exchanged. The high presence of soluble salts is
easily indicated by high conductivity and should be a regular test during initial exploration. The
full CEC test is not done routinely due to cost, and the fact that whole rock analysis can provide
a guide.
The AEC and CEC measured are not total cation exchange capacity, as is shown by the
increases by heating etc, but will provide a close form of effective cation exchange capacity that
enable comparison of relative exchange potential between zeolite samples. Most CEO tests are
relative, and unless the similar techniques are employed by other laboratories, the CEO or AEC
can not be compared closely. It is encouraged that zeolite application studies do at least one
determination using the Standard test as outlined by Fredrickson (1986), combined with the
effective (simulating the conditions to be encountered in practice, i.e. particle size, solutions etc.)
CEC. This allows other researchers to determine whether the zeolite is comparable.
36

Fig. 21 Some of the factors that influence AEC determination values using Standard technique of Fredrickson, 1986. For comparison, significant AEC is considered over 70 meq/100 g, Australian minimum mine grade 120 meq/100 g.
37
60 TO 60 0 5 10 '15 20
Hours (Note only 1; wash, not standard 3 washes)
50
Temp. ° C
10 20 30 40
RELEASING CATION AMMONIUM CONCENTRATION
2.5 0.5 1.5 2
NH4 OAc Concentration (M)
TEMPERATURE OF TEST
PARTICLE SIZE NOTE
1. 'Standard' is batch method by Fredrickson, 1986 (GS1986/228).
2. AEC data from Fredrickson & Dowswell (1988).
3. Sample is from The Gap, Werris Creek, /LSI. (No. ZP261).
4-
Standard (-0.045mm)
10 0.1
Size (mm)
0.01 0.001
ISO
140
1:111 0 120
'a 100
0 so Ui
60
40
TIME 160
140
0
▪
•
120 0
60
40
Acid • Ca No
NH 4 releasing cation
160
140
. o 0 120 0
ow 80
60
40
Standard ( x+) -
Standard (21 ° C)
• •; Standard ) ( 18 hours)
Standard ( I M
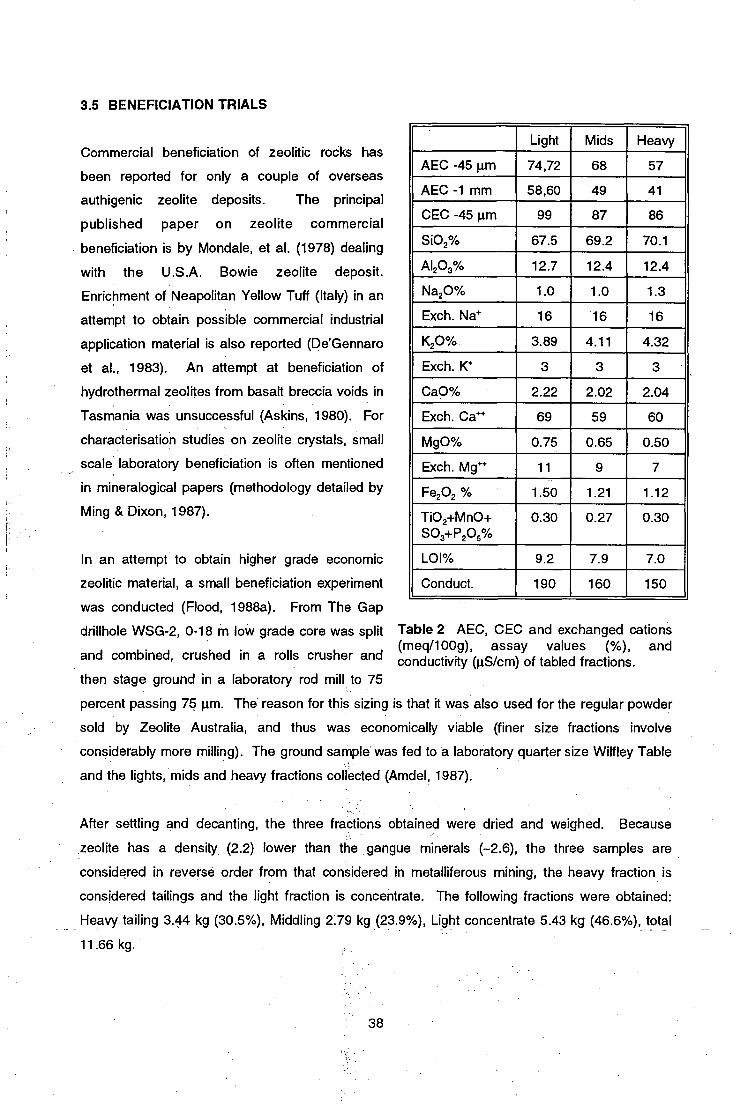
3.5 BENEFICIATION TRIALS
Commercial beneficiation of zeolitic rocks has
been reported for only a couple of overseas
authigenic zeolite deposits. The principal
published paper on zeolite commercial
beneficiation is by Mondale, et al. (1978) dealing
with the U.S.A. Bowie zeolite deposit.
Enrichment of Neapolitan Yellow Tuff (Italy) in an
attempt to obtain possible commercial industrial
application material is also reported (De'Gennaro
et al., 1983). An attempt at beneficiation of
hydrothermal zeolites from basalt breccia voids in
Tasmania was unsuccessful (Askins, 1980). For
characterisation studies on zeolite crystals, small
scale laboratory beneficiation is often mentioned
in mineralogical papers (methodology detailed by
Ming & Dixon, 1987).
In an attempt to obtain higher grade economic
zeolitic material, a small beneficiation experiment
was conducted (Flood, 1988a). From The Gap
drillhole WSG-2, 0-18 m low grade core was split
and combined, crushed in a rolls crusher and
then stage ground in a laboratory rod mill to 75
Light Mids Heavy
AEC -45 pm 74,72 68 57
AEC -1 mm 58,60 49 41
CEC -45 p.m 99 87 86
Si02% 67.5 69.2 70.1
Al203% 12.7 12.4 12.4
Na20% 1.0 1.0 1.3
Exch. Na+ 16 16 16
K20% 3.89 4.11 4.32
Exch. IC 3 3
CaO% 2.22 2.02 2.04
Exch. Ca++ 69 59 60
Mg0% 0.75 0.65 0.50
Exch. Mg++ 11 9 7
Fe202 % 1.50 1.21 1.12
Ti02+Mn0+ S03-FP205%
0.30 0.27 0.30
L01% 9.2 7.9 7.0
Conduct. 190 160 150
Table 2 AEC, CEO and exchanged cations (meq/100g), assay values (%), and conductivity (pS/cm) of tabled fractions.
percent passing 75 pm. The reason for this sizing is that it was also used for the regular powder
sold by Zeolite Australia, and thus was economically viable (finer size fractions involve
considerably more milling). The ground sample was fed to a laboratory quarter size Wilfley Table
and the lights, mids and heavy fractions collected (Amdel, 1987).
After settling and decanting, the three fractions obtained were dried and weighed. Because
• zeolite has a density (2.2) lower than the gangue minerals (-2.6), the three samples are
considered in reverse order from that considered in metalliferous mining, the heavy fraction is
considered tailings and the light fraction is concentrate. The following fractions were obtained:
Heavy tailing 3.44 kg (30.5%), Middling 219 kg (23.9%), Light concentrate 5.43 kg (46.6%),_ total
11.66 kg.
38
The NSW Department of Mineral Resource obtained the Standard AEC and the CEC
measurements (Fredrickson, et al., 1988, the Lights second AEC values were duplicate samples,
L87/1042, L87/1043, Fredrickson, 1987). The higher CEC compared with AEC is correlated with
the higher Conductivity, indicating dissolved salts were present.
The whole rock analysis shows the concentrate (lights) is depleted in Si02 (by 2.6%), and K20
(by 0.43%) and enriched in MgO (by 0.25%), Ca0 (by 0.18%), and higher LOI (by 2.2%),
compared to the tailings (heavy). This is to be expected with a small increase in zeolite content.
The AEC shows 22 percent difference between the tailings and the concentrate (-45 gm
material). While this appears successful, for commercial separation and concentration, a sizing
approximately of over 0.25 mm material would have to be used based on Taggart's expression
(Millard, 1993). Thus work to date has shown that gravity separation is possible, but more work
on practical sizings (for concentration equipment) needs to be completed.
4. MARKET AND PRODUCT DEVELOPMENT
Market development starts with the products to be provided. Zeolites can be used as
absorbents, ion-exchangers, and catalysts, and the full potential utilisation has yet to be fully
appreciated. Natural authigenic zeolite products have mineral impurities, differing zeolite
contents, diverse zeolites species, variable mineral SVAI ratios, and inconsistent cation contents,
compared to their very expensive synthetic counterparts.
But mineral impurities can act as binders ensuring mechanical strength (Kallo et al., 1982),
zeolite species together with SVAI ratio generally do not significantly change within a given area,
and cation composition can easily be modified by simple ion-exchange. This results in the need
to treat each potential mine site as a separate product, based on detailed characterisation. From
this, different sizings, packaging, ion-exchanges, and other pre treatments generate a whole
range of marketable products.
4.1 ZEOLITE APPLICATIONS AND MARKETS
World wide natural zeolite production is estimated at 300,000 tonnes/year (Roskill Information
Services Ltd, 1990), with 80-90 percent going into building/construction industry (used as local
building stones), agriculture and paper manufacture (used as a filler). The remainder is
consumed in the higher value industrial applications, including ceramics, oxygen generation
39

AGRICULTURE 1 Animal Husbandry: Improves feed conversion in many intensively reared animals; reduces toxic effects of cheap
sources of nitrogen in feed (e.g. urea). Reduces incidence of intestinal problems in pigs; improves well-being and egg output in chickens. Reduces malodour in animal sheds; results in drier, more valuable manure.
Agriculture Chemicals: Anti-caking and desiccant use. Helps preserve bagged feed. Acts as slow release carrier for pesticide and chemicals.
1 Horticulture: Improves cation exchange capacity of sandy soils. Acts as slow release medium for cationic nutrients. Reduces need for nitrogenous fertilisers by reducing rate of bacterial nitrification. Active, stable bed for nutrient and moisture control in hydroponics and in potting mixtures. Use as heavy metal trap in association with sewage sludge addition to soils. Addition to composting organic matter helps retain valuable ammonia.
AQUACULTURE ▪ Removes ammonium ions from water in recycle scrubbers, or if added to water or fish food. Use as aquarium
gravel. Low cost oxygen generator for pond reoxygenatation and aeration. BUILDING INDUSTRY O Dimension stone or pozolan. Pathway aggregate'. Light weight, acid resistant bricks. CHEMICAL INDUSTRY
Gas separation and purification. Extensive use (mainly synthetic zeolites) in petroleum and petrochemical industry for catalytic processes including Hydrogenation and Dehydrogenations, Hydrodealkylation, Methanation, Shape-selective reforming, Dehydration of gases and organic liquids, Organic catalysis; the following inorganic reactions, H 2S Oxidation, NH, Reduction of NO, CO oxidation, H 2O dissociation; also hydrocarbon conversion by Alkylation, Cracking, Hydrocracking and lsomerization.
DETERGENT INDUSTRY Added to powder detergents to displace phosphates for water softening.
DOMESTIC USES j Used as domestic pet litter to absorb moisture and odours. Odour absorbents for refrigerators, shoes, etc.
Beverage carbonation. Incorporated around car widows to suppress misting. ENERGY TECHNOLOGY
Alternative Fuels: Expanding use of new synthetic, high-silica zeolites for catalytic conversion of simple organic chemicals (e.g. methanol) to high octane fuels.
Gas supply: Clean gases from garbage dumps etc to supply methane fuel. Solar Power: Convert solar. energy into thermal energy by hydration-dehydration, use as heat storage medium
for solar heating or cooling. FOOD INDUSTRY ▪ Filter aid for purifying and clarifying (e.g. wine or sugar solutions). In plastic wraps improves shelf life of fruit
and vegetables. MANUFACTURING INDUSTRY ,
Filler in paper' and reactive absorbent/filler in many plastic and rubber goods. Storage of H,, CH,, argon and krypton for welding rods, etc. Solid state batteries and conducting paper. Pressure swing process for low capital cost oxygen or nitrogen generation. Feed material for ceramics manufacture.
MEDICAL APPUCATIONS j Polishing agent in fluoride containing toothpaste, in kidney dialysis systems to separate arnmoniacal nitrogen from haemodialysis liquids.
POLLUTION CONTROL O Water Treatment: Ammonium removal from agricultural liquid effluents and from treated sewage water.
Radioactive Cs and Sr removal from nuclear waste waters. Heavy metal removal from mining and metallurgical wastes and garbage dump effluents. Absorbent for oil and grease spills. Useful in softening of water.
Gas "Clean Up": Removal of water and simple polar pollutant gases from stack gases and gases evolved from garbage dumps. As moisture absorbent in some car exhaust systems.
O Flame Extinguishers: Can release H 2O, CO, or organic halides, high cooling effect, forms smothering glass on pyrophoric metals.
WEATHER MODIFICATION Crystallisation nuclei for Water and water Vapour, possibly for seeding clouds.
• Use may not necessarily depend on the presence of zeolite in the host rock, but rather on the physical nature (availability, density, colour, Porosity) of the host rock.
Table 3. Applications of zeolites. f indicates commercial sale in Australia established, e indicates trials started and waiting for acceptance.
plants, solar heating/cooling, catalysts, sewerage water cleaning, radioactive waste control etc.
40

Figure 22 SEM picture of Escott ultrafine powder (<50 pm), note subangular to subrounded blocky particle shapes. Scale bar = 0.1 mm.
Table 3 presents the numerous and diverse current and proposed markets for zeolites, both
synthetic and natural. Also shown are those where Australian natural zeolites are currently
undergoing trial, together with those where commercial sales are already established. The
papers by Mumpton (1978) and by Breck (1980) provide a comprehensive review of possible
applications.
There is no controlled or organised market for zeolites; buyers negotiate directly with known
producers. Most producers try to constantly promote the use and consumption of zeolites, but
this is uncoordinated. Mining of zeolites now occurs in over 17 countries, including Japan, Cuba,
China, Mexico, United States, Italy, and former USSR States. A complicating factor is that no
standard testing or product description exists, sometimes resulting in less than acceptable results
for clients, due to the various chemical and physical natures of natural zeolites.
4.2 HEALTH STUDIES
One of the more serious potential threats to the further development of natural zeolite markets is
the association of (certain fibrous) zeolites and the development of mesothelioma.
Epidemiological data shows that
exposure to the fibrous zeolite
mineral erionite within dusts, even
in low exposures, increases the
risk of mesothelioma. Guthrie
(1992) provides a good review of
the biological effects of zeolites
using terms familiar to mineral
scientists. As there is a trace of
fibrous mordenite at Escott, a
sample of ultrafine powder (<50
gm) material was examined by SEM (Fig. 22), and revealed
subangular, blocky fragments,
down to 1 p.m in diameter. This
checking for fibrous minerals
should be routine for new
deposits.
41

A threat to the development of the world natural zeolite market is the unchecked mining of
fibrous zeolites. Given the medical literature that is accumulating, it is only a matter of time
before compensation cases appear from fibrous zeolite use. Negative publicity is likely to result,
possibly being targeted at zeolites as a whole, regardless of which zeolite minerals are present.
Unless zeolite producers actively and continually state the zeolite type and crystal habit being
mined, confusion will occur in the community. Zeolite is a group term, and consumers should be
both aware of this terminology, and be informed exactly what zeolites they will be receiving.
Fibrous zeolites, in particular erionite, should not be mined or the cost could be the reputation of
the remaining natural zeolite mining industry.
4.3 PRICING AND COSTS
No product will sell if the price is perceived to exceed the value of the product by the client.
Current pricing is based around a benchmark of $160/tonne, FOB, Mudgee N.S.W, for full truck
load (20 to 22 tonnes) for regular powder in 20 kg paper sacks. Other products and amounts are
more expensive or cheaper depending on analysis of production costs (handling, bag costs, time
required etc.).
Of the direct operation costs, freight and crushing/screening/milling are the major costs. For the
first six years, 38 percent of total invoiced income was consumed by freight paid by Zeolite
Australia, and 33 percent went towards contract milling/crushing/bagging. Actual mining costs
are low (around 5%), as is the 2.3 percent of zeolite income that went to the landholder as
compensation. Another cost is that a large proportion of tonnes mined do not generate income
(only 70 percent of tonnes mined were sold), due to samples, trials, shrinkage, loss etc. Given
the cost percentage, little is left from the invoiced income for overheads including marketing,
research, advertising etc.
For Escott Natural Zeolite sold in the first six years, the average freight paid for the delivery of
raw material to milling plants alone was $36/tonne (some of this is recovered as the mill may be
closer to some clients). In order that this component of costs is reduced, the new milling plant
site is located near the township of Werris Creek, central to the current and proposed N.S.W.
mining locations. Also Zeolite Australia is actively engaged in negotiations with freight companies
to minimise freight costs. This includes arranging with the smaller clients that their part loads can
go together as split loads, thereby getting the full truck discounted freight rates. To ensure •
compatibility for all parties, time is required for organisation, but it ensures that markets are
encouraged to maximise their use of natural zeolites.
42
One example of this is the Western Australian distributor, a distance of 3825 kilometres to Perth
from Werris Creek by road. When the first truck load was delivered by roadfreight the cost was
$262/tonne, the next shipment by slower sea container resulted in a freight cost of only
$102/tonne. This has since been further reduced, resulting in a lower cost to the Western
Australian distributor, who in turn has responded by more active promotion of the product.
The other main cost is milling. Unlike many overseas deposits where mining can be done by
ripping with dozers, the Australian zeolite has to be drilled and blasted, followed by crushing,
screening, and, depending on product required, milling. The processing costs have been
determined by the availability of suitable contractors. Cost for milling alone for the regular
powder (<100 gm) has over the last six years averaged $48/tonne, with individual batches
costing up to $94/tonne. The main problem was the availability of milling during peak client
demand, resulting in the use of more expensive mills to satisfy the demand. This variability in
costs has been absorbed by Zeolite Australia.
4.4 MARKETING APPROACH
Since the mining of zeolite had become the sole mining activity for Mount Gipps Limited,
following the termination of other exploration and mining activities, Mount Gipps Limited changed
its name in August 1992 to Zeolite Australia Limited. This name change was to reflect the
change in focus of the company to pursue an intensive marketing and development phase for
natural zeolite.
Early marketing research was conducted by a group of agricultural consultants and saw zeolite
marketed largely into stockfeeds, potting mixes and organic fertilisers. Further developments
were focussed on industrial applications for sewerage treatment and water filtration.
Since mid-1992, there has been a change in focus with an increase in both research and
development of zeolite applications, and of marketing. The change has seen Zeolite Australia
Limited market zeolite product through three distinct channels as listed below in Table 4 (see
Marx, et al., 1993, for more in depth discussion).
43

CHANNEL NOTES
MANUFACTURERS (produces new product incorporating zeolite)
Manufacturing companies in the areas of organic and, chemical fertilisers, potting mixes, stockfeeds and stockblocks, aquarium gravel, kitty litter and odour control products. Initial research data provided by Zeolite Australia Limited led to trialing by these companies prior to their commercialisation of products containing zeolite. Companies undertake their own advertising and promotion with some technical input from Zeolite Australia Limited.
DISTRIBUTORS (on sells zeolite as
received)
Initially a small distribution system was set up mainly for marketing retail packs to home and market gardeners. A major success of this system was the contact with manufacturers who 'sourced initial trial product via this network. Distributors have been set up to handle home garden, horticulture, turf, aquaculture and specialty retail products. In most cases distributors handle products for only one or two markets with very little overlap. Advertising and promotion is undertaken by joint arrangements with Zeolite Australia Limited.
INDUSTRIAL USERS (consumes zeolite in
final end use)
Due to high transport costs, large industrial users such as sewage works, swimming pools and other end uses, will be supplied direct or via industrial contracting companies. Zeolite Australia is to be more active in the development and licensing of this environmental application technology, with recent acquisitions of patented process for waste water treatment and water filtration using zeolite filters and zeolite bio-filters.
Table 4. Marketing channels used by Zeolite Australia Limited for Escott Natural Zeolite.
RESEARCH AND DEVELOPMENT
The development of technological innovations leading to processes that utilise natural zeolites to
deliver economic and environmental benefits is important to the future of Zeolite Australia.
Nearly all research is into the application of zeolites.
Many research projects are currently underway in the following areas; new fertiliser products for
slow release of nutrients specifically aimed at sugar cane, tropical fruit, cut flowers and
vegetables; zeolite as a soil amendment for turf construction and renovation; zeolite use to
improve fertiliser value of composted animal manures and effect on soil nutrition; zeolite use to
improve N+K retention and reduce leaching in potting mixes; ammonia removal in saltwater and •
freshwater aquaculture; heavy metal stabilisation in soils and wastes; sewage sludge
stabilisation; ammonia removal in ion exchange column; and use of zeolite in biological wetlands
filters. Many more industrial applications are only now being appreciated.
Research is continuing with databases being built containing bibliographic references of zeolite
applications (ZEOREF), and chemistry and mineralogy of Australian and overseas zeolites
(ZEOCHEM). All samples, trials, and sale details are databased (ZEOSYS) so that analysis can
be done on research, marketing, and sales performance.
- Basic research needed includes the generation of cation- exchange isotherms (see Semmens,
1984) for common expected solutions, thus enabling the prediction of effective zeolite capacity,
and consequently the required zeolite dosages necessary for specific applications. Examples of
44

required selectivity coefficients, which is similar to an equilibrium constants and from which the
exchange isotherms are built, are NH 4+-Na+, NH4+-K+, NH4+-Ca2+, Na+-K+, Na+-Ca2+, K+-Ca2+.
Recent trial feedback indicates that Escott Natural Zeolite appears to prevent boron deficiency in
carnations during commercial cut flower growing conditions. The influence of zeolites with trace
metals in agriculture is unknown. No published papers deal with this subject, yet it is an area of
potential market interest. In this case it is likely that the zeolite is reacting with the boron
chemical already added, and releasing the boron so as to be available to the plants. But this is
an example of an area where research is needed.
4.5 ECONOMICS OF THE AUSTRALIAN ZEOLITE MARKET
The Australian zeolite mining industry has been operating at a loss since mining began in
December 1987. Most of the costing problems are directly associated with problems of scale of
operation. Without higher tonnages, turnover costs per tonne are difficult to reduce.
Until the market grows and
stabilises, and sufficient capital is
injected, operating costs will be
detrimentally high. Currently the
market has matured to the stage
where sales are now independent
of any single end user category
(Marx et al., 1993), but each
market segmentation requires
individual product specifications,
packaging, distribution network,
technical and trial support.
Fig. 23 Tonnes sold of Escott Natural Zeolite per quarter for the first six years based on order date.
The 3 December 1993 marks the sixth anniversary of zeolite mining in Australia, with a total of
6672.3 tonnes of ore mined since operations begun. It took six months to generate the first sale
(for aquaculture), but since then a total of 4657.5 tonnes have been sold up till 3 December
1993, with sales steadily growing as is shown in Figure 23.
Sales have been predominantly to the animal feed and horticulture markets (Fig. 24) during the
last six years, but other areas are growing. One aspect that is very different from metalliferous
mines is the number and diversity of clients. In the first six years commercial sales have been
45

„
S.A. (8.2%)
Tas. (0.2%)
Vic. (33.7%)
N.T. (0.5%)
Old. (17.1%)
N.S.W. (31.3%) Animal Feed (33:9%)
ACT. (0.1%)
O.S. (6.7%)
W.A. (1.2%)
Horticulure (42.2%) Distributor (15.7%)
Unknown (3.8%)
Arfalla.licacleCOWNI (2.2%)
made to over 230 different customers, scattered across Australia, and overseas (Fig. 24). In
1991 some large organic fertiliser manufactures began incorporating zeolite into their products,
and this can be seen in the June-August quarter orders as this market is seasonal (during 1993
these larger clients averaged out their orders over the year). In other markets the orders reflect
advertising expenditure (domestic gardens), and in others (i.e. piggeries) orders are dependant
on the client products market performance (i.e. pork markets), indicating that zeolite is considered
a luxury item, which can be done without when times are bad.
Fig. 24 Percentage tonnes sold by market category, and delivery of production.
The problem to date has been the lack of consumer and investor
natural zeolites. This is combined with low tonnages resulting in
shrinkage and loss, higher operating cost/tonne).
address, for the first six years
knowledge, and confidence, in
extremely low efficiency (high
There is no question that sales are price sensitive, and that different market categories show
differences in their sensitivity too price changes. In some areas the prices needs to be lowered '91'
to encourage trial and acceptance. The approach that has been adopted is to proceed with
acquiring a dedicated zeolite processing plant at Werris Creek, which will resolve many cost
problems. The other approach under way is to further develop other markets, particularly high
priced value added products.
In summary, the development of natural zeolite markets have encountered difficulties in the area
of production costs and marketing. Zeolite Australia Limited continues to progress the sales of
natural zeolite despite the following problems (after Marx et al., 1993):
1. Reluctance by industries to adopt innovations;
2. Cost to the company of demonstrating innovations to third parties;
3. Little assistance in development costs from either public or private funding;
46

4. Expensive initial contracted milling operations;
5. Vast distances resulting in high freight component of final end user price;
6. Threat of new local producers of zeolite entering market after expensive
acceptance phase has been borne by initial developer;
7. Cost of training a distribution network; and
8. Severe recession in both agricultural and industrial sectors in Australia over past
5 years.
5. CONCLUSIONS
The development of a natural zeolite industry is no longer dependent on geological
investigations, but has developed to where the industry is now dependent on marketing and
application research. Thus Zeolite Australia Limited has become involved in the development,
acquisition, and licensing of technology for environmental applications of natural zeolite. The
most important change taking place in developed countries like Australia is the growing
awareness and concern of the general public towards the environment. Natural zeolites through
numerous applications can become one of the leading products in the promotion of more
sustainable less environmentally damaging agricultural and industrial developments.
Both exploration, and corresponding geological research have been a very low priority in the
development of a stable natural zeolite market in Australia. As has been the Cuban experience
with zeolite market development (Gonzalez & Costa De Los Reyes, - 1993), no matter how large
or pure the ore deposit, it is detailed information on the product's application behaviour that is
required by the markets. No two zeolite deposits are the same, and detailed characterisation of
further deposits is essential. To help develop more standards for characterising natural zeolites,
an International Zeolite Marketing Board where member companies can trade technological
developments with other members should be encouraged. This board could develop a set of
standards for classifying the characteristics, both chemically and physically, of zeolites and
zeolitic products, to simplify local interpretation of overseas research papers. All suppliers of
zeolites should be able to provide mineralogical and physical details about their products.
A more serious potential threat to the greater development of natural zeolite markets is the
association of fibrous erionite zeolite with mesothelioma. This mineral is considered in recent
, publications to have higher toxicity than asbestos (Guthrie, 1992). Fibrous zeolites, in particular
erionite, should not be mined or the cost could be the reputation of the remaining natural zeolite
industry.
47
Given time there remains much to learn about Australian zeolites, their chemistry and properties.
This work is just the starting point. The natural zeolite industry in Australia is established, but
growth will be slow and difficult due to high costs and depressed consumer appreciation. The
role of the geologist has moved from active exploration, to that of technical coordinator for a
mineral group with extremely wide applications.
6. ACKNOWLEDGMENT
The material presented within this paper represents six years of intermittent work by a range of
geologists, who each contributed towards the greater understanding of zeolites. The author
particularly wishes to thank, Dr Peter Flood, who compiled and undertook most of the early
research. ' Other geologists involved in the exploration have been Daniel Sackers, David Choy,
and Rowland Hill, together with Wolf Marx and Chris Roberts, my sometimes patient superiors
over the last six years. I have tried to give credit where specific works are attributable, but any
nonsensical interpretation is my fault alone. Finally, the assistance of Zeolite Australia Limited for
permission to use data, Mike Gout who helped with the marketing section, Livre Holdings Pty Ltd
for giving me the time, Janice McKay for the drafting, the Museum of Victoria for the zeolite
samples, Benjahin Mapani for help with the petrology, Prof. Hideo Minto from the University of
Tokyo for various analyses, Dr Tim Bastow (CSIRO) with the NMR work, Ian Savicky for his
computer assistance, and my wife Cheryl for her patience, are all gratefully acknowledged and
thanked.
48

7. REFERENCES
ALIETTI, A. 1972. Polymorphism and Crystal-Chemistry of Heulandites and Clinoptilolites.
American Mineralogist, 57, 1448-462.
AMES, L.L., 1966. Cation Exchange Properties of Waikakite and Analcime. American
Mineralogist, 51, 903-909.
ARAKEL, A.V., 1987. Sedimentary Petrology of BMR Drill Cores and Shallow Vibrocores from
Playas in the Southern Amadeus Basin, Northern Territory. Aust Bur. Min. Resources
Record 1987/61.
ASKINS, P.W., 1980. E.L. 7/74 Tasmania, Report on Investigations Zeolites, Gad's Hill Area.
Unpub. Open file Coma/co Ltd report.
BIRCH, W.D., 1989. Chemistry of Victorian Zeolites. In Birch, W.D. (Ed.), Zeolites of Victoria,
Mineralogical Soc. Victoria, Spec. Pub. 2, 91-102.
BOLES, J.R., 1972. Composition, optical properties, cell dimensions, and thermal stability of
some heulandite-group zeolites. American Mineralogist. 57, 1542-1493.
BRAMLETTE & POSNJAK, 1933. Zeolite alteration of Pyroclastics. The American Mineralogist,
18, 167-171.
BRECK, D.W., 1980. Potential Uses of Natural and Synthetic Zeolites in Industry. In Townsend,
R.P. (Ed.), The Properties and Applications of Zeolites, The Chemical Soc. Spec. Pub.
33, London, 391-422.
BROOKE, H.J., 1822. Edinburgh PhiL Journal, 6-112.
BUSENBURY, E., & CLEMENCY, C.V., 1970. Determination of the Cation Exchange Capacity of
Clays and Soils Using an Ammonia Electrode. Clays and clay Minerals, 21, 213-217.
COOMBS, D.S., 1958. Zeolitised tuffs from the Kuttung glacial beds near Seaham, New South
Wales. Australian Journ. Sci., 21, 18-19.
COOPER, S.A., 1992. Exploration Licence 2774, Werris Creek, NSW, Tenth six monthly
progress report ending 19 February 1992. Unpub. report by Livre Holding Pty Ltd for
Mount Gipps Limited, March 1992.
DAVIDSON, G.J., & DASHLOOTY, S.A., 1993. The Glyde Sub-basin: A volcaniclastic-bearing
pull-apart basin coeval with the McArthur River base-metal deposit, Northern Territory.
Aust. J Earth Sci., 40, 527-543.
DRYSDALE, D.J., 1992. The Potential for a natural Zeolite Industry in Queensland, An analysis
of the Literature. Pap. dept. Earth ScL Univ. Old., 12, 332-347.
DUDDY, I.R., 1983. The Geology, petrology and geochemistry of the Otway Formation
volcanogenic sediments. Unpub. PhD thesis, University of Melbourne, Melbourne.
FLOOD, P.G., 1987. Exploration Licence 2774 First Exploration Progress Report for Six months
Ending 19 August 1987. Unpub. report for JM Stephen Pty Ltd.
49

FLOOD, P.G., 1988. Zeolite Beneficiation. Unpub. report for Mount Gipps Limited, 3 Feb. 1988.
FLOOD, P.G., 1991. Prospecting for Natural Zeolites: Exploration model based on an
occurrence in 300 m.y. old rocks near Werris Creek, New South Wales, Australia. Trans.
Inst. Metall. (Sect. B: AppL earth sc.), 100, B9-B13.
FLOOD, P.G. & TAYLOR, J.C., 1991. Mineralogy and geochemistry of Late Carboniferous
Zeolites, near Werris Creek, New South Wales, Australia. N. Jb. Miner. Mh., Jg.1991, H.2, 49-62.
FLOOD, P.G., MARX, W.T., & ROBERTS, C.L., 1993. Zeolite Production from the Escott Mine of
Mount Gipps Limited, Werris Creek, NSW. In Woodcock, J.T. & Hamilton, J.K. (Eds.), Australasian Mining and Metallurgy, Monograph 19, The Aust. Instit. of Mining & Metall.,
1431-1434.
FREDRICKSON, P., 1986. Characterisation of NSW Zeolites Deposits. Part 2. Manual of
Laboratory Test Methods. Unpub. NSW Department of Mineral Resources, Development
Laboratory, Report 86/10, August.
FREDRICKSON, P., 1987. Testing of a Potential Zeolite Bearing Rock from the Werrie Basin.
Unpub. NSW Mineral Resources Development Laboratory Report 87/52, November 1987.
FREDRICKSON, P.W., & DOWSWELL, L.A., 1988. Investigation of Cation Exchange Capacity
Test for use on Zeolite-Rich Rocks. Unpub. NSW Mineral Resources Development
Laboratory Report 88/38, Sept. 1988.
FREDRICKSON, P.W., DOWSWELL, L.A., & HOLMES, G., 1988. Characterisation of NSW
Zeolite Deposits Part 14, Further Rocks from the Tamworth Belt. Unpub. NSW Dept. of
Min. Resources Report 88/28, GS1988/302.
FREDRICKSON, P. & PECOVER, S., 1987. Characterisation of NSW Zeolites Deposits. Part 13.
Various Carboniferous and Tertiary Rocks from the Tamworth Belt. Unpub. NSW Dept.
of Mineral Resources, Development Lab., Report 87/53, November 1987.
GONZALEZ, J.L., & COSTA DE LOS REYES, A. 1993. Cuban Experiences in the Production
and Marketing of Natural Zeolites. Zeolite '93 4th International Conference on the
Occurrence, Properties, and Utilisation of Natural Zeolites, Program and Abstracts, Idaho, June 20-28, 1993, 101-103.
GOTTARDI, G., 1978. Mineralogy and Crystal Chemistry of Zeolites. In Sand, L.B. & Mumpton, F.A., (Ed.), Natural Zeolites Occurrence, Properties, Use, Pergamon Press, 31-44.
GOTTARDI, G., & GALLI, E., 1985. Natural Zeolites. Springer-Verlag, Berlin.
GRANT, J.A., 1986. Isocon diagram - A simple solution to greisen's equation for metasomation
alteration. Econ. Geol., 81, 1976-1982.
GUTHRIE, G.D.Jr. 1992. Biological Effects of inhaled Minerals. American Mineralogist. 77, 225-243.
50

HARMS, J.E., 1990. Report on Zeolites in Drummond Basin Queensland. Unpub. report by
Burgundy Exploration Pty Ltd, January 1990.
HAWLEY, D.L., 1991. Exploration and Development Work Related to a Zeolite Resource on EL
3294 Cranky Corner (Newcastle): Six Monthly Progress Report to 15 April 1991. Unpub.
report by Geoplan Resource Planning for International Mining Corporation NL.
GS1989/353.
HAY, R.L., 1978. Geological Occurrence of Zeolites. In Sand, L.B. & Mumpton, F.A., (Ed.),
Natural Zeolites Occurrence, Properties, Use, Pergamon Press, 135-143.
HELLFERICH, F., 1964. A Simple Identification Reaction for Zeolites (Molecular Sieves).
American Mineralogist. 46, 1752-1754.
HOLMES, G.G., LISHMUND, S.R., & OAKES, G.M., 1982. A Review of Industrial Minerals and
Rocks in New South Wales. Geol. Surv. of NSW Bulletin, 30, June 1978. 242-244.
HOLMES, G.G., & PECOVER, S.R. (Eds.), 1987. Natural Zeolites. An Information Package for
Exploration & Development in New South Wales. Unpub. NSW Geol. Surv. Report,
GS1987/145.
JOHNSON, S.E. & HENDERSON, R.A., 1991. Tectonic development of the Drummond Basin,
eastern Australia: Backarc Extension and Inversion in a Late Palaeozoic active margin
setting. Basin Res., 3, 197-213.
KRISTMANNSDOTTIR, H. & TOMASSON, J. 1978. Zeolites Zones in Geothermal Area in
Iceland. In Sand, L.B. & Mumpton, F.A. (Ed.), Natural Zeolites Occurrence, Properties,
Use, Pergamon Press, 277-284.
LEWIS, M.D., MOORE 3rd, F.D., & GOLDSBERRY, K.L., 1983. Ammonium-exchanged
Clinoptilolite and Granulated Clinoptilolite with Urea as Nitrogen Fertilisers. In Pond,
G.W., &.Mumpton, F.A. (eds.), Zeo-Agriculture, Westview Press, 105-111.
LIEU, K.Y., WILLIFORD, C.W., & REYNOLDS, W.R., 1988. Comparison of Wet Chemistry CEC
Determination. In Kallo, D., & Sherry, H.S. (Ed.), Occurrence, Properties and Utilisation
of Natural Zeolites, Akademiai Kiado, Budapest. 541-550.
LOUGHNAN, F.C., 1966. Analcite in the Newcastle Coal Measure Sediments of the Sydney
Basin, Australia. American Mineralogist, 51, 486-494.
MacNEVIN, A.A., 1973. Zeolites. Unpub. New South Wales GeoL Surv. Report, GS1973/236.
MARX, W.T., COOPER, S.A., & GOUT, M.J., 1993. Zeolite production in Australia. In Proc. The
Application of Zeolites for Environmental Solutions Workshop. University of New South
Wales, Sydney, 16-17 February 1993.
MARX, W.T., GOUT, M.J., & COOPER, S.A., In press. Production and Marketing of Australian
, Natural Zeolites. Proc. of Industrial Minerals in Environmental Applications Symposium,
GeoL Soc. Canada, Vancouver, November 18-19 1993.
51

MASON, B., & SAND, L.B., 1960. Clinoptilolite from Patagonia: The relationship between
clinoptilolite and heulandite. American Mineralogist, 45, 341-350.
MIAN, M.A., & HILCHIE, D.W., 1982. Comparison of results from Three Cation Exchange
Capacity (CEC) Analysis Techniques. The Log Analyst, 23, 10-16.
MING, D.W., & DIXON, J.B., 1987. Technique for the Separation of Clinoptilolite from Soils.
Clay & Clay Minerals, 35, 469-472.
McKELVEY, B.C., 1966. The Stratigraphy and Petrology of a Devonian and carboniferous
Sequence in north-east New South Wales. Unpub. Ph.D. Thesis, Uni. New England,
Armidale, NSW.
McPHIE, J., 1983. Outflow ignimbrite sheets from Late Carboniferous calderas, Currabubula
Formation, New South Wales, Australia. Geol. Mag., 120, 487-503.
McPHIE, J., 1984. Eruption Styles and Setting of Late Palaeozoic silicic volcanic centres, New
England Orogen, northeastern New South Wales. Unpub. Ph D. Thesis, University of
New England, Armidale.
McPHIE, J., 1986. Primary and redeposited facies from a large-magnitude, rhyolitic,
phreatomagmatic eruption: Cana Creek Tuff, Late Carboniferous, Australia. J. Volcano'.
Geotherm., 28: 319350.
MERCER, B.W., & AMES, L.L., 1978. Zeolite Ion Exchange in Radioactive and Municipal
Wastewater Treatment. In Sand, L.B. & Mumpton, F.A. (Ed.), Natural Zeolites
Occurrence, Properties, Use, Pergamon Press, 451-462.
MILLARD, M., 1993. Gravity Concentration Equipment. In Noakes, M., & Lanz, T. (Ed.), Cost
Estimate Handbook for the Australian Mining Industry, Aust. lnstit. Mining & Metall.,
Monograph 30.
MINATO, H., NAMBA, H., & ITO, N., 1984. Thermal Behaviours on Clinoptilolite, Part 1. Hyogo
Univ. Teacher Educ. Jour, 4, 101-110.
MINATO, H., & UTADA, M., 1986. Chemical Composition and Thermal Behaviour of Heulandite
and Clinoptilolite. Jour. Japan Assoc. Min. Pet. Econ. GeoL, 61, 213-221, Translated
from Japanese.
MING, D.W., ALLEN, E.A., GALINDO, C., & HENNINGER, D.L., 1991. Methods for determining
Cation Exchange Capacities and Compositions of Native Exchangeable Cations for
Clinoptilolite. Zeolite '91 3th International Conference on the Occurrence, Properties, and
Utilisation of Natural Zeolites, Program - Abstracts, Cuba, April 8-12 1991, 127-128.
MING, D.W., & DIXON, J.B., 1986. Clinoptilolite in South Texas Soils. Soil Science Society of
America Journal, 50(6), 1618-1622.
MING, D.W., & DIXON, J.B., 1987. Quantitative determination of clinoptilolite in soils by a cation
exchange capacity method. Clay & Clay Miner., 35, 463-468.
52

MUMPTON, F.A., 1978. Natural Zeolites: A New Industrial Mineral Commodity. In Sand, L.B. &
Mumpton, F.A. (Ed.), Natural Zeolites Occurrence, Properties, Use, Pergamon Press,
3-27.
NEW SOUTH WALES DEPARTMENT OF MINERAL RESOURCES, 1986a. Field testing kit for
natural Zeolites. Minfo (NSW Mining & Explor. Quart.), 10, 8-9.
NEW SOUTH WALES DEPARTMENT OF MINERAL RESOURCES, 1986b. New Zeal for
Zeolites. Minfo (NSW Mining & Explor. Quart.), 15, 5-8.
NEW SOUTH WALES DEPARTMENT OF MINERAL RESOURCES, 1987. Proceedings of
Seminar on Natural Zeolites in New South Wales. Unpub. Report GS1987/146.
NODA, S., 1980. A Simple Method for Determining the Cation Exchange Capacity of Natural
Zeolites. Nendo Kagaku, 20:3, 79-83.
PAKE, G.E., 1948. Nuclear resonance adsorption in hydrated crystals: Fine structure of the
proton line. J. Chem. Phys., 16, 327-336.
PECOVER, S.R., 1987. The Geology and Prospectivity of Zeolite Occurrences in New South
Wales. In Holmes, G.G., & Pecover, S.R., (Eds.), Natural Zeolites: An Information
Package for Exploration and Development in New South Wales. Unpub. NSW Geol.
Surv. Report, GS1987/145, 65-100.
PINCHIN,J., 1978. A seismic Investigation of the eastern margin of the Galilee Basin,
Queensland. BMR Jom. Aust. Geol. & Geophy., 3, 193-201.
ROSKILL INFORMATION SERVICES LTD, 1990. The Economics of Zeolites. London.
SCHALLER, W.T., 1932. The Mordenite-Clinoptilolite Group; Clinoptilolite, a new Species.
American Mineralogist, 10, 305-331.
SEMMENS, M.J., 1984. Cation-exchange Properties of Natural Zeolites. In Pond, G.W., &
Mumpton, F.A. (ed.) Zeo-Agriculture. Westview Press, 45-53.
SHELTON, V.A., 1993. The Economic Reality of a Natural Zeolite Business. Zeolite'93 4th
International Conference on the Occurrence, Properties, and Utilisation of Natural
Zeolites, Program and Abstracts, Idaho, June 20-28, 1993, 187-189.
SHEPPARD, R.A., 1973. Zeolites in Sedimentary Rocks. In Brobst, D.A. & Pratt, W.P. (Ed.),
United States Mineral Resources, U.S. Geol. Survey Prof. Paper 820. 689-695.
SHEPPARD, R.A., 1983. Characterisation Of Zeolite materials in Agricultural Research. In Pond,
W.G. & Mumpton F.A. (Ed.), Zeo-Agriculture, Westview Press, 79-87.
STEPHEN, G.J., & GOUT, M.J., 1993. Production and Marketing of Australian Natural Zeolites.
Zeolite'93 4th International Conference on the Occurrence, Properties, and Utilisation of
Natural Zeolites, Program and Abstracts, Idaho, 20-28 June, 193-195.
SURDAM, R.C., 1977. Zeolites in Closed Hydrological Systems. In Mineralogy and Geology of
Natural Zeolites. Mumpton, F.A. (Ed.), Min. Soc. America, Short Course Notes 4, 65-91.
53

SURDAM, R.C., & SHEPPARD, R.A., 1978. Zeolites in Saline, Alkaline-Lake Deposits. In Sand,
L.B. & Mumpton, F.A. (Ed.), Natural Zeolites Occurrence, Properties, Use, Pergamon
Press, 145-174.
TSCHERNICH, R.W., 1992. Zeolites of the World. Geoscience Press Inc., Arizona, U.S.A.
WARD R.L., & McKAGUE, H.L., 1993. Multinuclear Nuclear Magnetic Resonance Investigation
of the Dehydration/Rehydration of Two Zeolite Isomorphs: Clinoptilolite and Heulandite.
Zeolite'93 4th International Conference on the Occurrence, Properties, and Utilisation of
Natural Zeolites, Program and Abstracts, Idaho, 20-28 June, 213-214.
WHETTEN, J.T. 1965. Carboniferous Glacial Rocks from the Werrie Basin, New South Wales,
Australia. GeoL Soc. of America Bull., 76, 43-56.
WILKINSON, J.F.G., & WHETTEN, J.T., 1964. Some Analcime bearing Pyroclastic and
Sedimentary Rocks from New South Wales. J. Sed. Petrology, 34, 543-553.
WINCHESTER, J.A., & FLOYD, P.A., 1977. Geochemical discrimination of Different Magma and
their Differentiation Products using Immobile Elements. Chem. GeoL, 20, 325-344.
YUCEL, H. & CULFAZ, A., 1988. Characterisation of clinoptilolite of Western Anatolia. In Kallo,
D., & Sherry, H.S. (Ed.), Occurrence, Properties and Utilisation of Natural Zeolites,
Akademiai Kiado, Budapest, 99-108.
54

'M'S'N '41.ag 'uo!.lew.Joj epqnqeJ_Ino W0.4 saLdwes
pas!.14Loaz pa4oe1es J0j. s!.sAieue 4uawaia JOCeW 7130J 8 L 0 11M I. XION3ddV
1861 `BA03ad 9 nonnipa13 'samosas Frau89 10 luaormda0 so 0 111 saideles
oc oc 01 81 OE OE OE OE az sz Oc oc sz oc )1111c0 *IRS aiptIli OL'O 107 401 100 091 PTO 890 zro zol 900 IVT 111 OIT 417 uopeyiaa OuEIS 200I/batu 0/ < 0r66 CETI 800 SOT 107 0E1 187 WO ZVO ITT Ill 1171 IZT 0119 ueail S31DIVS TIV 11011101/03 111110118Y11111
S 44 SS SS14 SS IS 901 co7 000 100 KT 990 601 090 000 SVO aro 417 900 161 6966 COI OTT 800 160 1/1 60t 060 100 E10 811 8171 ZZT 1189
E EE EC EEEEEE Et IST 801 000 IVO 910 OE'0 SO SIT IVO OOT ct wo ZOT 177 E986 1911 On 900 017 017 617 OTO 900 OTT 101 E611 LIT 1E'69 8 OI L 8 8 8 1 8 8 1 . 0 /ST CO'l 00'0 ZOT 1I1 89'0 WO C1'0 NT 400 911 SST 100 851 8816 958 OIT 401 WE 611 1E7 EST 100 IIT 101 oru 8111 £919 S SS SS SSS /SS SS LIT 1311 on 00'0 IVO WO 11'0 CO 100 WO WO 610 100 161 9966 0471 000 900 401 101 OrE ETI 400 000 EVI 0011 6r0 4149 8 8 8 8 8 8 8 8 8 8 8 8 09'0 1E1 400 101 901 6I0 ZIT ZOT SOT ET 160 400 S61 9966 99II 600 SOT 951 LVO S67 EVI 100 9(0 160 6511 4I0 1119
lunaD Owes uoRnaa puen
uaa lunaj Owes
00P01/00 PS wax
wnoo Owes uopepkaa puels
lunoo aidwes 0:921a0 PuE'1S
maw 10003 Owes
uontinag PUBiS twail
S311S 131110
ENO 'HD
111111 NMI 'HD
azlianans
am • (To 11)
S1V101 11115 80I1T301
1011i 01101 086 OIT 011 VO'I 087 WE Sul 100 010 or! 044I 810 0999 91 cc/IS laaii IS we0 gIlocl1nO d111.1 V0/1 40E17 10111 0666 0111 INT 100 901 091 ZI1 Oil 100 0(0 orT 0171 010 orta 901 ES/t8 10011 IS area 4PIPlo 11113 10E17 101141 9066 0I1I 611 on /TV OLT 091 0S7I 0119 911 SE/L8 10111 IS auvli dOID j ES712 laski 0166 0471 OTT LOT ETO 011 197 S0I 100 OIT WI 0671 910 0959 LII ES/L8 mix IS iflodInt) law! d1110 P00 90E17 laaw 0E16 001 0111 901 E90 017 191 0(0 100 oro 090 041 910 MI 86 ES/L8 1)11ili IS All0dplo laml (IMO 110/1 10E17 1111141 0186 011 oro 900 S61 OVI 817 OTO 401 an an osm 910 0501 16 ES/L8 1111141 dS S 111111 do D (ND )13011 61E17 101114 0066 061 OTT 1110 lIZ 0S7 ETI SL'O S00 aro 011 0911 910 OTOL CS/L8 101141 IS El 111111 dE'D aql @ID WI LZEd7 101141 0016 066 OtO sn crz 017 997 sro col on on 0(Z' 610 0999 611 ES/L8 10811 IS g olin deo ata (ND PoS 91E17 1041 0616 cc oto col) trl 001 991 550 100 010 060 0071 810 0501 IL ES/L8 101141 dS deD aql 11110 ZIEd2 lasx 0066 Or8. 0(0 ZTO wc on ES1 S110 E00 OIT 001 OrZI ETO OITL 1/ ES/L8 lau IS de D aql 1103 Poo KEIZ 1011140166 OZTI CRT IVO 917 017 197 590 VOT OIT Orl - 00E1 610 0019 611 ES/18 110114 dS de9 aijj 413 P3E ZEEd7 loari 0986 058 OIT S00 911 OTO El7 Sr0 100 OIT 051 Orli 810 ors 911 ES/L8 IS 109 aq1 dO13 SZEd2 101111 0166 056 aro 900 8E7 011 S97 OLT 100 0111 oro 0911 LIT 0669 61 ES//8 10111 IS 103 au, 413 711 81E12 10/D1 0416 ort on 900 inc OLT S07 040 IVO OTT 060 0071 tro 0569 91 CS/18 10E11 IS d9 0112 (11110 3Poll LIEd7 1111141 0086 011 OIT S00 661 000 SO7 STO 100 OtO OTO 0671 TZT 0019 St ES/18 11E41 IS <1E'D'atll dO13 POE SIE12 10841 1116 016 947 057 197 050 911 orn 0E19 ZZI SE/L8 101111 IS deD aij.j dgID 3P08 19112
lull Tali 6966 891 ITO S00 141 In 641 /CI 401 1(1 6171 IET 6089 ZVI E6/S/S1 118311011 APaRIS sd[tio aa 00 '31111 6166 8871 000 900 801 150 LTC 05I COT 000 (91 0171 6r0 6819 ZEI II I6/1/SZ 101 811011 Apaays tauuetip W91 - 00 VI 115 '31111 0966 6871 100 900 801 650 69E 641 ETO OVO £91 691I 6(0 9059 1E1 10 I6/1/S1 110 811011 APaaqS fauuND 1011 -00 VI HS 1111 6166 85C1 000 900 SE'I OrE 481 900 000 407 9111 6E0 8679 6E1 Zi I6/1/S1 1108 111111 gPaatIS 9c11113 1010 (111A-OT Y4 03 '31111 1866 SSII 000 9040 IT! ZrI Oa sal 900 001 407 Sill oro 6019 6E1 II 16/1/SZ 1111 0 1P11 4aatIS 910I3 11110 DIVS-TE y9 03
iun qtali 8966 0116 100 500 1101 151 90E SrI EVO • ITT ICE1 LET ova 651 E6/S/SZ 118811011 AMIE 911113 VO WIE-07 1/4 113 101114 0566 0871 010 SVO 601 001 STE 011 ITO OTT 001 0171 EIT 0119 511 cska IS 110n3 413 Poll 60117 law 0(16 0011010 500 C11 OLT 167 000 IOT OIT OLT 0901 cro out ROI ES/L8 10111 IS 110393 dOID 1>01 IIC17 loali 0866 0871 OIT 600 LVI 060 99E 501 IVO OZT 010 0071 tro 0419 VZI ES/L8 101111 dS 110372 11110 711 80C17 'max OETOI 0511010 500 WO 0911 667 001 ITO OIT OTO 0111 601 On/ SOT ES/18 108114 dS 110393 d 1.113 1D011 0IE17 101141 Or66 0171 010 COT 611 ON 40t SI1 IVO UT 011 OVIT 110 0119 SIT (0/18 10011 Id 110303 911110 [Fa aila-sc 3511 laaw 0666 0111 oro 400 6r1 001 In 011 ITO OZT Oil MI ZIT 0619 601 (0/18 10011 Id =3 Scipio pa 1019-61 1 3518 3111 IS'66 108 COT 900 Iry ssro 607 ITO 9110 1E1 6671 Er0 9119 0E1 00n8 E7 DS 110303 aIduES Pan 1886I/I1 t7 10001 0066 0911 OIT ZOO .E9'I 001 067 SVI 100 OZT 001 OSII oraa 16 ES/L8 101141 Id 110303 sdaiD Evr-fiZ I 351.1
0)11 % % X 9 9 9 X 9 9 % % % boo 1311/11 141 1101211301 3121 130111111
18101 101 (OS 5011 050 01011 0 03 014 041 001 £0101 COM 1011 ZOIS 33V INVS 31/40LS 311111'S

2 :el Z1
•-■
Vg r4 r; zr. V3 r.1 gg
g4
•••• 0.
^1 cq
UM UM soM UM U. UM UrA C. CM UM UM UM UM
gi
°-;
CM WM CM CM CM CM CM CC „
ra. iwca.
um c. cM v. 00 v. Ca C. C. C. 00 C. um c. um oo
uM u. V- um um um uM
c.
8 8 S re S S
r- um r- r- cm um co co CO CO
C. C4 C. C. VOI CV CV
r- ra
5i Ef. tE gr, tr.
1 1 'a 2 c.3 A -a -A -A -A ...A 3 , -A -A
2T229? -11 2E2ER .211.2T 62-22 E3 1
ctl 0 ;II Ei EE 55 if.' 51 EA 11 5 El 5i El Ei E El Ei Ei E4 V3 N
Et
V2 ER CR ZS LS ER gi SZ tW. ZS L5 eg ER L5 eg g2 OR E3 :a El ZS g3 ER .:1:1 m EE " 2 " a n ra c,
ca.
v.. C. ,... 7. le
0 a
„
cm ,....„ „_, ,,=,
.. p „
0. = el F3 cr. ra Cn co cc c. u. cm v. cm .19. ■c uM c. vm „ cm co V. Cg 0 V- uM v. CU
6-. p 0.
OA vc ER ER. um cn ra rn ra ER. E, um cm oo cm e- e. c- ca cm c. co c. um cm c, em
oso V2 SR E3 ER oo ER fa ca eg um cn um co ZS Eg ZS SE EE r2 .= .4 Cm 01
on r- ZS ER
„ „ cm CO C. CR C. C. CM
C4 =, c. ••••• cs, ..6. •••• oia. ..- .... oss us LAM v- ta. UM LO CO ...- uc •-• •-• CO CO CC/ 0 v. 0. 0
un El c, Ci. ... ... .-. aca ... .... .... .... , ... .... ...... .... ....- -...- ....- 0 0 0 0 0 6.0 0 0 orM
on ta c.... =a. on ...T.4 .-. ra .-. s .... „ Lem co um .... s..., .-• em ,=. gii M C-. id: %ea 07 ..0, 0 C.-:. ....: CM CM 0? cM A. 116 -n c. A-1 X711 =4 ‘,
c., ,m
co cm oo cm cm cm cm co cm cm ca um U.
ER co c. es. um on r- co u. oo co rn cm ud ^. so: cm u4
CR CO C. cm um cm um cm • u4 c4 la?, ad cm „
UM uM C. UM C.
um C. V- e4 ' u5 ca
i
.,:. ..: .. ... • ..:
Avs
cm cm cm em c4 c5 cm cm c.
„ cm co ... cm um cm cm es co C. om 1
om --. I I ... ...... ra rn rn ca :zg ..., c> uo. :-.....1 — :1 ., — cm u-.! ..... 1
um 'cm cm cm c. Hol oq oo cq ri um cm. :...1 vs cq oq yq 1
c›
.-, 1 ,, „ „ e. • „ um co cm c? uM .? .? c'' '7 ''''' '''''' o,,i c4 ■4 C. ... 0 cm „ ....
I IC? 4,,, c> C. ..... • c, cm 1 -- c–
C. G. C■ C. C. UM C. c. v, c. C. um cd cm e4 cm •4 c6 e-1cm ". .
:a cm c4 col
cn co co cm um e- um cm c4
Eg cI c. cm cm
cm c5 c5 c5
.74 342
V. v. C. c. C. C. -me C. 0- c4 c5 c4 =5 c5
a 0.
0 a ca.
ca„
ga. a Es.
7 El
17.
8 la
El
a
vA 1S1 CO 10.
a GO 10. 0. Ow
131
a.
g4 g4 2R E2 23 Z4 ZS t2.. tirm• Z.A! C2 SI Ve ee 22 Z5'. `" S3 ER Z5 147:
rn rn
um um um um um um um rn rn rn rn rn Ll Ll ZS g 14 1 14 A ig g g _
8 8 11
44 .. co cc co co co .0 cc co om co EG co co co oo ,"... - .g.
a rE c",._ 22.1.2222---.--:-.,22 ca
0.)..2-•=.•-r.P2Q.'71.2 M e1,11,Y,F, g..§fl =c .7 V. 5 5 5 '-' 'D.1 Ea 5 5 5 5 • 5 5 00 ' en en
g
DO Dm 0. CU 0 CU CD 0 0 0 CD g
W Ct
. ....
a i; m _. T
Id Id Id .,-7.....,--aus. a aa- aaaa 3-2.4. at c., . .. il 21 li li A ii g A ji ] 2 A X X.' A .23 X A A sq X s2 X -2 'oi ..1- -, i • ... ji I
DM CD E.-. F. 6.-. F+ F■ F■ 6--. F. C.:: F. 6- E. 7C CA
1 ii 8. 2. .E.. a- a- a. ... .. .. .a.
Mc
5 A° 1 '' • _
— „. . .....,
R -.-- .-,, 1 E . I El =Z ,. . .,. 0. , C.
.:
...... ... g g g co ou so 4=1 4-4 SU
nm nm +a
ac cm co ac CS c§ A A A li A A A A A g g g A A A A A El El E2 'ig
c, ,---_-- • — 6-
-- — .. r... .. ga €4 z-----; ;.-4 — .., v3 ;74 „,a, -- 9 ,, a,, . r3 f3 g? '57 Z3 g2 gs es gS gs 8 8 S
Ei 0.
Es r,
CO R.
-4 •
VD1
CV] 6-•
VD CD .1
p
APPENDIX 2 Whole rock trace element analysis of selected zeolitised samples from Currabubula Formation, N.S.W.

K20
P20
5 10
1 TO
TAL
.7.
"
51 H H C. UM co .--.4 CV Cr c. C■ c, c, U0 C. C.- um Co e- cm un .. ,m ..4, e.
COCO kg, q Co
' ■V ..S. C., C, ,, C., C., ..., ,, ■. C., U. G., LIG, C■ U. CI, P. U, I
• N.,
C. CV j
C. =.a. II 11
'.---c '-'' 'n L'' M grl; H " Z",
c--- o-.
- - - - - - M VS' F-1 t.-.3 PA g3 e.
e. -..
a. Cc n i 1 m
-- 51 H CC) „ C") „._ C-) ...„ C")., „ „ II CC ,-, = ii Lc.
c, ii N „ H :1
_. . N „ H ,4i. --r. - N
. - „ - - CM 1.C.3 ca- •-• LC, 0, a= cC. CY CO ce, ..C.3 Oa Co II 0 c- ..3.
E■ GL, .1
'-- = Z..,71 M M .1:73 g.Z.4 E.' A 0. 147:: "2 Ell '71.4 :j."7'1
..., ,- .., ■ 1
co
11
0. .... E. H „.., ,-,:g -,1-1 H
,, . ii " „ -0 Ea 11 c, m
0.-_, ,-- ,- 9 - CO CV •-■ CV C. CM CV CO
0 Ca. 11 11 : s
a 11 C.4 Cr) „. Cal CV I I .... I.))11
Lig Et u ,.
,. 0 11 " ,- to c, an to cm to to to to to Cr) --. to cm to en cm ca a, om
11 u cm to Cal N
.. .. u u N „
u6
11 to cr. c- ..c. to co, en CO ... ..c. c- on c- c, c., co co ,- co c- oo C..- CV Cal
6 "
Cl. n 1 1 I I
g. N C--„ „ to „, „, 0.)„ „„ -, to CC) -r, „. Hc--2 . ••••• H n
!I ,.., e H
to 0, Cr) ,- -, co ,, to - ,- 0. o ,_ 0. 0, „
-- • -- to -- -- to c. " o ...„. e,
c=5 t H N co N :1 "
„„ „. - -, ..„. __, „ „. „ .. - ,. ., .g.; ga " " ..,, ,, o o 117 .;.: "' la 11 -'"
o
0 „ ''.5 '''l il g tt
li .. 0. .0 .0 ..„, .0 „„ .-, 0, 0„ 0, c" .. e. .0 . .0 „0 ,.. „„ --
-, -- -
I I I I
x..2 . c5 o; oS c, c...5 ---; cr; cS c7, cS cS c-7 c5 =6' o'.00$c N ,,s c=7, 0.
11 -4 c cc; c- c- cS c..5 c
-o r! ,, oo CV cm cm cn
S. Era gi 11
11 I. .- ..4 cS -4 cS ,r: ,3 c.i .sc5 cc -.1, a6 ,4
t o o 1
a I i
0 o c5 c5 c5 co c; c> cS c5 cc. c. c, co C0 G. C7 cn cm cm cm cm cm
OS OS C ma ma
Ccm 0H -'
o H c5 cS .--. co 0. .. ,,
I
11 2re
1 1
II I
11
t4r. 11 c. o o
c=7. =3 c5 c5 e5 cz; cS c5 c5 C5 C5 C5 =E; C5 C5
C, m a a a a a c. c. a a a a c. c.: a a a c. a a c.: m
dE 'e II 050 05 CS cz; c5 c5 c5 cS c.; cr;•c5 05 0)
= u 1 (,) . -, - ._. .. .. , - C5 •C. C7, .--o ..-4 cCa .,.i.
= ara 11 c5 cS c5 cS cS ci co cS c5 cS c5 cS c. c5 co cS cc. c5 c> H
M M to 0, to C..-1 V- ....4 “, CO Co 44, LC. to LC. .--1 C,-1 .--. C-- to to LC, II
,, 1 i
a _ _. d - .. „, _, t.-1 - ,, -, „, -, ,, „„ - „„ „„ .. ..., c- o o „ o o „ o ,..; ..„7. c5 cs -; co ''' , 10... ■ 1
ae 3 a:pi re; a3 2
cm
, r.4 . -v-r,
m Pay,. .atl. -al: ..*: a-5 co-3 Ci op-. .--, ,..5, rs5 ,,i to
i i
7 cScS
, e5 c5 I i
cS cS cS cc; cS c5 c5 cc; C.; cS cc> c, cS
H c) we ..--S - - C n tri mr; e5H c-- c-- e.- c-- c---
" " cc 11 c, cLop, c, 0- 0- cL 0- c, 0.. 0... ... 0.... ... cL 0... cL 0.. c. c,... 0. c, 11 . . . . . . . . . . . . ,.; . . . . . . . . .
:1 “, co RI RI RI en to to a-, cu cuwa, cua,cucucucu.,4 .22,cucucucuw .cu cu am ca
2E: 11 fa.. an
a
.x= c.
C3 0 C. C. C. C, C, C, C, C. C. C, C, C, C. C, C. O.. C.. c,
C., 0 0 0 0 0 0 0 0 0 0 0 C> 0 0 0 0
CCC11 m, u,
C 00 CO■, ■T ■T a, ar a, a, a, a, ar. a, a, a, a, ar a,
00 CO CO 00 CO 00 CO 00 00 00 00 00 00 CO 00 CO 00 00 00 CO
I I
11
-ra
CV.
a
oe cm cm o cm a a gF; E.:;' os .77 g;"-; g;., H C3 !--:, M H c, co 0, ,, -, o LC> Cr. CO
CV CV U. a■-• cm con a cm a c•-• a- ox, ,3 tr, Po- -torma .a. co r ,4
,-, coos ....p,.clo.. a .r....., .....,.. c-- 8 o .,, a- C. ci ,..? ,S co-5 '.5 , -; ,r: r,', a.5 '.5 r--; --5
cm cm to c5
cc C.
I 1 CM
,4 -4
0000 cS a en cn .--. c--
.--. .-4 ma cm -4 ,4 =; a3 ac, ,o cm cm ,, Lot,
.-4 ,S o-4 CS cS ,=5 -7' '5 "-4 Illo i .-4 c'S 1 .. :: ., „. Hi
Il il
5 :7_,
0 0000 ., ., ,_,
::.: - 11 12
N li g
1 I
i 1
-co
_
....
voro c
07.1 :7. 1: Pm
C. :I 0'
.1!"7:1 .:2a..-75' '' cy
= !
I
I
I g
>1 Ca
.■.a
'ag
.
11 R
.. n • H_. 03 0 CC
C3 CO
El S ii '''.2 I I ' E _, d -,..
: 1 = CO = 11 y 0
C-,
APPENDIX 3 Whole rock analysis by McPhie, 1984, of Rhyolite Ignimbrites from the Currabubula Formation.

SAMPLE NUMBER
SAMPLE TYPE
SAMP. AEC LOCATION BY meq
Si02 %
TiO2 Al203 Fe203 MnO % % % %
MgO %
CaO %
Na20 %
K20 %
P205 %
LOI %
TOTAL %
W8 Rock Chip Scholfield Creek JH 141 69.04 0.22 11.58 0.90 0.01 1.19 1.62 1.96 0.86 0.02 12.41 99.82 W9 Rork Chip Scholfield Creek JH 151 10.07 0.21 11.39 0.93 0.01 1.20 1.62 1.70 0.96 0.01 12.24 100.35 W10 Rock Chip Scholfield Creek JH 149 69.10 0.21 11.65 0.91 0.01 1.08 2.35 1.13 0.91 0.03 12.17 99.55 W11 Rock Chip 4km NE Mowbray JH 142 70.04 0.16 11.11 0.78 0.02 1.02 1.72 1.23 0.82 0.01 11.98 98.89
Mean 69.56 0.20 11.43 0.88 0.01 1.12 L83 1.51 0.89 0.02 12.20 99.65 Stand Deviation 0.57 0.03 0.24 0.07 0.00 0.09 0.35 0.39 0.06 0.01 0.18 0.61 Sample Count 4 4 4 4 4 4 4 4 4 4 4 4
SAMPLE NUMBER
As Ba Ce Cr Cu Ga La Nb Nd Ni Pb Rb Sc Sr Th U V Y Zn Zr PPm PPm PPm PPm PPm PPm PPm PPm PPm PPm PPm PPm PPm PPm PPm PPm PPm PPm PPm PPm
W8 10 2203 55 8 10 13 35 12 28 7 13 18 3 2453 25 9 7 30 35 172 W9 5 2811 56 18 10 15 25 10 31 7 10 18 5 2387 25 5 13 31 38 156 W10 8 6784 36 13 8 13 24 11 23 6 14 21 3 1718 21 5 17 31 34 184 W11 12 9551 48 17 8 9 45 11 39 6 19 20 4 2763 24 7 22 33 16 108
- --- Mean 8.8 5337.3 48.8 14.0 9.0 12.5 32.3 11.0 30.3 6.5 14.0 19.3 3.8 2330.3 23.8 6.5 14.8 31.3 30.8 155.0 Stand Deviation 3.0 3466.7 9.2 4.5 1.2 2.5 9.8 0.8 6.7 0.6 3.7 1.5 1.0 439.9 1.9 1.9 6.3 1.3 10.0 33.4 Sample Count 4 4 4 4 4 4 4 4 4 4 4 4 4 4 4 4 4 4 4 4
- NEAR WILLOWS, Ducabrook Formation, Drummond Basin, Q1d. All Whole rock, Analysis by P. Flood, U.N.E. AEC > 70 meq/100g
APPENDIX 4 Whole rock analysis zeolite sample from near Willows, Ducabrook Formation, Drummond Basin, Qld.
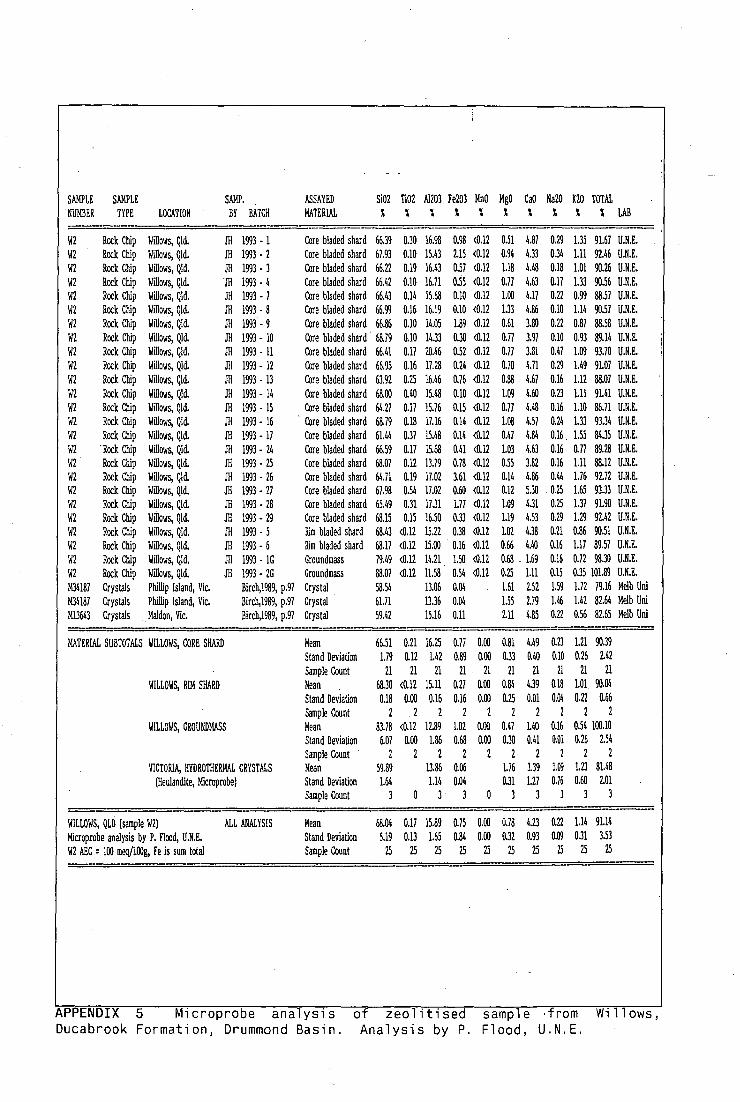
SAMPLE SAMPLE SAMP. NUMBER TYPE LOCATION BY BATCH
ASSAYED MATERIAL
SiO2 S
TiO2 Al203 1e203 Mn0 MgO CaO Na20 K20 TOTAL S % S S S S S S % LAB
W2 Rock Chip Willows, Qld. Jil 1993 - 1 Core bladed shard 66.39 0.30 16.98 0.98 <0.12 0.51 4.87 0.29 1.35 91.67 U.N.E. W2 Rock Chip Willows, Qld. JH 1993 - 2 Core bladed shard 67.93 0.10 15.43 2.15 <0.12 0.94 4.33 0.34 1.11 92.46 U.N.E.
Rock Chip Willows, Qld. Jli 1993 - 3 Core bladed shard 66.22 0.19 16.43 0.57 <0.12 118 4.48 0.18 1.01 90.26 U.N.E. W2 Rock Chip Willows, Qld. JH 1993 - 4 Core bladed shard 66.42 0.10 16.71 0.55 <0.12 037 4.63 0.17 1.33 90.56 U.N.E. W2 Rock Chip Willows, Qld. JH 1993 - 1 Core bladed shard 66.43 0.14 15.68 0.10 <0.12 100 4.11 0.22 0.99 88.51 U.N.E. W2 Rock Chip Willows, Qld. JH 1993 - 8 Core bladed shard 66.99 0.16 16.19 0.10 <0.12 1.33 4.86 0.10 1.14 90.57 U.N.E. W2 Rock Chip Willows, Qld. J11 1993 - 9 Core bladed shard 66.86 0.10 14.05 1.89 <0.12 0.61 3.80 0.22 0.87 88.58 U.N.E. W2 Rock Chip Willows, Qld. JH 1993 - 10 Core bladed shard 68.19 0.10 14.33 0.30 <0.12 0.17 3.97 0.10 0.93 89.14 U.N.E. W2 Rock Chip Willows, Qld. JH 1993 - 11 Core bladed shard 66.41 0.17 20.46 0.52 <0.12 0.77 3.81 0.47 1.09 93.10 U.N.E. W2 Rock Chip Willows, Qld. JH 1993 - 12 Core bladed shard 66.95 0.16 17.28 0.24 <0.12 0.10 4.71 0.29 1.49 9107 U.N.E. W2 Rock Chip Willows, Qld. JH 1993 - 13 Core bladed shard 63.92 0.25 16.46 0.76 <0.12 0.88 4.67 0.16 1.12 88.07 U.N.E. W2 Rock Chip Willows, Qld. JH 1993 - 14 Core bladed shard 68.00 0.40 15.48 0.10 <0.12 109 4.60 0.23 111 9141 U.N.E. W2 Rock Chip Willows, Qld. JH 1993 - 15 Core bladed shard 64.21 0.17 15.76 0.15 <0.12 0.77 4.48 0.16 1.10 86.71 U.N.E. W2 Rock Chip Willows, Qld. JH 1993 - 16 Core bladed shard 683 0.18 17.16 0.14 <0.12 108 4.57 0.24 133 93.34 U.N.E. W2 Rock Chip Willows, Qld. JH 1993 - 17 Core bladed shard 61.44 0.37 15.48 0.14 <0.12 0.47 4.84 0.16 1.55 84.35 U.N.E. W2 "Rock Chip Willows, Qld. JH 1993 - 24 Core bladed shard 66.59 0.17 15.68 0.41 <0.12 103 4.63 0.16 0.77 89.28 U.N.E. W2 Rock Chip Willows, Qld. JH 1993 - 25 Core bladed shard 68.07 0.12 13.79 0.78 <0.12 0.55 3.82 0.16 1.11 88.12 U.N.E. W2 Rock Chip Willows, Qld. JH 1993 - 26 Core bladed shard 64.71 0.19 11.02 3.61 <0.12 0.14 4.86 0.44 1.76 92.72 U.N.E. W2 Rock Chip Willows, Qld. JH 1993 - 27 Core bladed shard 67.98 0.54 17.02 0.60 <0.12 0.12 5.30 0.25 1.65 93.33 U.N.E. W2 Rock Chip Willows, Qld. JH 1993 - 28 Core bladed shard 65.49 0.31 11.31 1.77 <0.12 1.09 4.31 0.25 137 9190 U.N.E. W2 Rock Chip Willows, Qld. JH 1993 - 29 Core bladed shard 68.15 0.15 16.50 0.33 <0.12 119 4.53 0.29 1.29 92.42 U.N.E. W2 Rock Chip Willows, Qld. JH 1993 - 5 Rim bladed shard 68.43 <0.12 15.22 0.38 <0.12 102 4.38 0.21 0.86 90.51 U.N.E. W2 Rock Chip Willows, Qld. JH 1993 - 6 Rim bladed shard 68.17 <0.12 15.00 0.16 <0.12 0.66 4.40 0.16 1.17 89.57 U.N.E. W2 Rock Chip Willows, Qld. .111 1993 - 10 Groundmass 79.49 <0.12 14.21 150 <0.12 0.68 169 0.16 0.12 98.30 U.N.E. W2 Rock Chip Willows, Qld. JH 1993 - 2G Groundmass 88.07 <0.12 11.58 0.54 <0.12 0.25 1.11 0.15 0.35 101.89 U.N.E. 1434187 Crystals Phillip Island, Vic. Birch,1989, p.91 Crystal 58.54 13.06 0.04 1.61 2.52 1.59 1.72 79.16 Melb Uni 1434181 Crystals Phillip Island, Vic. Birch,1989, p.97 Crystal 61.71 13.36 0.04 1.55 2.79 1.46 1.42 82.64 Melb Uni 1413643 Crystals Maldon, Vic. Birch,1989, p.97 Crystal 59.42 15.16 0.11 2.11 4.85 0.22 0.56 82.65 Melb Uni
MATERIAL SUBTOTALS WILLOWS, CORE SHARD Mean 66.51 0.21 16.25 0.17 0.00 0.81 4.49 0.23 1.21 90.39 Stand Deviation 179 0.12 142 0.89 0.00 0.33 0.40 0.10 0.26 2.42 Sample Count 21 21 21 21 21 21 21 21 21 21
WILLOWS, RIM SHARD Mean 68.30 <0.12 15.11 0.27 0.00 0.84 4.39 0.18 101 90.04 Stand Deviation 0.18 0.00 0.16 0.16 0.00 0.25 0.01 0.04 0.22 0.66 Sample Count 2 2 2 2 2 2 2 2 2 2
WILLOWS, GROUNDMASS Mean 83.78 <0.12 12.89 102 0.00 0.47 140 0.16 0.54 100.10 Stand Deviation 6.07 0.00 186 0.68 0.00 0.30 0.41 0.01 0.26 2.54 Sample Count 2 2 2 2 2 2 2 2 2 2
VICTORIA, HYDROTHERMAL CRYSTALS Mean 59.89 13.86 0.06 176 3.39 109 123 81.48 (Heulandite, Microprobe) Stand Deviation 1.64 1.14 0.04 0.31 1.27 0.76 0.60 2.01
Sample Count 3 0 3 3 0 3 3 3 3 3
WILLOWS, QLD (sample W2) ALL ANALYSIS Mean 68.04 0.11 15.89 0.75 0.00 0.78 4.23 0.22 1.14 9114 Microprobe analysis by P. Flood, U.N.E. Stand Deviation 5.19 0.13 1.65 0.84 0.00 0.32 0.93 0.09 0.31 3.53 W2 AEC L. 100 meq/100g, Fe is sum total Sample Count 25 25 25 25 25 25 25 25 25 25
APPENDIX 5 Microprobe analysis of zeolitised sample from Willows, Ducabrook Formation, Drummond Basin. Analysis by P. Flood, U.N.E.

SAMPLE SAMPLE ASSAYED S102 Al203,FeO Mn0 MgO CaD 1420 820 TOTAL NUMBER TYPE LOCATION BATCH MATERIAL % % % % %
R17685 Drill Chips Mcorbannool Bore 8, 129m Duddy'88,Table9.3-15 Crystal 63.69 15.15 0.16 1.23 3.11 0.55 1,33 86.40 R17685 Drill Chips Moorbannool Bore 8, 129m Duddy'88,Table9.3-16 Crystal 62.91 15.73 0.20 0.05 1.27 2.99 041 1.47 85.71 1117685 Drill Chips Mcorbannool Bore 8, 129: Duddy'88,Table9.3-17 Crystal 65.25 15.48 0.18 0.03 1.44 3.1 0.15 1.21 87.69 1117685 Drill Chips Mcorbannool Bore 8, 129m Duddy'88,Table9.3-18 Crystal 63.42 14.95 0.16 1.61 2.21 0.39 1.72 86.51 1117685 Drill Chips Moorbannool Bore 8, 12,9m Duddy'88Table9.3-19 Crystal 65.58 15.36 0,20 1.61 3.08 0.16 1.38 07.86 825078 Drill Chips Yangery 1, 976: Duddy'88,Table9.5-10 Crystal 61.19 1465 0.35 0.68 3.68 0.41 0.32 84.12 R25078 Drill Chips Yangery I, 976m Du dd y'88,Tab le9.5 -11 Crystal 61.94 14.75 0.95 0.98 3.70 0.35 0.99 85.35 1125078 Drill Chips Yangery I t 976m Duddy'88,Table9.5-12 Crystal 63.20 14.97 0.10 0.48 3.85 0.47 0.24 86.19 1125078 Drill Chips Yangery 1, 976m Duddy'88,Table9.5-13 Crystal 6247 14.68 0.22 0.38 3.97 0.64 0.26 85.23 1125078 Drill Chips Yangery 1, 976m Duddy'88,Table9.5-9 Crystal 63.46 14.84 0.27 0.07 0,43 3.81 0.32 0.1 85.82 1125087 Drill Chips Corriejong I, 1096m Duddy'88,Table9.5-14 Crystal 59.88 17.37 0.09 0,04 0.13 3.73 0.33 0.25 87.08 R25087 Drill Chips Corriejong 1, 1096: Duddy'88,Table9.5-15 Crystal 62.67 15.04 0.23 0.32 2.74 0.70 0.31 98.92 1125194 Drill Chips Yangery 1, 922m Duddy'88,Table9.5-8 Crystal . 59.26 15.31 0.21 0.25 0.91 5.03 0.37 0.59 84.78 1125312 Drill Chips Gerangamete 13, 556m Duddy'88,Table9.5-6 Crystal 60.48 17.24 0.37 0.03 1.24 2.52 0.56 1.50 86.40 1125312 Drill Chips Gerangamete 13, 556m Duddy'88,Table9.5-7 Crystal 58.76 17.49 0.19 0.05 1.39 3.22 0.40 1.31 85.48 1125321 Drill Chips Tullich 1, 166m Dudd y'813,Table9.5-1 Crystal 63.25 15.45 0.16 0.04 1.05 1.93 1.27 1.74 85.70 1125321 Drill Chips Tullich 1, 166m Duddy'88,Table9.5-2 Crystal 62.11 15.96 0.26 1.06 2.23 3.14 1.70 87.32 1125321 Drill Chips Tuilich 1, 166: Duddy138,Table9.5-3 Crystal 62.47 15.21 0.15 1.04 2.12 1.57 1.35 84.82 1125321 Drill Chips Tullich 1, 166: Dudd y'88,Table9.5-4 Crystal 63.51 1436 0.12 1,18 1.78 1.11 1.87 84.49 1125321 Drill Chips Tullich 1, 166m Duddy'138,Table9.5-5 Crystal 61.22 15.67 0.34 1.12 2.06 1.78 1.80 85.21 1126419 Drill Chips Flaxman's 1, 2350: Duddy'88,Table9.5-16 Crystal 59.34 14.72 0.68 5.61 0,33 0.29 86.76 1126419 Drill Chips Flanan's 1, 2350m Duddy'88,Table9.5-17 Crystal 57.81 15.93 0.50 5.53 0.60 0.28 85.65 1125020 Rock Chip Loc, 65 Duddy'83,Table9.3-5 Crystal 62.24 15.02 0.20 1.23 3.94 0.38 1.52 84.53 1125020 Rock Chip Loc. 65 Duddy'83,Table9.3-6 Crystal 61,27 14.96 0.34 0.04 1,35 3,57 9.41 1.58 83.72 025020 Rock Chip Loc. 65 Duddy'83,Table9.3-7 Crystal 66.13 15.57 0.44 0.07 0.52 3.16 0,38 1.59 88.86 1125020 Rock Chip Leo. 65 Duddy'83,Table9.3-8 Crystal 62.97 15.28 0.21 0.86 0.21 4.21 0.39 1.83 86.47 112501 Rock Chip Loc. 65 Duddy'83,Table.9.3-9 Crystal 62.89 1489 0.63 0.03 0.52 3.70 0.89 1.66 86.46 1125297 P,ock Chip Loc. 157A Duddy'83,Table9.3-10 Crystal 59.95 14.96 0.26 0.06 0.54 3.74 0.18 1.66 85.65 1125227 Rock Chip Loc. 157A Dudd y'83,Table9.3 -11 Crystal 59.03 15.92 0.19 0.44 3.36 0.13 1.46 86.17 1125287 Rock Chip Loc. 157A Duddy'83,Table9.3-12 Crystal 61.45 14.65 0.12 0.32 3.87 0.24 1.42 87.92 1125373 Rock Chip Loc. 224 Duddy'83,Table9.3-13 Crystal 59.49 15.27 0.12 1.29 2.68 223 2.53 84.63 825373 Rock Chip Loc. 204 Duddy'83,Table9.3-14 Crystal 59.18 16.15 1.10 2.66 2.22 2.01 84.85 1126441 P.ock Chip loc. 15 Duddy'83,Table9.3-1 Crystal 57.86 16.49 0.37 1.38 2.86 1.74 2.46 8404 112E441 Rock Chip Loc. 15 Duddy'83,Table9.3-2 Crystal 59,96 10.35 0.35 0.05 1.47 1.96 1.19 2.70 12.09 1126441 Rock Chip Loc. 15 Duddy'83,Table9.3-3 Crystal 59.19 15.06 1.08 0.14 1.21 1.56 1.53 2,99 84.36 1126458 Rock Chip Loc. 30 Duddy'83,Table9.3-4 Crystal 59.15 16.03 0.09 0.97 1.87 2.41 0.85 84.12 R19335 Rock Chip Loc. 153 Duddy'83,Table9.4-3 Crystal in Concretion 59.70 1471 . 0.05 1.10 1.76 2,76 3.29 94.35 1119335 Rock Chip loc. 153 Duddy'83,Table9.4-4 Crystal in Concretion 63.10 15.25 0.10 1.23 1.83 2.01 4.58 88.92 1119335 Rock Chip Loc. 153 Duddy'83,Table9.4-5 Crystal in Concretion 62.1 15,06 0.11 0.08 0.97 1.91 2.41 3.30 87.01 1125139 Rock Chip Loc. 14 Duddy'83,Table9.4-10 Crystal in Concretion 62.52 14.63 0.16 0.03 L33 3.45 0.41 0.92 £4.13 1125139 Rock Chip Loc. 14 Duddy'83,Table9.4-11 Crystal in Concretion 61.83 14,50 0.14 0.05 1.42 3.39 0.31 1.37 83.22 1125139 Rock Chip LOC. 14 Duddy'83,Table9.4-12 Crystal in Concretion 59.44 15.01 0.14 0.22 L45 5.20 0.66 1.83 84.31 825139 Rock Chip Loc. 14 Duddy'83,Table9.4-9 Crystal in Concretion 61.82 14.77 0.11 0.16 1.39 5.49 0.59 1.56 86.24 1125366 Rock Chip Loc. 204 Duddy'83,Table9.4-7 Crystal in Concretion 65.12 14,54 0.19 0.07 1.21 0.96 2,31 3.14 87.85 1125366 Rock Chip Loc. 224 Duddy'83,Table9,4-8 Crystal in Concretion 63.38 15.23 0.69 0.09 1.14 1.63 4.03 1.77 88.36 826491 Rock Chip Loc. 110 Duddy'83,Table9,4-6 Crystal in Concretion 68.69 13.30 0.87 0.09 0.36 0.36 2.79 2.19 98.68 1126640 Rock Chip Loc. 194 Duddy'83,Table9.4-1 Crystal in Concretion 65.99 14.09 0.03 0.09 0.97 4.39 0.13 1.54 87.96 1126640 Rock Chip Loc. 194 Duddy'83,Table9.4-2 Crystal in Concretion 63.83 13.73 0.62 0.10 0.91 4.52 0.06 0.98 85.30
MATERIAL SUBTOTALS CRYSTALS, DRILL HOLES Mean 6221 15.47 0.28 0.07 0.98 2.37 0.73 0.98 06.07 Stand Deviation 2.05 0.88 0.1 0,07 0.44 1,07 0.69 0.65 1.19 Sample Count 22 22 22 8 20 22 22 22 22
CRYSTALS, SURFACE Mean 60.77 15.47 0.33 0.06 0.92 3.08 1.66 1.88 85.22 Stand Deviation 2.20 0.61 0.27 0.04 0.47 0.84 2.38 0.59 1.78 Sample Count 14 14 13 7 11 14 11 14 14
CRYSTALS 111 CONCRETIONS (SURFACE) Mean 63.19 1457 0.29 0,09 1.13 2.91 1,55 2.21 86.27 Stand Deviation 2.57 0.60 0.29 0.05 0.30 1.72 1.32 1.13 2.02 Sample Count 12 12 11 11 12 12 12 12 12
_ - °TWAY BASIN (DUDDY, 1983), Vic. ALL S.uJ4PLED Mean 01.94 15.25 0.29 0.93 1.00 3.17 1.21 1.55 85.91 All microprobe analysis, Melb. Uni. Stand Deviation 2.36 0.83 0.24 0,06 0.42 1.21) 1.54 0.94 1.63 Clinoptilolite-Heulandite crystals. Sample Count 48 48 46 26 46 48 18 18 48
APPENDIX 6 Microprobe analysis by Duddy, 1983, of zeolite crystals from Otway Formation, Otway Basin, Victoria.