Geologic Framework, Regional Aquifer Properties … · By Jeff B. Langman, Jesse E. Sprague, and...
108
U.S. Department of the Interior U.S. Geological Survey Scientific Investigations Report 2012–5019 Prepared in cooperation with the U.S. Forest Service Geologic Framework, Regional Aquifer Properties (1940s– 2009), and Spring, Creek, and Seep Properties (2009–10) of the Upper San Mateo Creek Basin near Mount Taylor, New Mexico
Transcript of Geologic Framework, Regional Aquifer Properties … · By Jeff B. Langman, Jesse E. Sprague, and...

U.S. Department of the InteriorU.S. Geological Survey
Scientific Investigations Report 2012–5019
Prepared in cooperation with the U.S. Forest Service
Geologic Framework, Regional Aquifer Properties (1940s–2009), and Spring, Creek, and Seep Properties (2009–10) of the Upper San Mateo Creek Basin near Mount Taylor, New Mexico

Cover: Cibola San Mateo Creek Basin.

Geologic Framework, Regional Aquifer Properties (1940s–2009), and Spring, Creek, and Seep Properties (2009–10) of the Upper San Mateo Creek Basin near Mount Taylor, New Mexico
By Jeff B. Langman, Jesse E. Sprague, and Roger A. Durall
Prepared in cooperation with the U.S. Forest Service
Scientific Investigations Report 2012–5019
U.S. Department of the InteriorU.S. Geological Survey

U.S. Department of the InteriorKEN SALAZAR, Secretary
U.S. Geological SurveyMarcia K. McNutt, Director
U.S. Geological Survey, Reston, Virginia: 2012
This and other USGS information products are available at http://store.usgs.gov/ U.S. Geological Survey Box 25286, Denver Federal Center Denver, CO 80225
To learn about the USGS and its information products visit http://www.usgs.gov/ 1-888-ASK-USGS
Any use of trade, product, or firm names is for descriptive purposes only and does not imply endorsement by the U.S. Government.
Although this report is in the public domain, permission must be secured from the individual copyright owners to reproduce any copyrighted materials contained within this report.
Suggested citation:Langman, J.B., Sprague, J.E., and Durall, R.A., 2012, Geologic framework, regional aquifer properties (1940s–2009), and spring, creek, and seep properties (2009–10) of the upper San Mateo Creek Basin near Mount Taylor, New Mexico: U.S. Geological Survey Scientific Investigations Report 2012–5019, 96 p.

The cooperation of many individuals and organizations was essential for completion of this study. The authors acknowledge the support and help of personnel from the USFS’s Cibola National Forest. In particular, Mary Dereske and Livia Crowley who helped guide this study and provided useful insight for completion of study goals. Additionally, the authors wish to thank Harry Lee for allowing access to the springs, creeks, and seeps on the Lee Ranch and his insight into the hydrologic resources of the target area.


v
ContentsAbstract ..........................................................................................................................................................1Introduction ....................................................................................................................................................1
Purpose and Scope .............................................................................................................................2Description of the Study Area ...........................................................................................................2
Structural and Surface Geology ...............................................................................................3Subsurface Geology ...................................................................................................................6Climate and Surface Hydrology ................................................................................................6Groundwater Hydrology and Primary Aquifers .....................................................................6
Valley Alluvium and Menefee Formation .......................................................................7Point Lookout, Crevasse Canyon, Gallup, Dakota, and Morrison Formations .........8Chinle Group .......................................................................................................................9San Andres and Glorieta Formations .............................................................................9
Human Influence on Water Resources ...................................................................................9Previous Studies ................................................................................................................................10
Study Methods ............................................................................................................................................10Existing Data .......................................................................................................................................10New Data .............................................................................................................................................11Quality-Assurance .............................................................................................................................14
Geologic Framework and Regional Aquifer Properties ........................................................................15San Mateo Creek Basin Geology ....................................................................................................15Hydraulic Properties of Major Aquifers .........................................................................................15
Horizontal Flow ..........................................................................................................................15Water-Level Elevations ............................................................................................................21Hydraulic Conductivity .............................................................................................................22
Groundwater Composition of Major Aquifers ...............................................................................22Major Elements .........................................................................................................................22Trace Elements ..........................................................................................................................25Contaminants of Concern ........................................................................................................25
Spring, Creek, and Seep Properties of the Upper San Mateo Creek Basin, New Mexico, 2009 and 2010 .................................................................................................................................26
Spring, Creek, and Seep Flow ..........................................................................................................26Spring, Creek, and Seep Water Composition ................................................................................27
Water Isotopes and Evaporation ............................................................................................30Major Elements .........................................................................................................................31Saturation Indices ....................................................................................................................31Creek Flow Paths and Geochemical Model of Transition from Creek to Seep ...............32
Summary .......................................................................................................................................................35References ...................................................................................................................................................36Appendixes 1. Historical Groundwater-Elevation Data .................................................................................41 2. Historical Groundwater Major-Element Data .......................................................................53 3. Historical Groundwater Trace-Element Data ........................................................................65 4. Historical Groundwater Contaminants-of-Concern Data ...................................................79

vi
Figures 1. Map showing location of the upper San Mateo Creek Basin ..............................................2 2. Map showing regional geologic structural areas, study area, and target area ...............3 3. Map showing San Mateo Creek Basin in the regional landform ........................................4 4. Map showing regional surface geology ..................................................................................5 5. Generalized stratigraphic column of the subsurface geology below the valley forms
in the southern San Juan Basin ................................................................................................7 6. Geologic cross section from west to east through the upper San Mateo Creek
Basin ..............................................................................................................................................8 7. Map showing sampling sites and surface topography of the upper San Mateo
Creek Basin .................................................................................................................................12 8. Map showing surface geology of the upper San Mateo Creek Basin .............................18 9. Map showing relative differences in water-level elevations for the distribution of
water-level data compiled for wells with screens located in the Quaternary alluvium .......................................................................................................................................19
10. Map showing relative differences in water-level elevations for the distribution of water-level data compiled for wells with screens located in Cretaceous, Jurassic, Triassic, and Permian formations ...........................................................................................20
11. Trilinear diagrams of major-element relations for groundwater collected from the deposits and formations found in the study area .................................................................24
12. Graphs showing landform gradients between sampling sites on El Rito and San Mateo Creeks and underlying geologic formations .............................................................27
13. Graph showing dissolved oxygen and pH relation for water from El Rito, San Lucas, and San Mateo Creeks .............................................................................................................30
14. Graph showing stable isotope ratios for water from El Rito, San Lucas, and San Mateo Creeks .............................................................................................................................31
15. Trilinear diagram of major-element relations for water from El Rito, San Lucas, and San Mateo Creeks .....................................................................................................................32
Tables 1. Information for the spring-, creek-, and seep-sample sites in the upper San Mateo
Creek Basin .................................................................................................................................13 2. Sample analytes and laboratory analysis methods .............................................................14 3. Stratigraphic, lithologic, and aquifer characteristics of geologic deposits and
formations in the study and target areas ...............................................................................16 4. Water-level elevation statistics for aquifers in consolidated formations in the study
area ..............................................................................................................................................21 5. Formation characteristics indicative of horizontal hydraulic-conductivity variation
among the aquifers in the study area .....................................................................................23 6. Number of detections of frequently detected trace elements in groundwater from
the study area .............................................................................................................................25 7. Number of detections of contaminants of concern in groundwater from the study
area ..............................................................................................................................................26 8. Physical and chemical properties of springs, creeks, and seeps within the target
area, August 2009 ......................................................................................................................28

vii
9. Physical and chemical properties of springs, creeks, and seeps within the target area, May 2010 ...........................................................................................................................29
10. Saturation indices of possible common minerals for water collected from the spring, creek, and seep locations along El Rito Creek in the target area ........................33
11. Saturation indices of possible common minerals for water collected from the spring, creek, and seep locations along San Mateo Creek in the target area ................33
12. Geochemical model results for creek to seep locations along El Rito and San Mateo Creeks .............................................................................................................................34
Conversion Factors, Datums, and Abbreviations
Inch/Pound to SI
Multiply By To obtain
inch 2.540 centimeter (cm)
foot (ft) 0.3048 meter (m)
yard (yd) 0.9144 meter (m)
mile (mi) 1.609 kilometer (km)
acre 4,047 square meter (m2)
gallon (gal) 3.785 liter (L)
foot per day (ft/d) 0.00035 centimeters per second (cm/s)
foot per year (ft/yr) 9.7xl0-7 centimeters per second (cm/s)
foot squared per day (ft2/d) 0.09290 meter squared per day (m2/d)
cubic feet per second (ft3/s) 0.0283 cubic meters per minute (m3/s)
acre-feet per year (acre-ft/yr) 1,233 cubic meter per year (m3/yr)
Temperature in degrees Celsius (ºC) can be converted to degrees Fahrenheit (ºF) as follows:
ºF = (1.8 x ºC) + 32
Vertical coordinate information is referenced to the North American Vertical Datum of 1988 (NAVD 88).
Horizontal coordinate information is referenced to the North American Datum of 1983 (NAD 83).
Specific conductance is given in microsiemens per centimeter at 25 degrees Celsius (µS/cm).
Abbreviations
< less than
> greater than
% percent
‰ per mil
± plus or minus
Ag silver
Al aluminum

viii
As arsenic
B boron
Ba barium
Be beryllium
BrCCO
2
Ca
brominecarboncarbon dioxidecalcium
Cd cadmium
Cl chloride
Cr chromium
Co cobalt
Cu copperδ delta, indicates isotopic ratio compared to standard, in per mil units
F fluoride
Fe iron
H hydrogen
HCO3
bicarbonate
Hg mercury
IAP ion activity product
K potassium
K hydraulic conductivity
Ksp
solubility product
Li lithium
Ma million years before present
MDL method detection level
Mg magnesium
Mn manganese
Mo molybdenum
Na sodium
Ni nickel
NO3
nitrate (may also include nitrate plus nitrite)
NTU nephelometric turbidity unit
O oxygen
Pb lead
Ra radium
redox reduction-oxidation
Sb antimony
SeSi
seleniumsilicon
SO4
sulfate
TDS total dissolved solids
Tl thallium
U uranium
USEPA U.S. Environmental Protection Agency
USFS U.S. Forest Service
USGS U.S. Geological Survey
V vanadium
Zn zinc

AbstractThe U.S. Geological Survey, in cooperation with the U.S.
Forest Service, examined the geologic framework, regional aquifer properties, and spring, creek, and seep properties of the upper San Mateo Creek Basin near Mount Taylor, which contains areas proposed for exploratory drilling and possible uranium mining on U.S. Forest Service land. The geologic structure of the region was formed from uplift of the Zuni Mountains during the Laramide Orogeny and the Neogene volcanism associated with the Mount Taylor Volcanic Field. Within this structural context, numerous aquifers are present in various Paleozoic and Mesozoic sedimentary formations and the Quaternary alluvium. The distribution of the aquifers is spatially variable because of the dip of the formations and erosion that produced the current landscape configuration where older formations have been exhumed closer to the Zuni Mountains.
Many of the alluvial deposits and formations that contain groundwater likely are hydraulically connected because of the solid-matrix properties, such as substantive porosity, but shale layers such as those found in the Mancos Formation and Chinle Group likely restrict vertical flow. Existing water-level data indicate topologically downgradient flow in the Quater-nary alluvium and indiscernible general flow patterns in the lower aquifers. According to previously published material and the geologic structure of the aquifers, the flow direction in the lower aquifers likely is in the opposite direction compared to the alluvium aquifer. Groundwater within the Chinle Group is known to be confined, which may allow upward migration of water into the Morrison Formation; however, confining layers within the Chinle Group likely retard upward leak-age. Groundwater was sodium-bicarbonate/sulfate dominant or mixed cation-mixed anion with some calcium/bicarbon-ate water in the study area. The presence of the reduction/oxidation-sensitive elements iron and manganese in ground-water indicates reducing conditions at some time or in some location(s) in most aquifers. Frequent detections of zinc in the alluvium aquifer may represent anthropogenic influences such as mining.
Along the mesas in the upper San Mateo Creek Basin, springs that form various creeks, including El Rito and San Mateo Creeks, discharge from the basalt-cap layer and the upper Cretaceous sedimentary layers. Streamflow in El Rito and San Mateo Creeks flows down steep gradients near the mesas sustained by groundwater discharges, and this stream-flow transitions to shallow groundwater contained within the valley alluvium through infiltration where the subse-quent groundwater is restricted from downward migration by the shaly Menefee Formation. This shallow groundwater reemerges at seeps where the land surface has been eroded below the groundwater level. Spring- and creek-water samples contained small amounts of dissolved solutes, and seep water contained substantially larger amounts of dissolved solutes. The pH of water within the creeks was neutral to alkaline, and all locations exhibited well-oxygenated conditions, although typically at substantially less than saturated levels. Changes in the stable-isotope ratios of water between spring and summer samples indicate differences in source-water inputs that likely pertain to seasonal recharge sources. Results of the water-isotope analysis and geochemical modeling indicate little evaporation and chemical weathering at the spring and creek sites but stronger evaporation and chemical weathering by the time the water reaches the seep locations in the center of the upper San Mateo Creek Basin.
IntroductionThe water resources of the San Mateo Creek Basin
(fig. 1) are important to the citizens of New Mexico, in particular, the town of San Mateo and the city of Grants, for potable-water sources. Citizens and tribal groups in this area are concerned about the possible effects on the water resources from exploratory drilling and possible mining of uranium (U) as currently (2011) proposed by various companies. Uranium mining in this region has historically targeted members of the Morrison Formation, and previous mining operations dewa-tered aquifers at and above the ore. Water generated during dewatering was discharged to natural waterways without
Geologic Framework, Regional Aquifer Properties (1940s–2009), and Spring, Creek, and Seep Properties (2009–10) of the Upper San Mateo Creek Basin near Mount Taylor, New Mexico
By Jeff B. Langman, Jesse E. Sprague, and Roger A. Durall

2 Geologic Framework, Regional Aquifer Properties (1940s–2009), and Spring, Creek, and Seep Properties (2009–10)
treatment, because much of the U mining occurred prior to major environmental legislation such as the Clean Water Act. This mine water was a substantial source of contamination of sediment, alluvial aquifers, and deeper aquifers in areas of faulting (Schoeppner, 2008). The New Mexico Environ-ment Department has issued a health advisory for current and future private wells within the San Mateo Creek Basin concerning various contaminants of concern including gross alpha activity, nitrate (NO3), radium (Ra), and U (New Mexico Environment Department, 2009). The U.S. Geological Survey (USGS), in cooperation with the U.S. Forest Service (USFS), examined the geologic framework; regional aquifer proper-ties; and spring, creek, and seep properties of the upper San Mateo Creek Basin near Mount Taylor, which contains areas proposed for exploratory drilling and possible uranium mining on USFS land.
Purpose and Scope
This report presents the results of a study to character-ize the geologic framework; regional aquifer properties; and spring, creek, and seep properties of the upper San Mateo Creek Basin. Existing data (data collected prior to this study; 1940s to 2009) were used to describe groundwater charac-teristics of major aquifers including general directions of groundwater flow and groundwater composition. New data were collected in 2009 and 2010 to characterize the springs, creeks, and seeps within the upper San Mateo Creek Basin. To
evaluate the geologic framework; regional aquifer properties; and spring, creek, and seep properties of the upper San Mateo Creek Basin, the target area of the study (target area) encom-passes the upper San Mateo Creek Basin, but a larger study area composed of parts of the Zuni Uplift and Chaco Slope regions was used to ensure sufficient existing data for evalu-ation of geologic and aquifer properties relevant to the target area (fig. 2).
Description of the Study Area
The study area is composed of the eastern slope of the Zuni Uplift and much of the Chaco Slope region within the southeastern part of the San Juan Basin (fig. 2). The area was a low-lying plain in the late Paleozoic Era and much of the Mesozoic Era, and the landscape was transformed to the current structure mostly because of the Laramide Orogeny during the late Cretaceous age (Woodward and Callender, 1977; Baldwin and Anderholm, 1992; Cather, 2003). Prior to the Laramide Orogeny, the area was part of the Western Interior Basin, a broad foreland basin that subsided partially in response to tectonic loading in the Cordilleran thrust belt, which allowed repeated transgressive-regressive sequences (Cather, 2003). The Zuni Uplift that constitutes the Zuni Mountains was formed during the Ancestral Rockies and Laramide Orogenies (Strickland and others, 2003). The Chaco Slope represents the northeast flank of the Zuni Uplift where formation dip lessens with distance from the apex of the fold.
Figure 1. Location of the upper San Mateo Creek Basin.
Gallup
GrantsCIBOLA NATIONAL FOREST
ThoreauPrewitt
McCartys
San Mateo
MAP LOCATION
NEW MEXICO
San Mateo Creek Basin
SAN
DO
VAL
MCKINLEY
40
40
371
605
547
MCKINLEY
MCKINLEY
CIBOLA
35˚ 30´
35˚ 00´
108˚ 30´ 108˚ 00´ 107˚ 30´
Mount Taylor
Zuni Uplift/Mountains
0 5 10 MILES
0 5 10 KILOMETERS
San Juan Basin
San Juan Basin
CIBOLABluewater
CIBOLA NATIONAL FOREST
Introduction 3
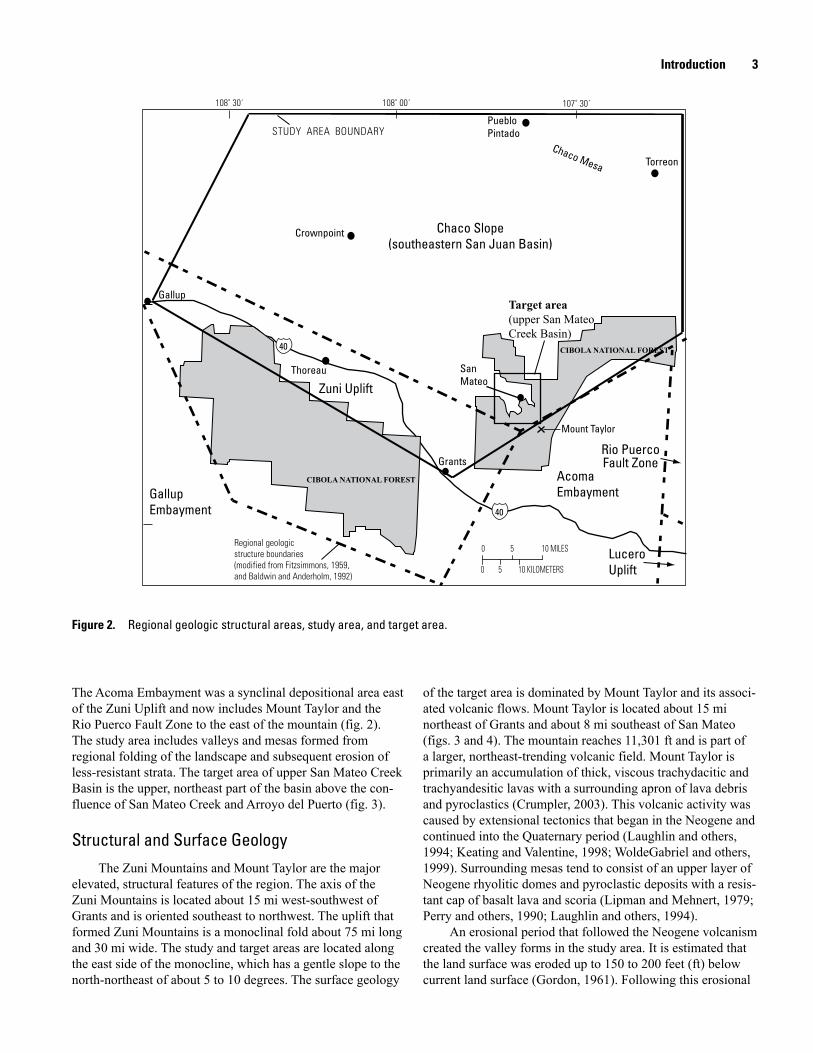
The Acoma Embayment was a synclinal depositional area east of the Zuni Uplift and now includes Mount Taylor and the Rio Puerco Fault Zone to the east of the mountain (fig. 2). The study area includes valleys and mesas formed from regional folding of the landscape and subsequent erosion of less-resistant strata. The target area of upper San Mateo Creek Basin is the upper, northeast part of the basin above the con-fluence of San Mateo Creek and Arroyo del Puerto (fig. 3).
Structural and Surface GeologyThe Zuni Mountains and Mount Taylor are the major
elevated, structural features of the region. The axis of the Zuni Mountains is located about 15 mi west-southwest of Grants and is oriented southeast to northwest. The uplift that formed Zuni Mountains is a monoclinal fold about 75 mi long and 30 mi wide. The study and target areas are located along the east side of the monocline, which has a gentle slope to the north-northeast of about 5 to 10 degrees. The surface geology
of the target area is dominated by Mount Taylor and its associ-ated volcanic flows. Mount Taylor is located about 15 mi northeast of Grants and about 8 mi southeast of San Mateo (figs. 3 and 4). The mountain reaches 11,301 ft and is part of a larger, northeast-trending volcanic field. Mount Taylor is primarily an accumulation of thick, viscous trachydacitic and trachyandesitic lavas with a surrounding apron of lava debris and pyroclastics (Crumpler, 2003). This volcanic activity was caused by extensional tectonics that began in the Neogene and continued into the Quaternary period (Laughlin and others, 1994; Keating and Valentine, 1998; WoldeGabriel and others, 1999). Surrounding mesas tend to consist of an upper layer of Neogene rhyolitic domes and pyroclastic deposits with a resis-tant cap of basalt lava and scoria (Lipman and Mehnert, 1979; Perry and others, 1990; Laughlin and others, 1994).
An erosional period that followed the Neogene volcanism created the valley forms in the study area. It is estimated that the land surface was eroded up to 150 to 200 feet (ft) below current land surface (Gordon, 1961). Following this erosional
Figure 2. Regional geologic structural areas, study area, and target area.
Gallup
Grants
CIBOLA NATIONAL FOREST
Target area(upper San MateoCreek Basin)
40
40
108˚ 30´ 108˚ 00´ 107˚ 30´
Chaco Slope(southeastern San Juan Basin)
AcomaEmbayment
Zuni Uplift
LuceroUplift
Rio PuercoFault Zone
Crownpoint
PuebloPintado
Torreon
San Mateo
Thoreau
CIBOLA NATIONAL FOREST
Chaco Mesa
Regional geologicstructure boundaries(modified from Fitzsimmons, 1959,and Baldwin and Anderholm, 1992)
STUDY AREA BOUNDARY
GallupEmbayment
Mount Taylor
0 5 10 MILES
0 5 10 KILOMETERS

4 Geologic Framework, Regional Aquifer Properties (1940s–2009), and Spring, Creek, and Seep Properties (2009–10)
Figure 3. San Mateo Creek Basin in the regional landform.
San M
ateo C
reek
Rio San Jose
San Miguel C
reek
San L
ucas
Creek
Rinc
onad
a C
reek
Arroyo del Puerto
Rio Paguate
Seboyetita Creek
Lobo Creek
108°00 ' 107°50 ' 107°40 ' 107°30 ' 107°20 '
State of New Mexico lands and trust lands, various designations
Federal lands
San Mateo Creek Basin
Mount Taylor
Zuni Mountains
Laguna Pueblo
San Mateo
Grants
Milan
Acoma Pueblo
McC
arty
Syn
clin
e(H
unt,
1938
)
Base from U.S. Geological Survey digital data, 1:24,000 and 1:500,000. Projection: Universal Transverse Mercator zone 13N, North American Datum of 1983, Vertical Datum North American Vertical Datum of 1988.
MCKINLEYCIBOLA
0 10 20 MILES
0 10 20 KILOMETERS
N
40
40
605
509
53
117
Syncline
Non-differentiated ownership
Developed areasPueblo, reservation, or trust lands
Land grant, undifferentiated
San Mateo Creek
EXPLANATION
El Rito Creek
Target area: upper San Mateo Creek Basin
Lower San Mateo Creek Basin
Lower and upper San Mateo Creek Basin divided at the inflow of the Arroyo del Puerto. The upper San Mateo Creek portion is representative of the target area of the study (heavy dashed lines separate the upper San Mateo Creek Basin from the remainder of the larger San Mateo Creek Basin)
La Jara Mesa
Jesus Mesa
35˚ 30´
35˚ 20´
35˚ 10´
35˚ 00´

Introduction 5
Figure 4. Regional surface geology.
0 10 MILES
0 10 KILOMETERS
108°00 ' 107°50 ' 107°40 ' 107°30 ' 107°20 '
Base from U.S. Geological Survey digital data, 1:24,000 and 1:500,000. Projection: Universal Transverse Mercator zone 13N, North American Datum of 1983.Geology from New Mexico Bureau of Geology and Mineral Resources digital data, 1:500,000.
N
Mount Taylor40
40
605
509
53
117
San Mateo
Grants
A
A’
San M
ateo C
reek
Rio San Jose
JurassicUpper Jurassic, undividedMorrisonLower Jurassic, undivided, may contain Entrada, Todilto, Summerville, and (or) Bluff
Crevasse Canyon
DakotaMancos and Dakota
Gallup
Mancos
CretaceousMenefee
Mancos, lower
Mulatto Tongue, Mancos
Rio Salado Tongue, Mancos
Satan Tongue, MancosHasta Tongue, Point Lookout
Point Lookout
PermianPermian, undivided
Abo
GlorietaSan Andres
Yeso
QuaternaryAlluvium
Basaltic to andesitic lava flowsEolian deposit
Intrusive rocks of intermediate to silicic composition
Basaltic to andesitic lava flows (Miocene)Silicic to intermediate volcanic rocksIntermediate to silicic volcanic rocks
NeogeneBasaltic to andesitic lava flows (Pliocene) Precambrian
Precambrian, undivided
Landslide deposit
TriassicChinle (Group)
EXPLANATION
A--A’ is a trace for a geologic cross section shown in figure 6.
Zuni Mountains
35˚ 30´
35˚ 20´
35˚ 10´
35˚ 00´
6 Geologic Framework, Regional Aquifer Properties (1940s–2009), and Spring, Creek, and Seep Properties (2009–10)
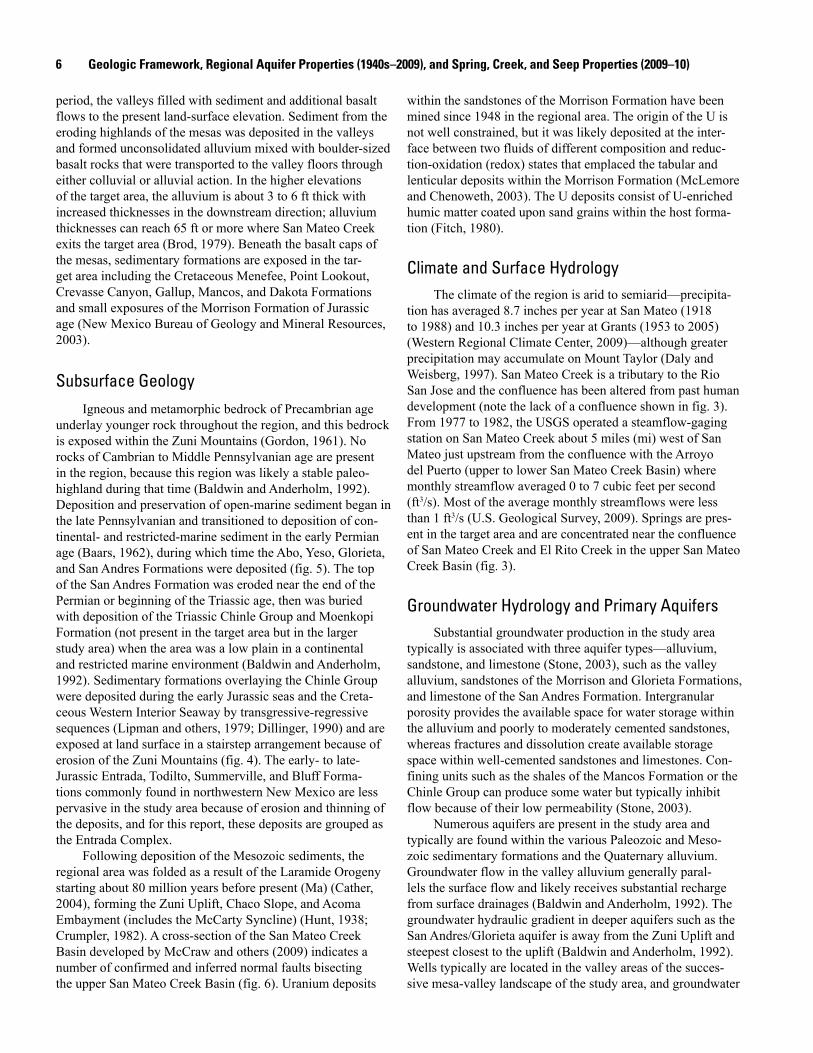
period, the valleys filled with sediment and additional basalt flows to the present land-surface elevation. Sediment from the eroding highlands of the mesas was deposited in the valleys and formed unconsolidated alluvium mixed with boulder-sized basalt rocks that were transported to the valley floors through either colluvial or alluvial action. In the higher elevations of the target area, the alluvium is about 3 to 6 ft thick with increased thicknesses in the downstream direction; alluvium thicknesses can reach 65 ft or more where San Mateo Creek exits the target area (Brod, 1979). Beneath the basalt caps of the mesas, sedimentary formations are exposed in the tar-get area including the Cretaceous Menefee, Point Lookout, Crevasse Canyon, Gallup, Mancos, and Dakota Formations and small exposures of the Morrison Formation of Jurassic age (New Mexico Bureau of Geology and Mineral Resources, 2003).
Subsurface GeologyIgneous and metamorphic bedrock of Precambrian age
underlay younger rock throughout the region, and this bedrock is exposed within the Zuni Mountains (Gordon, 1961). No rocks of Cambrian to Middle Pennsylvanian age are present in the region, because this region was likely a stable paleo-highland during that time (Baldwin and Anderholm, 1992). Deposition and preservation of open-marine sediment began in the late Pennsylvanian and transitioned to deposition of con-tinental- and restricted-marine sediment in the early Permian age (Baars, 1962), during which time the Abo, Yeso, Glorieta, and San Andres Formations were deposited (fig. 5). The top of the San Andres Formation was eroded near the end of the Permian or beginning of the Triassic age, then was buried with deposition of the Triassic Chinle Group and Moenkopi Formation (not present in the target area but in the larger study area) when the area was a low plain in a continental and restricted marine environment (Baldwin and Anderholm, 1992). Sedimentary formations overlaying the Chinle Group were deposited during the early Jurassic seas and the Creta-ceous Western Interior Seaway by transgressive-regressive sequences (Lipman and others, 1979; Dillinger, 1990) and are exposed at land surface in a stairstep arrangement because of erosion of the Zuni Mountains (fig. 4). The early- to late-Jurassic Entrada, Todilto, Summerville, and Bluff Forma-tions commonly found in northwestern New Mexico are less pervasive in the study area because of erosion and thinning of the deposits, and for this report, these deposits are grouped as the Entrada Complex.
Following deposition of the Mesozoic sediments, the regional area was folded as a result of the Laramide Orogeny starting about 80 million years before present (Ma) (Cather, 2004), forming the Zuni Uplift, Chaco Slope, and Acoma Embayment (includes the McCarty Syncline) (Hunt, 1938; Crumpler, 1982). A cross-section of the San Mateo Creek Basin developed by McCraw and others (2009) indicates a number of confirmed and inferred normal faults bisecting the upper San Mateo Creek Basin (fig. 6). Uranium deposits
within the sandstones of the Morrison Formation have been mined since 1948 in the regional area. The origin of the U is not well constrained, but it was likely deposited at the inter-face between two fluids of different composition and reduc-tion-oxidation (redox) states that emplaced the tabular and lenticular deposits within the Morrison Formation (McLemore and Chenoweth, 2003). The U deposits consist of U-enriched humic matter coated upon sand grains within the host forma-tion (Fitch, 1980).
Climate and Surface HydrologyThe climate of the region is arid to semiarid—precipita-
tion has averaged 8.7 inches per year at San Mateo (1918 to 1988) and 10.3 inches per year at Grants (1953 to 2005) (Western Regional Climate Center, 2009)—although greater precipitation may accumulate on Mount Taylor (Daly and Weisberg, 1997). San Mateo Creek is a tributary to the Rio San Jose and the confluence has been altered from past human development (note the lack of a confluence shown in fig. 3). From 1977 to 1982, the USGS operated a steamflow-gaging station on San Mateo Creek about 5 miles (mi) west of San Mateo just upstream from the confluence with the Arroyo del Puerto (upper to lower San Mateo Creek Basin) where monthly streamflow averaged 0 to 7 cubic feet per second (ft3/s). Most of the average monthly streamflows were less than 1 ft3/s (U.S. Geological Survey, 2009). Springs are pres-ent in the target area and are concentrated near the confluence of San Mateo Creek and El Rito Creek in the upper San Mateo Creek Basin (fig. 3).
Groundwater Hydrology and Primary AquifersSubstantial groundwater production in the study area
typically is associated with three aquifer types—alluvium, sandstone, and limestone (Stone, 2003), such as the valley alluvium, sandstones of the Morrison and Glorieta Formations, and limestone of the San Andres Formation. Intergranular porosity provides the available space for water storage within the alluvium and poorly to moderately cemented sandstones, whereas fractures and dissolution create available storage space within well-cemented sandstones and limestones. Con-fining units such as the shales of the Mancos Formation or the Chinle Group can produce some water but typically inhibit flow because of their low permeability (Stone, 2003).
Numerous aquifers are present in the study area and typically are found within the various Paleozoic and Meso-zoic sedimentary formations and the Quaternary alluvium. Groundwater flow in the valley alluvium generally paral-lels the surface flow and likely receives substantial recharge from surface drainages (Baldwin and Anderholm, 1992). The groundwater hydraulic gradient in deeper aquifers such as the San Andres/Glorieta aquifer is away from the Zuni Uplift and steepest closest to the uplift (Baldwin and Anderholm, 1992). Wells typically are located in the valley areas of the succes-sive mesa-valley landscape of the study area, and groundwater

Introduction 7
generally is pumped from the valley alluvium or San Andres/Glorieta aquifer (Baldwin and Anderholm, 1992; Agency for Toxic Substances and Disease Registry, 2008). Ground-water in the alluvium is hydraulically connected to ground-water in the San Andres/Glorieta aquifer in areas near the Zuni Uplift, but in other parts of the study area various members of the Chinle Group restrict flow between these two aquifers (Frenzel, 1992). During exploratory drilling in the 1970s north of San Mateo and within the target area, 15 water-bearing units (defined by formations and specific formation members) were encountered between land surface and 3,300 ft below land surface (Gulf Mineral Resources Company, written
commun., 1977) indicating that many of the Mesozoic forma-tions in the area likely contain water and may be hydraulically connected.
Valley Alluvium and Menefee Formation
An unconfined aquifer is present in the valley alluvium and the Menefee Formation in the upper San Mateo Creek Basin. The Menefee Formation is present at the surface in the eastern part of the basin in and near the town of San Mateo, and groundwater discharging from the upper Menefee sup-plies springs that form El Rito, San Lucas, and San Mateo
Figure 5. Generalized stratigraphic column of the subsurface geology below the valley forms in the southern San Juan Basin (modified from various figures in Lucas and others, 2003; courtesy of the New Mexico Bureau of Geology and Mineral Resources).
Owl Rock
PaintedDesert
Member
SonselaMember
Blue MesaMember
Bluewater Creek
Shinarump
Moenkopi
Chin
le G
roup
P
etrif
ied
Fore
st
Conglomerate
Sandstone
Sandstone, laminated
Sandstone with cross bedding
Sandstone, ripples
Sandstone, ripples and soft sediment deformation
Siltstone
Limestone
Pisolitic limestone
Mudstone
Mudstone with calcrete nodules
Pedoturbated unit
McG
affe
yM
embe
rPe
rea
Bed
Entrada
Todilto
Bluff and Summerville
J
uras
sic
Tria
ssic
San Andres
Glorieta
Perm
ian
Yeso
Abo
EXPLANATION

8 Geologic Framework, Regional Aquifer Properties (1940s–2009), and Spring, Creek, and Seep Properties (2009–10)
Creeks in the target area. The upper Menefee has been eroded, and unconsolidated material is present in thin layers in the easternmost part of the valley or along the base of the mesas. The alluvium thickens westward following San Mateo Creek where greater basin area contributes to the deposition of valley alluvium. Near the town of San Mateo, the alluvium aquifer overlies Menefee shales, and numerous intermittent or ephemeral springs and seeps are present in the area of the confluence of El Rito and San Mateo Creeks. West of this location, the Menefee is no longer present as the landscape transitions to older formations exhumed from previous ero-sion (fig. 4). Within the Rio San Jose Basin, alluvium-aquifer water typically has a specific conductance ranging from 600 to 2,500 microsiemens per centimeter (µS/cm), although values of 6,000 µS/cm have been reported; dissolved-solids concentrations have ranged from 590 to 14,000 milligrams per liter (mg/L) (Brod and Stone, 1981; Stone and others, 1983). Dissolved-solids concentrations in groundwater from the Menefee have ranged from 200 to 1,400 mg/L (Brod and Stone, 1981).
Point Lookout, Crevasse Canyon, Gallup, Dakota, and Morrison Formations
Besides the Menefee, the Cretaceous Point Lookout, Crevasse Canyon, Gallup, and Dakota Formations (predomi-nantly sandstones) likely have the porosity to contain substan-tial groundwater. Located between the Gallup and Dakota, the Mancos Formation likely contains small amounts of water, but this clay-rich formation probably is more of a confining
layer than an aquifer. A review of stratigraphic logs at the New Mexico Bureau of Geology and Mineral Resources (NMB-GMR) indicated that the Cretaceous layers can be discontinu-ous through the area. The Crevasse Canyon Formation can be substantial in thickness and contains two sandstone members (Dalton and Stray) that likely contain water, but these mem-bers are spatially variable and not present in many locations across the study area because of erosion (Stone and others, 1983). The underlying Gallup and Dakota sandstones are more likely to be present as aquifers, although deposition of these formations was not prevalent for this area. The southern extent of the Gallup Formation is along the southern boundary of the study area (Stone and others, 1983). Dissolved-solids in the Cretaceous formations have ranged from concentrations of 200 to 700 mg/L for the Point Lookout (Brod and Stone, 1981); 1,200 to 2,200 mg/L for the Gallup (Gulf Mineral Resources Company, written commun., 1979); and 600 to 1,400 mg/L for the Dakota (Brod and Stone, 1981).
Aquifers in the Jurassic formations likely exist in most parts of the study area, and most information is related to U ore extraction from the Morrison Formation. Water was com-monly encountered during exploratory drilling and mining of U from the Morrison, and the groundwater was removed for ore extraction (McLemore and Chenoweth, 2003; Yancey and McLemore, 2008). The Morrison Formation is divided into the mudstone, sandstone, conglomerate, and limestone Brushy Basin Member; the conglomerate, sandstone, and mudstone Westwater Canyon Sandstone Member; and interbedded shale and sandstone Recapture Member (Stone and others, 1983). The Brushy Basin Member and Westwater Canyon Member
Figure 6. Geologic cross section from west to east through the upper San Mateo Creek Basin (modified from McCraw and others, 2009; courtesy of the New Mexico Bureau of Geology and Mineral Resources).
Km
J
KmmKg KcdiKcd Kcg Kpl Kmf
NORTHWESTA
SOUTHEASTA’
San Mateo
Kd
Cretaceous Formations Kmf Menefee Kpl Point Lookout Kcg Crevasse Canyon, Gibson Coal Member Kcd Crevasse Canyon, Dalton Sandstone Member Kmm Mancos, Mulatto Tongue Member Kcdi Creavasse Canyon, Dilco Coal Member Kg Gallup Km Mancos , main body Kd Dakota, undivided
Jurassic Formations J Morrison, undivided and lower Jurassic formations
Elev
atio
n, in
feet
abo
ve s
ea le
vel
??Inferred fault
0 1 MILE
0 1 KILOMETER
EXPLANATION
Trace of A to A´ is shown in figure 4. Surface geology shown here in figure 6 is more detailed than the surface geology shown in figure 4
8,000
7,000
6,000
5,000
4,000
3,000
2,000
8,000
7,000
6,000
5,000
4,000
3,000
2,000
Fault—Arrow shows relative movementContact

Introduction 9
historically have contained water and were dewatered for U extraction, which caused local water-level declines during mining. Groundwater from the Westwater Canyon Mem-ber has contained dissolved-solids concentrations of 360 to 2,200 mg/L (Brod and Stone, 1981). Roca Honda Resources, LLC (2009a) estimated the potentiometric surface of the Morrison aquifer at the Jesus Mesa (fig. 3) to be about 1,000 to 1,300 ft below land surface. Given that groundwater was found in the upper part of the Jurassic formations (Morrison), it can be assumed that the lower Entrada Complex likely con-tains groundwater.
Chinle GroupThe Chinle Group is the only Triassic geologic unit in
the study area, but this group can be up to 1,500 ft thick in the region and is composed primarily of mudstone and silt-stone with some minor sandstone and limestone components (Stone and others, 1983). A likely discontinuous, confined aquifer(s) is present in the Chinle Group from recharge occurring around the Zuni Uplift, although this aquifer is not considered highly productive (Baldwin and Anderholm, 1992). The Chinle Group tends to act more as a confining unit for the underlying San Andres/Glorieta aquifer (Baldwin and Anderholm, 1992).
San Andres and Glorieta FormationsThe confined San Andres/Glorieta aquifer is defined by
the Permian San Andres and Glorieta Formations that underlie much of west-central New Mexico and is the primary aquifer of the region. The San Andres consists mostly of limestone and some sandstone and is unconformably overlain by the Chinle Group. The San Andres conformably overlies the Glorieta, which is composed of well-sorted, well-cemented fine- to medium-grained sandstone, and conformably overlies the Yeso Formation. The San Andres and Glorieta are consid-ered to be a single aquifer because of the gradational contact between the formations, and much of the water in this aqui-fer travels through solution channels within the San Andres (Baldwin and Anderholm, 1992). Joints, fractures, and faults create anisotropic conditions within the San Andres/Glorieta aquifer (Kelley and Clinton, 1960). Groundwater flow is mostly towards the east-northeast away from the Zuni Uplift, and discharge from the aquifer as springs is common (Baldwin and Anderholm, 1992). Dissolved-solids concentrations in the aquifer in the Grants-Bluewater area (fig. 1), typically are less than 1,500 mg/L, and calcium (Ca) and magnesium (Mg) and bicarbonate (HCO3) and sulfate (SO4) are the dominant cations and anions (Baldwin and Anderholm, 1992).
Human Influence on Water ResourcesWithin the study area, municipal, industrial, and agricul-
tural wells were primarily completed in the San Andres/ Glorieta aquifer. The city of Grants derives its municipal
water from this aquifer. Prior to the 1940s, domestic and stock wells withdrew small amounts of water from the San Andes/Glorieta aquifer, but in the 1940s, new irrigation wells were completed to supply an increasing agricultural area (Baldwin and Anderholm, 1992). By 1955, 22 wells were supplying 13,600 acre-ft/yr for agriculture (85 percent of total withdrawal), municipal, and industrial use in the Grants area (Gordon, 1961). This increase in groundwater withdrawn from the San Andres/Glorieta aquifer is attributed with decreas-ing flow in the Ojo del Gallo (minor drainage immediately south of Grants) and substantially lowering the potentiometric surface of the aquifer (Baldwin and Anderholm, 1992). Water levels fluctuated with pumpage, and the largest declines were recorded in the early 1960s during the height of agricultural use. These declines recovered following decreases in agricul-tural use (Baldwin and Anderholm, 1992).
In addition to agricultural uses, mining influenced groundwater levels within the region because of the need to dewater formations containing U ore and water needed for milling operations. Mining and milling operations relied on water from the San Andres/Glorieta aquifer. Substantial U deposits were discovered in 1955 north of Grants, which initiated a boom in mining, increased the local population, and decreased the amount of irrigated land (Baldwin and Anderholm, 1992). The ratio of San Andres/Glorieta water used for agricultural, industrial, and municipal uses began to change with a greater share going to industrial uses (mostly mining or milling or related uses) and a smaller share going to agriculture with an overall drop in the volume of water withdrawn from the aquifer. By 1982, the volume of water withdrawn from the aquifer had decreased to 3,900 acre-ft/yr, and 38 percent of the water was used for industrial operations (Baldwin and Anderholm, 1992). Mining and milling opera-tions decreased through the 1980s and 1990s, and water needs correspondingly decreased. With the decrease in mining and agriculture, municipal water became the primary use of San Andres/Glorieta water.
Within the target area, there is a small population and no major agricultural land use. Most of the private land in the upper San Mateo Creek Basin outside of the town of San Mateo is part of the Lee Ranch (cattle ranch). Surface-water conveyances have been modified to support ranching opera-tions. San Mateo Creek was dammed immediately above the town of San Mateo where incoming creek flow is allowed to infiltrate and discharges below the dam. Smaller retaining structures are present along El Rito and San Mateo Creeks on the valley floor for stock use. According to the New Mexico Water Rights System database managed by the New Mexico Office of the State Engineer (http://nmwrrs.ose.state.nm.us/nmwrrs/index.html; database reviewed in 2010), most of the wells in and around the town of San Mateo draw water from the unconfined aquifer in the valley alluvium and Menefee Formation with the remaining wells drawing water from deeper Cretaceous formations.

10 Geologic Framework, Regional Aquifer Properties (1940s–2009), and Spring, Creek, and Seep Properties (2009–10)
Previous Studies
The upper San Mateo Creek Basin has not been studied as an entire hydrologic unit. There are a number of private company reports describing the hydrogeology of various loca-tions in the target area because of the potential for U mining in these locations. These reports are in addition to a substantial amount of geologic work by the New Mexico Bureau of Geol-ogy and Mineral Resources such as the recent draft update to the San Mateo quadrangle (McCraw and others, 2009). The New Mexico Environment Department has conducted various monitoring programs in conjunction with regulatory monitoring by the mining companies, but these data have not been compiled by the New Mexico Environment Department to derive an overview of the hydrologic resources within the upper San Mateo Creek Basin.
Study MethodsThe characterization of the geologic framework; regional
aquifer properties; and springs, creeks, and seeps of the upper San Mateo Creek Basin was performed by compiling and analyzing existing hydrogeologic data supplemented with new data from the analysis of spring-, creek-, and seep-water samples collected as part of this study. Compilation of existing data for the study area consisted of reviewing databases man-aged by the USGS, U.S. Environmental Protection Agency, and the State of New Mexico along with relevant and read-ily available journal articles and government and private consultant reports. The data were screened to only include data relevant to deposits and formations found in the target area—upper San Mateo Creek Basin. The larger study area was used to compile sufficient hydraulic and geochemical data to describe the general water-level and geochemical charac-teristics of the major aquifers that are present in the study and target areas. Most of the existing data compiled for this study ranged from the 1970s to 2009, but some data extend back to the 1940s (date of collection). This large temporal scale was included to allow for comparison of hydraulic and geochemi-cal characteristics of the multiple aquifers relevant to the upper San Mateo Creek Basin.
Existing Data
A review of the study area geology was necessary to establish the geologic framework containing the aquifers. Stratigraphic descriptions were created from existing literature and the review of drilling logs at the New Mexico Bureau of Geology and Mineral Resources. Groundwater hydraulic data (aquifer water levels and hydraulic conductivities) and chemistry data (major and trace elements along with contami-nants of concern such as NO3, Ra, and U) were compiled to analyze basin-wide hydrogeologic characteristics. Water-level differences were interpreted to identify general flow patterns
of the major aquifers in the San Mateo Creek Basin where possible. Hydraulic conductivity and transmissivity of aquifers and between aquifers were assessed where available. Aquifers were characterized by comparing concordant data across the various saturated deposits and formations in the study area that were relevant to the target area.
To analyze the data relevant to aquifers in the target area, formation designations were standardized to current (2011) accepted formation nomenclature. This standardization was necessary because of the length of the existing data record (1940s to 2009) during which formation identification has changed with certain formation names dropped from accepted use or added as additional studies continued to update the stratigraphic nomenclature of the region. Although it is a geologic group, the Chinle Group is treated similar to the formation designation because of a lack of discrimination of the Chinle Group’s formations in this area regarding hydro-geologic data (it was recently elevated to Group status1). In addition to this name standardization, data associated with formation members were grouped under the formation name. This grouping increases the variability of the data subsets because of member differences, but this grouping provides a more consistent discussion with all differences described at the formation level. There are a number of alluvial, colluvial, and landslide Quaternary deposits in the study area, and these unconsolidated deposits were grouped under a Quaternary alluvium (Qa) hydrostratigraphic unit designation with the assumption that these unconsolidated layers should hydrauli-cally behave as a single unit. Similarly, the volcanoclastics of the Mount Taylor Volcanic Field also were grouped as a single unit. It is not assumed that these igneous extrusive rocks have similar hydraulic properties, but these units likely contain only young water recently recharged from the surface. For pur-poses of this report, data associated with the Entrada, Todilto, Summerville, and Bluff Formations were grouped as a single hydrostratigraphic unit described as the Entrada Complex. These early to mid-Jurassic formations have not been well defined for the study area, and the Entrada Formation likely is the dominant formation of these predominantly sandstone and limestone layers. Additionally, a small percent of data were attributed to multiple formations. These multiple-formation samples were assigned to the uppermost formation for analy-sis. The uppermost formation was assumed to represent the greater thickness of the saturated interval of the well, because it could not be ascertained as to whether the lower forma-tions were fully penetrated by the wells. Designating indi-vidual formations for multiple-formation data mostly affected samples collected from the San Andres/Glorieta aquifer. Some data were attributed to the San Andres Formation and some were attributed to the Glorieta Formation, but a substantial part of the data was attributed to both formations. The single-formation designation of multiple-formation data greatly
1The Chinle Group was elevated from formation status by Lucas (1993), but this status change has not been fully accepted (e.g., Dubiel, 1994, and Woody, 2006). The Chinle Group designation is used for purposes of this report.
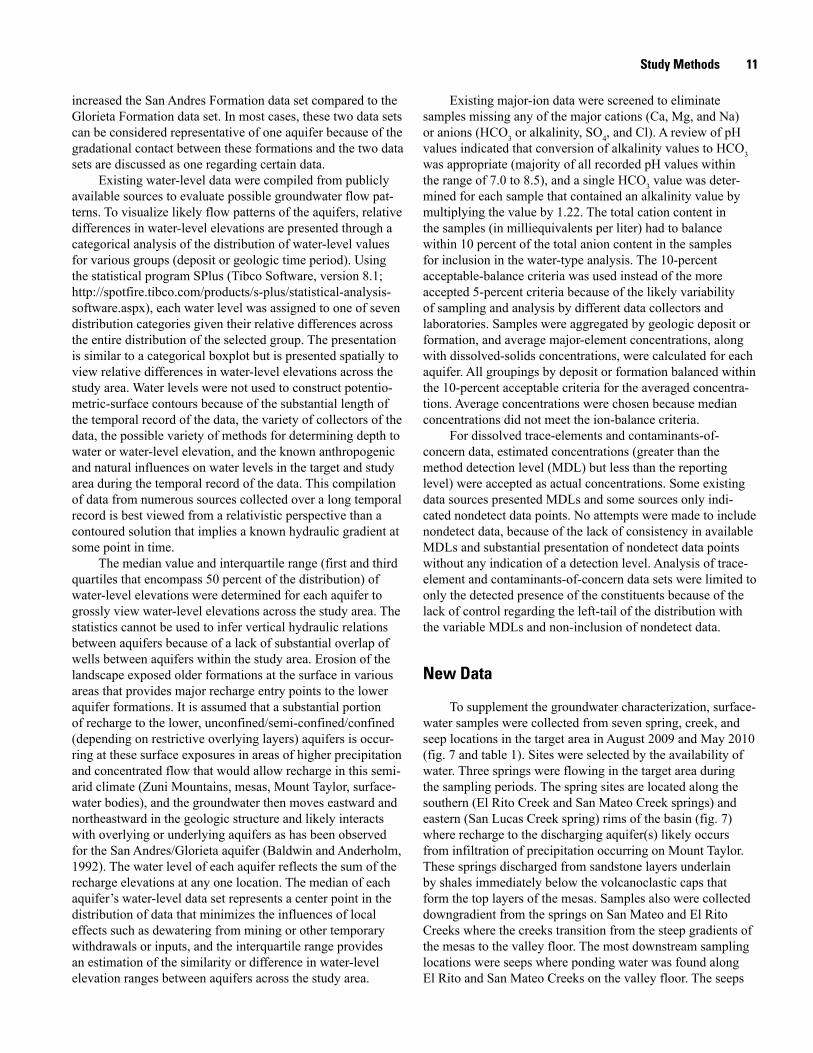
Study Methods 11
increased the San Andres Formation data set compared to the Glorieta Formation data set. In most cases, these two data sets can be considered representative of one aquifer because of the gradational contact between these formations and the two data sets are discussed as one regarding certain data.
Existing water-level data were compiled from publicly available sources to evaluate possible groundwater flow pat-terns. To visualize likely flow patterns of the aquifers, relative differences in water-level elevations are presented through a categorical analysis of the distribution of water-level values for various groups (deposit or geologic time period). Using the statistical program SPlus (Tibco Software, version 8.1; http://spotfire.tibco.com/products/s-plus/statistical-analysis-software.aspx), each water level was assigned to one of seven distribution categories given their relative differences across the entire distribution of the selected group. The presentation is similar to a categorical boxplot but is presented spatially to view relative differences in water-level elevations across the study area. Water levels were not used to construct potentio-metric-surface contours because of the substantial length of the temporal record of the data, the variety of collectors of the data, the possible variety of methods for determining depth to water or water-level elevation, and the known anthropogenic and natural influences on water levels in the target and study area during the temporal record of the data. This compilation of data from numerous sources collected over a long temporal record is best viewed from a relativistic perspective than a contoured solution that implies a known hydraulic gradient at some point in time.
The median value and interquartile range (first and third quartiles that encompass 50 percent of the distribution) of water-level elevations were determined for each aquifer to grossly view water-level elevations across the study area. The statistics cannot be used to infer vertical hydraulic relations between aquifers because of a lack of substantial overlap of wells between aquifers within the study area. Erosion of the landscape exposed older formations at the surface in various areas that provides major recharge entry points to the lower aquifer formations. It is assumed that a substantial portion of recharge to the lower, unconfined/semi-confined/confined (depending on restrictive overlying layers) aquifers is occur-ring at these surface exposures in areas of higher precipitation and concentrated flow that would allow recharge in this semi-arid climate (Zuni Mountains, mesas, Mount Taylor, surface-water bodies), and the groundwater then moves eastward and northeastward in the geologic structure and likely interacts with overlying or underlying aquifers as has been observed for the San Andres/Glorieta aquifer (Baldwin and Anderholm, 1992). The water level of each aquifer reflects the sum of the recharge elevations at any one location. The median of each aquifer’s water-level data set represents a center point in the distribution of data that minimizes the influences of local effects such as dewatering from mining or other temporary withdrawals or inputs, and the interquartile range provides an estimation of the similarity or difference in water-level elevation ranges between aquifers across the study area.
Existing major-ion data were screened to eliminate samples missing any of the major cations (Ca, Mg, and Na) or anions (HCO3 or alkalinity, SO4, and Cl). A review of pH values indicated that conversion of alkalinity values to HCO3 was appropriate (majority of all recorded pH values within the range of 7.0 to 8.5), and a single HCO3 value was deter-mined for each sample that contained an alkalinity value by multiplying the value by 1.22. The total cation content in the samples (in milliequivalents per liter) had to balance within 10 percent of the total anion content in the samples for inclusion in the water-type analysis. The 10-percent acceptable-balance criteria was used instead of the more accepted 5-percent criteria because of the likely variability of sampling and analysis by different data collectors and laboratories. Samples were aggregated by geologic deposit or formation, and average major-element concentrations, along with dissolved-solids concentrations, were calculated for each aquifer. All groupings by deposit or formation balanced within the 10-percent acceptable criteria for the averaged concentra-tions. Average concentrations were chosen because median concentrations did not meet the ion-balance criteria.
For dissolved trace-elements and contaminants-of- concern data, estimated concentrations (greater than the method detection level (MDL) but less than the reporting level) were accepted as actual concentrations. Some existing data sources presented MDLs and some sources only indi-cated nondetect data points. No attempts were made to include nondetect data, because of the lack of consistency in available MDLs and substantial presentation of nondetect data points without any indication of a detection level. Analysis of trace-element and contaminants-of-concern data sets were limited to only the detected presence of the constituents because of the lack of control regarding the left-tail of the distribution with the variable MDLs and non-inclusion of nondetect data.
New Data
To supplement the groundwater characterization, surface-water samples were collected from seven spring, creek, and seep locations in the target area in August 2009 and May 2010 (fig. 7 and table 1). Sites were selected by the availability of water. Three springs were flowing in the target area during the sampling periods. The spring sites are located along the southern (El Rito Creek and San Mateo Creek springs) and eastern (San Lucas Creek spring) rims of the basin (fig. 7) where recharge to the discharging aquifer(s) likely occurs from infiltration of precipitation occurring on Mount Taylor. These springs discharged from sandstone layers underlain by shales immediately below the volcanoclastic caps that form the top layers of the mesas. Samples also were collected downgradient from the springs on San Mateo and El Rito Creeks where the creeks transition from the steep gradients of the mesas to the valley floor. The most downstream sampling locations were seeps where ponding water was found along El Rito and San Mateo Creeks on the valley floor. The seeps

12
Geologic Framew
ork, Regional Aquifer Properties (1940s–2009), and Spring, Creek, and Seep Properties (2009–10)
Figure 7. Sampling sites and surface topography of the upper San Mateo Creek Basin.
605
509
605
547
Rd 239
Rd 453
Rd 1
92
Rd 456
Rd 555
Rd 7
5
San Lucas Rd
Rd 239Rd 453
Rd 22
La Jara Mesa
San Mateo Mesa
Jesus Mesa
San Mateo Creek
El Rito Creek
San Lucas Creek
San Miguel Creek
Cañada las Vacas
El Rito Creek
Arroyo del Puerto
San Mateo
San Mateo Creek
Base from U.S. Geological Survey 1:24,000 and 1:100,000 digital dataProjection: Universal Transverse Mercator zone 13N, North American Datum of 1983, North American Vertical Datum of 1988
0 2 4 MILES
0 4 KILOMETERS2
N
“Rd” indicates county or U.S. Forest Service road
El Rito CreekSpring
El Rito Creek
El Rito Creek Seep
San Mateo Creek Seep
San Mateo Spring
San Lucas Spring
San Mateo Creek
Sampling site
Stock tank or pond
Cibola National Forest
Cebolla land grant
State lands
EXPLANATION
35˚ 25´
35˚ 20´
35˚ 15´
107˚ 45´ 107˚ 40´ 107˚ 35´

Study Methods 13
were present where shallow groundwater is near the surface as indicated by numerous salt deposits and visible signs of ephemeral or intermittent springs and shallow water levels in nearby piezometers. All samples were analyzed for field properties (water temperature, pH, specific conductance, and dissolved oxygen), dissolved solids, major elements (Ca, Mg, Na, K, HCO3, SO4, and Cl), trace elements (Al, Sb, As, Ba, B, Be, Cd, Cr, Co, Cu, Fe, Li, Pb, Mn, Hg, Mo, Ni, Se, Si, Ag, Na, Tl, V, and Zn), stable isotopes of water (δ2H and δ18O), and contaminants of concern that have historically exceeded maximum contaminant levels in this area (gross alpha activ-ity, NO3, Ra, and U; table 2). Stable isotopes of hydrogen (2H/1H) and oxygen (18O/16O) composing water are reported as δ2H and δ18O per mil (‰), which is the ratio of the stable-isotopic abundances of an element in a sample to those of the Vienna Mean Standard Ocean Water (VSMOW; Révész and Coplen, 2008a; Révész and Coplen, 2008b). All samples were collected as grab samples from atmospherically-exposed surfaces and filtered through a 0.45-micron capsule filter using a peristaltic pump and new, individual Teflon-coated tubing at each site.
The creek- and seep-solute concentrations were used to model potential geochemical mass-balance reactions between the creek sample sites and the seep sample sites on El Rito and San Mateo Creeks. These point-to-point locations represent the evolution of creek flow from groundwater discharged at the mesas to infiltration and flow through the valley alluvium and reappearance at downstream seeps. The reemerged shal-low groundwater likely undergoes greater evaporation on the valley floor as it reappears at the surface through seep dis-charge that produces quiescent shallow ponds. Additionally, relative to water that remains on the surface as creek flow, water that infiltrates into the alluvium would be expected to undergo greater rock-water interactions as it migrates more slowly along the valley floor. This rock-water interaction was visible in the addition of clays and likely associated oxide
polymorphs that were apparent in the samples collected from the seep sites. Some of these clays were present in the seep samples following filtration and are considered part of the “dissolved” fraction for concentration analysis because of acid preservation of the samples that draws elements from the clays and oxides into solution. Inclusion of elements associated with the clays that passed through the 0.45-micron filters influences charge balance determination and trace-element concentra-tions as trace elements sorbed to these very fine particles are not included for determining the charge balance (potential for imbalance with this exclusion) and may increase the con-centration of typically low solubility trace elements such as aluminum (Al).
The geochemical model NETPATH (Plummer and others, 1994) was used to model the geochemical reactions between the creek and seep sites using the NETPATH-WIN interface (El-Kadi and Fujiwara, 2009). Each model of the creek to seep flow path for El Rito and San Mateo Creeks was constrained by specific elements that were identified as having substantial mass flux between the creek and seep sites with consider-ation for the changes in flow type (open channel to shallow groundwater) and the introduction of clays and oxides to the water as shallow groundwater travels through predominantly aluminosilicate alluvium and formations. Mineral phases were chosen based on the local geology, the introduction of alumi-nosilicate clays and Fe and Mn oxides that passed through the 0.45-micron filter as part of the “dissolved” fraction, and a review of possible mineral phases produced from the calcula-tion of saturation indices (log of the ratio of the ion activity product (IAP) and the solubility product (Ksp) from entering all available solute concentrations into PHREEQC (Parkhurst and Appelo, 1999) using the PHREEQCi interface (version 2.17.0); http://wwwbrr.cr.usgs.gov/projects/GWC_coupled/phreeqci/). The selected mineral phases represent the thermo-dynamically preferred mineral forms given the available ele-ment concentrations and general aqueous chemical conditions
Table 1. Information for the spring-, creek-, and seep-sample sites in the upper San Mateo Creek Basin.
[USGS, U.S. Geological Survey; NAD 83, North American Datum of 1983; ft, feet; NAVD 88, North American Vertical Datum of 1988]
Local site name (fig. 7)
USGS site name
Latitude (NAD 83)
Longitude (NAD 83)
Land-surface elevation
(in ft above NAVD 88)
Exiting or flow through deposit/
formation
El Rito Creek spring 351710107412001 35º17´09.7˝ 107º41´19.6˝ 7,935 Volcanoclastic and upper Menefee
El Rito Creek 351828107411301 35º18´28.3˝ 107º41´13.1˝ 7,260 Menefee
El Rito Creek seep 351950107413101 35º19´49.5˝ 107º41´31.4˝ 7,023 Alluvium
San Mateo Creek spring 351649107355701 35º16´49.0˝ 107º35´57.4˝ 8,945 Volcanoclastic
San Mateo Creek 351918107375301 35º19´17.5˝ 107º37´53.2˝ 7,520 Menefee
San Mateo Creek seep 352017107410301 35º20´17.4˝ 107º41´03.2˝ 7,041 Alluvium
San Lucas Creek spring 352045107361701 35º20´44.7˝ 107º36´17.3˝ 7,871 Volcanoclastic and Menefee

14 Geologic Framework, Regional Aquifer Properties (1940s–2009), and Spring, Creek, and Seep Properties (2009–10)
(pH, temperature, and dissolved oxygen), but these selected mineral phases are not meant to indicate the only miner-als likely to dissolve or precipitate or be available for cation exchange/sorption. These mineral phases are useful for view-ing the mass flux of the available solutes between aqueous and solid phases with changes in element compositions and concentrations.
Model results describe the mass transfers of the selected mineral phases that account for the observed changes within the constrained elements. Models were run with creek data representing the initial solution and the seep data represent-ing the final solution. Evaporation was included as an effect along with the dissolution and precipitation of the mineral phases to account for changes in the water chemistry between the initial and final solutions. Cation exchange was attempted in the geochemical models but dismissed as an examinable process because of the leaching of elements from the less than 0.45-micron clays and oxides with acidification of the collected samples that altered the dissolved to exchange-site element ratios. A CO2 phase did indicate changes between the creek and seep sites, but this phase is not presented because of the lack of organic C data that would hinder this discussion, but this flux is visible in the pH differences between the sites. The mass transfer estimates of the dissolution or precipitation
of mineral phases are represented by a positive (dissolution) or negative (precipitation) value in millimoles per kilogram (mmol/kg) of water, and the evaporation effect is quantified through an estimated value of the remaining water solution in grams as indicated by an outputted evaporation factor (concen-trations increased by this multiplier through evaporation).
Quality-Assurance
Surface-water data collection was performed accord-ing to USGS quality-control and quality-assurance standards described in the USGS National Field Manual for the Collec-tion of Water-Quality Data (U.S. Geological Survey, 2006). One sequential replicate sample was collected during each sampling period at a randomly selected site to evaluate labora-tory precision, and matrix-spike samples were collected at the same site to ascertain matrix interference for all constituents. All replicate-sample results were within 10 percent of the environmental-sample results for concentrations greater than the reporting level, and matrix-spike sample results were within allowable laboratory limits. Additionally, laboratory-blank samples were analyzed to examine method contamina-tion and no analytes were detected above the reporting level in the laboratory-blank samples.
Table 2. Sample analytes and laboratory analysis methods.
[ºC, degrees Celsius; %, percent; µS/cm, microsiemens per centimeter at 25 degrees Celsius; NTU, nephelometric turbidity units; mg/L, milligrams per liter; µg/L, micrograms per liter; pCi/L, picocuries per liter; USGS, U.S. Geological Survey; δxX (‰) = (Ratiosample/Ratiostandard − 1) x 1,000 of specified isotope ratio; ‰, per mil]
Constituent Description Method/lab code Medium LaboratoryAnalytical precision
Field values Water temperature, pH, conductance, turbidity
Orion 130A, Orion 250A+, Oakton T-100 (field meters)
Water Field collection 0.1 ºC, 0.02 pH, 0.5% µS/cm, 0.1 NTU
Dissolved solids Filterable residue 1MCAWW 2540C Water TestAmerica Labs, Arvada, Co.
5 mg/L
Alkalinity Alkalinity as CaCO31MCAWW 2320B Water TestAmerica Labs 1.1 mg/L
Major anions Br, Cl, F, SO41MCAWW 300.0A Water TestAmerica Labs 0.06 to 1.2 mg/L
Major cations Ca, Mg, Na, K 1SW846 6010B Water TestAmerica Labs 0.034 to 1.1 mg/L
Trace elements 224 trace elements 1SW846 6010B, 6020, 7470A Water TestAmerica Labs 0.01 to 2 µg/L
Nitrate NO3 + NO2 as N 1USEPA 353.2 Water TestAmerica Labs 0.05 mg/L
Gross alpha 3USEPA 900.0 Water TestAmerica Labs 1 pCi/L
Radium isotopes Alpha-emitting isotopes of Ra (226Ra and 228Ra)
1USEPA 903.0 and 904.0 Water TestAmerica Labs 1 pCi/L
Stable isotopes of water 2H/1H, 18O/16O Révész and Coplen, 2008a and b
Water USGS Reston Stable Isotope Laboratory
2‰ as δ2H and 0.2‰ δ18O
1U.S. Environmental Protection Agency, 2009.2Al, Sb, As, Ba, B, Be, Cd, Cr, Co, Cu, Fe, Li, Pb, Mn, Hg, Mo, Ni, Se, Si, Ag, Tl, U, V, and Zn.3U.S. Environmental Protection Agency, 1993.

Geologic Framework and Regional Aquifer Properties 15
Geologic Framework and Regional Aquifer Properties
Regional data were used to describe the geologic, hydraulic, and geochemical characteristics of the aquifers of the study area regarding formations relevant to the target area. Geologic and hydraulic characteristics include stratigraphy, formation properties, groundwater-flow patterns derived from existing water-level differences, and published hydraulic con-ductivities measured in the field or laboratory. Geochemically, groundwater variation among the aquifers was examined by reviewing existing data for differences in pH, dissolved solids, water type defined by the major elements, trace elements, and contaminants of concern.
San Mateo Creek Basin Geology
The geologic framework of the study area consists of the Zuni Uplift, Chaco Slope, and the Mount Taylor Volcanic Field. Within this structural context, the sedimentary forma-tions provide matrices for local and regional aquifers. Infor-mation regarding the study area stratigraphy was compiled along with associated aquifer information to present a table of deposit, formation, and aquifer properties that are relevant to the hydrologic resources of the target area (table 3). For this report, aquifers are described by the individual formations or deposits where groundwater is present. These descriptions are used to refer to the saturated portions of deposits or formations but are not meant to discriminate separate aquifers. Many of the aquifers likely are well-connected, but investigation of those connections is beyond the scope of this report. The distribution of the aquifers is spatially variable because of the dip of the formations and erosion that produced the current landscape configuration where older formations have been exhumed closer to the Zuni Mountains.
The thicknesses and range of deposits and formations present a potentially complex interaction of aquifers in the study and target areas. Many of the deposits and formations likely are hydraulically connected because of the solid-matrix properties, such as porosity and permeability (table 3), but the Mancos Formation (including the Mulatto Tongue) and Chinle Group likely restrict vertical flow given the shaly composition of these formations. The Mancos is a near-surface formation that may not be present in parts of the study and target areas because of thinning and erosion. It is more prevalent on the mesas and strongly visible at the surface of Jesus and San Mateo Mesas (fig. 8). The limited presence of the Mancos in the valley areas lessens its role as a potential inhibitor of vertical flow to the lower aquifers. The Chinle Group is a thick sequence of predominantly shale and silt that likely acts as a strong inhibitor to vertical flow between the overlying Jurassic formations and the underlying Permian formations. The Chinle Group is exposed at the surface west of the target area in the lower San Mateo Creek Basin (fig. 4).
Hydraulic Properties of Major Aquifers
Groundwater in the study area occurs in numerous depos-its and formations that form unconfined and confined aquifers, and recharge occurs in highlands such as the Zuni Mountains and Mount Taylor. Horizontal flow is driven by these recharge areas and the regional tilt of the landscape, but local effects such as the McCarty Syncline and differences in recharge locations likely influence local conditions. Vertical flow likely is occurring among many of the formations except where restricted by shaly formations such as the Menefee, Mancos, and Chinle. Existing water-level elevations compiled as part of this study are listed in appendix 1.
Horizontal FlowAvailable water-level data were evaluated to try and
identify general flow patterns within each of the aquifers. Only water-level data from the alluvium aquifer provided an indica-tion of flow direction in the study and target areas. Water-level elevations in the alluvium aquifer decrease in the downstream direction along San Mateo Creek (fig. 9). This observation is consistent with Baldwin and Anderholm’s (1992) determina-tion that groundwater flow in the alluvium aquifer generally is the same direction as that of surface water (or land topology) for this region. The water-level data from the lower aquifers in the sedimentary formations did not indicate similar relative differences in water-level elevations across the study area that could be interpreted as prevalent flow directions across the study or target areas. The relative distribution of water-level elevations in the study area for the lower aquifers is presented (fig. 10) as groupings of water levels for formations from geologic periods to indicate the variability in relative water-level elevations among each of the period groupings and no apparent flow directions from differences in relative water-level elevations. The large temporal and spatial extent of the water-level data (fig. 10 and table 1-1) appears to hinder iden-tification of the general flow patterns for these deeper aquifers. In the target area, it is likely that groundwater in these lower aquifers generally flows eastward given the hydrogeologic framework where formation dip is eastward across the target area and the eastward flow direction identified by Baldwin and Anderholm (1992) for the San Andres/Glorieta aquifer. If the flow direction in the underlying aquifers is to the east in the target area, this flow direction is opposite of the flow direction in the alluvium aquifer in the upper San Mateo Creek Basin. Opposing flow directions would be a result of different recharge areas and the unconsolidated alluvium that conforms to the topological gradient compared to the consolidated for-mations that have a regional opposing gradient.
The influence of faults on groundwater flow was not investigated as part of this study, but the presence of numer-ous normal faults in the target area (fig. 6) likely influences groundwater flow. Faults can inhibit flow by disconnecting permeable pathways or by reducing porosity from fault gouge,

16
Geologic Framew
ork, Regional Aquifer Properties (1940s–2009), and Spring, Creek, and Seep Properties (2009–10)Table 3. Stratigraphic, lithologic, and aquifer characteristics of geologic deposits and formations in the study and target areas.—Continued
[ft, feet; %, percent; NA, not available; <, less than]
Deposit/ formation
Geologic age
1Deposit/formation description
Surface location in the target area (figs. 4 and 8)
Thickness (ft)
Porosity/ permeability
1Direction of flow
Aquifer present
QuarternaryAlluvium (Qa) Quaternary—
upper Pleistocene to Holocene
Alluvium eroded from surrounding formations
Valley floor Highly variable
Possibly large perme-ability
Variable Yes
NeogeneFlows and volca-
noclastics (Tnv and Tpb)
Neogene Lava, pyroclastic flows, and associated volcanoclastics from the Mount Taylor Volcanic Field
Forms mesa caps on basin highlands
Highly variable
Possible large porosity in vesicular basalts, but low permeability unless fractured
Away from Mount Taylor
Unlikely as an aquifer. Likely runoff or per-colation to underly-ing formations
CretaceousMenefee (Kmf) Late
CretaceousInterbedded mudstones, siltstones, fine- to
medium-grained sandstones, mudstones, and thin coals
Northeastern part of basin
2Highly variable (eroded), up to 1,000 ft thick
30% sandstone, 65% shale, decent lense permeability
East to northeast
3Discontinuous
Point Lookout (Kpl)
Late Cretaceous
Medium to fine-grained, cross-bedded sandstone
Exposed along northern rim areas
4,5120 Likely porous with sandstone dominance
East to northeast
3Discontinuous
Crevasse Canyon (Kcc)
Late Cretaceous
Interbedded siltstone, sandstone, and coal with thin conglomerates
Exposed along rim 5800 Highly variable East to northeast
3Discontinuous
Mulatto Tongue of Mancos (Kmm)
Late Cretaceous
Thin-bedded, tabular to ripple-laminated sandstone (well to moderately sorted and very fine grained) and black mudstone
Exposed along rim 5305 Larger porosity than main body of Man-cos shale
East to northeast
3Discontinuous
Gallup (Kg) Late Cretaceous
Cross-bedded, moderately-sorted, very fine- to fine-grained sandstone
Exposed along rim 573–85 Likely porous with sandstone dominance
East to northeast
3Discontinuous
Mancos (Km) Middle Cretaceous
Mudstone and silty mudstone with finely laminated to cross-bedded thin sandstone layers (well sorted and fine grained)
Exposed along base of mesas on northern basin boundary
5125–710 Small permeability given dominance of shale layers
East to northeast
3Possibly discontinuous
Dakota (Kd) Middle Cretaceous
5Sandstones derived from marine shore-faces, intertongues with Mancos
Exposed along base of mesa on the south-west basin boundary
550–60 Likely porous with sandstone dominance
East to northeast
3Possibly discontinuous
JurassicMorrison (Jm) Upper
JurassicMudstone and sandstone Minor exposure on La
Jara Mesa2,5700 Highly variable East to
northeastYes
5Entrada Complex—Early to Middle Jurassic composed of the Entrada, Todilto, Summerville, and Bluff Formations
Table 3. Stratigraphic, lithologic, and aquifer characteristics of geologic deposits and formations in the study and target areas.
[ft, feet; %, percent; NA, not available; <, less than]

Geologic Framew
ork and Regional Aquifer Properties
17Table 3. Stratigraphic, lithologic, and aquifer characteristics of geologic deposits and formations in the study and target areas.—Continued
[ft, feet; %, percent; NA, not available; <, less than]
Deposit/ formation
Geologic age
1Deposit/formation description
Surface location in the target area (figs. 4 and 8)
Thickness (ft)
Porosity/ permeability
1Direction of flow
Aquifer present
Bluff (Jb) Middle Jurassic
Sandstone Not exposed in the basin 2<5–300 Small permeability for a sandstone2
East to northeast
Yes
Summerville (Js) Middle Jurassic
Thin alternating beds of mudstone, silt-stone, and sandstone
Not exposed in the basin NA NA East to northeast
Yes
Todilto (Jt) Early Jurassic Limestone Not exposed in the basin NA NA East to northeast
Yes
Entrada (Je) Early Jurassic 2A three member formation consisting of upper and lower sandstones with a middle siltstone
Not exposed in the basin NA NA East to northeast
Yes
TriassicChinle Group
(TRc)Triassic 7Mudstone and siltstone with clayey/silty
sandstone lensesNot exposed in the basin 71,250 7Small East to
northeast7Yes, but limited
aquifer because of dominance of shales
PermianSan Andres (Psa) Late Permian 8Marine, upper and lower massive fos-
siliferous limestone separated by a sandstone unit
Not exposed in the basin 7225 (San Andres and Glorieta)
Large permeability 7East Yes, major aquifer
Glorieta (Pg) Middle to late Permian
8Massive, well-sorted, well-cemented, fine- to medium-grained sandstone
Not exposed in the basin NA 7East Yes, major aquifer
Yeso (Py) Early Permian 7,9Sandstone, clayey sandstone, and silt-stone mixed with carbonates and evapo-rites deposited under marine conditions
Not exposed in the basin 11,000 7Small permeability Unknown 7Leaky basal unit for the San Andres/ Glorieta aquifer
Abo (Pa) Early Permian 7Fine- to coarse-grained sandstone, siltstone, and mudstone with conglomer-ates in the lower unit deposited during continental conditions
Not exposed in the basin 71,000 7Small permeability Unknown 7Leaky confining unit
1Descriptions from McCraw and others (2009) and New Mexico Bureau of Geology and Mineral Resources (2003) unless otherwise noted. The flow-direction indication depends on the study area of the cited references. According to the references, flow directions were mostly northeastward closer to the Zuni Mountains and more eastward closer to the McCarty Syncline under Mount Taylor (fig. 3).
2Stone and others, 1983.3Given a review of existing local and regional information, a productive aquifer is unlikely present in these formations within the study area but small amounts of groundwater may be present.4Maximum thickness.5Roca Honda Resources, LLC, 2009a.6Entrada Complex—this term is used solely for this report to describe the early to late Jurassic deposits that have not been well discriminated in the study area. The Entrada is the dominant formation and the
presence of the Todilto has been identified by the authors from review of driller’s notes. The presence of Bluff and Summerville Formations in this area is debatable and beyond the scope of this report.7Baldwin and Anderholm, 1992.8Gordon, 1961.9Baars, 1962.

18
Geologic Framew
ork, Regional Aquifer Properties (1940s–2009), and Spring, Creek, and Seep Properties (2009–10)
Figure 8. Surface geology of the upper San Mateo Creek Basin.
K d
K m l
Volcanic rocks(Tnv)
Tmb
Ql
Kcc
Ql
Qa
Qa
Ql
Kmf
Kmf
Jsr
Kcc
Kcc
KmmKg
Kml
Kcc
Jm
Jm San Mateo Creek
El Rito Creek
San Lucas Creek
San Miguel Creek
San Mateo
El Rito Creek
San Mateo Creek
605
509
605
547
Rd 239
Rd 453
Rd 1
92
Rd 456
Rd 556Arroyo del Puerto
La Jara Mesa
San Mateo Mesa
Jesus Mesa
Lava flows(Tmb)
Menefee(Kmf)
Point Lookout(Kpl)
Crevasse Canyon(Kcc)
Mancos,Mulatto Tongue(Kmm)
Lower Mancos(Kml)
Gallup(Kg)
Dakota-Mancos(Kdm)
Dakota(Kd)
Colluvium(Ql)
Alluvium(Qa)
San Rafael,undivided(Jsr)
Morrison(Jm)
Cañada las Vacas
Spring
Creek
Seep
Spring
Creek
Seep
Spring
Base from U.S. Geological Survey 1:24,000 and 1:100,000 digital data.Projection: Universal Transverse Mercator zone 13N, North American Datum of 1983.Geology from New Mexico Bureau of Geology and Mineral Resources 1:500,000 digital data.
0 2 4 MILES
0 2 4 KILOMETERS
N
Spring, creek, or seep sampling site
EXPLANATION
35˚ 25´
35˚ 20´
35˚ 15´
107˚ 45´ 107˚ 40´ 107˚ 35´

Geologic Framework and Regional Aquifer Properties 19
Figure 9. Relative differences in water-level elevations for the distribution of water-level data compiled for wells with screens located in the Quaternary alluvium. Discrete water-level data are presented in appendix 1.
605
509
. x
0 3 6 9 12 MILES
0 4 8 12 KILOMETERS
108°00'' 107°45'
Base from U.S. Geological Survey digital data, 1:24,000Projection: Universal Transverse Mercator zone 13N, North American Datum of 1983, North American Vertical Datum of 1988
Rio San Jose
San M
ateo C
reek
40
40
Higher water-level elevationLower water-level elevation
Water-level elevation comparison
The relative difference in water levels is presented through a categorical analysis of the distribution of water-level values. Using the statistical program SPlus (Tibco Software, version 8.1), each water level was assigned to one of seven distribution categories as determined by the overall distribution of water levels found in the Quarternary alluivum for the period of record. The presentation is similar to a categorical boxplot
Developed area
EXPLANATION
35˚ 30´
35˚ 20´
Mount TaylorGrantsMilan

20 Geologic Framework, Regional Aquifer Properties (1940s–2009), and Spring, Creek, and Seep Properties (2009–10)
Figure 10. Relative differences in water-level elevations for the distribution of water-level data compiled for wells with screens located in Cretaceous, Jurassic, Triassic, and Permian formations. Discrete water-level data are presented in appendix 1.
0 3 6 9 12 MILES
0 4 8 12 KILOMETERS
108°00' 107°45'
Base from U.S. Geological Survey digital data, 1:24,000Projection: Universal Transverse Mercator zone 13N, North American Datum of 1983, North American Vertical Datum of 1988
MilanGrants
Rio San Jose
MountTaylor
40
40
6 0 5
5 0 9
. x
San M
ateo C
reek
Triassic formationsJurassic formationsCretaceous formations
Permian formations
Age period grouping of wells
The relative difference in water levels is presented through a categorical analysis of the distribution of water-level values for each geologic age grouping (formations grouped by period). Using the statistical program SPlus (Tibco Software, version 8.1), each water level was assigned to one of seven distribution categories as determined by the overall distribution of water levels found in each period grouping. Each period grouping is separate, and similar-sized symbols between period groupings does not indicate similar water-level elevations. The presentation is similar to a categorical boxplot for each of the individual period groupings
35˚ 30´
35˚ 15´
Higher water-level elevationLower water-level elevation
Water-level elevation comparison
Developed area
EXPLANATION

Geologic Framework and Regional Aquifer Properties 21
but faults also can create higher permeable pathways along the fault trace (Fetter, 2001). The influence of faults is dependent upon the material in the fault zone. There likely is substan-tial displacement along some of the faults in the target area (fig. 6), but given the consolidated nature and thickness of the sedimentary formations, it is likely that faults in the study area enhance groundwater flow by increasing hydraulic conductiv-ity across the fault zones, as has been observed on regional scales with porous, sedimentary formations (Garven, 1995). Faults as barriers or conduits for groundwater flow, however, depend on the individual nature of a fault (Garven, 1995).
Water-Level ElevationsMedian values and the interquartile range of the water-
level elevations were ascertained for each aquifer in the study area. These statistics represent the midpoint of the data set and 50 percent of its distribution that allows water levels in the aquifers to be viewed without influence of outliers that may skew inferences about the data. In the San Juan Basin, it is common for there to be substantial differences in the water levels of the various aquifers in the basin and up to 200 ft or more of difference has been identified (Stone and others, 1983). Within the study area, data for the various aquifers indicate 10s to 100s of ft of difference between median water-level elevations with minimal overlap in the range of uncer-tainty as indicated by the interquartile ranges except between the Dakota and Morrison Formations (table 4). Higher water elevations are found in the upper formations. Water-level elevations generally decrease with depth, although these
values cannot be compared directly as the data of each aquifer represents only that discrete area within the study area con-taining each aquifer’s wells (see figs. 9 and 10 for the distribu-tion of wells by age groupings). Insufficient overlap of wells inhibits the interpretation of general vertical flow directions between aquifers in the study area.
The changing basal unit beneath the valley alluvium alters shallow groundwater flow because of differences in permeability of the basal unit that allows or restricts vertical migration of groundwater. In the eastern part of the basin, the presence of the Menefee Formation appears to restrict down-ward migration of groundwater from the valley alluvium. The Menefee Formation consists of interbedded shales, siltstones, and sandstones and is underlain by the Point Lookout For-mation (sandstone) (table 3). It is likely that the portion of the valley alluvium that is underlain by the Point Lookout instead of the Menefee (western part of the target area) allows greater opportunity for downward migration of water from the alluvium aquifer. This geologic transition from the Menefee to Point Lookout has a surface expression of numerous seeps and salt deposits present along the creek from the eastern part of the basin to the confluence of El Rito and San Mateo Creeks. Downgradient or westward of this location, seeps and salt deposits are no longer present, and the Point Lookout Forma-tion underlies the alluvium in this area (figs. 4 and 8).
Groundwater within the Chinle Group is confined (Frenzel, 1992), and upward migration from this aquifer into the Morrison Formation may be possible although the restricted nature of the water-elevation data sets do not allow for such a determination, given the limited overlap of
Table 4. Water-level elevation statistics for aquifers in consolidated formations in the study area.
[All values have been rounded to the nearest 5 feet; values are only shown for aquifers containing nine or more data points; NA, not available]
Deposit/formationGeneral formation
description1
Water-level elevation median
Water-level elevation
interquartile range2
Number of water-level
values in the study area
Menefee (Kmf) Mudstone, siltstone, and sandstone 7,190 7,130–7,240 61Point Lookout (Kpl) Sandstone 6,975 6,940–7,045 10Crevasse Canyon (Kcc) Siltstone and sandstone NA NA 0Mulatto Tongue of Mancos (Kmm) Sandstone and mudstone NA NA 0Gallup (Kg) Sandstone NA NA 2Mancos (Km) Mudstone and sandstone 6,815 6,710–6,830 9Dakota (Kd) Sandstones 6,615 6,495–6,790 13Morrison (Jm) Mudstone and sandstone 6,550 6,530–6,585 92Entrada Complex Sandstone, siltstone, mudstone, and limestone NA NA 3Chinle Group (TRc) Mudstone and siltstone 6,685 6,570–6,750 49San Andres (Psa) Limestone 6,455 6,440–6,480 30
1See table 3 for full formation description.2The interquartile range consists of the first and third quartiles, thereby encompassing 50 percent of the distribution.
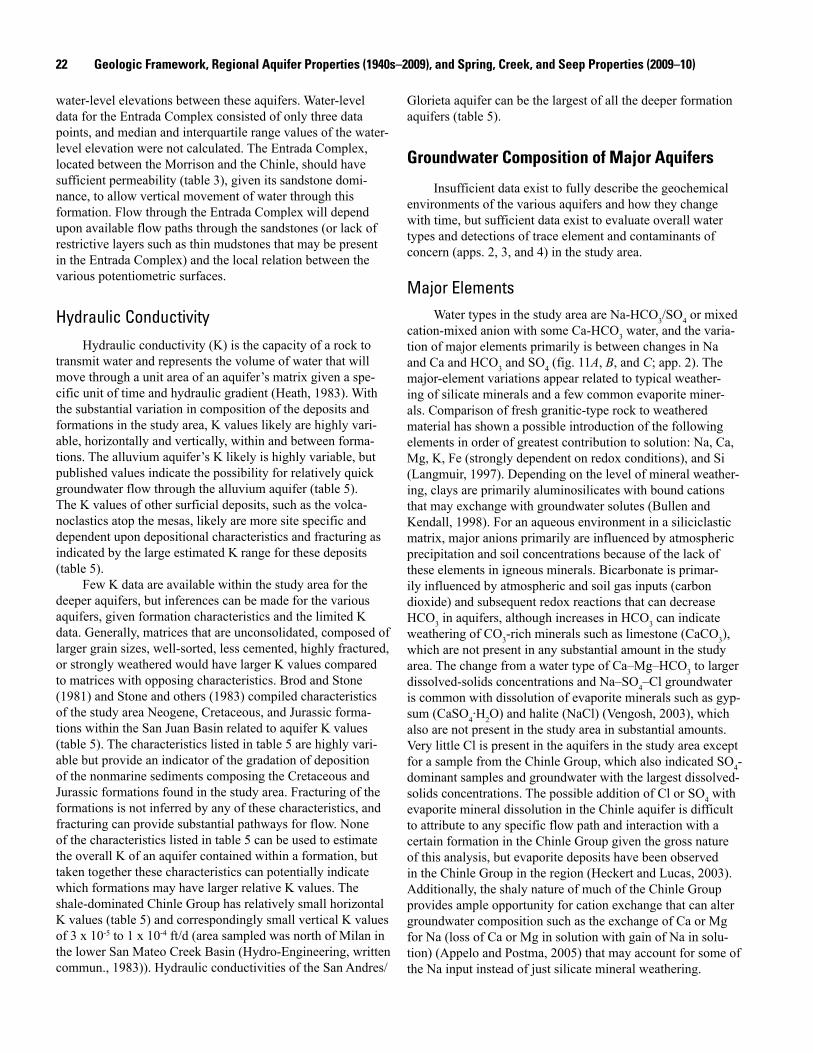
22 Geologic Framework, Regional Aquifer Properties (1940s–2009), and Spring, Creek, and Seep Properties (2009–10)
water-level elevations between these aquifers. Water-level data for the Entrada Complex consisted of only three data points, and median and interquartile range values of the water-level elevation were not calculated. The Entrada Complex, located between the Morrison and the Chinle, should have sufficient permeability (table 3), given its sandstone domi-nance, to allow vertical movement of water through this formation. Flow through the Entrada Complex will depend upon available flow paths through the sandstones (or lack of restrictive layers such as thin mudstones that may be present in the Entrada Complex) and the local relation between the various potentiometric surfaces.
Hydraulic ConductivityHydraulic conductivity (K) is the capacity of a rock to
transmit water and represents the volume of water that will move through a unit area of an aquifer’s matrix given a spe-cific unit of time and hydraulic gradient (Heath, 1983). With the substantial variation in composition of the deposits and formations in the study area, K values likely are highly vari-able, horizontally and vertically, within and between forma-tions. The alluvium aquifer’s K likely is highly variable, but published values indicate the possibility for relatively quick groundwater flow through the alluvium aquifer (table 5). The K values of other surficial deposits, such as the volca-noclastics atop the mesas, likely are more site specific and dependent upon depositional characteristics and fracturing as indicated by the large estimated K range for these deposits (table 5).
Few K data are available within the study area for the deeper aquifers, but inferences can be made for the various aquifers, given formation characteristics and the limited K data. Generally, matrices that are unconsolidated, composed of larger grain sizes, well-sorted, less cemented, highly fractured, or strongly weathered would have larger K values compared to matrices with opposing characteristics. Brod and Stone (1981) and Stone and others (1983) compiled characteristics of the study area Neogene, Cretaceous, and Jurassic forma-tions within the San Juan Basin related to aquifer K values (table 5). The characteristics listed in table 5 are highly vari-able but provide an indicator of the gradation of deposition of the nonmarine sediments composing the Cretaceous and Jurassic formations found in the study area. Fracturing of the formations is not inferred by any of these characteristics, and fracturing can provide substantial pathways for flow. None of the characteristics listed in table 5 can be used to estimate the overall K of an aquifer contained within a formation, but taken together these characteristics can potentially indicate which formations may have larger relative K values. The shale-dominated Chinle Group has relatively small horizontal K values (table 5) and correspondingly small vertical K values of 3 x 10⁻⁵ to 1 x 10⁻⁴ ft/d (area sampled was north of Milan in the lower San Mateo Creek Basin (Hydro-Engineering, written commun., 1983)). Hydraulic conductivities of the San Andres/
Glorieta aquifer can be the largest of all the deeper formation aquifers (table 5).
Groundwater Composition of Major Aquifers
Insufficient data exist to fully describe the geochemical environments of the various aquifers and how they change with time, but sufficient data exist to evaluate overall water types and detections of trace element and contaminants of concern (apps. 2, 3, and 4) in the study area.
Major ElementsWater types in the study area are Na-HCO3/SO4 or mixed
cation-mixed anion with some Ca-HCO3 water, and the varia-tion of major elements primarily is between changes in Na and Ca and HCO3 and SO4 (fig. 11A, B, and C; app. 2). The major-element variations appear related to typical weather-ing of silicate minerals and a few common evaporite miner-als. Comparison of fresh granitic-type rock to weathered material has shown a possible introduction of the following elements in order of greatest contribution to solution: Na, Ca, Mg, K, Fe (strongly dependent on redox conditions), and Si (Langmuir, 1997). Depending on the level of mineral weather-ing, clays are primarily aluminosilicates with bound cations that may exchange with groundwater solutes (Bullen and Kendall, 1998). For an aqueous environment in a siliciclastic matrix, major anions primarily are influenced by atmospheric precipitation and soil concentrations because of the lack of these elements in igneous minerals. Bicarbonate is primar-ily influenced by atmospheric and soil gas inputs (carbon dioxide) and subsequent redox reactions that can decrease HCO3 in aquifers, although increases in HCO3 can indicate weathering of CO3-rich minerals such as limestone (CaCO3), which are not present in any substantial amount in the study area. The change from a water type of Ca–Mg–HCO3 to larger dissolved-solids concentrations and Na–SO4–Cl groundwater is common with dissolution of evaporite minerals such as gyp-sum (CaSO4·H2O) and halite (NaCl) (Vengosh, 2003), which also are not present in the study area in substantial amounts. Very little Cl is present in the aquifers in the study area except for a sample from the Chinle Group, which also indicated SO4-dominant samples and groundwater with the largest dissolved-solids concentrations. The possible addition of Cl or SO4 with evaporite mineral dissolution in the Chinle aquifer is difficult to attribute to any specific flow path and interaction with a certain formation in the Chinle Group given the gross nature of this analysis, but evaporite deposits have been observed in the Chinle Group in the region (Heckert and Lucas, 2003). Additionally, the shaly nature of much of the Chinle Group provides ample opportunity for cation exchange that can alter groundwater composition such as the exchange of Ca or Mg for Na (loss of Ca or Mg in solution with gain of Na in solu-tion) (Appelo and Postma, 2005) that may account for some of the Na input instead of just silicate mineral weathering.
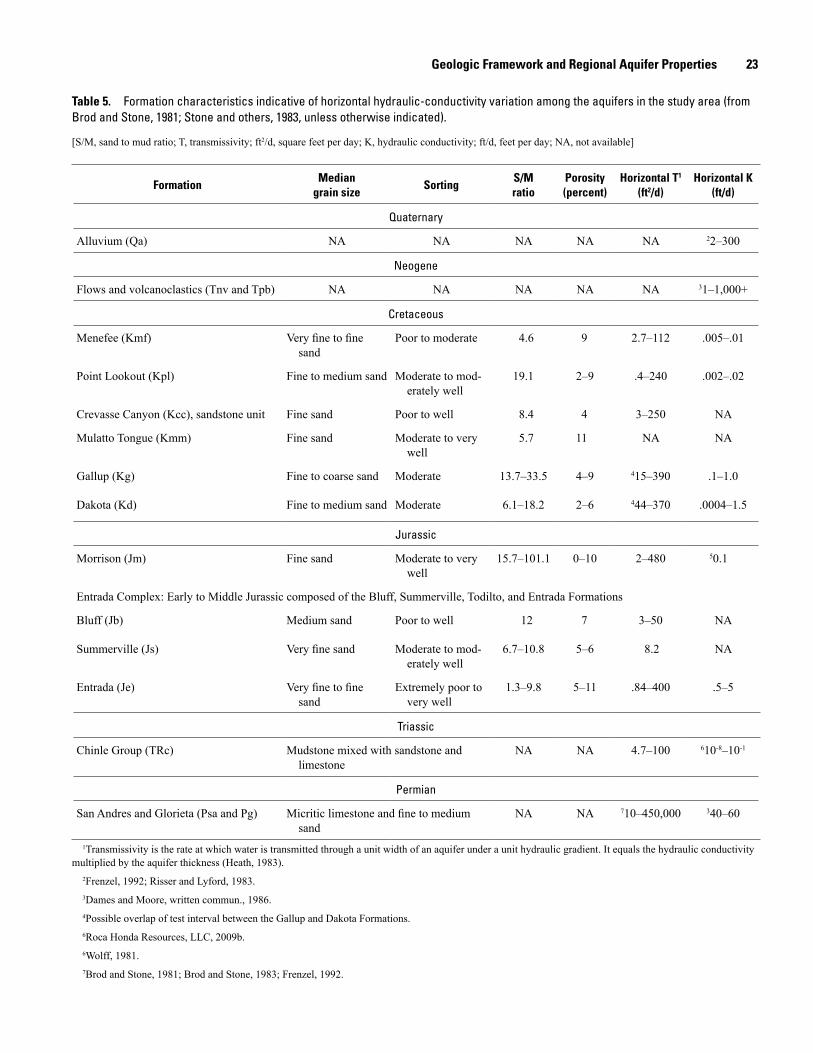
Geologic Framework and Regional Aquifer Properties 23
Table 5. Formation characteristics indicative of horizontal hydraulic-conductivity variation among the aquifers in the study area (from Brod and Stone, 1981; Stone and others, 1983, unless otherwise indicated).
[S/M, sand to mud ratio; T, transmissivity; ft2/d, square feet per day; K, hydraulic conductivity; ft/d, feet per day; NA, not available]
FormationMedian
grain sizeSorting
S/M ratio
Porosity (percent)
Horizontal T1 (ft2/d)
Horizontal K (ft/d)
Quaternary
Alluvium (Qa) NA NA NA NA NA 22–300
Neogene
Flows and volcanoclastics (Tnv and Tpb) NA NA NA NA NA 31–1,000+
Cretaceous
Menefee (Kmf) Very fine to fine sand
Poor to moderate 4.6 9 2.7–112 .005–.01
Point Lookout (Kpl) Fine to medium sand Moderate to mod-erately well
19.1 2–9 .4–240 .002–.02
Crevasse Canyon (Kcc), sandstone unit Fine sand Poor to well 8.4 4 3–250 NA
Mulatto Tongue (Kmm) Fine sand Moderate to very well
5.7 11 NA NA
Gallup (Kg) Fine to coarse sand Moderate 13.7–33.5 4–9 415–390 .1–1.0
Dakota (Kd) Fine to medium sand Moderate 6.1–18.2 2–6 444–370 .0004–1.5
Jurassic
Morrison (Jm) Fine sand Moderate to very well
15.7–101.1 0–10 2–480 50.1
Entrada Complex: Early to Middle Jurassic composed of the Bluff, Summerville, Todilto, and Entrada Formations
Bluff (Jb) Medium sand Poor to well 12 7 3–50 NA
Summerville (Js) Very fine sand Moderate to mod-erately well
6.7–10.8 5–6 8.2 NA
Entrada (Je) Very fine to fine sand
Extremely poor to very well
1.3–9.8 5–11 .84–400 .5–5
Triassic
Chinle Group (TRc) Mudstone mixed with sandstone and limestone
NA NA 4.7–100 610-8–10-1
Permian
San Andres and Glorieta (Psa and Pg) Micritic limestone and fine to medium sand
NA NA 710–450,000 340–60
1Transmissivity is the rate at which water is transmitted through a unit width of an aquifer under a unit hydraulic gradient. It equals the hydraulic conductivity multiplied by the aquifer thickness (Heath, 1983).
2Frenzel, 1992; Risser and Lyford, 1983.3Dames and Moore, written commun., 1986.4Possible overlap of test interval between the Gallup and Dakota Formations.6Roca Honda Resources, LLC, 2009b.6Wolff, 1981.7Brod and Stone, 1981; Brod and Stone, 1983; Frenzel, 1992.

24
Geologic Framew
ork, Regional Aquifer Properties (1940s–2009), and Spring, Creek, and Seep Properties (2009–10)
Figure 11. Trilinear diagrams of major-element relations for groundwater collected from the deposits and formations found in the study area. The data are a composite of available major-element concentrations collected in the study area from 1958 to 2009.
PERCENTCalcium
100
80
60
40
20
0
0
20
40
60
80
100
Mag
nesiu
m
0
2
0
40
6
0
80
1
00
Sodium plus potassium
Chloride plus fluoride
0
20
40
60
80
100
100 80
60 40
20 0
Bica
rbon
ate
100
80
60
40
20
0
Sulfate
0
2
0
40
6
0
80
1
00
Sulfa
te p
lus c
hlor
ide
0 20
40 60
80 100 Calcium
plus magnesium
100
8
0
60
4
0
20
0
100 80
60 40
20 0
PERC
ENT PERCENT
Quarternary alluvium
PERCENTCalcium
100
80
60
40
20
0
20
40
60
80
100
Mag
nesiu
m
0
2
0
40
6
0
80
1
00
Sodium plus potassium
Chloride plus fluoride
0
20
40
60
80
100
100 80
60 40
20 0 100
80
60
40
20
0
Sulfate
0
2
0 4
0
60
8
0
100
Sulfa
te p
lus c
hlor
ide
0 20
40 60
80 100 Calcium
plus magnesium
100
8
0
60
4
0
20
0
100 80
60 40
20 0
PERC
ENT PERCENT
Crevasse Canyon
Dakota
GallupMancos
MenefeePoint Lookout
PERCENTCalcium
100
80
60
40
20
0
0
20
40
60
80
100
Mag
nesiu
m
0
2
0
40
6
0
80
1
00
Sodium plus potassium
Chloride plus fluoride
0
20
40
60
80
100
100 80
60 40
20 0
Bica
rbon
ate
100
80
60
40
20
0
Sulfate
0
2
0
40
6
0
80
1
00
Sulfa
te p
lus c
hlor
ide
0 20
40 60
80 100 Calcium
plus magnesium
100
80
6
0
40
2
0
0
100 80
60 40
20 0
PERC
ENT PERCENT
Entrada Complex*Morrison
San Andres/Glorieta
*Entrada Complex represents the combined formations of the Bluff, Summerville, Todilto, and Entrada Formations that are difficult to discriminate in this area and combined for purposes of this report.
PERCENTCalcium
100
80
60
40
20
0
0
20
40
60
80
100
Mag
nesiu
m
0
2
0
40
6
0
80
1
00
Sodium plus potassium
Chloride plus fluoride
0
20
40
60
80
100
100 80
60 40
20 0
Bica
rbon
ate
100
80
60
40
20
0
Sulfate
0
2
0
40
6
0
80
1
00
Sulfa
te p
lus c
hlor
ide
0 20
40 60
80 100 Calcium
plus magnesium
100
8
0
60
4
0
20
0
100 80
60 40
20 0
PERC
ENT PERCENT
< 1,000 milligrams per liter (mg/L)
Average dissolved solids
1,000−2,000 mg/L2,000−4,000 mg/L
4,000−6,000 mg/L
> 6,000 mg/L
A. Quarternary aquifer formation B. Cretaceous aquifer formations
C. Jurassic, Triassic, Permian, aquifer formations D. Averages for all aquifer formations
Bica
rbon
ate
Chinle
Entrada Complex*Morrison
Crevasse Canyon
Dakota
Gallup
MenefeePoint Lookout
San Andres/Glorieta
Quarternary alluvium
Chinle
Mancos
EXPLANATION
EXPLANATION
EXPLANATION
EXPLANATION

Geologic Framework and Regional Aquifer Properties 25
Trace ElementsA search of existing trace-element data in the study area
produced data for Al, Sb, As, Ba, Be, B, Br, Cd, Cr, Co, Cu, Fe, Pb, Li, Mn, Mo, Ni, Se, Ag, Tl, V, and Zn. Very few of these elements were consistently detected in any aquifer, and only Ba, B, Fe, Li, Mn, V, and Zn were detected with any frequency. All existing data sources indicated some data where the elements were not detected at concentrations greater than the MDL(s), although MDLs were not regularly presented in the literature. Nondetect data were not included for analysis in this report because of missing MDLs, which severely limits the statistical analysis of the data because of the bias from this exclusion. The elements of Ba, B, Fe, Li, Mn, V, and Zn are abundant in the Earth’s crust and can be mobile in natural waters, and each element can indicate certain characteristics of mineral weathering and redox-environment changes (Hem, 1989; Nimz, 1998). The presence of the redox-sensitive elements Fe and Mn (and to a lesser degree V) indicates reducing conditions at some time in some location in most formations (table 6). Fe is present in the aquifers in vari-ous concentrations (app. 3), and it can enter solution under reducing conditions that substantially increase its solubility (Hem, 1989). As part of the USGS National Water-Quality Assessment Program redox classification system, McMahon and Chapelle (2008), proposed a reducing condition threshold 50 µg/L for Mn and 100 µg/L for Fe. As shown in appendix 3, each aquifer contained groundwater at some time that met one or both of the thresholds for reducing conditions. Given the gross nature of this analysis and data compilation and inter-connectedness of the aquifers, persistence of reducing condi-tions in any aquifer at any specific location is unknown.
Boron is the most common trace element detected and had the largest concentrations except for Fe in specific aquifers (table 6 and app. 3). Boron is an abundant element
in the Earth’s crust and is highly mobile in natural waters (Bullen and Kendall, 1998; Nimz, 1998). Chemical weather-ing appears strongest in the upper formations because of the frequency of detections of B and Li and the presence of the other common trace elements (table 6), although this could be attributed to sampling frequency. Lithium is common in pegmatites, substitutes for Mg in some minerals, and tends to remain in solution as it is less favored in common-ion exchange compared to other ions (Kelly, 1948; Heier and Billings, 1970). Because of the nature of the data and the likely interconnectedness of the aquifers, the larger presence of these elements cannot be attributed to any characteristic of the upper formations. It is possible that chemical weathering of minerals containing these elements is occurring in overly-ing formations, such as the Menefee Formation, and being transported into lower formations, such as the Point Lookout Formation. Zinc was most commonly detected in the upper aquifers and the Morrison aquifer, which could represent anthropogenic influences such as mining, where mined water or materials containing Zn were brought to the surface from the Morrison Formation and Zn was transported to the upper aquifers.
Contaminants of Concern
Groundwater in the San Mateo Creek Basin has been contaminated by past mining and milling operations, and a health advisory has been issued for existing and future private wells within the basin concerning contaminant concentra-tions in excess of Federal drinking-water standards for gross alpha, NO3, Ra, and U (New Mexico Environment Depart-ment, 2009). The sources of contamination are suspected to be naturally occurring ore deposits and former U mines and mills (New Mexico Environment Department, 2009). For purposes
Table 6. Number of detections of frequently detected trace elements in groundwater from the study area.
[Concentrations of the detected occurrence are presented in appendix 3; NA, not available]
Deposit/formation Barium Boron Iron Lithium Manganese Vanadium Zinc
Alluvium (Qa) 4 39 22 1 7 1 6Menefee (Kmf) 8 50 40 7 13 5 21Point Lookout (Kpl) 12 21 16 NA 4 1 11Crevasse Canyon (Kcc) NA 7 7 NA NA NA NAGallup (Kg) NA 13 13 1 3 NA 2Mancos (Km) NA 2 2 1 1 NA NADakota (Kd) 1 12 14 1 2 NA 2Morrison (Jm) 4 22 11 5 5 NA 11Entrada Complex (Je) NA 11 15 2 2 1 1Chinle Group (TRc) 1 9 11 NA 1 NA NASan Andres (Psa) NA 26 27 NA 3 NA 1
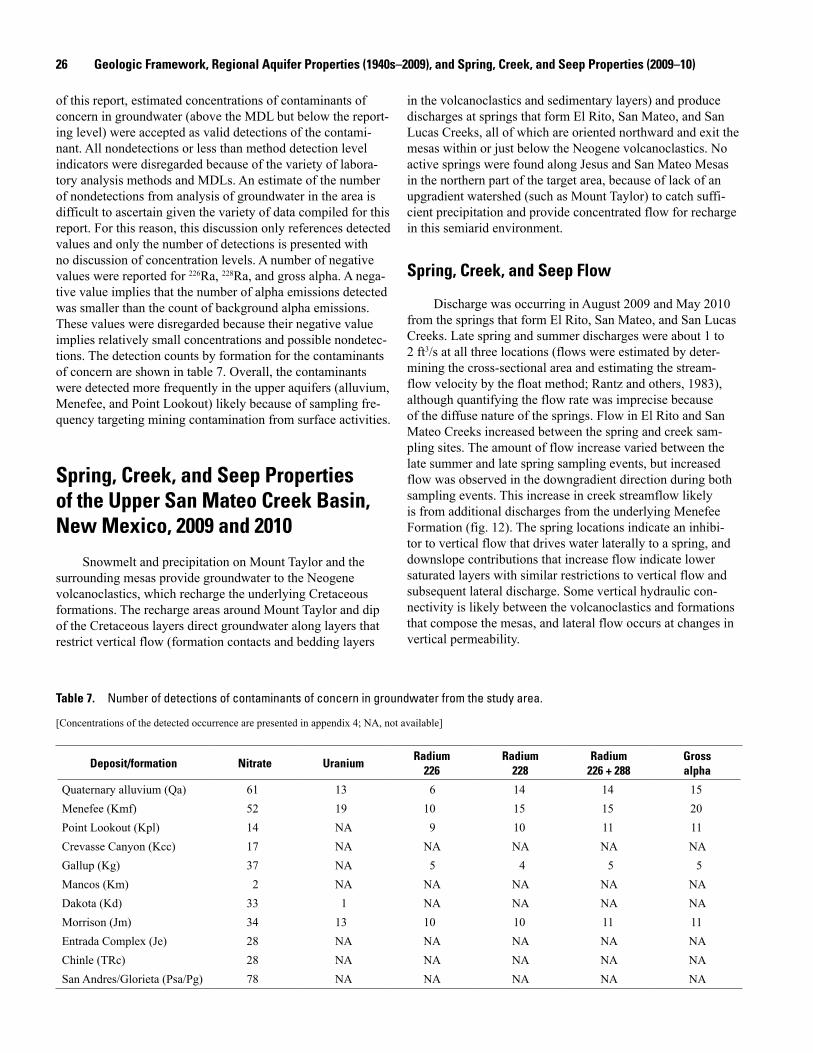
26 Geologic Framework, Regional Aquifer Properties (1940s–2009), and Spring, Creek, and Seep Properties (2009–10)
of this report, estimated concentrations of contaminants of concern in groundwater (above the MDL but below the report-ing level) were accepted as valid detections of the contami-nant. All nondetections or less than method detection level indicators were disregarded because of the variety of labora-tory analysis methods and MDLs. An estimate of the number of nondetections from analysis of groundwater in the area is difficult to ascertain given the variety of data compiled for this report. For this reason, this discussion only references detected values and only the number of detections is presented with no discussion of concentration levels. A number of negative values were reported for 226Ra, 228Ra, and gross alpha. A nega-tive value implies that the number of alpha emissions detected was smaller than the count of background alpha emissions. These values were disregarded because their negative value implies relatively small concentrations and possible nondetec-tions. The detection counts by formation for the contaminants of concern are shown in table 7. Overall, the contaminants were detected more frequently in the upper aquifers (alluvium, Menefee, and Point Lookout) likely because of sampling fre-quency targeting mining contamination from surface activities.
Spring, Creek, and Seep Properties of the Upper San Mateo Creek Basin, New Mexico, 2009 and 2010
Snowmelt and precipitation on Mount Taylor and the surrounding mesas provide groundwater to the Neogene volcanoclastics, which recharge the underlying Cretaceous formations. The recharge areas around Mount Taylor and dip of the Cretaceous layers direct groundwater along layers that restrict vertical flow (formation contacts and bedding layers
in the volcanoclastics and sedimentary layers) and produce discharges at springs that form El Rito, San Mateo, and San Lucas Creeks, all of which are oriented northward and exit the mesas within or just below the Neogene volcanoclastics. No active springs were found along Jesus and San Mateo Mesas in the northern part of the target area, because of lack of an upgradient watershed (such as Mount Taylor) to catch suffi-cient precipitation and provide concentrated flow for recharge in this semiarid environment.
Spring, Creek, and Seep Flow
Discharge was occurring in August 2009 and May 2010 from the springs that form El Rito, San Mateo, and San Lucas Creeks. Late spring and summer discharges were about 1 to 2 ft3/s at all three locations (flows were estimated by deter-mining the cross-sectional area and estimating the stream-flow velocity by the float method; Rantz and others, 1983), although quantifying the flow rate was imprecise because of the diffuse nature of the springs. Flow in El Rito and San Mateo Creeks increased between the spring and creek sam-pling sites. The amount of flow increase varied between the late summer and late spring sampling events, but increased flow was observed in the downgradient direction during both sampling events. This increase in creek streamflow likely is from additional discharges from the underlying Menefee Formation (fig. 12). The spring locations indicate an inhibi-tor to vertical flow that drives water laterally to a spring, and downslope contributions that increase flow indicate lower saturated layers with similar restrictions to vertical flow and subsequent lateral discharge. Some vertical hydraulic con-nectivity is likely between the volcanoclastics and formations that compose the mesas, and lateral flow occurs at changes in vertical permeability.
Table 7. Number of detections of contaminants of concern in groundwater from the study area.
[Concentrations of the detected occurrence are presented in appendix 4; NA, not available]
Deposit/formation Nitrate UraniumRadium
226Radium
228Radium
226 + 288Gross alpha
Quaternary alluvium (Qa) 61 13 6 14 14 15Menefee (Kmf) 52 19 10 15 15 20Point Lookout (Kpl) 14 NA 9 10 11 11Crevasse Canyon (Kcc) 17 NA NA NA NA NAGallup (Kg) 37 NA 5 4 5 5Mancos (Km) 2 NA NA NA NA NADakota (Kd) 33 1 NA NA NA NAMorrison (Jm) 34 13 10 10 11 11Entrada Complex (Je) 28 NA NA NA NA NAChinle (TRc) 28 NA NA NA NA NASan Andres/Glorieta (Psa/Pg) 78 NA NA NA NA NA
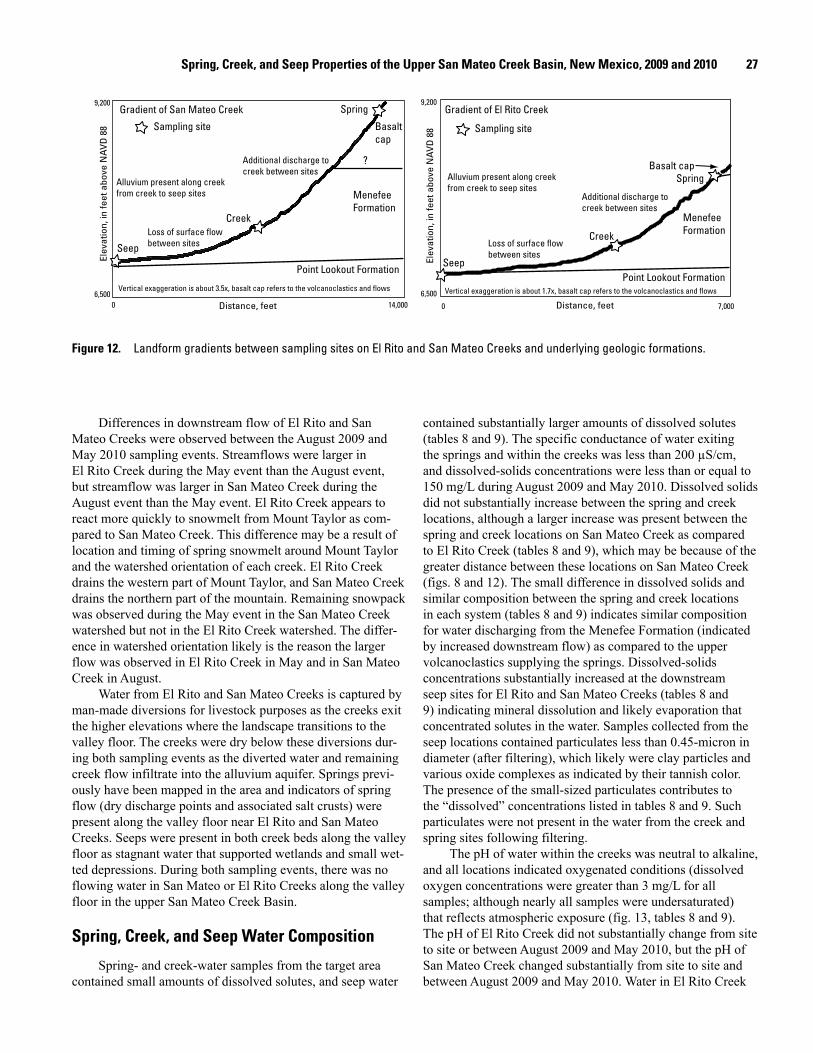
Spring, Creek, and Seep Properties of the Upper San Mateo Creek Basin, New Mexico, 2009 and 2010 27
Differences in downstream flow of El Rito and San Mateo Creeks were observed between the August 2009 and May 2010 sampling events. Streamflows were larger in El Rito Creek during the May event than the August event, but streamflow was larger in San Mateo Creek during the August event than the May event. El Rito Creek appears to react more quickly to snowmelt from Mount Taylor as com-pared to San Mateo Creek. This difference may be a result of location and timing of spring snowmelt around Mount Taylor and the watershed orientation of each creek. El Rito Creek drains the western part of Mount Taylor, and San Mateo Creek drains the northern part of the mountain. Remaining snowpack was observed during the May event in the San Mateo Creek watershed but not in the El Rito Creek watershed. The differ-ence in watershed orientation likely is the reason the larger flow was observed in El Rito Creek in May and in San Mateo Creek in August.
Water from El Rito and San Mateo Creeks is captured by man-made diversions for livestock purposes as the creeks exit the higher elevations where the landscape transitions to the valley floor. The creeks were dry below these diversions dur-ing both sampling events as the diverted water and remaining creek flow infiltrate into the alluvium aquifer. Springs previ-ously have been mapped in the area and indicators of spring flow (dry discharge points and associated salt crusts) were present along the valley floor near El Rito and San Mateo Creeks. Seeps were present in both creek beds along the valley floor as stagnant water that supported wetlands and small wet-ted depressions. During both sampling events, there was no flowing water in San Mateo or El Rito Creeks along the valley floor in the upper San Mateo Creek Basin.
Spring, Creek, and Seep Water Composition
Spring- and creek-water samples from the target area contained small amounts of dissolved solutes, and seep water
contained substantially larger amounts of dissolved solutes (tables 8 and 9). The specific conductance of water exiting the springs and within the creeks was less than 200 µS/cm, and dissolved-solids concentrations were less than or equal to 150 mg/L during August 2009 and May 2010. Dissolved solids did not substantially increase between the spring and creek locations, although a larger increase was present between the spring and creek locations on San Mateo Creek as compared to El Rito Creek (tables 8 and 9), which may be because of the greater distance between these locations on San Mateo Creek (figs. 8 and 12). The small difference in dissolved solids and similar composition between the spring and creek locations in each system (tables 8 and 9) indicates similar composition for water discharging from the Menefee Formation (indicated by increased downstream flow) as compared to the upper volcanoclastics supplying the springs. Dissolved-solids concentrations substantially increased at the downstream seep sites for El Rito and San Mateo Creeks (tables 8 and 9) indicating mineral dissolution and likely evaporation that concentrated solutes in the water. Samples collected from the seep locations contained particulates less than 0.45-micron in diameter (after filtering), which likely were clay particles and various oxide complexes as indicated by their tannish color. The presence of the small-sized particulates contributes to the “dissolved” concentrations listed in tables 8 and 9. Such particulates were not present in the water from the creek and spring sites following filtering.
The pH of water within the creeks was neutral to alkaline, and all locations indicated oxygenated conditions (dissolved oxygen concentrations were greater than 3 mg/L for all samples; although nearly all samples were undersaturated) that reflects atmospheric exposure (fig. 13, tables 8 and 9). The pH of El Rito Creek did not substantially change from site to site or between August 2009 and May 2010, but the pH of San Mateo Creek changed substantially from site to site and between August 2009 and May 2010. Water in El Rito Creek
Gradient of San Mateo Creek
Distance, feet Distance, feet
Elev
atio
n, in
feet
abo
ve N
AV
D 8
8
Elev
atio
n, in
feet
abo
ve N
AV
D 8
8
MenefeeFormation
Point Lookout Formation
?
Basaltcap
Spring
Creek
Seep
Sampling site
Vertical exaggeration is about 3.5x, basalt cap refers to the volcanoclastics and flows
Additional discharge tocreek between sites
Loss of surface flowbetween sites
Gradient of El Rito Creek
MenefeeFormation
Basalt cap
Point Lookout Formation
Spring
Creek
Seep
Sampling site
Vertical exaggeration is about 1.7x, basalt cap refers to the volcanoclastics and flows
Additional discharge tocreek between sites
Loss of surface flowbetween sites
Alluvium present along creekfrom creek to seep sites
Alluvium present along creekfrom creek to seep sites
9,200
6,500
9,200
6,500
0 7,0000 14,000
Figure 12. Landform gradients between sampling sites on El Rito and San Mateo Creeks and underlying geologic formations.

28 Geologic Framework, Regional Aquifer Properties (1940s–2009), and Spring, Creek, and Seep Properties (2009–10)
Table 8. Physical and chemical properties of springs, creeks, and seeps within the target area, August 2009.
[cond., conductance; µS/cm, microsiemens per centimeter at 25ºC; mg/L, milligrams per liter; ºC, degrees Celsius; %, percent; NTU, nephelometric turbidity unit; <, less than; µg/L, micrograms per liter; δxX (‰) = (Ratiosample/Ratiostandard − 1) x 1,000 of specified isotope ratio; ‰, per mil; pCi/L, picocurie per liter]
Constituent UnitsEl Rito
Creek SpringEl Rito Creek
El Rito Creek Seep
San Mateo Creek Spring
San Mateo Creek
San Mateo Creek Seep
San Lucas Creek Spring
General propertiespH 8.34 8.29 8.38 7.49 8.1 7.29 7.27Specific cond. µS/cm 151 159 600 119 129 1,009 181Dissolved O2 mg/L 6.07 8.2 3.79 5.43 5.22 3.86 5.61O2 saturation % 60 78 39 53 55 47 55Temperature ºC 14.7 13.1 16.5 14.2 17.5 24.8 13.8Turbidity NTU 1.1 4.1 850 4.9 6.3 NA 4.3Dissolved solids mg/L 130 130 1,300 72 120 590 130
Major elementsCalcium mg/L 14 14 8.2 13 11 42 17Magnesium mg/L 4 4.2 3.3 3.6 3.1 26 6.4Sodium mg/L 9.7 9.7 130 3.8 8.9 140 9.6Potassium mg/L 3.6 3.4 6.3 *1.2 3.4 4.1 3.4Silica mg/L 53 51 26 23 47 21 45Alkalinity mg/L 72 77 380 36 62 440 89Sulfate mg/L *1.5 *1.4 24 6.9 *1.5 60 *1.6Chloride mg/L *2.1 *2 21 *1.7 *1.7 29 *2.5Fluoride mg/L *.24 *.29 1.3 <.06 *.18 1.7 *.12
Trace elementsAluminum µg/L <18 <18 700 <18 <18 <18 <18Antimony µg/L <3.1 <3.1 <3.1 *3.2 <3.1 <3.1 <3.1Arsenic µg/L <4.4 <4.4 17 <4.4 <4.4 <4.4 <4.4Barium µg/L 19 33 28 39 26 170 24Beryllium µg/L <.47 <.47 <.47 <.47 <.47 <.47 <.47Boron µg/L *8.4 *10 190 *6.3 *8.3 110 *11Bromide µg/L <110 <110 *170 <110 <110 230 <110Cadmium µg/L <.45 <.45 <.45 <.45 <.45 <.45 <.45Chromium µg/L <.66 <.66 <.66 <.66 <.66 <.66 <.66Cobalt µg/L <1.2 <1.2 *1.8 <1.2 <1.2 <1.2 <1.2Copper µg/L <1.4 <1.4 *12 <1.4 <1.4 <1.4 <1.4Iron µg/L <22 *54 790 610 *27 <22 <22Lead µg/L <2.6 *2.6 <2.6 <2.6 <2.6 <2.6 <2.6Lithium µg/L *8.5 *8.9 17 *4 *9 66 *7Manganese µg/L <.25 *1.7 39 100 *2 310 *1.8Molybdenum µg/L <3.1 <3.1 *7.6 <3.1 <3.1 *8.6 <3.1Nickel µg/L <1.3 <1.3 *3.4 <1.3 <1.3 <1.3 <1.3Selenium µg/L <4.9 <4.9 <4.9 <4.9 <4.9 <4.9 <4.9Silver µg/L *1.4 *1.6 *1.4 *1.4 *1.6 *1.6 *1.2Strontium µg/L 93 110 120 87 76 1,000 120Thallium µg/L <4.9 <4.9 <4.9 <4.9 <4.9 <4.9 <4.9Vanadium µg/L *3.7 *3.4 57 <1.1 *2.2 *1.5 *4.8Zinc µg/L *5.8 <4.5 *7.6 *6.1 *5.4 <4.5 *8.9
Isotopesδ2H (2H/1H) ‰ -89.10 -88.46 -39.39 -83.79 -90.14 -81.92 -90.13δ18O (18O/16O) ‰ -12.58 -12.48 -5.16 -11.81 -12.52 -11.02 -12.47
Local contaminants of concernNitrate, as N mg/L .44 *.036 *.036 *.045 *.069 *.044 .19Uranium µg/L *.59 *.39 2.7 <.02 *.25 4.2 *.49Mercury µg/L <.027 <.027 <.027 <.027 <.027 <.027 <.027Radium-226 pCi/L *.19 *.28 *.21 <.15 <.15 *.2 <.15Radium-228 pCi/L <.4 <.4 <.4 <.4 *.76 *.46 <.4Gross alpha pCi/L <1.5 <1.5 3.5 <1.5 <1.5 3.4 <1.5
*Estimated value—concentration was detected below the reporting level but above the method detection level.

Spring, Creek, and Seep Properties of the Upper San Mateo Creek Basin, New Mexico, 2009 and 2010 29
Table 9. Physical and chemical properties of springs, creeks, and seeps within the target area, May 2010.
[cond., conductance; µS/cm, microsiemens per centimeter at 25ºC; mg/L, milligrams per liter; ºC, degrees Celsius; %, percent; NTU, nephelometric turbidity unit; <, less than; µg/L, micrograms per liter; δxX (‰) = (Ratiosample/Ratiostandard − 1) x 1,000 of specified isotope ratio; ‰, per mil; pCi/L, picocurie per liter]
Constituent UnitsEl Rito
Creek SpringEl Rito Creek
El Rito Creek Seep
San Mateo Creek Spring
San Mateo Creek
San Mateo Creek Seep
San Lucas Creek Spring
General propertiespH 8.16 8.19 8.57 6.98 8.09 9.23 7.98Specific cond. µS/cm 151 178 1,027 58.7 134 2,460 191Dissolved O2 mg/L 6.80 9.84 6.03 7.98 7.83 9.66 7.39O2 saturation % 64 78 69 69 79 >100 68Temperature ºC 12.7 5.4 21.8 8.7 15.8 25.0 11.6Turbidity NTU .8 11 1.8 2.2 9.8 74 8.7Dissolved solids mg/L 130 150 690 63 130 1,600 140
Major elementsCalcium mg/L 13 16 29 5 10 12 18Magnesium mg/L 3.5 4.4 22 1.3 2.8 7.9 6.2Sodium mg/L 9.6 12 190 2.9 9.8 590 10Potassium mg/L 3.8 3.8 9.5 *.99 3.7 6.8 3.7Silica mg/L 51 51 54 17 45 7.5 45Alkalinity mg/L 71 85 550 15 64 840 96Sulfate mg/L *1.5 *2 27 7.6 *2.6 380 *1.6Chloride mg/L *2.2 *2.7 14 *1.6 *2.2 130 *2.8Fluoride mg/L *.27 *.3 2.4 *.08 *.23 2.9 *.16
Trace elementsAluminum µg/L <18 <18 <18 410 *78 190 *52Antimony µg/L <3.1 <3.1 <3.1 <3.1 <3.1 <3.1 <3.1Arsenic µg/L <4.4 <4.4 *13 <4.4 <4.4 21 <4.4Barium µg/L 18 37 73 14 25 48 33Beryllium µg/L <.47 <.47 <.47 <.47 <.47 <.47 <.47Boron µg/L *9.9 *11 220 *4.4 *10 280 *12Bromide µg/L <110 <110 240 <110 <110 1,000 <110Cadmium µg/L <.45 <.45 <.45 <.45 <.45 <.45 <.45Chromium µg/L <.66 <.66 <.66 <.66 <.66 <.66 <.66Cobalt µg/L <.12 <.12 <.12 <.12 <.12 *.98 <.12Copper µg/L *1 *1.1 *4.4 *1.2 *.62 23 *1.0Iron µg/L <22 *52 <22 200 *68 340 *39Lead µg/L <.26 <.26 <.26 <.26 <.26 <.26 <.26Lithium µg/L *7.9 *5.1 78 <.26 *4 51 *2.3Manganese µg/L <.25 <.25 *.51 *2 *.79 *7.2 *.95Molybdenum µg/L <3.1 <3.1 *7.8 <3.1 <3.1 42 <3.1Nickel µg/L <1.3 <1.3 *1.9 <1.3 <1.3 *5.8 <1.3Selenium µg/L <4.9 <4.9 <4.9 <4.9 <4.9 <4.9 <4.9Silver µg/L <.93 <.93 <.93 <.93 <.93 <.93 <.93Strontium µg/L 86 120 510 32 69 280 120Thallium µg/L <4.9 <4.9 <4.9 <4.9 <4.9 <4.9 <4.9Vanadium µg/L *2.7 *2.6 13 <1.1 *2.4 38 *4.3Zinc µg/L <4.5 <4.5 <4.5 <4.5 <4.5 <4.5 <4.5
Isotopesδ2H (2H/1H) ‰ -89.51 -88.18 -73.49 -88.77 -88.67 -48.08 -89.14δ18O (18O/16O) ‰ -12.68 -12.46 -9.15 -12.59 -12.39 -3.51 -12.46
Local contaminants of concernNitrate, as N mg/L .37 *.17 <.042 <.042 *.09 <.042 *.16Uranium µg/L *.63 *.54 7.1 *.025 *.37 26 *.58Mercury µg/L <.027 <.027 <.027 <.027 <.027 <.027 <.027Radium-226 pCi/L <.15 <.15 <.15 <.15 <.15 *.34 <.15Radium-228 pCi/L <.67 <.67 <.67 <.67 *.92 .77 <.67Gross alpha pCi/L <1.5 <1.5 *2.8 <1.5 <1.5 29 <1.5
*Estimated value—concentration was detected below the reporting level but above the method detection level.

30 Geologic Framework, Regional Aquifer Properties (1940s–2009), and Spring, Creek, and Seep Properties (2009–10)
indicated a greater increase in dissolved-oxygen percent saturation with flow from the spring to creek locations as compared to San Mateo Creek, likely because of the larger topological gradient on El Rito Creek between the spring and creek locations (more turbulent flow). Dissolved-oxygen concentrations and percent saturation were equal or greater during the May 2010 sampling as compared to the August 2009 sampling for all locations.
Water Isotopes and EvaporationThe variation in isotopic composition of precipitation
may allow discrimination of recharge because of changes in the isotopic composition from temperature changes during for-mation of precipitation and additional evaporation (Genereux and Hooper, 1998; Ingraham, 1998). The δ2H and δ18O values in the two creek systems generally plot near the global mete-oric water line (GMWL) (fig. 14), which is atypical of the southwestern United States, where the semiarid climate gener-ally produces values for any surface water or groundwater that plot below the GMWL with a reduced trend slope (evaporation line) because of a greater fractionation influence on H than O (Friedman and others, 1992; Kendall and Coplen, 2001). Only the seep samples indicate values below the GMWL. The larger values of the seeps indicate heavier isotope ratios or greater loss of the lighter isotopes likely from fraction-ation during evaporation, assuming no other water sources of
different isotopic composition (no identifiable upward leakage sources given the geologic framework and likely vertical flow directions).
The water isotopes also indicate differences in source waters and (or) evaporative effect between El Rito and San Mateo Creeks. The seep in El Rito Creek contained water with a heavier isotopic value for the August sample compared to the May sample, which is expected given the higher rate of evaporation during August. This seasonal influence was different for the seep in San Mateo Creek, which contained a heavier isotopic value for the May sample. This contrast in seasonal influences between the two creeks, indicates dif-ferences in source-water inputs between the two sampling events that likely pertain to differences in source-water mixing (winter precipitation and snowmelt compared to summer thun-derstorms) and evaporation during snowmelt. This difference may be the quicker melt in the El Rito Creek watershed, given the observed lack of snow in this watershed and the presence of snow in the San Mateo Creek watershed during the May sampling event, as discussed in the Spring, Creek, and Seep Flow section. Such seasonal differences in the stable isotopes of water is common for shallow groundwater where the iso-tope signal is not attenuated (seasonal sources are not mixed) prior to discharge from the springs or seeps (Leibundgut and others, 2009). A lack of attenuation of the seasonal isotopic signal indicates that seasonal changes in flow or solutes will be visible in the spring, creek, and seep discharges.
3.5 4.5 5.5 6.5 7.5 8.5 9.5 10.5
Dissolved oxygen, in milligrams per liter
6.5
7.5
8.5
9.5
pH, i
n st
anda
rd u
nits S C
Se
S
C
Se
S C
Se
S
C
SeEl Rito Creek: S (spring), C (creek), Se (seep), black for August 2009, red for May 2010San Mateo Creek: S (spring), C (creek), Se (seep), black for August 2009, red for May 2010San Lucas Spring, black for August 2009, red for May 2010
EXPLANATION
Figure 13. Dissolved oxygen and pH relation for water from El Rito, San Lucas, and San Mateo Creeks.

Spring, Creek, and Seep Properties of the Upper San Mateo Creek Basin, New Mexico, 2009 and 2010 31
Major Elements
The ion-exchange pool at any location in a flow path exemplifies water-rock interactions and atmospheric inputs, and ions will exchange at the mineral surfaces at relatively constant rates that reflect clay mineralogy, water pH, and water chemistry (Bullen and Kendall, 1998); although, water-rock interactions that produce mineral dissolution or adsorp-tion can result in nonconservative solute behavior that limits the utility of major-element and trace-element concentrations for identifying source waters and flow paths (Langmuir, 1997). Results from the creek sampling indicated similarities in composition between the El Rito and San Mateo Creeks at comparable sampling sites (spring to spring or creek to creek) and large changes in downstream composition in each creek, mostly as a result of changes in Na and smaller changes in SO4 between the creek and seep sites (fig. 15 and tables 8 and 9). These changes alter the composition in El Rito and San Mateo Creeks from a mixed cation-HCO3 water type at the spring and creek locations to Na-HCO3 at the seeps, which can occur with silicate weathering or cation exchange (Stumm and Morgan, 1996).
The major-element data indicated a strong electrical (cation-anion) imbalance for the sample from the seep along El Rito Creek in August 2009 (14 percent greater anion charge). Water at the seep along El Rito Creek in 2009 appears to contain additional buffering compounds such as hydroxides
(largest pH value of all samples), borates (largest boron value of all samples), aluminosilicates (largest aluminum value of all samples), and organic ligands (largest concentrations for many of the trace elements) (table 8), which resulted from the inclusion of very fine suspended particles passing through the 0.45-micron filter and were visible to the naked eye. The major cations and anions also did not balance for the sample collected from the spring at San Mateo Creek during the August 2009 sampling event, but this unbalanced charge was positive. This location appears to be influenced by a change in oxidation conditions. Water from the spring was oxygenated (5.43 mg/L dissolved oxygen at a saturation level of 53 per-cent), but the water contained relatively large concentrations of Fe (610 μg/L) and Mn (100 μg/L). It appears that reducing conditions may be present in the aquifer contained within the young, cap-forming basalts. The water chemistry of the aqui-fer may not be fully represented by the spring sample site as the water becomes oxygenated and kinetic reactions of various soluble or insoluble solutes occur at different rates with the transition from reduced to oxygenated conditions.
Saturation IndicesThe presence of the major elements and trace elements in
surface water in the upper San Mateo Creek Basin may allow various mineral compounds and phases to either dissolve in or precipitate from solution given the elements’ concentrations.
Figure 14. Stable isotope ratios for water from El Rito, San Lucas, and San Mateo Creeks.
-14 -13 -12 -11 -10 -9 -8 -7 -6 -5 -4 -3-100
-90
-80
-70
-60
-50
-40
-30
δ18Ο, per mil relative to Vienna Mean Standard Ocean Water (VSMOW)
δ2H,
per
mil
rela
tive
to V
SMOW
Global precipita
tion: δ
2 H = 8.13δ
18 O + 10.8
SC
Se
S
C
Se
S C
Se
SC
Se
El Rito Creek: S (spring), C (creek), Se (seep), black for August 2009, red for May 2010San Mateo Creek: S (spring), C (creek), Se (seep), black for August 2009, red for May 2010San Lucas Spring, black for August 2009, red for May 2010
EXPLANATION

32 Geologic Framework, Regional Aquifer Properties (1940s–2009), and Spring, Creek, and Seep Properties (2009–10)
The saturation indices of possible common mineral forms were determined for the water samples from the August 2009 and May 2010 sampling events (tables 10 and 11). Negative values indicate undersaturation where a mineral might dis-solve in the water and positive values indicate supersaturation where a mineral may precipitate from the water. The saturation indices indicate similar water composition and solute concen-trations for spring to creek flow paths indicating no inputs of different water chemistries (tables 10 and 11). The increased flow between the spring and creek sites that was observed for El Rito and San Mateo Creeks is a result of the addition of water that is similar in composition to that discharging from the springs. The change from an open channel flow to infil-tration into the alluvium from the creek to seep sites allows increased mineral weathering and provides available surfaces
for sorption and cation exchange as seen with the substan-tial differences in mineral phases (tables 10 and 11). Such a change in the flow system can induce large changes in the aqueous chemical environment as the elemental composition is altered with new inputs/outputs from weathering, cation exchange, and possible precipitation of various minerals along with sorbed elements (Bullen and Kendall, 1998).
Creek Flow Paths and Geochemical Model of Transition from Creek to Seep
El Rito and San Mateo Creeks are fed by precipitation (seasonal snow and rain) around Mount Taylor that feed the springs forming these creeks near the base of the mountain.
PERCENT
Calcium
100
80
60
40
20
0
0
20
40
60
80
100
Mag
nesiu
m
0
2
0
40
6
0
80
1
00
Sodium plus potassium
Chloride plus fluoride
0
20
40
60
80
100
100 80
60 40
20 0
Carb
onat
e pl
us b
icar
bona
te
100
80
60
40
20
0
Sulfate
0
2
0
40
6
0
80
1
00
Sulfa
te p
lus c
hlor
ide
0 20
40 60
80 100
Calcium plus m
agnesium
100
8
0
60
4
0
20
0
100 80
60 40
20 0 PE
RCEN
T PERCENT
El Rito CreekEl Rito Creek Seep
El Rito Creek Spring
San Lucas Creek Spring
San Mateo CreekSan Mateo Creek Seep
San Mateo Creek Spring
EXPLANATIONDissolved solids, in milligrams per liter (mg/L)
<200
>200 to <1,000
>1,000
Black symbol is August 2009, red symbol is May 2010
Figure 15. Trilinear diagram of major-element relations for water from El Rito, San Lucas, and San Mateo Creeks.

Spring, Creek, and Seep Properties of the Upper San Mateo Creek Basin, New Mexico, 2009 and 2010 33
Table 10. Saturation indices of possible common minerals for water collected from the spring, creek, and seep locations along El Rito Creek in the target area.
[Saturation indices were calculated in PHREEQC (2.17.0) and represent the log of the ratio of the ion activity product (IAP) and the solubility product (Ksp)]
PhaseMineral
composition
August 2009 May 2010
Spring Creek Seep Spring Creek Seep
Anhydrite CaSO4 -4.14 -4.17 -7.68 -4.16 -3.95 -2.88
Barite BaSO4 -1.72 -1.48 -10.67 -1.7 -1.11 -.31
Calcite CaCO3 -.1 -.14 -8.11 -.34 -.26 1.2
Celestite SrSO4 -4.36 -4.32 -9.84 -4.39 -4.1 -2.67
Chalcedony SiO2 .61 .62 -3.37 .62 .72 .52
Chrysotile Mg3Si2O5(OH)4 -1.24 -1.72 31.32 -2.78 -3.33 2.76
Dolomite CaMg(CO3)2 -.54 -.63 -16.4 -1.07 -1.06 2.61
Fluorite CaF2 -2.67 -2.49 -12.32 -2.57 -2.29 -.72
Gypsum CaSO4·2H2O -3.89 -3.91 -7.68 -3.91 -3.69 -2.65
Halite NaCl -9.2 -9.22 -5.56 -9.18 -8.98 -7.16
Sepiolite Mg2Si3O7.5OH·3H2O .37 .12 15.26 -.55 -.46 2.62
Strontianite SrCO3 -1.77 -1.73 -10.27 -1.99 -1.81 -.06
Table 11. Saturation indices of possible common minerals for water collected from the spring, creek, and seep locations along San Mateo Creek in the target area.
[Saturation indices were calculated in PHREEQC (2.17.0) and represent the log of the ratio of the ion activity product (IAP) and the solubility product (Ksp)]
PhaseMineral
composition
August 2009 May 2010
Spring Creek Seep Spring Creek Seep
Anhydrite CaSO4 -3.48 -4.22 -2.33 -3.79 -4.02 -2.46
Barite BaSO4 -.72 -1.62 .33 -.95 -1.36 .26
Calcite CaCO3 -1.26 -.45 .1 -2.7 -.51 1.3
Celestite SrSO4 -3.71 -4.43 -2.03 -4.02 -4.23 -2.06
Chalcedony SiO2 .26 .53 .1 .2 .53 -.46
Chrysotile Mg3Si2O5(OH)4 -7.21 -2.72 -5.03 -12.54 -3.17 3.15
Dolomite CaMg(CO3)2 -2.88 -1.2 .34 -5.9 -1.36 2.83
Gypsum CaSO4·2H2O -3.23 -3.97 -2.11 -3.53 -3.77 -2.25
Halite NaCl -9.7 -9.34 -6.99 -9.81 -9.18 -5.77
Manganite MnOOH -4.73 -4.72 -5.18 -7.9 -5.15 -2.37
Rhodochrosite MnCO3 -.88 -1.82 .26 -3.58 -2.25 -.67
Sepiolite Mg2Si3O7.5OH·3H2O -4.17 -.86 -3.39 -7.6 -1.09 1.12
Strontianite SrCO3 -2.92 -2.12 -1.07 -4.35 -2.17 .22
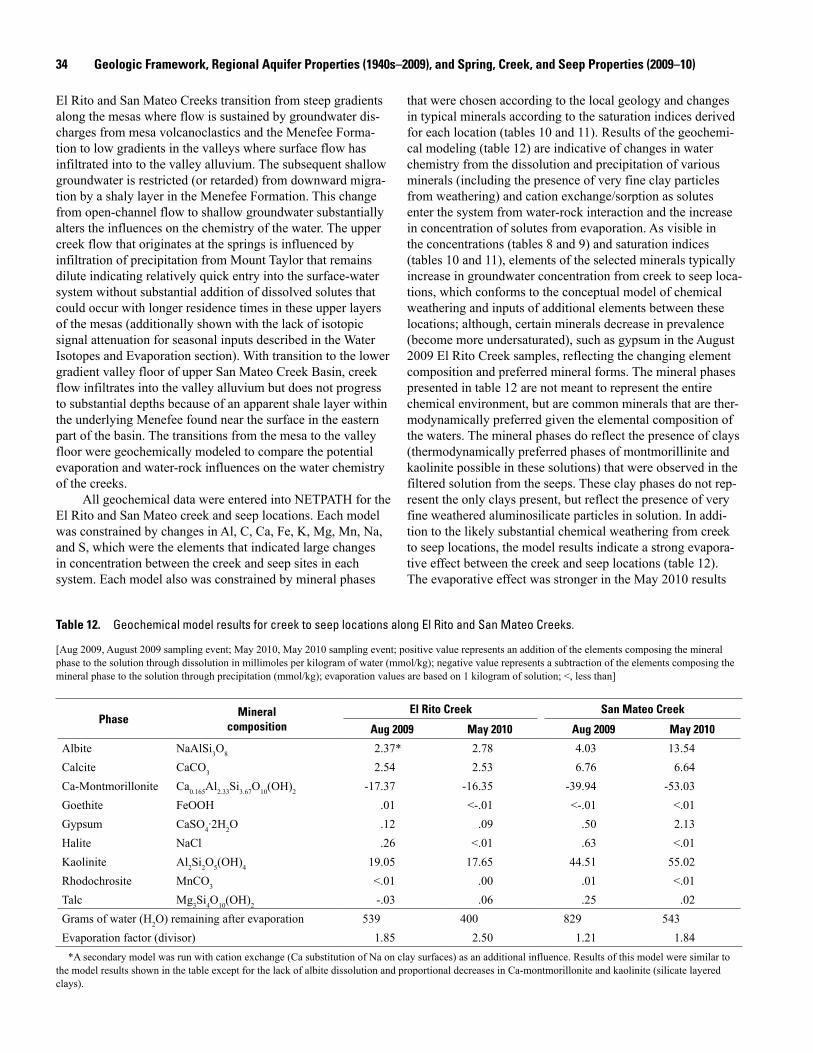
34 Geologic Framework, Regional Aquifer Properties (1940s–2009), and Spring, Creek, and Seep Properties (2009–10)
El Rito and San Mateo Creeks transition from steep gradients along the mesas where flow is sustained by groundwater dis-charges from mesa volcanoclastics and the Menefee Forma-tion to low gradients in the valleys where surface flow has infiltrated into to the valley alluvium. The subsequent shallow groundwater is restricted (or retarded) from downward migra-tion by a shaly layer in the Menefee Formation. This change from open-channel flow to shallow groundwater substantially alters the influences on the chemistry of the water. The upper creek flow that originates at the springs is influenced by infiltration of precipitation from Mount Taylor that remains dilute indicating relatively quick entry into the surface-water system without substantial addition of dissolved solutes that could occur with longer residence times in these upper layers of the mesas (additionally shown with the lack of isotopic signal attenuation for seasonal inputs described in the Water Isotopes and Evaporation section). With transition to the lower gradient valley floor of upper San Mateo Creek Basin, creek flow infiltrates into the valley alluvium but does not progress to substantial depths because of an apparent shale layer within the underlying Menefee found near the surface in the eastern part of the basin. The transitions from the mesa to the valley floor were geochemically modeled to compare the potential evaporation and water-rock influences on the water chemistry of the creeks.
All geochemical data were entered into NETPATH for the El Rito and San Mateo creek and seep locations. Each model was constrained by changes in Al, C, Ca, Fe, K, Mg, Mn, Na, and S, which were the elements that indicated large changes in concentration between the creek and seep sites in each system. Each model also was constrained by mineral phases
that were chosen according to the local geology and changes in typical minerals according to the saturation indices derived for each location (tables 10 and 11). Results of the geochemi-cal modeling (table 12) are indicative of changes in water chemistry from the dissolution and precipitation of various minerals (including the presence of very fine clay particles from weathering) and cation exchange/sorption as solutes enter the system from water-rock interaction and the increase in concentration of solutes from evaporation. As visible in the concentrations (tables 8 and 9) and saturation indices (tables 10 and 11), elements of the selected minerals typically increase in groundwater concentration from creek to seep loca-tions, which conforms to the conceptual model of chemical weathering and inputs of additional elements between these locations; although, certain minerals decrease in prevalence (become more undersaturated), such as gypsum in the August 2009 El Rito Creek samples, reflecting the changing element composition and preferred mineral forms. The mineral phases presented in table 12 are not meant to represent the entire chemical environment, but are common minerals that are ther-modynamically preferred given the elemental composition of the waters. The mineral phases do reflect the presence of clays (thermodynamically preferred phases of montmorillinite and kaolinite possible in these solutions) that were observed in the filtered solution from the seeps. These clay phases do not rep-resent the only clays present, but reflect the presence of very fine weathered aluminosilicate particles in solution. In addi-tion to the likely substantial chemical weathering from creek to seep locations, the model results indicate a strong evapora-tive effect between the creek and seep locations (table 12). The evaporative effect was stronger in the May 2010 results
Table 12. Geochemical model results for creek to seep locations along El Rito and San Mateo Creeks.
[Aug 2009, August 2009 sampling event; May 2010, May 2010 sampling event; positive value represents an addition of the elements composing the mineral phase to the solution through dissolution in millimoles per kilogram of water (mmol/kg); negative value represents a subtraction of the elements composing the mineral phase to the solution through precipitation (mmol/kg); evaporation values are based on 1 kilogram of solution; <, less than]
PhaseMineral
compositionEl Rito Creek San Mateo Creek
Aug 2009 May 2010 Aug 2009 May 2010
Albite NaAlSi3O8 2.37* 2.78 4.03 13.54Calcite CaCO3 2.54 2.53 6.76 6.64Ca-Montmorillonite Ca0.165Al2.33Si3.67O10(OH)2 -17.37 -16.35 -39.94 -53.03Goethite FeOOH .01 <-.01 <-.01 <.01Gypsum CaSO4·2H2O .12 .09 .50 2.13Halite NaCl .26 <.01 .63 <.01Kaolinite Al2Si2O5(OH)4 19.05 17.65 44.51 55.02Rhodochrosite MnCO3 <.01 .00 .01 <.01Talc Mg3Si4O10(OH)2 -.03 .06 .25 .02Grams of water (H2O) remaining after evaporation 539 400 829 543Evaporation factor (divisor) 1.85 2.50 1.21 1.84
*A secondary model was run with cation exchange (Ca substitution of Na on clay surfaces) as an additional influence. Results of this model were similar to the model results shown in the table except for the lack of albite dissolution and proportional decreases in Ca-montmorillonite and kaolinite (silicate layered clays).

Summary 35
(2.50 and 1.84 evaporation factors) as compared to the August 2009 results (1.85 and 1.21 evaporation factors). These results support the conceptual model of substantial mineral dissolu-tion with increased water-rock interaction because of the entrance of the creek flow into the subsurface with the transi-tion to the valley floor followed by substantial evaporation of the water as it reappears at the surface from seeps near the confluence of El Rito and San Mateo Creeks.
Summary
The water resources of the San Mateo Creek Basin are important to the citizens of New Mexico, in particular, the town of San Mateo and the city of Grants, for potable water sources. Citizens and tribal groups in this area are concerned about the possible effects on the water resources from explor-atory drilling and possible mining of uranium as currently (2011) proposed by various companies for U.S. Forest Service land in the upper San Mateo Creek Basin. Existing data were used to describe the geologic framework and regional aqui-fer properties, and new data were collected to characterize the springs, creeks, and seeps in the upper San Mateo Creek Basin. The geologic framework of the study area consists of the Zuni Uplift, Chaco Slope, and the Mount Taylor Volcanic Field. The major landscape features of the San Mateo Creek Basin are a result of folding and tilting during the Laramide Orogeny and the Neogene volcanism associated with the Mount Taylor Volcanic Field. Within this structural context, the sedimentary formations provide matrices for local and regional aquifers.
Groundwater in the study area occurs in numerous depos-its and formations that form unconfined and confined aquifers, and recharge occurs in highlands such as the Zuni Mountains and Mount Taylor. Existing water-level data indicate topologi-cally downgradient flow in the Quaternary alluvium aquifer and indiscernible general flow patterns in lower aquifers. According to previously published material and the geologic structure of the aquifers, the flow direction in the lower aqui-fers likely is in the opposite direction compared to the allu-vium aquifer. These opposing horizontal-flow directions are a result of different recharge areas, the unconsolidated alluvium that follows the topological gradient, and a regional opposing gradient of the lower sedimentary formations.
Insufficient data exist to fully describe the geochemical environments of the various aquifers and how they change with time, but sufficient data exist to evaluate general water types in the study area. Water types in the study area are sodium-bicarbonate/sulfate or mixed cation-mixed anion with some calcium-bicarbonate water, and the variation of major elements is primarily between changes in sodium and cal-cium and bicarbonate and sulfate. The major-element varia-tions appear related to typical weathering of silicate minerals and a few common evaporite minerals and cation-exchange processes. The presence of the reduction/oxidation-sensitive
elements iron and manganese indicates reducing conditions at some time or in some location in most formation aquifers. The large concentrations of zinc in the alluvium aquifer could represent anthropogenic influences such as mining.
Snowmelt and precipitation on Mount Taylor and the sur-rounding mesas provide groundwater to the Neogene volcano-clastics, which recharge the underlying Cretaceous formations. The upgradient recharge areas and regional dip of the Creta-ceous layers towards the north-northeast direct groundwater along likely bedding planes that restrict vertical flow and cause discharges at springs that form El Rito, San Mateo, and San Lucas Creeks. Streamflows were larger in El Rito Creek during May 2010 compared to August 2009, but streamflow was larger in San Mateo Creek during August 2009 compared to May 2010. El Rito Creek appears to react more quickly to snowmelt from Mount Taylor than does San Mateo Creek. This difference may be a result of location and timing of spring snowmelt around Mount Taylor because of differences in watershed orientation. Water from El Rito and San Mateo Creeks is captured by man-made diversions for livestock purposes as the creeks exit the higher elevations where the landscape transitions to the valley floor. The creeks were dry below these diversions during the sampling events in 2009 and 2010. The diverted water and remaining creek flow infiltrate into the alluvium aquifer, but some of this water did reemerge in seeps in the center of the upper San Mateo Creek Basin near the confluence of El Rito and San Mateo Creeks.
Spring- and creek-water samples from the target area contained small amounts of dissolved solutes, and seep water contained substantially larger amounts of dissolved solutes. The specific conductance of water exiting the springs and within the creeks was less than 200 microsiemens per centime-ter and dissolved-solids concentrations were less than or equal to 150 milligrams per liter during August 2009 and May 2010. The pH of water within the creeks was neutral to alkaline, and all locations indicated oxygenated conditions with nearly all samples being undersaturated for dissolved oxygen. Results of water-isotope analyses indicate limited evaporation at the spring and creek sites but greater evaporation by the time the water reaches the seep locations in the center of upper San Mateo Creek Basin. Variations in water isotopes between El Rito and San Mateo Creeks indicate differences in source-water inputs between the two sampling events that likely pertain to spring snowmelt compared to summer-thunderstorm precipitation.
Results from the creek sampling indicated similarities in composition between the El Rito and San Mateo Creeks at the comparable sampling sites (spring to spring or creek to creek) and large changes in downstream composition in each creek, mostly as a result of changes in sodium and smaller changes in sulfate between the creek and seep sites. These changes alter the composition in El Rito and San Mateo Creeks from mixed cation-bicarbonate water type at the spring and creek locations to sodium-bicarbonate water type at the seeps. Geochemical modeling of the transition from creek to seep locations along El Rito and San Mateo Creeks indicates chemical weathering

36 Geologic Framework, Regional Aquifer Properties (1940s–2009), and Spring, Creek, and Seep Properties (2009–10)
and additional element inputs through water-rock interac-tions and possible element composition changes from cation exchange. Additionally, the model results indicate an evapora-tive effect between the creek and seep locations and differ-ences in the chemical weathering and evaporation effects by season.
References
Agency for Toxic Substances and Disease Registry, 2008, Health Consultation, Homestake Mining Company Mill Site, Milan, Cibola County, New Mexico: Division of Health Assessment and Consultation, Agency for Toxic Substances and Disease Registry, Department of Health and Human Services, 26 p., accessed July 6, 2010, at http://www.epa.gov/region6/6sf/newmexico/homestake_mining/nm_homestake_mining_atsdr_rpt.pdf.
Appelo, C.A.J., and Postma, D., 2005, Geochemistry, ground-water, and pollution, 2d edition: AA Balkema Publishers, Rotterdam, 638 p.
Baars, D.L., 1962, Permian system of the Colorado Plateau: American Association of Petroleum Geologists Bulletin, v. 46, no. 2, p. 149–218.
Baldwin, J.A., and Anderholm, S.K., 1992, Hydrogeology and ground-water chemistry of the San Andres/Glorieta aquifer in the Acoma embayment and eastern Zuni uplift, west-central New Mexico: U.S. Geological Survey Water-Resources Investigations Report 91–4033, 304 p.
Brod, R.C., 1979, Hydrogeology and water resources of the Ambrosia Lake–San Mateo area, McKinley and Valencia counties, New Mexico: Socorro, N. Mex., M.S. thesis, New Mexico Institute of Mining and Technology, 194 p.
Brod, R.C., and Stone, W.J., 1981, Hydrogeology of Ambro-sia Lake–San Mateo area, McKinley and Cibola Counties, New Mexico: New Mexico Bureau of Mines and Mineral Resources, HS–2, text and map, scale 1:62,500.
Bullen, T.D., and Kendall, C., 1998, Tracing of weathering reactions and water flowpaths, a multi-isotope approach, in Kendall, C., and McDonnell, J.J., eds., Isotope tracers in catchment hydrology: Amsterdam, Elsevier Science B.V., chap. 18, p. 611–643.
Cather, S.M., 2003, Polyphase Laramide tectonism and sedi-mentation in the San Juan Basin, New Mexico, in Lucas, S.G., Semken, S.C., Berglof, W.R., and Ulmer-Scholle, D.S., eds., Geology of the Zuni Plateau: New Mexico Geo-logical Society, Fifty-Fourth Annual Field Conference, Las Vegas, New Mexico, New Mexico Highlands University, September 24–27, 2003, p. 119–132.
Cather, S.M., 2004, The Laramide Orogeny in central and northern New Mexico and southern Colorado, in Mack, G.H., and Giles, K.A., eds., The geology of New Mexico, a geologic history: Socorro, New Mexico Geological Society Special Publication 11, p. 203–248.
Crumpler, L.S., 1982, Volcanism in the Mount Taylor region: New Mexico Geological Society Guidebook 33, p. 291–298.
Crumpler, L.S., 2003, The Mount Taylor Volcanic Field, in Lucas, S.G., Semken, S.C., Berglof, W.R., and Ulmer-Scholle, D.S., eds., Geology of the Zuni Plateau: New Mexico Geological Society, Fifty-Fourth Annual Field Conference, Las Vegas, New Mexico, New Mexico High-lands University, September 24–27, 2003, p. 75–77.
Daly, C., and Weisburg, J., 1997, Average annual precipita-tion, New Mexico: U.S. Department of Agriculture, Natural Resources Conservation Service, National Water and Climate Center, accessed July 25, 2011, at http://www.wrcc.dri.edu/pcpn/nm.gif.
Dillinger, J.K., 1990, Geologic map of the Grants 30' x 60' quadrangle, west-central New Mexico: U.S. Geological Survey Coal Investigations map C–118–A, scale 1:100,000.
Dubiel, R.F., 1994, Triassic deposystems, paleogeography, and paleoclimate of the Western Interior, in Caputo, M.V., Peterson, J.A., and Franczyk, K.J., eds., Mesozoic systems of the Rocky Mountain region, USA: Rocky Mountain Section, Society of Economic Paleontologists and Mineralo-gists, p. 133–168.
El–Kadi, A., and Fujiwara, K., 2009, NETPATH-WIN—Windows version of NETPATH based on original model of Plummer and others (2009), distributed by the Isotope Hydrology Section of the International Atomic Energy Agency, Vienna, Austria.
Fetter, C.W., 2001, Applied hydrogeology: New Jersey, Prentice Hall, Inc., 598 p.
Fitch, D.C., 1980, Exploration for uranium deposits, Grants Mineral Belt, in Rautman, C.A., ed., Geology and min-eral technology of the Grants uranium region 1979: New Mexico Bureau of Mines and Mineral Resources, Memoir 38, p. 40–51.
Fitzsimmons, J.P., 1959, The structure and geomorphology of west-central New Mexico, in Weir, Jr., J.E., Baltz, E.H., and Cardwell, W.D.E., eds., Guidebook of west-central New Mexico: Socorro, New Mexico Geological Society, 10th Field Conference, p. 112–116.
Frenzel, P.F., 1992, Simulation of ground-water flow in the San Andres/Glorieta aquifer in the Acoma Embayment and eastern Zuni Uplift, west-central New Mexico: U.S. Geological Survey Water-Resources Investigations Report 91–4099, 381 p.

References 37
Friedman, I., Smith, G.I., Gleason, J.D., Warden, A., and Harris, J.M., 1992, Stable isotope composition of waters in southeastern California—modern precipitation: Journal Geophysical Research, v. 97, p. 5795–5812.
Garven, G., 1995, Continental-scale groundwater flow and geologic processes: Annual Review of Earth and Planetary Sciences, v. 23, p. 89–118.
Genereux, D.P., and Hooper, R.P., 1998, Oxygen and hydro-gen isotopes in rainfall-runoff studies, in Kendall, C., and McDonnell, J.J., eds., Isotope tracers in catchment hydrol-ogy: Amsterdam, Elsevier Science B.V., p. 319–346.
Gordon, E.D., 1961, Geology and ground-water resources of the Grants–Bluewater area, Valencia County, New Mexico: New Mexico State Engineer Technical Report 20, 109 p.
Heath, R.C., 1983, Basic ground-water hydrology: U.S. Geo-logical Survey Water-Supply Paper 2220, 84 p.
Heckert, A.B., and Lucas, S.G., 2003, Triassic stratigraphy in the Zuni Mountains, west-central New Mexico, in Lucas, S.G., Semken, S.C., Berglof, W.R., and Ulmer-Scholle, D.S., eds., Geology of the Zuni Plateau: New Mexico Geological Society, Fifty-Fourth Annual Field Conference, September 24–27, 2003, p. 245–262.
Heier, K.S., and Billings, G.K., 1970, Lithium, in Wedepohl, K.H., ed., Handbook of geochemistry: Berlin, Springer– Verlag, v. II–1, p. 3I1–3I3.
Hem, J.D., 1989, Study and interpretation of the chemical characteristics of natural water: U.S. Geological Survey Water-Supply Paper 2254, 263 p.
Hunt, C.B., 1938, Igneous geology and structure of the Mount Taylor Volcanic Field, New Mexico: U.S. Geological Sur-vey Professional Paper 189–B, p. 51–80.
Ingraham, N.L., 1998, Isotopic variations in precipitation, in Kendall, C., and McDonnell, J.J., eds., Isotope tracers in catchment hydrology: Amsterdam, Elsevier Science B.V., p. 87–118.
Keating, G.N., and Valentine, G.A., 1998, Proximal stratigra-phy and syn-eruptive faulting in rhyolitic Grants Ridge Tuff, New Mexico, USA: Journal of Volcanology and Geothermal Research, v. 81, no. 1–2, p. 37–49.
Kelley, V.C., and Clinton, N.J., 1960, Fracture systems and tectonic elements of the Colorado Plateaus: Albuquerque, University of New Mexico Press, Publications in Geology, no. 6, 104 p.
Kelly, W.P., 1948, Cation exchange in soils: New York, Reinhold Publishing Corporation, 114 p.
Kendall, C., and Coplen, T.B., 2001, Distribution of oxygen- 18 and deuterium in river waters across the United States: Hydrological Processes, v. 15, no. 7, p. 1363–1393.
Langmuir, D., 1997, Aqueous environmental geochemistry: New Jersey, Prentice Hall, Inc., 600 p.
Laughlin, A.W., Perry, F.V., Damon, P.E., Shafiqullah, M., WoldeGabriel, G., McIntosh, W., Harrington, C.D., Wells, S.G., and Drake, P.G., 1994, Geochronology of Mount Taylor, Cebollita Mesa, and Zuni–Bandera volcanic fields, Cibola County, New Mexico: New Mexico Geology, v. 15, no. 4, p. 81–92.
Leibundgut, C., Maloszewski, P., and Külls, C., 2009, Tracers in hydrology: West Sussex, United Kingdom, Wiley- Blackwell, 415 p.
Lipman, P.W., and Mehnert, H.H., 1979, Potassium-argon ages from the Mount Taylor Volcanic Field, New Mexico: U.S. Geological Survey Professional Paper 1124–B, 8 p.
Lipman, P.W., Pallister, J.S., and Sargent, K.A., 1979, Geologic map of the Mount Taylor quadrangle, Valen-cia County, New Mexico: U.S. Geological Survey Map GQ–1523, scale 1:24,000.
Lucas, S.G., 1993, The Chinle Group—revised stratigraphy and biochronology of upper Triassic nonmarine strata in the western United States: Museum of Northern Arizona Bul-letin, v. 59, p. 27–50.
Lucas, S.G., Semken, S.C., Berglof, W.R., and Ulmer–Scholle, D.S., eds., 2003, Geology of the Zuni Plateau: New Mexico Geological Society, Fifty-Fourth Annual Field Conference, Las Vegas, New Mexico, New Mexico Highlands Univer-sity, September 24–27, 2003, variously paged.
McCraw, D.J., Read, A.S., Lawrence, J.R., Goff, F., and Goff, C.J., 2009, Preliminary geologic map of the San Mateo quadrangle, McKinley and Cibola Counties, New Mexico: New Mexico Bureau of Geology and Mineral Resources, Open-file Digital Geologic Map OF–GM 194, map.
McLemore, V.T., and Chenoweth, W.L, 2003, Uranium resources in the San Juan Basin, New Mexico, in Lucas, S.G., Semken, S.C., Berglof, W.R., and Ulmer–Scholle, D.S., eds., Geology of the Zuni Plateau: New Mexico Geo-logical Society, Fifty-Fourth Annual Field Conference, Las Vegas, New Mexico, New Mexico Highlands University, September 24–27, 2003, p. 165–177.
McMahon, P.B., and Chapelle, F.H., 2008, Redox processes and water quality of selected principal aquifer systems: Ground Water, v. 46, no. 2, p. 259–271.
New Mexico Bureau of Geology and Mineral Resources, 2003, Geologic map of New Mexico, 1:500,000: New Mexico Bureau of Geology and Mineral Resources, map with explanation.

38 Geologic Framework, Regional Aquifer Properties (1940s–2009), and Spring, Creek, and Seep Properties (2009–10)
New Mexico Environment Department, 2009, Health advisory for the private wells within the San Mateo Creek Basin: New Mexico Environment Department, 3 p., accessed July 1, 2010, at http://www.nmenv.state.nm.us/OOTS/documents/wellhealthadvisory01072009final.pdf.
Nimz, G.J., 1998, Lithogenic and cosmogenic tracers, in Kendall, C., and McDonnell, J.J., Isotope tracers in catch-ment hydrology: Amsterdam, Elsevier Science B.V., chap-ter 8, p. 247–289.
Parkhurst, D.L., and Appelo, C.A.J., 1999, User’s guide to PHREEQC (version 2)—A computer program for specia-tion, batch-reaction, one-dimensional transport, and inverse geochemical calculations: U.S. Geological Survey Water-Resources Investigations Report 99–4259, 310 p.
Perry, F.V., Baldridge, W.S., DePaolo, J., and Shafiqullah, M., 1990, Evolution of a magmatic system during continental extension: the Mount Taylor Volcanic Field, New Mexico: Journal of Geophysical Research, v. 95, p. 19327–19348.
Plummer, L.N., Prestemon, E.C., and Parkhurst, D.L., 1994, An interactive code (NETPATH) for modeling NET geo-chemical reactions along a flowpath—Version 2.0: U.S. Geological Survey Water-Resources Investigations Report 94–4169, 130 p.
Rantz, S.E., and others, 1982, Measurement and computation of streamflow, volume 1— Measurement of stage and dis-charge: U.S. Geological Survey Water-Supply Paper 2175, 284 p.
Révész, K., and Coplen, T.B., 2008a, Determination of the δ(2H/1H) of water—RSIL Lab Code 1574, in Révész, K., and Coplen, T.B., eds., Methods of the Reston Stable Isotope Laboratory: U.S. Geological Survey Techniques and Methods, book 10, section C, chapter 1, 27 p.
Révész, K., and Coplen, T.B., 2008b, Determination of the δ(18O/16O) of water—RSIL Lab Code 489, in Révész, K., and Coplen, T.B., eds., Methods of the Reston Stable Isotope Laboratory: U.S. Geological Survey Techniques and Methods, book 10, section C, chapter 2, 28 p.
Risser, D.W., and Lyford, F.P., 1983, Water resources on the Pueblo of Laguna, west-central New Mexico: U.S. Geologi-cal Survey Water-Resources Investigations Report 83–4038, 308 p.
Roca Honda Resources, LLC, 2009a, 11-20-2009 permit application, Phase II of a new mine application—Baseline data report: Permit application to the Mining and Minerals Division of the New Mexico Energy, Minerals, and Natural Resources Department, variously paged, accessed January 3, 2011, at http://www.emnrd.state.nm.us/MMD/MARP/permits/MARP_Permits.htm.
Roca Honda Resources, LLC, 2009b, 11-20-2009 permit application, Phase II of a new mine application—Sampling and analysis plan revision, phase I of new mine application: Permit application to the Mining and Minerals Division of the New Mexico Energy, Minerals, and Natural Resources Department, variously paged, accessed January 3 , 2011, at http://www.emnrd.state.nm.us/MMD/MARP/permits/MARP_Permits.htm.
Schoeppner, J., 2008, Groundwater remediation from uranium mining in New Mexico: Southwest Hydrology, November/December issue, p. 22–23.
Stone, W.J., 2003, Hydrostratigraphy, hydrodynamics, and hydrochemistry—Geologic controls of groundwater phe-nomena in the San Juan Basin, in Lucas, S.G., Semken, S.C., Berglof, W.R., and Ulmer–Scholle, D.S., eds., Geol-ogy of the Zuni Plateau: New Mexico Geological Society, Fifty-Fourth Annual Field Conference, Las Vegas, New Mexico, New Mexico Highlands University, September 24–27, 2003, p. 191–195.
Stone, W.J., Lyford, F.P., Frenzel, P.F., Mizell, N.H., and Padgett, E.T., 1983, Hydrogeology and water resources of San Juan Basin, New Mexico: Socorro, New Mexico Bureau of Mines and Mineral Resources, Hydrologic Report 6, 70 p.
Strickland, D., Heizler, M.T., Selverstone, J., and Karlstrom, K.E., 2003, Proterozoic evolution of the Zuni Moun-tains, western New Mexico—Relationship to the Jemez Lineament and implications for a complex cooling history, in Lucas, S.G., Semken, S.C., Berglof, W.R., and Ulmer–Scholle, D.S., eds., Geology of the Zuni Plateau: New Mexico Geological Society, Fifty-Fourth Annual Field Con-ference, Las Vegas, New Mexico, New Mexico Highlands University, September 24–27, 2003, p. 109–117.
Stumm, W., and Morgan J.J., 1996, Aquatic chemistry—Chemical equilibria and rates in natural waters, (3d): New York, Wiley-Interscience, 1,022 p.
U.S. Environmental Protection Agency, 1993, Methods for the determination of inorganic substances in environmental samples: EPA/600/R–93/100, including updates, variously paged.
U.S. Environmental Protection Agency, 2009, Methods and guidance for the analysis of water (official EPA versions) including updates, variously paged on CD-ROM.
U.S. Geological Survey, 2006, Collection of water samples (ver. 2.0): U.S. Geological Survey Techniques of Water-Resources Investigations, book 9, chap. A4, variously paged, accessed July 1, 2010, at http://pubs.water.usgs.gov/twri9A4/.

References 39
U.S. Geological Survey, 2009, USGS surface-water monthly statistics for New Mexico, USGS 08342600 San Mateo Creek near San Mateo, NM: U.S. Geological Survey National Water Information System Web inter-face, http://waterdata.usgs.gov/nm/nwis/nwisman/?site_no=08342600&agency_cd=USGS.
Vengosh, A., 2003, Salinization and saline environments, in Holland, H.D., Turekian, K.K., and Sherwood Lollar, B., eds., Treatise on geochemistry: Elsevier Sciences, v. 9.09, p. 333–365.
Western Regional Climate Center, 2009, New Mexico cli-mate summaries for cooperator stations, variously paged, accessed September 9, 2010, at http://weather.nmsu.edu/cooperator1/index.htm.
WoldeGabriel, G., Keating, G.N., and Valentine, G.A., 1999, Effects of shallow basaltic intrusion into pyroclastic depos-its, Grants Ridge, New Mexico, USA: Journal of Volcanol-ogy and Geothermal Research, v. 92, no. 3–4, p. 389–411.
Wolff, R.G., 1981, Porosity, permeability, distribution coeffi-cients, and dispersivity, in Touloukian, Y.S., Judd, W.R., and Roy, R.F., eds., 1981, Physical properties of rocks and min-erals: New York, McGraw Hill/CINDAS, v. II–2, p. 45–81.
Woodward, L.A., and Callender, J.F., 1977, Tectonic frame-work of the San Juan Basin, in Fassett, J.E., and James, H.L., eds., 1977, Guidebook of San Juan Basin III, north-western New Mexico: New Mexico Geological Society, 28th Field Conference, p. 209–212.
Woody, D.T., 2006, Revised stratigraphy of the lower Chinle Formation (upper Triassic) of Petrified Forest National Park, Arizona, in Parker, W.G., Ash, S.R., and Irmis, R.B., eds., A century of research at Petrified Forest National Park, 1906–2006: Museum of Northern Arizona Bulletin 62, p. 17–45.
Yancey, C.L., and McLemore, V.T., 2008, Uranium geology of the West: Southwest Hydrology, November/December 2008, p. 20–34.


Appendix 1.—Historical Groundwater-Elevation Data


Appendix 1 43
Existing groundwater-elevation data in the study area are presented in table 1-1. The spatial distribution of the associated wells across the study area is shown in fig. 1-1 (individual well locations can be located through latitude and longitude coordi-nates presented in table 1-1). The water-level data set is a compilation of multiple sources and is presented in order of increasing geologic age of the associated formation. Initial formation designations were determined by the authors/data collectors of the source references (references listed following the table). Groundwater-elevation data without formation designations were not included for analysis in this study. For this study, formation designations were homogenized to currently (2011) accepted forma-tion nomenclature. This homogenization was necessary because of the long data record (1940s onward) during which formation identification has changed with certain formation names dropped from the lexicon or added as additional studies continued to update the stratigraphic nomenclature of the region (see Methods section).
Table 1-1. Historical groundwater-elevation data in the study area, 1946–2009.—Continued
[NAD 83, North American Datum of 1983; ft, feet; NAVD 88, North American Vertical Datum of 1988; Qa, Quaternary alluvium; NA, a specific date is not available, but the data are associated with documents that place the date within the range of 1946–2009; Kmf, Cretaceous Menefee Formation; Kpl, Cretaceous Point Lookout Formation; Kg, Cretaceous Gallup Formation; Km, Cretaceous Mancos Formation; Kd, Cretaceous Dakota Formation; Jm, Jurassic Morrison Formation; Je, Jurassic Entrada Complex (includes Entrada, Todilto, Summerville, and Bluff Formations); TRc, Triassic Chinle Group; Psa, Permian San Andres Formation (including Glorieta Formation)]
Line no.
FormationData
source*Data
identifier**Latitude (NAD 83)
Longitude (NAD 83)
Date
Water elevation
(in ft above NAVD 88)
Land-surface elevation
(in ft above NAVD 88)
1 Qa RHR 21 35.323 107.684 03/23/78 7,062 7,0772 Qa RHR 23 35.325 107.683 03/23/78 7,055 7,0703 Qa RHR 24 35.324 107.682 03/23/78 7,055 7,0704 Qa RHR 28 35.337 107.654 NA 7,144 7,2245 Qa RHR 33 35.334 107.657 06/17/78 7,122 7,1526 Qa RHR 36 35.335 107.649 07/03/80 7,194 7,2247 Qa RHR 40 35.344 107.637 NA 7,274 7,2798 Qa RHR 43 35.342 107.637 NA 7,277 7,2859 Qa RHR 53 35.339 107.637 NA 7,303 7,307
10 Qa RHR 54 35.336 107.637 NA 7,310 7,34911 Qa RHR 59 35.333 107.637 NA 7,362 7,47012 Qa RHR 60 35.333 107.637 NA 7,362 7,47013 Qa RHR 69 35.338 107.635 NA 7,326 7,32814 Qa RHR 70 35.336 107.636 NA 7,326 7,35415 Qa RHR 76 35.330 107.644 09/01/62 7,303 7,33916 Qa RHR 79 35.331 107.645 09/01/62 7,267 7,28717 Qa RHR 85 35.330 107.643 06/22/81 7,250 7,30018 Qa RHR 87 35.330 107.643 08/18/80 7,352 7,40219 Qa RHR 88 35.331 107.653 05/29/05 7,181 7,21520 Qa RHR 96 35.331 107.647 12/12/79 7,238 7,27421 Qa RHR 106 35.364 107.769 08/31/89 6,863 6,90022 Qa RHR 115 35.347 107.776 03/01/75 6,797 6,83423 Qa RHR 116 35.345 107.786 05/10/05 6,744 6,82424 Qa RHR 119 35.346 107.756 03/01/76 6,816 6,86725 Qa RHR 120 35.348 107.738 12/01/57 6,856 6,91326 Qa RHR 121 35.348 107.739 12/01/57 6,856 6,91327 Qa Stone 15.10.32.214 35.491 107.914 09/18/62 7,451 7,46028 Qa Stone 13.09.24.221a 35.347 107.737 12/06/57 6,853 6,91029 Qa Stone 13.08.25.111 35.333 107.661 09/11/62 7,276 7,29530 Qa Stone 12.09.06.312 35.296 107.831 07/25/56 6,599 6,673
Appendix 1

44 Geologic Framework, Regional Aquifer Properties (1940s–2009), and Spring, Creek, and Seep Properties (2009–10)
Table 1-1. Historical groundwater-elevation data in the study area, 1946–2009.—Continued
[NAD 83, North American Datum of 1983; ft, feet; NAVD 88, North American Vertical Datum of 1988; Qa, Quaternary alluvium; NA, a specific date is not available, but the data are associated with documents that place the date within the range of 1946–2009; Kmf, Cretaceous Menefee Formation; Kpl, Cretaceous Point Lookout Formation; Kg, Cretaceous Gallup Formation; Km, Cretaceous Mancos Formation; Kd, Cretaceous Dakota Formation; Jm, Jurassic Morrison Formation; Je, Jurassic Entrada Complex (includes Entrada, Todilto, Summerville, and Bluff Formations); TRc, Triassic Chinle Group; Psa, Permian San Andres Formation (including Glorieta Formation)]
Line no.
FormationData
source*Data
identifier**Latitude (NAD 83)
Longitude (NAD 83)
Date
Water elevation
(in ft above NAVD 88)
Land-surface elevation
(in ft above NAVD 88)
31 Qa Stone 12.09.07.3431 35.278 107.830 11/30/55 6,582 6,64032 Qa Stone 12.11.15.214 35.273 107.981 NA 6,550 6,63033 Qa Stone 12.10.27.222 35.246 107.871 09/01/58 6,520 6,57034 Qa Stone 12.10.32.211 35.232 107.914 01/04/47 6,480 6,55535 Qa Stone 11.10.04.422 35.210 107.889 07/26/56 6,462 6,53836 Qa Stone 11.10.02.421 35.210 107.856 03/01/59 6,468 6,59837 Qa Stone 11.10.16.142a 35.185 107.898 10/15/57 6,450 6,53038 Qa Stone 11.10.21.242 35.171 107.889 06/12/49 6,467 6,51539 Qa Stone 11.10.22.243 35.169 107.873 10/01/58 6,800 6,91040 Qa Stone 11.09.30.211 35.160 107.821 NA 6,437 6,47541 Qa Stone 11.09.30.122a 35.160 107.828 NA 6,429 6,47042 Qa Stone 11.09.30.122 35.160 107.828 05/11/49 6,417 6,47043 Qa Stone 11.10.25.221 35.160 107.839 08/26/56 6,429 6,44044 Qa Stone 11.10.26.321a 35.153 107.865 09/05/57 6,431 6,46545 Qa Stone 11.10.26.441 35.149 107.857 09/20/57 6,435 6,45046 Qa Stone 11.10.27.414 35.151 107.876 01/03/47 6,459 6,49547 Qa Stone 12.10.26.23 35.241 107.860 03/05/54 6,450 6,55048 Qa Stone 11.10.26.414 35.151 107.858 09/28/56 6,435 6,45049 Qa Stone 10.09.06.111 35.131 107.835 11/27/58 6,426 6,43050 Qa USGS 351638107495001 35.277 107.831 11/30/55 6,585 6,64351 Qa USGS 351640107494801 35.278 107.831 03/29/84 6,603 6,64552 Qa USGS 351722107502001 35.289 107.840 03/29/84 6,623 6,65553 Qa USGS 351745107495301 35.296 107.832 07/25/56 6,603 6,67754 Qa Brod A3 35.290 107.850 07/01/56 6,589 6,65755 Qa Brod A5 35.281 107.841 08/01/77 6,585 6,64056 Qa Brod A4 35.277 107.844 07/01/56 6,567 6,62557 Qa Brod A6 35.275 107.866 07/01/56 6,571 6,62158 Qa Brod A1 35.296 107.830 07/01/56 6,593 6,67359 Qa Brod A2 35.276 107.830 11/01/55 6,582 6,64060 Qa Brod A10 35.338 107.788 03/01/75 6,721 6,82961 Qa Brod A11 35.347 107.782 12/01/57 6,743 6,83062 Qa Brod A12 35.347 107.749 12/01/57 6,584 6,91063 Qa Brod A3 35.347 107.749 12/01/57 6,853 6,91064 Qa Brod A14 35.333 107.788 08/05/77 6,722 6,78065 Qa Brod A8 35.387 107.806 03/01/75 6,876 6,89666 Qa Brod A9 35.388 107.815 03/01/75 6,880 6,90467 Qa Brod A16 35.408 107.837 02/01/75 6,925 6,95868 Qa Brod A17 35.409 107.832 02/01/75 6,923 6,94769 Qa Brod A18 35.409 107.830 02/01/75 6,915 6,95270 Qa Brod A19 35.398 107.828 03/01/75 6,923 6,926

Appendix 1 45
Table 1-1. Historical groundwater-elevation data in the study area, 1946–2009.—Continued
[NAD 83, North American Datum of 1983; ft, feet; NAVD 88, North American Vertical Datum of 1988; Qa, Quaternary alluvium; NA, a specific date is not available, but the data are associated with documents that place the date within the range of 1946–2009; Kmf, Cretaceous Menefee Formation; Kpl, Cretaceous Point Lookout Formation; Kg, Cretaceous Gallup Formation; Km, Cretaceous Mancos Formation; Kd, Cretaceous Dakota Formation; Jm, Jurassic Morrison Formation; Je, Jurassic Entrada Complex (includes Entrada, Todilto, Summerville, and Bluff Formations); TRc, Triassic Chinle Group; Psa, Permian San Andres Formation (including Glorieta Formation)]
Line no.
FormationData
source*Data
identifier**Latitude (NAD 83)
Longitude (NAD 83)
Date
Water elevation
(in ft above NAVD 88)
Land-surface elevation
(in ft above NAVD 88)
71 Qa Brod A20 35.403 107.805 02/01/75 6,890 6,93672 Qa Brod A21 35.396 107.817 02/01/75 6,907 6,91073 Qa Brod A22 35.398 107.819 02/01/75 6,901 6,92274 Qa Brod A23 35.398 107.821 02/01/75 6,895 6,92475 Kmf RHR 5 35.384 107.637 08/18/79 7,159 7,23176 Kmf RHR 7 35.368 107.659 NA 7,121 7,19877 Kmf RHR 9 35.353 107.646 09/10/62 7,114 7,18578 Kmf RHR 20 35.342 107.664 10/23/62 7,066 7,10379 Kmf RHR 27 35.335 107.657 02/01/78 7,138 7,17880 Kmf RHR 31 35.334 107.651 10/17/72 7,170 7,20581 Kmf RHR 34 35.335 107.655 06/03/05 6,915 7,17582 Kmf RHR 42 35.342 107.640 10/01/72 7,198 7,25783 Kmf RHR 45 35.340 107.637 NA 7,290 7,30384 Kmf RHR 47 35.348 107.737 NA 7,335 7,42585 Kmf RHR 48 35.343 107.631 06/02/73 7,138 7,32386 Kmf RHR 57 35.333 107.642 09/10/62 7,207 7,29787 Kmf RHR 31 35.335 107.637 NA 7,301 7,31688 Kmf RHR 61 35.333 107.642 02/01/78 7,196 7,29789 Kmf RHR 62 35.334 107.643 05/29/05 7,209 7,29790 Kmf RHR 63 35.335 107.640 03/01/78 7,141 7,28091 Kmf RHR 37 35.335 107.637 NA 7,301 7,31692 Kmf RHR 66 35.339 107.633 NA 7,092 7,35293 Kmf RHR 75 35.331 107.642 09/10/62 7,260 7,30394 Kmf RHR 77 35.329 107.642 10/01/72 7,259 7,33995 Kmf RHR 80 35.329 107.642 10/11/72 7,312 7,33996 Kmf RHR 82 35.329 107.640 07/31/71 7,317 7,39297 Kmf RHR 84 35.328 107.641 09/08/80 7,229 7,34998 Kmf RHR 89 35.334 107.653 08/01/73 7,179 7,21599 Kmf RHR 91 35.331 107.641 10/24/72 7,221 7,254
100 Kmf RHR 92 35.331 107.646 02/01/78 7,255 7,277101 Kmf RHR 94 35.330 107.648 04/21/89 7,200 7,270102 Kmf RHR 98 35.325 107.680 08/01/77 7,046 7,070103 Kmf RHR 100 35.320 107.693 01/01/47 7,050 7,070104 Kmf RHR 104 35.309 107.687 01/01/67 7,142 7,192105 Kmf Stone 13.08.14.422 35.354 107.646 09/10/62 7,109 7,180106 Kmf Stone 13.08.24.223 35.345 107.631 09/10/62 7,189 7,330107 Kmf Stone 13.08.22.242 35.344 107.664 10/23/62 7,073 7,110108 Kmf Stone 13.08.23.432 35.336 107.651 NA 7,142 7,180109 Kmf Stone 13.08.24.334 35.335 107.643 NA 7,240 7,290110 Kmf Stone 13.08.24.334a 35.335 107.643 09/10/62 7,210 7,300

46 Geologic Framework, Regional Aquifer Properties (1940s–2009), and Spring, Creek, and Seep Properties (2009–10)
Table 1-1. Historical groundwater-elevation data in the study area, 1946–2009.—Continued
[NAD 83, North American Datum of 1983; ft, feet; NAVD 88, North American Vertical Datum of 1988; Qa, Quaternary alluvium; NA, a specific date is not available, but the data are associated with documents that place the date within the range of 1946–2009; Kmf, Cretaceous Menefee Formation; Kpl, Cretaceous Point Lookout Formation; Kg, Cretaceous Gallup Formation; Km, Cretaceous Mancos Formation; Kd, Cretaceous Dakota Formation; Jm, Jurassic Morrison Formation; Je, Jurassic Entrada Complex (includes Entrada, Todilto, Summerville, and Bluff Formations); TRc, Triassic Chinle Group; Psa, Permian San Andres Formation (including Glorieta Formation)]
Line no.
FormationData
source*Data
identifier**Latitude (NAD 83)
Longitude (NAD 83)
Date
Water elevation
(in ft above NAVD 88)
Land-surface elevation
(in ft above NAVD 88)
111 Kmf Stone 13.08.24.334b 35.334 107.642 09/10/62 7,205 7,295112 Kmf Stone 13.08.26.211 35.333 107.653 09/11/62 7,182 7,215113 Kmf Stone 13.08.25.114 35.331 107.642 09/11/62 7,274 7,310114 Kmf Stone 15.08.21.4414 35.509 107.685 09/20/62 6,747 6,857115 Kmf USGS 352004107383001 35.334 107.642 09/10/62 7,259 7,299116 Kmf Brod MF9 35.254 107.637 05/15/05 7,240 7,290117 Kmf Brod MF1 35.354 107.654 10/01/72 7,124 7,180118 Kmf Brod MF1 35.354 107.654 09/01/62 7,108 7,180119 Kmf Brod MF2 35.343 107.676 10/01/72 7,077 7,110120 Kmf Brod MF2 35.343 107.676 10/01/62 7,073 7,110121 Kmf Brod MF4 35.336 107.658 02/01/78 7,132 7,169122 Kmf Brod MF5 35.336 107.652 09/01/62 7,142 7,180123 Kmf Brod MF6 35.344 107.632 02/01/78 7,189 7,248124 Kmf Brod MF8 35.345 107.645 09/01/62 7,179 7,320125 Kmf Brod MF8 35.345 107.645 10/01/72 7,125 7,320126 Kmf Brod MF10 35.335 107.643 09/01/62 7,211 7,300127 Kmf Brod MF10 35.335 107.643 02/01/78 7,207 7,295128 Kmf Brod MF14 35.336 107.641 03/01/78 7,186 7,325129 Kmf Brod MF15 35.331 107.632 09/01/62 7,277 7,320130 Kmf Brod MF16 35.331 107.630 10/01/72 7,263 7,290131 Kmf Brod MF17 35.331 107.630 09/01/62 7,274 7,310132 Kmf Brod MF18 35.331 107.630 10/01/72 7,230 7,310133 Kmf Brod MF19 35.332 107.656 09/01/62 7,182 7,215134 Kmf Brod MF20 35.332 107.656 08/01/73 7,171 7,207135 Kmf Brod MF21 35.332 107.663 02/01/78 7,246 7,267136 Kpl RHR 25 35.333 107.664 06/15/00 7,049 7,136137 Kpl RHR 50 35.340 107.631 NA 6,899 7,369138 Kpl RHR 83 35.332 107.640 05/29/05 7,044 7,313139 Kpl RHR 90 35.332 107.651 09/11/62 6,973 7,254140 Kpl RHR 93 35.331 107.649 NA 7,041 7,251141 Kpl RHR 103 35.311 107.686 08/01/77 7,056 7,169142 Kpl Stone 13.08.26.221 35.333 107.648 09/11/62 6,934 7,215143 Kpl RHR 123 35.433 107.607 NA 6,913 6,925144 Kpl RHR 127 35.456 107.634 NA 6,972 6,986145 Kpl Brod P2 35.333 107.659 NA 6,959 7,240146 Kg RHR 32 35.338 107.662 05/28/02 7,016 7,123147 Kg USGS 352632107394801 35.442 107.664 07/23/86 6,485 7,184148 Km RHR 72 35.339 107.633 05/29/05 6,649 7,349149 Km RHR 72 35.339 107.633 NA 6,649 7,368150 Km RHR 107 35.360 107.750 02/01/58 6,799 6,942

Appendix 1 47
Table 1-1. Historical groundwater-elevation data in the study area, 1946–2009.—Continued
[NAD 83, North American Datum of 1983; ft, feet; NAVD 88, North American Vertical Datum of 1988; Qa, Quaternary alluvium; NA, a specific date is not available, but the data are associated with documents that place the date within the range of 1946–2009; Kmf, Cretaceous Menefee Formation; Kpl, Cretaceous Point Lookout Formation; Kg, Cretaceous Gallup Formation; Km, Cretaceous Mancos Formation; Kd, Cretaceous Dakota Formation; Jm, Jurassic Morrison Formation; Je, Jurassic Entrada Complex (includes Entrada, Todilto, Summerville, and Bluff Formations); TRc, Triassic Chinle Group; Psa, Permian San Andres Formation (including Glorieta Formation)]
Line no.
FormationData
source*Data
identifier**Latitude (NAD 83)
Longitude (NAD 83)
Date
Water elevation
(in ft above NAVD 88)
Land-surface elevation
(in ft above NAVD 88)
151 Km Stone 14.09.05.4323 35.466 107.813 12/16/57 6,831 7,245152 Km Stone 14.08.15.244 35.442 107.663 04/03/61 6,978 7,478153 Km Brod MN4 35.398 107.848 03/01/75 6,977 7,010154 Km Brod MN1 35.443 107.673 NA 6,710 7,210155 Km Brod MN3 35.398 107.816 02/01/75 6,815 6,923156 Km Brod MN2 35.467 107.815 12/01/57 6,831 7,245157 Kd RHR 14 35.358 107.704 04/01/81 5,863 7,178158 Kd RHR 17 35.358 107.728 06/14/03 6,417 7,041159 Kd RHR 18 35.360 107.719 12/31/74 6,333 7,133160 Kd Stone 14.09.34.422 35.396 107.769 12/18/58 6,500 7,008161 Kd Stone 15.11.25.334 35.494 107.959 08/02/61 6,615 7,280162 Kd Stone 13.09.13.1114 35.361 107.750 02/13/58 6,792 6,935163 Kd Stone 13.09.16.3241 35.353 107.796 12/17/57 6,734 6,810164 Kd Stone 13.09.16.333 35.349 107.803 12/17/57 6,822 6,910165 Kd Stone 14.09.28.233 35.414 107.960 10/10/57 6,569 6,999166 Kd Stone 14.09.28.234 35.414 107.791 10/30/57 6,493 7,022167 Kd Brod DK2 35.361 107.735 02/01/58 6,792 6,935168 Kd Brod DK3 35.349 107.803 12/01/57 6,822 6,910169 Kd Brod DK4 35.351 107.799 12/01/57 6,734 6,810170 Jm Stone 13.09.14.4143 35.352 107.757 10/04/58 6,625 6,896171 Jm Stone 14.10.11.434a 35.450 107.862 10/18/60 6,495 7,065172 Jm RHR 1 35.324 107.614 NA 7,709 8,209173 Jm RHR 73 35.339 107.637 10/01/76 6,238 7,300174 Jm RHR 109 35.348 107.758 04/02/86 6,643 6,890175 Jm RHR 110 35.347 107.781 12/01/57 6,614 6,837176 Jm RHR 111 35.349 107.780 07/21/86 6,643 6,847177 Jm RHR 112 35.346 107.786 NA 6,611 6,831178 Jm RHR 113 35.347 107.783 12/01/58 6,632 6,837179 Jm RHR 114 35.346 107.785 10/01/62 6,639 6,837180 Jm RHR 117 35.346 107.783 01/18/79 6,641 6,831181 Jm RHR 134 35.393 107.750 NA 6,511 7,093182 Jm RHR 135 35.396 107.768 NA 6,526 7,034183 Jm RHR 137 35.393 107.747 NA 7,133 7,133184 Jm Stone 15.10.20.124 35.520 107.919 09/19/77 6,554 7,554185 Jm Stone 15.11.29.1132 35.505 108.033 07/26/76 6,632 7,075186 Jm Stone 14.10.11.434 35.450 107.862 11/07/57 6,600 7,060187 Jm Stone 14.10.22.214 35.433 107.880 03/27/57 6,552 7,077188 Jm Stone 14.10.23.114 35.432 107.871 05/07/57 6,551 7,053189 Jm Stone 14.10.23.132 35.430 107.871 05/07/57 6,549 7,034190 Jm Stone 14.10.23.141 35.430 107.869 05/07/57 6,549 7,047
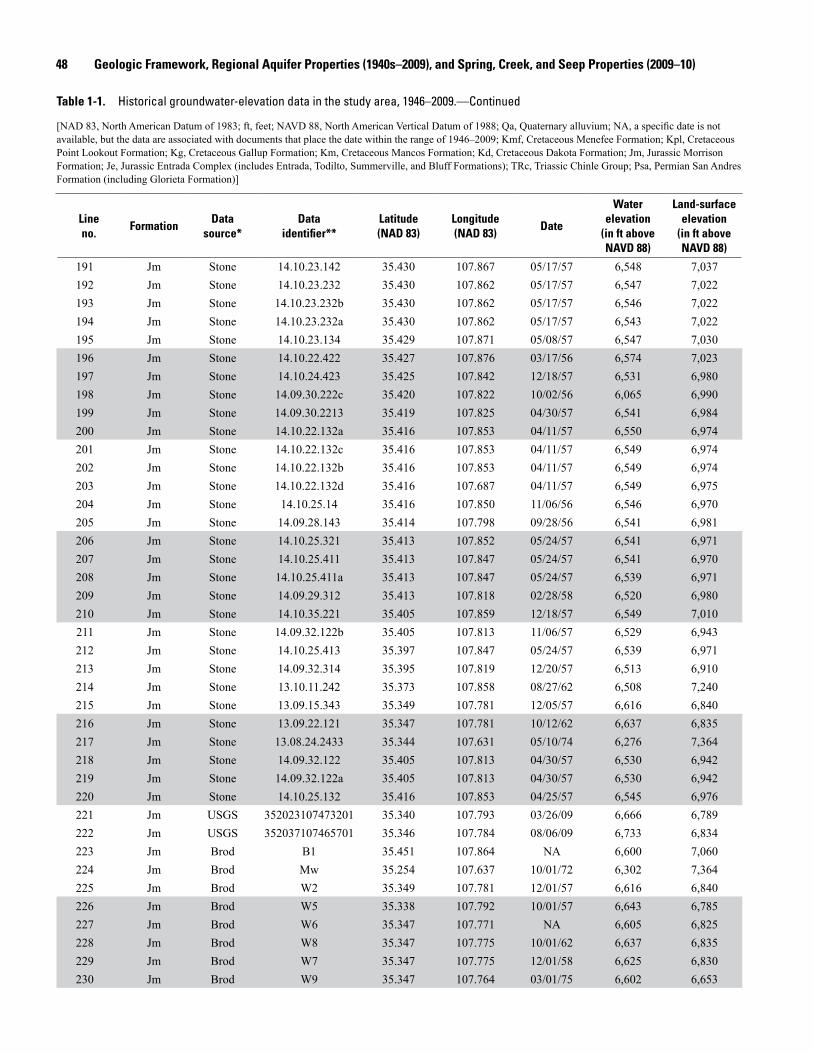
48 Geologic Framework, Regional Aquifer Properties (1940s–2009), and Spring, Creek, and Seep Properties (2009–10)
Table 1-1. Historical groundwater-elevation data in the study area, 1946–2009.—Continued
[NAD 83, North American Datum of 1983; ft, feet; NAVD 88, North American Vertical Datum of 1988; Qa, Quaternary alluvium; NA, a specific date is not available, but the data are associated with documents that place the date within the range of 1946–2009; Kmf, Cretaceous Menefee Formation; Kpl, Cretaceous Point Lookout Formation; Kg, Cretaceous Gallup Formation; Km, Cretaceous Mancos Formation; Kd, Cretaceous Dakota Formation; Jm, Jurassic Morrison Formation; Je, Jurassic Entrada Complex (includes Entrada, Todilto, Summerville, and Bluff Formations); TRc, Triassic Chinle Group; Psa, Permian San Andres Formation (including Glorieta Formation)]
Line no.
FormationData
source*Data
identifier**Latitude (NAD 83)
Longitude (NAD 83)
Date
Water elevation
(in ft above NAVD 88)
Land-surface elevation
(in ft above NAVD 88)
191 Jm Stone 14.10.23.142 35.430 107.867 05/17/57 6,548 7,037192 Jm Stone 14.10.23.232 35.430 107.862 05/17/57 6,547 7,022193 Jm Stone 14.10.23.232b 35.430 107.862 05/17/57 6,546 7,022194 Jm Stone 14.10.23.232a 35.430 107.862 05/17/57 6,543 7,022195 Jm Stone 14.10.23.134 35.429 107.871 05/08/57 6,547 7,030196 Jm Stone 14.10.22.422 35.427 107.876 03/17/56 6,574 7,023197 Jm Stone 14.10.24.423 35.425 107.842 12/18/57 6,531 6,980198 Jm Stone 14.09.30.222c 35.420 107.822 10/02/56 6,065 6,990199 Jm Stone 14.09.30.2213 35.419 107.825 04/30/57 6,541 6,984200 Jm Stone 14.10.22.132a 35.416 107.853 04/11/57 6,550 6,974201 Jm Stone 14.10.22.132c 35.416 107.853 04/11/57 6,549 6,974202 Jm Stone 14.10.22.132b 35.416 107.853 04/11/57 6,549 6,974203 Jm Stone 14.10.22.132d 35.416 107.687 04/11/57 6,549 6,975204 Jm Stone 14.10.25.14 35.416 107.850 11/06/56 6,546 6,970205 Jm Stone 14.09.28.143 35.414 107.798 09/28/56 6,541 6,981206 Jm Stone 14.10.25.321 35.413 107.852 05/24/57 6,541 6,971207 Jm Stone 14.10.25.411 35.413 107.847 05/24/57 6,541 6,970208 Jm Stone 14.10.25.411a 35.413 107.847 05/24/57 6,539 6,971209 Jm Stone 14.09.29.312 35.413 107.818 02/28/58 6,520 6,980210 Jm Stone 14.10.35.221 35.405 107.859 12/18/57 6,549 7,010211 Jm Stone 14.09.32.122b 35.405 107.813 11/06/57 6,529 6,943212 Jm Stone 14.10.25.413 35.397 107.847 05/24/57 6,539 6,971213 Jm Stone 14.09.32.314 35.395 107.819 12/20/57 6,513 6,910214 Jm Stone 13.10.11.242 35.373 107.858 08/27/62 6,508 7,240215 Jm Stone 13.09.15.343 35.349 107.781 12/05/57 6,616 6,840216 Jm Stone 13.09.22.121 35.347 107.781 10/12/62 6,637 6,835217 Jm Stone 13.08.24.2433 35.344 107.631 05/10/74 6,276 7,364218 Jm Stone 14.09.32.122 35.405 107.813 04/30/57 6,530 6,942219 Jm Stone 14.09.32.122a 35.405 107.813 04/30/57 6,530 6,942220 Jm Stone 14.10.25.132 35.416 107.853 04/25/57 6,545 6,976221 Jm USGS 352023107473201 35.340 107.793 03/26/09 6,666 6,789222 Jm USGS 352037107465701 35.346 107.784 08/06/09 6,733 6,834223 Jm Brod B1 35.451 107.864 NA 6,600 7,060224 Jm Brod Mw 35.254 107.637 10/01/72 6,302 7,364225 Jm Brod W2 35.349 107.781 12/01/57 6,616 6,840226 Jm Brod W5 35.338 107.792 10/01/57 6,643 6,785227 Jm Brod W6 35.347 107.771 NA 6,605 6,825228 Jm Brod W8 35.347 107.775 10/01/62 6,637 6,835229 Jm Brod W7 35.347 107.775 12/01/58 6,625 6,830230 Jm Brod W9 35.347 107.764 03/01/75 6,602 6,653

Appendix 1 49
Table 1-1. Historical groundwater-elevation data in the study area, 1946–2009.—Continued
[NAD 83, North American Datum of 1983; ft, feet; NAVD 88, North American Vertical Datum of 1988; Qa, Quaternary alluvium; NA, a specific date is not available, but the data are associated with documents that place the date within the range of 1946–2009; Kmf, Cretaceous Menefee Formation; Kpl, Cretaceous Point Lookout Formation; Kg, Cretaceous Gallup Formation; Km, Cretaceous Mancos Formation; Kd, Cretaceous Dakota Formation; Jm, Jurassic Morrison Formation; Je, Jurassic Entrada Complex (includes Entrada, Todilto, Summerville, and Bluff Formations); TRc, Triassic Chinle Group; Psa, Permian San Andres Formation (including Glorieta Formation)]
Line no.
FormationData
source*Data
identifier**Latitude (NAD 83)
Longitude (NAD 83)
Date
Water elevation
(in ft above NAVD 88)
Land-surface elevation
(in ft above NAVD 88)
231 Jm Brod W29 35.433 107.859 05/01/57 6,551 7,053232 Jm Brod W30 35.431 107.865 05/02/57 6,549 7,034233 Jm Brod W31 35.429 107.863 05/03/57 6,549 7,030234 Jm Brod W32 35.431 107.859 05/04/57 6,549 7,047235 Jm Brod W33 35.431 107.861 05/05/57 6,548 7,037236 Jm Brod W34 35.431 107.874 05/06/57 6,549 7,022237 Jm Brod W35 35.431 107.874 05/07/57 6,543 7,022238 Jm Brod W36 35.431 107.874 05/08/57 6,545 7,022239 Jm Brod W37 35.425 107.847 02/01/57 6,531 6,980240 Jm Brod W38 35.416 107.848 04/01/57 6,045 6,476241 Jm Brod W39 35.416 107.848 04/01/57 6,550 6,974242 Jm Brod W40 35.416 107.848 04/01/57 6,549 6,974243 Jm Brod W41 35.416 107.848 04/01/57 6,550 6,974244 Jm Brod W42 35.416 107.848 04/01/57 6,549 6,975245 Jm Brod W43 35.412 107.854 05/01/57 6,541 6,971246 Jm Brod W44 35.412 107.841 05/01/57 6,540 6,970247 Jm Brod W45 35.412 107.841 05/01/57 6,539 6,971248 Jm Brod W46 35.411 107.843 05/01/57 6,539 6,971249 Jm Brod W47 35.405 107.872 12/01/57 6,554 7,015250 Jm Brod W10 35.443 107.834 NA 6,456 7,200251 Jm Brod W11 35.415 107.789 09/01/56 6,547 6,987252 Jm Brod W13 35.415 107.801 10/01/57 6,493 7,022253 Jm Brod W15 35.415 107.801 NA 6,577 7,022254 Jm Brod W18 35.412 107.817 02/01/58 6,530 6,980255 Jm Brod W19 35.419 107.837 12/01/57 6,506 6,984256 Jm Brod W21 35.405 107.812 04/01/57 6,529 6,942257 Jm Brod W22 35.405 107.812 04/01/57 6,530 6,942258 Jm Brod W23 35.405 107.812 11/01/57 6,529 6,943259 Jm Brod W25 35.396 107.814 12/01/57 6,513 6,910260 Jm Brod W27 35.397 107.776 05/01/58 6,500 7,008261 Jm Brod W28 35.397 107.745 05/01/58 6,488 7,070262 Je Stone 13.10.18.4113 35.357 107.936 11/13/63 6,685 7,050263 Je Stone 13.09.30.213 35.331 107.829 10/30/57 6,557 6,910264 Je Brod T1 35.338 107.830 NA 6,630 6,990265 TRc Stone 14.11.30.2112 35.420 108.041 08/03/61 6,787 6,848266 TRc Stone 13.11.06.424 35.382 108.035 06/23/48 6,745 6,790267 TRc Stone 13.11.06.424a 35.382 108.035 09/05/62 6,735 6,785268 TRc Stone 13.11.06.313 35.381 108.050 09/05/62 6,751 6,790269 TRc Stone 13.11.08.2211 35.376 108.021 06/24/48 6,734 6,770270 TRc Stone 13.12.12.1422 35.374 108.061 08/04/61 6,777 6,822

50 Geologic Framework, Regional Aquifer Properties (1940s–2009), and Spring, Creek, and Seep Properties (2009–10)
Table 1-1. Historical groundwater-elevation data in the study area, 1946–2009.—Continued
[NAD 83, North American Datum of 1983; ft, feet; NAVD 88, North American Vertical Datum of 1988; Qa, Quaternary alluvium; NA, a specific date is not available, but the data are associated with documents that place the date within the range of 1946–2009; Kmf, Cretaceous Menefee Formation; Kpl, Cretaceous Point Lookout Formation; Kg, Cretaceous Gallup Formation; Km, Cretaceous Mancos Formation; Kd, Cretaceous Dakota Formation; Jm, Jurassic Morrison Formation; Je, Jurassic Entrada Complex (includes Entrada, Todilto, Summerville, and Bluff Formations); TRc, Triassic Chinle Group; Psa, Permian San Andres Formation (including Glorieta Formation)]
Line no.
FormationData
source*Data
identifier**Latitude (NAD 83)
Longitude (NAD 83)
Date
Water elevation
(in ft above NAVD 88)
Land-surface elevation
(in ft above NAVD 88)
271 TRc Stone 13.12.12.424 35.367 108.053 06/04/59 6,763 6,825272 TRc Stone 13.11.07.431 35.366 108.042 08/03/61 6,758 6,810273 TRc Stone 13.11.07.344 35.364 108.044 03/12/75 6,770 6,845274 TRc Stone 13.11.17.113a 35.360 108.033 08/02/69 6,820 6,900275 TRc Stone 13.11.17.123 35.360 108.029 06/23/48 6,656 6,800276 TRc Stone 13.11.17.133 35.356 108.033 08/02/61 6,711 6,822277 TRc Stone 13.11.17.411a 35.355 108.024 09/18/62 6,720 6,805278 TRc Stone 13.11.17.411b 35.355 108.024 06/23/48 6,653 6,800279 TRc Stone 13.11.17.3333 35.349 108.034 10/24/62 6,539 6,920280 TRc Stone 13.11.23.324 35.338 107.976 08/03/61 6,496 6,800281 TRc Stone 13.11.27.3142 35.324 107.995 12/07/55 6,594 6,720282 TRc Stone 13.09.29.343 35.320 107.816 06/05/59 6,522 6,750283 TRc Stone 13.10.33.4443 35.306 107.894 07/25/56 6,680 6,718284 TRc Stone 13.11.34.433 35.306 107.989 09/19/62 6,528 6,710285 TRc Stone 12.10.01.222 35.304 107.836 07/24/56 6,629 6,675286 TRc Stone 12.10.05.341 35.293 107.918 05/18/49 6,641 6,705287 TRc Stone 12.11.03.342 35.293 107.986 08/31/56 6,533 6,660288 TRc Stone 12.11.10.411 35.282 107.984 05/10/46 6,532 6,650289 TRc Stone 12.11.10.411a 35.279 107.983 10/01/55 6,480 6,640290 TRc Stone 12.09.18.311 35.268 107.834 04/01/59 6,567 6,625291 TRc Stone 12.10.23.233a 35.256 107.831 07/11/46 6,519 6,594292 TRc Stone 12.10.26.322 35.239 107.862 05/26/56 6,503 6,573293 TRc Stone 12.10.34.2141 35.231 107.878 NA 6,476 6,558294 TRc Stone 13.11.173.114 35.360 108.031 03/28/61 6,728 6,795295 TRc Stone 13.10.20.114 35.346 107.925 09/17/69 6,444 6,890296 TRc Stone 13.10.18.212 35.362 107.934 06/16/76 6,993 7,040297 TRc Stone 13.11.18.122 35.362 108.044 09/05/62 6,753 6,840298 TRc Stone 13.11.18.221 35.362 108.038 08/02/61 6,732 6,805299 TRc Stone 13.11.18.224 35.360 108.035 06/23/48 6,812 6,900300 TRc Stone 13.11.17.114a 35.360 108.031 06/23/48 6,741 6,800301 TRc Stone 13.11.17.141 35.358 108.028 08/02/61 6,735 6,810302 TRc Stone 13.11.17.442a 35.351 108.018 07/21/61 6,730 6,830303 TRc Stone 13.11.17.442 35.351 108.018 12/18/57 6,685 6,830304 TRc USGS 351815107501001 35.304 107.837 07/24/56 6,633 6,679305 TRc USGS 351918107485601 35.322 107.816 03/29/84 6,676 6,764306 TRc USGS 351644107482901 35.279 107.809 07/25/56 6,689 6,774307 TRc Brod C2 35.304 107.853 07/01/56 6,629 6,675308 TRc Brod C5 35.255 107.870 07/01/46 6,519 6,594309 TRc Brod C1 35.278 107.806 07/01/56 6,685 6,770310 TRc Stone 14.12.14.143 35.444 108.080 09/05/62 6,845 7,090

Appendix 1 51
Table 1-1. Historical groundwater-elevation data in the study area, 1946–2009.—Continued
[NAD 83, North American Datum of 1983; ft, feet; NAVD 88, North American Vertical Datum of 1988; Qa, Quaternary alluvium; NA, a specific date is not available, but the data are associated with documents that place the date within the range of 1946–2009; Kmf, Cretaceous Menefee Formation; Kpl, Cretaceous Point Lookout Formation; Kg, Cretaceous Gallup Formation; Km, Cretaceous Mancos Formation; Kd, Cretaceous Dakota Formation; Jm, Jurassic Morrison Formation; Je, Jurassic Entrada Complex (includes Entrada, Todilto, Summerville, and Bluff Formations); TRc, Triassic Chinle Group; Psa, Permian San Andres Formation (including Glorieta Formation)]
Line no.
FormationData
source*Data
identifier**Latitude (NAD 83)
Longitude (NAD 83)
Date
Water elevation
(in ft above NAVD 88)
Land-surface elevation
(in ft above NAVD 88)
311 TRc Stone 14.11.19.124 35.433 108.043 08/04/61 6,821 6,880312 TRc Stone 14.11.19.4113 35.427 108.042 08/03/61 6,810 6,870313 TRc Stone 13.10.08.211 35.377 107.919 10/02/56 6,669 7,000314 Psa Stone 14.10.22.414 35.425 107.880 03/22/57 6,442 7,016315 Psa Stone 12.11.03.212 35.304 107.981 03/01/59 6,510 6,690316 Psa Stone 12.10.05.341a 35.293 107.919 01/08/58 6,454 6,700317 Psa Stone 12.10.07.1433 35.284 107.935 10/15/55 6,458 6,635318 Psa Stone 12.11.15.211 35.274 107.984 02/19/57 6,475 6,632319 Psa Stone 12.11.15.223 35.273 107.979 NA 6,510 6,630320 Psa Stone 12.11.24.424 35.251 107.942 05/10/46 6,480 6,590321 Psa Stone 12.11.24.334 35.248 107.956 NA 6,438 6,598322 Psa Stone 12.11.24.334a 35.248 107.955 NA 6,435 6,595323 Psa Stone 12.11.25.122 35.246 107.951 04/06/48 6,547 6,595324 Psa Stone 12.11.25.12 35.245 107.952 03/05/54 6,553 6,600325 Psa Stone 15.18.14.133 35.244 107.944 02/01/51 6,473 6,590326 Psa Stone 12.10.26.242 35.243 107.854 05/22/58 6,410 6,590327 Psa Stone 12.10.28.44 35.234 107.890 09/01/54 6,479 6,560328 Psa Stone 12.10.29.434b 35.233 107.911 02/01/51 6,472 6,555329 Psa Stone 12.10.31.211 35.232 107.931 11/17/77 6,453 6,575330 Psa Stone 12.10.31.12 35.231 107.934 09/01/58 6,440 6,580331 Psa Stone 11.10.04.333 35.204 107.905 01/28/58 6,454 6,540332 Psa Stone 11.10.04.344 35.204 107.898 07/26/56 6,450 6,534333 Psa Stone 11.10.10.111a 35.204 107.888 11/14/47 6,451 6,536334 Psa Stone 11.10.16.434 35.176 107.894 07/27/56 6,443 6,515335 Psa Stone 11.10.26.321c 35.153 107.865 06/26/58 6,443 6,465336 Psa Stone 11.10.27.444 35.147 107.871 10/01/58 6,385 6,490337 Psa Stone 12.11.23.111 35.261 107.975 07/20/56 6,521 6,610338 Psa Stone 13.11.14.32 35.354 107.974 10/09/69 6,493 6,855339 Psa USGS 352433107462101 35.409 107.773 NA 6,455 6,986340 Psa Brod S2 35.255 107.870 02/01/46 6,476 6,592341 Psa Brod S2 35.255 107.870 08/01/57 6,444 6,592342 Psa Brod B2 35.426 107.877 03/01/57 6,442 7,016343 Psa Stone 14.9.28.441 35.409 107.788 10/01/57 6,440 6,982
*Data sources:Brod—Brod, R.C., and Stone, W.J., 1981, Hydrogeology of Ambrosia Lake-San Mateo area, McKinley and Cibola Counties, New Mexico: New Mexico Bureau of Mines and Mineral Resources, HS-2, text and map, 1:62,500.Stone—Stone, W.J., Lyford, F.P., Frenzel, P.F., Mizell, N.H., and Padgett, E.T., 1983, Hydrogeology and water resources of San Juan Basin, New Mexico: Socorro, New Mexico Bureau of Mines and Mineral Resources, Hydrologic Report 6, 70 p.RHR—Roca Honda Resources, LLC, 2009a, 11-20-2009 Permit application, Phase II of a new mine application—Baseline data report: Permit application to the Mining and Minerals Division of the New Mexico Energy, Minerals, and Natural Resources Department, http://www.emnrd.state.nm.us/MMD/MARP/permits/MARP_Permits.htm.USGS—U.S. Geological Survey, 2009, Groundwater levels for New Mexico: U.S. Geological Survey National Water Information System, http://nwis.waterdata.usgs.gov/nm/nwis/gwlevels.**Data identifiers: these values are data indicators used by the source to identify the data within the report or database.

52 Geologic Framework, Regional Aquifer Properties (1940s–2009), and Spring, Creek, and Seep Properties (2009–10)
Figure 1-1. Spatial distribution of historical groundwater-elevation data in the study area.
!!!
!!!!!!!!!!!
!!!!!!
!
!! ! !!
!
!
!
!
!!
!
!
! !
!
! !!!!!
!!!
!
!
!
!!
!!
!!!!
!
!
!! !!
!
!!
!!!!
!!!!
!
!
!!!!!
!!!! !
!!!!!!!
!!!!!! !!!
!!!
!!!
!!!!! !
!
!
!
!!!!
!!!!!
!!!!!!!!!!!!
!!!
!
!
!
!
!!
!!!
!
!
!
!
!
!
!
!
!!!
!
!
!!!
! !
!
!! !
!
!
!!!!!!!!
!! !
!
!
!
!!!!!!!!!! !!!!!! !! !!!! !
! !! !
!
!! !
!!!
!
!!
!
!
!!!! !
!!!!!!!!!!!!!!! !!!
!
!
!!!!!
!!!! ! !
!
!!
!
!!!!!
! !! !!!!!!
!
!!
!! !!!
!!!
!
!!
!
!
!!!!!!!!
! !!
!
!
!
!
!!
!
!
!!
!!!
!!!!!! !!!!!
!! !
!
!!
!
!
!
!!
!
!
¬«605
¬«509
. x
0 3 6 9 12 MILES
0 4 8 12 KILOMETERS
108° 00´ 107° 45´
! Well location from which data were collected
Base from U.S. Geological Survey digital data, 1:24,000Projection: Universal Transverse Mercator zone 13N, North American Datum of 1983, North American Vertical Datum of 1988
Chaco Slope
Zuni Uplift
Milan Grants
Rio San Jose
San Mateo Creek
MountTaylor
Acom
a Em
baym
ent
Chaco Slope
Regional geologicstructure boundaries(modified from Fitzsimmons,1959, and Baldwin and Anderholm, 1992)
Zuni
Upl
ift
40
40
35˚ 30´
35˚ 15´
Developed area
EXPLANATION

Appendix 2.—Historical Groundwater Major-Element Data


Existing major-element data in the study area are presented in table 2-1. The spatial distribution of the associated wells across the study area is shown in fig. 2-1 (individual well locations can be located through latitude and longitude coordinates presented in table 2-1). The major-element data set is a compilation of multiple sources and is presented in order of increasing geologic age of the associated formation. Initial formation designations were determined by the authors/data collectors of the source references (references listed following the table). Existing major-element data without formation designations were not included for analysis in this study. For this study, formation designations were homogenized to currently (2011) accepted forma-tion nomenclature. This homogenization was necessary because of the long data record (1950s onward) during which formation identification has changed with certain formation names dropped from the lexicon or added as additional studies continued to update the stratigraphic nomenclature of the region (see Methods section).
Appendix 2
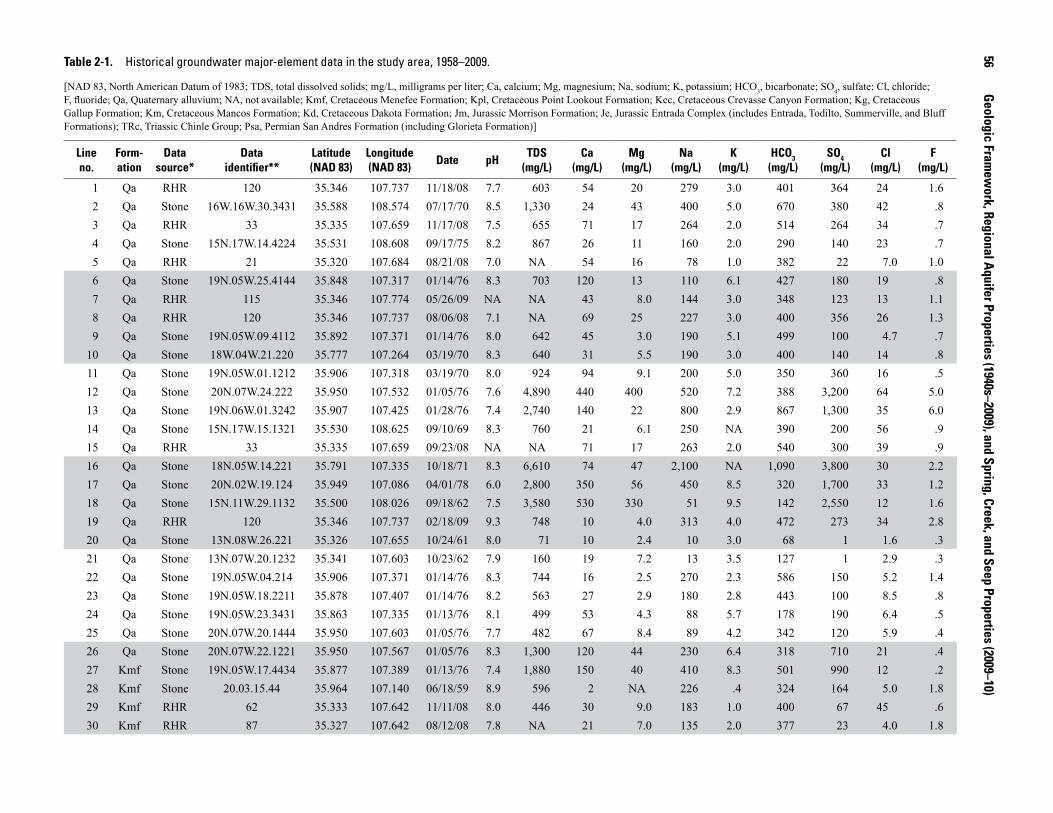
56
Geologic Framew
ork, Regional Aquifer Properties (1940s–2009), and Spring, Creek, and Seep Properties (2009–10)Table 2-1. Historical groundwater major-element data in the study area, 1958–2009.—Continued
[NAD 83, North American Datum of 1983; TDS, total dissolved solids; mg/L, milligrams per liter; Ca, calcium; Mg, magnesium; Na, sodium; K, potassium; HCO3, bicarbonate; SO4, sulfate; Cl, chloride; F, fluoride; Qa, Quaternary alluvium; NA, not available; Kmf, Cretaceous Menefee Formation; Kpl, Cretaceous Point Lookout Formation; Kcc, Cretaceous Crevasse Canyon Formation; Kg, Cretaceous Gallup Formation; Km, Cretaceous Mancos Formation; Kd, Cretaceous Dakota Formation; Jm, Jurassic Morrison Formation; Je, Jurassic Entrada Complex (includes Entrada, Todilto, Summerville, and Bluff Formations); TRc, Triassic Chinle Group; Psa, Permian San Andres Formation (including Glorieta Formation)]
Line no.
Form-ation
Data source*
Data identifier**
Latitude (NAD 83)
Longitude (NAD 83)
Date pHTDS
(mg/L)Ca
(mg/L)Mg
(mg/L)Na
(mg/L)K
(mg/L)HCO3
(mg/L)SO4
(mg/L)Cl
(mg/L)F
(mg/L)
1 Qa RHR 120 35.346 107.737 11/18/08 7.7 603 54 20 279 3.0 401 364 24 1.62 Qa Stone 16W.16W.30.3431 35.588 108.574 07/17/70 8.5 1,330 24 43 400 5.0 670 380 42 .83 Qa RHR 33 35.335 107.659 11/17/08 7.5 655 71 17 264 2.0 514 264 34 .74 Qa Stone 15N.17W.14.4224 35.531 108.608 09/17/75 8.2 867 26 11 160 2.0 290 140 23 .75 Qa RHR 21 35.320 107.684 08/21/08 7.0 NA 54 16 78 1.0 382 22 7.0 1.06 Qa Stone 19N.05W.25.4144 35.848 107.317 01/14/76 8.3 703 120 13 110 6.1 427 180 19 .87 Qa RHR 115 35.346 107.774 05/26/09 NA NA 43 8.0 144 3.0 348 123 13 1.18 Qa RHR 120 35.346 107.737 08/06/08 7.1 NA 69 25 227 3.0 400 356 26 1.39 Qa Stone 19N.05W.09.4112 35.892 107.371 01/14/76 8.0 642 45 3.0 190 5.1 499 100 4.7 .7
10 Qa Stone 18W.04W.21.220 35.777 107.264 03/19/70 8.3 640 31 5.5 190 3.0 400 140 14 .811 Qa Stone 19N.05W.01.1212 35.906 107.318 03/19/70 8.0 924 94 9.1 200 5.0 350 360 16 .512 Qa Stone 20N.07W.24.222 35.950 107.532 01/05/76 7.6 4,890 440 400 520 7.2 388 3,200 64 5.013 Qa Stone 19N.06W.01.3242 35.907 107.425 01/28/76 7.4 2,740 140 22 800 2.9 867 1,300 35 6.014 Qa Stone 15N.17W.15.1321 35.530 108.625 09/10/69 8.3 760 21 6.1 250 NA 390 200 56 .915 Qa RHR 33 35.335 107.659 09/23/08 NA NA 71 17 263 2.0 540 300 39 .916 Qa Stone 18N.05W.14.221 35.791 107.335 10/18/71 8.3 6,610 74 47 2,100 NA 1,090 3,800 30 2.217 Qa Stone 20N.02W.19.124 35.949 107.086 04/01/78 6.0 2,800 350 56 450 8.5 320 1,700 33 1.218 Qa Stone 15N.11W.29.1132 35.500 108.026 09/18/62 7.5 3,580 530 330 51 9.5 142 2,550 12 1.619 Qa RHR 120 35.346 107.737 02/18/09 9.3 748 10 4.0 313 4.0 472 273 34 2.820 Qa Stone 13N.08W.26.221 35.326 107.655 10/24/61 8.0 71 10 2.4 10 3.0 68 1 1.6 .321 Qa Stone 13N.07W.20.1232 35.341 107.603 10/23/62 7.9 160 19 7.2 13 3.5 127 1 2.9 .322 Qa Stone 19N.05W.04.214 35.906 107.371 01/14/76 8.3 744 16 2.5 270 2.3 586 150 5.2 1.423 Qa Stone 19N.05W.18.2211 35.878 107.407 01/14/76 8.2 563 27 2.9 180 2.8 443 100 8.5 .824 Qa Stone 19N.05W.23.3431 35.863 107.335 01/13/76 8.1 499 53 4.3 88 5.7 178 190 6.4 .525 Qa Stone 20N.07W.20.1444 35.950 107.603 01/05/76 7.7 482 67 8.4 89 4.2 342 120 5.9 .426 Qa Stone 20N.07W.22.1221 35.950 107.567 01/05/76 8.3 1,300 120 44 230 6.4 318 710 21 .427 Kmf Stone 19N.05W.17.4434 35.877 107.389 01/13/76 7.4 1,880 150 40 410 8.3 501 990 12 .228 Kmf Stone 20.03.15.44 35.964 107.140 06/18/59 8.9 596 2 NA 226 .4 324 164 5.0 1.829 Kmf RHR 62 35.333 107.642 11/11/08 8.0 446 30 9.0 183 1.0 400 67 45 .630 Kmf RHR 87 35.327 107.642 08/12/08 7.8 NA 21 7.0 135 2.0 377 23 4.0 1.8

Appendix 2
57Table 2-1. Historical groundwater major-element data in the study area, 1958–2009.—Continued
[NAD 83, North American Datum of 1983; TDS, total dissolved solids; mg/L, milligrams per liter; Ca, calcium; Mg, magnesium; Na, sodium; K, potassium; HCO3, bicarbonate; SO4, sulfate; Cl, chloride; F, fluoride; Qa, Quaternary alluvium; NA, not available; Kmf, Cretaceous Menefee Formation; Kpl, Cretaceous Point Lookout Formation; Kcc, Cretaceous Crevasse Canyon Formation; Kg, Cretaceous Gallup Formation; Km, Cretaceous Mancos Formation; Kd, Cretaceous Dakota Formation; Jm, Jurassic Morrison Formation; Je, Jurassic Entrada Complex (includes Entrada, Todilto, Summerville, and Bluff Formations); TRc, Triassic Chinle Group; Psa, Permian San Andres Formation (including Glorieta Formation)]
Line no.
Form-ation
Data source*
Data identifier**
Latitude (NAD 83)
Longitude (NAD 83)
Date pHTDS
(mg/L)Ca
(mg/L)Mg
(mg/L)Na
(mg/L)K
(mg/L)HCO3
(mg/L)SO4
(mg/L)Cl
(mg/L)F
(mg/L)
31 Kmf RHR 27 35.335 107.655 08/06/08 6.8 NA 72 11 38 4.0 310 21 6.0 0.432 Kmf Stone 19N.12W.27.14 35.849 108.101 02/20/67 8.7 1,710 3 .6 470 .8 410 540 35 1.233 Kmf Stone 20N.06W.11.4244 35.979 107.443 01/13/76 7.3 173 11 .9 43 .7 65 48 9.2 .434 Kmf Stone 19N.09W.35.13 35.833 107.762 08/27/70 8.7 830 19 7.3 250 2.0 200 390 8.9 .635 Kmf Stone 18.09.15.42 35.790 107.780 12/07/72 9.0 799 6 NA 300 NA 400 270 14 NA36 Kmf Stone 18.09.12.1 35.804 107.744 02/20/67 9.0 1,120 2 .6 400 NA 360 430 59 1.537 Kmf Stone 15N.09W.09.2442 35.544 107.796 10/03/62 8.4 223 5 1.1 81 1.5 207 11 1.5 .538 Kmf Stone 18N.09W.12.1A 35.804 107.744 12/04/72 8.9 2,110 2 NA 800 2.0 1,220 520 85 .639 Kmf RHR 62 35.333 107.642 05/26/09 NA NA 22 7.0 168 1.0 380 60 40 .640 Kmf Stone 15N.06W.22.3123 35.514 107.460 10/03/62 8.4 290 3 .5 109 1.4 270 10 3.9 .441 Kmf RHR 62 35.333 107.642 08/20/08 7.4 NA 48 14 188 2.0 415 74 106 .642 Kmf Stone 16N.08W.20.1312 35.602 107.708 10/15/62 8.7 625 6 1.8 220 2.0 320 200 13 1.043 Kmf Stone 13N.09W.15.343 35.355 107.778 09/18/62 8.1 516 14 3.4 179 1.7 370 102 14 .944 Kmf Stone 18N.11W.29.3111 35.762 108.030 07/27/64 8.7 768 2 .7 270 .8 24 520 15 1.245 Kmf RHR 100 35.320 107.693 11/08/08 7.8 202 29 9.0 39 11 228 6 8.0 .346 Kmf Stone 20N.04W.34.4421 35.920 107.246 05/14/64 8.5 519 3 NA 190 .6 308 146 8.6 .347 Kmf Stone 21N.07W.35.1231 36.008 107.546 01/27/76 8.2 275 60 3.5 21 1.7 119 100 5.1 .448 Kmf Stone 20N.05W.22.4422 35.949 107.353 11/01/63 8.2 168 14 4.1 38 .4 120 24 6.9 .549 Kmf Stone 21N.01W.29.223 36.017 106.972 06/18/59 7.1 1,030 208 20 92 4.4 254 521 38 .550 Kmf RHR 100 35.320 107.693 08/21/08 7.0 NA 18 5.0 39 9.0 158 13 13 .251 Kmf Stone 18N.06W.04.3421 35.820 107.478 02/21/67 8.7 1,720 4 .6 600 1.0 600 760 22 3.152 Kmf RHR 27 35.335 107.655 11/13/08 7.4 249 63 10 34 4.0 304 20 6.0 .453 Kmf Stone 15N.09W.13.144 35.529 107.745 10/16/62 7.5 731 140 57 32 3.0 570 180 4.8 .654 Kmf RHR 7 35.367 107.658 02/16/09 8.7 1,988 18 5.0 986 4.0 947 1,300 77 2.855 Kmf RHR 87 35.327 107.642 02/16/09 8.5 331 27 9.0 113 2.0 398 22 4.0 1.656 Kmf Stone 19N.02W.21.34 35.863 107.051 04/25/78 6.2 5,800 300 570 630 13 470 4,000 19 .657 Kmf RHR 62 35.333 107.642 02/18/09 8.4 417 19 6.0 154 1.0 376 62 35 .658 Kmf RHR 27 35.335 107.655 05/19/09 NA NA 56 9.0 41 4.0 314 17 5.0 .559 Kmf RHR 100 35.320 107.693 02/11/09 7.6 209 33 10 35 8.0 254 6 4.0 .560 Kmf RHR 27 35.335 107.655 02/16/09 7.7 250 57 9.0 35 4.0 302 18 6.0 .4

58
Geologic Framew
ork, Regional Aquifer Properties (1940s–2009), and Spring, Creek, and Seep Properties (2009–10)Table 2-1. Historical groundwater major-element data in the study area, 1958–2009.—Continued
[NAD 83, North American Datum of 1983; TDS, total dissolved solids; mg/L, milligrams per liter; Ca, calcium; Mg, magnesium; Na, sodium; K, potassium; HCO3, bicarbonate; SO4, sulfate; Cl, chloride; F, fluoride; Qa, Quaternary alluvium; NA, not available; Kmf, Cretaceous Menefee Formation; Kpl, Cretaceous Point Lookout Formation; Kcc, Cretaceous Crevasse Canyon Formation; Kg, Cretaceous Gallup Formation; Km, Cretaceous Mancos Formation; Kd, Cretaceous Dakota Formation; Jm, Jurassic Morrison Formation; Je, Jurassic Entrada Complex (includes Entrada, Todilto, Summerville, and Bluff Formations); TRc, Triassic Chinle Group; Psa, Permian San Andres Formation (including Glorieta Formation)]
Line no.
Form-ation
Data source*
Data identifier**
Latitude (NAD 83)
Longitude (NAD 83)
Date pHTDS
(mg/L)Ca
(mg/L)Mg
(mg/L)Na
(mg/L)K
(mg/L)HCO3
(mg/L)SO4
(mg/L)Cl
(mg/L)F
(mg/L)
61 Kmf Stone 17N.11W.15. 35.704 107.994 02/20/67 7.8 1,400 190 24 190 2.0 250 800 12 0.362 Kmf RHR 100 35.320 107.693 05/19/09 NA NA 34 10 34 6.0 258 4 4.0 .563 Kmf RHR 87 35.327 107.642 05/19/09 NA NA 23 8.0 111 2.0 401 24 4.0 1.764 Kmf Stone 20N.07W.18.4112 35.965 107.621 12/27/75 8.6 1,750 2 .7 670 2.5 859 490 89 3.065 Kmf Stone 19N.05W.25.424 35.848 107.317 01/15/76 8.9 2,510 9 58 790 .2 543 1,300 44 2.066 Kmf Stone 19N.06W.35.3244 35.834 107.443 12/28/75 8.6 2,000 2 .7 770 3.2 1,250 450 79 8.167 Kmf Stone 16N.13W.11.3413 35.632 108.185 11/24/64 7.1 1,400 380 74 69 5.0 31 1,300 14 .668 Kmf Stone 18N.08W.09.111 35.804 107.691 03/19/70 8.1 3,560 400 150 430 11 510 2,000 39 .869 Kmf Stone 20N.09W.08.343 35.979 107.815 01/28/76 7.3 857 140 85 26 2.3 456 350 14 .270 Kmf Stone 19N.08W.04.2144 35.906 107.691 01/26/76 8.7 2,010 10 3.1 650 2.5 237 1,200 6.0 4.071 Kmf Stone 19N.06W.35.3244 35.834 107.443 12/28/75 8.3 1,320 7 3.1 520 6.4 1,270 100 19 2.672 Kmf Stone 19N.08W.34.2131 35.833 107.673 01/05/76 8.0 1,700 4 2.2 590 2.3 529 810 26 1.273 Kmf Stone 19N.09W.07.3324 35.891 107.833 09/22/75 4.3 2,060 280 170 72 3.6 NA 1,500 11 .474 Kmf Stone 19N.07W.01.4112 35.907 107.532 01/12/76 7.3 953 93 41 160 3.5 344 460 6.3 .175 Kmf Stone 20N.10W.01.22 35.994 107.850 01/28/76 8.0 1,940 150 78 350 4.5 280 1,200 11 .476 Kpl Stone 19N.05W.18.2224 35.878 107.407 01/14/76 7.7 383 62 14 49 1.2 209 77 29 1.277 Kpl Stone 19N.06W.24.2212 35.863 107.425 01/15/76 8.6 2,770 3 1.3 1,000 3.4 1,040 1,100 71 4.978 Kpl Stone 19N.05W.12.3234 35.892 107.318 01/13/76 8.4 1,610 3 1.0 600 2.2 891 480 19 5.579 Kpl Stone 16N.07W.26.2214 35.588 107.549 10/03/62 8.7 875 3 .7 320 2.0 380 330 11 .980 Kpl Stone 19N.13W.13.444 35.878 108.173 11/02/71 8.7 2,060 6 1.2 700 3.0 420 1,000 60 2.481 Kpl Stone 13N.09W.22.2124 35.341 107.778 09/11/62 8.1 510 74 24 76 3.0 360 100 22 1.082 Kpl Stone 16N.09W.22.4444 35.602 107.778 10/02/62 8.5 964 7 1.8 342 2.2 395 387 9.1 .683 Kpl Stone 16N.08W.33.1341 35.573 107.691 10/02/62 8.3 1,470 6 2.3 557 2.3 826 397 74 3.784 Kpl Stone 16N.10W.08.321 35.631 107.918 09/20/62 8.7 1,390 7 NA 482 2.7 393 648 28 1.485 Kpl Stone 19N.12W.34 35.834 108.101 11/02/71 8.6 1,920 4 1.2 670 3.0 470 940 47 3.486 Kpl Stone 16N.11W.17.4322 35.616 108.026 09/19/62 7.4 1,550 96 53 338 6.1 307 876 15 .587 Kpl Stone 15N.17W.12.34 35.545 108.591 10/04/62 7.0 1,940 330 162 54 4.9 546 1,100 7.7 .888 Kpl Stone 16N.07W.32.4141 35.573 107.602 10/02/62 7.6 2,000 62 24 573 4.3 326 1,130 37 .889 Kpl Stone 13N.07W.09.433 35.368 107.585 09/21/62 7.7 174 23 9.4 13 6.0 150 4 3.6 .290 Kpl Stone 17N.11W.35.223 35.660 107.977 02/20/67 8.7 1,710 8 2.4 580 NA 270 1,000 26 .8

Appendix 2
59Table 2-1. Historical groundwater major-element data in the study area, 1958–2009.—Continued
[NAD 83, North American Datum of 1983; TDS, total dissolved solids; mg/L, milligrams per liter; Ca, calcium; Mg, magnesium; Na, sodium; K, potassium; HCO3, bicarbonate; SO4, sulfate; Cl, chloride; F, fluoride; Qa, Quaternary alluvium; NA, not available; Kmf, Cretaceous Menefee Formation; Kpl, Cretaceous Point Lookout Formation; Kcc, Cretaceous Crevasse Canyon Formation; Kg, Cretaceous Gallup Formation; Km, Cretaceous Mancos Formation; Kd, Cretaceous Dakota Formation; Jm, Jurassic Morrison Formation; Je, Jurassic Entrada Complex (includes Entrada, Todilto, Summerville, and Bluff Formations); TRc, Triassic Chinle Group; Psa, Permian San Andres Formation (including Glorieta Formation)]
Line no.
Form-ation
Data source*
Data identifier**
Latitude (NAD 83)
Longitude (NAD 83)
Date pHTDS
(mg/L)Ca
(mg/L)Mg
(mg/L)Na
(mg/L)K
(mg/L)HCO3
(mg/L)SO4
(mg/L)Cl
(mg/L)F
(mg/L)
91 Kpl Stone 13N.07W.11.1313 35.370 107.550 08/27/62 7.7 216 31 13 20 4.0 190 15 6.4 0.292 Kpl Stone 14N.08W.04.3343 35.472 107.690 08/29/62 7.8 149 20 8.5 10 3.0 120 6 5.4 .393 Kcc Stone 18N.13W.23.3212 35.776 108.190 11/02/71 8.5 2,000 6 1.2 720 2.0 510 650 300 6.094 Kcc Stone 17N.02W.07.422 35.719 107.086 11/04/68 8.3 242 33 9.1 38 7.0 190 41 3.9 .395 Kcc Stone 16N.14W.21.3334 35.603 108.326 07/11/61 7.0 3,410 620 230 110 11 710 2,000 23 .396 Kcc Stone 15N.11W.17.1111 35.529 108.026 01/15/70 7.9 2,320 120 170 280 7.0 180 1,300 75 .797 Kcc Stone 15N.10W.04.1311 35.558 107.901 09/12/62 7.5 3,440 88 23 990 8.0 170 2,200 40 2.098 Kcc Stone 15N.10W.32.214 35.486 107.919 08/01/61 7.5 1,450 110 44 290 7.0 270 840 10 .499 Kg Stone 16N.05W.19.414 35.602 107.407 04/13/78 9.2 312 1 .3 120 .8 269 18 3.5 .7
100 Kg RHR 16 35.356 107.704 05/19/09 NA NA 14 20 158 4.0 226 229 5.0 .4101 Kg Stone 14N.09W.18.243 35.442 107.831 10/01/62 9.6 3,340 3 1.8 1,120 5.1 194 1,940 76 2.5102 Kg RHR 16 35.356 107.704 08/25/08 7.9 NA 32 32 169 5.0 293 285 7.0 .5103 Kg Stone 15N.11W.17.1111 35.529 108.026 09/18/62 8.8 1,130 3 .9 401 1.8 348 444 73 1.2104 Kg Stone 16N.11W.33.332 35.573 108.008 02/12/73 7.9 882 78 34 160 1.0 190 490 5.3 .5105 Kg Stone 16N.08W.14.1114 35.617 107.655 10/02/62 7.9 1,110 9 5.0 365 3.2 276 563 12 .8106 Kg Stone 15N.10W.32.214 35.486 107.919 07/18/73 8.1 1,110 100 36 180 3.1 210 580 7.1 .6107 Kg Stone 17N.13W.10.44 35.718 108.208 03/10/70 7.8 654 80 26 87 5.0 270 260 8.9 .4108 Kg Stone 16N.07W.13.2244 35.617 107.531 09/19/62 8.2 2,190 10 2.1 718 3.2 308 1,250 42 .8109 Kg RHR 16 35.356 107.704 02/12/09 8.9 466 17 22 152 6.0 245 258 5.0 .4110 Kg Stone 16N.18W.35.14 35.574 108.716 01/24/69 7.9 879 46 9.5 240 6.0 280 330 86 1.1111 Km Stone 16N.15W.21. 35.603 108.432 11/18/71 8.7 799 7 2.4 300 .8 510 160 22 2.2112 Km Stone 16N.04W.36.2321 35.573 107.210 06/05/73 8.5 7,760 120 9.0 2,400 6.6 241 4,500 580 2.9113 Kd Stone 16N.14W.33.22 35.574 108.326 03/20/74 9.0 977 9 NA 340 NA 310 400 14 1.3114 Kd Stone 16N.15W.20. 35.603 108.450 02/23/70 9.3 592 2 NA 220 .7 370 140 7.0 .2115 Kd Stone 16N.17W.25.1132 35.588 108.591 03/26/74 8.8 982 14 2.4 340 NA 500 220 83 2.6116 Kd Stone 14N.09W.28.143 35.414 107.795 04/30/63 7.7 1,520 140 56 280 8.0 320 850 17 .3117 Kd Stone 15N.06W.22.3123 35.514 107.460 10/30/68 8.4 820 65 21 180 2.0 310 340 15 .4118 Kd Stone 14N.09W.28.143 35.414 107.795 08/30/63 7.7 1,525 140 56 276 7.6 319 850 17 .3119 Kd Stone 16N.15W.17.1431 35.618 108.450 02/13/74 8.3 324 38 8.5 73 3.0 280 48 5.3 .4120 Kd Stone 14N.09W.18.400 35.442 107.831 08/08/62 7.6 742 38 11 200 8.0 280 320 8.8 .7

60
Geologic Framew
ork, Regional Aquifer Properties (1940s–2009), and Spring, Creek, and Seep Properties (2009–10)Table 2-1. Historical groundwater major-element data in the study area, 1958–2009.—Continued
[NAD 83, North American Datum of 1983; TDS, total dissolved solids; mg/L, milligrams per liter; Ca, calcium; Mg, magnesium; Na, sodium; K, potassium; HCO3, bicarbonate; SO4, sulfate; Cl, chloride; F, fluoride; Qa, Quaternary alluvium; NA, not available; Kmf, Cretaceous Menefee Formation; Kpl, Cretaceous Point Lookout Formation; Kcc, Cretaceous Crevasse Canyon Formation; Kg, Cretaceous Gallup Formation; Km, Cretaceous Mancos Formation; Kd, Cretaceous Dakota Formation; Jm, Jurassic Morrison Formation; Je, Jurassic Entrada Complex (includes Entrada, Todilto, Summerville, and Bluff Formations); TRc, Triassic Chinle Group; Psa, Permian San Andres Formation (including Glorieta Formation)]
Line no.
Form-ation
Data source*
Data identifier**
Latitude (NAD 83)
Longitude (NAD 83)
Date pHTDS
(mg/L)Ca
(mg/L)Mg
(mg/L)Na
(mg/L)K
(mg/L)HCO3
(mg/L)SO4
(mg/L)Cl
(mg/L)F
(mg/L)
121 Kd Stone 14N.09W.18.400 35.442 107.831 08/08/62 7.5 1,410 71 27 360 6.0 300 770 14 0.5122 Kd Stone 17N.13W.10.42 35.718 108.208 10/29/74 8.3 379 12 4.1 120 2.3 252 93 3.4 .4123 Kd Stone 14N.09W.17.300 35.442 107.814 10/16/62 8.1 4,470 420 200 691 13 383 2,880 50 1.2124 Kd Stone 15N.12W.17.111 35.531 108.131 07/31/61 8.4 431 6 1.7 147 2.8 247 124 9.6 .6125 Kd Stone 14N.10W.11.434A 35.457 107.867 04/24/64 7.8 945 53 13 252 5.2 209 536 8.7 .9126 Kd Stone 14N.10W.11.434A 35.457 107.867 05/06/63 7.6 1,050 100 33 200 4.0 340 500 25 .4127 Kd Stone 14N.09W.18.400 35.442 107.831 08/08/62 7.7 606 29 6.2 170 6.0 280 230 8.8 .7128 Kd Stone 16N.10W.22.212 35.602 107.883 05/23/75 NA 915 31 17 250 4.3 271 450 12 .4129 Jm RHR 116 35.345 107.780 02/10/09 7.3 1,727 538 142 240 6.0 210 1,940 48 .7130 Jm RHR 114 35.346 107.781 02/18/09 7.8 1,688 524 135 215 11 229 1,880 48 .5131 Jm RHR 116 35.345 107.780 11/13/08 6.9 1,687 518 144 240 6.0 213 1,970 52 .7132 Jm Stone 16N.12W.16.23 35.617 108.114 09/08/72 8.5 790 30 4.9 210 3.0 160 370 11 .3133 Jm Stone 14N.09W.32.314 35.399 107.813 05/03/63 8.1 478 20 7.3 140 8.0 250 160 5.2 .2134 Jm RHR 113 35.346 107.781 11/10/08 7.4 1,833 539 148 224 6.0 212 2,030 50 .5135 Jm RHR 116 35.345 107.780 05/21/09 NA NA 496 136 242 6.0 222 1,920 48 .7136 Jm Stone 14N.09W.34.422 35.399 107.777 02/14/58 8.3 420 6 5.0 140 2.0 240 120 6.0 .4137 Jm RHR 113 35.346 107.781 09/22/08 6.6 NA 548 147 236 7.0 205 2,090 52 .5138 Jm Stone 14N.10W.22.414 35.428 107.884 08/08/62 7.6 478 32 9.7 120 6.0 240 160 9.8 .8139 Jm RHR 116 35.345 107.780 08/19/08 6.5 NA 544 146 236 6.0 214 2,080 57 .6140 Jm Stone 14N.10W.22.414 35.428 107.884 08/08/62 7.6 477 30 10 120 6.0 240 160 8.0 .8141 Jm Stone 15N.12W.17.123 35.531 108.131 09/30/76 NA 801 44 16 210 7.0 220 420 8.9 .5142 Jm RHR 113 35.346 107.781 05/26/09 NA NA 501 142 237 7.0 219 2,000 48 .5143 Jm Stone 14N.09W.28.233 35.414 107.795 08/30/63 8.0 611 25 9.2 178 6.2 300 222 7.9 .6144 Jm Stone 15N.12W.19.223 35.516 108.149 05/04/63 8.3 247 29 5.8 52 3.0 220 22 4.6 .4145 Jm Stone 14N.09W.32.122 35.399 107.813 08/13/59 7.8 1,370 211 62 127 4.2 256 794 10 .6146 Jm RHR 113 35.346 107.781 02/12/09 7.6 1,715 507 138 231 6.0 205 2,010 48 .6147 Jm Stone 14N.09W.36.313 35.398 107.742 08/11/59 7.3 524 46 12 114 7.6 220 218 8.0 .4148 Jm Stone 14N.10W.25.132 35.414 107.849 04/29/63 7.8 437 32 17 90 7.4 247 136 5.6 1.0149 Jm Stone 14N.10W.11.434 35.457 107.867 04/24/63 8.2 718 15 4.9 226 3.7 252 322 7.7 .3150 Jm RHR 114 35.346 107.781 09/18/08 6.6 NA 504 125 208 10 213 1,910 51 .5

Appendix 2
61Table 2-1. Historical groundwater major-element data in the study area, 1958–2009.—Continued
[NAD 83, North American Datum of 1983; TDS, total dissolved solids; mg/L, milligrams per liter; Ca, calcium; Mg, magnesium; Na, sodium; K, potassium; HCO3, bicarbonate; SO4, sulfate; Cl, chloride; F, fluoride; Qa, Quaternary alluvium; NA, not available; Kmf, Cretaceous Menefee Formation; Kpl, Cretaceous Point Lookout Formation; Kcc, Cretaceous Crevasse Canyon Formation; Kg, Cretaceous Gallup Formation; Km, Cretaceous Mancos Formation; Kd, Cretaceous Dakota Formation; Jm, Jurassic Morrison Formation; Je, Jurassic Entrada Complex (includes Entrada, Todilto, Summerville, and Bluff Formations); TRc, Triassic Chinle Group; Psa, Permian San Andres Formation (including Glorieta Formation)]
Line no.
Form-ation
Data source*
Data identifier**
Latitude (NAD 83)
Longitude (NAD 83)
Date pHTDS
(mg/L)Ca
(mg/L)Mg
(mg/L)Na
(mg/L)K
(mg/L)HCO3
(mg/L)SO4
(mg/L)Cl
(mg/L)F
(mg/L)
151 Jm Stone 14N.09W.28.143 35.414 107.795 10/17/62 7.9 1,880 90 26 485 5.6 253 1,110 22 1.1152 Jm Stone 16N.17W.33.4223 35.574 108.645 03/26/74 8.3 736 34 11 200 .1 300 290 20 .3153 Jm Stone 14N.10W.22.414 35.428 107.884 08/08/62 8.0 386 11 2.3 120 4.0 240 98 8.4 .8154 Jm Stone 14N.10W.22.214 35.428 107.884 10/18/60 8.3 2,260 26 3.9 700 4.0 170 1,400 60 2.4155 Jm RHR 114 35.346 107.781 05/26/09 NA NA 433 114 201 11 210 1,802 45 .5156 Je Stone 14N.12W.17.3333 35.444 108.131 09/05/62 9.0 656 3 .6 254 2.2 395 115 34 7.0157 Je Stone 16N.17W.15.2324 35.617 108.626 02/13/74 8.5 303 20 1.6 100 2.0 250 29 14 .5158 Je Stone 13N.10W.18.4113 35.356 107.938 02/02/67 NA 242 12 2.4 140 3.0 210 130 11 .9159 Je Stone 14N.12W.14.143 35.443 108.078 08/04/61 7.7 1,150 115 43 206 2.6 332 579 22 .3160 Je Stone 15N.13W.22.1111 35.517 108.202 07/11/61 7.9 528 36 5.8 141 4.8 228 164 47 .5161 Je Stone 16N.15W.16.300 35.618 108.432 11/05/73 8.2 361 26 2.4 69 1.6 200 47 9.0 .5162 Je Stone 20N.07W.08.321 35.980 107.603 04/24/75 NA 2,740 67 5.8 850 8.9 615 1,400 62 7.7163 Je Stone 19N.05W.01.3323 35.906 107.318 12/27/75 7.5 8,240 100 8.4 2,600 22 343 4,600 700 4.6164 Je Stone 13N.10W.18.212 35.356 107.938 02/28/58 7.6 1,890 260 9.7 320 3.0 190 1,100 22.0 1.2165 TRc Stone 14N.13W.33.141 35.401 108.221 07/18/61 7.2 567 124 25 39 2.2 265 230 14.0 .2166 TRc Stone 14N.15W.28.1434 35.415 108.432 05/14/69 7.9 796 160 33 35 3.0 250 380 10.0 .4167 TRc Stone 13N.10W.20.114 35.341 107.920 06/18/76 7.9 15,200 660 67 4,600 16 100 2,100 6,900 .5168 TRc Stone 15N.16W.06.2 35.559 108.574 06/15/66 NA 624 180 39 29 .8 240 450 12 .2169 TRc Stone 13N.11W.08.2211 35.370 108.026 03/12/75 NA 337 18 6.3 100 3.0 301 42 8.2 .5170 TRc Stone 13N.10W.20.114 35.341 107.920 12/22/76 7.9 23,000 1,100 91 7,100 27 52 1,000 13,000 .4171 Psa Stone 16N.04W.18.4444 35.617 107.300 06/05/73 6.8 11,100 350 61 3,500 88 1,410 3,300 3,100 3.4172 Psa Stone 15N.16W.06.2 35.559 108.574 07/01/70 7.2 893 190 38 27 NA 230 410 7.0 .2173 Psa Stone 14N.13W.20.4322 35.430 108.238 07/14/70 8.5 467 31 14 170 NA 220 72 150 .3174 Psa Stone 15N.16W.30.3443 35.502 108.574 03/23/72 8.4 1,070 170 82 27 5.0 190 590 6.4 .3175 Psa Stone 15N.12W.17.123A 35.531 108.131 01/26/75 7.7 628 54 18 130 NA 180 300 1.8 .5176 Psa Stone 15N.12W.19.22 35.516 108.149 02/08/77 9.3 775 6 NA 270 3.0 220 220 130 2.7177 Psa Stone 15N.17W.12.34 35.545 108.591 10/02/68 7.3 4,560 260 59 1,100 21 110 3,000 63 .4178 Psa Stone 14N.13W.33.124 35.401 108.221 03/13/75 7.3 652 150 28 11 1.8 177 350 4.8 .4179 Psa Stone 14N.15W.04.1134 35.473 108.432 07/19/61 7.4 344 90 15 10 1.2 280 72 4.8 .2180 Psa Stone 15N.16W.06.2 35.559 108.574 11/06/69 7.7 936 190 38 22 2.0 240 460 9.9 .3

62
Geologic Framew
ork, Regional Aquifer Properties (1940s–2009), and Spring, Creek, and Seep Properties (2009–10)Table 2-1. Historical groundwater major-element data in the study area, 1958–2009.—Continued
[NAD 83, North American Datum of 1983; TDS, total dissolved solids; mg/L, milligrams per liter; Ca, calcium; Mg, magnesium; Na, sodium; K, potassium; HCO3, bicarbonate; SO4, sulfate; Cl, chloride; F, fluoride; Qa, Quaternary alluvium; NA, not available; Kmf, Cretaceous Menefee Formation; Kpl, Cretaceous Point Lookout Formation; Kcc, Cretaceous Crevasse Canyon Formation; Kg, Cretaceous Gallup Formation; Km, Cretaceous Mancos Formation; Kd, Cretaceous Dakota Formation; Jm, Jurassic Morrison Formation; Je, Jurassic Entrada Complex (includes Entrada, Todilto, Summerville, and Bluff Formations); TRc, Triassic Chinle Group; Psa, Permian San Andres Formation (including Glorieta Formation)]
Line no.
Form-ation
Data source*
Data identifier**
Latitude (NAD 83)
Longitude (NAD 83)
Date pHTDS
(mg/L)Ca
(mg/L)Mg
(mg/L)Na
(mg/L)K
(mg/L)HCO3
(mg/L)SO4
(mg/L)Cl
(mg/L)F
(mg/L)
181 Psa Stone 15N.16W.06.2 35.559 108.574 03/16/72 7.9 906 190 37 25 NA 240 460 9.9 0.4182 Psa Stone 15N.17W.13.3141 35.531 108.590 08/18/64 NA 883 120 59 110 4.0 23 730 14 .4183 Psa Stone 15N.16W.06.2 35.559 108.574 12/08/70 7.7 895 190 38 27 .1 42 450 140 .2184 Psa Stone 14N.15W.04.1134 35.473 108.432 03/13/75 NA 356 91 16 10 1.4 279 85 4.7 .1185 Psa Stone 14N.13W.33.124 35.401 108.221 12/06/67 7.4 770 180 29 10 NA 250 360 17 .3186 Psa Stone 14N.13W.33.124 35.401 108.221 04/07/72 7.5 724 180 28 7 NA 250 360 10 .3187 Psa Stone 15N.17W.13.3141 35.531 108.590 01/01/67 8.0 1,050 120 60 110 4.0 230 570 22 .3188 Psa Stone 15N.17W.13.1142 35.531 108.590 01/01/67 8.2 1,060 120 15 200 3.0 200 610 23 .5189 Psa Stone 14N.13W.20.4323 35.430 108.238 03/13/75 NA 399 2 .1 150 2.0 326 58 15 .2
*Data sources:Stone—Stone, W.J., Lyford, F.P., Frenzel, P.F., Mizell, N.H., and Padgett, E.T., 1983, Hydrogeology and water resources of San Juan Basin, New Mexico: Socorro, New Mexico Bureau of Mines and Mineral Resources, Hydrologic Report 6, 70 p.RHR—Roca Honda Resources, LLC, 2009a, 11-20-2009 Permit application, Phase II of a new mine application—Baseline data report: Permit application to the Mining and Minerals Division of the New Mexico Energy, Minerals, and Natural Resources Department, http://www.emnrd.state.nm.us/MMD/MARP/permits/MARP_Permits.htm.**Data identifiers: these values are data indicators used by the source to identify the data within the report or database.

Appendix 2 63
Figure 2-1. Spatial distribution of historical groundwater major-element data in the study area.
!
!
!
!
!
!
! !
!
!
!
!
!
!
!
!
!
!
!!
!
!!
!
! !
!
!
!!!
!
!
!
!!
!
!
!
!
!
!
!
!
!
!
!
!
!
!
!
!
!
!
!
!!!!
!
! !
!
!!
!
!
!
!
!!
!!
!
!!
!
!
!
!
!!
!
!
!
!!
!
!
!
!
!
!
!
!!
!
!
!
!
!
!
!
!
!
!
!
!
!!
!!!
!
!
!
!
!
!!
!
!
!
!!!
!
!!!
!
!
!!
!
!
!
!
!
!
!
!
!
!
!
!!
!
!
!
!
!!
!
!
!
!
!
!
!
!
!
!
!!
!
!
!!
!
!
!
!!
!!
!
!
!!!!
!
!!
!!
!
£¤550
¬
¬
¬«602
¬«197
¬«605
¬«509
x
Brimhall Nizhoni
107° 00´107° 30´108° 00´108° 30´
0 10 20 30 MILES
0 10 20 30 KILOMETERS
Base from U.S. Geological Survey digital data, 1:24,000Projection: Universal Transverse Mercator zone 13N, North American Datum of 1983, North American Vertical Datum of 1988
Sheep Springs
Naschitti
Tohatchi
Twin Lakes
Yah-ta-hey
GallupChurch Rock
Crownpoint
Thoreau
Ramah
BlackRock
MilanGrants
PaguateEncinal
Paraje
PuebloPintado
Torreon
Mt. Taylor
40
40
57
53
Regional geologicstructure boundaries(modified from Fitzsimmons,1959, and Baldwin and Anderholm, 1992)
Chaco Slope(southern San Juan Basin)
Zuni Uplift Acoma Embayment
Rio PuercoFault Zone
£¤550
Cuba
¬96
La Jara
ReginaNageezi
AcomitaLaguna
Nakaibito
£¤491
!¬«371
! Well location from which data were collected
36˚ 00´
35˚ 30´
Developed area
EXPLANATION


Appendix 3.—Historical Groundwater Trace-Element Data
Appendix 3


Appendix 3 67
Existing trace-element data in the study area are presented in table 3-1. The spatial distribution of the associated wells across the study area is shown in fig. 3-1 (individual well locations can be located through latitude and longitude coordinates presented in table 3-1). The trace-element data set is a compilation of multiple sources and is presented in order of increasing geologic age of the associated formation. Initial formation designations were determined by the authors/data collectors of the source references (references listed following the table). Existing trace-element data without formation designations were not included for analysis in this study. For this study, formation designations were homogenized to currently (2011) accepted forma-tion nomenclature. This homogenization was necessary because of the long data record (1940s onward) during which formation identification has changed with certain formation names dropped from the lexicon or added as additional studies continued to update the stratigraphic nomenclature of the region (see Methods section).

68
Geologic Framew
ork, Regional Aquifer Properties (1940s–2009), and Spring, Creek, and Seep Properties (2009–10)Table 3-1. Historical groundwater trace-element data in the study area, 1942–2009.—Continued
[NAD 83, North American Datum of 1983; Ba, barium; µg/L, micrograms per liter; B, boron; Fe, iron; Li, lithium; Mn, manganese; V, vanadium; Zn, zinc; Qa, Quaternary alluvium; NA, not available; Kmf, Cretaceous Menefee Formation; Kpl, Cretaceous Point Lookout Formation; Kcc, Cretaceous Crevasse Canyon Formation; Kg, Cretaceous Gallup Formation; Km, Cretaceous Mancos Formation; Kd, Cretaceous Dakota Formation; Jm, Jurassic Morrison Formation; Je, Jurassic Entrada Complex (includes Entrada, Todilto, Summerville, and Bluff Formations); TRc, Triassic Chinle Group; Psa, Permian San Andres Formation (including Glorieta Formation)]
Line no.
Form-ation
Data source*
Data identifier**
Latitude (NAD 83)
Longitude (NAD 83)
DateBa
(µg/L)B
(µg/L)Fe
(µg/L)Li
(µg/L)Mn
(µg/L)V
(µg/L)Zn
(µg/L)
1 Qa RHR 120 35.346 107.737 08/06/08 NA 200 NA NA 70 NA NA2 Qa RHR 120 35.346 107.737 02/18/09 NA 500 80 NA 10 NA NA3 Qa RHR 120 35.346 107.737 05/26/09 NA 200 NA NA 100 NA NA4 Qa RHR 121 35.346 107.737 08/18/08 NA 300 NA NA NA NA NA5 Qa RHR 21 35.320 107.684 08/21/08 100 NA NA NA NA NA NA6 Qa RHR 21 35.320 107.684 11/08/08 100 100 NA NA NA NA NA7 Qa RHR 115 35.346 107.774 11/13/08 NA 200 NA NA NA NA NA8 Qa RHR 33 35.335 107.659 09/23/08 NA 300 50 NA 260 NA NA9 Qa RHR 33 35.335 107.659 11/17/08 NA 300 NA NA 140 NA NA
10 Qa Stone 20N.07W.20.1444 35.950 107.603 01/05/76 NA 270 10 NA NA NA NA11 Qa Stone 20N.07W.20.1423 35.950 107.603 01/05/76 NA 70 10 NA NA NA NA12 Qa Stone 20N.07W.18.4112 35.965 107.621 01/05/76 NA 50 NA NA NA NA NA13 Qa Stone 19N.05W.25.424 35.848 107.317 01/28/76 NA 80 140 NA NA NA NA14 Qa Stone 19N.05W.25.4144 35.848 107.317 01/29/76 NA 150 20 NA NA NA NA15 Qa Stone 19N.05W.18.2224 35.878 107.407 01/14/76 NA 110 NA NA NA NA NA16 Qa Stone 19N.05W.18.2211 35.878 107.407 01/13/76 NA 700 100 NA NA NA NA17 Qa Stone 19N.05W.12.3234 35.892 107.318 01/14/76 NA 30 NA NA NA NA NA18 Qa Stone 19N.05W.01.3323 35.906 107.318 01/14/76 NA 70 NA NA NA NA NA19 Qa Stone 19N.05W.01.1212 35.906 107.318 01/14/76 NA 40 70 NA NA NA NA20 Qa Stone 19N.04W.09 35.892 107.264 03/19/70 NA NA 70 NA NA NA NA21 Qa Stone 18N.04W.23.13 35.777 107.229 10/18/71 NA 380 NA NA NA NA NA22 Qa Stone 18N.04W.06 35.820 107.300 03/19/70 NA 50 70 NA NA NA NA23 Qa Stone 16N.17W.33.4223 35.574 108.645 03/26/74 NA 670 NA NA NA NA NA24 Qa Stone 16N.17W.25.1132 35.588 108.591 10/06/76 NA 180 20 NA NA NA NA25 Qa Stone 16N.16W.19.1 35.603 108.574 07/17/70 NA 50 70 NA NA NA NA26 Qa Stone 15N.17W.14.2322B 35.531 108.608 09/17/75 NA 300 NA NA NA NA NA27 Qa Stone 15N.17W.14.1A 35.531 108.608 08/07/75 NA 540 NA NA NA NA NA28 Qa Stone 15N.17W.14.1 35.531 108.608 08/07/75 NA 260 NA NA NA NA NA29 Qa Stone 15N.17W.13.3414 35.531 108.590 10/15/65 NA NA 20 NA NA NA NA30 Qa Stone 15N.10W.32.214 35.486 107.919 09/18/62 NA 80 NA NA NA NA NA

Appendix 3
69Table 3-1. Historical groundwater trace-element data in the study area, 1942–2009.—Continued
[NAD 83, North American Datum of 1983; Ba, barium; µg/L, micrograms per liter; B, boron; Fe, iron; Li, lithium; Mn, manganese; V, vanadium; Zn, zinc; Qa, Quaternary alluvium; NA, not available; Kmf, Cretaceous Menefee Formation; Kpl, Cretaceous Point Lookout Formation; Kcc, Cretaceous Crevasse Canyon Formation; Kg, Cretaceous Gallup Formation; Km, Cretaceous Mancos Formation; Kd, Cretaceous Dakota Formation; Jm, Jurassic Morrison Formation; Je, Jurassic Entrada Complex (includes Entrada, Todilto, Summerville, and Bluff Formations); TRc, Triassic Chinle Group; Psa, Permian San Andres Formation (including Glorieta Formation)]
Line no.
Form-ation
Data source*
Data identifier**
Latitude (NAD 83)
Longitude (NAD 83)
DateBa
(µg/L)B
(µg/L)Fe
(µg/L)Li
(µg/L)Mn
(µg/L)V
(µg/L)Zn
(µg/L)
31 Qa Stone 12N.11W.14.311A 35.269 107.968 07/12/46 NA 37 NA NA NA NA NA32 Qa Stone 12N.11W.14.311 35.269 107.968 07/12/46 NA NA NA NA NA NA NA33 Qa Stone 12N.10W.29.434 35.240 107.916 07/12/46 NA 36 NA NA NA NA NA34 Qa Stone 11N.10W.21.221 35.168 107.898 06/07/57 NA 30 NA NA NA NA NA35 Qa Stone 11N.010W.26.321 35.154 107.863 05/07/57 NA 70 NA NA NA NA NA36 Qa Stone 13N.07W.31.414 35.311 107.620 10/24/62 NA 40 NA NA NA NA NA37 Qa Stone 13N.07W.20.1232 35.341 107.603 08/29/62 NA 30 10 NA NA NA NA38 Qa Stone 13N.07W.09.433 35.368 107.585 10/23/62 NA 50 10 NA NA NA NA39 Qa Stone 15N.17W.13.3243 35.531 108.590 10/13/65 NA NA 10 NA NA NA NA40 Qa Stone 15N.17W.14.4224 35.531 108.608 10/05/65 NA NA 20 NA NA NA NA41 Qa Stone 15N.17W.13.3141 35.531 108.590 10/15/65 NA NA 30 NA NA NA NA42 Qa Stone 15N.17W.13.3141 35.531 108.590 10/15/65 NA NA 30 NA NA NA NA43 Qa Stone 15N.17W.13.3141 35.531 108.590 10/05/65 NA NA 30 NA NA NA NA44 Qa Stone 15N.17W.14.2324A 35.531 108.608 09/10/69 NA 580 190 NA NA NA NA45 Qa Stone 20N.07W.22.1221 35.950 107.567 12/27/75 NA 190 20 20 50 1 1046 Qa RHR 21 35.320 107.684 05/19/09 100 NA NA NA NA NA 3047 Qa RHR 115 35.346 107.774 05/26/09 NA 200 NA NA NA NA 3048 Qa RHR 115 35.346 107.774 09/16/08 NA 200 NA NA NA NA 2049 Qa RHR 33 35.335 107.659 05/19/09 400 NA NA NA NA NA 2050 Qa RHR 120 35.346 107.737 11/18/08 NA 300 NA NA 70 NA 1051 Kmf Stone 20N.07W.08.321 35.980 107.603 02/21/67 NA 30 190 NA NA NA NA52 Kmf Stone 19N.05W.17.4434 35.877 107.389 01/14/76 NA 20 NA NA NA NA NA53 Kmf Stone 19N.05W.04.214 35.906 107.371 01/13/76 NA 400 30 NA NA NA NA54 Kmf Stone 20N.07W.24.222 35.950 107.532 12/28/75 NA 470 10 110 20 9.7 33055 Kmf Stone 19N.06W.01.3242 35.907 107.425 01/15/76 NA 360 170 80 40 .5 2056 Kmf Stone 19N.05W.09.4112 35.892 107.371 01/13/76 NA 1,500 10 NA NA NA NA57 Kmf RHR 87 35.327 107.642 02/16/09 NA 300 NA NA NA NA NA58 Kmf RHR 100 35.320 107.693 08/21/08 NA NA NA NA 100 NA NA59 Kmf RHR 100 35.320 107.693 11/08/08 NA NA NA NA 300 NA NA60 Kmf RHR 100 35.320 107.693 02/11/09 100 NA NA NA 260 NA NA

70
Geologic Framew
ork, Regional Aquifer Properties (1940s–2009), and Spring, Creek, and Seep Properties (2009–10)Table 3-1. Historical groundwater trace-element data in the study area, 1942–2009.—Continued
[NAD 83, North American Datum of 1983; Ba, barium; µg/L, micrograms per liter; B, boron; Fe, iron; Li, lithium; Mn, manganese; V, vanadium; Zn, zinc; Qa, Quaternary alluvium; NA, not available; Kmf, Cretaceous Menefee Formation; Kpl, Cretaceous Point Lookout Formation; Kcc, Cretaceous Crevasse Canyon Formation; Kg, Cretaceous Gallup Formation; Km, Cretaceous Mancos Formation; Kd, Cretaceous Dakota Formation; Jm, Jurassic Morrison Formation; Je, Jurassic Entrada Complex (includes Entrada, Todilto, Summerville, and Bluff Formations); TRc, Triassic Chinle Group; Psa, Permian San Andres Formation (including Glorieta Formation)]
Line no.
Form-ation
Data source*
Data identifier**
Latitude (NAD 83)
Longitude (NAD 83)
DateBa
(µg/L)B
(µg/L)Fe
(µg/L)Li
(µg/L)Mn
(µg/L)V
(µg/L)Zn
(µg/L)
61 Kmf RHR 100 35.320 107.693 05/19/09 100 NA NA NA 210 NA NA62 Kmf Stone 20N.05W.22.4422 35.949 107.353 01/13/76 NA 10 NA NA NA NA NA63 Kmf Stone 20N.04W.34.4421 35.920 107.246 11/01/63 NA NA 40 NA NA NA NA64 Kmf Stone 20N.03W.15.44 35.964 107.140 05/14/64 NA 70 10 NA NA NA NA65 Kmf Stone 20N.02W.31.2 35.920 107.086 09/29/52 NA NA 580 NA NA NA NA66 Kmf Stone 20N.02W.19.124 35.949 107.086 06/18/59 NA 270 700 NA NA NA NA67 Kmf Stone 21N.12W.33.1222 36.010 108.120 04/02/74 NA 350 NA NA NA NA NA68 Kmf Stone 20N.12W.26.444 35.936 108.083 05/02/67 NA 20 190 NA NA NA NA69 Kmf Stone 20N.05W.07.33C 35.978 107.407 01/29/76 NA 920 30 NA NA NA NA70 Kmf Stone 19N.09W.35.13 35.833 107.762 02/20/67 NA 20 260 NA NA NA NA71 Kmf Stone 19N.09W.07.3324 35.891 107.833 08/27/70 NA 80 110 NA NA NA NA72 Kmf Stone 19N.01W.08.223 35.892 106.962 04/25/78 NA 650 3,700 570 NA NA NA73 Kmf Stone 18N.09W.12.1A 35.804 107.744 11/30/66 NA 10 70 NA NA NA NA74 Kmf Stone 18N.09W.12.121 35.804 107.744 07/27/64 NA NA 80 NA NA NA NA75 Kmf Stone 18N.09W.12.1131 35.804 107.744 12/07/72 NA 580 150 NA NA NA NA76 Kmf Stone 18N.08W.09.111 35.804 107.691 02/20/67 NA 10 260 NA NA NA NA77 Kmf Stone 18N.05W.01.134 35.820 107.318 02/21/67 NA 20 110 NA NA NA NA78 Kmf Stone 17N.08W.30.4143 35.674 107.726 11/30/77 NA 10 110 NA NA NA NA79 Kmf Stone 17N.08W.19.434 35.689 107.726 02/20/67 NA NA 110 NA NA NA NA80 Kmf Stone 16N.08W.33.1341 35.573 107.691 10/02/62 NA 260 30 NA NA NA NA81 Kmf Stone 16N.07W.32.4141 35.573 107.602 10/15/62 NA 130 NA NA NA NA NA82 Kmf Stone 15N.08W.21.4414 35.515 107.692 10/16/62 NA 90 20 NA NA NA NA83 Kmf Stone 15N.06W.22.3123 35.514 107.460 10/22/62 NA 300 230 NA NA NA NA84 Kmf Stone 15N.06W.20.121 35.515 107.495 10/03/62 NA 100 20 NA NA NA NA85 Kmf Stone 13N.08W.24.3348 35.341 107.637 09/10/62 NA 130 20 NA NA NA NA86 Kmf Stone 18N.06W.04.3421 35.820 107.478 02/26/71 NA NA 220 NA NA NA NA87 Kmf Stone 18N.06W.04.3421 35.820 107.478 12/04/72 NA NA 250 NA NA NA NA88 Kmf RHR 27 35.335 107.655 11/13/08 200 NA NA NA NA NA 26089 Kmf RHR 27 35.335 107.655 05/19/09 200 NA NA NA NA NA 22090 Kmf RHR 27 35.335 107.655 08/06/08 200 NA NA NA NA NA 150

Appendix 3
71Table 3-1. Historical groundwater trace-element data in the study area, 1942–2009.—Continued
[NAD 83, North American Datum of 1983; Ba, barium; µg/L, micrograms per liter; B, boron; Fe, iron; Li, lithium; Mn, manganese; V, vanadium; Zn, zinc; Qa, Quaternary alluvium; NA, not available; Kmf, Cretaceous Menefee Formation; Kpl, Cretaceous Point Lookout Formation; Kcc, Cretaceous Crevasse Canyon Formation; Kg, Cretaceous Gallup Formation; Km, Cretaceous Mancos Formation; Kd, Cretaceous Dakota Formation; Jm, Jurassic Morrison Formation; Je, Jurassic Entrada Complex (includes Entrada, Todilto, Summerville, and Bluff Formations); TRc, Triassic Chinle Group; Psa, Permian San Andres Formation (including Glorieta Formation)]
Line no.
Form-ation
Data source*
Data identifier**
Latitude (NAD 83)
Longitude (NAD 83)
DateBa
(µg/L)B
(µg/L)Fe
(µg/L)Li
(µg/L)Mn
(µg/L)V
(µg/L)Zn
(µg/L)
91 Kmf RHR 27 35.335 107.655 02/16/09 200 NA NA NA NA NA 11092 Kmf RHR 7 35.367 107.658 09/17/08 NA 400 120 NA 10 NA 8093 Kmf RHR 7 35.367 107.658 11/16/08 NA 500 510 NA 10 NA 8094 Kmf RHR 83 35.331 107.640 08/20/08 NA 700 NA NA NA NA 7095 Kmf RHR 7 35.367 107.658 02/16/09 NA 500 570 NA 60 NA 5096 Kmf RHR 83 35.331 107.640 11/10/08 NA 700 NA NA NA NA 4097 Kmf RHR 62 35.333 107.642 08/20/08 NA NA NA NA 10 NA 3098 Kmf RHR 62 35.333 107.642 05/26/09 NA 100 NA NA NA NA 3099 Kmf RHR 62 35.333 107.642 11/11/08 NA 100 NA NA NA NA 30
100 Kmf RHR 87 35.327 107.642 11/12/08 100 400 NA NA NA NA 20101 Kmf RHR 87 35.327 107.642 05/19/09 NA 300 NA NA NA NA 20102 Kmf RHR 62 35.333 107.642 02/18/09 NA 100 NA NA NA NA 20103 Kmf RHR 7 35.367 107.658 05/18/09 NA 500 540 NA 60 NA 20104 Kmf RHR 87 35.327 107.642 08/12/08 200 400 NA NA NA NA 10105 Kmf Stone 16N.11W.33.411 35.573 108.008 11/24/64 NA NA 100 NA NA NA NA106 Kmf Stone 16N.11W.33.313 35.573 108.008 06/06/62 NA NA 140 NA NA NA NA107 Kmf Stone 21N.05W.32.424 36.006 107.386 01/23/78 NA 80 20 200 NA NA NA108 Kmf Stone 19N.08W.04.2144 35.906 107.691 09/22/75 NA 150 NA NA NA NA NA109 Kmf Stone 19N.06W.35.3244 35.834 107.443 01/26/76 NA 200 NA NA NA NA NA110 Kmf Stone 19N.06W.31.2242 35.835 107.514 01/12/76 NA 150 20 NA NA NA NA111 Kmf Stone 19N.06W.24.2212 35.863 107.425 12/28/75 NA 290 NA NA NA NA NA112 Kmf Stone 19N.06W.10.2111 35.892 107.460 12/28/75 NA 400 10 NA NA NA NA113 Kmf Stone 18N.05W.14.221 35.791 107.335 03/19/70 NA 50 70 NA NA NA NA114 Kmf Stone 19N.05W.23.3431 35.863 107.335 01/15/76 NA 240 NA NA NA NA NA115 Kmf Stone 20N.062.29.4143 35.936 107.496 12/28/75 NA 450 NA 80 10 1.1 240116 Kmf Stone 19N.07W.01.4112 35.907 107.532 01/05/76 NA 340 10 50 NA .1 10117 Kmf Stone 20N.06W.34.1143 35.921 107.460 12/27/75 NA 300 1,100 60 50 .5 NA118 Kpl RHR 90 35.331 107.649 11/10/08 400 100 NA NA NA NA NA119 Kpl RHR 122 35.398 107.559 03/06/79 NA 130 180,000 NA 6,000 NA NA120 Kpl RHR 132 35.418 107.635 10/18/79 450 250 NA NA 20,000 NA NA

72
Geologic Framew
ork, Regional Aquifer Properties (1940s–2009), and Spring, Creek, and Seep Properties (2009–10)Table 3-1. Historical groundwater trace-element data in the study area, 1942–2009.—Continued
[NAD 83, North American Datum of 1983; Ba, barium; µg/L, micrograms per liter; B, boron; Fe, iron; Li, lithium; Mn, manganese; V, vanadium; Zn, zinc; Qa, Quaternary alluvium; NA, not available; Kmf, Cretaceous Menefee Formation; Kpl, Cretaceous Point Lookout Formation; Kcc, Cretaceous Crevasse Canyon Formation; Kg, Cretaceous Gallup Formation; Km, Cretaceous Mancos Formation; Kd, Cretaceous Dakota Formation; Jm, Jurassic Morrison Formation; Je, Jurassic Entrada Complex (includes Entrada, Todilto, Summerville, and Bluff Formations); TRc, Triassic Chinle Group; Psa, Permian San Andres Formation (including Glorieta Formation)]
Line no.
Form-ation
Data source*
Data identifier**
Latitude (NAD 83)
Longitude (NAD 83)
DateBa
(µg/L)B
(µg/L)Fe
(µg/L)Li
(µg/L)Mn
(µg/L)V
(µg/L)Zn
(µg/L)
121 Kpl Stone 19N.13W.13.444 35.878 108.173 11/02/71 NA 750 270 NA NA NA NA122 Kpl Stone 19N.12W.27.14 35.849 108.101 11/02/71 NA 750 50 NA NA NA NA123 Kpl Stone 19N.12W.05. 35.907 108.137 11/02/71 NA 750 30 NA NA NA NA124 Kpl Stone 17N.11W.24.413 35.689 107.959 02/20/67 NA NA 150 NA NA NA NA125 Kpl Stone 14N.05W.14.422 35.438 107.334 08/29/62 NA 50 NA NA NA NA NA126 Kpl Stone 13N.08W.26.221 35.326 107.655 09/11/62 NA 140 20 NA NA NA NA127 Kpl Stone 16N.10W.22.212 35.602 107.883 09/19/62 NA 140 NA NA NA NA NA128 Kpl Stone 16N.09W.22.4444 35.602 107.778 09/20/62 NA 330 NA NA NA NA NA129 Kpl Stone 16N.08W.20.1312 35.602 107.708 10/02/62 NA 140 100 NA NA NA NA130 Kpl Stone 16N.08W.14.1114 35.617 107.655 10/02/62 NA 220 310 NA NA NA NA131 Kpl Stone 16N.07W.13.2244 35.617 107.531 10/02/62 NA 190 NA NA NA NA NA132 Kpl Stone 16N.06W.29.231 35.588 107.495 10/03/62 NA 210 40 NA NA NA NA133 Kpl Stone 15N.09W.13.144 35.529 107.745 10/04/62 NA 120 NA NA NA NA NA134 Kpl Stone 16N.04W.18.444 35.617 107.300 07/27/78 90 110 50 NA 9 2 10135 Kpl RHR 90 35.331 107.649 08/11/08 400 100 30 NA NA NA 90136 Kpl RHR 102 35.311 107.687 09/24/08 200 500 40 NA 20 NA 90137 Kpl RHR 102 35.311 107.687 02/11/09 100 400 90 NA NA NA 60138 Kpl RHR 102 35.311 107.687 11/08/08 NA 500 250 NA NA NA 50139 Kpl RHR 90 35.331 107.649 02/16/09 200 400 NA NA NA NA 40140 Kpl RHR 22 35.342 107.664 05/19/09 300 NA NA NA NA NA 40141 Kpl RHR 22 35.342 107.664 11/13/08 300 NA 30 NA NA NA 30142 Kpl RHR 90 35.331 107.649 05/19/09 400 NA NA NA NA NA 20143 Kpl RHR 22 35.342 107.664 08/21/08 300 NA NA NA NA NA 20144 Kpl RHR 22 35.342 107.664 02/11/09 300 NA 40 NA NA NA 20145 Kcc Stone 15N.09W.09.2442 35.544 107.796 09/12/62 NA 360 20 NA NA NA NA146 Kcc Stone 18N.13W.23.3212 35.776 108.190 11/02/71 NA 750 40 NA NA NA NA147 Kcc Stone 18N.13W.01.4 35.820 108.173 11/02/71 NA 1300 80 NA NA NA NA148 Kcc Stone 16N.13W.11.3413 35.632 108.185 07/11/61 NA 350 10 NA NA NA NA149 Kcc Stone 15N.10W.06.2421 35.558 107.936 08/01/61 NA 220 20 NA NA NA NA150 Kcc Stone 15N.10W.13.1314 35.529 107.848 07/18/73 NA 260 20 NA NA NA NA

Appendix 3
73Table 3-1. Historical groundwater trace-element data in the study area, 1942–2009.—Continued
[NAD 83, North American Datum of 1983; Ba, barium; µg/L, micrograms per liter; B, boron; Fe, iron; Li, lithium; Mn, manganese; V, vanadium; Zn, zinc; Qa, Quaternary alluvium; NA, not available; Kmf, Cretaceous Menefee Formation; Kpl, Cretaceous Point Lookout Formation; Kcc, Cretaceous Crevasse Canyon Formation; Kg, Cretaceous Gallup Formation; Km, Cretaceous Mancos Formation; Kd, Cretaceous Dakota Formation; Jm, Jurassic Morrison Formation; Je, Jurassic Entrada Complex (includes Entrada, Todilto, Summerville, and Bluff Formations); TRc, Triassic Chinle Group; Psa, Permian San Andres Formation (including Glorieta Formation)]
Line no.
Form-ation
Data source*
Data identifier**
Latitude (NAD 83)
Longitude (NAD 83)
DateBa
(µg/L)B
(µg/L)Fe
(µg/L)Li
(µg/L)Mn
(µg/L)V
(µg/L)Zn
(µg/L)
151 Kcc Stone 15N.10W.06.2421 35.558 107.936 01/15/70 NA 150 70 NA NA NA NA152 Kg RHR 32 35.336 107.662 08/21/08 NA 400 60 NA 10 NA NA153 Kg RHR 16 35.356 107.704 11/11/08 NA 500 NA NA NA NA NA154 Kg RHR 16 35.356 107.704 05/19/09 NA 400 NA NA NA NA NA155 Kg Stone 17N.13W.21.111 35.689 108.226 09/17/76 NA 120 10 NA NA NA NA156 Kg Stone 17N.12W.33.244 35.660 108.119 03/10/70 NA NA 320 NA NA NA NA157 Kg Stone 16N.18W.35.14 35.574 108.716 05/25/56 NA NA 10 NA NA NA NA158 Kg Stone 16N.11W.17.4322 35.616 108.026 02/12/73 NA 120 10 NA NA NA NA159 Kg Stone 16N.07W.26.2214 35.588 107.549 10/02/62 NA 120 20 NA NA NA NA160 Kg Stone 16N.05W.19.414 35.602 107.407 09/19/62 NA 130 200 NA NA NA NA161 Kg Stone 16N.04W.36.2321 35.573 107.210 04/13/78 NA 80 10 30 NA NA NA162 Kg Stone 15N.10W.04.1311 35.558 107.901 07/18/73 NA 180 NA NA NA NA NA163 Kg Stone 14N.08W.15.244 35.442 107.672 10/01/62 NA 800 NA NA NA NA NA164 Kg Stone 15N.18W.14.2223 35.531 108.716 11/28/55 NA NA 10 NA NA NA NA165 Kg Stone 15N.18W.13.1134A 35.531 108.698 11/22/48 NA NA 20 NA NA NA NA166 Kg Stone 15N.18W.14.2223 35.531 108.716 12/06/48 NA NA 30 NA NA NA NA167 Kg Stone 15N.10W.13.1314 35.529 107.848 09/18/62 NA 240 570 NA NA NA NA168 Kg RHR 16 35.356 107.704 02/12/09 NA 400 13,800 NA 80 NA 50169 Kg RHR 16 35.356 107.704 08/25/08 NA 300 NA NA 20 NA 20170 Km Stone 16N.01W.29.2322 35.588 106.961 06/05/73 NA 1,800 30 1,200 20 NA NA171 Km Stone 16N.15W.20.1314 35.603 108.450 11/18/71 NA 600 20 NA NA NA NA172 Kd Stone 16N.10W.02.23 35.646 107.864 05/23/75 NA NA 1,300 NA 60 NA NA173 Kd Stone 14N.08W.04.3343 35.472 107.690 10/16/62 NA 380 20 NA NA NA NA174 Kd Stone 17N.12W.30.3243 35.675 108.154 10/29/74 NA NA 10 NA NA NA NA175 Kd Stone 17N.12W.30.142 35.675 108.154 10/13/64 NA NA 30 NA NA NA NA176 Kd Stone 16N.16W.15.4322 35.617 108.521 02/07/74 NA 20 NA NA NA NA NA177 Kd Stone 16N.15W.11.3323 35.632 108.397 02/13/74 NA 120 NA NA NA NA NA178 Kd Stone 16N.14W.21.3334 35.603 108.326 03/20/74 NA 40 500 NA NA NA NA179 Kd Stone 16N.14W.15.1342 35.617 108.309 03/20/74 NA 320 2,000 NA NA NA NA180 Kd Stone 15N.11W.17.1111 35.529 108.026 07/31/61 NA 100 20 NA NA NA NA

74
Geologic Framew
ork, Regional Aquifer Properties (1940s–2009), and Spring, Creek, and Seep Properties (2009–10)Table 3-1. Historical groundwater trace-element data in the study area, 1942–2009.—Continued
[NAD 83, North American Datum of 1983; Ba, barium; µg/L, micrograms per liter; B, boron; Fe, iron; Li, lithium; Mn, manganese; V, vanadium; Zn, zinc; Qa, Quaternary alluvium; NA, not available; Kmf, Cretaceous Menefee Formation; Kpl, Cretaceous Point Lookout Formation; Kcc, Cretaceous Crevasse Canyon Formation; Kg, Cretaceous Gallup Formation; Km, Cretaceous Mancos Formation; Kd, Cretaceous Dakota Formation; Jm, Jurassic Morrison Formation; Je, Jurassic Entrada Complex (includes Entrada, Todilto, Summerville, and Bluff Formations); TRc, Triassic Chinle Group; Psa, Permian San Andres Formation (including Glorieta Formation)]
Line no.
Form-ation
Data source*
Data identifier**
Latitude (NAD 83)
Longitude (NAD 83)
DateBa
(µg/L)B
(µg/L)Fe
(µg/L)Li
(µg/L)Mn
(µg/L)V
(µg/L)Zn
(µg/L)
181 Kd Stone 14N.09W.36.313 35.398 107.742 04/24/63 NA NA 80 NA NA NA NA182 Kd Stone 14N.09W.36.313 35.398 107.742 05/06/63 NA NA 20 50 NA NA NA183 Kd Brod 16N.15W.20.1314 35.603 108.450 11/23/70 NA 120 40 NA NA NA NA184 Kd Brod 16N.15W.17.1431 35.618 108.450 07/29/70 NA 50 110 NA NA NA NA185 Kd Brod 16N.15W.17.1431 35.618 108.450 02/23/70 NA 20 390 NA NA NA NA186 Kd Stone 14N.09W.17.300 35.442 107.814 08/08/62 NA 170 NA NA NA NA NA187 Kd Stone 16N.15W.20.1314 35.603 108.450 02/13/74 NA 60 100 NA NA NA 30188 Kd Stone 16N.17W.15.2324 35.617 108.626 03/26/74 10 740 10 NA 8 NA 6189 Jm Stone 17N.16W.35.413 35.660 108.510 03/23/71 NA NA 500 NA NA NA NA190 Jm Stone 16N.17W.21.3442 35.603 108.644 03/26/74 NA 200 NA NA NA NA NA191 Jm Stone 16N.16W.17.2114 35.617 108.556 02/07/74 NA 60 30 NA NA NA NA192 Jm Stone 16N.14W.33.22 35.574 108.326 03/06/73 NA 1,700 NA NA NA NA NA193 Jm Stone 16N.11W.33.332 35.573 108.008 09/08/72 NA NA 20 NA NA NA NA194 Jm Stone 15N.12W.17.123A 35.531 108.131 05/04/63 NA NA 260 10 NA NA NA195 Jm Stone 14N.10W.25.100 35.414 107.849 08/18/59 NA 210 NA NA NA NA NA196 Jm Stone 14N.09W.32.314 35.399 107.813 08/11/59 NA 100 NA NA NA NA NA197 Jm Stone 14N.09W.32.122 35.399 107.813 02/14/58 NA NA 2,100 NA NA NA NA198 Jm Stone 14N.09W.30.2213 35.414 107.831 05/03/63 NA NA NA 120 NA NA NA199 Jm Stone 14N.09W.29.312 35.413 107.813 08/13/59 NA 170 430 NA NA NA NA200 Jm Stone 14N.09W.18.400 35.442 107.831 08/30/63 NA NA 60 50 NA NA NA201 Jm Stone 14N.09W.18.243 35.442 107.831 10/17/62 NA 230 10 NA NA NA NA202 Jm Stone 14N.10W.11.434A 35.457 107.867 10/18/60 NA 330 NA NA NA NA NA203 Jm Stone 16N.16W.30.3431 35.588 108.574 05/02/72 NA 80 10 NA NA NA NA204 Jm Stone 15N.11W.29.1132 35.500 108.026 09/30/76 30 50 NA NA NA NA NA205 Jm Stone 14N.09W.34.422 35.399 107.777 04/24/63 NA NA NA 70 NA NA NA206 Jm Stone 14N.10W.24.400 35.428 107.849 04/29/63 NA NA 20 50 NA NA NA207 Jm Stone 14N.10W.22.2 35.428 107.884 08/08/62 NA 160 10 NA NA NA NA208 Jm Stone 14N.10W.22.2 35.428 107.884 08/08/62 NA 140 NA NA NA NA NA209 Jm RHR 113 35.346 107.781 02/12/09 NA NA NA NA 170 NA 460210 Jm RHR 116 35.345 107.780 08/19/08 NA 300 NA NA NA NA 210

Appendix 3
75Table 3-1. Historical groundwater trace-element data in the study area, 1942–2009.—Continued
[NAD 83, North American Datum of 1983; Ba, barium; µg/L, micrograms per liter; B, boron; Fe, iron; Li, lithium; Mn, manganese; V, vanadium; Zn, zinc; Qa, Quaternary alluvium; NA, not available; Kmf, Cretaceous Menefee Formation; Kpl, Cretaceous Point Lookout Formation; Kcc, Cretaceous Crevasse Canyon Formation; Kg, Cretaceous Gallup Formation; Km, Cretaceous Mancos Formation; Kd, Cretaceous Dakota Formation; Jm, Jurassic Morrison Formation; Je, Jurassic Entrada Complex (includes Entrada, Todilto, Summerville, and Bluff Formations); TRc, Triassic Chinle Group; Psa, Permian San Andres Formation (including Glorieta Formation)]
Line no.
Form-ation
Data source*
Data identifier**
Latitude (NAD 83)
Longitude (NAD 83)
DateBa
(µg/L)B
(µg/L)Fe
(µg/L)Li
(µg/L)Mn
(µg/L)V
(µg/L)Zn
(µg/L)
211 Jm RHR 113 35.346 107.781 09/22/08 NA 300 NA NA 110 NA 200212 Jm RHR 116 35.345 107.780 05/21/09 NA 300 NA NA NA NA 110213 Jm RHR 116 35.345 107.780 02/10/09 NA 200 NA NA NA NA 80214 Jm RHR 116 35.345 107.780 11/13/08 NA 200 NA NA NA NA 70215 Jm RHR 114 35.346 107.781 02/18/09 100 300 NA NA 70 NA 40216 Jm RHR 114 35.346 107.781 09/18/08 200 200 NA NA 70 NA 20217 Jm RHR 113 35.346 107.781 11/10/08 NA 200 NA NA NA NA 20218 Jm RHR 114 35.346 107.781 05/26/09 200 300 NA NA 60 NA 10219 Jm RHR 113 35.346 107.781 05/26/09 NA 300 NA NA NA NA 10220 Je Stone 14N.12W.14.143 35.443 108.078 09/05/62 NA 310 100 NA NA NA NA221 Je Stone 14N.12W.09.221 35.458 108.114 09/05/62 NA 1,600 30 NA NA NA NA222 Je Stone 14N.11W.19.124 35.428 108.043 08/04/61 NA 180 10 NA NA NA NA223 Je Stone 13N.10W.08.211 35.370 107.920 02/02/67 NA 60 70 NA NA NA NA224 Je Stone 13N.10W.20.114 35.341 107.920 07/23/76 NA 1,000 280 NA NA NA NA225 Je Stone 20N.06W.32.23 35.921 107.496 04/24/75 NA NA 170 450 90 NA NA226 Je Stone 16N.16W.25.2344 35.588 108.486 02/13/74 NA 500 220 NA NA NA NA227 Je Stone 15N.14W.13.413 35.531 108.273 06/10/70 NA NA 260 NA NA NA NA228 Je Stone 13N.10W.18.4113 35.356 107.938 04/26/72 NA 1,200 630 NA NA NA NA229 Je Stone 15N.13W.12.144 35.546 108.167 07/11/61 NA 150 210 NA NA NA NA230 Je Stone 15N.17W.14.4224 35.531 108.608 10/15/65 NA NA 40 NA NA NA NA231 Je Stone 15N.13W.22.1111 35.517 108.202 09/24/70 NA 890 150 NA NA NA NA232 Je Stone 15N.17W.14.4224 35.531 108.608 09/30/66 NA NA 520 NA NA NA NA233 Je Stone 15N.13W.22.1111 35.517 108.202 03/20/74 NA 1,030 340 NA NA NA 170234 Je Stone 19N.04W.13.111C 35.877 107.211 12/27/75 NA 1,900 800 1,200 90 6.7 NA235 TRc Stone 13N.12W.10.2444 35.370 108.096 08/23/67 NA 500 400 NA NA NA NA236 TRc Brod 14N.13W.20.4323 35.430 108.238 07/12/61 NA 210 80 NA NA NA NA237 TRc Stone 13N.11W.07.344 35.370 108.043 03/12/75 NA NA 10 NA 30 NA NA238 TRc Brod 12N.10W.23.233 35.254 107.862 07/12/46 NA 550 NA NA NA NA NA239 TRc Brod 14N.13W.33.124 35.401 108.221 07/18/61 NA 120 10 NA NA NA NA240 TRc Stone 15N.15W.20.313 35.517 108.449 06/15/66 NA NA 40 NA NA NA NA

76
Geologic Framew
ork, Regional Aquifer Properties (1940s–2009), and Spring, Creek, and Seep Properties (2009–10)Table 3-1. Historical groundwater trace-element data in the study area, 1942–2009.—Continued
[NAD 83, North American Datum of 1983; Ba, barium; µg/L, micrograms per liter; B, boron; Fe, iron; Li, lithium; Mn, manganese; V, vanadium; Zn, zinc; Qa, Quaternary alluvium; NA, not available; Kmf, Cretaceous Menefee Formation; Kpl, Cretaceous Point Lookout Formation; Kcc, Cretaceous Crevasse Canyon Formation; Kg, Cretaceous Gallup Formation; Km, Cretaceous Mancos Formation; Kd, Cretaceous Dakota Formation; Jm, Jurassic Morrison Formation; Je, Jurassic Entrada Complex (includes Entrada, Todilto, Summerville, and Bluff Formations); TRc, Triassic Chinle Group; Psa, Permian San Andres Formation (including Glorieta Formation)]
Line no.
Form-ation
Data source*
Data identifier**
Latitude (NAD 83)
Longitude (NAD 83)
DateBa
(µg/L)B
(µg/L)Fe
(µg/L)Li
(µg/L)Mn
(µg/L)V
(µg/L)Zn
(µg/L)
241 TRc Stone 15N.15W.20.313 35.517 108.449 10/24/67 NA 200 70 NA NA NA NA242 TRc Stone 13N.10W.18.212 35.356 107.938 06/18/76 NA NA 90 NA NA NA NA243 TRc Stone 13N.10W.18.212 35.356 107.938 12/22/76 660 2,600 100 NA NA NA NA244 TRc Stone 14N.13W.25.1334 35.415 108.167 09/30/71 NA 450 150 NA NA NA NA245 TRc Brod 14N.15W.04.1134 35.473 108.432 05/14/69 NA NA 220 NA NA NA NA246 TRc Stone 14N.13W.25.1334 35.415 108.167 03/01/66 NA 30 230 NA NA NA NA247 TRc Stone 15N.16W.06.2 35.559 108.574 03/28/72 NA 80 NA NA NA NA NA248 Psa Stone 15N.16W.30.3443 35.502 108.574 10/02/68 NA 1,100 110 NA NA NA NA249 Psa Stone 14N.13W.33.3341 35.401 108.221 07/19/61 NA 110 10 NA NA NA NA250 Psa Stone 13N.12W.34.332 35.313 108.097 09/04/62 NA 140 NA NA NA NA NA251 Psa Stone 12N.10W.32.111 35.225 107.915 07/12/46 NA 70 NA NA NA NA NA252 Psa Stone 12N.10W.30.421 35.240 107.933 05/07/57 NA 70 NA NA NA NA NA253 Psa Stone 12N.10W.27.333 35.240 107.880 05/07/57 NA 330 NA NA NA NA NA254 Psa Stone 12N.10W.23.233 35.254 107.862 07/12/46 NA 276 NA NA NA NA NA255 Psa Stone 11N.10W.16.121 35.182 107.898 07/12/46 NA 70 NA NA NA NA NA256 Psa Stone 11N.10W.09.221 35.197 107.898 07/11/46 NA 70 NA NA NA NA NA257 Psa Stone 11N.10W.04.333 35.211 107.898 08/23/66 NA 160 NA NA NA NA NA258 Psa Stone 11N.10W.04.211 35.211 107.898 06/07/57 NA 40 NA NA NA NA NA259 Psa Stone 15N.17W.13.222 35.531 108.590 10/01/64 NA NA 60 NA NA NA NA260 Psa Stone 15N.16W.23.3132 35.517 108.503 03/23/72 NA 80 NA NA NA NA NA261 Psa Stone 14N.13W.20.4322 35.430 108.238 03/13/75 NA NA 10 NA 20 NA NA262 Psa Stone 14N.13W.20.4321 35.430 108.238 03/13/75 NA NA 50 NA NA NA NA263 Psa Stone 14N.13W.19.1 35.430 108.256 07/14/70 NA 300 NA NA NA NA NA264 Psa Stone 14N.15W.04.1134 35.473 108.432 03/03/75 NA NA 20 NA NA NA NA265 Psa Stone 14N.13W.33.124 35.401 108.221 03/13/75 NA NA 10 NA 30 NA NA266 Psa Stone 11N.10W.16.121A 35.182 107.898 08/15/62 NA 150 NA NA NA NA NA267 Psa Stone 15N.17W.24.4121 35.517 108.591 07/22/65 NA NA 10 NA NA NA NA268 Psa Stone 15N.17W.24.4121 35.517 108.591 07/22/65 NA NA 10 NA NA NA NA269 Psa Stone 15N.18W.13.1134A 35.531 108.698 07/25/67 NA NA 10 NA NA NA NA270 Psa Stone 15N.17W.24.4121 35.517 108.591 06/05/64 NA NA 20 NA NA NA NA

Appendix 3
77Table 3-1. Historical groundwater trace-element data in the study area, 1942–2009.—Continued
[NAD 83, North American Datum of 1983; Ba, barium; µg/L, micrograms per liter; B, boron; Fe, iron; Li, lithium; Mn, manganese; V, vanadium; Zn, zinc; Qa, Quaternary alluvium; NA, not available; Kmf, Cretaceous Menefee Formation; Kpl, Cretaceous Point Lookout Formation; Kcc, Cretaceous Crevasse Canyon Formation; Kg, Cretaceous Gallup Formation; Km, Cretaceous Mancos Formation; Kd, Cretaceous Dakota Formation; Jm, Jurassic Morrison Formation; Je, Jurassic Entrada Complex (includes Entrada, Todilto, Summerville, and Bluff Formations); TRc, Triassic Chinle Group; Psa, Permian San Andres Formation (including Glorieta Formation)]
Line no.
Form-ation
Data source*
Data identifier**
Latitude (NAD 83)
Longitude (NAD 83)
DateBa
(µg/L)B
(µg/L)Fe
(µg/L)Li
(µg/L)Mn
(µg/L)V
(µg/L)Zn
(µg/L)
271 Psa Stone 15N.17W.24.4121 35.517 108.591 10/06/60 NA NA 40 NA NA NA NA272 Psa Brod 15N.15W.18.3344 35.531 108.467 11/06/69 NA 220 70 NA NA NA NA273 Psa Brod 15N.17W.12.34 35.545 108.591 04/01/69 NA NA 70 NA NA NA NA274 Psa Brod 15N.15W.18.3344 35.531 108.467 06/15/66 NA NA 70 NA NA NA NA275 Psa Stone 15N.15W.18.3344 35.531 108.467 08/12/70 NA NA 70 NA NA NA NA276 Psa Stone 15N.15W.18.3344 35.531 108.467 08/01/68 NA 50 80 NA NA NA NA277 Psa Stone 15N.15W.18.3344 35.531 108.467 11/06/69 NA 50 110 NA NA NA NA278 Psa Stone 15N.17W.13.1142 35.531 108.590 08/18/64 NA NA 120 NA NA NA NA279 Psa Stone 14N.13W.127.342A 35.458 108.167 12/06/67 NA NA 140 NA NA NA NA280 Psa Stone 15N.18W.13.1134A 35.531 108.698 08/31/66 NA NA 170 NA NA NA NA281 Psa Brod 15N.17W.12.34 35.545 108.591 11/30/66 NA 50 190 NA NA NA NA282 Psa Brod 15N.17W.13.1142 35.531 108.590 11/30/66 NA 20 260 NA NA NA NA283 Psa Brod 15N.17W.24.4121 35.517 108.591 08/25/58 NA NA 270 NA NA NA NA284 Psa Brod 15N.12W.17.111 35.531 108.131 02/08/76 NA 1,400 360 NA NA NA NA285 Psa Stone 15N.17W.24.4121 35.517 108.591 02/05/42 NA NA 600 NA NA NA NA286 Psa Stone 12N.11W.25.213 35.240 107.950 07/11/46 NA 147 NA NA NA NA NA287 Psa Stone 11N.10W.16.121A 35.182 107.898 08/22/66 NA 260 NA NA NA NA NA288 Psa Brod 12N.11W.25.213 35.240 107.950 05/07/57 NA 330 NA NA NA NA NA289 Psa Stone 14N.13W.127.342A 35.458 108.167 04/07/72 NA 120 NA NA NA NA NA290 Psa Stone 15N.15W.20.313 35.517 108.449 03/16/72 NA 160 NA NA NA NA NA291 Psa Stone 12N.11W.15.211 35.269 107.985 05/06/57 NA 1,200 NA NA NA NA NA292 Psa Stone 15N.12W.17.111 35.531 108.131 01/26/75 NA NA 1,900 NA 180 NA 220
*Data sources:Brod—Brod, R.C., and Stone, W.J., 1981, Hydrogeology of Ambrosia Lake-San Mateo area, McKinley and Cibola Counties, New Mexico: New Mexico Bureau of Mines and Mineral Resources, HS-2, text and map, 1:62,500.Stone—Stone, W.J., Lyford, F.P., Frenzel, P.F., Mizell, N.H., and Padgett, E.T., 1983, Hydrogeology and water resources of San Juan Basin, New Mexico: Socorro, New Mexico Bureau of Mines and Mineral Resources, Hydrologic Report 6, 70 p.RHR—Roca Honda Resources, LLC, 2009a, 11-20-2009 Permit application, Phase II of a new mine application—Baseline data report: Permit application to the Mining and Minerals Division of the New Mexico Energy, Minerals, and Natural Resources Department, http://www.emnrd.state.nm.us/MMD/MARP/permits/MARP_Permits.htm.**Data identifiers: these values are data indicators used by the source to identify the data within the report or database.

78 Geologic Framework, Regional Aquifer Properties (1940s–2009), and Spring, Creek, and Seep Properties (2009–10)
Figure 3-1. Spatial distribution of historical groundwater trace-element data in the study area.
£¤550
¬
¬
¬«602
¬«197
¬«605
¬«509
x
Brimhall Nizhoni
107° 00'107° 30'108° 00'108° 30'
0 10 20 30 MILES
0 10 20 30 KILOMETERS
Base from U.S. Geological Survey digital data, 1:24,000Projection: Universal Transverse Mercator zone 13N, North American Datum of 1983, North American Vertical Datum of 1988
Sheep Springs
Naschitti
Tohatchi
Twin LakesYah-ta-hey
Gallup
Church Rock
Crownpoint
Thoreau
Ramah
BlackRock
MilanGrants
PaguateEncinal
Paraje
PuebloPintado
Torreon
Mt. Taylor
40
40
57
53
Regional geologicstructure boundaries(modified from Fitzsimmons,1959, and Baldwin and Anderholm, 1992)
Chaco Slope(southern San Juan Basin)
Zuni Uplift Acoma Embayment
Rio PuercoFault Zone
550
Cuba
96
La Jara
ReginaNageezi
AcomitaLaguna
Nakaibito
¤491
!¬«371
!!!!!!
! !!
!!!
!!
!!!!!
!
!
!
!!!
!!!!!
!
!!
!
!!
!
!!
!!!!!!
!
!!! !!
!
!
!
!
!!
!!!!!
!
!
!
!
!
!
!
!
!
! !
!!! !!
!!
! !
! !!
!
!!
!!!!
!!
!
!
!!!!!!!
!
!
!!
!
!
!!!
!
!
!
!!
!
!
!!
!
!
!
!
!
!
! ! !! !
!
!
!
!!!!
!!!!!!
!
!
!
!
!
!
!
!
!!!
!
!
!
!!
!
!!
!
!!! !
!!
!!
!
!
!!
!!
!!
! !
!!
!!
!!!
!
!!!
!
!!
! !
!
!!!
!!
!!!
!
!
!
!!!
!!!!!!!!!!!
!!
!
!!
!
!
!
!
!!
!!
!
!
!
!
!
!
!
!
!
!
!!
!!
!
!
!
!
!
!
!
!! !
!
!!!!
!!
!!!
!
!
!
!!!!!
!!!
!!!
!!!!!!
!
!!!!
!!
!
!
!
!
!
!
!
36˚ 00´
35˚ 30´
! Well location from which data were collected
Developed area
EXPLANATION

Appendix 4.—Historical Groundwater Contaminants-of-Concern Data


Appendix 4 81
Data for the contaminants of concern in the study area (NO3, U, Ra, and gross alpha) are presented in table 4-1. The spatial distribution of the associated wells across the study area is shown in fig. 4-1 (individual well locations can be located through latitude and longitude coordinates presented in table 4-1). The contaminants-of-concern data set is a compilation of multiple sources and is presented in order of increasing geologic age of the associated formation. Initial formation designations were determined by the authors/data collectors of the source references (references listed following the table). Contaminant data without formation designations were not included for analysis in this study. For this study, formation designations were homoge-nized to currently (2011) accepted formation nomenclature. This homogenization was necessary because of the long data record (1940s onward) during which formation identification has changed, with certain formation names dropped from the lexicon or added as additional studies continued to update the stratigraphic nomenclature of the region (see Methods section).
Appendix 4

82
Geologic Framew
ork, Regional Aquifer Properties (1940s–2009), and Spring, Creek, and Seep Properties (2009–10)Table 4-1. Historical groundwater contaminants-of-concern data in the study area, 1942–2009.—Continued
[NAD 83, North American Datum of 1983; NO3, nitrate or nitrate plus nitrite; N, nitrogen; mg/L, milligrams per liter; U, uranium; µg/L, micrograms per liter; Ra, radium; pCi/L, picocuries per liter; Qa, Quaternary alluvium; NA, not available; Kmf, Cretaceous Menefee Formation; Kpl, Cretaceous Point Lookout Formation; Kcc, Cretaceous Crevasse Canyon Formation; Kg, Cretaceous Gallup Formation; Km, Cretaceous Mancos Formation; Kd, Cretaceous Dakota Formation; Jm, Jurassic Morrison Formation; Je, Jurassic Entrada Complex (includes Entrada, Todilto, Summerville, and Bluff Formations); TRc, Triassic Chinle Group; Psa, Permian San Andres Formation (including Glorieta Formation)]
Line no.
Form-ation
Data source*
Data identifier**
Latitude (NAD 83)
Longitude (NAD 83)
DateNO3
(as N, mg/L)U
(µg/L)Ra 226 (pCi/L)
Ra 228 (pCi/L)
Ra 228 +226 (pCi/L)
Gross alpha (pCi/L)
1 Qa RHR 120 35.348 107.738 08/06/08 NA 3.3 0.41 0.42 0.83 6.72 Qa RHR 120 35.348 107.738 11/18/08 NA 2.7 .41 .25 .66 11.83 Qa RHR 120 35.348 107.738 02/18/09 NA NA NA .71 .71 2.14 Qa RHR 120 35.348 107.738 05/26/09 NA 3.6 .51 2.60 3.11 5.35 Qa RHR 121 35.348 107.739 08/18/08 1.7 NA NA .27 .27 1.86 Qa RHR 21 35.323 107.684 08/21/08 NA 4.9 .03 .31 .34 8.87 Qa RHR 21 35.323 107.684 11/08/08 NA 5.3 .09 2.40 2.49 7.48 Qa RHR 21 35.323 107.684 02/11/09 NA 5.5 NA .46 .46 5.69 Qa RHR 21 35.323 107.684 05/19/09 NA 5.1 NA 1.00 1.00 8.6
10 Qa RHR 115 35.347 107.776 09/16/08 5.7 180 NA .32 .32 20511 Qa RHR 115 35.347 107.776 11/13/08 5.6 166 NA .01 .01 22812 Qa RHR 115 35.347 107.776 05/26/09 5.7 192 NA .03 .03 16613 Qa RHR 33 35.334 107.657 09/23/08 2.0 8.5 NA NA NA 26.814 Qa RHR 33 35.334 107.657 11/17/08 2.8 8.0 NA .01 .01 13.715 Qa RHR 33 35.334 107.657 05/19/09 NA NA .3 .05 .35 3.516 Qa Stone 11N.10W.21.221 35.168 107.898 06/07/57 8.2 NA NA NA NA NA17 Qa Stone 11N.10W.26.321 35.154 107.863 05/07/57 3.1 NA NA NA NA NA18 Qa Stone 11N.10W.26.321A 35.154 107.863 10/21/44 5.7 NA NA NA NA NA19 Qa Stone 11N.10W.26.321A 35.154 107.863 06/15/55 3.8 NA NA NA NA NA20 Qa Stone 12N.10W.27.244 35.240 107.880 07/25/56 10 NA NA NA NA NA21 Qa Stone 12N.10W.29.434 35.240 107.916 07/12/46 14 NA NA NA NA NA22 Qa Stone 12N.11W.14.213 35.269 107.968 07/23/56 .9 NA NA NA NA NA23 Qa Stone 12N.11W.14.311A 35.269 107.968 07/18/56 16 NA NA NA NA NA24 Qa Stone 13N.07W.09.433 35.368 107.585 10/23/62 .1 NA NA NA NA NA25 Qa Stone 13N.07W.20.1232 35.341 107.603 08/29/62 .2 NA NA NA NA NA26 Qa Stone 13N.07W.31.414 35.311 107.620 10/24/61 .5 NA NA NA NA NA27 Qa Stone 13N.09W.22.2124 35.341 107.778 12/06/57 12 NA NA NA NA NA28 Qa Stone 15N.10W.32.214 35.486 107.919 09/18/62 10 NA NA NA NA NA29 Qa Stone 15N.15W.07.23 35.545 108.468 04/07/53 20 NA NA NA NA NA30 Qa Stone 15N.17W.13.3243 35.531 108.590 10/13/65 2.7 NA NA NA NA NA

Appendix 4
83Table 4-1. Historical groundwater contaminants-of-concern data in the study area, 1942–2009.—Continued
[NAD 83, North American Datum of 1983; NO3, nitrate or nitrate plus nitrite; N, nitrogen; mg/L, milligrams per liter; U, uranium; µg/L, micrograms per liter; Ra, radium; pCi/L, picocuries per liter; Qa, Quaternary alluvium; NA, not available; Kmf, Cretaceous Menefee Formation; Kpl, Cretaceous Point Lookout Formation; Kcc, Cretaceous Crevasse Canyon Formation; Kg, Cretaceous Gallup Formation; Km, Cretaceous Mancos Formation; Kd, Cretaceous Dakota Formation; Jm, Jurassic Morrison Formation; Je, Jurassic Entrada Complex (includes Entrada, Todilto, Summerville, and Bluff Formations); TRc, Triassic Chinle Group; Psa, Permian San Andres Formation (including Glorieta Formation)]
Line no.
Form-ation
Data source*
Data identifier**
Latitude (NAD 83)
Longitude (NAD 83)
DateNO3
(as N, mg/L)U
(µg/L)Ra 226 (pCi/L)
Ra 228 (pCi/L)
Ra 228 +226 (pCi/L)
Gross alpha (pCi/L)
31 Qa Stone 15N.17W.13.3243 35.531 108.590 10/12/66 0.2 NA NA NA NA NA32 Qa Stone 15N.17W.13.3414 35.531 108.590 10/15/65 .4 NA NA NA NA NA33 Qa Stone 15N.17W.14.1 35.531 108.608 08/07/75 .6 NA NA NA NA NA34 Qa Stone 15N.17W.14.1A 35.531 108.608 08/07/75 .6 NA NA NA NA NA35 Qa Stone 15N.17W.14.2322B 35.531 108.608 09/17/75 .5 NA NA NA NA NA36 Qa Stone 15N.17W.15.1321 35.530 108.625 03/07/65 .2 NA NA NA NA NA37 Qa Stone 15N.17W.15.24142 35.530 108.625 03/19/65 29 NA NA NA NA NA38 Qa Stone 16N.15W.19.42 35.603 108.468 05/11/50 .1 NA NA NA NA NA39 Qa Stone 16N.15W.20.1134 35.603 108.450 08/30/49 2.2 NA NA NA NA NA40 Qa Stone 16N.16W.19.1 35.603 108.574 07/17/70 1.2 NA NA NA NA NA41 Qa Stone 18N.04W.06. 35.820 107.300 03/19/70 8.7 NA NA NA NA NA42 Qa Stone 18N.04W.22.21 35.777 107.247 12/14/50 .9 NA NA NA NA NA43 Qa Stone 18N.04W.22.231 35.777 107.247 01/04/64 .4 NA NA NA NA NA44 Qa Stone 19N.04W.09. 35.892 107.264 03/19/70 5.0 NA NA NA NA NA45 Qa Stone 20N.05W.23.3 35.949 107.335 07/26/54 .8 NA NA NA NA NA46 Qa Stone 16N.17W.25.1132 35.588 108.591 10/06/76 NA 2.1 NA NA NA NA47 Qa Stone 11N.10W.26.321B 35.154 107.863 06/12/58 .1 NA NA NA NA NA48 Qa Stone 12N.10W.30.242 35.240 107.933 06/08/56 26 NA NA NA NA NA49 Qa Stone 12N.10W.30.242 35.240 107.933 05/07/57 20 NA NA NA NA NA50 Qa Stone 12N.11W.11.334 35.284 107.968 06/27/56 16 NA NA NA NA NA51 Qa Stone 12N.11W.11.334 35.284 107.968 05/09/57 14 NA NA NA NA NA52 Qa Stone 12N.11W.14.311 35.269 107.968 06/07/57 6.6 NA NA NA NA NA53 Qa Stone 12N.11W.14.311 35.269 107.968 10/21/44 36 NA NA NA NA NA54 Qa Stone 12N.11W.14.311 35.269 107.968 07/12/46 30 NA NA NA NA NA55 Qa Stone 12N.11W.15.211 35.269 107.985 05/08/57 16 NA NA NA NA NA56 Qa Stone 15N.17W.13.3141 35.531 108.590 10/15/65 .2 NA NA NA NA NA57 Qa Stone 15N.17W.13.3141 35.531 108.590 10/05/66 .2 NA NA NA NA NA58 Qa Stone 15N.17W.14.2324A 35.531 108.608 10/01/64 9.2 NA NA NA NA NA59 Qa Stone 15N.17W.14.2324A 35.531 108.608 09/10/69 6.2 NA NA NA NA NA60 Qa Stone 16N.17W.25.1132 35.588 108.591 06/22/54 13 NA NA NA NA NA

84
Geologic Framew
ork, Regional Aquifer Properties (1940s–2009), and Spring, Creek, and Seep Properties (2009–10)Table 4-1. Historical groundwater contaminants-of-concern data in the study area, 1942–2009.—Continued
[NAD 83, North American Datum of 1983; NO3, nitrate or nitrate plus nitrite; N, nitrogen; mg/L, milligrams per liter; U, uranium; µg/L, micrograms per liter; Ra, radium; pCi/L, picocuries per liter; Qa, Quaternary alluvium; NA, not available; Kmf, Cretaceous Menefee Formation; Kpl, Cretaceous Point Lookout Formation; Kcc, Cretaceous Crevasse Canyon Formation; Kg, Cretaceous Gallup Formation; Km, Cretaceous Mancos Formation; Kd, Cretaceous Dakota Formation; Jm, Jurassic Morrison Formation; Je, Jurassic Entrada Complex (includes Entrada, Todilto, Summerville, and Bluff Formations); TRc, Triassic Chinle Group; Psa, Permian San Andres Formation (including Glorieta Formation)]
Line no.
Form-ation
Data source*
Data identifier**
Latitude (NAD 83)
Longitude (NAD 83)
DateNO3
(as N, mg/L)U
(µg/L)Ra 226 (pCi/L)
Ra 228 (pCi/L)
Ra 228 +226 (pCi/L)
Gross alpha (pCi/L)
61 Qa Stone 16N.17W.33.4223 35.574 108.645 09/24/53 0.3 NA NA NA NA NA62 Qa Stone 16N.17W.33.4223 35.574 108.645 03/26/74 13 NA NA NA NA NA63 Qa Stone 18N.09W.12.1 35.804 107.744 08/20/48 14 NA NA NA NA NA64 Qa Stone 18N.09W.12.1 35.804 107.744 07/27/64 1.1 NA NA NA NA NA65 Qa Stone 21N.10W.29.2 36.024 107.922 03/05/63 8.1 NA NA NA NA NA66 Qa Stone 21N.10W.29.2 36.024 107.922 04/18/64 7.5 NA NA NA NA NA67 Qa Stone 21N.10W.29.2 36.024 107.922 05/28/65 6.6 NA NA NA NA NA68 Qa Stone 21N.10W.29.2 36.024 107.922 01/23/66 8.1 NA NA NA NA NA69 Qa Stone 21N.10W.29.2 36.024 107.922 04/15/67 5.8 NA NA NA NA NA70 Qa Stone 21N.10W.29.2114 36.024 107.922 02/05/68 3.3 NA NA NA NA NA71 Qa Stone 21N.10W.29.2114 36.024 107.922 09/14/56 5.1 NA NA NA NA NA72 Kmf RHR 27 35.335 107.657 08/06/08 NA 4.9 NA .03 .03 5.573 Kmf RHR 27 35.335 107.657 11/13/08 NA 4.9 NA NA NA 5.874 Kmf RHR 27 35.335 107.657 02/16/09 NA 5.1 NA 1.30 1.30 5.375 Kmf RHR 27 35.335 107.657 05/19/09 NA 414 NA NA NA 11.176 Kmf RHR 87 35.330 107.643 08/12/08 NA 2.5 .12 .39 .51 8.077 Kmf RHR 87 35.330 107.643 11/12/08 .5 1.8 NA NA NA 8.478 Kmf RHR 87 35.330 107.643 02/16/09 .8 1.6 NA 2.10 2.10 2.079 Kmf RHR 87 35.330 107.643 05/19/09 NA 1.6 NA NA NA 7.380 Kmf RHR 62 35.334 107.643 08/20/08 NA 4.8 NA .77 .77 4.281 Kmf RHR 62 35.334 107.643 11/11/08 NA 2.9 NA NA NA 5.582 Kmf RHR 62 35.334 107.643 02/18/09 NA 1.6 .16 .85 1.01 3.183 Kmf RHR 62 35.334 107.643 05/26/09 NA 1.7 .14 .70 .84 3.884 Kmf RHR 100 35.320 107.693 08/21/08 NA .4 .13 .79 .92 1.985 Kmf RHR 100 35.320 107.693 11/08/08 .8 .9 .01 1.50 1.51 6.686 Kmf RHR 100 35.320 107.693 02/11/09 NA 5.3 .12 .60 .72 6.387 Kmf RHR 100 35.320 107.693 05/19/09 NA 2.4 .01 .58 .59 8.288 Kmf RHR 7 35.368 107.659 09/17/08 1.0 .7 NA .10 .10 6.989 Kmf RHR 7 35.368 107.659 11/16/08 .9 .4 .89 .14 1.03 48.990 Kmf RHR 7 35.368 107.659 02/16/09 1.0 NA 1.3 2.60 3.90 15.8

Appendix 4
85Table 4-1. Historical groundwater contaminants-of-concern data in the study area, 1942–2009.—Continued
[NAD 83, North American Datum of 1983; NO3, nitrate or nitrate plus nitrite; N, nitrogen; mg/L, milligrams per liter; U, uranium; µg/L, micrograms per liter; Ra, radium; pCi/L, picocuries per liter; Qa, Quaternary alluvium; NA, not available; Kmf, Cretaceous Menefee Formation; Kpl, Cretaceous Point Lookout Formation; Kcc, Cretaceous Crevasse Canyon Formation; Kg, Cretaceous Gallup Formation; Km, Cretaceous Mancos Formation; Kd, Cretaceous Dakota Formation; Jm, Jurassic Morrison Formation; Je, Jurassic Entrada Complex (includes Entrada, Todilto, Summerville, and Bluff Formations); TRc, Triassic Chinle Group; Psa, Permian San Andres Formation (including Glorieta Formation)]
Line no.
Form-ation
Data source*
Data identifier**
Latitude (NAD 83)
Longitude (NAD 83)
DateNO3
(as N, mg/L)U
(µg/L)Ra 226 (pCi/L)
Ra 228 (pCi/L)
Ra 228 +226 (pCi/L)
Gross alpha (pCi/L)
91 Kmf RHR 7 35.368 107.659 05/18/09 0.7 NA 0.37 0.45 0.82 35.992 Kmf Stone 13N.08W.24.334B 35.341 107.637 09/10/62 8.3 NA NA NA NA NA93 Kmf Stone 13N.08W.26.221 35.326 107.655 09/11/62 14 NA NA NA NA NA94 Kmf Stone 14N.05W.14.422 35.438 107.334 08/29/62 1.4 NA NA NA NA NA95 Kmf Stone 15N.06W.22.3123 35.514 107.460 10/22/62 1.0 NA NA NA NA NA96 Kmf Stone 15N.08W.21.4414 35.515 107.692 10/16/62 .7 NA NA NA NA NA97 Kmf Stone 15N.13W.08. 35.546 108.238 11/15/48 .4 NA NA NA NA NA98 Kmf Stone 15N.18W.19.244 35.515 108.786 06/10/55 .6 NA NA NA NA NA99 Kmf Stone 16N.05W.15.233 35.617 107.353 09/19/62 1.1 NA NA NA NA NA
100 Kmf Stone 16N.07W.32.4141 35.573 107.602 10/15/62 .6 NA NA NA NA NA101 Kmf Stone 16N.08W.33.1341 35.573 107.691 10/02/62 .4 NA NA NA NA NA102 Kmf Stone 16N.11W.33.411 35.573 108.008 11/24/64 9.2 NA NA NA NA NA103 Kmf Stone 17N.08W.19.434 35.689 107.726 02/20/67 1.9 NA NA NA NA NA104 Kmf Stone 17N.11W.24.413 35.689 107.959 02/20/67 1.1 NA NA NA NA NA105 Kmf Stone 17N.11W.30.431 35.674 108.048 07/18/73 .6 NA NA NA NA NA106 Kmf Stone 18N.03W.01.23 35.820 107.104 12/14/50 .4 NA NA NA NA NA107 Kmf Stone 18N.04W.16.4 35.791 107.264 01/20/57 2.1 NA NA NA NA NA108 Kmf Stone 18N.05W.01.134 35.820 107.318 02/21/67 1.5 NA NA NA NA NA109 Kmf Stone 18N.05W.14.221 35.791 107.335 03/19/70 1.9 NA NA NA NA NA110 Kmf Stone 18N.06W.04.3421 35.820 107.478 02/26/71 .6 NA NA NA NA NA111 Kmf Stone 18N.09W.12.121 35.804 107.744 07/27/64 1.1 NA NA NA NA NA112 Kmf Stone 19N.02W.21.34 35.863 107.051 05/20/65 .2 NA NA NA NA NA113 Kmf Stone 19N.03W.34.34 35.834 107.140 12/12/50 143 NA NA NA NA NA114 Kmf Stone 19N.05W.36.1132 35.834 107.318 04/16/56 2.6 NA NA NA NA NA115 Kmf Stone 19N.06W.10.2111 35.892 107.460 04/16/56 2.2 NA NA NA NA NA116 Kmf Stone 19N.08W.34.2131 35.833 107.673 08/20/48 1.3 NA NA NA NA NA117 Kmf Stone 19N.09W.07.3324 35.891 107.833 08/27/70 .1 NA NA NA NA NA118 Kmf Stone 19N.09W.11.4433 35.891 107.762 08/20/48 1.3 NA NA NA NA NA119 Kmf Stone 19N.09W.35.13 35.833 107.762 02/20/67 2.4 NA NA NA NA NA120 Kmf Stone 19N.12W.05. 35.907 108.137 11/02/71 1.9 NA NA NA NA NA

86
Geologic Framew
ork, Regional Aquifer Properties (1940s–2009), and Spring, Creek, and Seep Properties (2009–10)Table 4-1. Historical groundwater contaminants-of-concern data in the study area, 1942–2009.—Continued
[NAD 83, North American Datum of 1983; NO3, nitrate or nitrate plus nitrite; N, nitrogen; mg/L, milligrams per liter; U, uranium; µg/L, micrograms per liter; Ra, radium; pCi/L, picocuries per liter; Qa, Quaternary alluvium; NA, not available; Kmf, Cretaceous Menefee Formation; Kpl, Cretaceous Point Lookout Formation; Kcc, Cretaceous Crevasse Canyon Formation; Kg, Cretaceous Gallup Formation; Km, Cretaceous Mancos Formation; Kd, Cretaceous Dakota Formation; Jm, Jurassic Morrison Formation; Je, Jurassic Entrada Complex (includes Entrada, Todilto, Summerville, and Bluff Formations); TRc, Triassic Chinle Group; Psa, Permian San Andres Formation (including Glorieta Formation)]
Line no.
Form-ation
Data source*
Data identifier**
Latitude (NAD 83)
Longitude (NAD 83)
DateNO3
(as N, mg/L)U
(µg/L)Ra 226 (pCi/L)
Ra 228 (pCi/L)
Ra 228 +226 (pCi/L)
Gross alpha (pCi/L)
121 Kmf Stone 19N.12W.27.14 35.849 108.101 11/02/71 0.1 NA NA NA NA NA122 Kmf Stone 19N.13W.28.1 35.849 108.227 01/05/50 1.2 NA NA NA NA NA123 Kmf Stone 20N.07W.08.321 35.980 107.603 02/21/67 1.1 NA NA NA NA NA124 Kmf Stone 20N.09W.08.343 35.979 107.815 12/20/63 .1 NA NA NA NA NA125 Kmf Stone 20N.10W.01.22 35.994 107.850 01/24/64 .1 NA NA NA NA NA126 Kmf Stone 20N.12W.26.444 35.936 108.083 05/02/67 .9 NA NA NA NA NA127 Kmf Stone 20N.13W.07.31 35.980 108.263 09/13/49 1.3 NA NA NA NA NA128 Kmf Stone 21N.08W.25.3223 36.022 107.635 02/21/67 2.7 NA NA NA NA NA129 Kmf Stone 21N.12W.33.1222 36.010 108.120 04/02/74 4.3 NA NA NA NA NA130 Kmf Stone 16N.04W.18.444 35.617 107.300 07/27/78 NA 1.1 NA NA NA NA131 Kmf Stone 15N.06W.20.121 35.515 107.495 10/03/62 1.2 NA NA NA NA NA132 Kmf Stone 18N.08W.09.111 35.804 107.691 12/04/72 2.5 NA NA NA NA NA133 Kmf Stone 18N.08W.09.111 35.804 107.691 02/20/67 2.4 NA NA NA NA NA134 Kmf Stone 18N.09W.12.1131 35.804 107.744 08/01/58 1.4 NA NA NA NA NA135 Kmf Stone 18N.09W.12.1131 35.804 107.744 12/07/72 1.2 NA NA NA NA NA136 Kmf Stone 19N.13W.13.444 35.878 108.173 01/04/52 2.7 NA NA NA NA NA137 Kmf Stone 19N.13W.13.444 35.878 108.173 11/02/71 .3 NA NA NA NA NA138 Kpl RHR 90 35.332 107.651 08/11/08 NA NA .24 2.10 2.34 .3139 Kpl RHR 90 35.332 107.651 11/10/08 NA NA .01 .32 .33 6.0140 Kpl RHR 90 35.332 107.651 02/16/09 NA NA NA 1.10 1.10 .4141 Kpl RHR 90 35.332 107.651 05/19/09 NA NA .36 .76 1.12 1.3142 Kpl RHR 22 35.343 107.664 08/21/08 NA NA .31 1.10 1.41 .9143 Kpl RHR 22 35.343 107.664 11/13/08 NA NA .24 .57 .81 .8144 Kpl RHR 22 35.343 107.664 02/11/09 NA NA .28 .22 .50 1.5145 Kpl RHR 22 35.343 107.664 05/19/09 NA NA .21 .60 .81 .6146 Kpl RHR 102 35.311 107.687 09/24/08 NA NA .08 NA .08 1.5147 Kpl RHR 102 35.311 107.687 11/08/08 NA NA NA 1.60 1.60 .4148 Kpl RHR 102 35.311 107.687 02/11/09 NA NA .06 1.30 1.36 .5149 Kpl Stone 16N.06W.29.231 35.588 107.495 10/03/62 .9 NA NA NA NA NA150 Kpl Stone 16N.07W.13.2244 35.617 107.531 10/02/62 1.5 NA NA NA NA NA

Appendix 4
87Table 4-1. Historical groundwater contaminants-of-concern data in the study area, 1942–2009.—Continued
[NAD 83, North American Datum of 1983; NO3, nitrate or nitrate plus nitrite; N, nitrogen; mg/L, milligrams per liter; U, uranium; µg/L, micrograms per liter; Ra, radium; pCi/L, picocuries per liter; Qa, Quaternary alluvium; NA, not available; Kmf, Cretaceous Menefee Formation; Kpl, Cretaceous Point Lookout Formation; Kcc, Cretaceous Crevasse Canyon Formation; Kg, Cretaceous Gallup Formation; Km, Cretaceous Mancos Formation; Kd, Cretaceous Dakota Formation; Jm, Jurassic Morrison Formation; Je, Jurassic Entrada Complex (includes Entrada, Todilto, Summerville, and Bluff Formations); TRc, Triassic Chinle Group; Psa, Permian San Andres Formation (including Glorieta Formation)]
Line no.
Form-ation
Data source*
Data identifier**
Latitude (NAD 83)
Longitude (NAD 83)
DateNO3
(as N, mg/L)U
(µg/L)Ra 226 (pCi/L)
Ra 228 (pCi/L)
Ra 228 +226 (pCi/L)
Gross alpha (pCi/L)
151 Kpl Stone 16N.08W.14.1114 35.617 107.655 10/02/62 0.5 NA NA NA NA NA152 Kpl Stone 16N.08W.20.1312 35.602 107.708 10/02/62 .8 NA NA NA NA NA153 Kpl Stone 16N.09W.22.4444 35.602 107.778 09/20/62 .8 NA NA NA NA NA154 Kpl Stone 16N.10W.22.212 35.602 107.883 09/19/62 .6 NA NA NA NA NA155 Kpl Stone 18N.11W.29.3111 35.762 108.030 04/06/53 .2 NA NA NA NA NA156 Kpl Stone 20N.02W.17.132 35.964 107.069 04/30/58 .4 NA NA NA NA NA157 Kpl Stone 20N.04W.34.4421 35.920 107.246 11/01/63 4.3 NA NA NA NA NA158 Kpl Stone 21N.01W.28.213 36.021 106.945 10/19/57 .2 NA NA NA NA NA159 Kpl Stone 21N.01W.29.24 36.017 106.972 10/24/55 .1 NA NA NA NA NA160 Kpl Stone 15N.09W.13.144 35.529 107.745 08/01/51 .1 NA NA NA NA NA161 Kpl Stone 15N.09W.13.144 35.529 107.745 10/04/62 .1 NA NA NA NA NA162 Kpl Stone 20N.02W.21.22 35.949 107.051 06/18/59 .4 NA NA NA NA NA163 Kcc Stone 14N.08W.04.3343 35.472 107.690 10/16/62 14 NA NA NA NA NA164 Kcc Stone 15N.09W.09.2442 35.544 107.796 09/12/62 2.7 NA NA NA NA NA165 Kcc Stone 16N.12W.16.23 35.617 108.114 05/19/55 .2 NA NA NA NA NA166 Kcc Stone 17N.11W.35.223 35.660 107.977 06/18/59 .2 NA NA NA NA NA167 Kcc Stone 17N.12W.03.41 35.733 108.101 08/03/49 1.8 NA NA NA NA NA168 Kcc Stone 17N.13W.11.33 35.718 108.190 12/03/51 1.4 NA NA NA NA NA169 Kcc Stone 18N.13W.23.3212 35.776 108.190 11/02/71 .3 NA NA NA NA NA170 Kcc Stone 18N.13W.01.4 35.820 108.173 08/03/49 2.8 NA NA NA NA NA171 Kcc Stone 18N.13W.01.4 35.820 108.173 11/02/71 .1 NA NA NA NA NA172 Kcc Stone 15N.06W.20.331 35.515 107.495 10/16/62 .2 NA NA NA NA NA173 Kcc Stone 15N.10W.06.2421 35.558 107.936 02/05/54 .1 NA NA NA NA NA174 Kcc Stone 15N.10W.06.2421 35.558 107.936 02/17/54 .1 NA NA NA NA NA175 Kcc Stone 15N.10W.06.2421 35.558 107.936 08/01/61 .2 NA NA NA NA NA176 Kcc Stone 15N.10W.13.1314 35.529 107.848 01/15/70 .6 NA NA NA NA NA177 Kcc Stone 15N.10W.13.1314 35.529 107.848 07/18/73 3.1 NA NA NA NA NA178 Kcc Stone 16N.13W.11.3413 35.632 108.185 03/18/54 .2 NA NA NA NA NA179 Kcc Stone 16N.13W.11.3413 35.632 108.185 07/11/61 1.1 NA NA NA NA NA180 Kg RHR 32 35.338 107.662 08/21/08 NA NA .13 1.20 1.33 2.2

88
Geologic Framew
ork, Regional Aquifer Properties (1940s–2009), and Spring, Creek, and Seep Properties (2009–10)Table 4-1. Historical groundwater contaminants-of-concern data in the study area, 1942–2009.—Continued
[NAD 83, North American Datum of 1983; NO3, nitrate or nitrate plus nitrite; N, nitrogen; mg/L, milligrams per liter; U, uranium; µg/L, micrograms per liter; Ra, radium; pCi/L, picocuries per liter; Qa, Quaternary alluvium; NA, not available; Kmf, Cretaceous Menefee Formation; Kpl, Cretaceous Point Lookout Formation; Kcc, Cretaceous Crevasse Canyon Formation; Kg, Cretaceous Gallup Formation; Km, Cretaceous Mancos Formation; Kd, Cretaceous Dakota Formation; Jm, Jurassic Morrison Formation; Je, Jurassic Entrada Complex (includes Entrada, Todilto, Summerville, and Bluff Formations); TRc, Triassic Chinle Group; Psa, Permian San Andres Formation (including Glorieta Formation)]
Line no.
Form-ation
Data source*
Data identifier**
Latitude (NAD 83)
Longitude (NAD 83)
DateNO3
(as N, mg/L)U
(µg/L)Ra 226 (pCi/L)
Ra 228 (pCi/L)
Ra 228 +226 (pCi/L)
Gross alpha (pCi/L)
181 Kg RHR 16 35.359 107.703 08/25/08 0.6 NA 0.85 1.10 1.95 3.9182 Kg RHR 16 35.359 107.703 11/11/08 NA NA .32 NA .32 5.7183 Kg RHR 16 35.359 107.703 02/12/09 1.1 NA .71 .13 .84 6.0184 Kg RHR 16 35.359 107.703 05/19/09 .6 NA .48 .53 1.01 8.8185 Kg Stone 14N.08W.15.244 35.442 107.672 10/01/62 5.8 NA NA NA NA NA186 Kg Stone 15N.10W.04.1311 35.558 107.901 10/22/64 .1 NA NA NA NA NA187 Kg Stone 15N.18W.08.320 35.545 108.769 02/24/56 .2 NA NA NA NA NA188 Kg Stone 15N.18W.13.324 35.531 108.698 12/10/53 11 NA NA NA NA NA189 Kg Stone 15N.18W.14.2223 35.531 108.716 11/28/55 .8 NA NA NA NA NA190 Kg Stone 15N.18W.14.2244 35.531 108.716 02/06/56 1.9 NA NA NA NA NA191 Kg Stone 15N.18W.16.341 35.530 108.751 12/13/55 .1 NA NA NA NA NA192 Kg Stone 15N.18W.18.3444 35.530 108.786 06/22/55 .6 NA NA NA NA NA193 Kg Stone 15N.18W.24.23 35.516 108.698 01/02/56 40 NA NA NA NA NA194 Kg Stone 15N.18W.30.3232 35.501 108.786 06/10/55 .1 NA NA NA NA NA195 Kg Stone 16N.05W.19.414 35.602 107.407 09/19/62 .1 NA NA NA NA NA196 Kg Stone 16N.07W.26.2214 35.588 107.549 10/02/62 1.8 NA NA NA NA NA197 Kg Stone 16N.18W.07.423 35.630 108.785 01/31/68 .1 NA NA NA NA NA198 Kg Stone 16N.18W.17.122A 35.616 108.767 01/12/69 .2 NA NA NA NA NA199 Kg Stone 16N.18W.32.44 35.574 108.768 12/06/55 .1 NA NA NA NA NA200 Kg Stone 17N.12W.33.244 35.660 108.119 03/10/70 .3 NA NA NA NA NA201 Kg Stone 15N.10W.06.2421 35.558 107.936 07/18/73 .1 NA NA NA NA NA202 Kg Stone 15N.10W.13.1314 35.529 107.848 09/18/62 .4 NA NA NA NA NA203 Kg Stone 15N.18W.13.1134A 35.531 108.698 12/06/48 .4 NA NA NA NA NA204 Kg Stone 15N.18W.13.1134A 35.531 108.698 11/28/55 .4 NA NA NA NA NA205 Kg Stone 15N.18W.14.144 35.531 108.716 02/06/56 1.9 NA NA NA NA NA206 Kg Stone 15N.18W.20.211 35.515 108.769 09/15/57 .1 NA NA NA NA NA207 Kg Stone 15N.18W.20.211 35.515 108.769 09/24/57 .1 NA NA NA NA NA208 Kg Stone 15N.18W.20.2211 35.515 108.769 05/19/57 .1 NA NA NA NA NA209 Kg Stone 16N.11W.17.4322 35.616 108.026 02/12/73 .6 NA NA NA NA NA210 Kg Stone 16N.18W.17.122 35.616 108.767 03/04/68 .3 NA NA NA NA NA

Appendix 4
89Table 4-1. Historical groundwater contaminants-of-concern data in the study area, 1942–2009.—Continued
[NAD 83, North American Datum of 1983; NO3, nitrate or nitrate plus nitrite; N, nitrogen; mg/L, milligrams per liter; U, uranium; µg/L, micrograms per liter; Ra, radium; pCi/L, picocuries per liter; Qa, Quaternary alluvium; NA, not available; Kmf, Cretaceous Menefee Formation; Kpl, Cretaceous Point Lookout Formation; Kcc, Cretaceous Crevasse Canyon Formation; Kg, Cretaceous Gallup Formation; Km, Cretaceous Mancos Formation; Kd, Cretaceous Dakota Formation; Jm, Jurassic Morrison Formation; Je, Jurassic Entrada Complex (includes Entrada, Todilto, Summerville, and Bluff Formations); TRc, Triassic Chinle Group; Psa, Permian San Andres Formation (including Glorieta Formation)]
Line no.
Form-ation
Data source*
Data identifier**
Latitude (NAD 83)
Longitude (NAD 83)
DateNO3
(as N, mg/L)U
(µg/L)Ra 226 (pCi/L)
Ra 228 (pCi/L)
Ra 228 +226 (pCi/L)
Gross alpha (pCi/L)
211 Kg Stone 16N.18W.17.122 35.616 108.767 03/09/68 0.8 NA NA NA NA NA212 Kg Stone 16N.18W.17.122 35.616 108.767 03/09/68 .2 NA NA NA NA NA213 Kg Stone 16N.18W.17.122 35.616 108.767 03/10/68 .3 NA NA NA NA NA214 Kg Stone 16N.18W.17.122 35.616 108.767 03/12/68 .4 NA NA NA NA NA215 Kg Stone 16N.18W.17.122 35.616 108.767 03/13/68 .6 NA NA NA NA NA216 Kg Stone 16N.18W.17.122 35.616 108.767 03/13/68 1.4 NA NA NA NA NA217 Kg Stone 16N.18W.32.211 35.574 108.768 01/24/69 .2 NA NA NA NA NA218 Kg Stone 17N.12W.30.4111 35.675 108.154 08/02/51 .2 NA NA NA NA NA219 Km Stone 16N.15W.20.1314 35.603 108.450 11/18/71 .1 NA NA NA NA NA220 Km Stone 16N.15W.20.32 35.603 108.450 08/31/49 24 NA NA NA NA NA221 Kd Stone 15N.12W.19.22 35.516 108.149 05/21/56 .4 NA NA NA NA NA222 Kd Stone 15N.12W.19.223 35.516 108.149 09/02/49 2.3 NA NA NA NA NA223 Kd Stone 15N.13W.07.33 35.546 108.255 11/19/48 .3 NA NA NA NA NA224 Kd Stone 16N.14W.21.3334 35.603 108.326 03/20/74 4.9 NA NA NA NA NA225 Kd Stone 16N.15W.11.3323 35.632 108.397 02/13/74 .2 NA NA NA NA NA226 Kd Stone 16N.16W.01.2344 35.646 108.485 06/09/55 1.5 NA NA NA NA NA227 Kd Stone 16N.16W.15.4322 35.617 108.521 02/07/74 52 NA NA NA NA NA228 Kd Stone 16N.17W.15.2324 35.617 108.626 03/26/74 5.6 NA NA NA NA NA229 Kd Stone 14N.09W.17.300 35.442 107.814 08/08/62 .2 NA NA NA NA NA230 Kd Stone 14N.09W.17.300 35.442 107.814 08/08/62 .2 NA NA NA NA NA231 Kd Stone 14N.09W.17.300 35.442 107.814 08/08/62 .1 NA NA NA NA NA232 Kd Stone 14N.09W.18.243 35.442 107.831 04/30/63 1.0 NA NA NA NA NA233 Kd Stone 14N.09W.18.243 35.442 107.831 08/30/63 1.0 NA NA NA NA NA234 Kd Stone 14N.09W.28.233 35.414 107.795 10/10/57 .3 NA NA NA NA NA235 Kd Stone 14N.09W.28.233 35.414 107.795 10/10/57 .5 NA NA NA NA NA236 Kd Stone 14N.09W.36.313 35.398 107.742 04/24/63 .3 NA NA NA NA NA237 Kd Stone 14N.09W.36.313 35.398 107.742 05/06/63 .7 NA NA NA NA NA238 Kd Stone 15N.06W.20.121 35.515 107.495 02/10/54 .5 NA NA NA NA NA239 Kd Stone 15N.06W.20.121 35.515 107.495 05/15/54 .2 NA NA NA NA NA240 Kd Stone 15N.06W.20.121 35.515 107.495 10/30/68 .5 NA NA NA NA NA

90
Geologic Framew
ork, Regional Aquifer Properties (1940s–2009), and Spring, Creek, and Seep Properties (2009–10)Table 4-1. Historical groundwater contaminants-of-concern data in the study area, 1942–2009.—Continued
[NAD 83, North American Datum of 1983; NO3, nitrate or nitrate plus nitrite; N, nitrogen; mg/L, milligrams per liter; U, uranium; µg/L, micrograms per liter; Ra, radium; pCi/L, picocuries per liter; Qa, Quaternary alluvium; NA, not available; Kmf, Cretaceous Menefee Formation; Kpl, Cretaceous Point Lookout Formation; Kcc, Cretaceous Crevasse Canyon Formation; Kg, Cretaceous Gallup Formation; Km, Cretaceous Mancos Formation; Kd, Cretaceous Dakota Formation; Jm, Jurassic Morrison Formation; Je, Jurassic Entrada Complex (includes Entrada, Todilto, Summerville, and Bluff Formations); TRc, Triassic Chinle Group; Psa, Permian San Andres Formation (including Glorieta Formation)]
Line no.
Form-ation
Data source*
Data identifier**
Latitude (NAD 83)
Longitude (NAD 83)
DateNO3
(as N, mg/L)U
(µg/L)Ra 226 (pCi/L)
Ra 228 (pCi/L)
Ra 228 +226 (pCi/L)
Gross alpha (pCi/L)
241 Kd Stone 15N.11W.17.1111 35.529 108.026 10/23/52 0.2 NA NA NA NA NA242 Kd Stone 15N.11W.17.1111 35.529 108.026 07/31/61 .4 NA NA NA NA NA243 Kd Stone 15N.12W.17.123 35.531 108.131 04/08/53 .2 NA NA NA NA NA244 Kd Stone 15N.12W.17.123A 35.531 108.131 05/21/56 .4 NA NA NA NA NA245 Kd Stone 16N.14W.15.1342 35.617 108.309 11/02/51 .6 NA NA NA NA NA246 Kd Stone 16N.14W.15.1342 35.617 108.309 03/20/74 4.3 NA NA NA NA NA247 Kd Stone 16N.15W.17.1431 35.618 108.450 02/23/70 .6 NA NA NA NA NA248 Kd Stone 16N.15W.17.1431 35.618 108.450 07/29/70 .6 NA NA NA NA NA249 Kd Stone 16N.15W.17.1431 35.618 108.450 11/23/70 .6 NA NA NA NA NA250 Kd Stone 16N.15W.17.1431 35.618 108.450 05/01/72 .6 NA NA NA NA NA251 Kd Stone 16N.15W.17.1431 35.618 108.450 02/13/74 .2 NA NA NA NA NA252 Kd Stone 17N.12W.30.142 35.675 108.154 12/12/48 .5 NA NA NA NA NA253 Kd Stone 17N.12W.30.142 35.675 108.154 10/13/64 .1 NA NA NA NA NA254 Kd Stone 14N.09W.17.300 35.442 107.814 08/30/63 NA 3.4 NA NA NA NA255 Jm Stone 14N.09W.34.422 35.399 107.777 04/24/63 .2 NA NA NA NA NA256 Jm Stone 14N.10W.11.434A 35.457 107.867 10/18/60 1.1 NA NA NA NA NA257 Jm Stone 15N.11W.29.1132 35.500 108.026 09/30/76 .1 NA NA NA NA NA258 Jm Stone 16W.16W.30.3431 35.588 108.574 05/02/72 20 NA NA NA NA NA259 Jm Stone 16N.14W.33.2223 35.574 108.326 02/22/52 .5 NA NA NA NA NA260 Jm Stone 16N.14W.33.2223 35.574 108.326 05/14/53 .1 NA NA NA NA NA261 Jm Stone 16N.14W.33.2223 35.574 108.326 03/06/73 .6 NA NA NA NA NA262 Jm RHR 116 35.345 107.786 08/19/08 19.7 10.9 .35 .77 1.12 22.6263 Jm RHR 116 35.345 107.786 11/13/08 21.3 10.6 .37 .50 .87 17.9264 Jm RHR 116 35.345 107.786 02/10/09 20.1 12.1 .27 .58 .85 23.7265 Jm RHR 116 35.345 107.786 05/21/09 18.2 10.3 .47 1.30 1.77 20.6266 Jm RHR 114 35.346 107.785 09/18/08 24.3 19.9 .96 .79 1.75 50.4267 Jm RHR 114 35.346 107.785 02/18/09 19.2 21.7 .45 .90 1.35 50.3268 Jm RHR 114 35.346 107.785 05/26/09 23.3 20.8 .47 .50 .97 36.0269 Jm RHR 113 35.347 107.783 09/22/08 24.6 15.8 .26 NA .26 25.4270 Jm RHR 113 35.347 107.783 11/10/08 19.8 15.5 .27 .35 .62 28.2

Appendix 4
91Table 4-1. Historical groundwater contaminants-of-concern data in the study area, 1942–2009.—Continued
[NAD 83, North American Datum of 1983; NO3, nitrate or nitrate plus nitrite; N, nitrogen; mg/L, milligrams per liter; U, uranium; µg/L, micrograms per liter; Ra, radium; pCi/L, picocuries per liter; Qa, Quaternary alluvium; NA, not available; Kmf, Cretaceous Menefee Formation; Kpl, Cretaceous Point Lookout Formation; Kcc, Cretaceous Crevasse Canyon Formation; Kg, Cretaceous Gallup Formation; Km, Cretaceous Mancos Formation; Kd, Cretaceous Dakota Formation; Jm, Jurassic Morrison Formation; Je, Jurassic Entrada Complex (includes Entrada, Todilto, Summerville, and Bluff Formations); TRc, Triassic Chinle Group; Psa, Permian San Andres Formation (including Glorieta Formation)]
Line no.
Form-ation
Data source*
Data identifier**
Latitude (NAD 83)
Longitude (NAD 83)
DateNO3
(as N, mg/L)U
(µg/L)Ra 226 (pCi/L)
Ra 228 (pCi/L)
Ra 228 +226 (pCi/L)
Gross alpha (pCi/L)
271 Jm RHR 113 35.347 107.783 02/12/09 22.3 16.9 0.31 0.32 0.63 21.0272 Jm RHR 113 35.347 107.783 05/26/09 23.9 16.1 NA .53 .53 25.4273 Jm Stone 13N.09W.15.343 35.355 107.778 02/13/58 7.7 NA NA NA NA NA274 Jm Stone 14N.09W.18.400 35.442 107.831 08/30/63 .2 NA NA NA NA NA275 Jm Stone 14N.09W.29.312 35.413 107.813 08/13/59 15 NA NA NA NA NA276 Jm Stone 14N.09W.30.2213 35.414 107.831 05/03/63 .2 NA NA NA NA NA277 Jm Stone 14N.10W.22.214 35.428 107.884 03/19/57 4.6 NA NA NA NA NA278 Jm Stone 14N.11W.03.3334 35.471 107.991 03/13/57 4.0 NA NA NA NA NA279 Jm Stone 16N.11W.33.332 35.573 108.008 09/08/72 .1 NA NA NA NA NA280 Jm Stone 16N.14W.33.22 35.574 108.326 03/06/73 .6 NA NA NA NA NA281 Jm Stone 16N.16W.17.2114 35.617 108.556 02/07/74 2.4 NA NA NA NA NA282 Jm Stone 16N.17W.21.3442 35.603 108.644 03/26/74 3.7 NA NA NA NA NA283 Jm Stone 14N.09W.18.400 35.442 107.831 08/30/63 NA 55 NA NA NA NA284 Jm Stone 14N.09W.29.312 35.413 107.813 08/13/59 NA 12 NA NA NA NA285 Jm Stone 14N.09W.18.243 35.442 107.831 10/17/62 1.2 NA NA NA NA NA286 Jm Stone 14N.10W.22.2 35.428 107.884 08/08/62 .2 NA NA NA NA NA287 Jm Stone 14N.10W.22.2 35.428 107.884 08/08/62 4.9 NA NA NA NA NA288 Jm Stone 14N.10W.22.2 35.428 107.884 08/08/62 3.9 NA NA NA NA NA289 Jm Stone 14N.10W.24.400 35.428 107.849 08/18/59 .1 NA NA NA NA NA290 Jm Stone 15N.12W.17.123A 35.531 108.131 05/04/63 .7 NA NA NA NA NA291 Je Stone 13N.09W.29.143 35.327 107.813 02/28/58 25 NA NA NA NA NA292 Je Stone 13N.10W.08.211 35.370 107.920 02/02/67 17 NA NA NA NA NA293 Je Stone 14N.11W.19.124 35.428 108.043 08/04/61 4.8 NA NA NA NA NA294 Je Stone 14N.12W.09.221 35.458 108.114 09/05/62 5.7 NA NA NA NA NA295 Je Stone 14N.12W.14.143 35.443 108.078 09/05/62 20 NA NA NA NA NA296 Je Stone 14N.12W.17.3333 35.444 108.131 11/15/48 8.6 NA NA NA NA NA297 Je Stone 15N.13W.12.144 35.546 108.167 07/11/61 1.0 NA NA NA NA NA298 Je Stone 15N.13W.22.1111 35.517 108.202 03/20/74 5.0 NA NA NA NA NA299 Je Stone 15N.14W.13.413 35.531 108.273 06/10/70 5.0 NA NA NA NA NA300 Je Stone 16N.14W.33.234 35.574 108.326 11/05/73 1.2 NA NA NA NA NA

92
Geologic Framew
ork, Regional Aquifer Properties (1940s–2009), and Spring, Creek, and Seep Properties (2009–10)Table 4-1. Historical groundwater contaminants-of-concern data in the study area, 1942–2009.—Continued
[NAD 83, North American Datum of 1983; NO3, nitrate or nitrate plus nitrite; N, nitrogen; mg/L, milligrams per liter; U, uranium; µg/L, micrograms per liter; Ra, radium; pCi/L, picocuries per liter; Qa, Quaternary alluvium; NA, not available; Kmf, Cretaceous Menefee Formation; Kpl, Cretaceous Point Lookout Formation; Kcc, Cretaceous Crevasse Canyon Formation; Kg, Cretaceous Gallup Formation; Km, Cretaceous Mancos Formation; Kd, Cretaceous Dakota Formation; Jm, Jurassic Morrison Formation; Je, Jurassic Entrada Complex (includes Entrada, Todilto, Summerville, and Bluff Formations); TRc, Triassic Chinle Group; Psa, Permian San Andres Formation (including Glorieta Formation)]
Line no.
Form-ation
Data source*
Data identifier**
Latitude (NAD 83)
Longitude (NAD 83)
DateNO3
(as N, mg/L)U
(µg/L)Ra 226 (pCi/L)
Ra 228 (pCi/L)
Ra 228 +226 (pCi/L)
Gross alpha (pCi/L)
301 Je Stone 16W.16W.25.2344 35.588 108.486 02/13/74 5.5 NA NA NA NA NA302 Je Stone 13N.10W.18.4113 35.356 107.938 11/15/63 .7 NA NA NA NA NA303 Je Stone 13N.10W.18.4113 35.356 107.938 04/26/72 13 NA NA NA NA NA304 Je Stone 15N.13W.22.1111 35.517 108.202 05/08/64 1.2 NA NA NA NA NA305 Je Stone 15N.13W.22.1111 35.517 108.202 09/24/70 .6 NA NA NA NA NA306 Je Stone 15N.17W.14.4224 35.531 108.608 10/15/65 .3 NA NA NA NA NA307 Je Stone 15N.17W.14.4224 35.531 108.608 09/30/66 .6 NA NA NA NA NA308 TRc Stone 12N.10W.23.233A 35.254 107.862 07/12/46 4.4 NA NA NA NA NA309 TRc Stone 12N.10W.33.444 35.225 107.898 06/28/56 2.4 NA NA NA NA NA310 TRc Stone 12N.10W.34.412 35.225 107.880 08/28/56 .6 NA NA NA NA NA311 TRc Stone 13N.10W.20.114 35.341 107.920 07/23/76 .3 NA NA NA NA NA312 TRc Stone 13N.11W.07.433 35.370 108.043 06/24/48 5.6 NA NA NA NA NA313 TRc Stone 13N.11W.08.2211 35.370 108.026 06/23/48 5.5 NA NA NA NA NA314 TRc Stone 13N.12W.10.2444 35.370 108.096 08/23/67 77 NA NA NA NA NA315 TRc Stone 13N.12W.11.32 35.370 108.079 06/23/48 .5 NA NA NA NA NA316 TRc Stone 14N.12W.20.111 35.429 108.131 05/11/50 1.1 NA NA NA NA NA317 TRc Stone 14N.13W.20.4323 35.430 108.238 07/12/61 1.1 NA NA NA NA NA318 TRc Stone 14N.13W.33.141 35.401 108.221 12/06/48 10 NA NA NA NA NA319 TRc Stone 14N.13W.33.314 35.401 108.221 12/06/48 9.3 NA NA NA NA NA320 TRc Stone 14N.15W.04.1134 35.473 108.432 05/14/69 .6 NA NA NA NA NA321 TRc Stone 15N.15W.31.1242 35.488 108.468 06/04/68 .5 NA NA NA NA NA322 TRc Stone 15N.16W.27.2312 35.502 108.521 04/03/52 .5 NA NA NA NA NA323 TRc Stone 12N.10W.34.2141 35.225 107.880 05/07/57 .2 NA NA NA NA NA324 TRc Stone 12N.10W.34.2141 35.225 107.880 07/17/56 14 NA NA NA NA NA325 TRc Stone 12N.10W.34.2141 35.225 107.880 04/20/65 2.0 NA NA NA NA NA326 TRc Stone 13N.10W.18.212 35.356 107.938 06/18/76 .1 NA NA NA NA NA327 TRc Stone 14N.13W.25.1334 35.415 108.167 03/01/66 1.9 NA NA NA NA NA328 TRc Stone 14N.13W.25.1334 35.415 108.167 09/03/71 .1 NA NA NA NA NA329 TRc Stone 14N.13W.28.1234 35.415 108.221 12/03/48 .9 NA NA NA NA NA330 TRc Stone 14N.13W.33.124 35.401 108.221 08/18/48 4.5 NA NA NA NA NA

Appendix 4
93Table 4-1. Historical groundwater contaminants-of-concern data in the study area, 1942–2009.—Continued
[NAD 83, North American Datum of 1983; NO3, nitrate or nitrate plus nitrite; N, nitrogen; mg/L, milligrams per liter; U, uranium; µg/L, micrograms per liter; Ra, radium; pCi/L, picocuries per liter; Qa, Quaternary alluvium; NA, not available; Kmf, Cretaceous Menefee Formation; Kpl, Cretaceous Point Lookout Formation; Kcc, Cretaceous Crevasse Canyon Formation; Kg, Cretaceous Gallup Formation; Km, Cretaceous Mancos Formation; Kd, Cretaceous Dakota Formation; Jm, Jurassic Morrison Formation; Je, Jurassic Entrada Complex (includes Entrada, Todilto, Summerville, and Bluff Formations); TRc, Triassic Chinle Group; Psa, Permian San Andres Formation (including Glorieta Formation)]
Line no.
Form-ation
Data source*
Data identifier**
Latitude (NAD 83)
Longitude (NAD 83)
DateNO3
(as N, mg/L)U
(µg/L)Ra 226 (pCi/L)
Ra 228 (pCi/L)
Ra 228 +226 (pCi/L)
Gross alpha (pCi/L)
331 TRc Stone 14N.13W.33.124 35.401 108.221 04/03/53 1.4 NA NA NA NA NA332 TRc Stone 14N.13W.33.124 35.401 108.221 09/30/64 .1 NA NA NA NA NA333 TRc Stone 15N.15W.20.313 35.517 108.449 03/01/58 .6 NA NA NA NA NA334 TRc Stone 15N.15W.20.313 35.517 108.449 06/15/66 .5 NA NA NA NA NA335 TRc Stone 15N.15W.20.313 35.517 108.449 10/24/67 .6 NA NA NA NA NA336 Psa Stone 11N.10W.04.333 35.211 107.898 08/23/66 33 NA NA NA NA NA337 Psa Stone 12N.10W.07.1433 35.284 107.933 06/27/56 .3 NA NA NA NA NA338 Psa Stone 12N.10W.26.242 35.240 107.862 05/22/58 1.2 NA NA NA NA NA339 Psa Stone 12N.10W.26.3222 35.240 107.862 10/15/56 3.2 NA NA NA NA NA340 Psa Stone 12N.10W.27.4311 35.240 107.880 07/25/56 6.9 NA NA NA NA NA341 Psa Stone 12N.10W.30.421 35.240 107.933 05/07/57 26 NA NA NA NA NA342 Psa Stone 12N.10W.30.433 35.240 107.933 10/21/44 32 NA NA NA NA NA343 Psa Stone 12N.11W.24.411 35.255 107.950 04/23/52 15 NA NA NA NA NA344 Psa Stone 13N.12W.34.332 35.313 108.097 09/04/62 .1 NA NA NA NA NA345 Psa Stone 14N.10W.22.414 35.428 107.884 11/21/56 .6 NA NA NA NA NA346 Psa Stone 14N.15W.01.3134 35.473 108.379 01/20/50 .5 NA NA NA NA NA347 Psa Stone 14N.15W.14.3423 35.444 108.397 01/20/50 .3 NA NA NA NA NA348 Psa Stone 14N.15W.28.1434 35.415 108.432 01/20/50 .5 NA NA NA NA NA349 Psa Stone 15N.17W.13.1124 35.531 108.590 05/09/50 .1 NA NA NA NA NA350 Psa Stone 15N.17W.13.222 35.531 108.590 10/01/64 .1 NA NA NA NA NA351 Psa Stone 15N.17W.16.21 35.530 108.644 08/06/53 .2 NA NA NA NA NA352 Psa Stone 15N.17W.16.2222A 35.530 108.644 08/06/53 .4 NA NA NA NA NA353 Psa Stone 15N.17W.16.3131 35.530 108.644 06/12/52 .2 NA NA NA NA NA354 Psa Stone 15N.17W.16.3131A 35.530 108.644 12/31/57 .2 NA NA NA NA NA355 Psa Stone 11N.10W.04.311 35.211 107.898 07/17/56 14 NA NA NA NA NA356 Psa Stone 11N.10W.04.311 35.211 107.898 06/07/57 17 NA NA NA NA NA357 Psa Stone 11N.10W.04.311 35.211 107.898 07/29/68 18 NA NA NA NA NA358 Psa Stone 11N.10W.04.311 35.211 107.898 07/24/56 19 NA NA NA NA NA359 Psa Stone 11N.10W.16.121 35.182 107.898 07/12/46 27 NA NA NA NA NA360 Psa Stone 11N.10W.16.121A 35.182 107.898 07/17/56 13 NA NA NA NA NA

94
Geologic Framew
ork, Regional Aquifer Properties (1940s–2009), and Spring, Creek, and Seep Properties (2009–10)Table 4-1. Historical groundwater contaminants-of-concern data in the study area, 1942–2009.—Continued
[NAD 83, North American Datum of 1983; NO3, nitrate or nitrate plus nitrite; N, nitrogen; mg/L, milligrams per liter; U, uranium; µg/L, micrograms per liter; Ra, radium; pCi/L, picocuries per liter; Qa, Quaternary alluvium; NA, not available; Kmf, Cretaceous Menefee Formation; Kpl, Cretaceous Point Lookout Formation; Kcc, Cretaceous Crevasse Canyon Formation; Kg, Cretaceous Gallup Formation; Km, Cretaceous Mancos Formation; Kd, Cretaceous Dakota Formation; Jm, Jurassic Morrison Formation; Je, Jurassic Entrada Complex (includes Entrada, Todilto, Summerville, and Bluff Formations); TRc, Triassic Chinle Group; Psa, Permian San Andres Formation (including Glorieta Formation)]
Line no.
Form-ation
Data source*
Data identifier**
Latitude (NAD 83)
Longitude (NAD 83)
DateNO3
(as N, mg/L)U
(µg/L)Ra 226 (pCi/L)
Ra 228 (pCi/L)
Ra 228 +226 (pCi/L)
Gross alpha (pCi/L)
361 Psa Stone 11N.10W.16.121A 35.182 107.898 08/15/62 15 NA NA NA NA NA362 Psa Stone 11N.10W.16.121A 35.182 107.898 08/19/63 14 NA NA NA NA NA363 Psa Stone 11N.10W.16.121A 35.182 107.898 08/22/66 14 NA NA NA NA NA364 Psa Stone 11N.10W.16.121A 35.182 107.898 07/29/68 16 NA NA NA NA NA365 Psa Stone 11N.10W.26.321C 35.154 107.863 12/15/58 1.0 NA NA NA NA NA366 Psa Stone 12N.10W.23.233 35.254 107.862 07/12/46 .6 NA NA NA NA NA367 Psa Stone 12N.10W.27.333 35.240 107.880 10/06/54 11 NA NA NA NA NA368 Psa Stone 12N.10W.27.333 35.240 107.880 07/17/56 9.5 NA NA NA NA NA369 Psa Stone 12N.10W.27.333 35.240 107.880 05/07/57 9.1 NA NA NA NA NA370 Psa Stone 12N.10W.27.333 35.240 107.880 04/20/65 13 NA NA NA NA NA371 Psa Stone 12N.10W.29.434A 35.240 107.916 06/28/56 31 NA NA NA NA NA372 Psa Stone 12N.10W.30.1121 35.240 107.933 07/18/56 32 NA NA NA NA NA373 Psa Stone 12N.10W.30.1121 35.240 107.933 05/08/57 58 NA NA NA NA NA374 Psa Stone 12N.10W.30.412 35.240 107.933 05/10/46 32 NA NA NA NA NA375 Psa Stone 12N.10W.30.421 35.240 107.933 07/18/56 27 NA NA NA NA NA376 Psa Stone 12N.10W.32.111 35.225 107.915 07/12/46 21 NA NA NA NA NA377 Psa Stone 12N.10W.32.111 35.225 107.915 06/15/55 22 NA NA NA NA NA378 Psa Stone 12N.10W.32.111 35.225 107.915 07/18/56 14 NA NA NA NA NA379 Psa Stone 12N.11W.10.4312 35.283 107.985 05/10/46 3.6 NA NA NA NA NA380 Psa Stone 12N.11W.15.211 35.269 107.985 06/27/56 7.0 NA NA NA NA NA381 Psa Stone 12N.11W.15.211 35.269 107.985 05/06/57 6.6 NA NA NA NA NA382 Psa Stone 12N.11W.23.231 35.255 107.968 06/04/47 18 NA NA NA NA NA383 Psa Stone 12N.11W.23.231 35.255 107.968 10/28/52 47 NA NA NA NA NA384 Psa Stone 12N.11W.23.231 35.255 107.968 06/27/56 76 NA NA NA NA NA385 Psa Stone 12N.11W.23.231 35.255 107.968 07/18/56 75 NA NA NA NA NA386 Psa Stone 12N.11W.24.233 35.255 107.950 07/18/56 19 NA NA NA NA NA387 Psa Stone 12N.11W.24.334 35.255 107.950 05/07/57 56 NA NA NA NA NA388 Psa Stone 12N.11W.24.334 35.255 107.950 06/28/56 13 NA NA NA NA NA389 Psa Stone 12N.11W.24.334 35.255 107.950 06/07/57 15 NA NA NA NA NA390 Psa Stone 12N.11W.25.122 35.240 107.950 07/18/56 18 NA NA NA NA NA

Appendix 4
95Table 4-1. Historical groundwater contaminants-of-concern data in the study area, 1942–2009.—Continued
[NAD 83, North American Datum of 1983; NO3, nitrate or nitrate plus nitrite; N, nitrogen; mg/L, milligrams per liter; U, uranium; µg/L, micrograms per liter; Ra, radium; pCi/L, picocuries per liter; Qa, Quaternary alluvium; NA, not available; Kmf, Cretaceous Menefee Formation; Kpl, Cretaceous Point Lookout Formation; Kcc, Cretaceous Crevasse Canyon Formation; Kg, Cretaceous Gallup Formation; Km, Cretaceous Mancos Formation; Kd, Cretaceous Dakota Formation; Jm, Jurassic Morrison Formation; Je, Jurassic Entrada Complex (includes Entrada, Todilto, Summerville, and Bluff Formations); TRc, Triassic Chinle Group; Psa, Permian San Andres Formation (including Glorieta Formation)]
Line no.
Form-ation
Data source*
Data identifier**
Latitude (NAD 83)
Longitude (NAD 83)
DateNO3
(as N, mg/L)U
(µg/L)Ra 226 (pCi/L)
Ra 228 (pCi/L)
Ra 228 +226 (pCi/L)
Gross alpha (pCi/L)
391 Psa Stone 12N.11W.25.122 35.240 107.950 05/07/57 65 NA NA NA NA NA392 Psa Stone 12N.11W.25.122 35.240 107.950 06/27/56 35 NA NA NA NA NA393 Psa Stone 12N.11W.25.213 35.240 107.950 07/11/46 27 NA NA NA NA NA394 Psa Stone 12N.11W.25.213 35.240 107.950 07/18/56 62 NA NA NA NA NA395 Psa Stone 14N.13W.19.1 35.430 108.256 07/14/70 1.2 NA NA NA NA NA396 Psa Stone 14N.13W.27.342A 35.415 108.203 04/07/72 .1 NA NA NA NA NA397 Psa Stone 15N.12W.17.123 35.531 108.131 02/08/77 .1 NA NA NA NA NA398 Psa Stone 15N.15W.18.3344 35.531 108.467 06/15/66 .9 NA NA NA NA NA399 Psa Stone 15N.15W.20.313 35.517 108.449 11/06/69 .1 NA NA NA NA NA400 Psa Stone 15N.15W.20.313 35.517 108.449 07/01/70 .6 NA NA NA NA NA401 Psa Stone 15N.15W.20.313 35.517 108.449 12/08/70 .6 NA NA NA NA NA402 Psa Stone 15N.15W.20.313 35.517 108.449 03/16/72 .3 NA NA NA NA NA403 Psa Stone 15N.16W.23.3132 35.517 108.503 05/03/50 .3 NA NA NA NA NA404 Psa Stone 15N.16W.23.3132 35.517 108.503 03/23/72 .1 NA NA NA NA NA405 Psa Stone 15N.17W.13.1142 35.531 108.590 08/18/64 1.9 NA NA NA NA NA406 Psa Stone 15N.17W.24.4121 35.517 108.591 02/05/42 .2 NA NA NA NA NA407 Psa Stone 15N.17W.24.4121 35.517 108.591 10/14/55 .2 NA NA NA NA NA408 Psa Stone 15N.17W.24.4121 35.517 108.591 08/25/58 .1 NA NA NA NA NA409 Psa Stone 15N.17W.24.4121 35.517 108.591 10/06/60 .1 NA NA NA NA NA410 Psa Stone 15N.17W.24.4121 35.517 108.591 02/28/63 .1 NA NA NA NA NA411 Psa Stone 15N.17W.24.4121 35.517 108.591 06/05/64 .1 NA NA NA NA NA412 Psa Stone 15N.16W.30.3443 35.502 108.574 10/02/68 .1 NA NA NA NA NA413 Psa Stone 12N.11W.25.213 35.240 107.950 06/22/62 29 NA NA NA NA NA
*Data sources:Stone—Stone, W.J., Lyford, F.P., Frenzel, P.F., Mizell, N.H., and Padgett, E.T., 1983, Hydrogeology and water resources of San Juan Basin, New Mexico: Socorro, New Mexico Bureau of Mines and Mineral Resources, Hydrologic Report 6, 70 p.RHR—Roca Honda Resources, LLC, 2009a, 11-20-2009 Permit application, Phase II of a new mine application—Baseline data report: Permit application to the Mining and Minerals Division of the New Mexico Energy, Minerals, and Natural Resources Department, http://www.emnrd.state.nm.us/MMD/MARP/permits/MARP_Permits.htm.**Data identifiers: these values are data indicators used by the source to identify the data within the report or database.

96 Geologic Framework, Regional Aquifer Properties (1940s–2009), and Spring, Creek, and Seep Properties (2009–10)
Publishing support provided byLafayette Publishing Service Center
Figure 4-1. Spatial distribution of historical groundwater contaminants-of-concern data in the study area.
£¤550
¬
¬
¬«602
¬«197
¬«605
¬«509
4
x
A
Brimhall Nizhoni
107° 00´107° 30´108° 00´108° 30´
0 10 20 30 MILES
0 10 20 30 KILOMETERS
Base from U.S. Geological Survey digital data, 1:24,000Projection: Universal Transverse Mercator zone 13N, North American Datum of 1983, North American Vertical Datum of 1988
Sheep Springs
Naschitti
Tohatchi
Twin LakesYah-ta-hey
Gallup
Church Rock
Crownpoint
Thoreau
Ramah
BlackRock
MilanGrants
PaguateEncinal
Paraje
PuebloPintado
Torreon
Mt. Taylor
40
40
57
53
Regional geologicstructure boundaries(modified from Fitzsimmons,1959, and Baldwin and Anderholm, 1992)
Chaco Slope(southern San Juan Basin)
Zuni Uplift Acoma Embayment
Rio PuercoFault Zone
£¤550
Cuba
¬96
La Jara
ReginaNageezi
AcomitaLaguna
Nakaibito
£¤491
!¬«371
!!!!!!!!!
!!!!!!
!!!!
!!
!!
!
!
!
!
!
!!!!!!!!!
!!!
!
!!
!
!
!
!
!!
!!!!!!
!!!!
!!!
!!
!!!!!!!
!!!!!!!!!!!!!!!!
!!!!
!!
!
!!
!
!
!
!!!
!!!
!
!
!
!
!!
!
!!
!
!
! !
!
!
!!
!!!
!
!
!!
!
!
!!!!
!!
!!!!!!!!
!!!
!
!!!!!
!
!
!
!!
!
!
!
!
!
!!
!
!!
!
!!!
!!
!!
!!!!!
!
!!
!!!!!!
!
!!
!!
!
!
!
!!!!!!!
!!!!!!!!
!
!
!!
!!
!
!
!!
!!
!!!!!
!!!!
!!!!!!!
!!!!!!!
!!
!
!
!
!
!!!!
!!!!!!!!!!!!
!
!!!
!
!!
!!
!
!
!!!! !
!
!
!
!
!!!
!
!!
!!
!!
!!!!
!
!!
!
!!!!
!!
!!
!!
!
!!!
!
!!!!!!
!!!
!
!
!!!!!!
!
!
!
!
!
!!!!!!
!!!!
!!!!!!
!
!!!!!!!!!!
!!!
!!!!!!!!!!!!!!!!
!!
!!!!!!!!
!!!!!!!!
!
! Well location from which data were collected
36˚ 00´
35˚ 30´
Developed area
EXPLANATION


Langman, Sprague, and Durall—
Geologic Fram
ework, Regional A
quifer Properties (1940s–2009), and Spring, Creek, and Seep Properties (2009–10)—SIR 2012–5019Printed on recycled paper
I SBN 978- 1- 4113-3359- 8
9 7 8 1 4 1 1 3 3 3 5 9 8