Geologia CroaticaGeologia Croaticabib.irb.hr/datoteka/361132.04_balic.pdfDa vo rin Balić 1, Jo si...
10
1. INTRODUCTION The goal for estimation is to get values of a chosen variable for unsampled locations. There are different interpolation methods, and each of them includes its own mathematical rules. The goal is to achieve the interpolation that is most simi- lar to the real geological distribution in the reservoir. In this paper the results of four methods: inverse distance weighting, nearest neighbourhood, moving average and kriging are compared. Kriging has proved to be the most appropriate linear interpolation method in the sense of least square diffe- rences. Originally this method was applied to gold deposits of South Africa by the engineer D. G. Krige, from which the name is derived (KRIGE,1951). This pioneer work was followed by strong theoretical (mathematical) development in several techniques of kriging. Today these geostatistical methods are widely used and represent a standard part of numerous methods of studies applied to reservoir rocks. The distribution of porosity is analysed as the most impor- tant variable in the reservoir. The methods are tested using data from the »T« reservoir, which belongs to the 1 st sandstone series of the Kloštar field (Table 1) in the Sava depression. The total number of reservoir units is 5. These are the following units (starting with the oldest): basement rocks (»temeljno gorje«), Miocene (reservoir II, III, IV, V, VI), Lower Panno- nian sediments, 2 nd sandstone series (reservoirs alpha, beta, gamma) and 1 st sandstone series (reservoirs IK, O, P, Q, R, S, T, U, V, Y, Z) (Table 1). These are the first porosity maps inter- polated in Pontian reservoirs in the Kloštar field. Davorin Balić 1 , Josipa Velić 2 , Tomislav Malvić 1 ABSTRACT The distribution of porosity data collected at the Kloštar field is analysed. This field is located in the north-western part of the Sava depression, and represents one of the most long-standing fields with respect to oil production in Croa- tia, where production has been ongoing for more than 50 years. Several reservoirs of very diverse lithology and stra- tigraphic age have been discovered. The oldest reservoirs (with minor oil reserves) occur in basement rocks of the Tertiary system (informally named the »temeljno gorje«), then in Badenian coarse-grained clastics, as well as san- dstones of Pannonian and Pontian ages. Major reservoirs, with respect to size, number and volume, are located in sediments of the Upper Pannonian and Lower Pontian. These are medium-grained sandstones, mostly quartz-mica grains, mutually separated by marls. Reservoirs of Lower Pontian age occur within whole structures (anticlines) at Kloštar, while the Upper Pannonian has been developed only in the south–west part. Earlier studies on the reservoi- rs have included only several measured values of reservoir porosity. These values have not been mapped, but only a unique average value, characteristic for the whole reservoir was calculated. Reinterpretation of e-logs increased the number of input values to 20 points of data. Rules are determined for the distribution of porosities in the largest re- servoir of the Lower Pontian named »T«. These regularities can be translated to the other sandstone reservoirs. Seve- ral interpolation methods were selected (inverse distance, nearest neighbourhood and moving average), with special emphasis on kriging. The interpolated maps are different. Based on a comparison of isoporosity, lines, shapes, and cross-validation results, kriging was evaluated as the most appropriate method for porosity interpolation. Keywords: oil, 1 st sandstone series, porosity, geostatistics, kriging, Pontian, Kloštar, Croatia 1 Reservoir Engineering & Field Development, INA – Oil Industry Plc., Zagreb, Croatia ([email protected], [email protected]) 2 Faculty of Mining, Geology and Petroleum Engineering, Zagreb, Croatia ([email protected]) Selection of the most appropriate interpolation method for sandstone reservoirs in the Kloštar oil and gas field Geologia Croatica 61/1 27–35 10 Figs. 1 Tab. Zagreb 2008 Geologia Croatica Geologia Croatica
Transcript of Geologia CroaticaGeologia Croaticabib.irb.hr/datoteka/361132.04_balic.pdfDa vo rin Balić 1, Jo si...

27
�1. INTRODUCTION
The goal for es ti ma tion is to get va lues of a cho sen va riab le for un sam pled loca tio ns. The re are dif fe re nt in ter po la tion met ho ds, and ea ch of them in clu des its own mat he ma ti cal ru les. The goal is to ac hie ve the in ter po la tion that is mo st si mi-lar to the real geo lo gi cal dis tri bu tion in the re ser voir. In this pa per the re sul ts of four met ho ds: in ver se dis tan ce weig hti ng, nea re st neig hbour hood, mo vi ng ave ra ge and kri gi ng are com pa red. Kri gi ng has pro ved to be the mo st ap prop ria te li near in ter po la tion met hod in the sen se of lea st squa re dif fe-ren ces. Ori gi nal ly this met hod was ap plied to go ld de po si ts of Sou th Af ri ca by the en gi neer D. G. Kri ge, from whi ch the na me is de ri ved (KRIGE,1951). This pio neer wo rk was fol lowed by stro ng theo re ti cal (mat he ma ti cal) de ve lop me nt
in se ve ral techniques of kri gi ng. To day the se geos ta tis ti cal met ho ds are wi de ly used and rep re se nt a stan da rd pa rt of nu me rous met ho ds of stu dies ap plied to re ser voir roc ks.
The dis tri bu tion of po ro si ty is ana lysed as the mo st im por-ta nt va riab le in the re ser voir. The met ho ds are tes ted usi ng da ta from the »T« re ser voir, whi ch be lo ngs to the 1st san dsto ne se ries of the Kloš tar fi e ld (Tab le 1) in the Sa va dep res sion. The to tal num ber of re ser voir uni ts is 5. The se are the fol lowi ng uni ts (star ti ng wi th the ol de st): ba se me nt roc ks (»temelj no gor je«), Mio ce ne (re ser voir II, III, IV, V, VI), Lower Pan no-nian se di men ts, 2nd san dsto ne se ries (re ser voi rs al pha, be ta, gam ma) and 1st san dsto ne se ries (re ser voi rs IK, O, P, Q, R, S, T, U, V, Y, Z) (Tab le 1). The se are the fi r st po ro si ty ma ps in ter-po la ted in Pon tian re ser voi rs in the Kloš tar fi e ld.
Da vo rin Balić1, Jo si pa Velić2, To mis lav Malvić1
AB STRA CT
The dis tri bu tion of po ro si ty da ta col lec ted at the Kloš tar fi e ld is ana lysed. This fi e ld is lo ca ted in the nor th-wes te rn pa rt of the Sa va dep res sion, and rep re sen ts one of the mo st lo ng-stan di ng fi el ds wi th res pe ct to oil pro duc tion in Croa-tia, whe re pro duc tion has been on goi ng for mo re than 50 years. Se ve ral re ser voi rs of ve ry di ver se lit ho lo gy and stra-tig rap hic age ha ve been dis co ve red. The olde st re ser voi rs (wi th mi nor oil re ser ves) oc cur in ba se me nt roc ks of the Ter tia ry system (in for mal ly na med the »te melj no gor je«), then in Ba de nian coar se-grai ned clas ti cs, as we ll as san-dsto nes of Pan no nian and Pon tian ages. Major re ser voi rs, wi th res pe ct to si ze, num ber and vo lu me, are lo ca ted in se di men ts of the Up per Pan no nian and Lower Pon tian. The se are me diu m-grai ned san dsto nes, mos tly quar tz-mi ca grai ns, mu tual ly se pa ra ted by mar ls. Re ser voi rs of Lower Pon tian age oc cur wit hin who le struc tu res (an tic li nes) at Kloš tar, whi le the Up per Pan no nian has been de ve lo ped on ly in the sou th–we st pa rt. Ear lier stu dies on the re ser voi-rs ha ve in clu ded on ly se ve ral mea su red va lues of re ser voir po ro sity. The se va lues have not been map ped, but on ly a unique ave ra ge va lue, cha rac te ris tic for the who le re ser voir was cal cu la ted. Rein ter pre ta tion of e-lo gs in crea sed the num ber of in put va lues to 20 poi nts of da ta. Ru les are de ter mi ned for the dis tri bu tion of po ro si ties in the lar ge st re-ser voir of the Lower Pon tian na med »T«. The se re gu la ri ties can be tran sla ted to the ot her san dsto ne re ser voi rs. Seve-ral in ter po la tion met ho ds we re se lec ted (in ver se dis tan ce, nea re st neig hbour hood and mo vi ng ave ra ge), wi th spe cial em pha sis on kri gi ng. The in ter po la ted ma ps are dif fe re nt. Ba sed on a com pa ri son of iso po ro si ty, li nes, sha pes, and cro ss-va li da tion re sul ts, kri gi ng was eva lua ted as the mo st ap prop ria te met hod for po ro si ty in ter po la tion.
Keywor ds: oil, 1st san dsto ne se ries, po ro si ty, geos ta tis ti cs, kri gi ng, Pon tian, Kloš tar, Croa tia
1 Re ser voir En gi nee ri ng & Fie ld De ve lop me nt, INA – Oil In dus try Plc., Zag reb, Croa tia (davo [email protected], to mis [email protected])
2 Fa cul ty of Mi ni ng, Geo lo gy and Pet ro leum En gi nee ri ng, Zag reb, Croa tia (jo si [email protected])
Se lec tion of the mo st ap prop ria tein ter po la tion met hod for san dsto ne
re ser voi rs in the Kloš tar oil and gas fi e ld
Geologia Croatica 61/1 27–35 10 Figs. 1 Tab. Zagreb 2008
Geologia CroaticaGeologia Croatica
�
04 balic.indd 2704 balic.indd 27 24.6.2008 11:08:2524.6.2008 11:08:25

Geologia Croatica Geologia Croatica 61/128
2. GEOGRAPHIC LOCATION AND BASIC GEOLOGY OF THE KLOŠTAR FIELD
The Kloš tar fi e ld is lo ca ted in the area of the Kloštar-Ivanić, Pre da vec, Šća po vec, So bo ća ni, Pr kos, Gor nji Ša ram pov and Li po vac vil la ges, i.e. in the Kloš tar, Iva ni ć-Grad and Br ckov-lja ni dis tric ts. It is lo ca ted about 35 km east of Zag reb (Fi gu re 1). In clo se proxi mi ty to the sou th-ea st, lie the pro duc tion oil fi el ds of Šumečani and Bu nja ni. Lu pog lav fi e ld lies to the nor thwe st, and the Ivanić fi e ld is to the sou th. The Kloš tar fi e ld co ve rs an area of arou nd 30 km2, and ad mi nis tra ti ve ly be lon gs to Zag reb Coun ty, and the re gio nal geo lo gi cal unit of the Sa va dep res sion (Fi gu re 1). The hydro car bon re ser-voi rs are in lit hos tra tig rap hic uni ts of Mio ce ne age na med the Pre čec, Iva ni ć-Grad (Oko li san dsto nes) and Kloš tar Ivanić (Po lja na san dsto nes) for ma tio ns. Minor oil re ser ves al so oc cur in roc ks of Pa laeo zoic age. Ge ne ral ly, the re are twen ty stra ti fi ed and/or mas si ve re ser voi rs pro ven, for mi ng 5 uni ts na med (from the ol de st) ba se me nt roc ks (»te melj no gor je«), Mio ce ne, Lower Pan no nian, 2nd san dsto ne se ries and 1st san dsto ne se ries (Tab le 1).
The ave ra ge ef fec ti ve thic kne ss of par ti cu lar re ser voi rs is 5 metres. The per mea bi li ty va ries be tween 2.4 and 179.9 x 10⁻³ µm2. The re are a to tal of 196 wel ls dril led to da te. Of the se, 64 are clas si fi ed as mea su ri ng wel ls, 59 are in pro duc-tion, 68 are aban do ned and 5 wel ls are used for the injec tion of was te wa ter1. The sche ma tic map of we ll lo ca tio ns in the Kloš tar fi e ld is shown in Fi gu re 2.
3. HISTORICAL EXPLORATION OF THE KLOŠTAR AREA
Geo lo gical re sear ch in the area of Kloš tar be gan at the be gin-ni ng of the 20th cen tu ry. Gas tra ces in wel ls of Kloš tar, Iva nić, and sur roun di ng vil la ges we re known from an cie nt ti mes. Fac to rs in di ca ti ng the pre sen ce of hydro car bo ns re sul ted in the fi r st we ll bei ng dril led to a dep th of 905 m in 1904/5. Gas was no ti ced at a dep th of arou nd 650 m, but oil had not been dis co ve red. Regio nal gra vi met ric sur veyi ng of nor th-we st Croa tia be tween 1940–1942 in clu ded the area of the Kloš tar fi e ld. Gra vi met ric stu dies then hig hlig hted a struc tu re cal led »Križ« wi th a Di na ri dic stri ke (NW–SE), in whi ch the Šu me-ča ni (dis co ve red in 1948), Bu nja ni (dis co ve red in 1952) and Lu pog lav (dis co ve red in 1971) oil fi el ds are lo ca ted.
On the nor th-we st pa rt of the Križ struc tu re, in the area of Kloš tar, the re has been a mo ve towar ds im ple men ti ng new gra vi met ric mea su re me nt met ho ds sin ce 1952. In ter pre ta tion of the re sul ts fa ci li ta ted the lo ca tion of the fi r st explo ra tion we ll Kloš ta r-1 (Klo-1). A dep th of 1272 m was ac hie ved in this we ll. The fi ve re ser voi rs, wi th to tal dep th of 853–990 metres have been dril led, to par ti cu lar dep ths as fol lows: A (853–865 m), P (873–875 m), Q (891.5–898.5 the m), R (914–915 m) and Y (987–990 m). An in dus trial ly sig ni fi ca nt amou nt of oil was dis co ve red. The Kloš tar fi e ld was put into pro duc-tion in 1954. On se ve ral oc ca sions in la ter yea rs, the den si ty of the ne two rk of seis mic pro fi les was in crea sed, es pe cial ly in the mar gi nal par ts of fi e ld, for the pur po se of fi e ld con tou ri ng and de fi ni tion of pet ro leum geo lo gy set tin gs. Be tween 1954–1961 new wel ls we re dril led, re co ve ry was in crea sed usi ng wa ter injec tion and the fi e ld boun da ries were exten ded. All the se ac hie ve men ts led to in crea ses in the re ser ves, whi ch ha ve been mo ni to red2 du ri ng who le pe riod of pro duc tion. Fur ther-mo re, pos sib le new amoun ts of hydro car bo ns in so-cal led hid den tra ps ha ve been es ti ma ted3.
1 Re po rt of hydro car bon re ser ves of the Kloš tar fi e ld, pro fes sio nal do cu men ta tion of INA – Reser voir En gi nee ri ng and Fie ld De ve lop-me nt De pt., 1977; At las of oil and gas fi el ds, pro fes sio nal do cu men-ta tion of INA – Re ser voir En gi nee ri ng and Fie ld De ve lop me nt De-pt., 1998, Re po rt of hydro car bon re ser ves of the Kloš tar fi e ld, pro fes sio nal do cu men ta tion of INA – Reser voir En gi nee ri ng and Fie ld De ve lop me nt De pt., 2002; Stu dy of Stei ner et al. from pro fes-sio nal do cu men ta tion of INA, 1999
2 Re po rt of hydro car bon re ser ves of the Kloš tar fi e ld, pro fes sio nal do cu men ta tion of INA – Re ser voir En gi nee ri ng and Fie ld De ve lop-me nt De pt., 1977; Re po rt of hydro car bon re ser ves of the Kloš tar fi e ld, pro fes sio nal do cu men ta tion of INA – Re ser voir En gi nee ri ng and Fie ld De ve lop me nt De pt., 2002
3 Stu dy of Stei ner et al. from pro fes sio nal do cu men ta tion of INA, 1999
Fi gu re 1: Geog rap hic lo ca tion of the Kloš tar fi e ld
Fi gu re 2: Sche ma tic map of we ll lo ca tio ns at the ana lyzed fi e ld
04 balic.indd 2804 balic.indd 28 24.6.2008 11:08:2624.6.2008 11:08:26

Geologia Croatica29
Da vo rin Balić et al.: Se lec tion of the mo st ap prop ria te in ter po la tion met hod for san dsto ne re ser voi rs in the Kloš tar oil and gas fi e ld
Many ot her re gio nal stu dies ha ve in clu ded in ves ti ga tion of the Kloš tar fi e ld as pa rt of explo red area. Pet rop hysi cal pro per ties of the san dsto nes as we ll as stra tig rap hic ar chi tec-tu re in the wes te rn pa rt of the Sa va dep res sion have been we ll de fi ned by JÜTTNER et al. (2001), SAFTIĆ (1998) and SAFTIĆ et al. (2001). VELIĆ & SAFTIĆ (2000) pub lis hed a ge ne ral pa per about hydro car bo ns in Croa tia, and fi nal ly CVETKOVIĆ (2007) ap plied neu ral ne twor ks for log ana lysis in the san dsto ne re ser voi rs in the Kloš tar fi e ld.
4. PETROLEUM GEOLOGY SETTINGS
The Križ struc tu re (in clu di ng the Kloš tar fi e ld) is lo ca ted at the mo st nor th-wes te rn pa rt of Mos la vač ka go ra Mt. Du ri ng the Lower and Mid dle Mio ce ne, a lar ge pa rt of Mos la vač ka go ra Mt. was up lif ted abo ve sea-le vel. The Križ struc tu re has Di na ric orien ta tion (NW–SE), and it is for med from Pre-Pa laeo zoic gra ni tes and gneis ses (VRAGOVIĆ & MAJER, 1980; PAMIĆ et al., 1984). The main nor the rn fau lt of the Sa va dep res sion was pa ral lel wi th the sout he rn mar gin of this struc tu re. Despi te a lar ge num ber of we ll da ta, the boun da ries be tween stra tig rap hic uni ts are of ten not pre ci se ly de fi ned, mos tly due to the in suf fi cie nt num ber of palaeon to lo gi cal sam ples and a lar ge num ber of tec to nic bloc ks. At fa vou rab le lo ca tio ns, stra tig rap hic boun da ries are de ter mi ned from avai-lab le we ll da ta (co res, mud par tic les and lo gs). The re are fi ve re ser voir se ries de fi ned in to tal, star ti ng wi th Pa laeo zoic roc ks and en di ng wi th Lower Pon tian se di men ts.
The Ba se me nt Ter tia ry system in clu des erup ti ves and me ta mor phic roc ks, gra ni tes and gneis ses of Pa laeo zoic age. This is a buried hi ll for med be fo re the Ter tia ry (i.e. Mio ce ne) pe riod, by ra dial tec to nic mo ve men ts and de nu da tion pro ces-ses. The roc ks are weat he red and ca tac li sed. This explai ns why so me par ts, in struc tu ral ly fa vou rab le pla ces, are con fi r med as oil re ser voi rs.
The Mid dle Mio ce ne (Ba de nian, Sar ma tian) was de po si-ted pe ric li nal ly over the Palaeo zoic mag ma ti c-me ta mor phic un con for mi ty, i.e. se di men ta tion was not con ti nuous. The Mid dle Mio ce ne stra tig rap hy is ve ry he te ro ge neous. The se se di-men ts be gin wi th coar se-grai ned con glo me ra tes, con glo me ra tic san dsto nes and san dsto nes of ten in ter ca la ted wi th sha les. They are over lain by da r k-grey, san dy and bi tu mi ni sed mar lsto nes, par tial ly in ter ca la ted wi th lig ht-grey, fi ne-grai ned san dsto nes. Mio ce ne be ds from eco no mic hydro car bon re ser voi rs at the sout he rn and eas te rn par ts of the Kloš tar struc tu re.
The Up per Mio ce ne (Pan no nian, Pon tian) is pro ven and explo red throug hout the en ti re fi e ld. Lower Pan no nian stra ta were con cor dan tly de po si ted over Sar ma tian bi tu mi ni sed mar lsto nes. This is a clear ly re cog ni sed fa cies of ha rd, whi te cal ci tic mar lsto nes, whi ch can be dis tin guis hed from the se di-men ts abo ve and be low on their lit ho lo gi cal and elec tro-physi-cal pro per ties (PLETIKAPIĆ, 1969). The re are of ten re la ti vely thin be ds of lig ht-grey, fi ne-grai ned san dsto nes that are sa tu ra-ted wi th sig ni fi ca nt oil re ser ves in the sout he rn pa rt of the fi e ld.
Up per Pan no nian se di men ts were de po si ted over the en ti re fi e ld. The se are mos tly brown or da r k-grey, ha rd cal ci-tic mar lsto nes. Three san dsto ne se ries (na med as alpha, be ta
and gam ma) are pre se nt in the sou th-wes te rn pa rt and are par tial ly sa tu ra ted wi th hydro car bo ns. This is al so cal led the 2nd san dsto ne se ries. The be ta re ser voir in clu des the lar ge st re ser ves and grea te st pro duc tion.
Lower Pon tian se di men ts are de fi ned as (da rk) grey, com pa ct mar lsto nes and san dy mar lsto nes in the sou th and ea st of the fi e ld. San dsto nes, that cou ld be clean or in clude sma ll pro por tio ns of ma rl or clay, are do mi na nt in the nor th–we st.
The san dsto ne re ser voi rs are na med, from the top, as G, H, I, K, L, M and N. These are mos tly sa tu ra ted wi th wa ter, exce pt for so me spo ra dic tra ces of gas (G and H) or oil (I and K). Dee per in ter va ls are na med O, P, Q, R, S, T, U, V, Y and Z, whi ch are the main oil re ser voi rs of the fi e ld. The mo st im por ta nt in ter va ls are T, U and V. The uni ts O–Z fo rm the 1st san dsto ne se ries.
The Up per Pon tian se di men ts are con cor da nt and oc cur over the en ti re fi e ld. The lit ho lo gy is mo no to nous, con sis ti ng of so ft san dy or clayey se di men ts. The propor tion of sa nd in crea ses upwar ds.
The Plio ce ne, i.e. Da cian and Ro ma nian, is al so known as the »Pa lu di na« be ds. The se se di men ts mos tly in clu de clays in al ternation wi th me diu m- and coar se-grai ned san ds.
The Qua ter na ry con si sts mos tly of yel lowi sh, san dy clay se di men ts wi th nu me rous li me con cre tio ns. The ave ra ge thic-kne ss is be tween 10 and 15 metres.
The Kloš tar struc tu re is a faul ted an tic li ne wi th Di na ric stri ke. The geo lo gi cal his to ry is ve ry in te res ti ng, as dis co ve-red du ri ng in ves ti ga tion of the struc tu ral de fi ni tion and pa laeo-tec to nic evo lu tion of the wes te rn pa rt of the Sa va dep res sion (VELIĆ, 1979; 1980; 1983). The fi e ld struc tu re was for med in the Mid dle Mio ce ne, ac com pa nied by stro ng uplif ti ng even ts in the Ba de nian and Sar ma tian. At that ti me, an an tic-li ne was crea ted, wi th di men sions of 7 x 2 km wi th a NW–SE orien ta tion. La ter, in the Up per Mio ce ne, this struc tu re was dif fe ren tia ted into two smal ler par ts: the nor the rn whi ch was up lif ted throug hout the Pon tian, and the sout he rn pa rt whi ch was on ly acti va ted in the Up per Pon tian. In the sa me pe riod the par ti cu lar bloc ks be tween these up lif ted areas gra dual ly sub si ded, es pe cial ly in the Lower Pon tian. The re ce nt struc tu-ral sha pe was tec to ni cal ly crea ted in the Plio ce ne and Qua ter-na ry, when the main pha se of hydro car bon mig ra tion pro bab ly oc cur red.
The Kloš tar struc tu re was bor de red by the prin ci pal nor the rn fau lt zo ne of the dep res sion. The ver ti cal dis pla ce-me nt, at the le vel of mar ker »Tg« (ba se me nt top), is al mo st 1000 metres. This is why the geo lo gi cal set ti ng of the fi e ld is ve ry com plex. Su ch a lar ge dis pla ce me nt is al so refl ec ted in the fa ct that the re ser voi rs of the 1st san dsto ne se ries are dis lo-ca ted in 17 bloc ks (Fi gu re 3).
The re ser voi rs of the 1st san dsto ne se ries (Tab le 1, Fi gu re 4, na med as Z, Y, V, U, T, R, S, P, P, O and IK) be lo ng to the Lower Pon tian be ds. The pa rt of the 1st san dsto ne se ries that is sa tu ra ted wi th hydro car bo ns co ve rs the nor th-eas te rn pa rt of the fi e ld. The struc tu re gen tly sin ks towa rd the nor th–we st. Ac cor di ng to the clas si fi ca tion of oil and gas re ser voi rs gi ven by Brod (in AKSIN, 1967), the hydro car bon re ser voi rs of the
04 balic.indd 2904 balic.indd 29 24.6.2008 11:08:2724.6.2008 11:08:27

Geologia Croatica Geologia Croatica 61/130
poi nt da ta (9) the ave ra ge re ser voir po ro si ties are cal cu la ted as arit hme ti cal means.
The Kloš tar fi e ld is cha rac te ri sed by a ve ry lo ng pro duc-tion pe riod. It has al rea dy las ted 53 yea rs and the next 20 yea rs of pro duc tion are plan ned (Fi gu re 5). The re fo re, em pha sis is gi ven to the in ter pre ta tion of ad di tio nal lo gs and cal cu la tion of new pet rop hysi cal va lues. This was do ne in 2007 for 20 rep re sen ta ti ve wel ls. The ave ra ge po ro si ties for ea ch re ser voir we re cal cu la ted, and this pa ra me ter was es pe cial ly inter po la-ted in san dsto ne re ser voir »T«, as it is the lar ge st and mo st typi cal san dsto ne re ser voir.
1st san dsto ne se ries rep re se nt a group of stra ti fi ed be ds de li nea-ted by tec to nic and lit ho lo gi cal bar rie rs. The ana lysed re ser-voir »T«, to get her wi th re ser voirs U and V, rep re se nts the mo st im por ta nt re ser voir of the 1st san dsto ne se ries. The mar lsto ne that se pa ra tes re ser voi rs T, U and V from ea ch ot her is fou nd in the cen tral pa rt. The se re ser voi rs con si st of fi ne- to me diu m-grai ned, weak san dsto nes, wi th a maxi mum thic kne ss up to 10 metres. The mar lsto nes gra dual ly di sap pear at the ea st of the struc tu re, al lowi ng pos sib le con nec tion of re ser voi rs »T« and »U«.
The ave ra ge re ser voir pa ra me te rs are cal cu la ted usi ng weig hte ni ng and the ef fec ti ve thic kne ss of the ana lysed in ter-va ls. The la bo ra to ry po ro si ty da ta are de ri ved from the 51 co res from 9 wel ls. Due to the sma ll num ber of ho ri zon tal
AgeLit ho-strat.
uni tsRe ser voir se ries Re ser voi rs
CEN
OZO
IC
MIO
CEN
E
UPP
ER M
IOCE
NE
LOWER PONTIAN
KLOŠ TA R-I VA NIĆ fm. 1st san dsto ne se ries IK, O, P, Q, R, S, T, U, V, Y, Z
UPPERPANNONIAN
IVANIĆ-GRAD fm. 2nd san dsto ne se ries al pha, be ta, gam ma
LOWERPANNONIAN
PRKOS fm. Pre-Va len cien be ds
MID
DLE
M
IOCE
NE
BADENIAN, SARMATIAN
PREČEC fm. Mio ce ne II, III, IV, V, VI
PALEOZOIC Ba se me nt »te melj no gor je«
Table 1 Sche ma tic re view of the chro no-, lit hos tra tig rap hic and re ser voir uni ts
Fi gu re 3: Struc tural map of »T« re ser voir top (1st san dsto ne se ries). Drawn after note 3
4 Atlas of oil and gas fi el ds, pro fes sio nal do cu men ta tion of INA – Reser voir En gi nee ri ng and Fie ld De ve lop me nt De pt., 1998
Fi gu re 4: Sche ma tic geo lo gi cal cro ss-sec tion of the 1st san dsto ne se ries4
04 balic.indd 3004 balic.indd 30 24.6.2008 11:08:2724.6.2008 11:08:27

Geologia Croatica31
Da vo rin Balić et al.: Se lec tion of the mo st ap prop ria te in ter po la tion met hod for san dsto ne re ser voi rs in the Kloš tar oil and gas fi e ld
5. APPLIED INTERPOLATION METHODS
The es ti ma tion, i.e. in ter po la tion, can be do ne from known va lues of the ob ser ved pri ma ry va riab le (au to cor re la tion,) or by usi ng one or mo re al ter na ti ve se con da ry va riab les in the sa me area. A stro ng cor re la tion be tween the pri ma ry and se con-da ry variab les is the on ly con di tion requi red. The re are va rious es ti ma tion met ho ds, i.e. dif fe re nt in ter po la tion tec hniques. The ap plied prog ram Sur fer 8.0TM al lows the use of twel ve in ter po la tion met ho ds. He re, four met ho ds are com pa red: in ver se dis tan ce weig hti ng, nea re st neig hbour hood, mo vi ng ave ra ge and kri gi ng.
The In ver se Dis tan ce Weig hti ng met hod es ti ma tes va lues from a re la ti vely sim ple mat he ma ti cal expres sion (Equa tion 1). The in fl uen ce of ea ch poi nt is in ver sely pro por-tio nal to the dis tan ce from an es ti ma ted lo ca tion. The num ber of poin ts in clu ded in the es ti ma tion (z1...zn), is de fi ned by cir cle ra dii drawn arou nd a se lec ted lo ca tion. The re su lt is stron gly de pe ndent on the va lue of the dis tan ce expo ne nt (p). Most of ten this va lue is set at 2 (as he re). The main rea son of the po pu la ri ty of a va lue of 2 for the dis tan ce expo ne nt is the gen tly smoot hi ng cha rac te ris tic of this expo ne nt (János Gei ger, pe rs. co mm. 2007). In the ca se of p=1, a sim ple li near in ter po-la tion can be drawn. For p=3 re la ti ve ly sma ll dis tan ces are em pha si sed, but from a par ti cu lar dis tan ce the weig htings can in crea se dras ti cal ly. So if the ope ra tor has a men tal pic tu re of the geo lo gi cal la te ral va ria tion, the re is the pos si bi li ty of hig hlig hti ng fea tu res in clu di ng thin im per meab le bar rie rs, by usi ng a lar ge va lue for p.
1 1 ... 1
...z
d d d
dz
dz
dz
2
1
2
2
IU
Ip p
np
Ip p
npn
=+ +
+ +
(Equa tion 1)
Whe re:zIU – es ti ma ted va lued1...dn – dis tan ces of lo ca tio ns 1...n to the es ti ma ted lo ca-
tion zIU
p – dis tan ce expo ne ntz1...zn – real va lues at lo ca tio ns 1...n
The Nea re st neig hbour hood met hod as sig ns the va lue of the clo se st poi nt to ea ch grid no de. It is not so mu ch an inter-po la tion met hod as a zo nal assig nme nt tec hnique. This met hod is use ful in the ca se of re la ti ve lar ge zo nes wit hout da ta (bli nd areas), whi ch need to be sche ma ti cal ly map ped. The si ze of the zo ne that nee ds to be »ap prop ria te« is es ti ma ted from the de fi ned sin gle da ta, ba sed on the type of map ped va riab le.
The Mo vi ng Ave ra ge met hod cal cu la tes the va lues of grid no des from ave ra ged da ta mea su red in a par ti cu lar el lip-soid or cir cle that sur rou nds ea ch grid no de. The re is al so a need to de fi ne the lowe st num ber of da ta that can be ave ra ged. If the num be rs of da ta in si de the de fi ned area are lower than the mi ni mum, the no de va lue wi ll not be cal cu la ted. This is not exa ct in ter po lation but rat her a ki nd of sim ple met hod cha rac te ri sed by its tri vial smoot hi ng cha rac ter. The re are so me ap pli ca tions when this met hod can al so be ap plied to the late ral smoot hi ng of da ta.
Kri gi ng is a geos ta tis ti cal met hod, ba sed on cal cu la tions of spa tial de pen den ce, i.e. expe ri men tal va riog ra ms. The theo ry of va riog ram ana lysis is explai ned in nu me rous boo ks and pa pe rs. Su ch ana lyses are per for med at se ve ral fi el ds in the Croa tian pa rt of the Pan no nian ba sin system, i.e. for the sig ni-fi ca nt num ber of core da ta col lec ted in the Bje lo var sub dep res-sion (HERNITZ et. al., 2001; MALVIĆ, 2003; 2005; MALVIĆ & ĐUREKOVIĆ, 2003). Ter mi no lo gi cal ly, the ter ms va riog-ram and se mi va riog ram (e.g. see ISAAKS & SRIVASTAVA, 1989; JOURNEL & HUIJBREGTS, 1978; HOHN, 1988; JENSEN et al., 1997; MALVIĆ, 2003) are iden ti cal, be cau se the va riog ram equa tion can be sim pli fi ed in a way whe re by bo th si des are mul tip lied by ‘2’. The ob tai ned fun ction (Equa-tion 2) is cal led a se mi va riog ram and is writ ten as:
hN h
z u z u h2 1n n
n
N h2
1
#c = - +=
^^
_ _
^
hh
i i
h
8 B!(Equa tion 2)
Whe re:N(h) – num ber of da ta pai rs com pa red at dis tan ce ‘h’z(un) – va lues at lo ca tion un
z(un+h) – va lues at lo ca tion un+h.
Fi gu re 5: Pro duc tion ra tes and dyna mi cs (from: Atlas of oil and gas fi el ds, pro fes sio nal do cu men ta tion of INA-Re ser voir En gi nee ri ng and Fie ld De ve lop me nt De pt., 1998)
04 balic.indd 3104 balic.indd 31 24.6.2008 11:08:2924.6.2008 11:08:29

Geologia Croatica Geologia Croatica 61/132
Al mo st all expe ri men tal (se mi)va riog rams can be mat he-ma ti cal ly ap proxi ma ted by fi ve theo re ti cal mo de ls: sphe ri cal, expo nen tial, Gaus sian, li near and lo ga rit hmic (HOHN, 1988). The kri gi ng es ti ma tion in clu des the fol lowi ng cri te ria:
· It nee ds to be un bia sed,· The diffe ren ce of va rian ces be tween the mea su red and
es ti ma ted va lues (so cal led kri gi ng va rian ce) nee ds to be at the lowe st pos sib le va lue.
The kri gi ng al go rit hm al so cal cu la tes the pre dic ted and real es ti ma tion er ro rs. The se va lues can be com pa red wi th mea su red va lues (or in put da ta), and the re lia bi li ty of es ti ma-tion can be cal cu la ted. Kri gi ng is des cri bed as a sta tis ti cal tec hnique cal led »BLUE«. The ac ro nym BLUE mea ns Best Li near Un bia sed Es ti ma tor. The sim ple kri gi ng for mu la for es ti ma tion ba sed on »n« con trol poin ts (ha r d-da ta) is gi ven in Equa tion 3:
Z Zk ii
n
i1
#m==
! (Equa tion 3)
Whe re:li – weig hti ng coef fi cie nt for ea ch lo ca tion »i«Zi – sur roun di ng known va lues, so cal led con trol poin tsZk – va lue es ti ma ted by kri gi ng
The Kri gi ng met hod is di rec ted to es ti ma tion of an ap prop-ria te weig hti ng coef fi cie nt and fi nal ly a va lue Zk. The set of Zk va lues is ob tai ned by ap plyi ng a mat rix system of li near kri gi ng equa tio ns.
Cro ss-va li da tion is a rela ti ve ly sim ple nu me ri cal met hod ve ry of ten ap plied in chec ki ng the es ti ma tion qua li ty. It is ba sed on mo vi ng mea su red va lues at cer tain lo ca tions and es ti-ma ting new va lue at the sa me pla ce. New es ti ma tions are ba sed on the re mai ni ng mea su red da ta (Equa tion 4). The pro ce du re is re pea ted for all wel ls and a fi nal va lue cal led the Mean Squa re Er ror (MSE) is cal cu la ted. The met hod’s di sad-van ta ge is its in sen si tivity to the num ber of ana lysed wel ls. The famous pio neer wo rk on cro ss-va li da tion was pub lis hed by DAVIS (1987). In a geo lo gi cal sen se, the MSE va lue in di-ca tes an er ror ob tai ned from the exis ti ng da ta set usi ng a dif fe-re nt in ter po la tion al go rit hm. For exam ple, if the dep th of stra ta is map ped usi ng two met ho ds and the sa me in put da ta set, ea ch map wi ll be cha rac te ri sed by a dif fe re nt MSE va lue (Equa tion 4). Mo reo ver, a lower MSE va lue in di ca tes the mo re ap prop-ria te in ter po la tion, i.e. the lower er ror ob tai ned by n-1 da ta ana lysed sequen tial ly. Cal cu la tion of MSE can be ap plied to al mo st all geo lo gi cal va riab les in clu di ng po ro si ty, sa tu ra tion and ot hers.
MSE n real value estimation1 - ii
n2
1=
=
^ h! (Equa tion 4)
Whe re:MSE – re sul ts ob tai ned by cro ss-va li da tion
(Mean Squa re Er ror)real va lue – va lue ob tai ned at lo ca tion »i«es ti ma tion – va lue es ti ma ted at lo ca tion »i«
6. RESULTS OF A COMPARISON OF INTERPOLATION METHODS
Inter po la tion from 20 po ro si ty va lues was used as the in put. This is a ve ry li mi ted da ta set for the cal cu la tion of an expe ri-men tal va riog ram. There fo re, di rec tio nal va riog ra ms we re omit ted and on ly the om ni di rec tio nal ones (i.e. bei ng in de pen-de nt of di rec tion) we re cal cu la ted. In put da ta we re ave ra ged log mea su re men ts col lec ted for re ser voir »T« and rein ter pre-ted in 2007. Rein ter pre ta tion was ba sed on the neut ron and den si ty lo gs (CDL – Com pen sa ted Den si ty Log i CNL – Com pen sa ted Neut ron Log). Due to a hig her num ber of lo gs and bet ter sof twa re sup po rt, the qua li ty of the rein ter pre ted va lues is mu ch grea ter than those es ti ma ted in the pa st. In any par ti cu lar we ll the ve ry den se lo g-po ro si ty va lues we re rep la-ced by a sim ple ave ra ge va lue cal cu la ted for the who le re ser-voir thic kne ss. The new da ta set ma de it pos sib le to ap ply and com pare se ve ral in ter po la tion met ho ds and re sul ts.
Re sul ts ob tai ned by four met ho ds are pre sen ted on dif fe-re nt ma ps. Al mo st all, can be re cog ni sed by their ve ry dif fe-re nt mor pho lo gies, des pi te the sma ll si ze of the in put da ta set. The di re ct re sul ts of the mat he ma ti cal al go rit hms are used in ea ch met hod, as des cri bed abo ve.
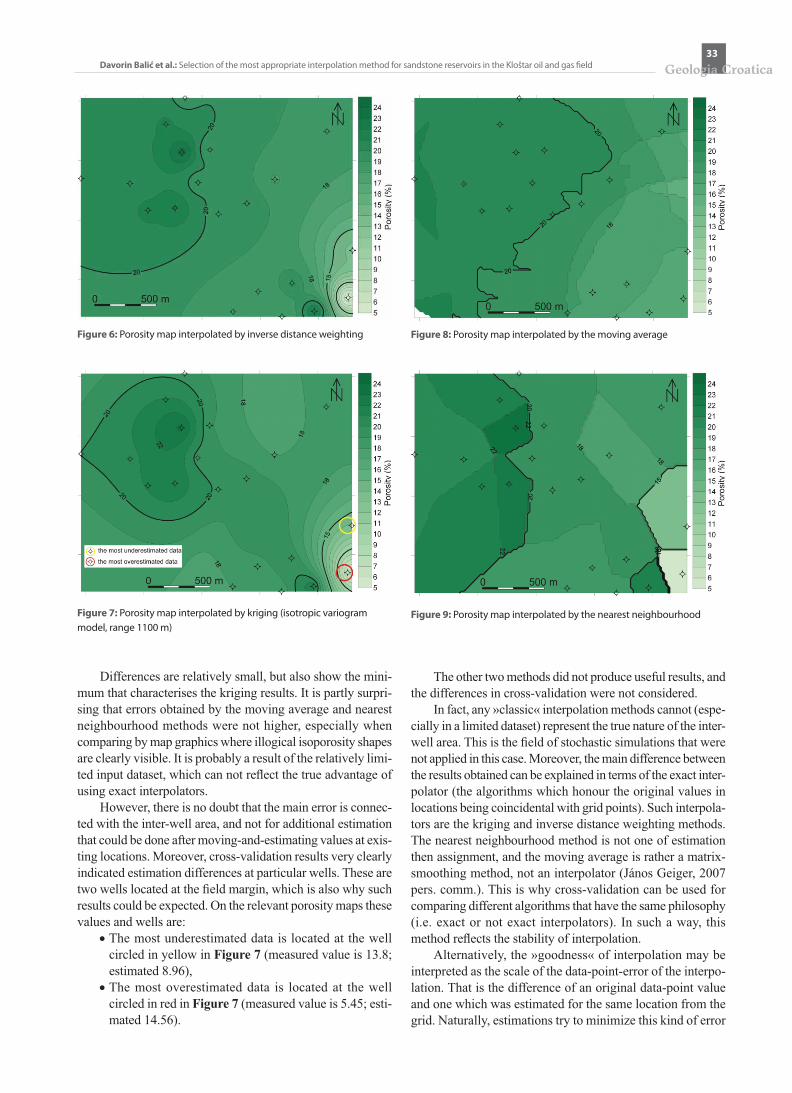
The re su lt of the inver se dis tan ce weig hti ng met hod is shown in Fi gu re 6. It in di ca tes the real po ro si ty dis tri bu tion in the reser voir and is al so si mi lar to the kri gi ng map (Fi gu re 7) whi ch is con si de red as the mo st aut hen tic al go rit hm in the sen se of geo lo gy and geomat he ma ti cs.
Howe ver, the ma ps ob tai ned by the ot her two met ho ds, whi ch are not exa ct in ter po la to rs, are inap prop ria te. The se are mo vi ng ave ra ge (Fi gu re 8) and nea re st neig hbour hood (Fi gu re 9) ma ps, whe re the pre sen ted iso po ro si ty sha pes can not be mea nin gful ly in ter pre ted. Even if the ra dii of the sear chi ng el lip soid is chan ged (mo vi ng ave ra ge), the gra dual tran si tion amo ng li nes has not been ac hie ved. The nea re st neig-hbour hood re su lt stron gly em pha sises the po lygo nal pre sen ta-tion. The re fo re, the se two met ho ds can not be ap plied to po ro-si ty in ter po la tion in re ser voi rs of the 1st san dsto ne se ries.
Kri gi ng and in ver se dis tan ce weig hti ng met ho ds are pro ven as va lid for po ro si ty map pi ng. This al so re sul ted from the fa ct that the san dsto ne re ser voi rs are a spe cial fa vou rab le lit ho lo gy for the ap pli ca tion of geos ta tis ti cal in ter po la tion met ho ds. This ana lysis al so con fi r ms that the po ro si ty dis tri-bu tion in re ser voir »T« of Lower Pon tian age is mo st ap prop-ria tely repre sen ted by the kri gi ng re sul ts. The fi r st eva lua tion is ba sed on the geo lo gi cal mea ni ng of iso po ro si ty li ne sha pes whe re the kri gi ng map des cri bes the po ro si ty dis tri bu tion in the cen tral and eas te rn par ts of the fi e ld par ti cu lar ly we ll.
Nu me ri cal es ti ma tion of ma ps is per for med usi ng a cro ss-va li da tion equa tion. The fol lowi ng va lues were ob tai ned for the dif fe re nt met ho ds (star ti ng wi th the lowe st er ro r):1. Kri gi ng 366.93 (exa ct in ter po la tor)2. Mo vi ng ave ra ge 369.26 (sim ple mat rix smoot hi ng)3. In ver se dis tan ce weig hti ng 371.97 (exa ct in ter po la tor)4. Nea re st neig hbour hood 389.00 (zo nal as sig nme nt)
04 balic.indd 3204 balic.indd 32 24.6.2008 11:08:2924.6.2008 11:08:29
Geologia Croatica33
Da vo rin Balić et al.: Se lec tion of the mo st ap prop ria te in ter po la tion met hod for san dsto ne re ser voi rs in the Kloš tar oil and gas fi e ld
Dif fe ren ces are re la ti ve ly sma ll, but al so show the mi ni-mum that cha rac te ri ses the kri gi ng re sul ts. It is par tly sur pri-si ng that er ro rs ob tai ned by the mo vi ng ave ra ge and nea re st neig hbour hood met ho ds we re not hig her, es pe cial ly when com paring by map grap hi cs whe re il lo gi cal iso po ro si ty sha pes are clear ly vi sib le. It is pro bab ly a re su lt of the re la ti ve ly li mi-ted in put da ta set, whi ch can not refl e ct the true ad van ta ge of using exa ct in ter po la to rs.
Howe ver, the re is no dou bt that the main er ror is con nec-ted wi th the in te r-we ll area, and not for ad di tio nal es ti ma tion that cou ld be do ne af ter mo vi ng-a nd-es ti ma ti ng va lues at exis-ti ng lo ca tio ns. Mo reo ver, cro ss-va li da tion re sul ts ve ry clear ly in di ca ted es ti ma tion dif fe ren ces at par ti cu lar wel ls. The se are two wel ls lo ca ted at the fi e ld mar gin, whi ch is al so why su ch re sul ts cou ld be expec ted. On the re le va nt po ro si ty ma ps the se va lues and wel ls are:
· The mo st un de res ti ma ted da ta is lo ca ted at the we ll cir cled in yel low in Fi gu re 7 (mea su red va lue is 13.8; es ti ma ted 8.96),
· The mo st ove res ti ma ted da ta is lo ca ted at the we ll cir cled in red in Fi gu re 7 (mea su red va lue is 5.45; es ti-ma ted 14.56).
The other two met ho ds did not pro du ce use ful re sul ts, and the dif fe ren ces in cro ss-va li da tion we re not considered.
In fa ct, any »clas sic« in ter po la tion met ho ds can not (es pe-cial ly in a li mi ted da ta set) repre se nt the true na tu re of the in te r-we ll area. This is the fi e ld of stoc has tic si mu la tio ns that we re not ap plied in this ca se. Mo reo ver, the main dif fe ren ce be tween the re sul ts ob tai ned can be explained in ter ms of the exa ct in ter-po la tor (the al go rit hms whi ch ho nour the ori gi nal va lues in lo ca tio ns bei ng coin ci dental wi th grid poin ts). Su ch in ter po la-to rs are the kri gi ng and in ver se dis tan ce weig hti ng met ho ds. The nea re st neig hbour hood met hod is not one of es ti ma tion then as sig nme nt, and the movi ng ave ra ge is rat her a mat rix-smoot hi ng met hod, not an in ter po la tor (János Gei ger, 2007 pe rs. co mm.). This is why cro ss-va li da tion can be used for com pa ri ng dif fe re nt al go rit hms that ha ve the sa me phi lo sop hy (i.e. exa ct or not exa ct in ter po la to rs). In su ch a way, this met hod refl ec ts the sta bi li ty of in ter po la tion.
Al ter na ti ve ly, the »good ne ss« of in ter po la tion may be in ter pre ted as the sca le of the da ta-poi nt-er ror of the in ter po-la tion. That is the dif fe ren ce of an ori gi nal da ta-poi nt va lue and one whi ch was es ti ma ted for the sa me lo ca tion from the grid. Na tu ral ly, es ti ma tio ns try to mi ni mi ze this ki nd of er ror
Fi gu re 6: Po ro si ty map in ter po la ted by in ver se dis tan ce weig hti ng
Fi gu re 7: Po ro si ty map in ter po la ted by kri gi ng (isot ro pic va riog ram mo del, ran ge 1100 m)
Fi gu re 8: Po ro si ty map in ter po la ted by the movi ng ave ra ge
Fi gu re 9: Po ro si ty map in ter po la ted by the nea re st neig hbour hood
04 balic.indd 3304 balic.indd 33 24.6.2008 11:08:3024.6.2008 11:08:30

Geologia Croatica Geologia Croatica 61/134
and pro du ce a Gaus sia n-er ror dis tri bu tion. It in clu des the fa ct that the mean er ror is for ced to be clo se to 0, whi le the stan-da rd de via tion is about 1. Howe ver, at the we ll-lo ca tio ns the se er ro rs are dif fe re nt. The bet ter the es ti ma tion, the smal ler the er ror in a par ti cu lar da ta poi nt. Grid di ng of the se poi nt er ror is al so wor th thin ki ng about. This is al so why re si dua ls are com pu ted by the Sur fer op tion. It gi ves a quan ti ta ti ve mea su re of how es ti ma tion on the grid ag rees wi th the ori gi nal da ta. Re si dual va lues are re por ted as eit her po si ti ve or ne ga ti ve va lues (Fi gu re 10). Sur fer au to ma ti cal ly uses the nea re st neig h-bour hood algo rit hm to cal cu la te re si dua ls, i.e. dif fe ren ces be tween mea su red and es ti ma ted va lues in ana lysed san dsto ne re ser voir.
It is clear ly seen that su ch dif fe ren ces mos tly nowhe re reac hed ± 2% of po ro si ty, which ma kes the de fau lt re si dual map (Fi gu re 10) com ple te ly ac cep tab le for eva lua tion of the mo st sen si ti ve areas for in ter po la tion. The sou th-wes te rn mar gin of the fi e ld is su ch an area, (Fi gu re 10, re si dual va lue >13%), pre vious ly des cri bed as an area whe re kri gi ng de fi ned the mo st un de res ti ma ted and ove res ti ma ted va lues. Al so, the hi gh ne ga ti ve re si dual (< –8%) is map ped at the sa me cor ner of the fi e ld.
7. CONCLUSIONS
The es ti ma tio ns for re ser voir »T«, (1st san dsto ne se ries of Lower Pon tian age) in the Kloš tar fi e ld, are shown on the ma ps and by the cro ss-va li da tion re sul ts. Four in ter po la tion met ho ds we re used – in ver se dis tan ce weig hti ng, nea re st neig-hbour hood, mo vi ng ave ra ge and kri gi ng. The num ber of we ll (da ta) was 20. It is con si dered as the mi ni mum da ta in san dsto-nes for the mo del li ng of an in put da ta set by an om ni di rec tio-nal va riog ram. This va riog ram mo del is plan ned to im pro ve when the num ber of in pu ts rea ch 30 va lues (in 2008).
The qua li ty of po ro si ty in ter po la tion can be eva lua ted ba sed on two cri te ria. The fi r st, grap hi cal one, in clu des the geo lo gi cal des crip tion of iso po ro si ty li ne sha pes, and al so takes in to con si de ra tion all avai lab le ma ps in ter po la ted unof-fi cial ly ear lier by ha nd. The se co nd, nu me ri cal cri te rion rep re-
sen ts the es ti ma tion of in ter pre ta tion qua li ty wi th re gar ds to the amou nt of mean squa re er ror (MSE). The com pa ri son of MSE can exac tly de ter mi ne how a par ti cu lar met hod is mo re suc ces sful in re pea ted es ti ma tion at exis ti ng lo ca tio ns. In this ana lysis the lowe st MSE was ac com pa nied by kri gi ng (366.93), and the hig he st by the nea re st neig hbour hood met hod (389.00). The fi nal de ci sion was ma de usi ng bo th cri te ria.
Mo reo ver, the two met ho ds des cri bed as exa ct in ter po la-to rs (kri gi ng and in ver se dis tan ce weig hti ng) are se lec ted as the mo st ap prop ria te for po ro si ty map pi ng in the ana lysed re ser voi rs. In ad di tion, their com pa ri son is fol lowed by poi nt-er ror da ta ana lyses, im pro vi ng the »clas si cal« MSE cal cu la-tion. The poi nt-er ror (or re si dual) ma ps re veal the areas whe re es ti ma tion can be des cri bed as mo re at ri sk of bei ng mode ra-te ly sub dued by met hod er ror. The se areas are the sou th-wes te rn mar gin of the fi e ld and one of the we lls lo ca ted in the nor th–we st.
The re is a gene ral expec ta tion that geos ta tis ti cal met ho ds (li ke kri gi ng) always lead to bet ter ma ps than mat he ma ti cal ly sim pler met ho ds. The ob tai ned re sul ts con fi rm su ch an assum-ption and, ba sed on es ti ma tion qua li ty, the mo st ap prop ria te met hod was kri gi ng, fol lowed by in ver se distan ce weig hti ng. The ot her two met ho ds (nea re st neig hbour hood and mo vi ng ave ra ge) did not pro du ce ac cep tab le re sul ts, mos tly be cau se they are not exa ct in ter po la to rs. The mo vi ng ave ra ge pa ra me-ter, ra dii of sear chi ng cir cle, was adap ted, but re sul ts we re not im pro ved. It re mains ju st a mat rix smoot hi ng tool. The nea re st neig hbour hood re sul ts we re ref lec ted throu gh zo nes that can not be con si de red as a geo lo gi cal ly ac cep tab le map, but on ly a sche ma tic view of po ro si ty dis tri bu tion ac cep tab le for qui ck in sig ht.
ACKNOWLEDGEMENT
This wo rk rep re sen ts pa rt of the Dip lo ma the sis of Mr. Da vo rin Balić, su per vi sed by Prof. Jo si pa Velić and Dr. To mis lav Malvić. This the sis was pa rt of a mul ti dis cip li na ry geos ta tis ti cal re sear ch pro je ct that was per for med in 2007 wit hin the pro jec ts en tit led:
– »Stra tig rap hi cal and geo mat he ma ti cal re sear ches of pet ro-leum geo lo gi cal syste ms in Croa tia« (pro je ct no. 195-1951293-0237), fi nan ced by the Mi nis try of Scien ce, Edu ca-tion and Spor ts of the Re pub lic of Croa tia;
– »Impro ve men ts of geo lo gi cal in ter pre ta tion met ho ds wi th pur po se of re co ve ry in crea si ng in san dsto ne re ser voi rs«, fi nan-ced by INA – Oil com pa ny Plc.
We wou ld li ke to tha nk to. Ma rio Weis ser M.Sc, di rec tor of Re ser voir En gi nee ri ng and Fie ld De ve lop me nt De par tme nt (as a pa rt of INA – Oil In dus try Plc.) for per mis sion to pre pa re da ta from the ar chi ve of the De par tme nt for re sear chi ng and pub li sh re sul ts in the Dip lo ma the sis.
Of cour se, than ks to our re viewe rs who of fered a lot of ve ry use ful sug ges tio ns and hig hly im pro ved this pa per. Prof. Bru no Saftić (from Uni ver si ty of Zag reb) helped us to exte nd the stra tig rap hic re view of the wi der area of the Kloš tar fi e ld. Prof. János Gei ger (from Uni ver si ty of Sze ged) hig hly im pro ved the con clu sio ns about the exa ct in ter po la to rs and in di ca ted the ne ces si ty of ap plying poi nt-er ror ana lysis.
Fi gu re 10: Re si dua ls cal cu la ted for par ti cu lar wel ls
04 balic.indd 3404 balic.indd 34 24.6.2008 11:08:3524.6.2008 11:08:35

Geologia Croatica35
Da vo rin Balić et al.: Se lec tion of the mo st ap prop ria te in ter po la tion met hod for san dsto ne re ser voi rs in the Kloš tar oil and gas fi e ld
8. REFERENCES
AKSIN, V. (1967): Geo lo gi ja naf te. – Dnev nik, 800 p.CVETKOVIĆ, M. (2007). Naf tno geo loš ka prim je na neu ron skih mre ža
na prim je ru le žiš ta po lja Kloš tar [Pet ro leum geo lo gy use of neu ral ne twor ks on the exam ple of re ser voir in Kloš tar fi e ld – in Croa tian]. – Un pub lis hed Gra dua te the sis, Fa cul ty of Mi ni ng, Geo lo gy and Pet ro leum En gi nee ri ng, Uni ver si ty of Zag reb, 49 p.
DAVIS, B. (1987): Uses and Abu ses of Cro ss Va li da tion in Geos ta tis ti cs. – Mat he ma ti cal Geo lo gy, 19/3, 241–248.
HERNITZ, Z., BOKOR, N. & MALVIĆ, T. (2001): Geos ta tis ti cal mo de-li ng of pet rop hysi cal da ta of oil fi el ds in the Nor the rn Croa tia. – EAGE, 63rd Con fe ren ce & Tec hni cal Exhi bi tion, Ju ne 11–15 2001, Am ster dam, Ab stra ct no. P611, 4p.
HOHN, M.E. (1988): Geos ta tis ti cs and Pet ro leum Geo lo gy. – Van Nos-tra nd Rein ho ld, 264 p.
ISAAKS, E. & SRIVASTAVA, R. (1989): An In tro duc tion to Ap plied Geos ta tis ti cs. – Oxfo rd Uni ver si ty Pre ss Inc., 580 p.
JENSEN, J.L., LAKE, L.W., CORBETT, P.W.M. & GOGGIN, D.J. (1997): Sta tis ti cs for Pet ro leum En gi nee rs and Geos cien tis ts. – Pren-ti ce Ha ll PTR, 390 p.
JOURNEL, A.G. & HUIJBREGTS, C.J. (1978): Mi ni ng Geos ta tis ti cs. – Aca de mic Pre ss, 600 p.
JÜTTNER, I., SAFTIĆ, B. & VELIĆ, J. (2001): Dis tri bu tion of Po ro si ty and Per mea bi li ty wit hin the Pon tian San dsto nes in the Wes te rn Pa rt of Sa va Dep res sion in Re la tion to their Stra tig rap hic Ar chi te cture and Pa laeo tec tonic Re la tio ns. – In: HERNITZ, Z. & SEČEN, J. (e ds.): Spe cial issue of Naf ta jour nal dedi ca ted to 2nd In ter na tio nal Sympo sium on Pet ro leum Geo lo gy he ld in 22–24 Ap ril 1999, Zag-reb, Croa tia, 139–144.
KRIGE, D.G. (1951): A Sta tis ti cal Ap proa ch to So me Ba sic Mi ne Va lua-tion Prob le ms on the Wi twa ter sra nd. – Jour nal of the Che mi cal, Me-tal lur gi cal and Mi ni ng So cie ty of Sou th Af ri ca, 52, 119–139.
MALVIĆ, T. (2003): One-di men sio nal va riog ram and sta tis ti cal ana lysis in re ser voir uni ts of the Bje lo var sag, Croa tia. – Naf ta, 54/7–8, 267–274.
MALVIĆ, T. (2005): Resul ts of geos ta tis ti cal po ro si ty map pi ng in Wes te rn Dra va Dep res sion fi el ds (Mol ve, Ka li no vac, Sta ri Gra dac). – Naf ta, 56/12, 465–476.
MALVIĆ, T. & ĐUREKOVIĆ, M. (2003): Ap pli ca tion of met ho ds: In ver-se dis tan ce weig hti ng, or di na ry kri gi ng and col lo ca ted cok ri gi ng in po ro si ty eva lua tion, and com pa ri son of re sul ts of the Be ni čan ci and Sta ri Gra dac fi el ds in Croa tia. – Naf ta, 54/9, 331–340.
PAMIĆ, J., KRKALO, E. & PROHIĆ., E. (1984): Granitne stijene sjeverozapadnog dijela Moslavačke gore u sjevernoj Hrvatskoj [Granite rocks of the north-western part of Moslavačka Mt. in the northern Croatia – in Croatian]. – Geologija, 27, 201–212.
PLETIKAPIĆ, Ž. (1969): Stratigrafi ja, paleogeografi ja i naftoplinonos-nost Ivanić-Grad formacije na obodu Moslavačkog masiva [Stratig-raphy, palaeogeography and oil and gas potential of the formation Ivanić-Grad at the margin of Moslavina massive – in Croatian]. – Faculty of Mining, Geology and Petroleum Engineering, Univer-sity of Zagreb, 71 p.
SAFTIĆ, B. (1998): Genetska stratigrafska sekvencijska analiza u pontskim naslagama zapadnoga dijela Savske depresije [Genetic stratigraphic sequential analysis in sediments of Pontian sediments of the western part of the Sava depression – in Croatian]. – Unpub-lished PhD Thesis, Faculty of Mining, Geology and Petroleum En-gineering, University of Zagreb, 136 p.
SAFTIĆ, B., PEH, Z., VELIĆ, J. & JÜTTNER, I. (2001): Interdepend-ence of Petrophysical Properties and Depth: Some Implications of Multivariate Solution on Distinction Between the Lower Pontian Hydrocarbon-bearing Sandstone Units in the Western Part of the Sava Depression. – Geol. Croatica, 54/2, 259–277.
VELIĆ, J. (1979): O razlikovanju neotektonskih struktura u zapadnom dijelu Savske depresije [About distinguishing of neotectonic struc-tures in the western part of the Sava depression – in Croatian]. – Geol. vjesnik, 31, 175–183.
VELIĆ, J. (1980): Geološka građa zapadnog dijela Savske depresije [Ge-ological settings of the western part of the Sava depression– in Croatian]. – Unpublished PhD Thesis, Faculty of Mining, Geology and Petroleum Engineering, University of Zagreb, 137 p.
VELIĆ, J. (1983): Neotektonski odnosi i razvitak zapadnog dijela Savske potoline [Neotectonic relations and evolution of the western part of the Sava depression – in Croatian]. – Acta geologica, 13/2, 26–65.
VELIĆ, J. & SAFTIĆ, B. (2000): Hydrocarbons in Croatia. – Vijesti Hr-vatskoga geološkog društva, 37/2, 42–43.
VRAGOVIĆ, M. & MAJER, V. (1980): Prilozi za poznavanje metamor-fnih stijena Zagrebačke gore, Moslavačke gore i Papuka (Hrvatska) [Contributions for knowing of metamorphic rocks of the Zagreb Mt. – in Croatian]. – Geol. vjesnik, 31, 295–308.
Manuscript received October 1, 2007.Revised manuscipt accepted January 18, 2008.
04 balic.indd 3504 balic.indd 35 24.6.2008 11:08:3724.6.2008 11:08:37

04 balic.indd 3604 balic.indd 36 24.6.2008 11:08:3724.6.2008 11:08:37