GEOHYDROLOGY AND POSSIBLE TRANSPORT … · Sediment transport 35 ... Map showing locations of...
54
GEOHYDROLOGY AND POSSIBLE TRANSPORT ROUTES OF POLYCHLORINATED BIPHENYLS IN HAIKU VALLEY, OAHU, HAWAII By Scot K. Izuka, Barry R. Hill, Patricia J. Shade, and Gordon W. Tribble U.S. GEOLOGICAL SURVEY Water-Resources Investigations Report 92-4168 Prepared in cooperation with the U.S. COASTGUARD, CIVIL ENGINEERING UNIT, HONOLULU, HAWAII Honolulu, Hawaii 1993
Transcript of GEOHYDROLOGY AND POSSIBLE TRANSPORT … · Sediment transport 35 ... Map showing locations of...

GEOHYDROLOGY AND POSSIBLE TRANSPORT ROUTES OF POLYCHLORINATED
BIPHENYLS IN HAIKU VALLEY, OAHU, HAWAII
By Scot K. Izuka, Barry R. Hill, Patricia J. Shade, and Gordon W. Tribble
U.S. GEOLOGICAL SURVEY Water-Resources Investigations Report 92-4168
Prepared in cooperation with the U.S. COASTGUARD, CIVIL ENGINEERING UNIT, HONOLULU, HAWAII
Honolulu, Hawaii 1993

U.S. DEPARTMENT OF THE INTERIOR BRUCE BABBITT, Secretary
U.S. GEOLOGICAL SURVEY Dallas L. Peck, Director
For additional information Copies of this reportwrite to: may be purchased from:
District Chief U.S. Geological SurveyU.S. Geological Survey Books and Open-File Reports Section677 Ala Moana Blvd., Suite 415 Federal Center, Box 25425Honolulu, HI 96813 Denver, CO 80225

CONTENTS
Abstract 1 Introduction 3
Purpose and scope 4Acknowledgments 4
Description of study area 4 Geology 7
Geologic methods 7Regional geologic setting 10Geologic units in Haiku Valley 10
Koolau Basalt 10 Colluvium and alluvium 12 Honolulu Volcanics 14
Areal distribution of rock units 15Geologic structure 15Hydrologic significance of geology 17
Exchange between ground water and surface water 20Methods of analysis 20Hydrographs and flow-duration curves for stream-gaging station 16275000 20Seepage characteristics of Heeia Stream 23
Estimate of ground-water recharge 28Water-balance computation 28Implications of recharge estimates on ground-water movement 30
Sediment transport 35Methods of sediment-transport study 35Reconnaissance of stream material, Heeia Stream, October and November, 1991 37Suspended-sediment transport at stream-gaging station 16275000 38
Transport of polychlorinated biphenyls (PCBs) 39Methods of PCB analysis 40PCBs in Heeia Stream 40PCBs in ground water 43
Summary and conclusions 44 References cited 45
111

ILLUSTRATIONS
1-2. Maps showing:1. Location of Haiku Valley, Oahu, Hawaii 22. Location of Omega Station, area of possible
PCB contamination, and study area 53. Schematic block diagram of Haiku Valley and neighboring valleys 6 4-5. Maps showing:
4. Geology of Haiku Valley 85. Principal regional geologic features of Oahu 11
6. Generalized geologic section showing relations among dikes, sediments, volcanic deposits, and basalt 13
7. Diagram showing geologic log and constructiondetails of well 2450-2 16
8-9. Geologic sections:8. Across Haiku Valley 189. Through axis of Haiku Valley 19
10-11. Graphs showing:10. Rainfall at Haiku rain gage and discharge at
station 16275000 2111. Flow-duration curves of daily mean discharge 22
12. Map showing locations of seepage-run sites 25 13-14. Graphs showing:
13. Discharge/distance relations for seepage runs 2614. Discharge/distance relations of past seepage runs
compared with seepage runs made for this study 2715. Diagram showing account of recharge; effects of geologic structure not considered 3216. Map showing partial recharge for dike compartment from which
Haiku water tunnel draws water 3317. Diagram showing account of recharge; effects of geologic structure are considered 3418. Map showing characteristics of channel-bottom sediment 3619. Graph showing relations between PCB and suspended-
sediment concentrations 41
IV

TABLES
1. Discharge of Heeia Stream measured on specified seepage run dates in 1991 242. Monthly water balance for drainage basin gaged at station 16275000 313. Monthly water balance for dike recharge area within the drainage
basin gaged at station 16275000 314. Annual streamflow and suspended-sediment loads in Heeia Stream
at station 16275000, water years 1988-91 345. Percentages of fine particles in suspended-sediment samples from Heeia Stream
at station 16275000, water years 1988-91 396. Suspended sediment and total PCB concentrations in water collected from
Heeia Stream at station 16275000, November and December, 1991 417. PCB concentrations of composite suspended-sediment samples from
Heeia Stream at station 16275000, water years 1990-92 42

CONVERSION FACTORS, ABBREVIATIONS, AND VERTICAL DATUM
Multiply
acre-foot (acre-ft)foot (ft)cubic foot (ft3)cubic foot per second (ft3/s)square foot (ft2)gallon (gal)gallon per minute (gal/min)million gallons (Mgal)million gallons per day (Mgal/d)inch (in.)inch per year (in/yr)mile, statute (mi)square mile (mi2)ton
By
1,2330.30480.028320.028320.092943.7850.06308
3,7850.04381
25.42.541.6092.5900.9072
To obtain
cubic metermetercubic metercubic meter per secondsquare meterlitercubic decimeter per minutecubic metercubic meter per secondmillimetercentimeter per yearkilometersquare kilometermegagram
Other useful conversionsIft3/s = 448.8 gal/min Ift3/s = 0.6463 Mgal/d
Temperature is given in degrees Celsius (°C), which can be converted to degrees Fahrenheit (°F) by using the equation:
1.8 x °C + 32 = F°
Abbreviations used in water-quality descriptionsmg = milligram l^g/kg = microgram per kilogram mg/kg = milligram per kilogram jo,g/L = microgram per liter mg/L = milligram per liter
Vertical datumAll elevations in this report are referenced relative to mean sea level.
VI

GEOHYDROLOGY AND POSSIBLE TRANSPORT ROUTES OF
POLYCHLORINATED BIPHENYLS IN HAIKU VALLEY,
OAHU, HAWAII
By Scot K. Izuka, Barry R. Hill, Patricia J. Shade, and Gordon W. Tribble
ABSTRACTA combination of geologic mapping, seepage runs, water-budget computation, analysis of
stream-gaging records, study of stream sediment, and measurement of polychlorinated biphenyls (PCBs) was used to investigate the geohydrology and possible routes of PCB transport from areas of possible contamination in the U.S. Coast Guard's Omega Station in Haiku Valley, Oahu, Hawaii. The PCBs were a contaminant in fuel that was sprayed on vegetation and ignited during defoliation efforts at the Omega Station.
Haiku Valley is a stream valley eroded into a thick section of dike-intruded, highly permeable lava flows. The valley is partly filled with alluvium, pyroclastics and massive lava flows. A shallow aquifer system is formed by a permeable unit of pyroclastics which is bounded below by less permeable alluvium, massive lava flows, and weathered basalt. A deeper aquifer system is present in the dike-intruded lava flows. Much of the area of suspected PCB- contaminated fuel application in Haiku Valley is situated on the geologic unit that forms the shallow aquifer.
A water budget calculated for the drainage area of a stream-gaging station (16275000) at the downgradient boundary of the Omega Station indicates that the shallow and deep aquifers receive recharge of 5.1 cubic feet per second from the 0.98 square-mile drainage area; approximately 10 percent of the drainage area is suspected to have been contaminated by PCBs. Approximately 4 cubic feet per second of water is withdrawn from the aquifers by a well and a water tunnel in the valley, but the geology of the area indicates that some of the water withdrawn by the tunnel also comes from recharge beyond the surface-water divides of Haiku Valley. Base flow to the stream is about 1.2 cubic feet per second.
A water-balance calculation between recharge, well and tunnel withdrawals, and stream base flow, indicates that 1.0 cubic feet per second or more of the water recharging the drainage area may travel through the subsurface and discharge downstream beyond the limits of the Omega Station. Mass-balance calculations indicate that the concentration of PCBs that dissolves in the ground-water as it infiltrates contaminated areas will be on the order of 10-7 micrograms per liter, but these calculations are based on a number of assumptions where data are lacking.
Analysis of sediment from Heeia Stream indicates that the sediment is transporting PCBs past station 16275000. Although PCB concentrations in unfiltered stream water samples collected at the station were below detection limits of 0.1 micrograms per liter, PCB concentrations ranged from 64 to 230 micrograms per kilogram in suspended sediment extracted from stream water. Because most of the suspended sediment in Heeia Stream is deposited in a wetland near the coast, the potential for PCB accumulation is greatest in the wetland.

21
°45
'15
8*
21°3
0' -
______157°4
5'
I
PA
CIF
IC
OC
EA
N
Are
a en
larg
ed i
n fig
ure
2
HA
IKU
VA
LLE
Y
STU
DY
AR
EA
Figu
re 1
. Lo
catio
n of
Hai
ku V
alle
y, O
ahu,
Haw
aii.

INTRODUCTIONBetween about 1973 and 1983, jet fuel and gasoline from an underground storage tank
were used to burn vegetation at the U.S. Coast Guard (Coast Guard) Omega Station (a low- frequency radio-transmission facility) in Haiku Valley, Oahu, Hawaii (fig. 1). In 1986, analysis of the residual fuel from the tank revealed the presence of polychlorinated biphenyls (PCBs) at a concentration of 5,800 \ig/L of fuel (Jay Silberman, U.S. Coast Guard, written commun., 1991).
Incomplete combustion of PCBs may produce dioxins and furans (Bretthauer and others, 1991). Some forms of dioxins and furans may be more toxic than PCBs. In October, 1989, shallow soil samples were collected from areas suspected to have been defoliated by burning. Concentrations of PCB as high as 1,700 M-g/kg, polychlorinated dibenzo-p-dioxins (dioxins) as high as 635 |Lig/kg, and polychlorinated dibenzofurans (furans) as high as 61.5 M-g/kg, were detected in some of these soil samples (Woodward-Clyde Consultants, 199la). The presence of dioxins and furans indicates that incomplete combustion of PCBs may have occurred. The Coast Guard is continuing to investigate and assess risks associated with contamination at the site.
PCBs were also found at a concentration of 230 jug/kg in stream sediment collected approximately 0.5 mi downstream from the Omega Station in January, 1989. Water samples collected from a nearby well (Honolulu Board of Water Supply Well 2450-2) in January, 1991 showed no detectable PCBs, dioxins, or furans (Woodward-Clyde Consultants, 199Ib).
The tank from which the fuel was drawn had a capacity of 25,000 gal. As much as 210 gal of fuel was sprayed on vegetation and burned once or twice annually between 1973 and 1983. Because no records of the burning were kept, it is not known precisely how much fuel was burned (Woodward-Clyde Consultants, 1991a).
The origin of the PCBs in the tank is also unknown. Until their manufacture was banned in the United States in 1979, PCBs were commonly used as a dielectric in transformers, capacitors, and cables (Smith and others, 1987). PCBs were also added to other chemicals as a plasticizer and flame retardant and as a coating for metal castings (Sittig, 1985), but were not normally additives to fuel. In addition to PCBs, the residual fuel from the tank also contained trichloroethane as well as the common fuel constituents benzene, toluene, and xylene.
Some forms of PCBs, dioxins, and furans are considered to be extremely toxic and are probable human carcinogens (Sittig, 1985). They have a tendency to attach to organic carbon in soils (National Research Council, 1979). Because of their adsorption tendencies, PCBs tend to have low dissolved concentrations in water, but the chemical may be concentrated by bioaccumulation (Smith and others, 1987). The tendency for adsorption to solids also allows the transport of PCBs by suspended sediment and organic detritus in streams.
The Coast Guard, which operates the Omega Station, expressed concern that the PCBs and other chemicals could be transported to ground water or downstream to wetlands and residential areas. The U.S. Geological Survey (USGS), in cooperation with the Coast Guard, undertook this study to investigate possible contaminant-transport routes through ground-water and surface- water systems. Because of the tendency of PCBs to attach to soil and sediment, and the tendency of PCBs to bioaccumulate from very low dissolved concentrations in water, both the movement of ground water and surface water as well as the transport of sediment by surface water must be considered to fully investigate possible transport routes.

Purpose and ScopeThis report discusses geohydrologic evidence of ground-water and surface-water movement
and sediment transport in an effort to identify routes by which water-borne contaminants may be transported within and beyond Haiku Valley. Specifically, this report describes the geologic framework of the valley and the bearing it has on the movement of ground water, the water budget of the Haiku Valley basin, the exchange between ground water and surface water, and the movement of sediment by surface water. The concentration of PCBs carried in suspended stream sediment is also described.
The study area of this report includes the entire floor of Haiku Valley, as well as areas near the course of Heeia Stream from Haiku Valley to Kaneohe Bay (fig. 2). The objectives of this study were met by a combination of field data collection and computational analyses including (1) detailed surface geologic mapping, (2) seepage runs, (3) computation of a water budget, (4) analysis of long-term hydrologic data from the USGS gaging station on Heeia Stream, (5) monitoring of sediment carried by the stream, (6) a reconnaissance of stream-bed material, and (7) analysis of PCB concentrations in stream water and sediment.
AcknowledgmentsMost of the sediment-transport data used in the analyses described here were a product of
research funded by the Hawaii State Department of Transportation. Logs of the H-3 tunnel, foundation borings, and the geologic map of the Haiku construction access road were also provided by the Hawaii State Department of Transportation. Drilling logs, field notes, and withdrawal records of the Haiku water tunnel and well 2450-2 were provided by the Honolulu Board of Water Supply. Rainfall records for the Lower Luakaha station were provided by the Hawaii State Department of Land and Natural Resources and the Honolulu Board of Water Supply.
DESCRIPTION OF STUDY AREAHaiku Valley is a stream-eroded, amphitheater-headed valley on the windward side of the
Koolau Range (fig. 3). Erosion has progressed to the stage where the windward flank of the Koolau Range consists of scalloped cliffs formed by the coalescence of adjacent valleys. Ridges between valleys have been eroded back and partly buried by sediments. The remaining cliffs and ridges rise abruptly from alluviated valley floors and coastal lowlands.
The axis of Haiku Valley trends eastward and extends approximately 1 mi from the crest of the Koolau Range to the ends of the ridges that bound the valley laterally. Orographic rainfall is frequent on the windward side of the Koolau Range. Haiku Valley receives an average of about 100 inches of rain per year (Giambelluca and others, 1986). Vegetation, ranging from short grass in areas maintained by the Coast Guard, to dense tropical forests, covers most of the valley floor. The valley is drained by Heeia Stream, which follows a 3.5 mi course through eroded hills and wetlands before discharging into Kaneohe Bay and the Pacific Ocean. Ground-water discharge to the stream maintains a perennial flow (Takasaki and others, 1969).
In 1944 the U.S. Navy constructed a low-frequency radio station in the valley. The Coast Guard has operated and maintained the station since 1973. A water tunnel was constructed near the headwaters of Heeia Stream in 1940 (Haiku water tunnel, Honolulu Board of Water Supply well 2450-1) and a well was drilled nearby in 1981 (Honolulu Board of Water Supply well 2450- 2). Both of these ground-water sources are currently in use. In 1989, construction began on a new freeway, including a four-lane viaduct and traffic tunnels, in Haiku Valley. At the time of

157°50' 157°49'
'^Si^V, rXT^-^UtP *tfa/^ /c< r laisra*
AREA OF POSSIBLE PCB
CONTAMINATION
STREAM Dotted where intermittent
solid where perennial
BOUNDARY OF STUDY AREA
Mr/Svl^ySf'**!JN X' h^^^f?-^
Base from U.S. Geological Survey 1:24.000 Kaneohe, 1983
Figure 2. Haiku Valley and study area.
5

HA
iKU
VA
LL
EY
EX
PLA
NA
TIO
N
AR
EA
CO
VE
RE
D
BY
TH
E O
CE
AN
MA
RIN
E S
ED
IME
NT
S
BA
SA
LT L
AVA
FL
OW
S
App
roxi
mat
e sc
ale1
MIL
Ej
Figu
re 3
. S
chem
atic
blo
ck d
iagr
am o
f H
aiku
Val
ley
and
neig
hbor
ing
valle
ys.

this investigation (October 1991 to February 1992), construction of the freeway (called the H-3) was fully underway.
The USGS currently operates a streamflow-gaging, water-quality, and sediment-sampling station (16275000) on Heeia Stream, near the entrance to the Omega Station (fig. 2). The gaging station is equipped to record stream stage, which is used to compute streamflow, at regular intervals. Samples of suspended sediment are collected automatically when stream stage is above 1.8 ft (about 23.50 ft3/s). The USGS water-resources annual data report publishes records of station 16275000 under the name "Haiku Stream near Heeia," which is consistent with names on older topographic maps, but the most recently published USGS topographic map (Kaneohe 7.5 minute quadrangle, 1983) shows the entire length of the stream draining Haiku Valley as "Heeia Stream." The stream will be referred to as "Heeia Stream" throughout this report; the station will be referred to by its USGS number, 16275000.
GEOLOGYThe only geologic maps of Haiku Valley published before this study are those by Stearns
(1939) and the State of Hawaii, Department of Transportation (1990). Steams' (1939) geologic map, which was published at a scale of 1:62,500, provides good regional information but does not provide the level of detail required for this study. Stearns' mapping relied on natural exposures of rock in the heavily vegetated valley; most of the geologic detail is in the stream channels.
In the years since Steams' geologic mapping, more geology has become exposed as part of highway construction and activities of the U.S. Navy and Coast Guard in the valley. Additional subsurface geologic information is available from foundation borings, wells, and tunnels. The State of Hawaii, Department of Transportation (1990) compiled a geologic log of an exploratory tunnel driven into the Koolau Range from Haiku Valley and a geologic map of the exposures along the construction access road for the H-3 tunnel. The map provides important geologic information along the base of the southern valley wall.
Geologic MethodsThe geology of Haiku Valley was mapped during October through December, 1991, in the
area shown in figure 4. Locations of rock outcrops were plotted on aerial photographs (taken in 1989) and transferred to a l:12,000-scale topographic base map, enlarged from the USGS 1:24,000-scale, 7.5-rninute Kaneohe quadrangle (1983). Lithologic descriptions and stratigraphic relationships for each outcrop were also recorded and transferred to the base map to produce the geologic map. Heavy vegetation in Haiku Valley presented a problem in precisely locating contacts between rock units, but a sufficient number of rock outcrops were found along road cuts and other excavations for freeway construction, stream channels, trenches for underground cables, and landslide scars to permit mapping of the areal distribution of rocks and infer locations of contacts.
Information from the geologic field mapping was supplemented by data from foundation borings for the H-3 freeway and logs of the Haiku water tunnel and well. Geology from the maps of Stearns (1939) and State of Hawaii, Department of Transportation (1990) were incorporated into the geologic map produced for this study.

157°49'45" 157°49'30 157°49'15'
Topographic base enlarged from U.S. Geological Survey 1:24,000, 7.5 minute Kaneohe quadrangle, 1983
Figure 4. Geologic map of Haiku Valley.
EXPLANATION
DC<
DC LU
§ o
YOUNGER ALLUVIUM (Holocene) - Poorly sorted, unconsolidated gravel in modern stream channel.
HONOLULU VOLCANICS, PYROCLASTICS (Pleistocene) - Poorly consolidated basaltic ash and cinder, moderately weathered. Interbedded with Qoa.
HONOLULU VOLCANICS, LAVA FLOWS (Pleistocene) - Sparsely vesicular, massive, feldspathoid-bearing basaltic lava flows. Interbedded with Qoa
OLDER ALLUVIUM AND COLLUVIUM (Pleistocene - Holocene) - Poorly sorted, poorly consolidated gravel and conglomerate, highly weathered. Interbedded with Qhp and Qhl.
UNCONFORMITY
LU
KOOLAU BASALT (Pliocene) - Thin (most less than 10 feet thick), basaltic aa and pahoehoe lava flows, commonly intruded by dikes.
CONTACT - Dashed where approximately located
A 1 LINE OF GEOLOGIC SECTION
2,000 FEET
500 METERS
Contour interval 40 feet Datum is sea level
Figure 4. Geologic map of Haiku Valley.

Regional Geologic SettingOahu is the third largest of the Hawaiian Islands, a chain of islands in the tropical-
subtropical, central North Pacific. The island chain was built on the westward-moving Pacific lithospheric plate by hot-spot volcanism (Clague and Dalrymple, 1987). This volcanism is characterized by voluminous, mildly explosive eruptions of highly fluid magma. The eruptions build large, broad, dome-shaped shield volcanoes by the accumulation of thousands of thin lava flows.
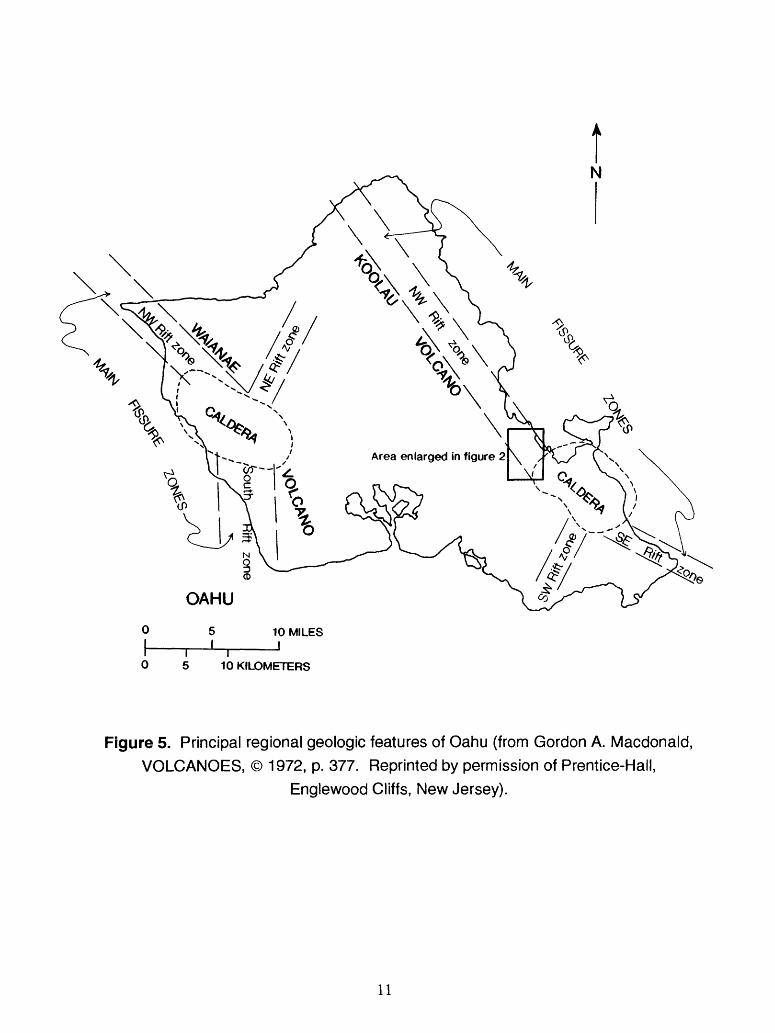
Haiku Valley is eroded into the northeastern flank of the Koolau Range, the remnant of the younger of two large shield volcanoes that compose the island of Oahu (fig. 5). The Koolau Volcano probably had a caldera near its summit and rift zones radiating from the summit, as is typical of shield volcanoes in Hawaii (Stearns and Vaksvik, 1935). The distribution of volcanic dikes, hydromagmatic alteration, volcanic breccias, and a positive gravity anomaly indicate that the center of the caldera was located 5 mi to the east of Haiku Valley, and a major rift zone extended from the caldera northwestward approximately parallel to the present axis of the Koolau Range (Walker, 1987). Most of the lava flows that build shield volcanoes originate from the caldera or along rift zones. The lava flows are characterized by high original and fracture porosity, making these rocks among the most productive aquifers on Oahu (Wentworth, 1938, 1942, 1951; Stearns and Vaksvik, 1935; Visher and Mink, 1969).
Volcanic dikes cut across the gently dipping flows of the shield volcano. The dikes have a nearly vertical orientation but sometimes cut across each other. Along the former rift zone of the Koolau Volcano, dikes are numerous but their abundance drops off sharply in the lateral margins of the rift zone (Stearns and Vaksvik, 1935; Takasaki and Mink, 1985). The upper reaches of Haiku Valley are situated in the marginal dike zone, where dikes are few (Takasaki and Mink, 1985).
Shield-building eruptions of the Koolau Volcano ended about 1.8 million years ago (Doell and Dalrymple, 1973). The original dome-like form of the shield volcano was subsequently modified by erosion and subsidence to give rise to the present elongate ridge known as the Koolau Range. Sediments eroded from the mountain range were deposited in the valleys and along the coast. Following a hiatus in volcanic activity of about 1 million years, eruptions resumed along new rifts transverse to the former rift zones of the Koolau Volcano (Macdonald and others, 1983). Several valleys, including Haiku Valley, were thus partially filled by lava flows, cinder, and ash (Stearns and Vaksvik, 1935).
Geologic Units in Haiku ValleyFour geologic units were mapped in Haiku Valley: (1) the Koolau Basalt of Tertiary age,
(2) Quaternary colluvium and older alluvium, (3) the Pleistocene Honolulu Volcanics, and (4) Quaternary younger alluvium. The stratigraphic nomenclature used in this report for the volcanic units is consistent with that proposed by Langenheim and Clague (1987). The names of sedimentary units as described below and used throughout this report are similar to names originated by Stearns and Vaksvik (1935) and Wentworth (1951), but modified to fit the hydrologic objectives of this report.
Koolau Basalt.- The oldest unit exposed in the valley is the Tertiary Koolau Basalt which are the basalts of the Koolau shield volcano (Stearns, 1939). The Koolau Basalt constitutes the basement rock on which all alluvium, colluvium, and Quaternary pyroclastics were deposited. The tholeiitic basalt lava flows of the Koolau Basalt exposed in Haiku Valley dip southwestward at an angle of about 7° (State of Hawaii, Department of Transportation, 1990). The flows are
10
tN
Area enlarged in figure 2
OAHU
5 10 MILES J__ I
i r5 10 KILOMETERS
Figure 5. Principal regional geologic features of Oahu (from Gordon A. Macdonald, VOLCANOES, © 1972, p. 377. Reprinted by permission of Prentice-Hall,
Englewood Cliffs, New Jersey).
11

stacked in a succession that is probably several thousands of feet thick (Macdonald and others, 1983). A 1,500 ft section of this formation is exposed in the steep walls of Haiku Valley.
Most of the lava flows of the Koolau Basalt are thin (about 10 ft) and include both aa and pahoehoe. Where fresh (unweathered), the basalt lava flows of the Koolau Basalt are gray to black, hard, jointed, and commonly contain phenocrysts of plagioclase and olivine. However, most of the exposures of the Koolau Basalt at the base of the walls and on the floor of Haiku Valley are so deeply weathered that none of their original mineralogy remains and the rock has acquired a soft, friable consistency. Well 2450-2 penetrated about 50 ft of weathered basalt below the alluvial valley fill.
The upper valley walls are difficult to access and therefore were not visited during this study, but it is apparent from the steep slope and dark color that most of the upper walls of the valley expose hard, slightly weathered lava flows. Because of their original hardness, the lava flows maintain the precipitous slopes characteristic of the walls of valleys on the windward side of the Koolau Range. The log of an exploratory tunnel for the H-3 freeway indicates that hard, moderately-weathered rock was encountered near the onset of tunneling (fig. 4), although some highly weathered rock was also present (State of Hawaii, Department of Transportation, 1990). Some outcrops of unweathered Koolau Basalt are exposed in roadcuts along the H-3 freeway construction access road at the base of the Haiku Valley walls, but most of the rock along this road is highly weathered.
The lava flows of the Koolau Basalt, particularly in the region of the study area, are probably cross-cut by many dikes, but few dikes are exposed in the study area (fig. 6). State of Hawaii, Department of Transportation (1990) found dikes in road cuts for the freeway construction access road, and dikes were penetrated by the Haiku water tunnel and the tunnels for the freeway, and many more probably remain buried beneath the alluvium and colluvium on the valley floor. The presence of dikes in Haiku Valley can also be inferred from the regional pattern of dike occurrence on the windward side of the Koolau Range. The lower half of Haiku Valley lies in an area mapped as the "Koolau dike complex" by Stearns (1939). Dikes are so numerous in this complex that an average of 100 to 200 dikes may be encountered on a horizontal traverse of 1 mi and may constitute over 10 percent of the total rock volume (Takasaki and Mink, 1985). The upper half of Haiku Valley lies in the "marginal dike zone" where fewer than 100 dikes are encountered per mile of horizontal traverse, and, in general, the dikes constitute less than 5 percent of the total rock volume (Takasaki and Mink, 1985). Walker (1987) placed the dike complex beyond Haiku Valley, farther northeast than shown in the maps by Stearns (1939) and Takasaki and Mink (1985). Whether Haiku Valley lies in the dike complex or in the marginal dike zone, the presence of dikes beneath the floor of the valley is almost certain.
Colluvium and Alluvium.-- Sedimentary deposits in Haiku Valley include clastic alluvial and colluvial gravels and conglomerate. Alluvium includes the sediments deposited by Heeia Stream, its tributaries, and their predecessors. Gravel in the present stream channel in Haiku Valley consists of loose boulders, cobbles, pebbles, and sand and only minor amounts of silt and clay, although fine sediment is deposited in the wetland near the coast (fig. 2). Alluvium that has been weathered or cemented exhibits the same grain-size distributions, clast-supported fabric, and roundness as alluvium in the modern stream channel, but permeability is greatly reduced by diagenesis (Stearns and Vaksvik, 1935; Wentworth, 1942).
Colluvium includes all deposits of mass wasting. Several processes fall under the category of mass wasting, and each process produces colluvium of different characteristics, but the
12
NORTHEAST
YOUNGER ALLUVIUM
MARINE SEDIMENTS
SOUTHWEST
HONOLULU VOLCANICS
OLDER ALLUVIUM
KOOLAU BASALT AND DIKES
Approximate scale
Discharge of ground water to stream
. Marginal dike zone . Dike complex
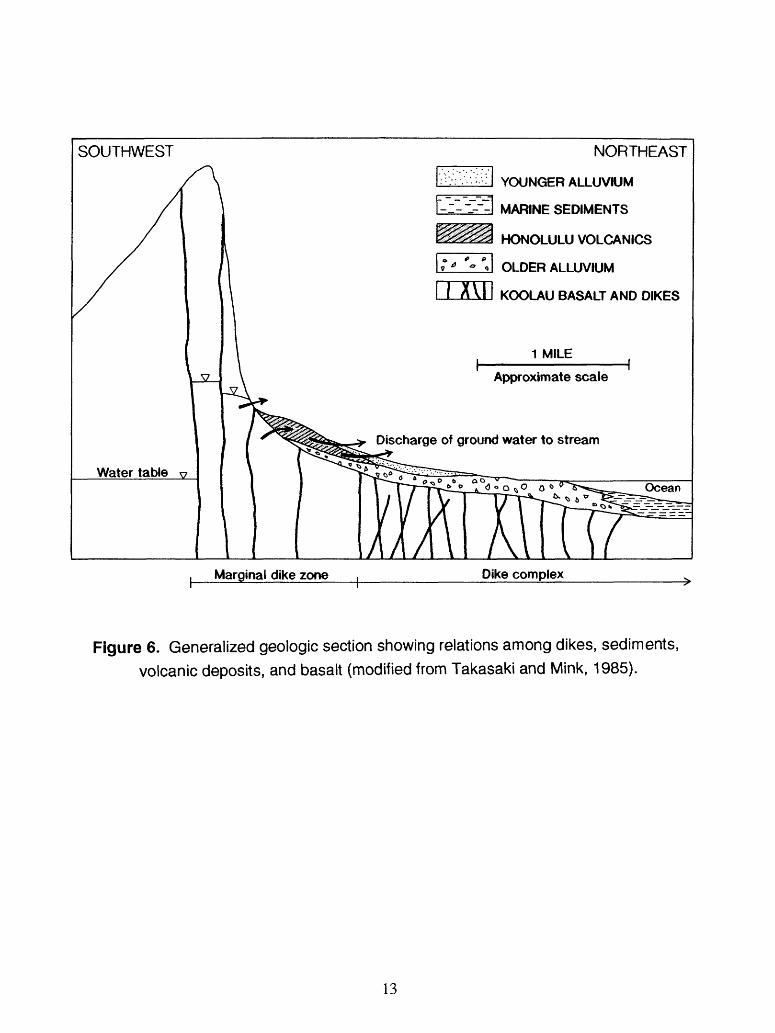
Figure 6. Generalized geologic section showing relations among dikes, sediments, volcanic deposits, and basalt (modified from Takasaki and Mink, 1985).
13

predominant process in wet regions such as Haiku Valley is soil avalanching, which releases a mixture of mud, pebbles, cobbles, and boulders known as a debris flow (Wentworth, 1943). Colluvium from debris flows has a greater proportion of fine sediment (silt and clay) than alluvium (Stearns and Vaksvik, 1935). The colluvial deposits contain poorly sorted, angular clasts in a matrix-supported fabric. These characteristics distinguish colluvium from alluvium, which consists of well-rounded clasts in a clast-supported fabric.
Previous investigators have subdivided the alluvium and colluvium of Oahu into "older" and "younger" subunits on the basis of diagenetic and weathering criteria (Stearns and Vaksvik, 1935; Wentworth, 1951). Although no biostratigraphic criteria were used to distinguish between these units, Stearns and Vaksvik (1935) believed that the "older" alluvium was of Pleistocene age and the "younger" alluvium was of Holocene age. The distinction between older and younger alluvium is important hydrologically because weathered alluvium tends to be much less permeable than unweathered alluvium, although some water has been developed from alluvium in places other than Haiku Valley (Wentworth, 1951; Visher and Mink, 1969; Williams and Soroos, 1973). However, colluvium, weathered or not, has low permeability because of the higher proportion of fine sediment in the matrices of these deposits than in alluvium. Colluvium and old alluvium are thus combined in this report and mapped as a single unit because both have relatively low permeabilities.
In contrast, the unweathered younger alluvium that lines the modern channels of Heeia Stream and its tributaries may have very high permeabilities (Stearns and Vaksvik, 1935). Because its hydrologic properties differ from those of the older alluvium and colluvium, the younger alluvium is mapped as a separate unit.
Honolulu Volcanics.-- Rocks of the Honolulu Volcanics of Pleistocene age are present in Haiku Valley. The volcanism that produced these rocks occurred about 1 to 2 million years after the shield-building volcanism of the Koolau Basalt and long after the erosion of the valleys had begun (Macdonald and others, 1983). Rocks of the Honolulu Volcanics in Haiku Valley include poorly cemented pyroclastics and massive lava flows.
In Haiku Valley, the pyroclastic deposits of the Honolulu Volcanics are primarily ash (less than 2 mm, millimeters, in diameter) and lapilli (2-64 mm in diameter), although some cobble (64-256 mm in diameter) and boulder-size (greater than 256 mm in diameter) bombs are present. Air-fall pyroclastics tend to become sorted during an eruption, and parts of a pyroclastic cone may be predominantly coarse near the vent and become increasingly fine distally.
The coarser pyroclastics observed in outcrops are poorly cemented and have retained some intergranular porosity and mafic (dark) color. Such coarse pyroclastics are extremely permeable (Stearns and Vaksvik, 1935). Some of the finer layers interbedded with the coarse cinder are cemented or deeply weathered and have lost much of their original porosity. The pyroclastic deposits thus have variable hydrologic characteristics that are linked to grain size. Most of the outcrops of pyroclastics in Haiku Valley are poorly cemented, coarse, and occasionally interbedded with thin layers of fine ash. The pyroclastic unit of the Honolulu Volcanics is therefore, overall, highly permeable.
The Honolulu Volcanics in Haiku Valley also include aa lava flows that descend the valley walls and partially cover the valley floor. The lava flows are mostly concealed beneath younger deposits, but are exposed at several sites along the stream channel. The flows are much thicker than average flows of the Koolau Basalt and have fewer vertical joints. Flows of the Honolulu Volcanics can also be distinguished by their massive, sparsely vesicular character and the presence of phenocrysts of the feldspathoid minerals (Winchell, 1947). The lava flow exposed
14

near station 16275000 near the boundary of the Omega station is approximately 30 ft thick and has very few vesicles.
Areal Distribution of Rock UnitsThe geologic map of Haiku Valley (fig. 4) shows the areal distribution of rock types.
Rocks of the Koolau Basalt (Tkb) form the steep walls of the valley. Older alluvium and colluvium (Qoa) filled the floor of the valley. Younger alluvium (Qya) lines stream channels. The contact between the sediments and the Koolau Basalt near the base of the northern valley wall cannot be precisely located on the map because it is concealed by vegetation. A break in slope between the precipitous valley walls and the less-steep margins of the valley floor is apparent at about 600-ft elevation, but this break does not represent the break between a cliff and associated talus or debris fans. Road cuts along the southern valley wall show that the Koolau Basalt lava flows commonly form not only the cliffs, but the gentler slopes below the cliffs as well. The degree of weathering probably plays an important role in the development of this break in slope. Above the break, the rocks of the Koolau Basalt are hard, unweathered, and better able to maintain steep slopes, whereas below the break, the rock is deeply weathered, soft, and fails more readily and assumes a gentler slope.
The rocks of the Honolulu Volcanics occur as both pyroclastic accumulations (Qhp) at the foot of the western valley wall and as lava flows (Qhl) that descend the southern valley wall. The geologic map of Stearns (1939) showed that the pyroclastics of the Honolulu Volcanics are only patchily distributed in Haiku Valley, but the more extensive exposures located during field work for this study indicate that the pyroclastic deposits are more extensive and probably thicker than previously believed. The source vent for the pyroclastics was probably near the small hill due east of the Omega Station building, near the portals of the H-3 tunnels, because the pyroclastics are coarsest there. The vent for the lava flow is clearly not the same as the vent for the pyroclastics. The lava flow on the south wall originates at an elevation of about 1,100 ft and descends the wall until it is obscured by vegetation. The lava flow crops out in several locations along Heeia Stream, and Stearns (1939) showed that it continues to the coast The relative ages of the lava flow and the pyroclastics is unclear. Stearns and Vaksvik (1935) wrote that the lava flow overlies the pyroclastics in some outcrops along the stream, but the log of well 2450-2 indicates that the lava flow occurs beneath the pyroclastics (fig. 7). The pyroclastic deposits observed underlying the lava flow by Stearns and Vaksvik (1935) may be from an earlier eruption that predates the pyroclastic deposits near the Omega Station in the upper valley.
Geologic StructureThe subsurface distribution of geologic units is shown in sections A-A' (fig. 8) andB-B'
(fig. 9). The Koolau Basalt forms the basement rock into which Heeia Stream has eroded nearly 2,000 ft. Dikes (not shown in figs. 8 and 9) with nearly vertical orientations intrude the Koolau Basalt. The dikes are probably less abundant in the upper valley than in the lower valley.
Sediments and volcanic deposits fill the axis of the valley. The sediments thicken toward the center and mouth of the valley, but some of the underlying Koolau Basalt is exposed where roadcuts or the stream has incised through the sedimentary cover (fig. 4). The thickness of the sediments and the depth to the Koolau Basalt basement are therefore difficult to estimate because the subsurface contact between these units is irregular. The log of well 2450-2 indicates that the depth to the Koolau Basalt basement in that location is 200 ft, and the cross sections indicate that the depth to the basement may be over 300 ft in the axis of the valley.
15

WELL CONSTRUCTION
HAIKU WELL 2450-2 Ground elevation: 496.7 feet (above sea level) Well diameter: 12 inches
GEOLOGIC LOG
GROUT SEAL 0 - 80 FEET
SAND AND GRAVEL 80 - 90 FEET
WATER TABLE 170 FEET
OPEN CASING 90 - 390 FEET
SOLID CASING AND GROUT 390 - 400 FEET
UNCASED BELOW 400 FEET
DEPTH, IN FEET
- 0
100
- 200
300
- 400
500
- 600
COLLUVIUM AND ALLUVIUM (Qya) 0 - 35 FEET
PYROCLASTICS (Qhp) 35 - 85 FEET
LAVA FLOW (Honolulu Volcanics, basalt) (Qhl) 85-130 FEET
COLLUVIUM AND ALLUVIUM (Qoa) 130-200 FEET
WEATHERED KOOLAU BASALT (Tkb) 200 - 250 FEET
UNWEATHERED KOOLAUBASALT (Tkb)250 FEET - BOTTOM
DRILLING NOTES (GPM = Gallons per minute)
- 0 - 35 feet: no water
~ 77 feet: flowing 10 GPM
-100 feet: flowing 25 GPM
~ 170 feet: water level after grouting
Figure 7. Geologic log and construction details of well 2450-2, near Heeia Stream in
Haiku Valley.
16
Pyroclastic deposits of the Honolulu Volcanics may be as thick as 150 ft in some places (figs. 8 and 9). The unit is probably thickest at its center, near the axis of the valley and thins towards its margins to form a lenticular body of permeable rock underlain, in descending order, by the 30 to 50 ft thick flows of the Honolulu Volcanics, deeply weathered old alluvium, and finally by the dike-intruded lava flows of the Koolau Basalt.
Hydrologic Significance of GeologyThe floor of Haiku Valley is a heterogeneous collection of rock types, each with its own
hydrologic characteristics. The valley is partly filled with older alluvium of relatively low permeability; a massive lava flow of the Honolulu Volcanics, which probably has very low permeability; pyroclastics of the Honolulu Volcanics which have relatively high permeabilities; and small deposits of younger alluvium that have high permeabilities (Stearns and Vaksvik, 1935; Stearns, 1939). The pyroclastics form a permeable lenticular mass that lies mostly above the less-permeable older alluvium, colluvium and lava flow. The superposition of geologic units of varying permeabilities provides a system in which lateral movement of water becomes important because vertical movement is retarded by units of low permeability.
The valley-filling complex is underlain by a basement of highly permeable Koolau Basalt lava flows that are cross-cut by dikes of extremely low permeability. The dikes that cut across the permeable lava flows form structures that retard the lateral movement of water. In the marginal dike zone, the dikes form compartments within which large quantities of water can accumulate (fig. 6). Although it is convenient to envision dike compartments as separate entities, they are probably interconnected. Water may pass from one dike compartment to the next, but the movement is slow. Dike compartments commonly discharge water into streams (including the stream in Haiku Valley) on the windward side of the Koolau Range (Takasaki and others, 1969). Water accumulated in dike compartments has been developed by constructing horizontal tunnels, such as the Haiku water tunnel, that penetrate the dikes bounding the compartments.
The drilling log of well 2450-2 (fig. 7), completed in 1981, indicates the existence of two aquifers, an aquifer with a potentiometric surface above ground level, and a second deeper aquifer with a water table at 170 ft below surface. According to the field notes taken during the drilling, the well flowed at 10 to 25 gal/min during drilling in alluvium and pyroclastics of the Honolulu Volcanics, but assumed a static level at an elevation of 325 ft (170 ft below surface) after the well was deepened to the Koolau Basalt and the upper 80 ft of alluvium and volcanic rocks in the well were sealed (fig. 7). The field notes indicate that the shallow aquifer is formed by either younger alluvium or the pyroclastics of the Honolulu Volcanics, or both. The deeper aquifer lies in a dike compartment within the Koolau Basalt. The shallow aquifers may be separated from the deeper aquifer by the thick massive basalt flow of the Honolulu Volcanics, the weathered old alluvium, or the weathered upper part of the Koolau Basalt, which retards, but does not necessarily prevent, flow between the aquifers. The main building, roads, and parking lot of the Omega Station, and much of the suspected PCB-contaminated area are situated on the same geologic units that form the shallow aquifer.
In 1939 to 1940, the Haiku water tunnel was driven horizontally at an elevation of 550 ft to develop water in dike compartments. A flow of 11.3 Mgal/d discharged under pressure when a 10-ft thick dike was penetrated. The dike was virtually vertical, striking N 53°E, and impounded water on its northwest side. Pressure of the water discharging from the compartment behind the penetrated dike indicated a water level of approximately 700 ft elevation in the compartment (Takasaki and Mink, 1985). At the completion of the water tunnel in 1940, bulkheads were
17

A
FE
ET
2,0
00-,
1,8
00-
1,6
00
-
1,4
00-
1,2
00
-
1,0
00-
800
600-
40
0-
200-
Sea
lev
el -
-20
0
Tkb
EX
PLA
NA
TIO
N
Tkb
YO
UN
GE
R A
LLU
VIU
M
HO
NO
LULU
VO
LCA
NIC
S,
PY
RO
CLA
ST
ICS
HO
NO
LULU
VO
LCA
NIC
S.
LAV
A F
LOW
OLD
ER
ALL
UV
IUM
KO
OLA
U B
AS
ALT
VE
RT
ICA
L E
XA
GG
ER
AT
ION
X2
Figu
re 8
. G
eolo
gic
sect
ion
acro
ss H
aiku
Val
ley
(line
A-A
1, ge
olog
ic m
ap,
figur
e 4)
.

BB
1
EX
PLA
NA
TIO
N
Qya
.
Tkb
YO
UN
GE
R A
LL
UV
IUM
HO
NO
LU
LU
VO
LC
AN
IC
PY
RO
CL
AS
TIC
S
HO
NO
LU
LU
VO
LC
AN
ICS
, LA
VA F
L£)W
OL
DE
R A
LL
UV
IUM
KO
OL
AU
BA
SA
LT
VE
RT
ICA
L E
XA
GG
ER
AT
ION
X2
Figu
re 9
. G
eolo
gic
sect
ion
thro
ugh
axis
of H
aiku
Val
ley
(line
B-B
1, ge
olog
ic m
ap,
figur
e 4)
.
installed to regulate the flow of water. The difference in water levels between the Haiku water tunnel and well 2450-2 indicate that they penetrate different dike compartments, but water may be exchanged between compartments.
EXCHANGE BETWEEN GROUND WATER AND SURFACE WATERAn important consideration in the study of possible contaminant transport routes is stream
seepage, the exchange between ground water and surface water. If the stream gains water from springs along its reach, contaminants in ground water may discharge to the stream. Conversely, contaminants carried in stream water may find their way to the ground water if the stream loses water by seepage.
The base flow of a stream is flow that is sustained during periods of little or no rainfall within a stream's drainage basin. Most of the flow originates from ground-water discharge (Langbein and Iseri, 1961). A stream's base-flow characteristics show the relation between ground water and surface water in a drainage basin. Base flow normally decreases with time after previous rainfall.
Methods of AnalysisThe USGS currently operates one station, 16275000, that measures stream discharge from a
0.98 mi2 drainage area in Haiku Valley (fig. 2). Base-flow characteristics of upper Heeia Stream were studied by hydrograph and flow-duration analysis of records from station 16275000. The station, located at the downstream boundary of the Omega Station, was operated during the periods January 1914 to October 1919, July 1939 to September 1977, and October 1982 to the present (1992). The stage-discharge relation at this station is considered accurate within 5 percent (Matsuoka and others, 1991).
Seepage runs were used to locate reaches of stream gains and losses and to measure the amount of exchange between ground water and surface water. Seepage runs are sets of nearly simultaneous discharge measurements at selected points along the course of a stream. Differences between stream discharges at upstream and downstream sites can be attributed to seepage of water into or out of the ground, if contribution from tributaries is not a factor. Stream discharge at selected sites along Heeia Stream was measured using the 0.6-depth, pygmy- current-meter method (Rantz and others, 1982a). Because of high rainfall in the study area, antecedent rainfall patterns had to be studied to ensure that tributary flow did not influence seepage measurements. In addition, tributaries were checked prior to each measurement, and seepage runs were conducted only when tributaries were observed to have no flow. Discharge ranged from 1.63 to 2.22 ft3/s at station 16275000 during the seepage runs.
Hydrographs and Flow-Duration Curves for Stream-Gaging Station 16275000The hydrograph data for station 16275000 and rainfall data from a nearby rain gage show
that stream stage responds quickly to rainfall (fig. 10). This flashy characteristic is typical of streams on Oahu where drainage basins are small and gradients are steep. Recessions after peak flows are steep, and the stream returns to base flow in a few hours. Between runoff peaks, the hydrograph becomes nearly flat at a discharge of about 1.0 to 2.0 ft3/s. This base flow comes from ground-water discharge to the stream.
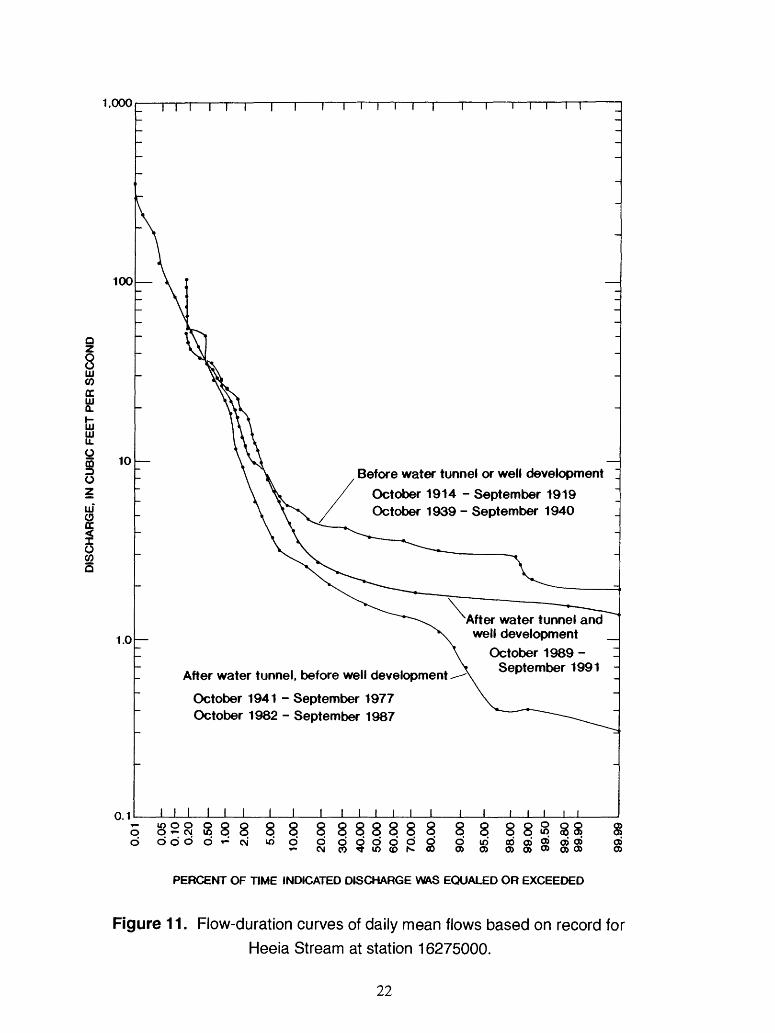
The prominent base flow of Heeia Stream can also be seen in the flow-duration curves of station 16275000 (fig. 11). Because the stream discharge is linked to ground-water discharge and may respond to artificial stresses on ground-water systems such as withdrawals from wells
20

DIS
CH
AR
GE
, IN
CU
BIC
FE
ET
PE
R S
EC
ON
DR
AIN
FA
LL,
IN I
NC
HE
S»
-n0
<5'
-a
c
c0
<D0
) .
®
^t
-* 3.
P
ro
"« .
ID
ro
ro<
Q
) I
0
§
§
TJ
»
ro
3 -
Oi
0
£
*0
a
T
O
o
?
rt
X,
£D
ryQ
.
1
^
7T
N)
rt0
0
c
w
w
8 c
5 8
§
§
5-5
^
CQ
g
<
O
" O
)
^?o?
^,0
Q
. H
£
W
IT
o
Q-
S«
3 u>
' °
^<i
g- »
CD
£1)
£U
*§
§. a
3 ?
°
K5$2
. "
S3-
pi -
^ ^
^ ^^
rw
& £J
O £J
O .j.
01
W
6"
3,
0
g13
£1
) 0
v
' ~
OJ
' ro
00
-^^
^^
|
11
?
s <§
i.
8CQ
3
0
CQ
ro I
On
0
01
5o
o
o
c
Y '
'-I f
I
m^=
^ m
c ^s-
C/5
( ^ CO
W
o S N>
^^1
r~
5 01
b
bi
b.
01
c
i I
i i
i^B
BS
SB
S^S
5 -
c_
TP
J _
i^
1 ,
m
w N>
(O "
1 1
1 1
1
0 >
ro 8 C*5
00
^*J m i o 3J
3
<»
« 8 0
1.000
100
10
1.0
0.1
rn i i \ i r \ i i r i \ r
After water tunnel and well development
October 1989 - September 1991
Before water tunnel or well development
October 1914 - September 1919 October 1939 - September 1940
After water tunnel, before well development
October 1941 - September 1977 October 1982 - September 1987
I I I I I I
o 828 8 8 8 88 8888888 8 8 88Sd d d d d CM w) o o o
i- CM COQ d in od o> 2>
U) 0> f*» CO Oft Oft Oft Oft 05
PERCENT OF TIME INDICATED DISCHARGE WAS EQUALED OR EXCEEDED
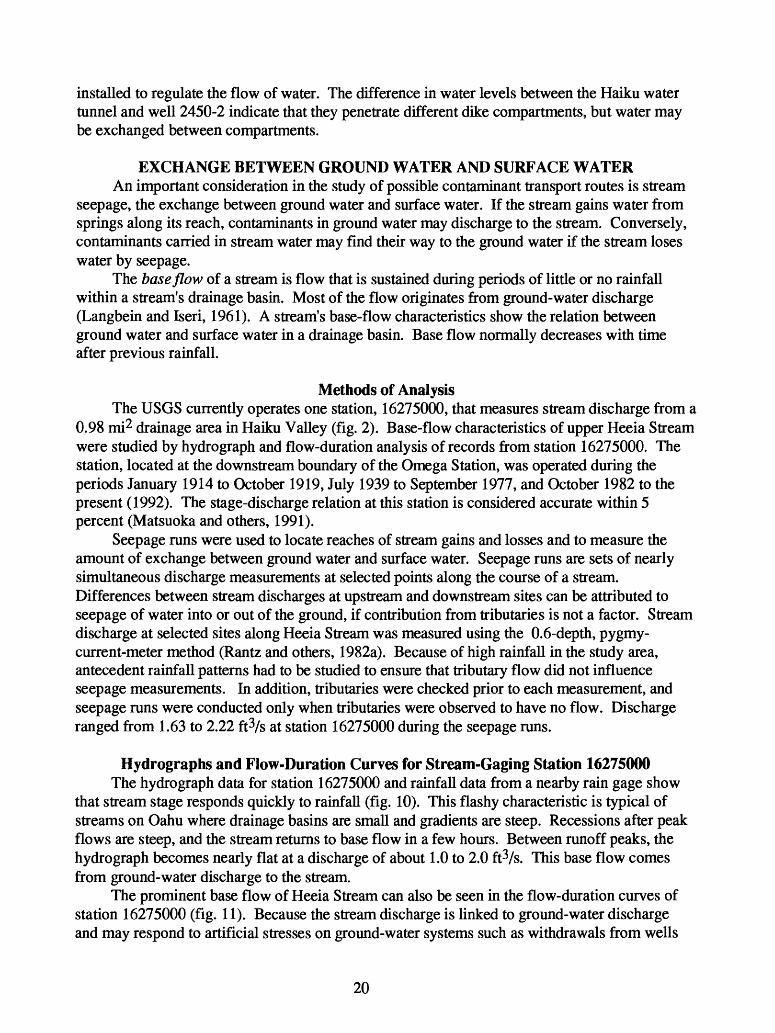
Figure 11. Flow-duration curves of daily mean flows based on record for
Heeia Stream at station 16275000.
22

and water tunnels, the record was divided into three separate periods significant in the development of ground water in Haiku Valley: (1) the period before the completion of the Haiku water tunnel in 1940 (a total of 6 years of record from October 1914 to September 1919 and October 1939 to September 1940), (2) the period between the completion of the water tunnel and the beginning of pumping at well 2450-2 (a total of 41 years of record from October 1941 to September 1977 and October 1982 and September 1987), and (3) the period during which both the tunnel and the well were withdrawing water (2 years of record between 1989 to 1991). All three curves indicate that the stream had not stopped flowing during the period of record. The lowest instantaneous flow recorded at the station was 0.20 ft3/s (Matsuoka and others, 1991). The persistence of flow, even during the driest periods, is attributed to ground-water discharge.
The flow-duration curves indicate that the base flow of Heeia Stream decreased after 1940 when Haiku water-tunnel withdrawals began, and increased in 1989 when withdrawals from well 2450-2 began. Whether water-tunnel and well withdrawals have caused the changes in base flow, or whether the changes are the result of climatic variations, is unclear. The Lower Luakaha rain gage (State number 782) located 6 mi to the southeast of Haiku Valley, is one of the few rain gages with a record long enough to compare with the Heeia stream-discharge record at station 16275000. During the 6 years of stream-discharge record prior to the development of the Haiku water tunnel, rainfall averaged 153 in/yr at the Lower Luakaha gage, but between 1940 and 1988, rainfall averaged only 116 in/yr, a decrease of approximately 24 percent. The decrease in base flow may thus be due to a decrease in rainfall. Even though base flow is sustained by ground- water discharge, a decrease in rainfall would decrease recharge and storage, which in turn decreases spring discharge and base flow. The recorded magnitude of the stream-discharge decrease is large, however: base flow after tunnel development was only about one third of the base flow before tunnel development. A change of this magnitude indicates that the tunnel is at least partly responsible for the decrease in base flow of the stream.
In 1980, the withdrawal from the tunnel decreased from about 1.9 Mgal/d to 1.7 Mgal/d. The increase in streamflow in the period from 1989 to 1990 may be due to this decrease in tunnel withdrawal, but rainfall in this period also increased to 128 in/yr. Interpretation of the effects of ground-water withdrawals on base flow for a short 2-year record is tenuous, however. Additional analyses and an extended stream-discharge record are needed to establish the connection between base flow and ground-water development.
Seepage Characteristics of Heeia StreamTable 1 shows the results of stream-discharge measurements made at selected sites along
Heeia Stream during October through December, 1991 (fig. 12). These measurements, made under base-flow conditions, quantify the net exchange between ground water and the stream. Where discharge at a downstream site is higher than at an upstream site, the stream is gaining water from ground-water discharge. Where discharge at a downstream site is lower than at the upstream site, the stream is losing water by seepage into the ground.
Base flow in Heeia Stream was traced to an elevation of 520 ft (estimated from topographic contours) near measuring site 1 (fig. 12). Here, the flow originated from springs discharging along the stream banks. Between sites 1 and 2, the stream gained an average (for the four seepage runs) of 0.24 ft3/s (table 1). The stream gains water along all of the reaches measured in the seepage runs. The most voluminous spring discharge observed issued from beneath a pile of boulders (apparently an artificial deposit) on the right bank of the stream between measuring
23

Table I. Discharge ofHeeia Stream measured on specified seepage-run dates in 1991
[--, no data; measuring sites shown in figure 12; site 6 is station 16275000]
Discharge, in cubic feet per second
Site
1 2 3 4 5 6 7 8
November November November 6 12 22
0.02 0.00 0.24 0.25 1.25 1.26 1.59 1.52 1.88 1.67 1.96 1.72
1.80 4.70 4.40
0.00 0.21 1.37 1.40 1.57 1.67 1.85 4.29
December 20
0.22 0.52 1.44 1.70 2.03 2.22 2.32 4.14
sites 2 and 3. Along this reach, the stream gained an average of 1.00 ft-Vs from ground-water discharge. The stream also gained a large volume of water between sites 7 and 8.
A plot of discharge compared with distance along the stream channel (measured from the uppermost site) is shown in figure 13. The slopes of this plot indicate gain per foot of channel, which is useful in comparing reaches of various lengths. The steeper slopes indicate a greater gain per foot of channel. The steepest slope occurs between sites 2 and 3. Between sites 4 and 7, the curve is relatively flat, but steepens again between sites 7 and 8. The graph indicates that most of the ground-water discharge to Heeia Stream within the seepage-run study area is concentrated in two reaches: between site 2 and 3, and between sites 7 and 8. Although all other reaches gain from ground-water discharge, contributions to the stream's base flow is relatively small. This pattern persists for each of the seepage runs.
Seepage runs from this study are compared in figure 14 with seepage runs done in 1938 prior to the construction of the Haiku water tunnel, in 1961 after construction of the tunnel and prior to construction of well 2450-2, and in 1981, before and during aquifer testing of well 2450- 2. Locations of measuring sites of the earlier seepage runs correspond closely to the site locations of this study. The earlier seepage runs show that the large gain between sites 2 and 3 has been a persistent feature in the seepage of Heeia Stream, despite the withdrawal of water from the nearby well and water tunnel.
24

157°50' 157°49'
STREAM solid where perennial
DISCHARGE MEASURING
Base from U.S. Geological Survey 1:24,000 Kaneohe, 1983
Figure 12. Locations of discharge measuring sites for seepage runs on Heeia Stream.
25

to o\
Site
6
Sta
tion
1627
5000
1.00
02
,00
0
3,0
00
4,
000
DIS
TAN
CE
FR
OM
UP
PE
RM
OS
T S
ITE
, IN
FE
ET
5,0
00
6,00
0
Figu
re 1
3.
Dis
char
ge/d
ista
nce
rela
tions
for
seep
age
runs
.

to
1,00
02.0
00
3.00
0 4
.00
0
DIS
TAN
CE
FR
OM
UP
PE
RM
OS
T S
ITE
. IN
FE
ET
5.00
06.
000
Figu
re 1
4.
Dis
char
ge/d
ista
nce
rela
tions
for
prev
ious
Hee
ia S
tream
see
page
run
s an
d se
epag
e ru
ns
mad
e fo
r thi
s st
udy.
ESTIMATE OF GROUND-WATER RECHARGEThe rate of ground-water recharge determines the quantity of water available for solution,
dilution, and transport of contaminants to aquifers. Water-balance calculations can also be used to estimate amounts of water moving into and out of a basin through the subsurface.
Water-Balance ComputationGround-water recharge is commonly estimated by using a water-balance model. The
water-balance concept, developed by Thornthwaite (1948) and Thornthwaite and Mather (1955) is a "bookkeeping" procedure for the plant-soil system that balances moisture inputs of rainfall with moisture outputs of direct runoff, evapotranspiration, and ground-water recharge. The relation is expressed by:
P = E + R + G+ASS (1)
where (all in units of length): P = precipitation,E = actual evapotranspiration,R = runoff,G = ground-water recharge, andASS = change in soil storage.
The bookkeeping process provides a running account of month-to-month moisture stored in the soil root area from which evapotranspiration occurs. By identifying the soil's moisture- holding capacity, and applying the water-balance bookkeeping procedure, water surplus and water deficit can be calculated. For this study, water surplus was equated to ground-water recharge; hence, recharge occurs when soil-moisture storage is exceeded. A water deficit occurs when soil-moisture storage is less than full and is insufficient to meet the maximum potential evapotranspiration demand.
A model using a geographic information system (GIS) for calculating a monthly water balance was created for the Haiku study area. The GIS-based model links the quantitative and spatial characteristics of the water-balance components in equation 1. The spatial characteristics are represented by digital data that include the study area boundary, mean monthly rainfall distribution, soil-type distribution, and adjusted annual pan-evaporation distribution. The study area boundary was digitized from the l:24,000-scale USGS Kaneohe 7.5 minute topographic quadrangle (1983).
Maps showing lines of equal monthly rainfall distribution for the island of Oahu (Giambelluca and others, 1986) were digitized and compose the GIS rainfall data. The rainfall maps were compiled from data collected at a network of 13 base stations that had complete records for the base period from 1916 through 1983. Average values were used for the area between lines of equal monthly rainfall. The spatial distribution of rainfall varies from month to month. Monthly rainfall distributions were used rather than monthly percentages of the annual rainfall distribution, to provide more realistic simulation of the rainfall variability.
The digital soil data, created by the Soil Conservation Service from base maps in Foote and others (1972), provide soil-water capacity and plant rooting-depth estimates, which are used to determine the maximum soil-moisture storage. The soil-water capacity is a measure of the amount of soil moisture available to plants for evapotranspiration and is the difference between field capacity and the wilting point. Soil-water capacities in Haiku Valley ranged from 0.01 to
28

0.17 inch of water per inch of soil (Foote and others, 1972). The plant rooting depth is estimated from the abundance of roots that appear at various depths in soil profiles. Rooting depths used in the model are from Foote and others (1972); rooting depths measured at several roadcuts during the geologic mapping for this study were found to be similar to the published depths of 1 inch on very steep rocky cliffs to 4 ft under forests on the valley floor. The maximum soil-moisture storage is the product of the rooting depth and the available water capacity for that soil type. The maximum soil-moisture storage value is critical in the water balance because it must be filled before ground-water recharge occurs. The maximum soil-moisture storage also determines whether evapotranspiration occurs at the potential maximum rate or at some lesser actual evapotranspiration rate. Maximum soil-moisture storage in Haiku Valley ranged from 0.01 inches on the rocky cliffs to 6.12 inches on the valley floor.
The GIS evapotranspiration data were created by digitizing the adjusted annual pan- evaporation map for the island of Oahu (Ekern and Chang, 1985). It is assumed that the pan- evaporation coefficient equals 1.0, and therefore, the pan-evaporation value is representative of potential evapotranspiration (Chang, 1968). The monthly pan-evaporation values were approximated by multiplying annual values by a ratio of mean monthly pan evaporation to mean annual pan evaporation as determined from 7 years of record at Maunawili pan-evaporation station 787.10 in Maunawili Valley (Ekern and Chang, 1985). This pan-evaporation station is located at an elevation of 410 ft, in a valley about 5 mi southeast of Haiku Valley and is similar with regard to wind, hours of sunlight, and elevation.
Runoff is calculated by multiplying the monthly precipitation by the ratio of basin-wide direct monthly runoff to basin-wide monthly rainfall. Direct monthly runoff is the difference between mean monthly flow at station 16275000 and the ground-water contribution to stream discharge, or base flow. A flow-duration analysis for the drainage basin of station 16275000 was made for each month. The discharge exceeded 90 percent of the time (Q9o) in the flow-duration analysis was the base-flow value subtracted from the mean flow to compute direct runoff for that month. The base-flow values ranged from 40 percent of the mean stream discharge in the winter months to 70 percent of the mean stream discharge in the dry summer months.
The GIS-based water-balance model is a computer program that uses the water-balance equation to calculate actual evapotranspiration, ground-water recharge, and remaining water stored in soil, from monthly rainfall, runoff, maximum soil storage, and potential evapotranspiration. The water-balance model steps through the months, using the sum of the monthly rainfall and the previous month's ending soil-storage value as the initial input volume of water, then subtracts runoff. The remaining volume is compared with maximum soil storage and potential evapotranspiration. Excess water is allotted to ground-water recharge. If there is insufficient water to fill maximum soil storage, no water goes to ground-water recharge. All of the water remains in soil storage and is subject to evapotranspiration. Evapotranspiration is subtracted from the water left in soil storage. If the amount of water in soil storage is enough to satisfy the potential evapotranspiration rate, then actual evapotranspiration equals the potential amount for that month. Once evapotranspiration is satisfied, any remaining water in soil storage is carried over to the next month. If the quantity of water in soil storage is less than the potential evapotranspiration value, then actual evapotranspiration equals the quantity in soil storage, and there is no water carried over in storage to the next month.
The model was computed on a monthly basis, starting with January. To start the monthly calculation, an estimate of initial soil-moisture conditions for January was needed. The initial soil moisture content for January was estimated by making three preliminary model runs using
29

values of 0 percent, 50 percent, and 100 percent of maximum soil storage as the initial soil- moisture condition. In each preliminary run, the soil moisture calculated at the end of December was 59 percent of the maximum soil storage, regardless of what initial January soil moisture condition was used. Soil moisture at the end of the year is apparently not sensitive to variability in soil moisture conditions at the beginning of the year. In the actual model run, the initial soil- moisture condition for January was set at 59 percent of capacity.
Implications of Recharge Estimates on Ground Water MovementThe monthly water balance for the drainage basin of station 16275000 is summarized in
table 2. Distinct seasonal variations in ground-water recharge are apparent by calculating the water balance on a monthly basis. Recharge ranges from a high in March of 136.37 Mgal to a low of 57.88 Mgal in June. The average annual recharge, 1,201.84 Mgal, converts to a rate of 3.29MgaVdor5.1ft3/s.
Ground-water and surface-water systems establish an equilibrium over time. Under steady- state conditions a ground-water body neither grows nor shrinks because the amount of recharge it receives is balanced by natural discharge at the surface through springs and to the ocean. If an artificial stress such as a well taps into the ground-water body, the aquifer adjusts by reducing the natural discharge to compensate for the water withdrawn by the well. A new steady-state equilibrium is established, provided the artificial withdrawal does not exceed recharge, when the amount of water recharging the aquifer is balanced by the natural discharge and discharge through wells.
The water balance computed on a monthly basis for the drainage area of station 16275000 in Haiku Valley indicates a recharge of 5.1 ft3/s. Assuming that all tunnel and well withdrawals of water are nearly at equilibrium with the ground- and surface-water systems from which they draw, the total withdrawal plus the natural discharge of ground water to the stream and ocean should equal the recharge. Records of well 2540-2 and the Haiku water tunnel indicate average withdrawals of 2.3 ft3/s and 1.7 ft3/s respectively, for a total of 4.0 ft3/s. For the following calculations, base flow was estimated as 1.2 ft3/s, the average of the monthly base flows used in the ground-water recharge calculation. The total of withdrawals and base flow, which represent the volume of ground water discharged within the drainage area of the gaging station, nearly balances the total recharge occurring within that basin (fig. 15). The difference in total discharge is only 0.2 ft3/s higher than the estimated total recharge. The excess discharge may come from subsurface flow from outside the basin. Recharge estimates may vary, however, depending on whether the water balance is computed on a daily, monthly, or annual basis. The difference between discharge and estimated recharge for Haiku Valley is very small and may be within the variability of recharge estimates.
Knowledge of geology of Haiku Valley, however, indicates that this simple water balance is not accurate. According to the geologic log of the Haiku water tunnel, the source of water is a dike compartment on the northwest side of a 10-ft thick dike striking N 57° E. The water level on the southeast side of the dike is apparently below the elevation of the tunnel. Before any withdrawal of water, the dike compartment had a water level estimated at 700 ft elevation. All of the water withdrawn from the tunnel must originate as recharge from above an elevation of 700 ft on the northwest side of the dike (fig. 16). A monthly water balance calculated for the area between the dike and the boundary of the drainage basin of station 16275000 indicates that 146.34 Mgal recharges the area in 1 year, which converts to an average annual recharge rate of 0.6 ft3/s. Of the 1.7 ft3/s discharged at the water tunnel, only 0.6 ft3/s is estimated to come from
30

recharge in Haiku Valley (table 3). The remaining water must come from recharge outside Haiku Valley, as has been suggested by Hirashima (1962) and Takasaki and others (1969), or from storage in the dike compartment. Thus, of the 5.1 ft3/s recharging within the drainage area of station 16275000,0.6 ft3/s is withdrawn at the water tunnel, and 2.3 ft3/s is withdrawn at the well.
Table 2. Monthly water balance, for drainage basin gaged at station 16275000
[Values are in millions of gallons]
January February MarchApril May JuneJuly August September OctoberNovemberDecember
Total
Rainfall
185.41 136.09 184.93154.53 128.69 87.39
115.31 136.87 118.13 138.50158.22182.99
1,727.06
Direct Actual runoff evapotranspiration
34.21 23.95 31.2936.92 13.87 7.51
16.63 12.48 15.06 21.3927.5542.43
283.29
16.57 17.18 21.7020.05 21.94 22.4223.23 22.26 23.10 20.4016.1616.16
241.17
Recharge
134.93 95.51
136.3795.77 94.73 57.8876.31
101.08 80.79 93.98
110.21124.28
1,201.84
Table 3. Monthly water balance, for the recharge area of the dike within the drainagebasin gaged at station 16275000
[Values are in millions of gallons. Recharge area of dike shown in figure 16]
JanuaryFebruaryMarchAprilMayJuneJulyAugustSeptemberOctoberNovemberDecember
Total
Rainfall18.4614.2318.4615.1612.909.02
11.7515.0911.7514.7316.3118.46
176.31
Direct Actual runoff evapotranspiration
3.432.373.123.671.370.141.651.241.502.132.744.24
27.60
0.100.110.140.130.140.750.150.140.140.130.100.10
2.13
Recharge14.9511.6815.2411.3111.388.119.95
13.6610.0912.4213.4214.13
146.34
31

to
Tunn
el0.
1 cu
bic
feet
pe
r se
cond
Sub
surf
ace
inflo
w f
rom
be
yond
bas
in
Bas
e flo
w o
f st
ream
Figu
re 1
5. A
ccou
nt o
f wat
er r
echa
rged
with
in th
e dr
aina
ge b
asin
of H
eeia
Stre
am a
t sta
tion
1627
5000
in H
aiku
Val
ley.
Effe
ct o
f geo
logi
c st
ruct
ure
on r
echa
rge
is no
t con
side
red.

Of the remaining 2.2 ft3/s left to discharge through springs and to the ocean, 1.2 ft3/s discharges as base flow above station 16275000, and 1.0 ft3/s travels in the subsurface to be discharged from the ground outside the drainage area (fig. 17). This flow provides a potential route of transport for any contaminants that may be dissolved in the ground water.
The estimates of subsurface flow out of the Haiku basin are based on the premise that the well and water tunnel have reached a steady-state equilibrium with the natural system. The possibility exists, however, that a steady state has not yet been reached. The well and tunnel may be depleting storage within the basin, outside the basin, or both. If part of the well and tunnel withdrawals are from storage depletion, a larger proportion of the 5.1 ft3/s recharging within the basin will be left to flow through the subsurface. If recharge has been underestimated, the additional water must also leave the basin as subsurface flow. In either case, the possibility exists that the volume of water that travels the route from infiltration in Haiku Valley to ground- water recharge, and then to subsurface transport beyond the basin, may be greater than estimated.
21*40'
2T-201
158° 10* 157*50'
FHCfIC OCEAN
ilua
Recharge area for dike compartment
Station 16275000
0.5 1 MILE
0.5 1 KILOMETER
Figure 16. Partial recharge area, in Haiku Valley, for dike compartmentfrom which the Haiku water tunnel draws its water. Actual recharge area
of dike compartment extends beyond the surface drainage divide.
33

Ui
1.1
cubi
c fe
et
per
seco
nd
Su
bsu
rfac
e '. ;
'>;':':
:';' ]
inflo
w f
rom
be
yond
bas
in
Hai
ku W
ater
Tun
nel
Bas
e flo
w o
f st
ream
Tran
spor
ted
beyo
nd b
asin
thr
ough
sub
surf
ace
Figu
re 1
7.
Acc
ount
of w
ater
rec
harg
ed w
ithin
the
drai
nage
bas
in o
f Hee
ia S
tream
at s
tatio
n 16
2750
00
in H
aiku
Val
ley.
E
ffect
of g
eolo
gic
stru
ctur
e on
rec
harg
e ar
eas
is co
nsid
ered
.

SEDIMENT TRANSPORTBecause of the tendency of PCBs to adsorb to solids, the movement of sediment suspended
in stream water provides a possible mechanism of transport. Important considerations in the study of PCB transport by stream sediment are the rate and volume of sediment carried by the stream; the characteristics of the sediment, such as grain size and organic carbon content; how much PCB is carried by the sediment; and where the sediment is deposited. In order to assess the potential for transport of PCBs by suspended sediment, a study of sediment transport and deposition was undertaken. Measurement of PCBs carried by the sediment is discussed in the section on PCB transport in this report
Methods of Sediment-Transport StudyThe study of sediment transport included a reconnaissance and description of stream-
bottom sediment along the channel of Heeia Stream and collection of water samples for analysis of sediment concentrations. The reconnaissance of Heeia Stream was done during October and November 1991 to survey the distribution of fine (silt and clay) sediment in bed material of the stream. Information on the location and extent of fine-sediment deposition is necessary to evaluate potential contamination of the stream bed with PCBs adsorbed to fine sediment particles eroded from contaminated areas at the Coast Guard Omega Station.
The reconnaissance was accomplished by walking along all accessible parts of the stream channel between station 16275000 and the mouth of Heeia Stream at Kaneohe Bay and visually inspecting bed material (fig. 18). About 1.52 mi of channel was inspected. Characteristics of the 1.14 mi of channel that passes through the wetland between the end of Halaulani Street and Kamehameha Highway are known from observations at the upstream and downstream ends of the wetland. The center of the wetland was unwadeable because of water depth, dense vegetation, and thick deposits of soft sediment. Because of problems associated with processing potentially contaminated material, no sieve analyses were performed. The presence of fine sediment was determined from appearance and by the suspension of bed material following mechanical disturbance of the bed.
Streamflow, water-quality, and sediment data are collected at station 16275000 in cooperation with the Hawaii State Department of Transportation as part of an ongoing effort to monitor effects of construction of the H-3 freeway. Streamflow data have been collected continuously since 1982. Water-quality data collected periodically from 1982 to 1991 are summarized by Wong and Hill (1992). Suspended-sediment data have been collected at station 16275000 from December 1,1983, to September 30,1984, and from July 1,1987, to present (1992). Freeway construction in Haiku Valley upstream of station 16275000 began in September, 1988. The route of the new freeway passes through areas believed to have been defoliated (Jeff Klein, Coast Guard, oral commun., 1992).
Stream discharge was measured periodically using the 0.6-depth pygmy current-meter method (Rantz and others, 1982a). Exceptionally high flows were determined using the slope- area method (Dalrymple and Benson, 1967). Daily mean Streamflow was computed from Streamflow measurements and gage-height records as described by Rantz and others (1982b).
Suspended-sediment samples were collected primarily with a PS-69 automatic suspended- sediment sampler (Edwards and Glysson, 1988). These samples were collected from a single intake point in mid-stream. Samples were collected daily, when conditions permitted, and more frequently during storms. Periodically, cross-sectional, depth-integrated, suspended-sediment samples were collected manually using a DH-48 sampler (Edwards and Glysson, 1988).
35

157°50'
d^tf/o;
;/«K>.
157°49' TI
REACH 6 Dark, sticky clay
REACH 7 Sand
I
0I 0
EXPLANATION
| REACH IN RECONNAISSANCE
UNSURVEYED REACH Dotted
where intermittent
2,000 4,000 FEET I I
I ! 1,000 METERS
&\A|v^- '~ ^?X> - f>v^.
%f\
H
REACH 5Fine sediment, gravel
REACH 4Concrete flood control
5Eiirj>3^AUo/ifl
' 3$f,-&s..
REACH 2Boulders, cobbles
^ **~Zr/ft ^282
yb/^siaFFP^^ff^--U
^^^
<*
REACH 3 Cobbles, gravel
I ^(((f.mc**so~\/
*^. * ^ /*=LV
^\t#
r2200~-
REACH 1 Sand bars, gravel, boulders
m&mMii ^w::
^^i^i "$P?J
^A^
^ odo^^fe;-as»s^i'.»afc=5?>
.^-C^!
SOO^'ii
y^i4^^
Base from U.S. Geological Survey 1:24.000 Kaneohe, 1983
Figure 18. Characteristics of channel-bottom sediment in Heeia Stream.
36
Suspended-sediment concentrations and particle-size analyses were determined using methods described by Guy (1969). Suspended-sediment loads were computed using sediment sample concentrations and streamflow records, as described by Porterfield (1972).
Reconnaissance of Stream Material, Heeia Stream, October and November 1991Heeia Stream at station 16275000 (fig. 18) has a steep (gradient of 0.27) channel incised
into bedrock with pool and riffle sequences. The bed at the station consists of exposed bedrock and boulders in riffles and coarse gravel in pools. The stage-discharge relation is controlled by a riffle on a thick lava flow of the Honolulu Volcanics. A pool 30 ft by 40 ft is normally present just above the riffle. The gage pool has filled with gravel several times during 1990-91. Pool capacity has been restored by manually removing gravel on three occasions and by scour during high flows. When gravel deposition covers the bedrock control, gravel is carried downstream; otherwise, the gage pool traps most coarse bed load.
Between station 16275000 and the confluence with lolekaa Stream (reach 1, fig. 18), Heeia Stream retains its steep pool/riffle character. Fine sediment deposition is limited to small (approximate maximum dimensions 20 ft in length and 6 ft in width) point and mid-channel bars containing predominantly sand with some intermixed finer sediments. Nine such bars were noted in this reach. Five pools with predominantly sand beds were also located in this reach.
Downstream of the confluence with lolekaa Stream, Heeia Stream flows through a relatively straight reach with a boulder and cobble bed before passing through culverts below the Kahekili Highway (reach 2, fig. 18). About 100 ft downstream of the highway, the stream flows over a waterfall approximately 15 ft in height and into a pool about 75 ft in diameter. This pool is impounded by a low rock dam.
From the large pool downstream of the Kahekili Highway to the Alaloa Street bridge (reach 3, fig. 18), the stream bed is composed primarily of cobbles and gravel. Several pools occur along this reach, but their beds contain very little fine sediment. Seepage of water along the stream banks was noted at several locations in this reach.
Heeia Stream enters a concrete flood-control channel about 200 ft upstream of the Alaloa Street bridge (reach 4, fig. 18). This channel had been recently cleaned of sediment and vegetation on November 4,1991. Some fine sediment in the channel appeared to be over-bank deposits dislodged by heavy equipment.
The concrete flood-control channel extends about 100 ft downstream of the Alaloa Street bridge, and ends at a concrete weir. Downstream of the weir (reach 5, fig. 18), the right bank has been protected with a concrete and stone wall, but the left bank and bed appear to be formed naturally. The stone wall extends for about 100 ft downstream of the weir. Pools and riffles occur in this reach; bed material in the pools is mostly sand with some intermixed fine sediment, and bed material in the riffles consists of cobbles and gravel. Pools are about 30 ft wide and 75 to 100 ft in length. Both banks in this reach are covered with a thick growth of honohono grass (Commelina diffusa).
Along the left bank at about 1,500 ft downstream of the Alaloa Street bridge, an abandoned meander forms a large pool that is isolated from the present stream channel during low flows. The bed of this pool is mostly sand, but an orange-brown floe remains suspended in the stagnant water of the pool.
About 300 ft downstream of the locked gate at the end of Halaulani Street (fig. 18), the stream becomes impassable on foot because of the depth of water and a thick growth of hau trees (Rauvolfia sandwichensis) along both banks and across the channel. The bed at this point is
37

sand and gravel. Stream gradient is relatively low (about 0.03). Downstream of this point, the stream enters a freshwater wetland and then flows into mangrove thickets.
Immediately upstream of the Kamehameha Highway bridge (reach 6, fig. 18), the bed sediments of the wetland appear to consist entirely of very fine dark sticky organic-rich clay. In many places, these sediments are covered with several centimeters of orange-brown floe. Although flowing water covers most of the wetland, there is no distinct channel. Mangrove thickets cover the entire wetland both upstream and downstream of the bridge.
A short distance downstream of the Kamehameha Highway bridge (reach 7, fig. 18), Heeia Stream regains a distinct open-water channel, and mangroves are restricted to the banks. Bed material along the banks consists predominantly of fine sediment. The stream becomes wider and shallower downstream. At the mouth of the stream, the bed material is mostly sand.
In summary, the steep channel, large boulders, and associated highly-turbulent flow in Heeia Stream upstream of the wetland area results in efficient transport of fine sediments to the more quiescent conditions within the wetland. Little storage of fine sediments occurs upstream of the wetland, whereas within the wetland, bottom sediments are almost entirely fine sediment and organic material. The wetland receives sediment from a drainage area of 3.65 mi2, of which about 3 percent may have been defoliated with the PCB-contaminated fuel. The potential for PCB accumulation within fine-sediment deposits is greater in the wetland than in the channel upstream, but the wetland may contain PCBs from sources outside the Omega Station as well.
Suspended-Sediment Transport at Stream-Gaging Station 16275000Variations in instantaneous suspended-sediment concentrations are due both to variations in
streamflow and to effects of highway construction (Hill and DeCarlo, 1991). Annual suspended- sediment loads (table 4) also reflect variations in annual streamflow as well as effects of highway construction. For water years 1988 to 1991, the load was greatest in 1989, after construction started and coinciding with the greatest annual streamflow of the period. Annual streamflow was lowest in 1990, but the 1990 suspended-sediment load was higher than the load in 1988 when the Haiku drainage basin was not affected much by highway construction. This difference in sediment loads may have resulted from increased sediment transport resulting from construction activities. Because some areas affected by freeway construction were defoliated in the past, increases in sediment transport resulting from construction activities may have resulted in increased off site transport of adsorbed PCBs. Table ^.--Annual streamflow and suspended-
PCBs tend to adsorb to fine (silt and sediment loads in Heeia Stream at station clay, <0.062 mm) sediment because of the 16275000, water years 1988-91________higher surface area and because the Suspended- proportion of organic carbon tends to be sediment high in fine sediment (Pavlou, 1980; Feltz, Water year Streamflow load 1980). Surface-area measurements of ________(acre-feet) (tons)____ suspended sediments collected at station 1988 2,520 1,310 16275000 on February 25,1990, gave a 1989 2,820 3,401 range of 93.2 to 96.9 square meters per gram 1999 1,760 1,660 (James Kuwabara, USGS, written commun., 1991_____2,440_____2,972______1990). These high surface areas indicate that the sediment has a high potential to
38

adsorb and transport trace organic compounds (James Kuwabara, USGS, written commun., 1990). Suspended-sediment samples from station 16275000 analyzed for particle size show that suspended sediments are composed primarily of silt and clay (table 5). The six samples analyzed for particle size during water year 1990 were all manually-collected, cross-sectional, depth-integrated samples; the three samples for the 1991 water year were all collected as point samples by the automatic sampler. The lower percentages of silt and clay during the 1991 water year may be an artifact of intake placement for the automatic sampler. Samples collected manually during water year 1990 probably provide a more reliable estimate than samples collected by the automatic sampler of the proportion of fine sediment in the suspended sediment in Heeia Stream. Data for these samples indicate that high percentages of suspended sediments are in the silt and clay fraction over a wide range of streamflow and suspended-sediment concentrations. These results indicate that suspended sediments in Heeia Stream have a high potential for PCB transport.
Table 5 Percentages of fine particles in suspended-sediment samples from Heeia Stream at station 16275000, water years 1990-91
[ft3/s, cubic feet per second; mg/L, milligrams per liter; mm, millimeters]
Date
01-16-90 01-16-90 01-19-90 01-19-90 01-19-90 01-24-90 03-19-91 03-23-91
Gage height (feet)
1.62 1.94 2.03 2.20 2.05 1.32 2.35 2.40
Streamflow (ft3/s)
12.0 35.0 43.0 63.0 45.0
4.10 90.0
100
Suspended sediment
concentration (mg/L)
2,780 4,740 5,640 3,330 3,760
368 3,360 1,380
Percentage of particles finer than 0.062 mm
99 96 88 94 99 98 63 66
TRANSPORT OF POLYCHLORINATED BIPHENYLS (PCB)PCBs have low solubility in water, (Oloffs and others, 1973), a high octanol-water
distribution coefficient (Metcalfe and others, 1986), and a strong affinity to adsorb to soils. The extent of adsorption is strongly influenced by the organic carbon concentration in the soil, and soil mineralogy has little effect (Haque and others, 1974; Karickhoff and others, 1979; Means and others, 1980; Weber and others, 1983; Mill, 1985; Jackson and others, 1986). Rates and equilibrium distribution coefficients may be higher for adsorption than desorption, but the extent to which sorption is reversible is uncertain (Horzempa and DiToro, 1983; Gschwend and Wu, 1985; Walters and others, 1986). Because of the tendency of PCBs to adsorb to soils, their concentration in ground water is usually low, but they may be sorbed onto dissolved organic carbon and aquatic organisms tend to bioaccumulate PCBs even from water that has very low PCB concentrations (National Research Council, 1979).
39

The chemical behavior of PCBs indicates that they can be transported by water as both dissolved and suspended load. Transport as suspended load is primarily a surface-water process, whereas transport as dissolved load takes place in both ground-water and surface-water systems. To study the transport of PCBs by streams, both suspended and dissolved loads were considered. In discussing transport in ground water, only the dissolution process was considered.
Methods of PCB AnalysisThirteen whole-water samples for determination of total PCB concentrations in stream
water were collected periodically from 1982 to 1991 as part of a study on the effects of freeway construction. Six additional samples were collected during storms in November and December, 1991 as a part of this study. Samples were collected directly into the sample containers by depth- integration at a single mid-stream vertical. PCB analyses were done at the U.S. Geological Survey National Water Quality Laboratory in Arvada, Colorado, using a packed column, gas chromatograph with an electron-capture detector (Wershaw and others, 1983).
Four samples of dried stream sediment were also analyzed for PCBs. Each of these samples was a composite of suspended sediment from water samples collected during separate period of high discharge (storms). The sediment was separated from the stream water by filtration (through a glass-fiber filter with a 0.45-micrometer pore size) and dried in an oven at 105°C for approximately 1 hour.
Estimates of ground-water PCB transport rely on PCB concentrations from previous studies. Rates of application are determined from information on defoliation practices. The method applies the concentrations, application rates and estimated recharge to mass-balance calculations. Dilution and partitioning are considered in the equation, bioaccumulation is not.
PCBs in Heeia StreamThirteen whole-water samples collected from Heeia Stream between October, 1982 and
September, 1991, all had PCB concentrations below detection limits of 0.1 |Xg/L (Wong and Hill, 1992). All of these samples were collected during streamflows of less than 3 ft3/s with the exception of one sample collected on March 19, 1991, at a streamflow of 33 ft3/s.
Because of relatively dry conditions since the present study began in October, 1991, only six additional storm samples were collected for PCB analyses (table 6), and none of these was collected at a discharge of more than 7.34 ftVs. PCB concentrations in these water samples were below detection limits. Suspended-sediment concentrations for samples collected at about the same times as these PCB samples ranged from 6 to 354 mg/L (table 6).
The PCB concentration of the whole-water samples may be below detection level because PCBs tend to adsorb to sediment and the sediment concentrations of whole-water samples were low. To further investigate the possibility that stream sediment may transport PCBs, suspended sediment was removed from stream water samples and analyzed separately. Four composite samples of sediment collected between January, 1990, and October, 1991, had PCB concentrations ranging from 64 to 230 fig/kg (table 7).
PCB concentrations are positively correlated with the average suspended-sediment concentrations of the composite samples (fig. 19). Although based on a small number of samples, the positive correlation indicates that as sediment concentrations increase, the ratio of contaminated soil to uncontaminated material increases.
40

Table 6.-Suspended-sediment and total concentration of poly chlorinated biphenyls (PCBs) in water collected from Heeia Stream at station 16275000, November and December, 1991.
[ft3/s, cubic feet per second; mg/L, milligrams per liter; {ig/L, microgram per liter; , nodata; <, less than]
Date
11-30-9111-30-9111-30-9111-30-9111-30-9111-30-9112-18-9112-18-9112-18-9112-18-9112-18-9112-18-9112-18-91
Suspended- PCB concentration sediment in unfiltered stream
Time Streamflow concentration water
0720073507400800080208050932094010151020105510581147
re 19. Relation betweenilorinated biphenyls (PCB)
(ft3/s) (mg/L) ftig/L)1.41 -- <0.11.35 151.33 111.32 -- <0.11.32 61.32 61.20 111.22 - <0.11.50 -- <0.11.50 1951.39 -- <0.11.39 3541.38 -- <0.1
f\ Af\
240 1 1 1 1 1 1
220 -
O
g 200 -
2S 180 -0- h-
1 1I g 160 -
1 § | Z 140 - Q.z w P- co5 120 -
UJ O Z ,00-
CD
°- 80 -
fin I * I I I I Iconcentrations and suspended- sediment concentrations in
Heeia Stream.
2,000 2,500 3,000 3,600 4,000 4,500 5,000 5,500
SUSPENDED-SEDIMENT CONCENTRATION.
IN MILLIGRAMS PER LITER
41

Results for October 16, 1991 (table 7) indicate that detectable PCB transport past station 16275000 was occurring at least as late as that date. A single bed-material sample collected near station 16275000 in September 1991, had a PCB concentration of 12 |ig/kg, indicating that some contamination of stream sediments had occurred and was detectable in the relatively coarse bed sediments at that time.
Table 1 . Concentrations of polychlorinated biphenyls (PCB) in composite suspended-sediment samples from Heeia Stream at station 16275000, water years 1990-92
[Solid-phase samples analyzed after filtration and drying at 105°C for one hour; detection levelfor PCBs is about 10 micrograms per kilogram (fig/kg); ft, feet; ft3/s, cubic feet per second; mg/L, milligrams per liter, g, grams]
Date
01-16-9001-16-9001-16-90
01-19-9001-19-90
03-19-9103-19-9103-19-9103-23-9103-23-9103-23-9103-23-91
10-16-9110-16-9110-16-9110-16-9110-16-9110-16-9110-16-9110-16-91
Time
134514351630
15201630
1245131013301200122012451310
00050055090009051150121013502200
Suspended PCB Instantaneous sediment concentration in
streamflow concentration Sample mass sediment (ft3/s) (mg/L) (g) ftig/kg)12.929.930.8
Average
41.045.0
Average
32.890.0
31012510028590.0
Average
820310346346256256290
31.9Average
2,4304,2404,7403,800
6,8503,7605,300
5753,3604,1804,5001,3803,4201,2922,670
2,8302,6404,8504,2002,0301,4001,890
1122,490
2.42294.51294.8241
Total 11.7599
7.16823.9473
Total 11.1155
0.29301.67942.17472.46500.71351.87350.6008
Total 9.7999
1.46761.36032.32702.13721.03950.69500.97630.0559
Total 10.0588
140
230
64
67
42

PCBs in Ground WaterAn estimate of the potential mass of PCBs applied on the Omega Station grounds can be
obtained by the following equation:
MPCB = Ra x Ta x Df x CPCB (2)
where: MPCB = mass of PCBs appliedRa = rate at which fuel was applied, in units of mass per timeTa = length of time of applicationDf = density of fuel, in units of mass per volume
CPCB = concentration of PCBs in fuel, in units of PCB mass per fuel mass
Assuming 20 applications of 210 gal (795 L) of fuel with a density of 0.803 kg/L (density of JP5) having a PCB concentration of 5.8 mg/kg (milligrams per kilogram) over a period of 10 years (Jay Silberman, Coast Guard, written commun., 1991), a total of 74 g of PCB may have been applied to the ground. At the time of this writing (April, 1992), about 10 percent of the 0.98 mi2 drainage area of station 1627500 was believed to have been sprayed with contaminated fuel (Jeff Klein, Coast Guard, written commun., 1992). Assuming uniform application, this yields an areal concentration of 0.03 mg of PCB per square foot.
If the total 74 g of PCB was applied in equal amounts over the 10-year period and completely dissolved into recharge percolating through contaminated soil, the PCB concentration in the recharge water would be 0.016 fig/L. If the application was infrequent and most of the 74 g of PCBs was applied in a few short periods of intense defoliation, concentrations may have been higher for those periods.
Because PCBs are strongly hydrophobic, however, it is more likely that the chemical is adsorbed to soil particles. Using a soil-to-water distribution coefficient of 105 (Horzempa and DiToro, 1983) yields a more likely concentration of 1.6 x 10~7 p,g/L dissolved in water recharging through the contaminated area, if PCBs were applied uniformly over 10 years. This concentration is far below the 1:1,000,000 cancer risk level of 5 x 10~3 p,g/L listed for drinking water in the U.S. Environmental Protection Agency (USEPA) Integrated Risk Information System (IRIS) data base (USEPA, written commun., 1993).
These estimates of ground-water PCB transport are based on a number of assumptions that have the serious shortcomings described below.
1. A great deal of uncertainty exists regarding the actual amount of contaminant applied to the area. The concentration of PCBs in the underground storage tank is known only for the period after the defoliation practice was discontinued. It is not known whether the tank concentrations were higher or lower in the past.
2. A substantial fraction of the PCB applied may have been lost by combustion or volatilization (Palusky and others, 1986). An unknown amount may have also been biologically degraded.
3. Atmospheric deposition may have added PCBs to the watershed. The mean flux of atmospheric PCB to the North Pacific is estimated as 0.22 micrograms per square meter per year (Duce and others, 1991). This converts to an annual flux of 0.56 g of PCB for the area of the watershed (0.98 mi2).
4. The PCB soil-to-water distribution coefficient (105) used in these calculations is only approximate, and may not be applicable to soils in Haiku Valley. The carbon content of Hawaiian soils derived from volcanic ash is typically high in the shallow
43

subsurface but decreases quickly with depth below 2 or 3 ft (Foote and others, 1972). It is possible, depending on methods of application, that the initial infiltration of PCB- contaminated fuel may have carried the contaminant below the carbon-rich soil horizon prior to volatilization, thereby reducing the soil's ability to adsorb the contaminants. Collection and analysis of deep soil horizons is required to investigate this possibility.
5. The mass-balance calculation assumes steady-state adsorption to particles and does not consider desorption of PCBs from soils. More seriously, concentrations and fluxes are calculated using a single annual recharge value, although recharge rates vary through the year. The rate of contaminant application probably varied through the year.
6. Infiltration by channelized flow through fractures may occur in the upper soil layers, which may lead to localized, high flow velocities sufficiently rapid to prevent equilibrium partitioning of the contaminant onto soils.
7. The mass-balance calculation also assumes that all of the PCBs reached the soil, but much of the PCBs may have been burned or moved with vegetation to other locations before it reached the ground.
SUMMARY AND CONCLUSIONSMost of the U.S. Coast Guard Omega Station and the area believed to have been sprayed
with PCB-contammated fuel directly overlie the pyroclastic deposits of the Honolulu Volcanics. The extent of the pyroclastics is greater and more continuous than previously mapped. The pyroclastics are coarse and apparently permeable in many places and form a lenticular body underlain by a less-permeable massive lava flow, older alluvium, and weathered basalt. This stratigraphy may promote preferential horizontal flow of ground water in the Honolulu Volcanics.
Drilling logs indicate that well 2450-2 penetrated two aquifer systems, one shallow and one deep. The shallow aquifer is formed by the pyroclastics of the Honolulu Volcanics, and the deeper aquifer is formed by the dike-intruded Koolau Basalt. The two aquifers are separated by a massive lava flow, older alluvium, and weathered basalt which retards, but does not necessarily prevent, vertical flow.
Heeia Stream gains flow from ground-water discharge along all reaches in between sites 1 and 8 (fig. 12). The stream has a persistent base flow, which measures 1 to 2 ft3/s at the U.S. Geological Survey stream-gaging station 16275000. Ground water discharges into Heeia Stream from springs below 520 ft elevation. Greatest volumes of ground-water discharge occurred between seepage-run measuring sites 2 and 3 and between 7 and 8 (figs. 12 and 13).
Water-balance calculations indicate that a large quantity of ground-water recharge (5.1 ft3/s) takes place in Haiku Valley above gaging station 16275000. About 10 percent of this water infiltrates through soils in areas believed to have been sprayed with PCB-contaminated fuel. Water infiltrating the areas of possible contamination travels two principal routes. Part of the water flows through the shallow, permeable pyroclastics of the Honolulu Volcanics, and is discharged to the stream. Part of the water passes to deeper aquifers and emerges at wells and springs within and beyond the Omega Station boundary. Any contaminants dissolved in the ground water are subject to the same flow paths. A mass-balance calculation of possible contaminant concentrations indicates that the concentration of PCBs dissolved in ground water will be very low, on the order of to 10"7 |ig/L. The calculation, however, makes many assumptions where data are lacking. Of particular note is the lack of information regarding the PCB concentration in, and volume of, the contaminated fuel used for defoliation.
44

Water-balance calculations also indicate that water withdrawn from the Haiku water tunnel originates partly from recharge in Haiku Valley and partly from outside the valley. The rate at which water is being withdrawn from the tunnel exceeds the quantity of estimated recharge from within the valley to the dike compartment from which the tunnel draws its water. Either storage in the dike compartment is being depleted or recharge to the compartment comes partly through the subsurface from outside Haiku Valley.
Analyses of suspended sediment from Heeia Stream indicate that PCBs are being transported past stream-gaging station 16275000 at the downstream boundary of the Omega Station site. PCB concentrations on suspended sediment separated from Heeia Stream water measured between 64 (ig/kg and 230 (ig/kg. PCB concentrations in whole-water samples from Heeia Stream were below the detection limit of 0.1 (ig/L but the amounts of sediment in the water samples were low.
Whether sediments are carried in high concentrations or not, they tend to be deposited in quiet reaches of the stream and the PCBs they carry may accumulate there. Small amounts of fine sediment accumulate in the steeper upstream channels. Fine sediment in Heeia Stream is deposited mostly in the wetland near the coast The potential for PCB accumulation within fine sediment deposits is therefore greater in the wetland than in the upstream reaches.
REFERENCES CITEDBretthauer, E.W., Kraus, H.W., and di Domencio, A., 1991, Dioxin perspectives: a pilot study on
international information exchange on dioxins and related compounds: New York, PlenumPress, 772 p.
Chang, J.H., 1968, Climate and agriculture, an ecological survey: Chicago, Aldine PublishingCo., 304 p.
Clague, D.A., and Dalrymple, G.B., 1987, The Hawaiian-Emperor volcanic chain, Part 1:Geologic evolution, chap. 1 of Decker, R.W., Wright, T.L., and Stauffer, P.H., eds.,Volcanism in Hawaii, U.S. Geological Survey Professional Paper 1350, v. 1, p. 5-54.
Dalrymple, Tate, and Benson, M.A., 1967, Measurement of peak discharge by the slope-areamethod: U.S. Geological Survey Techniques of Water-Resources Investigations, book 3,chap. A-2, 12 p.
Doell, R.R, and Dalrymple, G.B., 1973, Potassium-argon ages and paleomagnetism of theWaianae and Koolau Volcanic Series, Oahu, Hawaii: Geological Society of AmericaBulletin, v. 84, p.1217-1242.
Duce, R. A., Liss, P. S., Merrill, J. T., Atlas, E. L., Buat-Menard, P., Hicks, B.B., Miller, J. M.,Prospero, J. M., Arimoto, R., Church, T. M., Ellis, W., Galloway, J. N., Hansen, L.,Jickells, T. D., Knap, A. H., Reinhardt K. H., Schneider, B., Soudine, A., Tokos, J. J.,Tsunogai, S., Wollast, R., Zhou, M., 1991, The atmospheric input of trace species to theworld ocean. Global Biogeochemical Cycles, v. 5, p. 193-259.
Ekern, P.C., and Chang, J.H., 1985, Pan evaporation: State of Hawaii, Department of Land andNatural Resources, Report R74.
Edwards, T.K., and Glysson, G.D., 1988, Field methods for measurement of fluvial sediment:U.S. Geological Survey Open-File Report 86-531,118 p.
Feltz, H.R., 1980, Significance of bottom material data in evaluating water quality, in Baker,R.A., ed., Contaminants and sediments, volume 1, fate and transport, case studies,modeling, toxicity: Ann Arbor, Michigan, Ann Arbor Science Publishers, p. 271-288.
Foote, D.E., Hill, E.L., Nakamura, S., and Stephens, F., 1972, Soil survey of the islands ofKauai, Oahu, Maui, Molokai, and Lanai, State of Hawaii: U.S. Department of Agriculture,Soil Conservation Service, 232 p.
45

Giambelluca, T. W., Nullet, M.A., and Schroeder, T.A., 1986, Rainfall atlas of Hawaii: State of Hawaii, Department of Land and Natural Resources, Report R76, 276 p.
Gschwend, P.M., and Wu, S., 1985, On the constancy of sediment-water partition coefficients of hydrophobic organic pollutants: Environmental Science and Technology, v. 19, p. 90-96.
Guy, H.P., 1969, Laboratory theory and methods for sediment analysis: Techniques of Water- Resources Investigations of the U.S. Geological Survey, book 5, chap. Cl, 58 p.
Haque, R., Schmedding, D.W., and Freed, V.H., 1974, Aqueous solubility, adsorption, and vapor behavior of polychlorinated biphenyl Arochlor 1254: Environmental Science and Technology, v. 8, p. 139-142.
Hill, B.R., and DeCarlo, E.H., 1991, Effects of highway construction on suspended-sediment concentrations in two small drainage basins on Oahu, Hawaii, in State of Washington Water Research Center Report 78, Proceedings from the technical sessions of the regional conference nonpoint source pollution, the unfinished agenda for the protection of our water quality: March 20-21, Tacoma, Washington, p. 303-313.
Hirashima, G.T., 1962, Effect of the Haiku Tunnel on Kahaluu Stream, Oahu, Hawaii: U.S. Geological Survey Professional Paper 450C, p. 118-120.
Horzempa, L. M., and DiToro, D. M., 1983, The extent of reversibility of polychlorinated biphenyl adsorption: Water Research, v. 17, p. 851-859.
Jackson, D.R., Roulier, M.H., Grotta, H.M., Rust, S.W., and Warner, J.S., 1986, Solubility of 2,3,7,8-TCDD in contaminated soils, in Rappe, C, Choudhary, G., and Keith, L, eds., Chlorinated dioxins and dibenzofurans in perspective: Michigan, Lewis Publishers, p. 185-200.
Karickhoff, S.W., Brown, D.S., and Scott, T.A., 1979, Sorption of hydrophobic pollutant on natural sediments: Water Research, v. 13, 241-248.
Langbein, W.B., and Iseri, K.T., 1961, General introduction and hydrologic definitions: Manual of Hydrology, Part 1, General Surface-Water Techniques, U.S. Geological Survey Water- Supply Paper 1541-A, 29 p.
Langenheim, V.A.M., and Clague, D.A., 1987, The Hawaiian-Emperor volcanic chain, Part 2: Stratigraphic framework of volcanic rocks in the Hawaiian Islands, chap. 2 of: Decker, R.W., Wright, T.L., and Stauffer, P.H., eds., Volcanism in Hawaii, U.S. Geological Survey Professional Paper 1350, v. 1, p. 55-84.
Macdonald, G.A., 1972, Volcanoes: Englewood Cliffs, N.J., Prentice-Hall, 510 p.Macdonald, G. A., Abbott, A. T., and Peterson, F.T., 1983, Volcanoes in the sea, the geology of
Hawaii (2nd ed.): University of Hawaii Press, Honolulu, 517 p.Matsuoka, L, Tateishi, G.A., Lum, M.G., and Kunishige, V.E., 1991, Water resources data,
Hawaii and other Pacific areas, v. 1, Hawaii: U.S. Geological Survey Data Report HI-90-1, 290 p.
Means, J.C., Wood, S.G., Hassett, J.J., and Banwart, W.L., 1980, Sorption of polynuclear aromatic hydrocarbons by sediment and soils: Environmental Science and Technology, v. 14, p. 1524-1528.
Metcalfe, D.E., Zukovs, G., Mackay, D., and Patterson, S., 1986, Polychlorinated biphenyls(PCBs) physical and chemical property data, in Crine, J.P. (ed.), Hazards, decontamination, and replacement of PCB: A comprehensive guide: New York, Plenum Press, p. 3-33.
Mill, R., 1985, Prediction of the environmental rate of tetrachlorodibenzodioxin, in M.A. Kamrin and P.W. Rodgers, (eds.), Dioxins in the environment: Hemisphere Publishing, Washington, p. 173-193.
46
National Research Council, 1979, Polychlorinated biphenyls: Washington D.C., NationalAcademy of Sciences, 182 p.
Oloffs, P.C., Albright, L.J., Szeto, S.Y., and Lau, J., 1973, Factors affecting the behavior of fivechlorinated hydrocarbons in two natural waters and their sediments: Journal of the FisheriesResearch Board, Canada, v. 30, p. 1619-1623.
Palusky, J., Harwood, J.J., Clevenger, T.E., Kapila, S., and Yanders, A.F., 1986, Disposition oftetrachlorodibenzo-p-dioxin in soil, in Rappe, C, Choudhary, G., and Keith, L., eds.,Chlorinated dioxins and dibenzofurans in perspective: Ann Arbor, Mich., Lewis Publishers,p. 211-223.
Pavlou, S.P., 1980, Thermodynamic aspects of equilibrium sorption of persistent organicmolecules at the sediment-seawater interface: a framework for predicting distributions inthe aquatic environment, in Baker, R.A., ed., Contaminants and sediments, v. 2, analysis,chemistry, and biology: Ann Arbor, Mich., Ann Arbor Science Publishers, p. 323-332.
Porterfield, George, 1972, Computation of fluvial sediment discharge: Techniques of Water- Resources Investigations of the U.S. Geological Survey, book 3, chap. C3, 66 p.
Rantz, S.E., and others, 1982a, Measurement and computation of streamflow: Volume 1.Measurement of stage and discharge: U.S. Geological Survey Water-Supply Paper 2175,284 p.
Rantz, S.E., and others, 1982b, Measurement and computation of streamflow: Volume 2.Computation of discharge: U.S. Geological Survey Water-Supply Paper 2175, 346 p.
Sittig, Marshall, 1985, Handbook of toxic and hazardous chemicals and carcinogens (2nd ed.):Park Ridge, N.J., Noyes Publications, 950 p.
Smith, J.A., Witkowsky, P.J., Fusillo, T.V., 1987, Manmade organic compounds in the surfacewaters of the United States, a review of current understanding: U.S. Geological SurveyOpen-File Report 87-209, 182 p.
State of Hawaii, Department of Transportation, 1990, Interstate Route H-3 Trans-Koolauexploratory tunnel, Haiku approach and tunnels geology: State of Hawaii, Department ofTransportation, 102 p.
Stearns, H. T., 1939, Geologic map and guide of Oahu, Hawaii: Hawaii Division ofHydrography, Bulletin 2,75 p., 1 map sheet, scale 1:62,000.
Stearns, H.T., and Vaksvik, K.N., 1935, Geology and ground water resources of the Island ofOahu, Hawaii: Hawaii Division of Hydrography, Bulletin 1,479 p.
Takasaki, K. J., Hirashima, G. T., and Lubke, E. R., 1969, Water resources of windward Oahu:U.S. Geological Survey Water-Supply Paper 1894, 119 p.
Takasaki, K. J., and Mink, J. F., 1985, Evaluation of major dike-impounded ground-waterreservoirs, island of Oahu: U.S. Geological Survey Water-Supply Paper 2217, 77 p.
Thornthwaite, C.W., 1948, An approach toward a rational classification of climate: GeographicReview, v. 38, p. 55-94.
Thornthwaite C.W., and Mather, J.R., 1955, The water budget and its use in irrigation, in Water,The Yearbook of Agriculture 1955: U.S. Department of Agriculture, 346-358.
Visher, F. N. and J. F. Mink, 1969, Ground water resources in southern Oahu, Hawaii:Geological Survey Water-Supply Paper 1778,133 p.
Walker, G.P.L., 1987, The dike complex of the Koolau Volcano, Oahu, Internal structure of aHawaiian rift zone, chap. 41 0/Decker, R.W., Wright, T.L., and Stauffer, P.H., eds.,Volcanism in Hawaii: U.S. Geological Survey Professional Paper 1350, v. 2, p. 961-993.
47

Walters R.W., Guiseppi-Eile, A., Rao, M., and Means, J.C., 1986, Desorption of 2,3,7,8-TCDDfrom soils into water/methanol and methanol liquid phases, in Rappe, C, Choudhary, G.,and Keith, L., eds., Chlorinated dioxins and dibenzofurans in perspective: Mich., LewisPublishers, p. 157-169.
Weber, WJ., Voice, T.C., Pirbazari, M., Hunt, G.E., and Ulanoff, D.M., 1983, Sorption ofhydrophobic compounds by sediments, soils, and suspended solids-H: Water Research, v.17, p. 443-1452.
Wentworth, C. K., 1938, Geology and ground-water resources of the Palolo-Waialae District,Honolulu: Board of Water Supply, Honolulu, Hawaii, 274 p.
Wentworth, C. K., 1942, Geology and ground water resources of the Moanalua-Halawa District:Board of Water Supply, Honolulu, Hawaii, 156 p.
Wentworth, C. K., 1943, Soil avalanches in on Oahu, Hawaii: Bulletin of the Geological Societyof America, v. 54, p. 53-64.
Wentworth, C. K., 1951, Geology and ground water resources of the Honolulu-Pearl Harborarea, Oahu, Hawaii: Board of Water Supply, Honolulu, Hawaii, 111 p.
Wershaw, R.L., Fishman, M.J., Grabbe, R.R., and Lowe, L.E., 1983, Methods for thedetermination of organic substances in water and fluvial sediments: U.S. Geological SurveyTechniques of Water-Resources Investigations, book 5, Laboratory Analysis, chap. A3,Open-File Report 82-1004, 173 p.
Williams, J.A., and Soroos, R.L., 1973, Evaluation of methods of pumping test analyses forapplication to Hawaiian aquifers: University of Hawaii Water Resources Research CenterTechnical Report No. 70. 159 p.
Winchell, Horace, 1947, Honolulu Series, Oahu, Hawaii: Bulletin of the Geological Society ofAmerica, V. 58, p. 1-^8.
Wong, M.F., and Hill, B.R., 1992, Statistical summary of hydrologic and water-quality data fromthe North Halawa, Haiku, and Kamooalii drainage basins, Oahu, Hawaii, water years 1983-89: U.S. Geological Survey Water-Resources Investigations Report 92-4049, 52 p.
Woodward-Clyde Consultants, 199la, Soil sampling and chemical analyses of U.S. Coast GuardOmega Station, Haiku Valley, Oahu, Hawaii: Prepared for U.S. Army EngineeringDivision, Honolulu, Hawaii. 21 p., attachments.
Woodward-Clyde Consultants, 1991b, Soil and water sampling and chemical analyses of U.S.Coast Guard Omega Station, Haiku Valley, Oahu, Hawaii: Prepared for U.S. Army Corpsof Engineers Pacific Ocean Division, Honolulu, Hawaii, 8 p., attachments.
48