GEOGRAPHY - Victorian Curriculum and Assessment · PDF fileWhich of the following statements...
22
GEOGRAPHY Written examination Thursday 14 November 2002 Reading time: 11.45 am to 12.00 noon (15 minutes) Writing time: 12.00 noon to 2.00 pm (2 hours) QUESTION AND ANSWER BOOK Structure of book Number of Number of questions Number of questions to be answered marks 4 4 60 Figures Words STUDENT NUMBER Letter SUPERVISOR TO ATTACH PROCESSING LABEL HERE Victorian Certificate of Education 2002 VICTORIAN CURRICULUM AND ASSESSMENT AUTHORITY 2002 • Students are permitted to bring into the examination room: pens, pencils, highlighters, erasers, sharpeners and rulers. • Students are NOT permitted to bring into the examination room: blank sheets of paper and/or white out liquid/tape. • No calculator is allowed in this examination. Materials supplied • Question and answer book of 14 pages. • A data book. Instructions • Write your student number in the space provided above on this page. • All written responses must be in English. At the end of the examination • You may keep the data book. Students are NOT permitted to bring mobile phones and/or any other electronic communication devices into the examination room.
Transcript of GEOGRAPHY - Victorian Curriculum and Assessment · PDF fileWhich of the following statements...
GEOGRAPHY
Written examination
Thursday 14 November 2002
Reading time: 11.45 am to 12.00 noon (15 minutes)Writing time: 12.00 noon to 2.00 pm (2 hours)
QUESTION AND ANSWER BOOK
Structure of book
Number of Number of questions Number ofquestions to be answered marks
4 4 60
Figures
Words
STUDENT NUMBER Letter
SUPERVISOR TO ATTACH PROCESSING LABEL HEREVictorian Certificate of Education2002
VICTORIAN CURRICULUM AND ASSESSMENT AUTHORITY 2002
• Students are permitted to bring into the examination room: pens, pencils, highlighters, erasers,sharpeners and rulers.
• Students are NOT permitted to bring into the examination room: blank sheets of paper and/or whiteout liquid/tape.
• No calculator is allowed in this examination.
Materials supplied• Question and answer book of 14 pages.• A data book.
Instructions• Write your student number in the space provided above on this page.
• All written responses must be in English.
At the end of the examination• You may keep the data book.
Students are NOT permitted to bring mobile phones and/or any other electronic communicationdevices into the examination room.
GEOG EXAM 2
Question 1 – continued
Question 1Use Figure 1 on pages 2 and 3 of the data book when responding to Question 1a and Question 1b.
a. The Recreation Reserve centred on grid reference 552725 is a human resource. Classify this resource inone other way. Justify your classification.
i. Classification
ii. Justification
1 + 1 = 2 marks
(suggested time: 4 minutes)
b. Describe one way the recreation reserve might spatially interact with one other human resource shown inthe map region.
2 marks
(suggested time: 4 minutes)
Instructions
Answer all questions in the spaces provided in this book. Refer to the data book as indicated.
The marks allotted to each question are indicated at the end of the question.
Suggested times for each question are indicated at the end of the question.
3 GEOG EXAM
Question 1 – continuedTURN OVER
Use Figure 1 on pages 2 and 3 of the data book when responding to Question 1c.
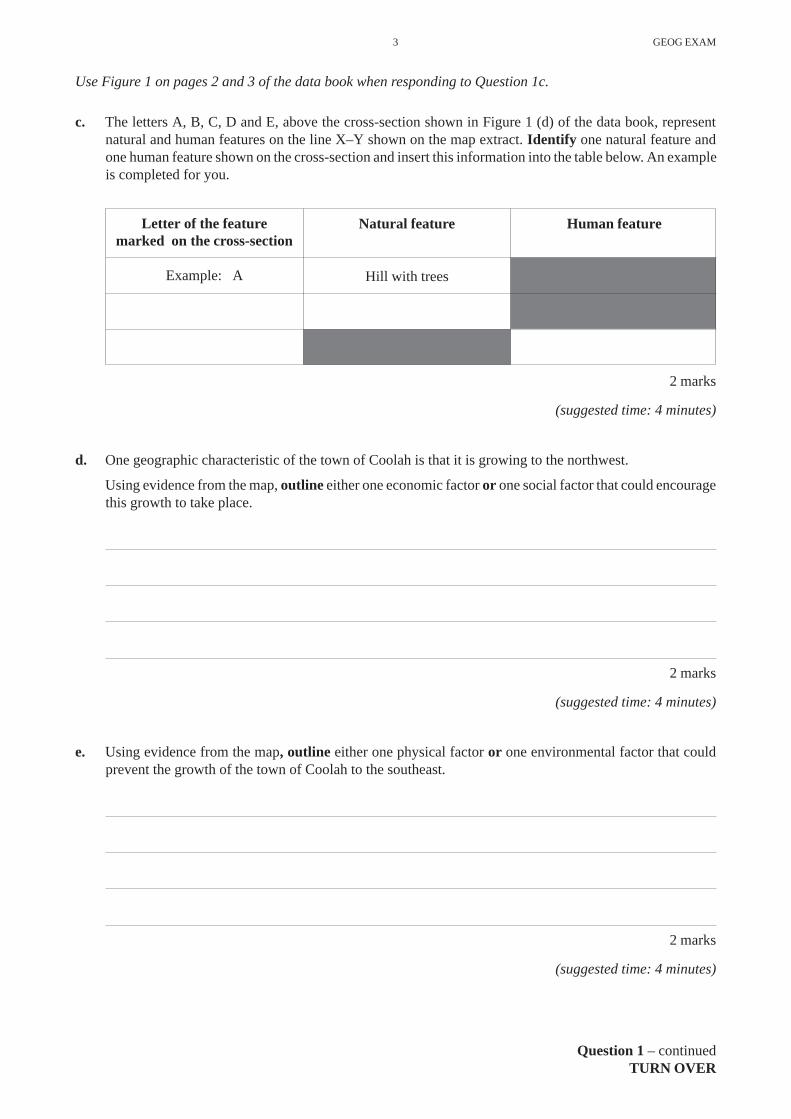
c. The letters A, B, C, D and E, above the cross-section shown in Figure 1 (d) of the data book, representnatural and human features on the line X–Y shown on the map extract. Identify one natural feature andone human feature shown on the cross-section and insert this information into the table below. An exampleis completed for you.
2 marks
(suggested time: 4 minutes)
d. One geographic characteristic of the town of Coolah is that it is growing to the northwest.
Using evidence from the map, outline either one economic factor or one social factor that could encouragethis growth to take place.
2 marks
(suggested time: 4 minutes)
e. Using evidence from the map, outline either one physical factor or one environmental factor that couldprevent the growth of the town of Coolah to the southeast.
2 marks
(suggested time: 4 minutes)
Letter of the featuremarked on the cross-section
Example: A
Natural feature
Hill with trees
Human feature

GEOG EXAM 4
f. i. Mark and identify on the map outline opposite two features that enable movement in the arealargely between the 500 metre contour lines, the town of Coolah in the north and the southern edge ofthe map.
ii. Complete the map using the following conventions: orientation, legend (key), title, scale and source.
2 + 2 = 4 marks
(suggested time: 8 minutes)
Question 1 – continued
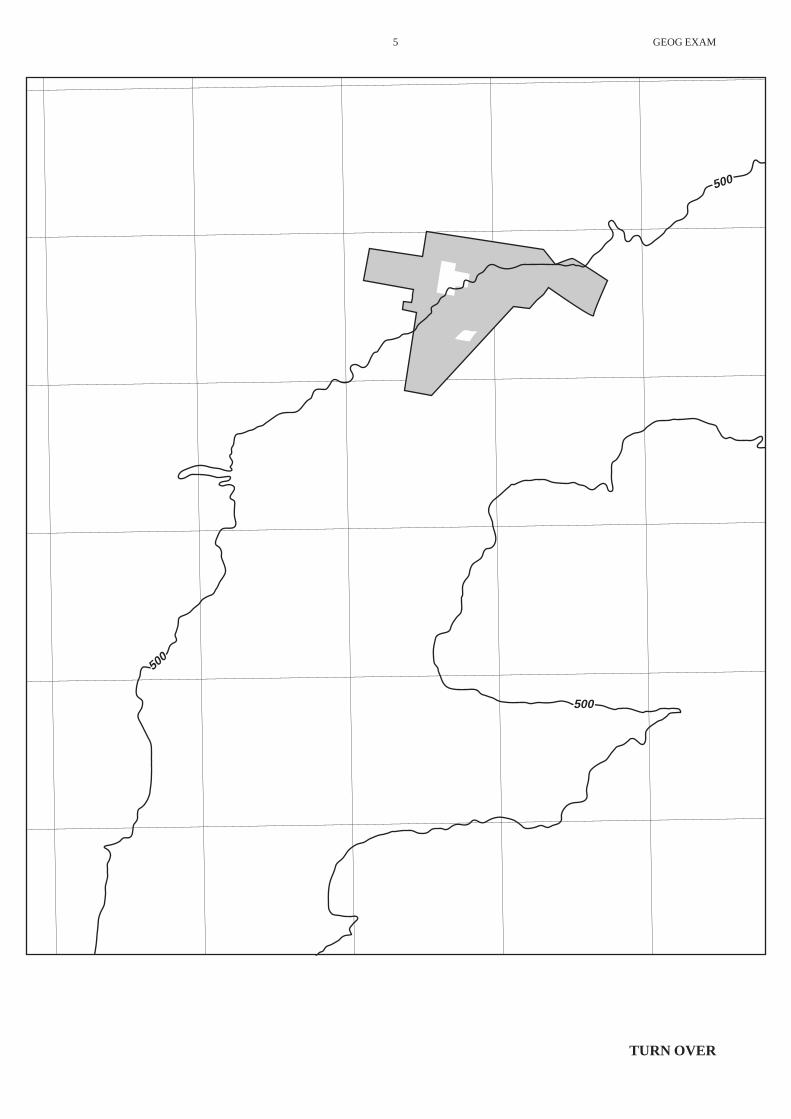
5 GEOG EXAM
TURN OVER
500
500
500

GEOG EXAM 6
Question 2Use Figure 2 (a), (b), (c) and (d) on page 4 of the data book when responding to Question 2a and Question 2b.
The geographic characteristics of reclaimed land in the Netherlands have changed over time.
a. Identify and describe one way in which the location of reclaimed land in the 20th century differs from thelocation of land reclaimed in earlier times.
b. Identify and describe one way in which the scale of reclaimed land in the 20th century differs from thescale of land reclaimed in earlier times.
3 + 3 = 6 marks
(suggested time: 12 minutes)
Question 2 – continued
7 GEOG EXAM
Question 2 – continuedTURN OVER
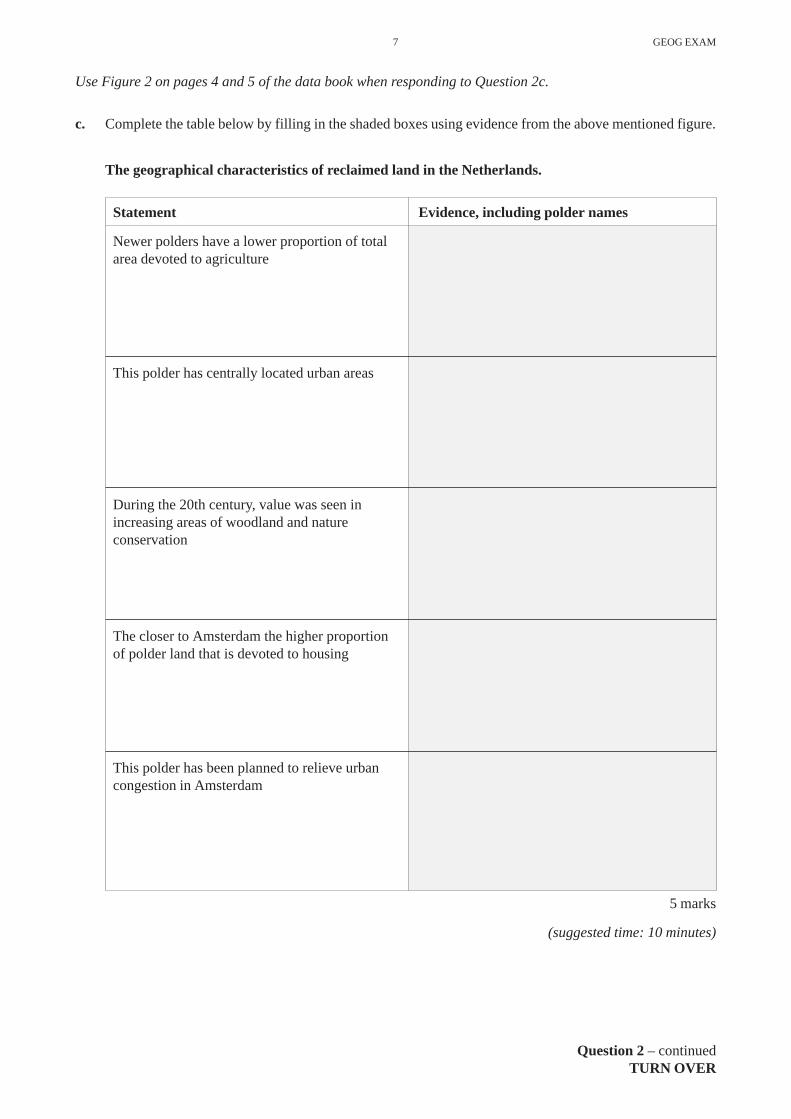
Use Figure 2 on pages 4 and 5 of the data book when responding to Question 2c.
c. Complete the table below by filling in the shaded boxes using evidence from the above mentioned figure.
The geographical characteristics of reclaimed land in the Netherlands.
Statement Evidence, including polder names
Newer polders have a lower proportion of totalarea devoted to agriculture
This polder has centrally located urban areas
During the 20th century, value was seen inincreasing areas of woodland and natureconservation
The closer to Amsterdam the higher proportionof polder land that is devoted to housing
This polder has been planned to relieve urbancongestion in Amsterdam
5 marks
(suggested time: 10 minutes)

GEOG EXAM 8
d. ‘The development of a resource impacts considerably on people and places.’
With reference to the development of a specific resource, other than one presented in this examination paper,discuss one effect of resource development on a place or one effect of resource development on people.
4 marks
(suggested time: 8 minutes)
9 GEOG EXAM
Question 3 – continuedTURN OVER
Question 3Use Figure 3 on pages 6, 7 and 8 of the data book when responding to Question 3.
a. Which of the following statements correctly describes the distribution of the global phenomena ofMediterranean climates?
i. They are located polewards of the Tropic of Cancer and the Tropic of Capricorn.
ii. They are located alongside enclosed coastlines in both the northern and southern hemispheres.
iii. They are located in small discontinuous areas on the western margins of all continents.
iv. They are located on southern coasts in the southern hemisphere and on northern coasts in the northernhemisphere.
v. They are all located on narrow coastal strips of land throughout the world.
1 mark
(suggested time: 2 minutes)
b. Which period of time, shown on Figure 3(c), is likely to be the one in which the water from the irrigationpipe, such as shown in Figure 3(e), is most needed for farming?
i. A
ii. B
iii. C
iv. D
v. E
1 mark
(suggested time: 2 minutes)
c. Throughout the world, farmers in regions with Mediterranean climates are able to produce a wide range offruit and vegetables in winter. This produce is often sold to markets in other parts of the world. Which ofthe following is the most important reason for this development?
i. Pests and diseases are less common in winter.
ii. Tourists provide a ready market for produce.
iii. Irrigation is used extensively in the Mediterranean areas.
iv. Abundant monthly rainfall extends the growing season.
v. The mild wet winters allow plant growth.
1 mark
(suggested time: 2 minutes)
GEOG EXAM 10
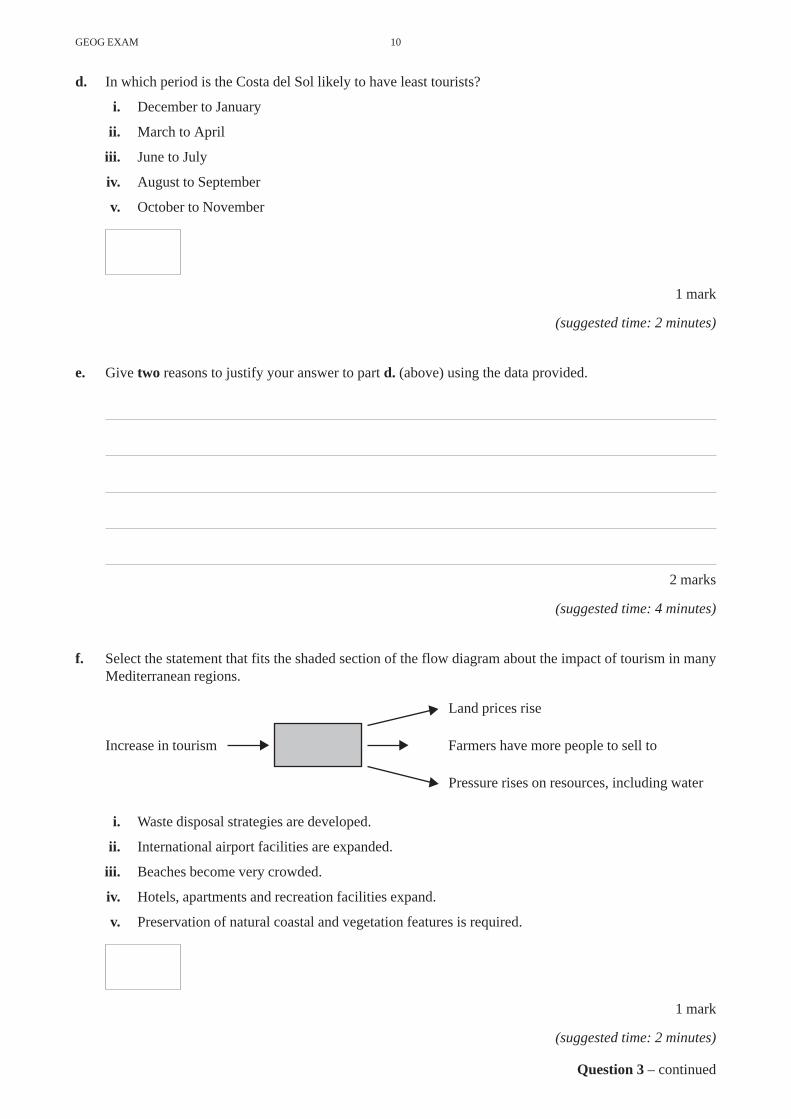
d. In which period is the Costa del Sol likely to have least tourists?
i. December to January
ii. March to April
iii. June to July
iv. August to September
v. October to November
1 mark
(suggested time: 2 minutes)
e. Give two reasons to justify your answer to part d. (above) using the data provided.
2 marks
(suggested time: 4 minutes)
f. Select the statement that fits the shaded section of the flow diagram about the impact of tourism in manyMediterranean regions.
Land prices rise
Increase in tourism Farmers have more people to sell to
Pressure rises on resources, including water
i. Waste disposal strategies are developed.
ii. International airport facilities are expanded.
iii. Beaches become very crowded.
iv. Hotels, apartments and recreation facilities expand.
v. Preservation of natural coastal and vegetation features is required.
1 mark
(suggested time: 2 minutes)
Question 3 – continued
11 GEOG EXAM
g. Which statement correctly describes the spatial association between the distribution of Mediterraneanclimates and grape-growing regions throughout the world?
i. A strong spatial association exists throughout the world.
ii. A weak spatial association exists throughout the world.
iii. The spatial association is strongest in North America.
iv. The spatial association is strongest in northern Europe.
v. The spatial association is weakest in Australia.
1 mark
(suggested time: 2 minutes)
Use Figure 3g of the data book when responding to Question 3h.
h. Explain the effects of resource development on the changing number of tourists visiting Spain’s Costa delSol region since the 1960s.
4 marks
(suggested time: 8 minutes)
i. Based on the evidence provided in Figure 3 of the data book, suggest a management policy for the 2000sto reverse the decline in tourist numbers in Spain’s Costa del Sol region.
2 marks
(suggested time: 4 minutes)
TURN OVER

GEOG EXAM 12
Question 4 – continued
Question 4
a. Use the world outline map provided to show the distribution of a global phenomenon created by humanactivity. You must use a phenomenon that has not been used previously in this examination paper.
4 marks
(suggested time: 8 minutes)

13 GEOG EXAM
b. Discuss the relative importance of two factors responsible for this distribution shown in part a.
6 marks
(suggested time: 12 minutes)
Question 4 – continuedTURN OVER

GEOG EXAM 14
c. Evaluate the policies developed to manage this phenomenon at three different scales – global, regional/national and local.
7 marks
(suggested time: 14 minutes)
END OF QUESTION AND ANSWER BOOK

Written examination
GEOGRAPHY
DATA BOOK
Thursday 14 November 2002
Reading time: 11.45 am to 12.00 noon (15 minutes)Writing time: 12.00 noon to 2.00 pm (2 hours)
© VICTORIAN CURRICULUM AND ASSESSMENT AUTHORITY 2002
• A question and answer book is provided with this data book.
• Refer to the data in this book for each question as indicated in the question and answer book.
• The data contained in this book is drawn from current real world case studies.
Directions to students
Victorian Certificate of Education2002
Students are NOT permitted to bring mobile phones and/or any other electronic communicationdevices into the examination room.

GEOG DATA 2
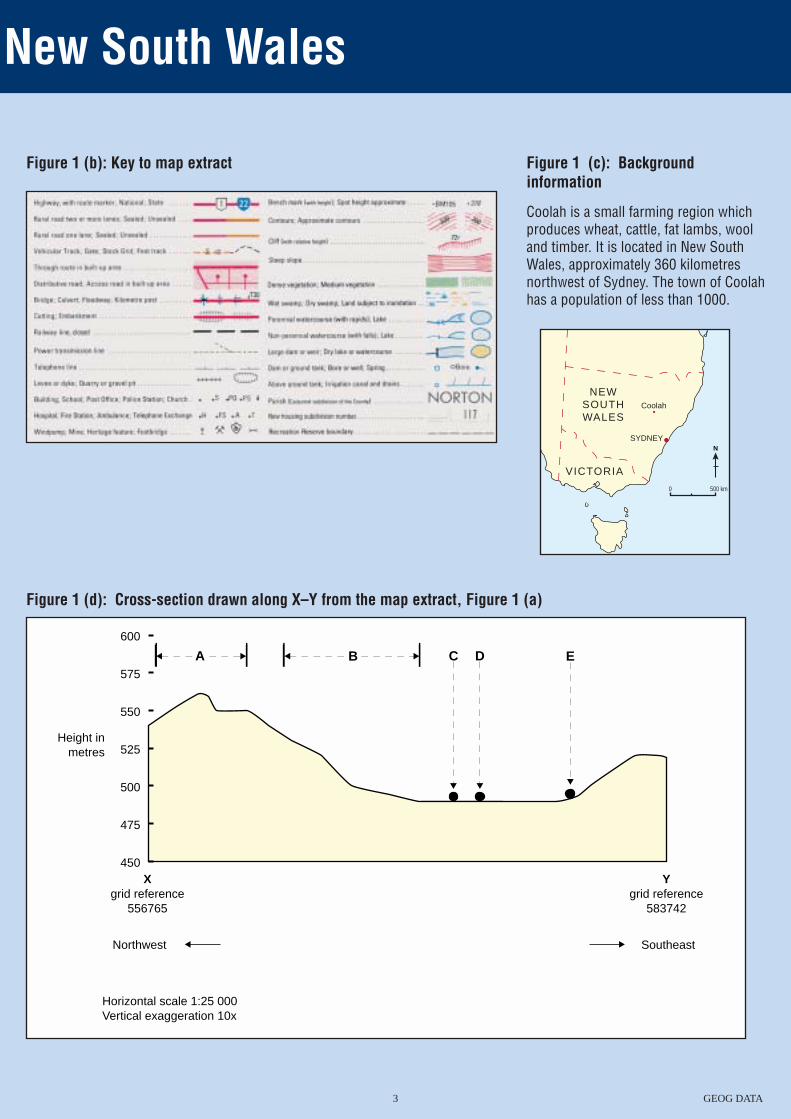
Figure 1 (a): Map extract 1:25 000
Figure 1: Coolah,
Source: Central Mapping Authority of New South Wales
3 GEOG DATA
450
475
500
525
550
575
600
A B C D E
Xgrid reference
556765
Ygrid reference
583742
Northwest Southeast
Horizontal scale 1:25 000Vertical exaggeration 10x
Height inmetres
Figure 1 (b): Key to map extract
Figure 1 (d): Cross-section drawn along X–Y from the map extract, Figure 1 (a)
New South Wales
Figure 1 (c): Backgroundinformation
Coolah is a small farming region whichproduces wheat, cattle, fat lambs, wooland timber. It is located in New SouthWales, approximately 360 kilometresnorthwest of Sydney. The town of Coolahhas a population of less than 1000.
Coolah
SYDNEY
NEW�SOUTHWALES
VICTORIA
N
500 km0

GEOG DATA 4
Figure 2: TheFigure 2 (b): Background information
The Netherlands is a nation that is small in size (less than 20 percent the size of Victoria) but with a population of over 15.5 million.Much of the Netherlands’ topography is a delta. Almost a quarter ofthe total national land area is below sea level. This land is protectedfrom flooding by a complex system of retaining walls, embankmentsand dams. For over 800 years the inhabitants of this region haveworked to reclaim wet areas for farming and settlement. In the 20thcentury large scale reclamations occurred in the region borderingIJsselmeer (Lake IJssel). Reclaimed areas (called polders) have avariety of land uses including farming and settlement.
Figure 2 (c): The Netherlands reclamation areas, 1200–2000 Figure 2 (d): The Netherlands, 1500
Figure 2 (a): Location
WADDEN-ZEE
N O R T H S E A
Groningen
Amsterdam
Utrecht
Almere
Rotterdam
Den Haag
G E R M A N Y
B E L G I U M
Land reclamation 1200—1600
Land reclamation 1600—1900
Land reclamation 1900—2000
Major polders:� 1 Wieringermeer
� 2 North East Polder
� 3 East Flevoland
� 4 South Flevoland 1
Major urban area
Major river
International boundary
0 10 20 30 40 50 60 70
0 50 km
80 km
present day urban area � present international boundaries
N
N
2c
2d
IJSSEL- MEER
3
4
2
5 GEOG DATA
e Netherlands
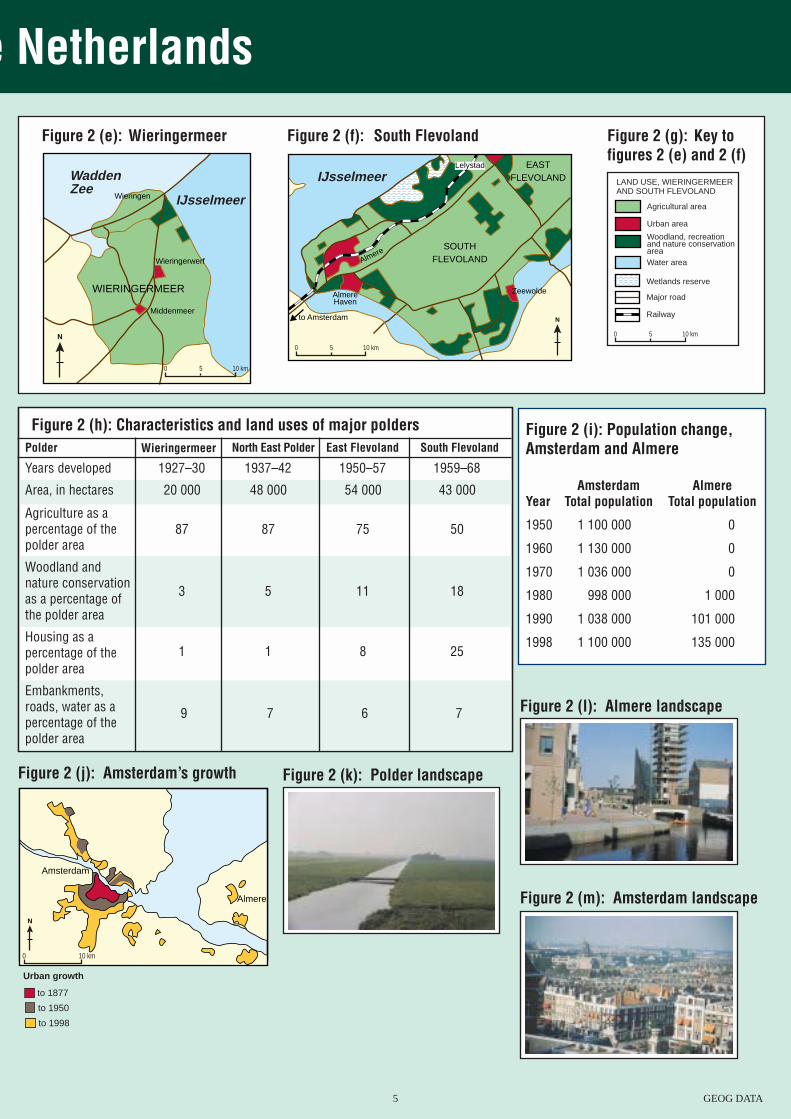
Figure 2 (e): Wieringermeer
Figure 2 (j): Amsterdam’s growth
Wieringerwerf
Middenmeer
WIERINGERMEER
Wieringen
N
WaddenZee
IJsselmeer
0 5 10 km
Almere�Haven
to Amsterdam
Almere
Zeewolde
SOUTH�FLEVOLAND
EAST�FLEVOLAND
N
Lelystad
IJsselmeer
0 5 10 km
Agricultural area
Water area
Urban area
Major road
Railway
Woodland, recreation�and nature conservation�area
Wetlands reserve
LAND USE, WIERINGERMEER �AND SOUTH FLEVOLAND
0 5 10 km
Figure 2 (f): South Flevoland Figure 2 (g): Key tofigures 2 (e) and 2 (f)
Figure 2 (i): Population change,Amsterdam and Almere
Amsterdam AlmereYear Total population Total population
1950 1 100 000 0
1960 1 130 000 0
1970 1 036 000 0
1980 998 000 1 000
1990 1 038 000 101 000
1998 1 100 000 135 000
Figure 2 (h): Characteristics and land uses of major poldersPolder Wieringermeer North East Polder East Flevoland South Flevoland
Years developed
Area, in hectares
1927–30 1937–42 1950–57 1959–68
20 000 48 000 54 000 43 000
87 87 75 50
Woodland andnature conservationas a percentage ofthe polder area
3 5 11 18
Housing as apercentage of thepolder area
1 1 8 25
Embankments,roads, water as apercentage of thepolder area
9 7 6 7
Agriculture as apercentage of thepolder area
Amsterdam
Almere
N
0 10 km
to 1877
Urban growth
to 1950
to 1998
Figure 2 (l): Almere landscape
Figure 2 (k): Polder landscape
Figure 2 (m): Amsterdam landscape
GEOG DATA 6
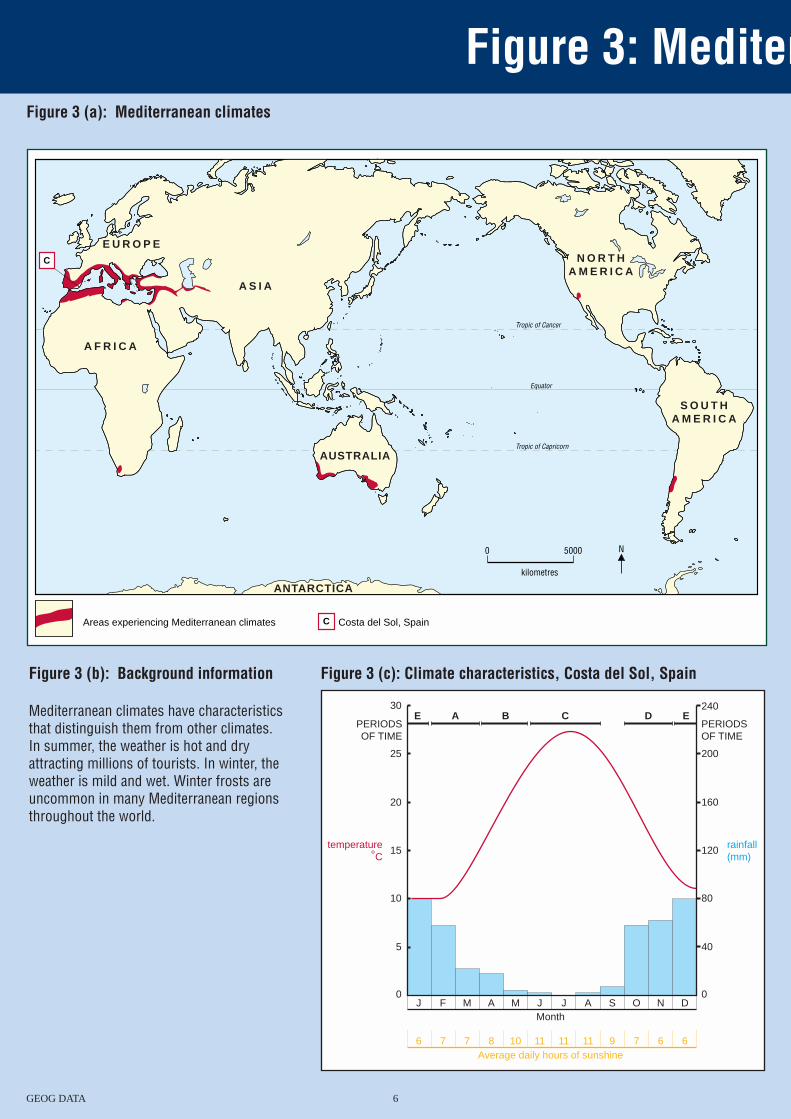
Figure 3 (a): Mediterranean climates
Figure 3: Mediter
Tropic of Cancer
Equator
Tropic of Capricorn
5000
kilometres
0 N
E U R O P E
A F R I C A
A S I A
N O R T H �A M E R I C A
S O U T H �A M E R I C A
AUSTRALIA
ANTARCTICA
Areas experiencing Mediterranean climates Costa del Sol, SpainC
C
Figure 3 (b): Background information
Mediterranean climates have characteristicsthat distinguish them from other climates.In summer, the weather is hot and dryattracting millions of tourists. In winter, theweather is mild and wet. Winter frosts areuncommon in many Mediterranean regionsthroughout the world.
J F M A M J JMonth
5
0
10
15
20
25
40
0
80
120
160
200
24030
A S O N D
Average daily hours of sunshine6 7 7 8 10 11 11 11 9 7 6 6
PERIODS�OF TIME
E A B C D EPERIODS�OF TIME
rainfall(mm)
temperature C
Figure 3 (c): Climate characteristics, Costa del Sol, Spain
7 GEOG DATA
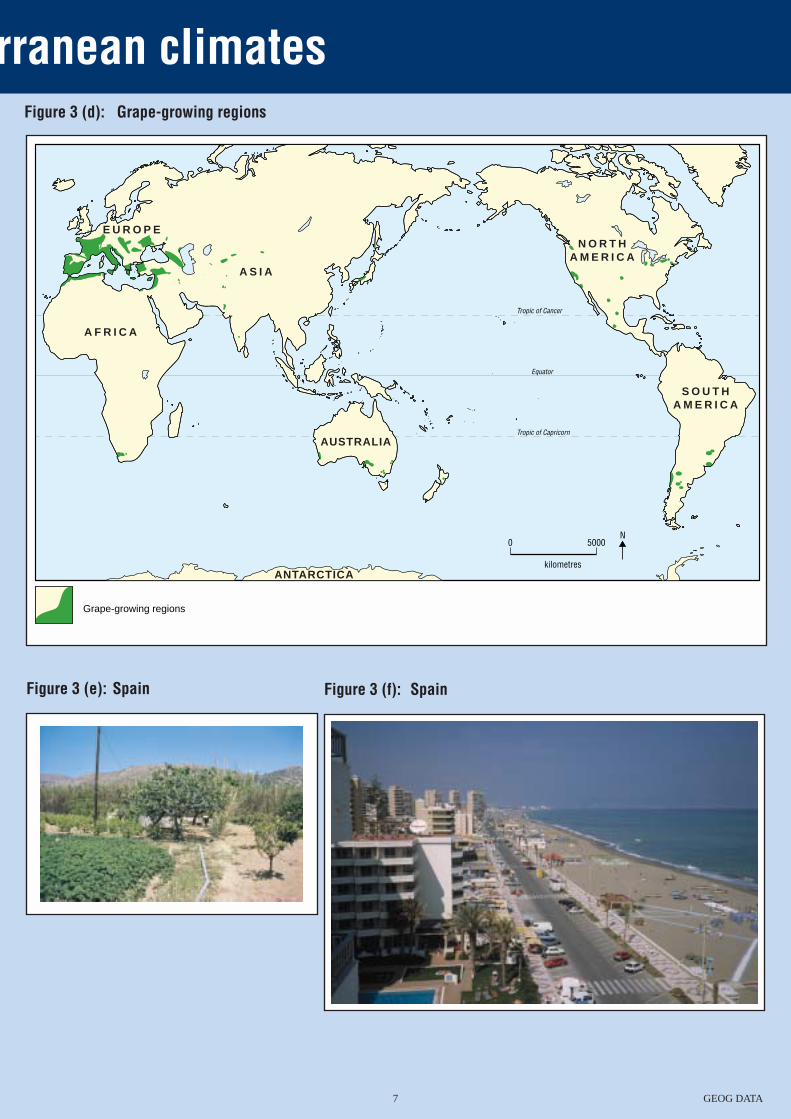
Figure 3 (d): Grape-growing regions
Figure 3 (e): Spain
rranean climates
Tropic of Cancer
Equator
Tropic of Capricorn
N
A S I A
N O R T H �A M E R I C A
S O U T H �A M E R I C A
AUSTRALIA
ANTARCTICA
Grape-growing regions
E U R O P E
A F R I C A
5000
kilometres
0
Figure 3 (f): Spain
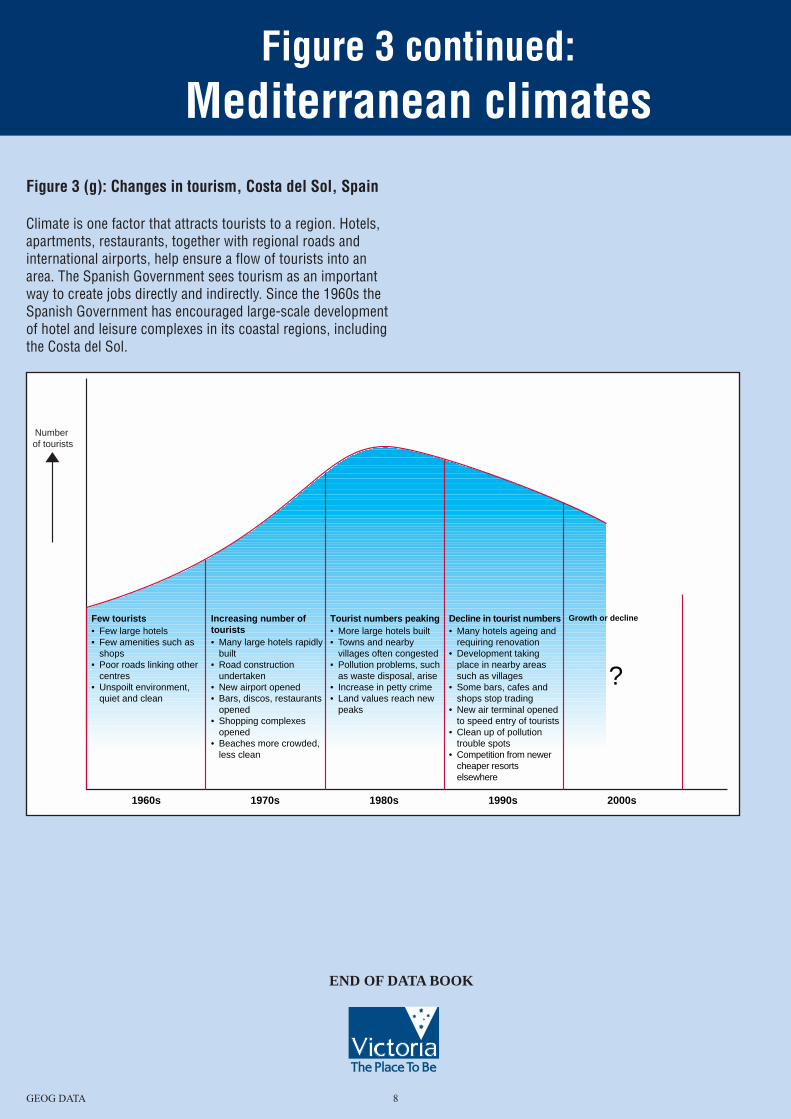
Figure 3 continued:Mediterranean climates
Figure 3 (g): Changes in tourism, Costa del Sol, Spain
Climate is one factor that attracts tourists to a region. Hotels,apartments, restaurants, together with regional roads andinternational airports, help ensure a flow of tourists into anarea. The Spanish Government sees tourism as an importantway to create jobs directly and indirectly. Since the 1960s theSpanish Government has encouraged large-scale developmentof hotel and leisure complexes in its coastal regions, includingthe Costa del Sol.
END OF DATA BOOK
GEOG DATA 8
Increasing number of tourists• �Many large hotels rapidly
built•�Road construction
undertaken•�New airport opened•�Bars, discos, restaurants
opened•�Shopping complexes
opened•�Beaches more crowded,
less clean
Tourist numbers peaking•�More large hotels built•�Towns and nearby
villages often congested•�Pollution problems, such
as waste disposal, arise•�Increase in petty crime•�Land values reach new
peaks
Decline in tourist numbers•�Many hotels ageing and
requiring renovation•�Development taking
place in nearby areas such as villages
•�Some bars, cafes and shops stop trading
•�New air terminal opened to speed entry of tourists
•�Clean up of pollution trouble spots
•�Competition from newer cheaper resorts �elsewhere
Growth or declineFew tourists•�Few large hotels•�Few amenities such as
shops•�Poor roads linking other
centres•�Unspoilt environment,
quiet and clean
1960s 1970s 1980s 1990s 2000s
Number �of tourists
?