GEOGRAPHY - sacai.org.za · The importance of terminology 5. Example questions: ... for basic...
19
2017 SACAI WINTER SCHOOL GEOGRAPHY NOTES
Transcript of GEOGRAPHY - sacai.org.za · The importance of terminology 5. Example questions: ... for basic...

2017 SACAI WINTER SCHOOL
GEOGRAPHY
NOTES

2017 SACAI WINTER SCHOOL
GEOGRAPHY TABLE OF CONTENTS
1. Assessment programme + type of questions
2. Structure of the question papers
3. Learning content
o Curriculum
o Textbook
4. The importance of terminology
5. Example questions: Paper 1
6. Map Work – Paper 2
o Terminology – GIS
o Map work techniques
o Type of questions in the Map Work paper (Use SACAI’s past exam papers posted on the Forum)
7. Make summaries

ASSESSMENT PROGRAM – GRADE 12
TERM
TASK
DESCRIPTION OF
ASSESSMENT
MARKS
WEIGHT
1
1
2
Assessment Task 1 (Data-handling)………………
Test
50
100
20 10
2
3
4
Assessment Task 2 (Research)……………………
Mid-year examination (Work done in term 1 & 2)
50
300
20
10
3
5
6 7
Assessment Task 3 (Map work)…………………..
Test Trial Examination
50
100 300
20 10 10
YEAR MARK 100
4
END-OF-YEAR EXAMINATION
300
300
400
100%
TYPE OF QUESTIONS (Level of difficulty)
LEVEL SOME ACTION WORDS
Lower- order 25%
▪Knowledge / Remembering
-Name (or list) / Give (outline ... the main points) / Define / Identify / Match
Middle- order 50%
▪Comprehension (understanding) ▪Application
-Describe / Explain / Summarise / Classify / Debate / Illustrate / Report / Forecast -Compare / Contrast / Demonstrate / Examine / Motivate / Calculate / Forecast / Apply
Higher- order 25%
▪Analysis ▪Evaluation Synthesis / ▪Creative ……
-Distinguish / Relate / Contrast / Divide / Identify -Justify / Compare / Conclude -Arrange / Conclude / Formulate (a solution / hypothesis) / Integrate / Group - Invent / Design / Develop

STRUCTURE OF QUESTION PAPERS PAPER 1: MARKS: 225 / TIME: 3 hours FOUR questions, answer ANY THREE questions. Section A: Question 1 (75) ■ Short objective type questions for 15 marks (15x1): Climate and Weather (8) and Geomorphology (7) ■ Climate and Weather: 30 marks ■ Geomorphology: 30 marks
Question 2 (As Question 1)
Section B: Question 3 (75) ■ Short objective type questions for 15 marks (15x1): Settlement (8) and SA Economic Geography (7) ■ Settlement Geography: 30 marks ■ SA Economic Geography: 30 marks
Question 4 (As Question 3)
PAPER 2: MARKS: 75 / TIME: 1½ hours Question 1 Multiple choice questions (15x1)[15] Question 2 Calculations and Techniques [20] [1 mark
per formula / step / label] Question 3 Analysis and interpretation of a
topographic map and aerial photograph; application of theory [25] [Combination of 1- and 2-mark questions]
Question 4 GIS [15] [Combination of 1- and 2-mark
questions]
EXAMPLE: Paper 1, Question 1 Grade 12
Short objective questions: Climate
8x1=(8) Short objective questions:
Geomorphology
7x1=(7) Climate (30 marks) as follows: 16 marks: A case study format which
includes a 4x2 paragraph type question; 14 marks: Other type of questions.
Geomorphology (30 marks) as follows: 16 marks: A case study format which
includes a 4x2 paragraph type question; 14 marks: Other type of questions.
[75]
ONE (1) mark per fact for basic recall (low- order), included definitions, no matter
how many facts.
TWO (2) marks per fact for understanding, application (middle-order),
analysis, evaluation and creativity (high-order).

LEARNING CONTENT GRADE 12 Geographical skills and techniques
Map work skills
Topographic maps
Aerial photos and orthophoto maps
Geographical Information Systems (GIS)
Using atlases
Climate and weather
Mid-latitude cyclones
Tropical cyclones
Subtropical anticyclones
Valley climates
Urban climates
Geomorphology
Drainage systems in South Africa
Fluvial processes
Catchment and river management
Rural and urban settlement
Study of settlements
Rural settlements
Rural settlement issues / Strategies
Urban settlements
Urban hierarchies
Urban structure and growth
Urban settlement issues / Strategies
Economic Geography of South Africa
Structure of the economy
Agriculture
Mining
Secondary and tertiary sectors
Strategies for industrial development
Informal sector VERY IMPORTANT: Terms & concepts of Grade 10/11will be applied in Grade 12 Refer to SACAI’s “Examination Guidelines”
Valley Climates
Slope aspect -Definition -Impact on the distribution of
temperature in a valley -Impact on human activities in a
valley
Development of -Anabatic winds (include all upward
movement of air in the valley) -Katabatic winds (include all downward movement of air in the valley) - Inversions / thermal belt -Frost pockets -Radiation fog - Draw simple freehand sketches to depict anabatic and katabatic winds
Influence on human activities -Settlements -Farming
Geographical Information Systems (GIS) •Concepts of
o GIS o Remote sensing
-Resolution -Pixels
o Spatial and spectral resolution o Spatial and attribute data / Database o Vector and raster data o Spatial objects
- Points/nodes - Lines - Area/polygons •Concept of layering of information •Components of GIS •Sources of information for GIS •Data manipulation and analysis
o Concept of data manipulation o Data integration o Buffer creation o Querying o Statistical analysis
•Data standardisation •Data sharing •Data security •Application of GIS by the
o Government o Private sector
•Developing a 'paper GIS' from existing maps,
photographs and other sources of information on layers of tracing paper.
•Identify and interpret concepts by using given data such
as satellite images, topographic maps, orthophoto maps, aerial photographs, pictures and statistics indicated on graphs and tables.

THE TEXTBOOK
The curriculum and NOT the ‘textbook’ represents the learning content.
The textbook is only the source to be used to work through the curriculum.
UNFORTUNATELY all textbooks are not equally complete and also a textbook’s facts (especially terminology) is not necessary always correct.
E.g. FOCUS’s definition of a settlement in the “glossary” is quite incomplete: ....” A settlement is a place where a group of people live” (page 172 / 336). Look at the photo:
I also see a building (buildings), farming (activities) and the farmstead is connected by road with the wine yards/cultivated lands/pasture/outside buildings etc. However, FOCUS described it as such in the text on page 172.
Then, each part of the settlement does not function on its own, it is interconnected ..... as in a system.
FOCUS p. 180: ‘Economic factors’: Rural settlements are covered, but the third point, referring to Skukuza, is NOT correct – Skukuza is not a rural settlement!
More inaccuracy occurs in the Afrikaans “VERKEN”.
WHAT IS THE SOLUTION?
It is strongly recommended that teachers/facilitators/tutors at centres make use of more than one textbook, AND proper preparation.
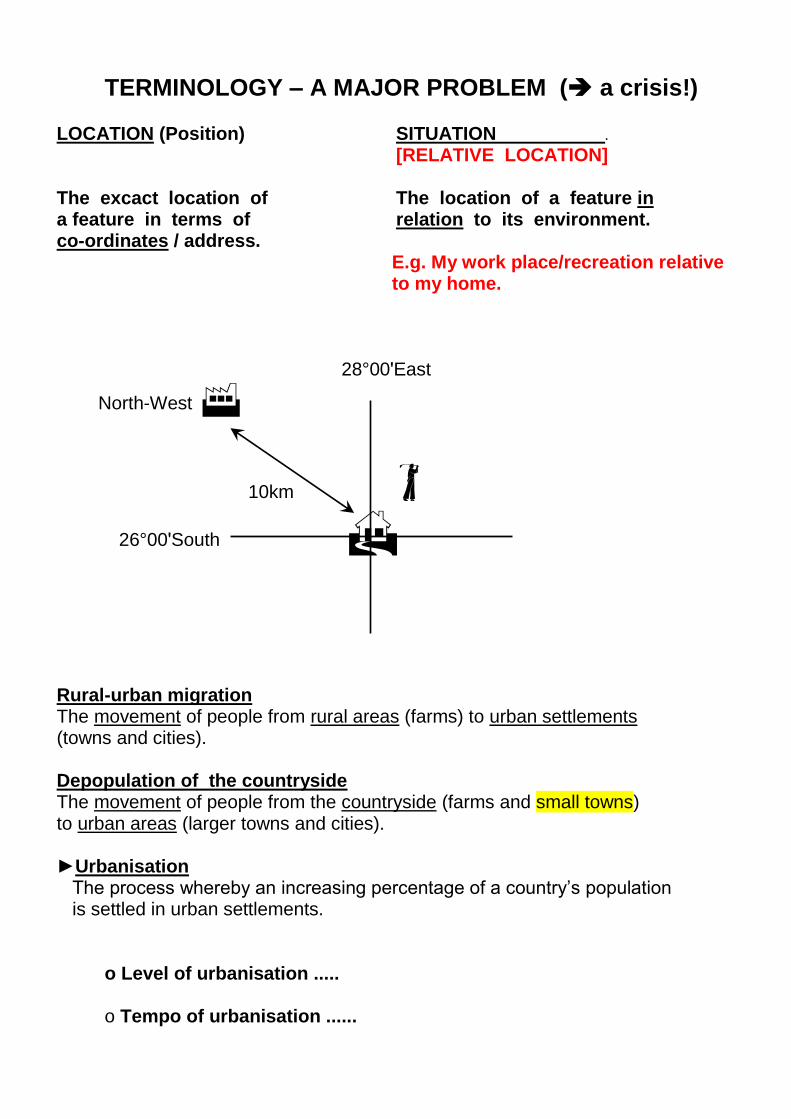
TERMINOLOGY – A MAJOR PROBLEM ( a crisis!) LOCATION (Position) SITUATION . [RELATIVE LOCATION] The excact location of The location of a feature in a feature in terms of relation to its environment. co-ordinates / address. E.g. My work place/recreation relative
to my home. 28°00ʹEast
North-West
10km
26°00ʹSouth Rural-urban migration The movement of people from rural areas (farms) to urban settlements (towns and cities). Depopulation of the countryside The movement of people from the countryside (farms and small towns) to urban areas (larger towns and cities). ►Urbanisation The process whereby an increasing percentage of a country’s population is settled in urban settlements. o Level of urbanisation ..... o Tempo of urbanisation ......

►Urban growth The increasing population numbers of urban settlements. ►Urban expansion The physical expansion of the build-up area of a town or city, i.e. the town or city’s area increase. Drainage basin The area from where a river system receives its water. Catchment area The area of a drainage basin that receives precipitation that feeds the rivers. Stream order The numbering of streams (segments) in a river system according to its position in the river system. Drainage density The ratio between the total length of all streams in the river system and the total area covered by the river system. Low High
Definitions should be complete, AND it counts only 1 mark 1 or nothing!

SHORT QUESTIONS Mainly low-order questions, but sometimes not. 2.1 Figure 2.1 is a cross-section of a valley indicating some micro-climatic conditions during day and night time. Answer the following questions. 2.1.1 Which part of figure 2.1 (X or Y) represents the daytime? (1) 2.1.2 Indicate which letters represent the following features of a valley climate: (a) Anabatic wind (E or F). (b) Katabatic wind (E or F). (c) The frost pocket (C or D). (d) The thermal belt (A or B). (e) The warmer slope during daytime (A or B). (5x1) (5) 2.1.3 Name the direction of the wind (northerly or southerly) at F. (1) [7]
FIGURE 2.1: [Examiner’s diagram]. 4.1 Choose a description from COLUMN B to fit a term in COLUMN A. Only write the letter (A to H) next to the question numbers 4.1.1 – 4.1.7 in your answer book. (You may use each description only once).
COLUMN A (Terms) COLUMN B (Descriptions)
4.1.1 Hamlet A – Buildings arranged along a main communication route.
4.1.2 Wet-point settlement B – Activities focusing on farming.
4.1.3 Dry-point settlement C – The most simple type of all settlements.
4.1.4 Linear settlement D – The farmer’s main objective is to make a profit.
4.1.5 Farmstead E – A terrain where people staying at a fountain or oasis in a dry area.
4.1.6 Rural settlement F– A position far from water above the flood line.
4.1.7 Commercial farming G – A loose grouping of a few farmsteads.
H - A variety of service delivery.
7x1=[7]

2.4 Choose a term / word from the list below to fit the following descriptions. Only write your choice next to the question numbers 2.4.1 – 2.4.8.
Aquifer / Exotic / Dendritic / Hydrograph / Graded / Aquiclude / Periodic / Trellis / Low / High / Deranged / Episodic
2.4.1 A rock that is impermeable and does not allow water to move through it. 2.4.2 A river that flows all year round through a very dry area. 2.4.3 A river that only flows after heavy rainfall. 2.4.4 The stream pattern that forms on sedimentary rocks which is uniform in their resistance to erosion. 2.4.5 Tributaries joining the main stream at 90° angles contribute to a typical … drainage pattern. 2.4.6 Upper course streams show a … stream order. 2.4.7 Upper course streams usually show a … drainage density. 2.4.8 A … river profile from source to mouth is smooth and concave. (8x1) [8]
3.4 Answer the following statements about economical geography as TRUE or FALSE. Only write your answers next to the corresponding question numbers 3.4.1 – 3.4.7 in your answer book. 3.4.1 The exploitation of the earth’s natural resources is an important secondary economic activity. 3.4.2 Large quantities of coal are exported through the port of Saldanha Bay. 3.4.3 To manufacture goods from heavy raw materials is a primary economic activity. 3.4.4 Trading at flea markets is an example of activities of the informal service sector. 3.4.5 All services rendered by information technology agencies can be classified as high order economic activities. 3.4.6 The tertiary economic sector contributes the most to the South African economy. 3.4.7 Decentralisation means the movement of economic activities away from the existing industrial regions in South Africa. (7x1) [7]

4.4 Various options are given as possible answers to the following questions. Choose the correct answer and write only the letter (A – D) next to the question numbers 4.4.1 – 4.4.8 in your answer book. 4.4.1 The GDP refers to the total domestic ... of a country. A raw materials B literacy C infrastructure D income 4.4.2 The relocating of economic activities from a core area is referred to as … A rejuvenation. B centralisation. C decentralisation. D isolation. 4.4.3 The main purpose of the spatial development initiatives (SDI’s) is to promote the ... of economic activities. A agglomeration B centralisation C decentralisation D nationalisation 4.4.4 The system to produce agricultural surpluses is known as ... A commercial farming. B financial security. C land reform. D subsistence farming. 4.4.5 Food processing is an example of ... industries. A high-technology B light C heavy D home 4.4.6 Food processing is an example of ... economic activities. A quaternary B tertiary C secondary D primary 4.4.7 The provision of clean water to informal settlements is a … activity. A quaternary B tertiary C secondary D primary (7x1) [7]

LONGER QUESTIONS …….. INTERPRETATION 3.5 Figure 3.5A is a graph showing the contribution of the various economic sectors to the GDP of two provinces while figure 3.5B identifies mining activities within these two provinces. 3.5.1 Briefly explain the concept of ‘gross domestic product by province’. (1x2) (2) 3.5.2 Distinguish between primary and secondary economic activities. (2x1) (2) 3.5.3 Which province’s primary economic sector contributes the highest percentage to its GDP? Also name the economic activity that dominates this contribution. (2x1) (2) 3.5.4 The sustainability of the activity named in 3.5.3 is to some extend very uncertain. Comment on this statement. (1x2) (2) 3.5.5 Give at least THREE other challenges (other than the one mentioned in 3.5.4), which are typical of this economic activity in South Africa. (3x2) (6) [14]
FIGURE 3.5A: [Statistics according to www.statssa.gov.za, December 2015]
3.6 Refer again to figure 3.5A. 3.6.1 Compare the contribution (%) of the secondary economic sector to the GDP of Gauteng and Limpopo respectively. (2x1) (2) 3.6.2 Which part of the secondary sector contributed the most? (1) 3.6.3 Which major industrial region put Gauteng in this superior position (3.6.1)? (1) 3.6.4 Discuss in approximately 8 to 10 lines FOUR factors that contributed to this region’s (3.6.3) industrial development. (4x2) (8) Paragraph type of questions should not be answered pointed, but the core facts could be underlined.

2.1.1 X 2.1.2 (a) E (b) F (c) C (d) B (e) A 2.1.3 Northerly (7x1) [7]
4.1.1 G
4.1.2 E 4.1.3 F 4.1.4 A 4.1.5 C 4.1.6 B 4.1.7 D (7x1) [7]
2.4.1 Aquiclude 2.4.2 Exotic 2.4.3 Episodic 2.4.4 Dendritic 2.4.5 Trellis 2.4.6 Low 2.4.7 High 2.4.8 Graded (8x1) [8] 3.4.1 False 3.4.2 False 3.4.3 False 3.4.4 True 3.4.5 False 3.4.6 True 3.4.7 True (7x1) [7] 4.4.1 D 4.4.2 C 4.4.3 C 4.4.4 A 4.4.5 B 4.4.6 C 4.4.7 B (7x1) [7]

3.5.1 Total value of all goods and services produced/delivered within the boundaries of a province during one year [Note: The complete definition] (1x2) (2) 3.5.2 Primary: The exploitation of the earth’s natural resources Secondary: The manufacturing of goods using natural resources as raw materials [The concepts, but NOT only examples] (2x1) (2) 3.5.3 Limpopo - Mining (2x1) (2) 3.5.4 -Minerals are non-renewable resources which ‘lifetime’ is limited / it can become exhausted -Minerals can be substituted quite easily through technology [Accept other logical and relevant facts] [Any one] (1x2) (2) 3.5.5 -Fluctuating international market prices for minerals -High production costs put pressure on its profitability -Environmental issues such as polluting water sources lead to conflict -Accidents in mines slow down production -Violent labour unrest causes damage and affects production negatively -Labour unrest in other economic sectors e.g. in transport / at harbours etc. affect mining directly [Accept other logical and relevant facts] [Any three] (3x2) (6) [14] 3.6.1 Gauteng: 18% / 19% Limpopo: 5% (2x1) (2) 3.6.2 Manufacturing (1) 3.6.3 The Pretoria-Witwatersrand-Vereeniging industrial region (1) 3.6.4 Raw materials: ….. Surrounded by large variety of raw materials (minerals) Power: …………… Close to power stations of Mpumalanga lower the cost of electricity Water: …………… Water of the Vaal Dam supplemented by Lesotho Highlands project Capital: …………. Gold mining caused the original spark towards industrial development Labour: ………… Large numbers of skilled and unskilled labour available from the mining sector/rural depopulation Transport: ………. -An effective network of road and rail transport converging on PWV -The Maputo Corridor links PWV with the Maputo harbour, relatively close -The OR Tambo International Airport promote the PWV as an international focus point Markets: ………… Population of close to 10m contributes to a large domestic market [Accept other logical and relevant facts] [Any four factors] (4x2) (8)

TERMINOLOGY – GIS This section was very poorly answered in the past exams!!
Check with the textbook(s).
Only a few examples. Make complete from the curriculum.
● Geographical Information Systems
.... computer technology ..... to organise data ...... store .....
analysing .... collected from a wide area
● Spatial data .... location .... co-ordinates .... e.g. of a hospital
● Attribute data .... descriptive information ..... e.g. number of beds .....
● Data base ..........
Spatial
Attributes
Hospital 1
Co-ordinates
Hospital 2
Co-ordinates
Hospital 3
-Number beds
-(Etc.) ....
● Remote sensing .......
Resolution ......
Pixels .....
●Data integration .......
● Data standardisation .....
●Data security ....
● Buffer creation .......
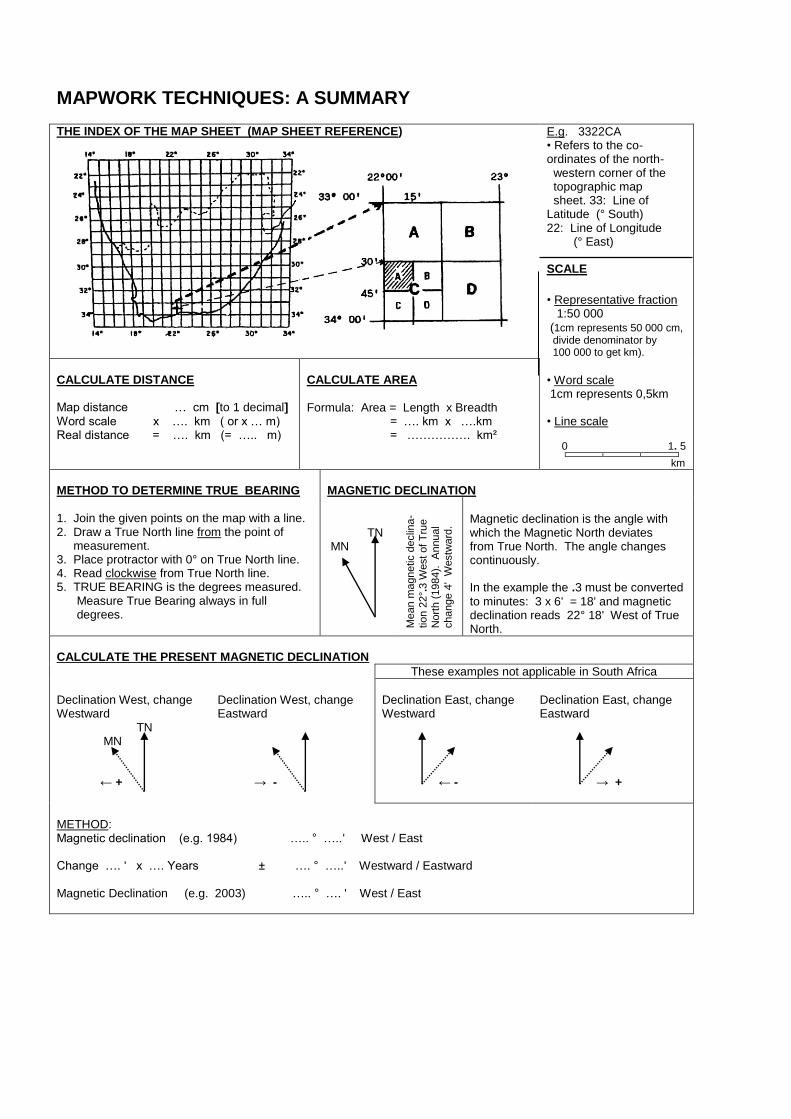
MAPWORK TECHNIQUES: A SUMMARY THE INDEX OF THE MAP SHEET (MAP SHEET REFERENCE)
E.g. 3322CA • Refers to the co-ordinates of the north- western corner of the topographic map sheet. 33: Line of Latitude (° South) 22: Line of Longitude (° East) SCALE
• Representative fraction 1:50 000 (1cm represents 50 000 cm, divide denominator by 100 000 to get km).
CALCULATE DISTANCE
Map distance … cm [to 1 decimal]
Word scale x …. km ( or x … m) Real distance = …. km (= ….. m)
CALCULATE AREA
Formula: Area = Length x Breadth = …. km x ….km = ……………. km²
• Word scale 1cm represents 0,5km • Line scale 0 1. 5
km METHOD TO DETERMINE TRUE BEARING
1. Join the given points on the map with a line. 2. Draw a True North line from the point of measurement. 3. Place protractor with 0° on True North line. 4. Read clockwise from True North line. 5. TRUE BEARING is the degrees measured. Measure True Bearing always in full degrees.
MAGNETIC DECLINATION
TN MN
Me
an m
agnetic d
eclin
a-
tio
n 2
2°.
3 W
est of T
rue
Nort
h (
1984).
A
nnual
change 4
' W
estw
ard
.
Magnetic declination is the angle with which the Magnetic North deviates from True North. The angle changes continuously. In the example the .3 must be converted
to minutes: 3 x 6' = 18' and magnetic declination reads 22° 18' West of True North.
CALCULATE THE PRESENT MAGNETIC DECLINATION
These examples not applicable in South Africa
Declination West, change Westward TN MN ← +
Declination West, change Eastward → -
Declination East, change Westward ← -
Declination East, change Eastward → +
METHOD: Magnetic declination (e.g. 1984) ….. ° …..' West / East Change …. ' x …. Years ± …. ° …..' Westward / Eastward Magnetic Declination (e.g. 2003) ….. ° …. ' West / East

MAGNETIC BEARING
True Bearing ….. ° 00' (Measure True Bearing with protractor in full degrees) Magnetic Declination + ….. ° …..' West (+ for West / - for East) Magnetic Bearing ..…. ° …..'
GRADIENT
Formula:
GradientVertical Interval
Horizontal equivalent
Height difference m
Dis ce m
Highest po Lowest po m
al dis ce on land m
( )
tan ( )
int int( )
Re tan ( )
20
1500
1
751 75
m
m
:
= For every 75 metres horizontal distance, the landscape rises or falls 1 metre.
CROSS-SECTIONS
Sketch views:
These are simple profiles (side views) of the landscape drawn free-hand, not accurate according to vertical and horizontal scale, showing the basic characteristics. E.g. River
Slip-off slope Undercut slope
Accurate cross-sections
1. Join the given points on the map with a line. 2. On a piece of paper, mark off all the points where the contours cross this line. Be as accurate as possible. 3. Determine the height of every contour line. 4. Draw a graph – vertical & horizontal axis (usually given). 5. Fill in the vertical scale as per instruction (e.g. 1cm represents 20m / 40m). 6. Transfer the position of the contour lines to the horizontal axis. 7. Mark the contour heights on the graph. 8. Join these heights, free-hand, taking into account that crests of hills and valley floors show curves and not straight lines.
EXAGGERATION OF THE VERTICAL SCALE
• Refers to how much the vertical scale is ‘stretched’ in relation to the horizontal scale. • Why is it necessary to make the vertical scale larger? E.g. Horizontal scale: 1:50 000 Vertical scale: 1cm represents 20m = 1:2 000 1 Formula:
Vertical ExaggerationVertical Scale
Horizontal Scalex times
1
2 000
1
50 000
1
2 000
50 000
125
Short cuts:
ExaggerationHorizontal Scale Deno ator
Vertical Scale Deno atortimes
min
min
50000
200025
CALCULATE THE SCALE OF A VERTICAL AERIAL PHOTOGRAPH (ORTHOPHOTO MAP)
Most popular formula: Photo scale = 1: Map scale denominator x Map distance (cm) Photo distance (cm) E.g. = 1: 50 000 x 3 (cm) 5 (cm) = 1:30 000
CHARACTERISTICS OF CONTOUR LINES
IDENTIFY LANDFORMS
USE MAP SYMBOLS
The numerator must be one (1), so divide the numerator and denominator by 20.
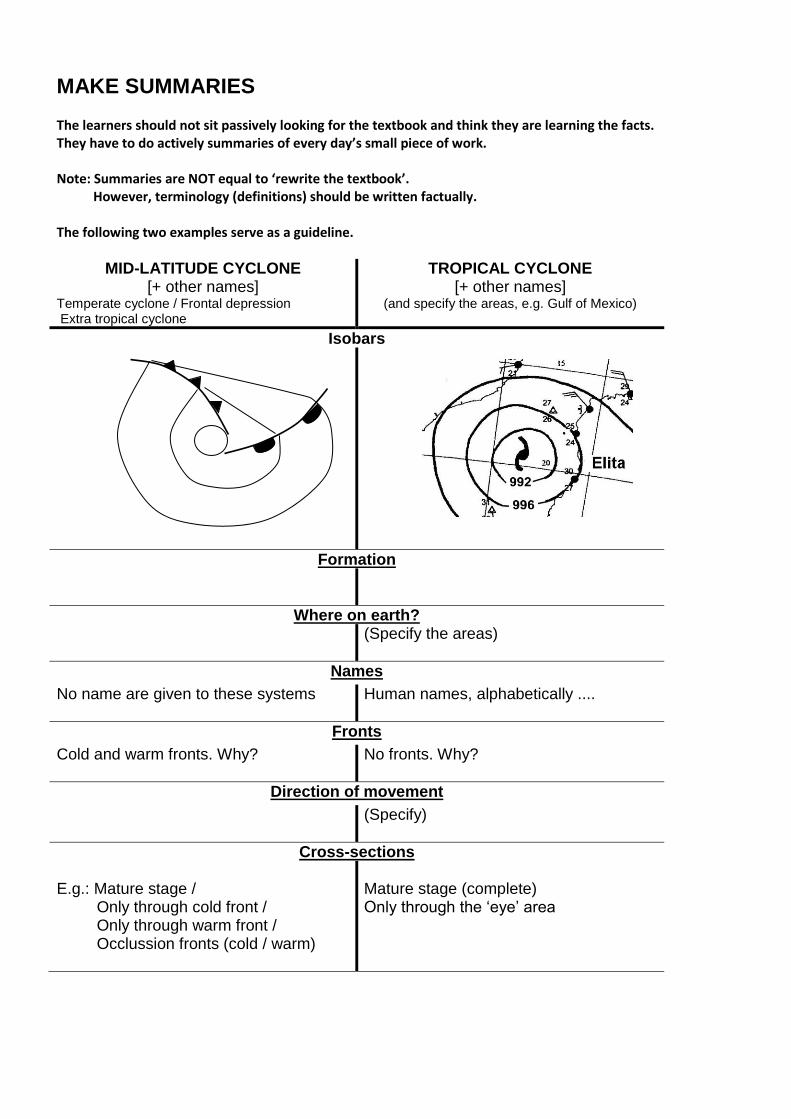
MAKE SUMMARIES The learners should not sit passively looking for the textbook and think they are learning the facts. They have to do actively summaries of every day’s small piece of work. Note: Summaries are NOT equal to ‘rewrite the textbook’. However, terminology (definitions) should be written factually. The following two examples serve as a guideline.
MID-LATITUDE CYCLONE [+ other names]
Temperate cyclone / Frontal depression Extra tropical cyclone
TROPICAL CYCLONE [+ other names]
(and specify the areas, e.g. Gulf of Mexico)
Isobars
Formation
Where on earth? (Specify the areas)
Names
No name are given to these systems
Human names, alphabetically ....
Fronts
Cold and warm fronts. Why? No fronts. Why?
Direction of movement
(Specify)
Cross-sections E.g.: Mature stage / Only through cold front / Only through warm front / Occlussion fronts (cold / warm)
Mature stage (complete) Only through the ‘eye’ area
L

SETTLEMENT The grouping of people...
Rural Urban Primary activities ... Secondary / Tertiary activities... Uni-functional... Multifunctional... Farm- stead Hamlet Village Town City Metropolis (Small/ (Metropole) Isolated Nucleated Large) Conurbation Megalopolis Central Trade/ places transport- Specialised -Break-of-bulk points -Junction towns -Gateway (gap) towns
Short, factual notes should be added
Here FOCUS differ. The above is the correct classification.