Geographical Analysis of Smoking in Leeds: A GIS-Based ...
12
Journal of Geographic Information System, 2013, 5, 269-280 http://dx.doi.org/10.4236/jgis.2013.53026 Published Online June 2013 (http://www.scirp.org/journal/jgis) Geographical Analysis of Smoking in Leeds: A GIS-Based Location-Allocation Technique for the Optimal Location of Smoking Cessation Services Mildred Oiza Ajebon, Monday Ohi Asikhia Department of Geography and Regional Planning, University of Benin, Benin City, Nigeria Email: [email protected], [email protected] Received April 19, 2013; revised May 20, 2013; accepted June 15, 2013 Copyright © 2013 Mildred Oiza Ajebon, Monday Ohi Asikhia. This is an open access article distributed under the Creative Com- mons Attribution License, which permits unrestricted use, distribution, and reproduction in any medium, provided the original work is properly cited. ABSTRACT Smoking is associated with several illnesses in the UK. Smoking rate in Leeds is higher than the national average. Finding optimal locations for stop-smoking services will be a good place to start in reducing smoking rates. The study utilizes a GIS-Based location-allocation method for the optimal distribution of smoking cessation centres in relation to the spatial distribution of the smoking population in Leeds. The demand for the smoking cessation clinics was estimated based on the 2009 General Life Style (GLS) statistics on age and social class stratification of smoking rates for the UK. Leeds specific rates were then obtained from the 2001 census key statistics data on socioeconomic status and age struc- ture for output areas via Census Area Statistics Website (CASWEB). The research findings show that spatial inequali- ties in smoking rate exist in output areas of Leeds. Poorer and non-skilled populations are demonstrated to have higher smoking rates compared with wealthier neighbourhoods. The study confirms the capability of GIS-Based location-al- location techniques to be useful modelling tools for determining the best locations for health facilities. The model allo- cates services in relation to the spatial patterns of demand in a fashion that minimises average travel distance. Keywords: GIS; Location-Allocation; Optimization; Smoking Cessation Services 1. Introduction Smoking is an important driver of spatial variations in mortality in Britain. It is associated with various types of heart diseases and established to be a major risk factor of various types of cancers worldwide ([1] Tomintz et al., 2008). The link between smoking and ill-health has in- creasingly attracted the attention of health researchers and government alike. Periodic targets are set by the UK government to reduce smoking in the population. One of the major targets of the 2011 Tobacco Control Program for England is to reduce adult smoking to 18.5% in 2015. This means that stop-smoking services will have to be located in communities where target groups can access them easily ([2] Pearce et al., 2011, [3] Tomintz et al., 2009, [4] Tomintz et al., 2010, [5] Wolfenden et al., 2005). Identifying specific locations that will effectively serve different population groups in different areas pre- sents a typical public-sector planning problem which requires the following fundamental geographical ques- tions to be answered. Where about in Leeds is the smok- ing population located? Are the existing stop-smoking centres optimally distributed in relation to the proportion of the smoking population? If not, what alternative dis- tribution of services will increase accessibility? The stu- dy aims to address these questions. The location-allo- cation methods are used for handling two important is- sues. Firstly, it attempts to model the geographical loca- tions of the smoking population for the smallest geo- graphical areas possible and second, it attempts to model optimal locations for smoking cessation services in rela- tion to the geographical pattern of demand. The chosen study area is Leeds City with a population estimate of 750,000. Statistics show that the city has a higher-than- national average smoking rate (26%) (Healthy Leeds, 2009 to 2012). Smoking has therefore been identified as an important health issue in the area. 2. Literature Review The population of smokers worldwide is estimated to be 1.8 billion accounting for about 5.4 million preventable Copyright © 2013 SciRes. JGIS
Transcript of Geographical Analysis of Smoking in Leeds: A GIS-Based ...
Journal of Geographic Information System, 2013, 5, 269-280 http://dx.doi.org/10.4236/jgis.2013.53026 Published Online June 2013 (http://www.scirp.org/journal/jgis)
Geographical Analysis of Smoking in Leeds: A GIS-Based Location-Allocation Technique for the Optimal Location of
Smoking Cessation Services
Mildred Oiza Ajebon, Monday Ohi Asikhia Department of Geography and Regional Planning, University of Benin, Benin City, Nigeria
Email: [email protected], [email protected]
Received April 19, 2013; revised May 20, 2013; accepted June 15, 2013
Copyright © 2013 Mildred Oiza Ajebon, Monday Ohi Asikhia. This is an open access article distributed under the Creative Com- mons Attribution License, which permits unrestricted use, distribution, and reproduction in any medium, provided the original work is properly cited.
ABSTRACT
Smoking is associated with several illnesses in the UK. Smoking rate in Leeds is higher than the national average. Finding optimal locations for stop-smoking services will be a good place to start in reducing smoking rates. The study utilizes a GIS-Based location-allocation method for the optimal distribution of smoking cessation centres in relation to the spatial distribution of the smoking population in Leeds. The demand for the smoking cessation clinics was estimated based on the 2009 General Life Style (GLS) statistics on age and social class stratification of smoking rates for the UK. Leeds specific rates were then obtained from the 2001 census key statistics data on socioeconomic status and age struc- ture for output areas via Census Area Statistics Website (CASWEB). The research findings show that spatial inequali- ties in smoking rate exist in output areas of Leeds. Poorer and non-skilled populations are demonstrated to have higher smoking rates compared with wealthier neighbourhoods. The study confirms the capability of GIS-Based location-al- location techniques to be useful modelling tools for determining the best locations for health facilities. The model allo- cates services in relation to the spatial patterns of demand in a fashion that minimises average travel distance. Keywords: GIS; Location-Allocation; Optimization; Smoking Cessation Services
1. Introduction
Smoking is an important driver of spatial variations in mortality in Britain. It is associated with various types of heart diseases and established to be a major risk factor of various types of cancers worldwide ([1] Tomintz et al., 2008). The link between smoking and ill-health has in- creasingly attracted the attention of health researchers and government alike. Periodic targets are set by the UK government to reduce smoking in the population. One of the major targets of the 2011 Tobacco Control Program for England is to reduce adult smoking to 18.5% in 2015. This means that stop-smoking services will have to be located in communities where target groups can access them easily ([2] Pearce et al., 2011, [3] Tomintz et al., 2009, [4] Tomintz et al., 2010, [5] Wolfenden et al., 2005). Identifying specific locations that will effectively serve different population groups in different areas pre- sents a typical public-sector planning problem which requires the following fundamental geographical ques- tions to be answered. Where about in Leeds is the smok-
ing population located? Are the existing stop-smoking centres optimally distributed in relation to the proportion of the smoking population? If not, what alternative dis- tribution of services will increase accessibility? The stu- dy aims to address these questions. The location-allo- cation methods are used for handling two important is- sues. Firstly, it attempts to model the geographical loca- tions of the smoking population for the smallest geo- graphical areas possible and second, it attempts to model optimal locations for smoking cessation services in rela- tion to the geographical pattern of demand. The chosen study area is Leeds City with a population estimate of 750,000. Statistics show that the city has a higher-than- national average smoking rate (26%) (Healthy Leeds, 2009 to 2012). Smoking has therefore been identified as an important health issue in the area.
2. Literature Review The population of smokers worldwide is estimated to be 1.8 billion accounting for about 5.4 million preventable
Copyright © 2013 SciRes. JGIS

M. O. AJEBON, M. O. ASIKHIA 270
deaths annually ([6] Guindon and Boisclair, 2003). In the UK, smoking rate is higher than the European average contributing to one fifth of all deaths ([7] McEwen et al., 2010, [2] Pearce et al., 2011, [8] Popham, 2011). The World Health Organisation Framework Convention on Tobacco Control suggests the inclusion of smoking ces- sation support services in national tobacco regulations ([9] Gibson et al., 2010). In the UK, several interventions have been made since 1945 to reduce smoking rates and to prevent people from starting. The government devel- oped a tobacco control policy plan in 1998 to cut overall smoking to 21% in 2010. Priority was on targeting vul- nerable groups through the provision of smoking cessa- tion services to help smokers quit successfully ([10] Bauld et al., 2007, [9] Gibson et al., 2010, [11] Statistics, 2011, [3] Tomintz et al., 2009). Analysis of the 2009 General Lifestyle Surveys (GLS) reveal that the 1998 target has been met for the general population, little change has however been achieved in the lower socio- economic groups which have higher estimates of 29% ([12] ASH Fact Sheet on Smoking Statistics 2011). Though general smoking prevalence in Britain declined steadily between mid-1970s and the 1980s, it now seems to be levelling at 21% (Table 1). Smoking rate (26%) in Leeds is higher than the UK average. Finding out where and why smoking rates vary among local populations in Leeds might be a good point to start in reducing smoking rate to the national average.
2.1. Demographic Character of the Smoking Population in Leeds
Smoking rate is established in literature to differ among populations. Several demographic variables captured in the general census and other demographic surveys like the GLS are often employed by health researchers in measuring prevalence. These include age structure, so- cioeconomic classification, education, housing tenure, employment, car ownership, and ethnicity. Heavy smok- ing is established in literature to vary widely with depri- vation ([2] Pearce et al., 2011, [8] Popham, 2011, [13] Richardson, 2001). Highest smoking prevalence is re- corded in deprived populations with higher rates in dis- advantaged places. Poorer people often use smoking as a temporary relief measure from social distress. Hence poorer smokers are less likely to quit smoking ([8] Popham, 2011, [13] Richardson, 2001). The widening
socioeconomic gradient in smoking is attributed to higher rates of smoking cessation among higher social groups and lower rates of successful quit attempts among per- sons in manual groups ([2] Pearce et al., 2011).
The association between social disadvantage and smoking prevalence is evident across areas in Leeds. Lifestyle surveys suggest even greater inequalities at smaller geographies, ranging from 18% in sub-urban affluent areas like Wetherby, to a sharp contrast of 46% in more deprived areas (Seacroft). Targeting smokers in deprived areas is a top priority in health planning because heavy smokers have limited economic resources; spend more money on cigarettes which limits access to healthy foods. For details, see ([14] Healthy Leeds, 2009 to 2012, [1] Tomintz et al., 2008, [4] Tomintz et al., 2010). Spa- tial pattern in smoking is also strongly defined along age lines. Studies have shown evidence of variations in smoking prevalence by age ([12] ASH Fact Sheet on Smoking [11] Statistics 2011, [15] Foley et al., 2009, [6] Guindon and Boisclair, 2003, [16] Robinson and Harris, 2011, Statistics, 2011). Higher smoking rates have been recorded for persons aged 20-24 since 1998 ([12] ASH Fact Sheet on Smoking Statistics 2011). The oldest groups (60 and above) have the lowest smoking rates.
2.2. Planning Stop-Smoking Services
Central to healthcare planning discussions, are the fun- damental concepts of service demand and supply. In an ideal scenario, services will be supplied in equal propor- tions to their demand. In spatial applications, this would mean correctly placing service centres in rural or urban areas to exactly meet the demand for them ([15] Foley et al., 2009). In reality, the existence of mismatches be- tween demand and supply at different spatial levels clearly defines a role for geographers in health facility planning. It has been recommended in literature to locate healthcare centres locally in relation to demand to in- crease utilization and to minimise distance travelled by poorer people to access available services. The study em- ploys this recommendation by attempting to determine the optimal locations for smoking-cessation clinics using existing statistics on the smoking population in Leeds.
3. Data and Methods
2001 census key statistics data on socioeconomic status
Table 1. Smoking rates in England from 1974 to 2009.
% Smoking Population 1974 1980 1986 1992 1998 2004 2005 2006 2008 2009
Men 51 42 35 29 30 26 25 23 22 22
Women 41 37 31 28 26 23 23 21 21 20
All 45 39 33 28 28 25 24 22 21 21
S ource: ([12] ASH Fact Sheet on Smoking Statistics 2011).
Copyright © 2013 SciRes. JGIS

M. O. AJEBON, M. O. ASIKHIA 271
and age structure for output areas was obtained via UK Census Area Statistics Website (CASWEB) to estimate smoking population. The 2009 General Life Style statis- tics on age and social class stratified smoking rates for UK was used to estimate smoking population of output areas in Leeds. The postcodes of existing thirty-three stop-smoking service centres and forty-four National Health Service (NHS) centres in Leeds were downloaded from NHS database. For mapping purposes, the spatial reference for the centroids of each postcode where clinics and stop-smoking services are located was derived using ordinance survey postcode query facility. Digital bound- ary data of output areas were obtained via (http://digimap. edina.ac.uk/cdptquery/servlet/Query?useJS=true; accessed 1st March, 2012). Full details on the number of clinics and the locations of existing stop-smoking centres are available at http://www.leedscommunityhealthcare.nhs. uk/what_we_do/specialist_services/stop_smoking_service1/smoking_clinics/.
The approach employed in this study is similar to con- ventional approaches used in health geography. This in- volves identifying relevant geographic dataset to estimate the smoking-population in Leeds. The smoking popula- tion for this study is estimated based on the 2009 General Life Style (GLS) statistics on social class stratification of smoking rates for the UK. Supplementary methods, Gi* statistics and K-Means classification were applied to es- timated smoking population data to further explain the spatial variations among population groups. The demand for stop-smoking services by different groups is meas- ured with demographic data. The distribution of stop- smoking facilities forms another layer of information for evaluating stop-smoking service supply in relation to demand. Ultimately, the estimated demand is used as a basis for a more sophisticated location-allocation model- ling of different location scenarios. The model was im- plemented in Arc Workstation 10.0. ArcGIS Desktop10 was used for other GIS analysis and mapping.
4. Analysis/Results
4.1. Estimating Smoking Population of Output-Areas of Leeds
The analysis began with deriving local estimates of
smoking population across Leeds using a variety of na- tional datasets such as household socioeconomic status and age. These are considered critical explanatory indi- cators of smoking in 2011 NHS tobacco program.
4.2. Estimating Smoking Population Based on Age
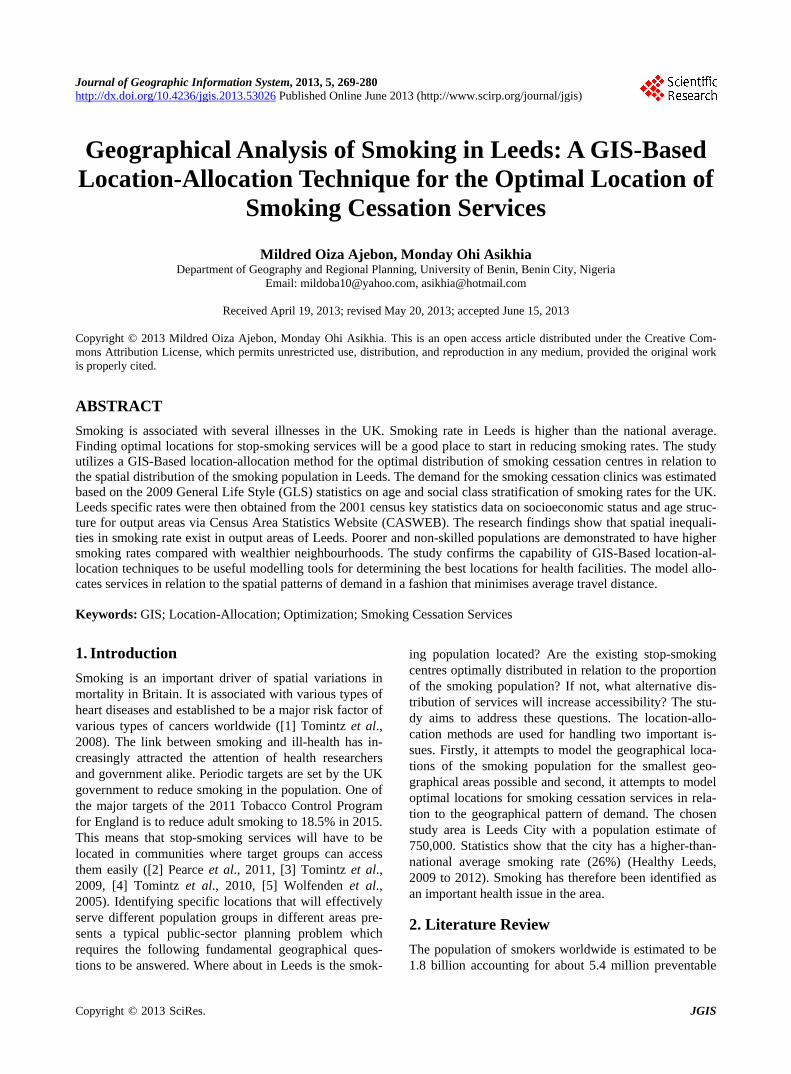
First, smoking rate is measured using age data from the 2001 census. The GLS smoking rates for age groups is shown in Table 2. Since 1998, persons in age group 20 - 24 have had the highest smoking rate in England. Groups above 60 years have the lowest rate of 14%. The 2009 national smoking rate is applied to the population of all 2439 Leeds output areas to measure the number of smokers. The resulting pattern of smoking population distribution across Leeds is shown in Figure 1. The re- sult for Leeds is as expected with highest concentration of smokers around Headingley, an area with high student and young population.
4.3. Estimating Smoking Population Based on Socioeconomic Class
The 2001 socioeconomic class data was aggregated into three broad classes namely; managerial and professional; intermediate; routine and manual.
Table 3 shows the 2009 national smoking rate for household heads in three broad socioeconomic classes. It can be seen that routine and manual groups have the highest rates (29%) for both men and women. Managers and professional have a lower rate of 15%. In all groups, men smoke more than women.
Applying these rates to the local population of Leeds output areas, the distribution of the smoking population by socioeconomic class is shown in Figure 2. Places with high concentration of smokers include Armley, Bramley, Hunslet, Morley North, and Seacroft wards. These areas are associated with socioeconomic depriva- tion in literature ([1] Tomintz et al., 2008). Comfortable sub-urban areas in the North of Leeds like Wetherby and North wards have relatively lower concentration of smokers. The Headingley area which rated highest in age-estimated smoking population appears to be lower in the social class stratified smoking rate because student
Table 2. Smoking prevalence by age in England, 2009.
% Smoking by age Age
Age 16 - 19 20 - 24 25 - 34 35 - 49 50 - 59 60+
1978 34 44 45 45 45 30
1988 26 27 36 36 33 23
1998 31 40 35 31 28 16
2008 22 30 27 24 22 13
2009 24 26 25 25 21 14
Source: ([12] ASH Fact Sheet on Smoking Statistics 2011).
Copyright © 2013 SciRes. JGIS
M. O. AJEBON, M. O. ASIKHIA 272
Smokers by age in %
Leeds_BoundaryLeeds_Ward
Leeds 0.00 - 15.60 15.60 - 16.33 16.33 - 17.58 17.58 - 19.42 19.42 - 25.18
2.5 1.25 0 2.5 5 7.5Kilometers
N
Figure 1. Smoking rate by age groups for Leeds output areas using 2009 estimates.
Table 3. Smoking prevalence by socioeconomic classification in England, 2009.
Percentage smoking cigarettes Socioeconomic Classification of Households
Men Women Total
Managerial and professional
Large Employers and Higher Managerial 12 13 13
Higher Professional 11 10 10
Lower Managerial and Professional 18
15
16
14
17
15
Intermediate
Intermediate 19 16 17
Small Employers and Own Account 23 21
21 19
22 20
Routine and manual
Lower Supervisory and Technical 25 27 26
Semi-Routine 31 26 28
Routine 34
30
30
27
32
29
Total 22 20 21
Source: ([12] ASH Fact Sheet on Smoking Statistics 2011).
Copyright © 2013 SciRes. JGIS

M. O. AJEBON, M. O. ASIKHIA
Copyright © 2013 SciRes. JGIS
273
Smokers by SEC in %
Leeds_Boundary
Leeds_Ward
0.37 - 12.00
12.00 - 14.00
14.00 - 16.00
16.00 - 18.00
18.00 - 21.64
2 1 0 2 4 6Kilometers
N
Figure 2. Smoking rate by socioeconomic class in Leeds output areas using 2009 GLS estimates. households are not included in the socioeconomic groups used. The inequality in smoking observed in populations and across areas in Leeds supports previous findings on the subject. [2] Pearce et al. (2011), [8] Popham (2011), [13] Richardson (2001), [16] Robinson and Harris (2011) and others found a strong relationship between heavy smoking and deprivation.
4.4. Smoking Hotspots and Area Profiling of Leeds
Using the 2009 socioeconomic-class-aggregated smoking population data, the Gi* statistics hotspot method was applied to identify areas with lower or higher smoking rates than the Leeds average. This is helpful for prioritis- ing and targeting smoking intervention strategies. The red areas in Figure 3 are identified as areas with higher than average rates of smoking in Leeds. These represent health action zones (Health Pudsey, Beeston, Morley South, Middleton, Hunslet, Bramley, Seacroft) where healthcare planners might wish to channel more inter-
vention resources. The white areas have average smoking rates and the blue areas have relatively lower rates. No- tice that the University and Headingley areas are again classified as having lower rates of smoking because of the omission of student households.
Given the slight variation in the distribution of smok- ing population observed using the age and social class national rates, a general area profile of Leeds output ar- eas was developed using K-Means cluster statistics. 25 of the key variables identified used by [17] Vickers and Rees (2007) for creating output area classification for the UK were analysed. They include age, marital status, health, economic activity; social class, ethnicity, housing tenure, car ownership etc. The area classification map in Figure 4 provides good description of what areas are like in Leeds. The area profile shows that Headingley and University wards are student areas, Seacroft and most output areas with heavy smoking are hard pressed, Hare- hills is an ethnic minority zone, Wetherby and North wards are more comfortable sub-urban areas. In line with

M. O. AJEBON, M. O. ASIKHIA 274
Legend
Leeds_Boundary
>2.58 Std. Dev.
2 1 0 2 4 6 Kilometers
N
1.96 - 2.58 Std. Dev. 1.65 - 1.96 Std. Dev. -1.65 - 1.65 Std. Dev. -1.96 - -1.65 Std. Dev. -2.58 - -1.96 Std. Dev. <-2.58 Std. Dev.
Smoking HotSpots in Leeds GiZ Score
Figure 3. Smoking hotspots in Leeds.
Legend
Leeds_Ward
2 1 0 2 4 6 Kilometers
N
Leeds_District
Comfortable/Urban Prosperity Hard Pressed
Student/Yonger White collar
Retirement Areas Typical Traits/Moderate
Multicultural Stop-Smoking
Figure 4. Geodemographic classification of Leeds.
Copyright © 2013 SciRes. JGIS

M. O. AJEBON, M. O. ASIKHIA 275
previous findings, heavy smoking can thus be clearly seen to be associated with deprivation in Leeds. ([2] Pearce et al., 2011, [8] Popham, 2011, [13] Richardson, 2001, [18] Shankar et al., 2010).
4.5. Spatial Distribution of Existing Health Centres in Relation to Demand
The distribution of existing stop-smoking services was examined in relation to estimated spatial pattern of smoking in Leeds. Figure 5 shows a mismatch between demand and supply of health services. Like most urban centres, services are concentrated in central Leeds ([15] Foley et al., 2009). While the north-end and outlying risk areas do not have local access to services, the university areas have more services than they might need. This is further complicated by the fact that not all centres are opened every day of the week. Services are only avail- able at certain times of the day when clinics are opened. This further reduces accessibility of smokers to existing services and market penetration.
4.6. Optimal Location of Stop-Smoking Services in Leeds
In order to provide a blue print for future development of
smoking cessation centres, a GIS-Based location-alloca- tion method is employed to find efficient distribution of stop-smoking centres Several research findings have proven location-allocation methods to be a useful model-ling technique for determining best locations for facilities in relation to spatial patterns of demand ([15] Foley et al., 2009, [19] Rahman and Smith, 2000, [20] Smith et al., 2011, [1] Tomintz et al., 2008, [3] Tomintz et al., 2009, [4] Tomintz et al., 2010). The model allocates services in relation to the distribution of demand in a fashion that minimises average travel distance. Figure 6 shows the optimal locations for stop-smoking services.
In the UK, free smoking-cessation services are tradi- tionally located in existing NHS centres. Experts have suggested that stop-smoking services should be located away from NHS centres to very local community levels to encourage the utilization by smokers (Wolfenden et al., 2005). In this study, the optimal location models are used to evaluate the distribution of the existing centres in Leeds. Only 15 (examples of Horsforth, Morley Centre, Rothwell, Ortley, Purdsey) stop-smoking centres are in near-optimal locations.
The NHS policy is designed to vary the locations of centres quarterly. Different numbers of clinics are opera- tional on different days and times of the week. Available
Smokers by SEC in %
Leeds_Boundary
Leeds_Ward
0.37 - 12.00 Stop-Smoking Clinics
12.00 - 14.00 N 14.00 - 16.0016.00 - 18.00
2 1 0 2 4 6 Kilometers
18.00 - 21.64
Figure 5. Comparing the distribution of existing stop-smoking service in relation to the population of smokers.
Copyright © 2013 SciRes. JGIS

M. O. AJEBON, M. O. ASIKHIA 276
33 Optimal Locations
Leeds_Boundary
9 Clinics on Mondays
Optimal Locatiors for 33 Clinics
2 1 0 2 4 6 Kilometers
N Leeds Output Areas
Opening_Periods of Clinics by weekday
8 Clinics on Tuesdays
7 Clinics on Wednesday
7 Clinics on Thursdays
4 Clinics on Fridays
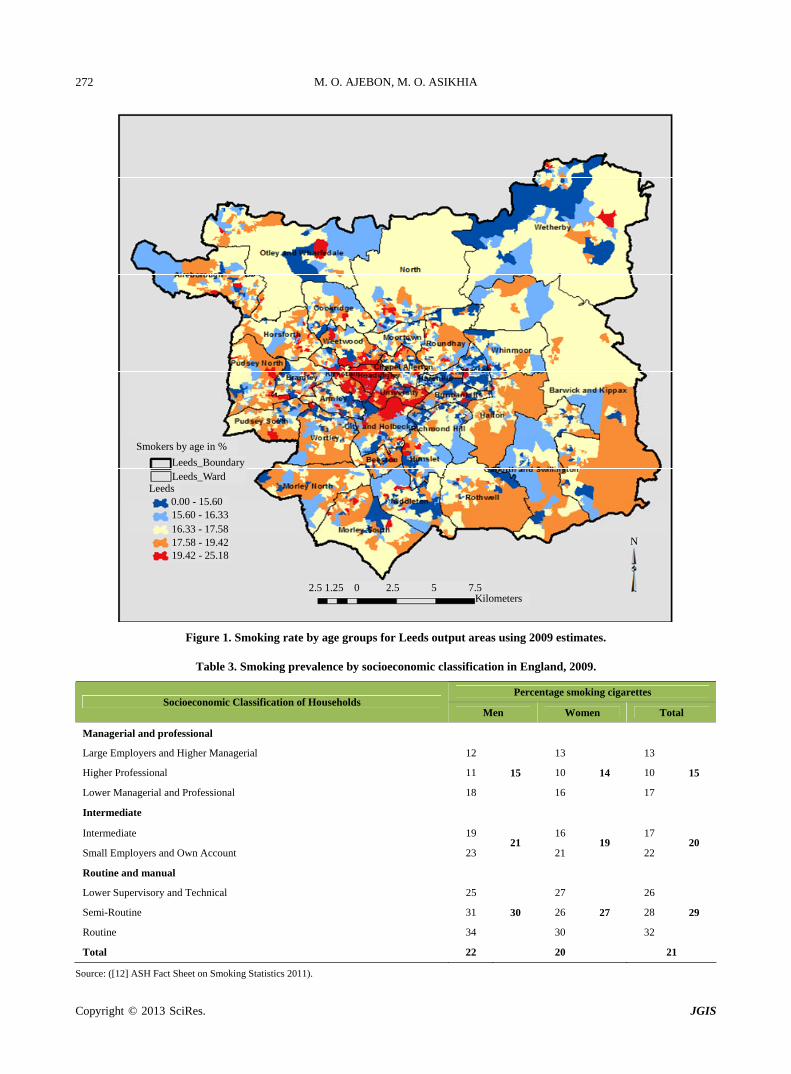
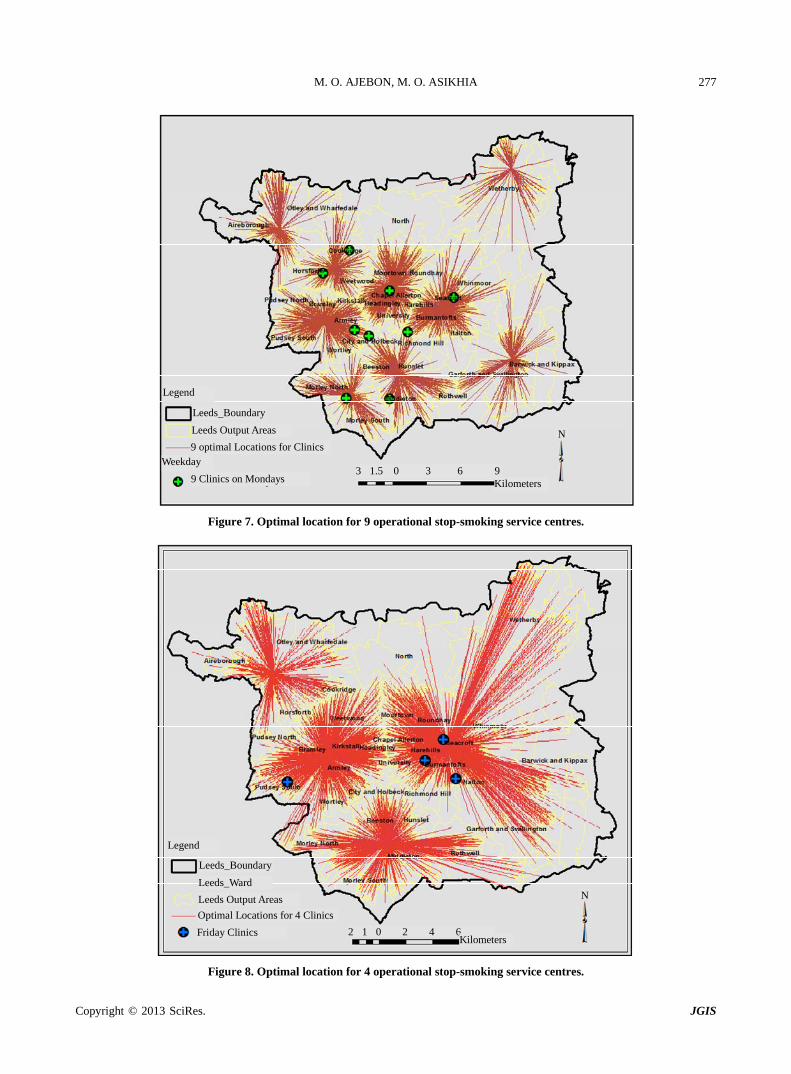
Figure 6. Optimal location for 33 existing stop-smoking service centres. data for this study shows that highest numbers of clinics (9) are operational on Mondays and lowest numbers of clinics (4) on Fridays (see Appendix 1 for details). Though this policy has the merit of ensuring that services are spatially mobile, it however has a negative implica- tion for accessibility to services by most smokers. If lo- cations must be varied quarterly due to certain circum- stances, then optimal locations for specific numbers of clinics operational on different days must be determined. Figures 7 and 8 show two different scenarios for nine and four optimal stop-smoking centres respectively. Three of the nine clinics (Morley, Scothall and Newcroft) operational on Mondays are located near-optimal loca- tions. Seacroft centre is the only one of the operational Friday clinics in optimal location. This means that users will have to travel a longer distances on those days to utilize services. Similar relationships are expected on Tuesdays Wednesdays and Thursdays. Overall, fixed optimal locations for all clinics is the best scenario for maximum accessibility and greater utilization of services. This will provide more effective and permanent smoking cessation support to target groups.
A forth scenario of what locations will be optimal if all NHS clinics listed in Appendix 1 were to be fixed loca-
tions for smoking cessation services is examined. The analysis (Figure 9) show some existing NHS centres to be in near-optimal locations. These include Hortsforth clinic, Seacroft, Morley South, Pudsey South, Otley and Rothwell clinics. Future provision of additional stop- smoking centres might consider locating in areas with optimally located NHS centre without current access to services. These include Wetherby Health Centre, Gar- forth Clinic, and Yeadon Community Healthcare.
5. Conclusions
This study demonstrates the benefit of integrating the analytical power of geographic information tools and demographic information in public sector planning. It has the merit of estimating smoking population at an output area level. It is recognised that census data at fine geo- graphical scales are blurred to increase confidentiality.
The research findings show that spatial inequalities in smoking rate exist in output areas of Leeds. Most wards in the southern ends of Leeds are identified as smoking hotspots. Evaluating the Location of existing stop- smoking clinics shows that most centres are sub-opti- mally located and concentrated in the Leeds City centre.
Copyright © 2013 SciRes. JGIS
M. O. AJEBON, M. O. ASIKHIA 277
Legend
Leeds_Boundary
9 Clinics on Mondays 3 1.5 0 3 6 9
Kilometers
N Leeds Output Areas
9 optimal Locations for Clinics Weekday
Figure 7. Optimal location for 9 operational stop-smoking service centres.
Legend
Leeds_Boundary
2 1 0 2 4 6Kilometers
N Leeds Output Areas
Optimal Locations for 4 Clinics
Leeds_Ward
Friday Clinics
Figure 8. Optimal location for 4 operational stop-smoking service centres.
Copyright © 2013 SciRes. JGIS

M. O. AJEBON, M. O. ASIKHIA 278
44 Optimal Locations
Leeds_Boundary
2 1 0 2 4 6Kilometers
N Leeds Output Areas
NHS_Clinics
Figure 9. Optimal location if all NHS centres were fixed locations for stop-smoking services.
Thirty-three alternative locations developed using Loca- tion-allocation Methods promises to be an effective and preferred way of distributing fixed stop-smoking services across Leeds. Derived information products are easy to visualise and understand by policy makers ([21] Vonk et al., 2007). The results of the analyses will facilitate plan- ning and policy making processes for effective targeting of risk population in Leeds.
However, reliance on the 2001 census data in the study is considered a major limitation. Though, the 2001 cen- sus is a rich source of demographic and socioeconomic data, it is fairly outdated. Information on smoking and related lifestyle information are not collected. Using the 2009 GLS statistics for deriving estimates of the smoking population from census data has serious implications for accuracy and reliability of results. It is argued that using one variable at a time to estimate smoking population might not be a reliable method because classification of areas into smoking groups might vary slightly with the demographic indicators used. [4] Tomintz et al. (2010) argue that micro-simulation techniques based on deter- ministic reweighting and integration of census and GLS data might be more reliable ways of combining key indi- cators of smoking risks to produce better estimates upon
which further analysis and policy decisions can be made. The conventional method used for resolving loca-
tion-allocation problems modelled alternate locations of services and demand as discrete points represented by centroids of output areas under consideration. This might be insufficient for handling dense demand data especially where a number of complex factors shaping location de- cisions (such as cost, time and uncertainties of potential sites) are not considered ([22] Murat et al., 2010). Dis- tance estimation in the location-allocation algorithm used is based on Euclidean principles. Spatial linkages and modes of transportation are not considered in estimating distance in the model. Some studies have moved beyond Euclidean distance by using GIS to produce robust mod- els which consider actual travel time along networks. Future studies and modifications of the model should consolidate on incorporating a wider range of demo- graphic and local environmental conditions which might modify what is considered optimal for locating stop- smoking services in realistic terms.
Despite inherent conceptual flaws and perceived mathematical sophistication of location-allocation meth- ods, the study in line with several studies, demonstrates the effectiveness of the method in providing a useful
Copyright © 2013 SciRes. JGIS
M. O. AJEBON, M. O. ASIKHIA 279
guide in location decision problem solving ([15] Foley et al., 2009, [7] McEwen et al., 2010, [19] Rahman and Smith, 2000, [1] Tomintz et al., 2008, [3] Tomintz et al., 2009, [4] Tomintz et al., 2010).
REFERENCES [1] M. N. Tomintz, G. P. Clarke and J. E. Rigby, “The Ge-
ography of Smoking in Leeds: Estimating Individual Smoking Rates and the Implications for the Location of Stop Smoking Services,” Area, Vol. 40, No. 3, 2008, pp. 341-353. doi:10.1111/j.1475-4762.2008.00837.x
[2] J. Pearce, R. Barnett and G. Moon, “Sociospatial Ine-qualities in Health-Related Behaviours: Pathways Linking Place and Smoking,” Progress in Human Geography, Vol. 36, No. 1, 2011, pp. 3-24.
[3] M. N. Tomintz, G. P. Clarke and J. E. Rigby, “Planning the Location of Stop Smoking Services at the Local Level: A Geographic Analysis,” The Journal of Smoking Cessa- tion, Vol. 4, No. 2, 2009, pp. 61-73. doi:10.1375/jsc.4.2.61
[4] M. N. Tomintz, G. P. Clarke and J. E. Rigby, “A Micro- simulation Model to Find Optimal Locations for Smoking Cessation Services,” Royal Geographical Society, Vol. 40, 2010, p. 21.
[5] L. Wolfenden, J. Wiggers, J. Knight, E. Campbell, A. Spigelman, R. Kerridge and K. Moore, “Increasing Smok- ing Cessation Care in a Preoperative Clinic: A Random- ized Controlled Trial,” Preventive Medicine, Vol. 41, No. 1, 2005, pp. 284-290. doi:10.1016/j.ypmed.2004.11.011
[6] G. E. Guindon and D. Boisclair, “Past, Current and Fu- ture Trends in Tobacco Use,” WHO Tobacco Control Papers, Vol. 63, 2003.
[7] A. McEwen, L. Condliffe and A. Gilbert, “Promoting Engagement with a Stop Smoking Service via Pro-Active Telephone Calls,” Patient Education and Counseling, Vol. 80, No. 2, 2010, pp. 277-279. doi:10.1016/j.pec.2009.11.009
[8] F. Popham, “To What Extent Can Deprivation Inequali- ties in Mortality and Heart Disease Incidence amongst the Working Aged in Scotland Be Explained by Smoking? Relative and Absolute Approaches,” Health & Place, Vol. 17, No. 5, 2011, pp. 1132-1136. doi:10.1016/j.healthplace.2011.05.008
[9] J. E. Gibson, R. L. Murray, R. Borland, K. M. Cummings, G. T. Fong, D. Hammond and A. Mcneill, “The Impact of the United Kingdom’s National Smoking Cessation Strat- egy on Quit Attempts and Use of Cessation Services: Findings from the International Tobacco Control Four Country Survey,” Nicotine & Tobacco Research, Vol. 12, Supplement 1, 2010, pp. S64-S71. doi:10.1093/ntr/ntq119
[10] L. Bauld, K. Judge and S. Platt, “Assessing the Impact of Smoking Cessation Services on Reducing Health Inequal- ities in England: Observational Study,” Tobacco Control,
Vol. 16, No. 6, 2007, pp. 400-404. doi:10.1136/tc.2007.021626
[11] T. N. I. C. L. Statistics, “Statistics on Smoking: England 2011,” The Health and Social Care Information Centre, 2011.
[12] ASH Fact Sheet on Smoking Statistics, “Smoking Statis- tics: Who Smokes and How Much,” Fact Sheets on Smoking Statistics, Action on Smoking and Health, 2011.
[13] K. Richardson, “Smoking, Low Income and Health Ine- qualities: Thematic Discussion Document,” Report for Action on Smoking and Health and the Health Develop- ment Agency, 2001.
[14] Healthy Leeds, “Health and Wellbeing Partnership Plan: Improving Health and Reducing Health Inequalities in Leeds,” Healthy Leeds Partnership Initiative, 2009 to 2012.
[15] R. Foley, M. C. Charlton and A. S. Fotheringham, “GIS in Health and Social Care Planning,” National Centre for Geocomputation, 2009. http://eprints.nuim.ie/2990/1/FoleyCharltonFotheringham_Final.pdf.
[16] S. Robinson and H. Harris, “Smoking and Drinking among Adults, 2009,” General Lifestyle Survey, Office for National Statistics, 2011, 84 pp.
[17] D. Vickers and P. Rees, “Creating the UK National Sta- tistics 2001 Output Area Classification,” Journal of the Royal Statistical Society: Series A (Statistics in Society), Vol. 170, No. 2, 2007, pp. 379-403. doi:10.1111/j.1467-985X.2007.00466.x
[18] A. Shankar, A. Mcmunn and A. Steptoe, “Health-Related Behaviors in Older Adults: Relationships with Socioeco- nomic Status,” American Journal of Preventive Medicine, Vol. 38, No. 1, 2010, pp. 39-46. doi:10.1016/j.amepre.2009.08.026
[19] S. Rahma and D. K. Smith, “Use of Location-Allocation Models in Health Service Development Planning in De- veloping Nations,” European Journal of Operational Re- search, Vol. 123, No. 3, 2000, pp. 437-452. doi:10.1016/S0377-2217(99)00289-1
[20] D. M. Smith, J. R. Pearce and K. Harland, “Can a Deter- ministic Spatial Microsimulation Model Provide Reliable Small-Area Estimates of Health Behaviours? An Example of Smoking Prevalence in New Zealand,” Health & Place, Vol. 17, No. 2, 2011, pp. 618-624. doi:10.1016/j.healthplace.2011.01.001
[21] G. Vonk, S. Geertman and P. Schot, “A SWOT Analysis of Planning Support Systems,” Environment and Plan- ning A, Vol. 39, No. 7, 2007, pp. 1699-1714. doi:10.1068/a38262
[22] A. Murat, V. Verter and G. Laporte, “A Continuous Analysis Framework for the Solution of Location-Allo- cation Problems with Dense Demand,” Computers & Operations Research, Vol. 37, No. 1, 2010, pp. 123-136. doi:10.1016/j.cor.2009.04.001
Copyright © 2013 SciRes. JGIS

M. O. AJEBON, M. O. ASIKHIA 280
Appendix
Appendix 1. Locations of existing stop-smoking service centres in Leeds.
Postcode X Y Clinic Period of Day Weekday Clinic Name
LS10 2PT 431293 431614 1 Mornings Wednesday Hunslet Health Centre
LS10 3JA 431441 429591 2 Afternoons Tuesday South Leeds Youth Hub
LS10 4HT 429946 427619 3 Tuesdays Monday Middleton Community Health Centre
LS11 5LQ 429840 430645 4 Evenings Thursday Parkside Community Health Centre
LS11 8BS 429403 431389 5 Mornings Tuesday Beeston Hill Community Health Centre
LS12 1HU 428105 432905 6 Afternoons Monday Priory View Medical Centre
LS12 1JE 428025 432919 7 Mornings Wednesday Thornton Medical Centre
LS12 3HD 426894 433419 8 Tuesdays Mondays Armley Moor Health Centre
LS12 5SG 426375 431867 9 Afternoons Wednesday Wortley Beck Health Centre
LS13 3EJ 424464 435218 10 Afternoons Thursday Bramley Clinic
LS14 6PF 435613 436186 11 Afternoons Monday Seacroft Clinic
LS14 6UH 434941 434607 12 Mornings Tuesdays Seacroft Hospital
LS15 7HR 434863 433469 13 Afternoons Friday Halton Clinic
LS15 7JY 436132 434509 14 Afternoons Thursday Newman Centre (St. Theresa’s Church Hall)
LS16 5BE 426296 437537 15 Mornings Tuesday West Park Centre
LS16 7QD 426419 440164 16 Afternoons Monday Holt Park Health Centre
LS17 5JD 429182 439111 17 Afternoons Wednesday Northcall Community Centre, Cramner Bank
LS18 4SE 424086 438226 18 Evenings Monday New Croft Surgery
LS2 9NS 429442 434115 19 Afternoons Wednesday Leeds General Infirmary
LS21 2LY 419767 446481 20 Mornings Thursday Wharfedale General Hospital
LS26 0UE 434068 428034 21 Evenings Wednesday Rothwell Health Centre
LS27 9NB 426109 427683 22 Evenings Monday Morley Health Centre
LS28 7BE 422315 433342 23 Evenings Tuesday Pudsey Leisure Centre
LS28 7XP 422241 433227 24 Mornings Friday Pudsey Health Centr
LS5 3DB 426409 435836 25 Afternoons Thursday Kirkstall Health Centre
LS7 3DT 429974 436727 26 Evenings Monday Scott Hall Sports Centre
LS7 4SA 431050 436365 27 Mornings Thursday Chapel Allerton Hospital
LS8 3BA 433945 436424 28 Mornings Friday The Lodge Medical Centre
LS9 6AU 432595 434850 29 Mornings Friday Bellbrooke Surgery
LS9 7ST 431242 434100 30 Afternoons Wednesday Lincoln Green Medical Centre
LS9 7TF 431768 434663 31 Afternoons Thursday St James’s University Hospital Gledhow Wing
LS9 8NG 431523 433230 32 Afternoons Monday Richmond Hill Children’s Centre
LS9 9EF 433169 433885 33 Afternoons Tuesday East Leeds Health Centre
Copyright © 2013 SciRes. JGIS