UNIT 4. Receiver Functional Block Diagram Fiber-Optic Communications Technology-Mynbaev & Scheiner.

Geog 126: Maps in Science and Society
The History of Quantitative Graphics to 1850
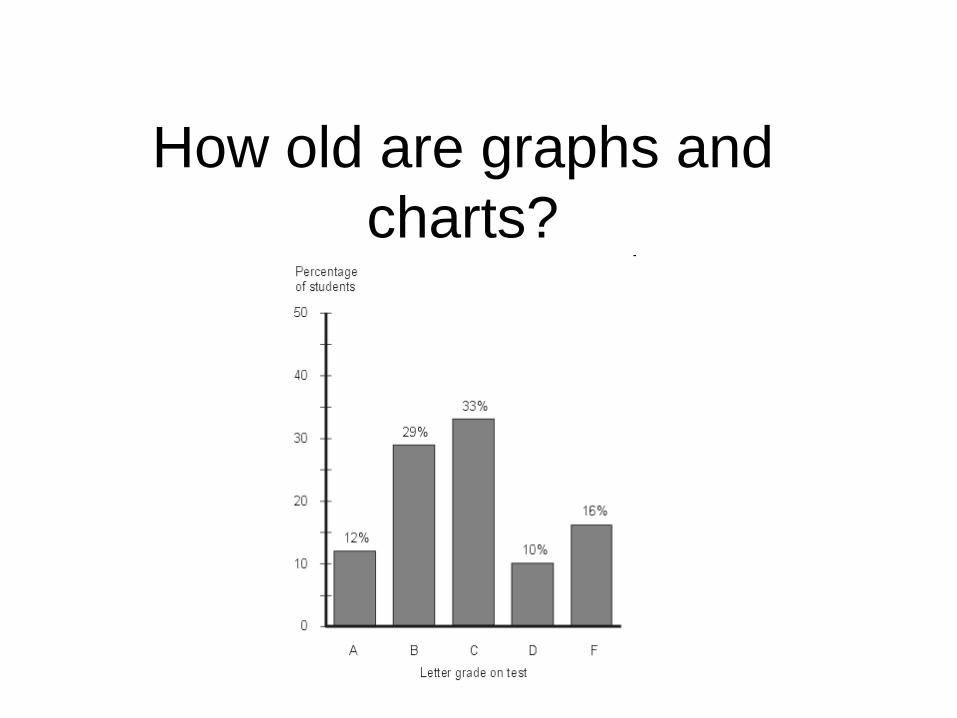
How old are graphs and charts?
The Birth of Quantitative Graphics
• Tied to the emergence of statistical thinking and data collection
• Tied to media – Printers, paper, computer screens etc.
• This lecture source entirely from: • http://www.math.yorku.ca/SCS/Gallery/milestone/

Precise Scientific Observation
• Data graphics are bound to data collection • Census in Egypt 3340 BC and in 3050 BC
– Well-developed and precise data collection techniques: Late 1500’s
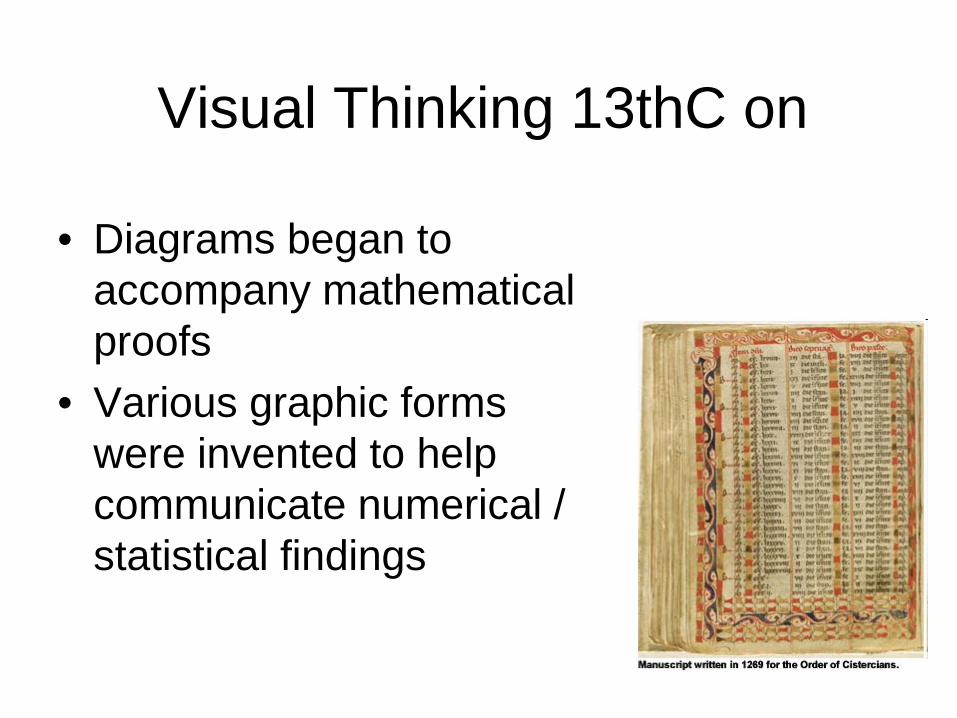
Visual Thinking 13thC on
• Diagrams began to accompany mathematical proofs
• Various graphic forms were invented to help communicate numerical / statistical findings
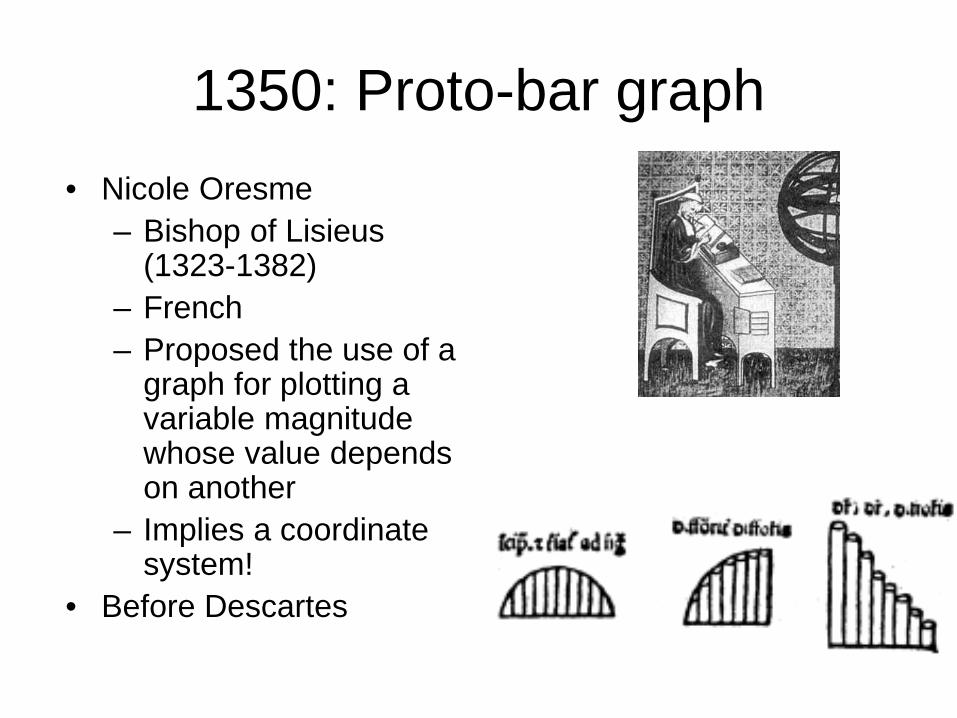
1350: Proto-bar graph • Nicole Oresme
– Bishop of Lisieus (1323-1382)
– French – Proposed the use of a
graph for plotting a variable magnitude whose value depends on another
– Implies a coordinate system!
• Before Descartes

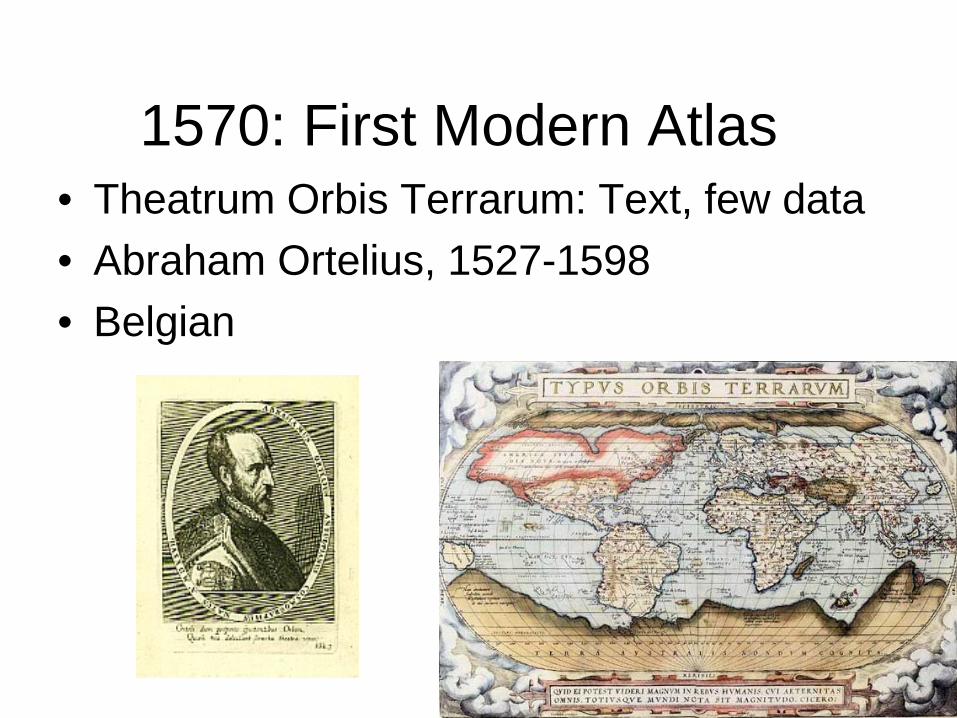
1570: First Modern Atlas • Theatrum Orbis Terrarum: Text, few data • Abraham Ortelius, 1527-1598 • Belgian

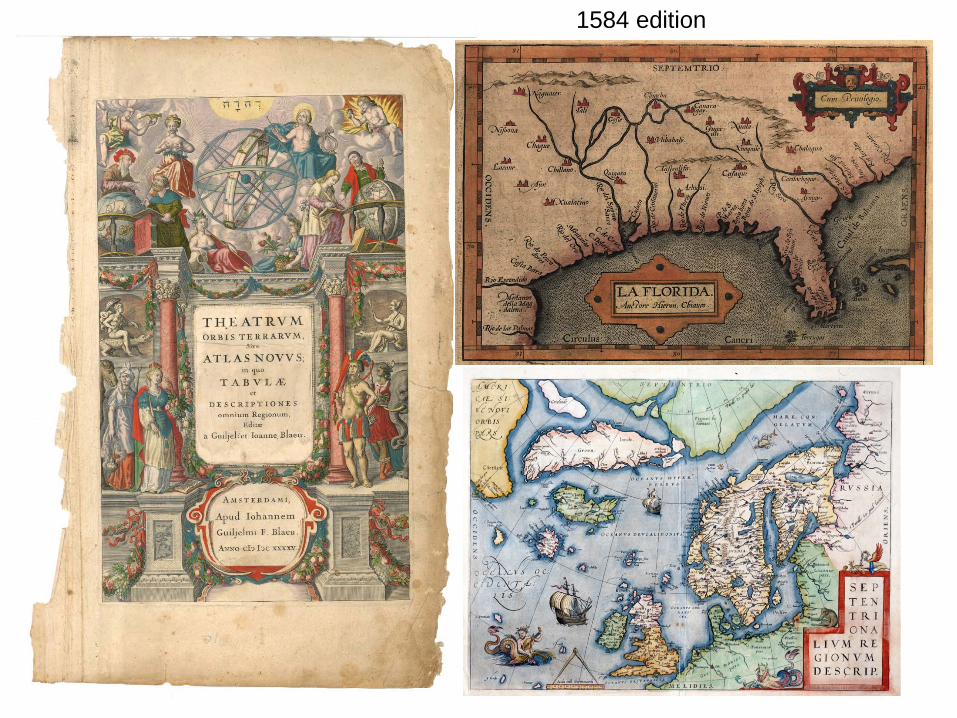
1584 edition
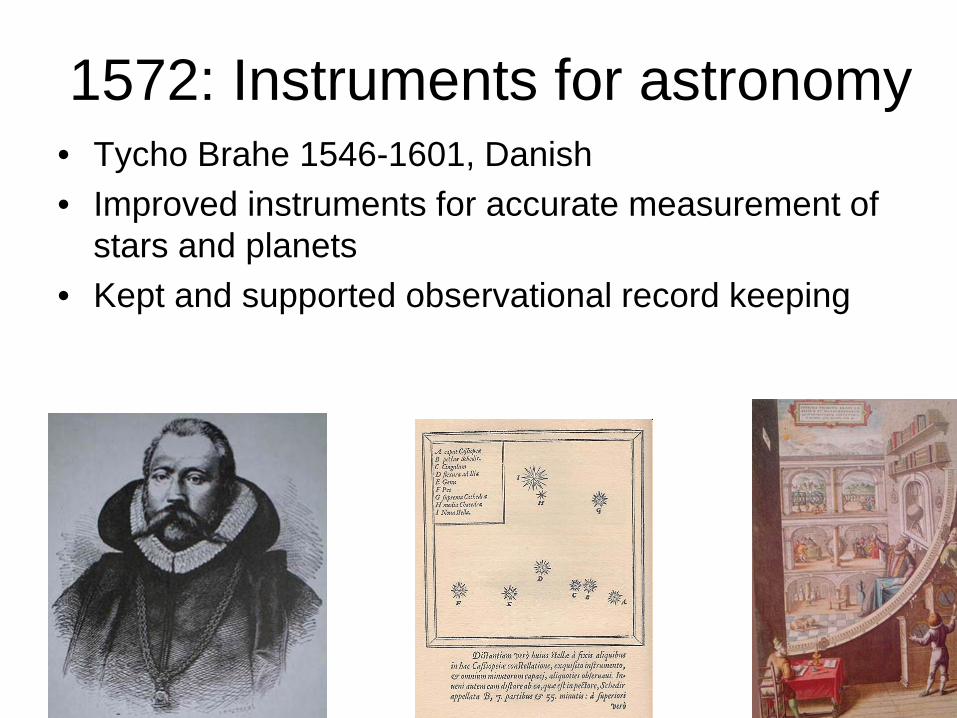
1572: Instruments for astronomy • Tycho Brahe 1546-1601, Danish • Improved instruments for accurate measurement of
stars and planets • Kept and supported observational record keeping

1637: Coordinates reintroduced • Cartesian Coordinates • Relationship established between graphed
lines and equations • Rene Descartes 1596-1650
– French

1626: First “Small Multiples”
• Shows a series of images – Arranged in a logical sequence – Depicts changes over time graphically
• Christopher Scheiner (1575-1650) – Italian – Changes in sunspots over time – Same idea used by Galileo in 1610

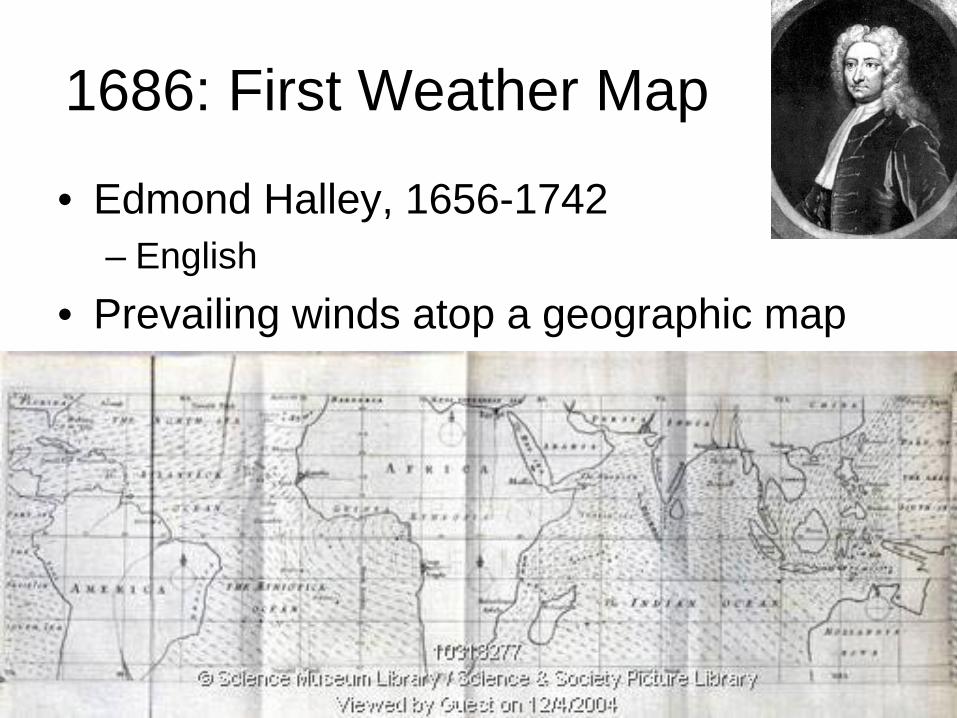
1686: First Weather Map
• Edmond Halley, 1656-1742 – English
• Prevailing winds atop a geographic map
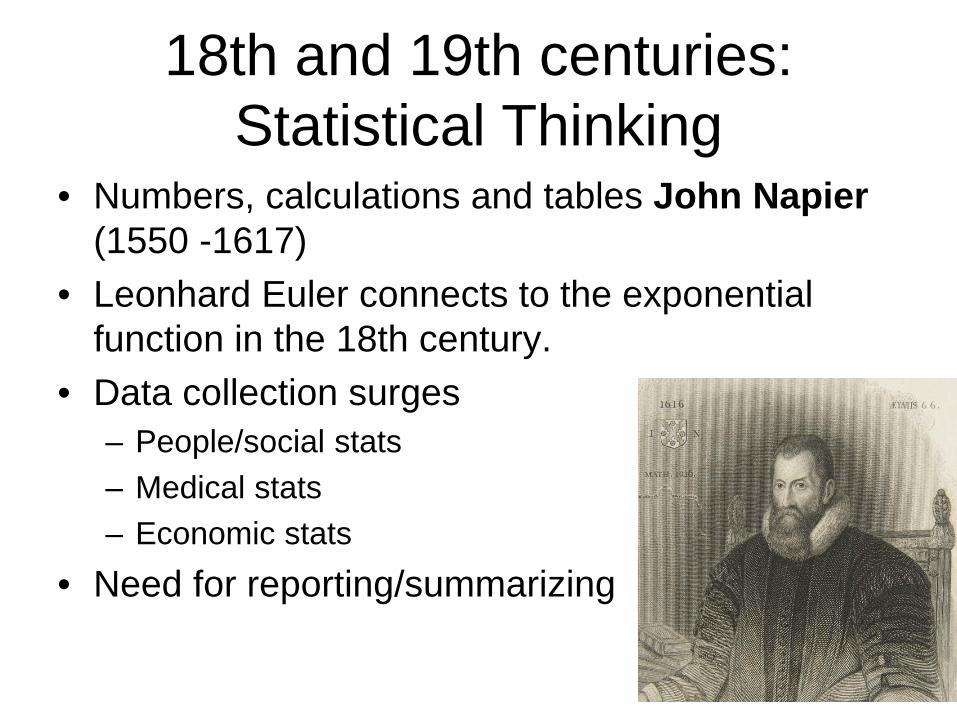
18th and 19th centuries: Statistical Thinking
• Numbers, calculations and tables John Napier (1550 -1617)
• Leonhard Euler connects to the exponential function in the 18th century.
• Data collection surges – People/social stats – Medical stats – Economic stats
• Need for reporting/summarizing
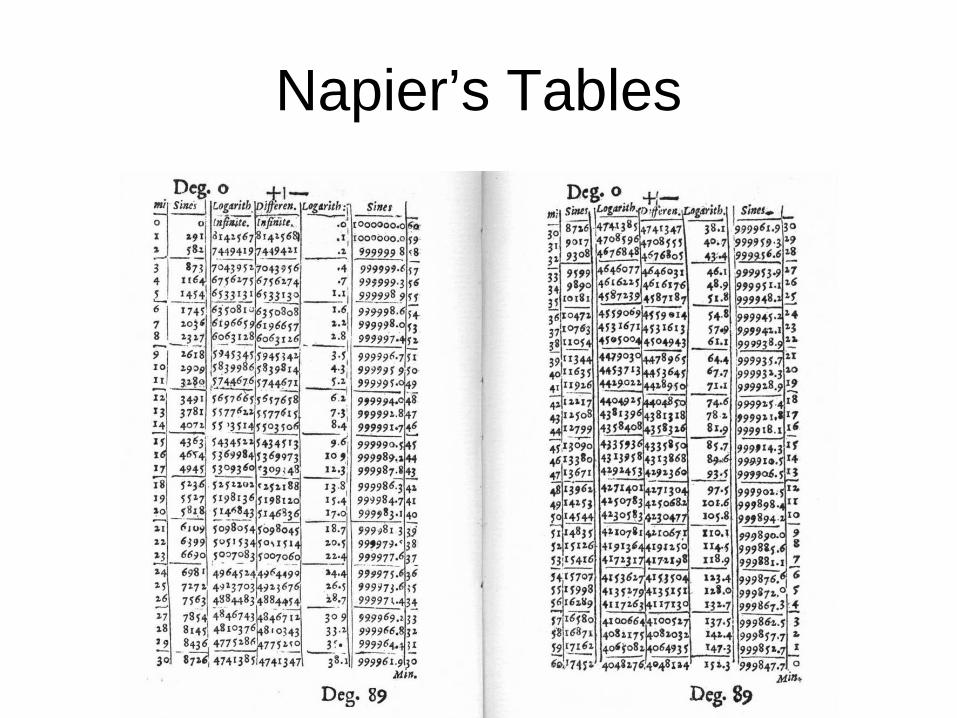
Napier’s Tables
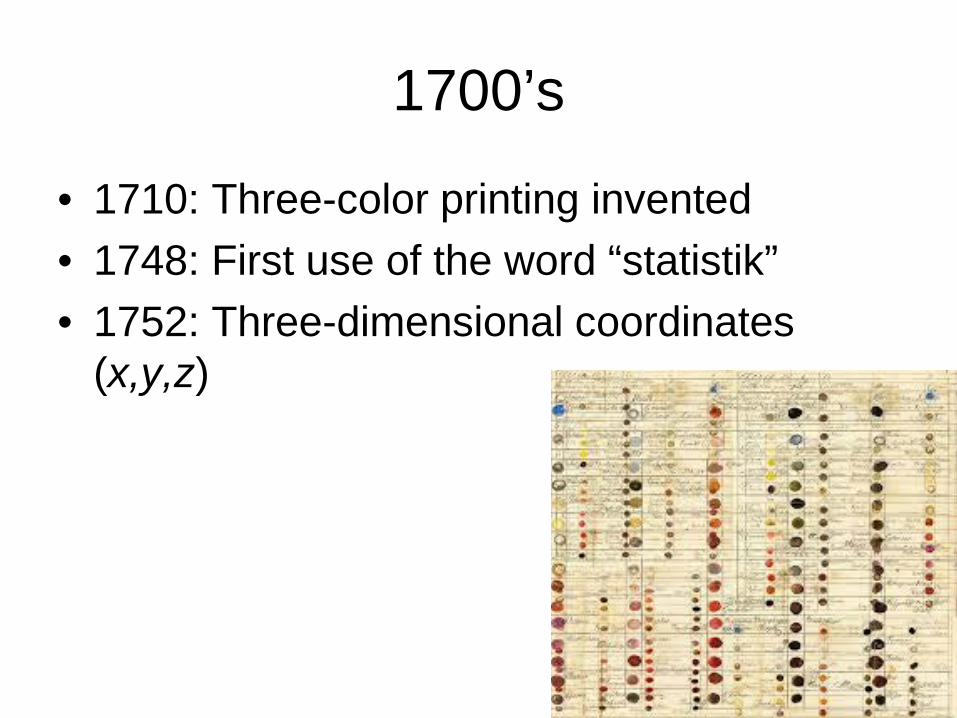
1700’s
• 1710: Three-color printing invented • 1748: First use of the word “statistik” • 1752: Three-dimensional coordinates
(x,y,z)
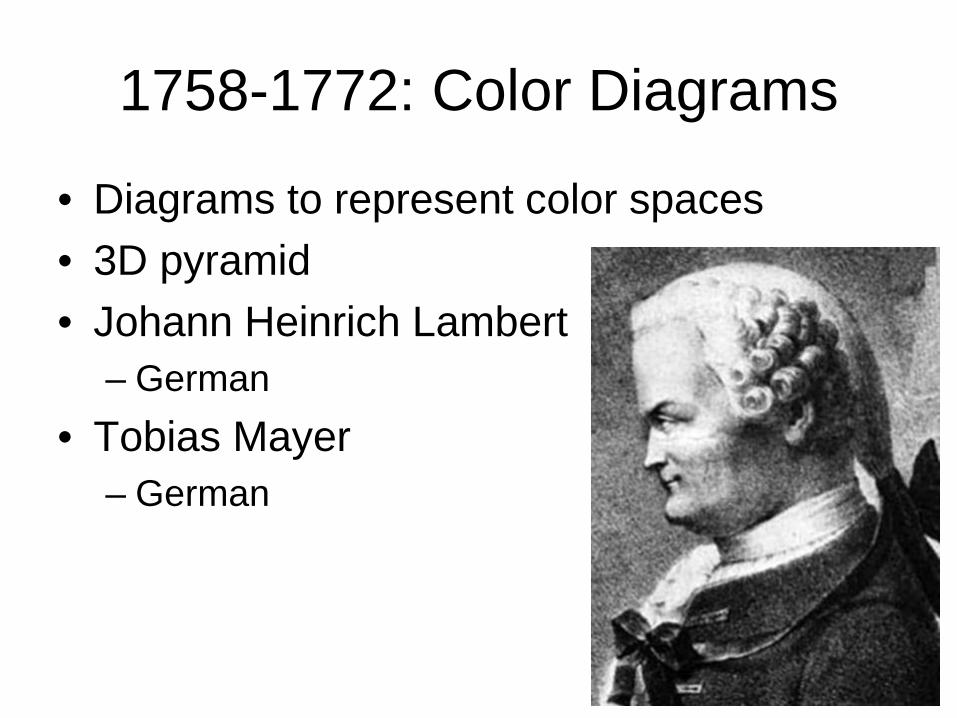
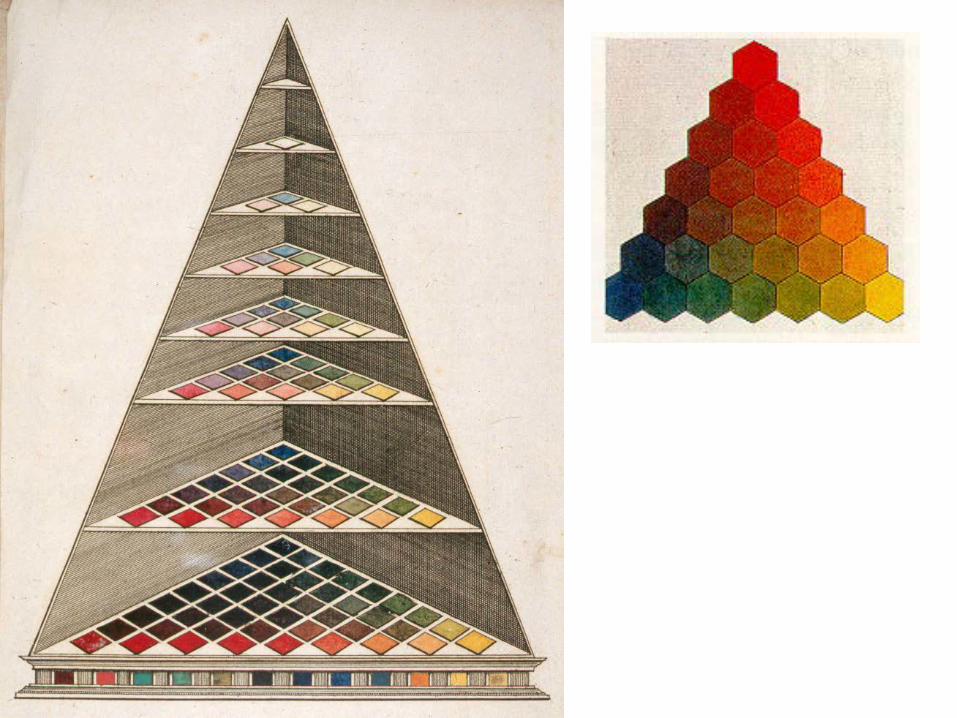
1758-1772: Color Diagrams
• Diagrams to represent color spaces • 3D pyramid • Johann Heinrich Lambert
– German • Tobias Mayer
– German
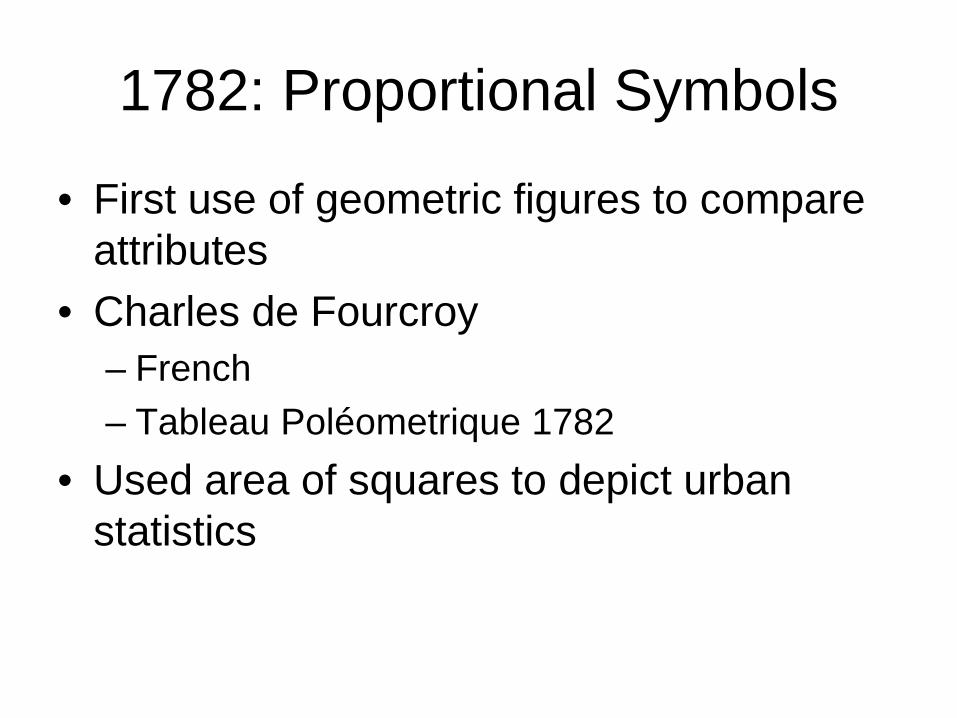
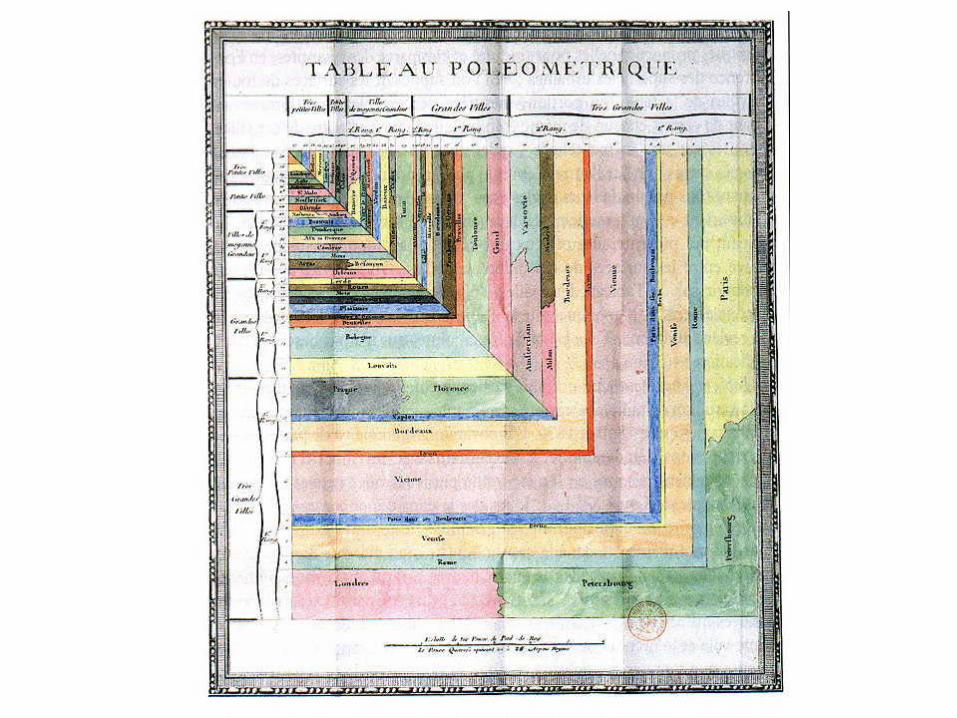
1782: Proportional Symbols
• First use of geometric figures to compare attributes
• Charles de Fourcroy – French – Tableau Poléometrique 1782
• Used area of squares to depict urban statistics
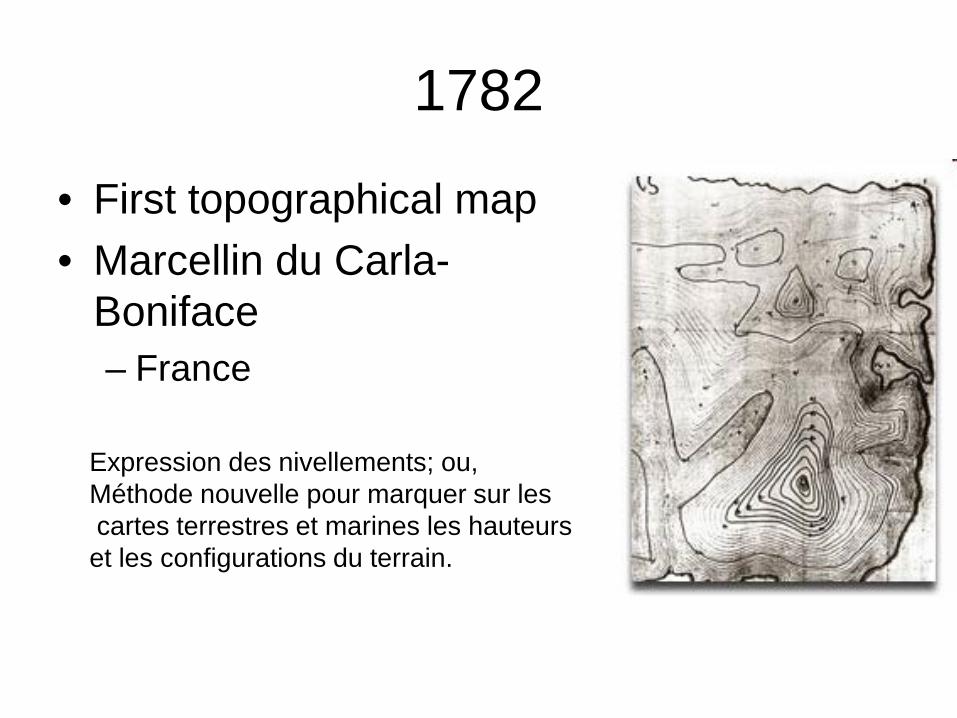
1782
• First topographical map • Marcellin du Carla-
Boniface – France
Expression des nivellements; ou, Méthode nouvelle pour marquer sur les cartes terrestres et marines les hauteurs et les configurations du terrain.
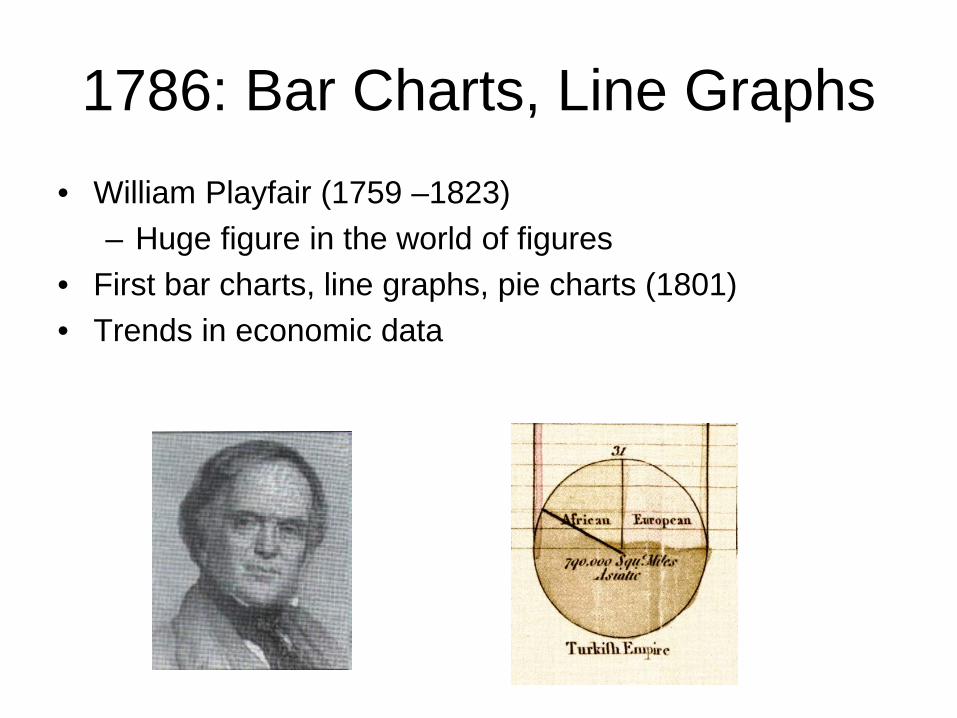
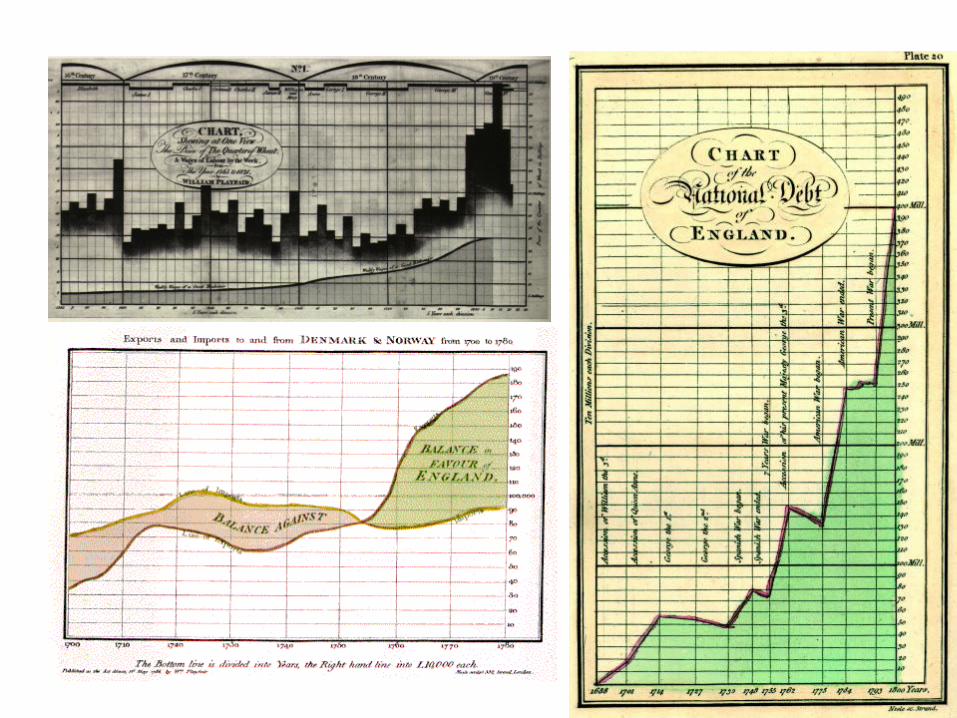
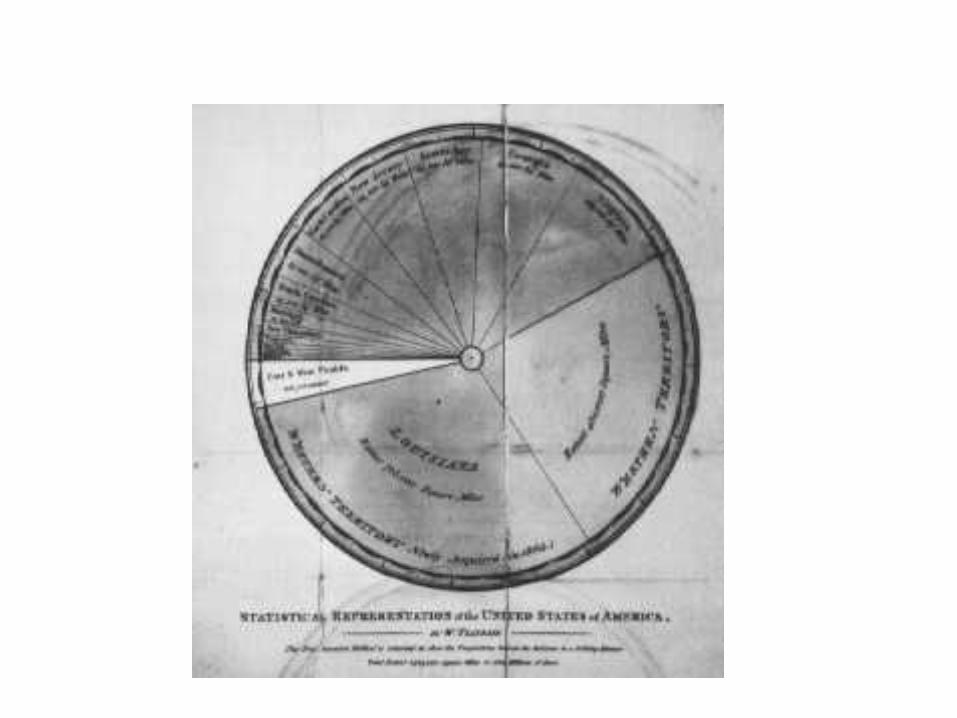
1786: Bar Charts, Line Graphs • William Playfair (1759 –1823)
– Huge figure in the world of figures • First bar charts, line graphs, pie charts (1801) • Trends in economic data
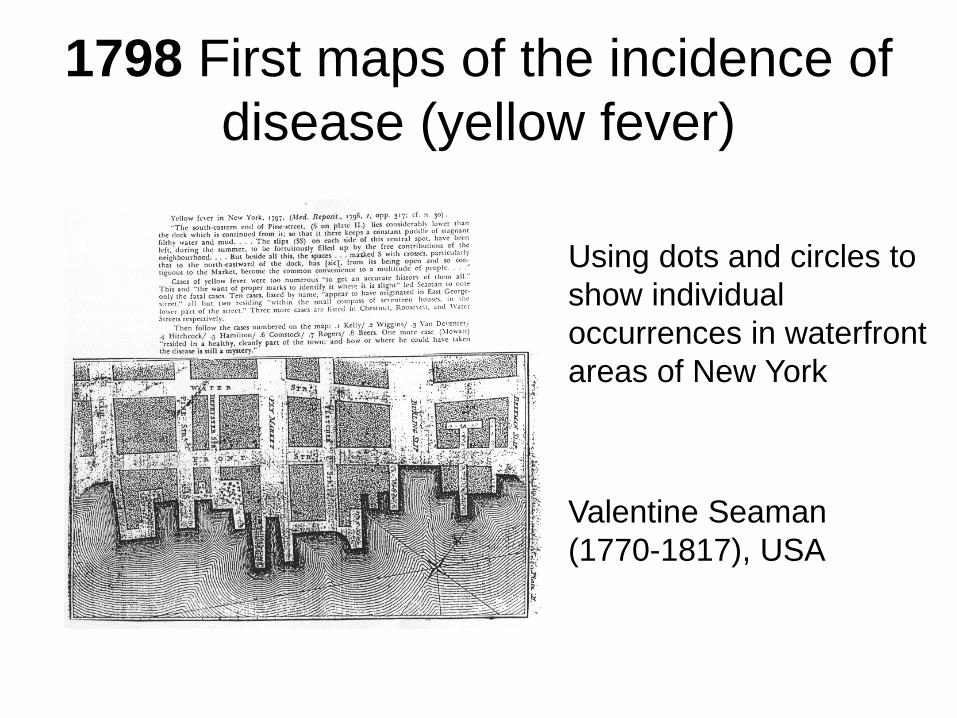
1798 First maps of the incidence of disease (yellow fever)
Valentine Seaman (1770-1817), USA
Using dots and circles to show individual occurrences in waterfront areas of New York
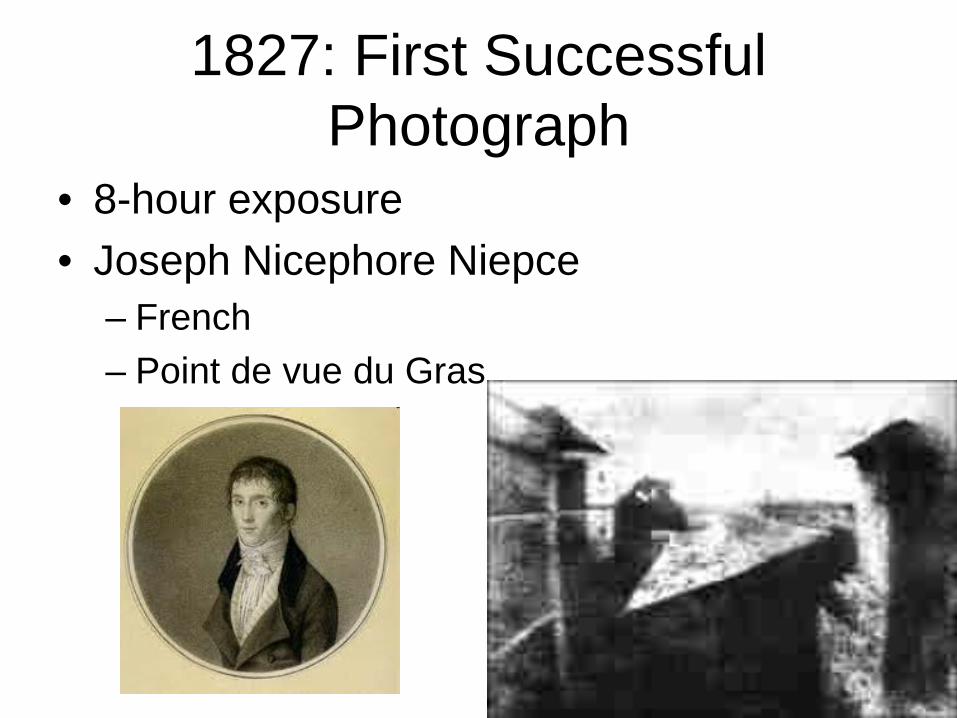
1827: First Successful Photograph
• 8-hour exposure • Joseph Nicephore Niepce
– French – Point de vue du Gras
1819: First Choropleth Map
• Baron Pierre Charles Dupin 1784-1873 – French
• Unclassed choropleth map of illiteracy • First “modern statistical map”

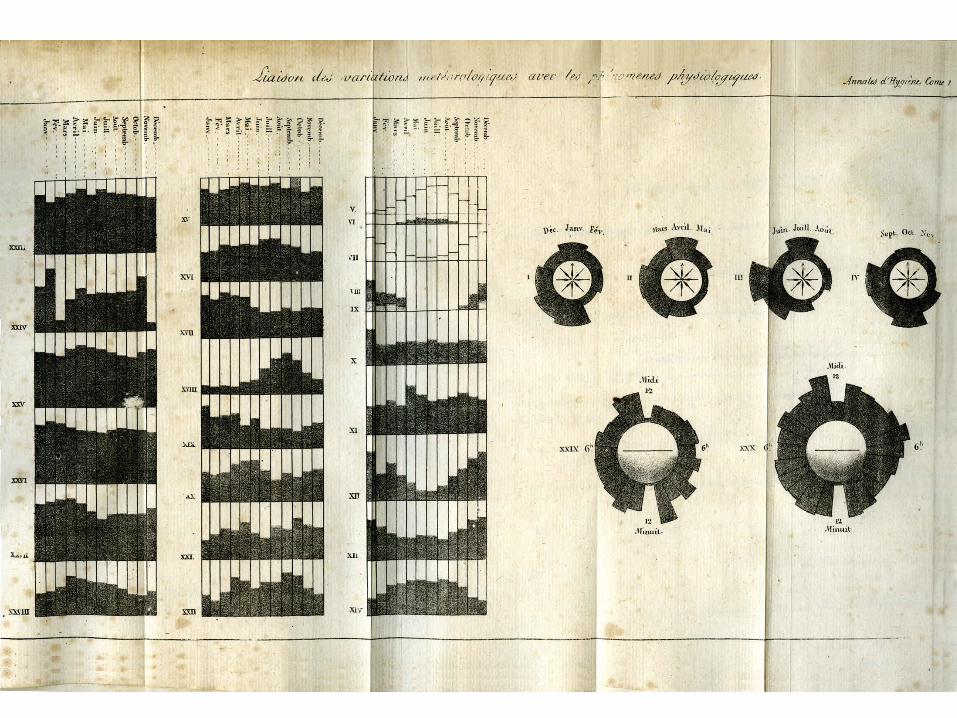
1829: Polar-(Radar) charts
• Show frequency of cyclic phenomena • Andre Michel Guerry 1802-1866
– French – Lawyer and amateur statistician. – Together with Adolphe Quetelet founded
moral statistics – Led to criminology, sociology and ultimately,
modern social science.


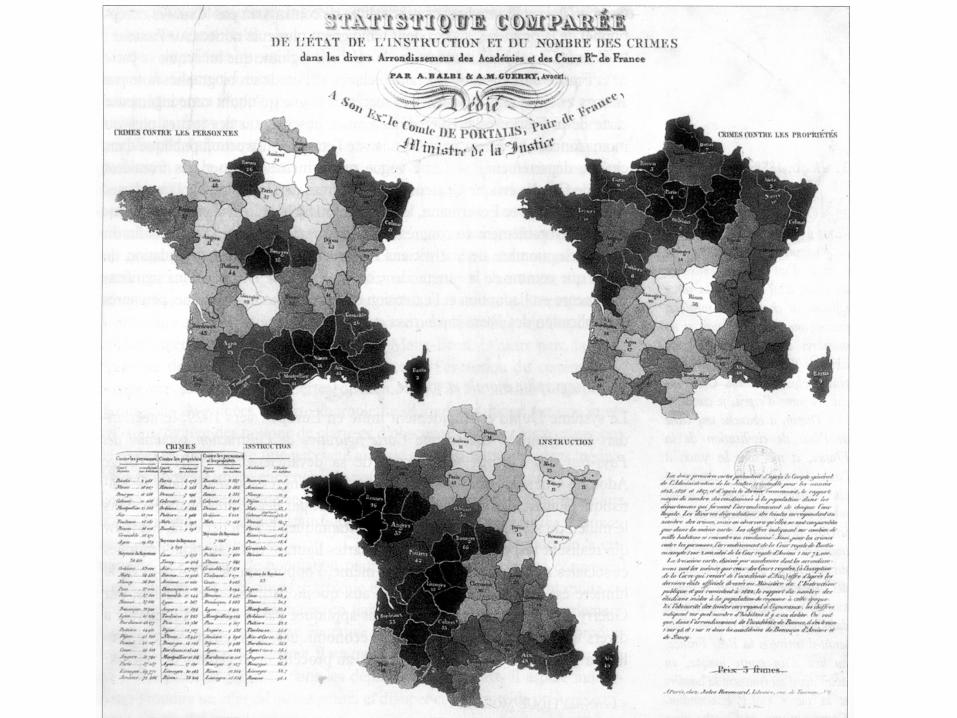
1829: First Cartographic Small Multiples
• Andre Michel Guerry • Crimes against persons compared to poverty • Balbi, Adriano, and André-Michel Guerry. 1829.
Statistique comparée de l'état de l'instruction et du nombre des crimes dans les divers arrondissements des Académies et des Cours Royales de France. Paris
• Also studied suicide, analyzed text reports

Small multiples-> animation
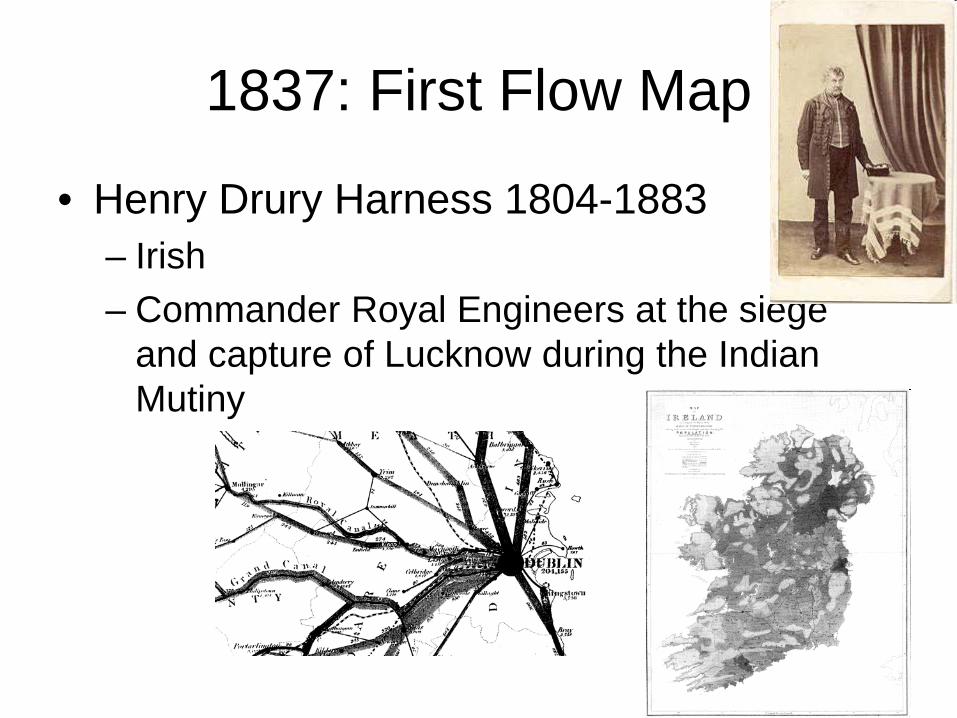
1837: First Flow Map
• Henry Drury Harness 1804-1883 – Irish – Commander Royal Engineers at the siege
and capture of Lucknow during the Indian Mutiny
Thematic Atlas • Heinrich Berghaus (1797-1884), Germany • Worked on Prussian trigonometrical
survey in 1816, pioneer at Potsdam • Physical atlas of the distribution of plants,
animals, climate, etc • Contained tables, graphs, pictorial profiles
of distributions over altitude • Cultural and human themes • Physikalischer Atlas (Gotha, 1838–1848)

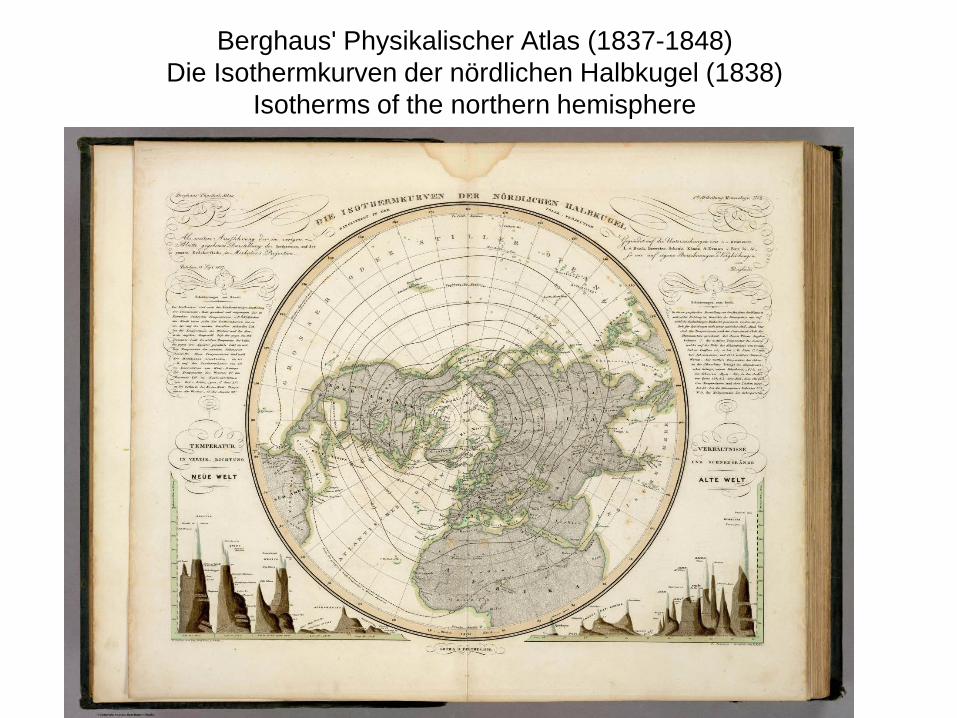
Berghaus' Physikalischer Atlas (1837-1848) Die Isothermkurven der nördlichen Halbkugel (1838)
Isotherms of the northern hemisphere
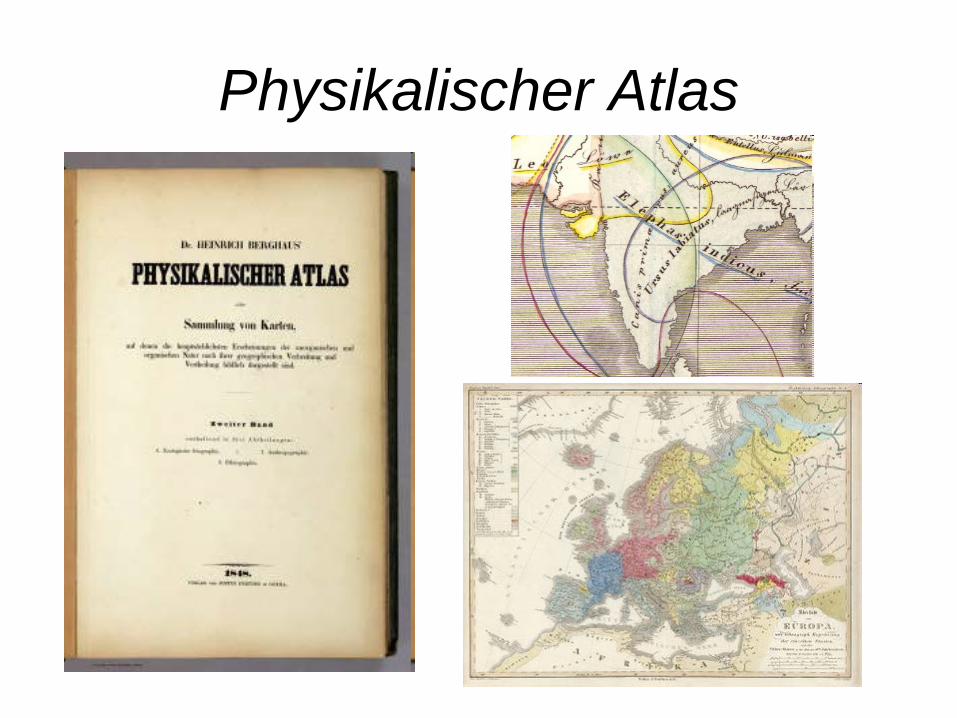
Physikalischer Atlas
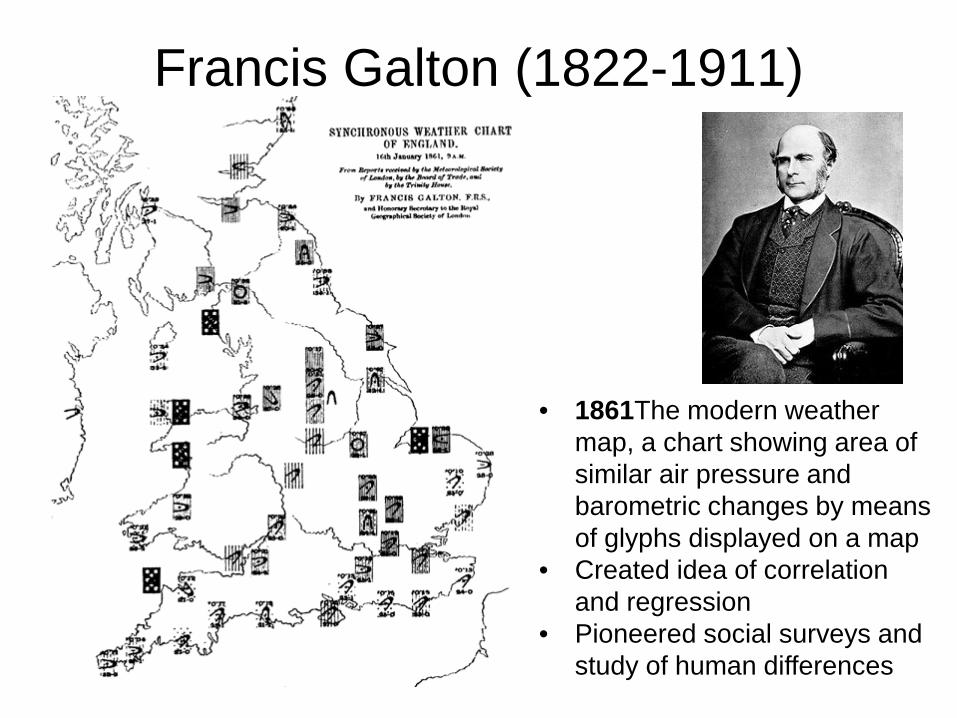
Francis Galton (1822-1911)
• 1861The modern weather
map, a chart showing area of similar air pressure and barometric changes by means of glyphs displayed on a map
• Created idea of correlation and regression
• Pioneered social surveys and study of human differences
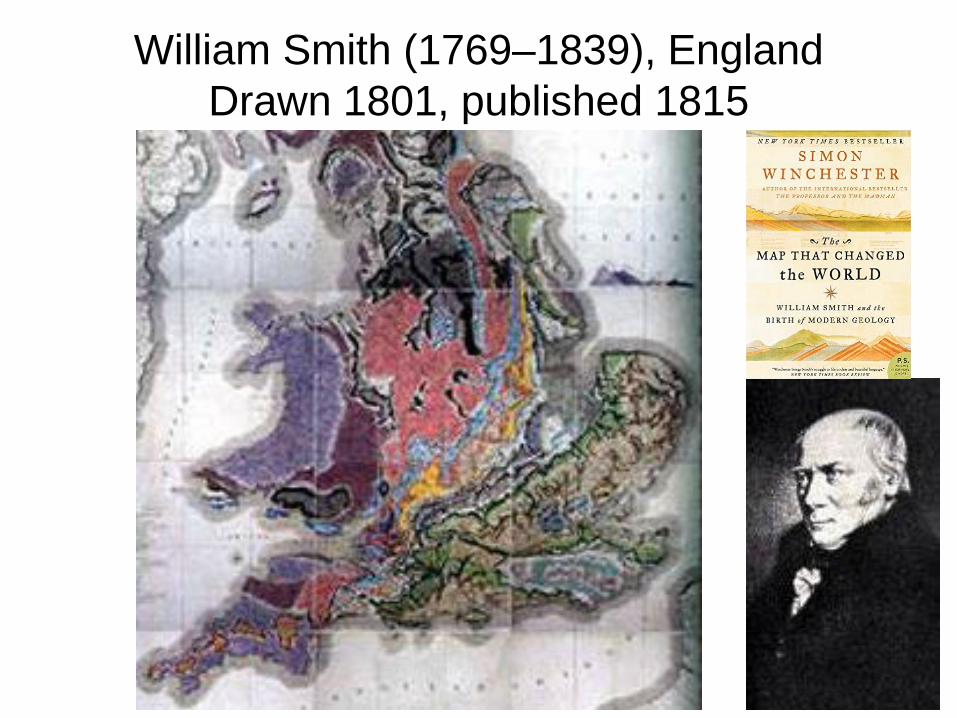
William Smith (1769–1839), England Drawn 1801, published 1815
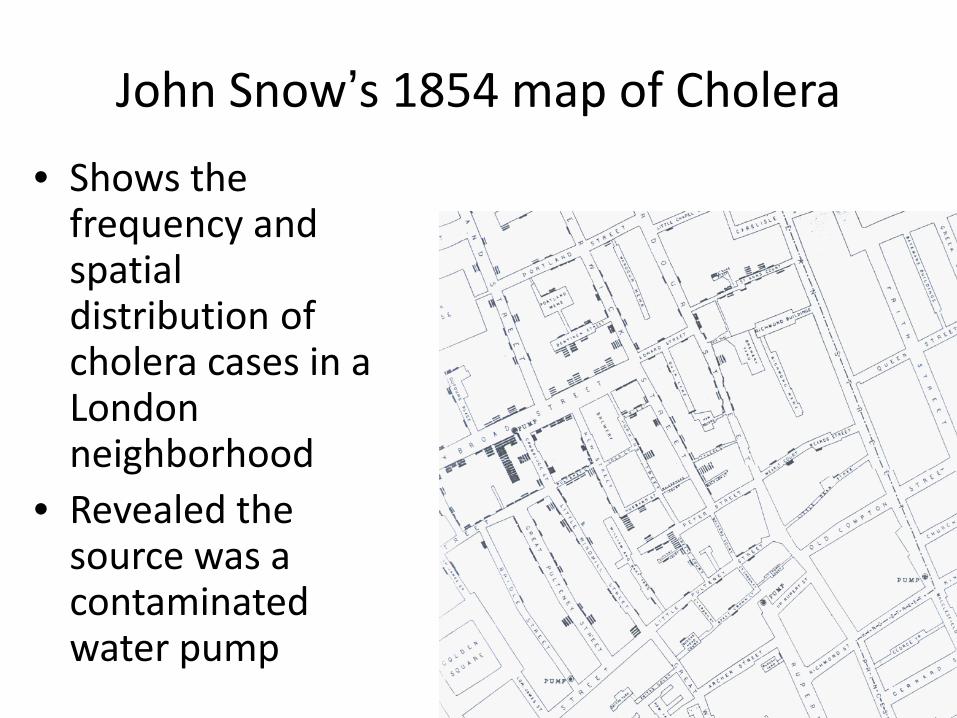
John Snow’s 1854 map of Cholera
• Shows the frequency and spatial distribution of cholera cases in a London neighborhood
• Revealed the source was a contaminated water pump
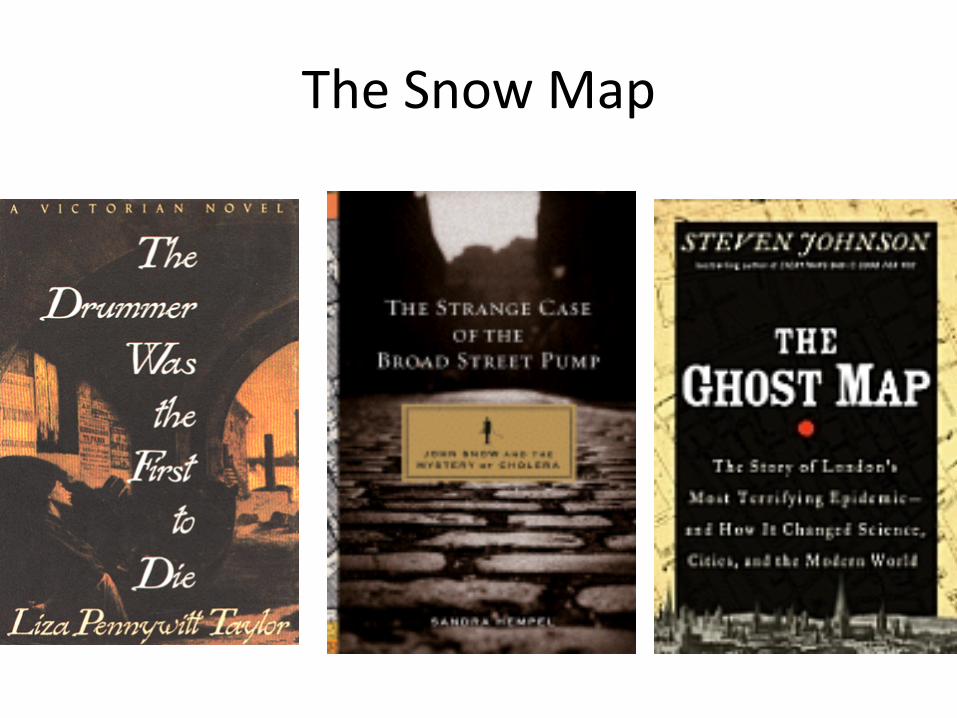
The Snow Map

The Broad Street Pump
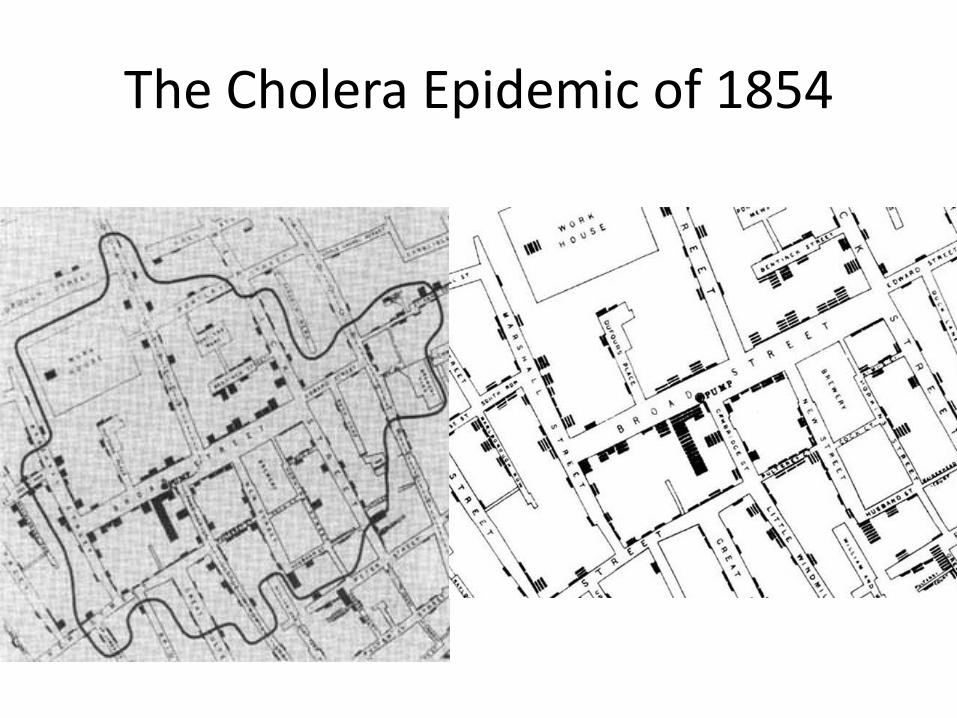
The Cholera Epidemic of 1854
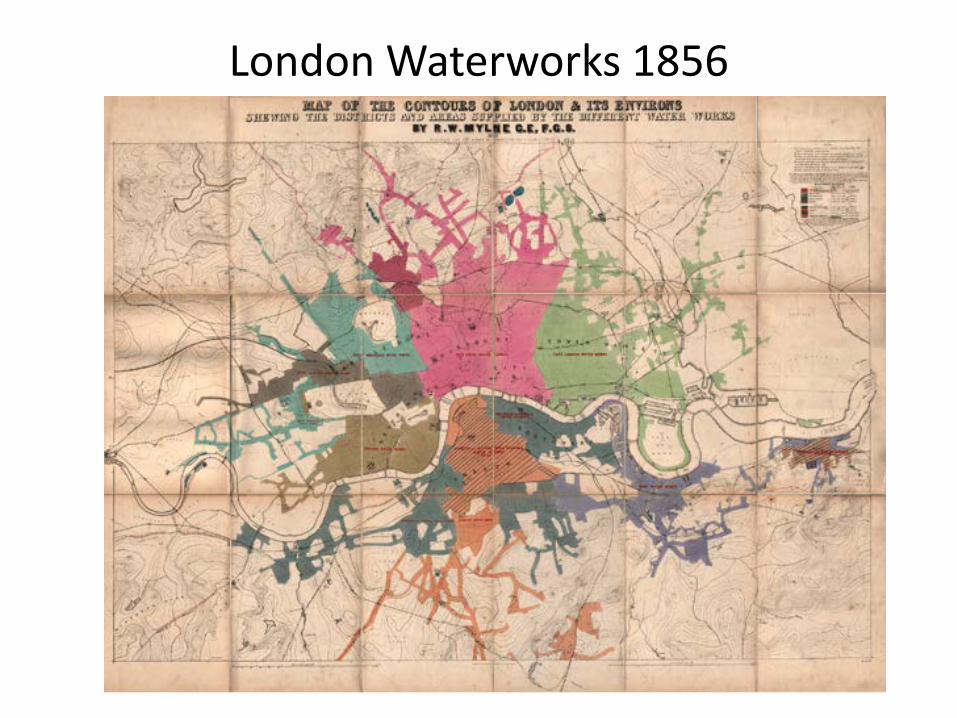
London Waterworks 1856

The Index Case

Booth’s Atlas of London 1898-99 See: http://phone.booth.lse.ac.uk/
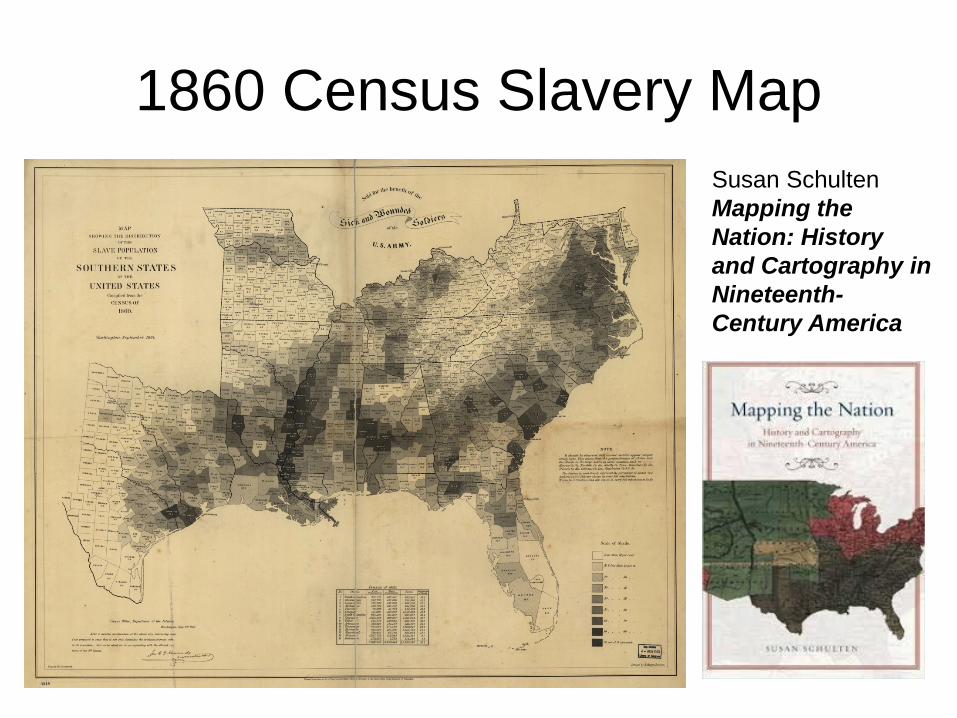
1860 Census Slavery Map Susan Schulten Mapping the Nation: History and Cartography in Nineteenth-Century America

Francis Bicknell Carpenter (1864) “First Reading of the Emancipation Proclamation
by President Lincoln”
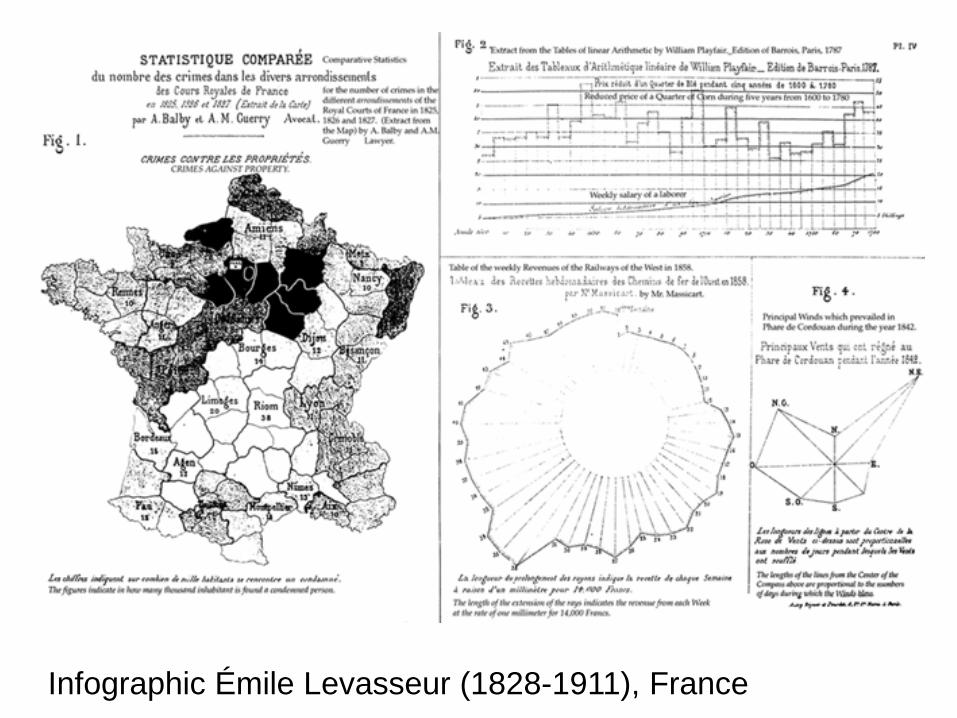
Infographic Émile Levasseur (1828-1911), France
Since the mid-19th Century • Rise of professional societies • Attempts at symbol standardization • Widespread use in science • Increased use in government, especially
for social issues e.g. public health • Origins of computing in Hollerith cards • Ideas appear in textbooks, comparisons
made
International Map of the World Millionth map
• Idea suggested by German Geographer Albrecht Penck (1858-1945) at the Fifth International Geographical Conference in 1891.
• Project begun in 1913 to create a complete map of the world according to internationally agreed standards
• Interrupted by WW1 • Central Bureau of the Map of the World established at the Ordnance
Survey in London • Archives partly destroyed by WWII German bombing • After the Second World War, the United Nations took over the
project, but interest waned • Only 800 to 1,000 of 2,500 planned maps were completed. • Officially abandoned in the early 1980s
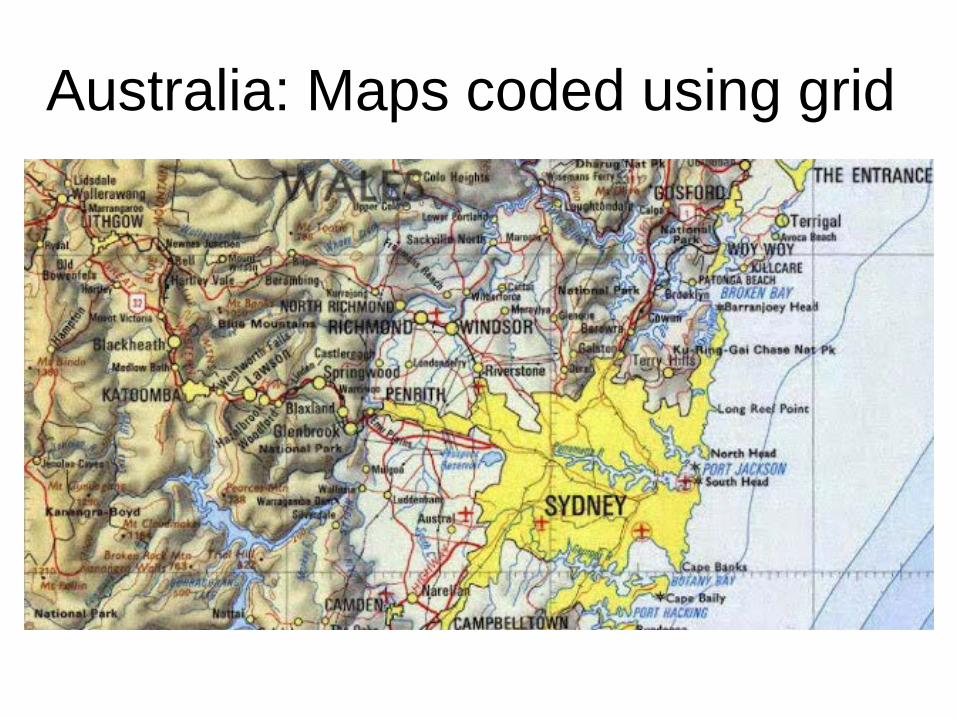
Australia: Maps coded using grid

Rediscovery in cartography • Scientific visualization • GeoViz • InfoViz • Spatialization • Data mining • Network theory
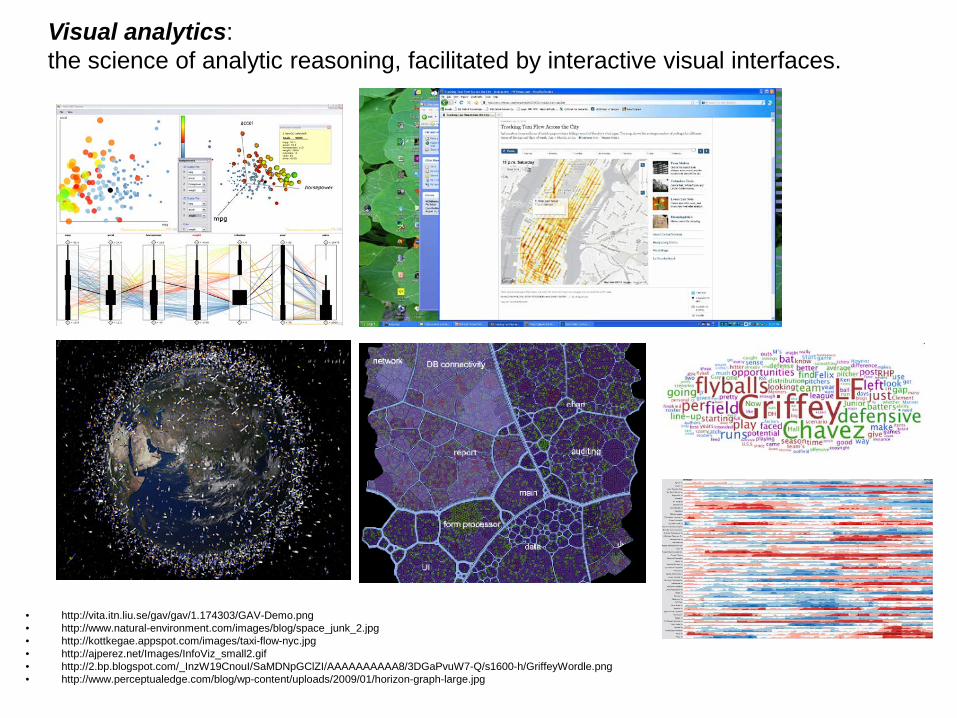
• http://vita.itn.liu.se/gav/gav/1.174303/GAV-Demo.png • http://www.natural-environment.com/images/blog/space_junk_2.jpg • http://kottkegae.appspot.com/images/taxi-flow-nyc.jpg • http://ajperez.net/Images/InfoViz_small2.gif • http://2.bp.blogspot.com/_InzW19CnouI/SaMDNpGClZI/AAAAAAAAAA8/3DGaPvuW7-Q/s1600-h/GriffeyWordle.png • http://www.perceptualedge.com/blog/wp-content/uploads/2009/01/horizon-graph-large.jpg
Visual analytics: the science of analytic reasoning, facilitated by interactive visual interfaces.
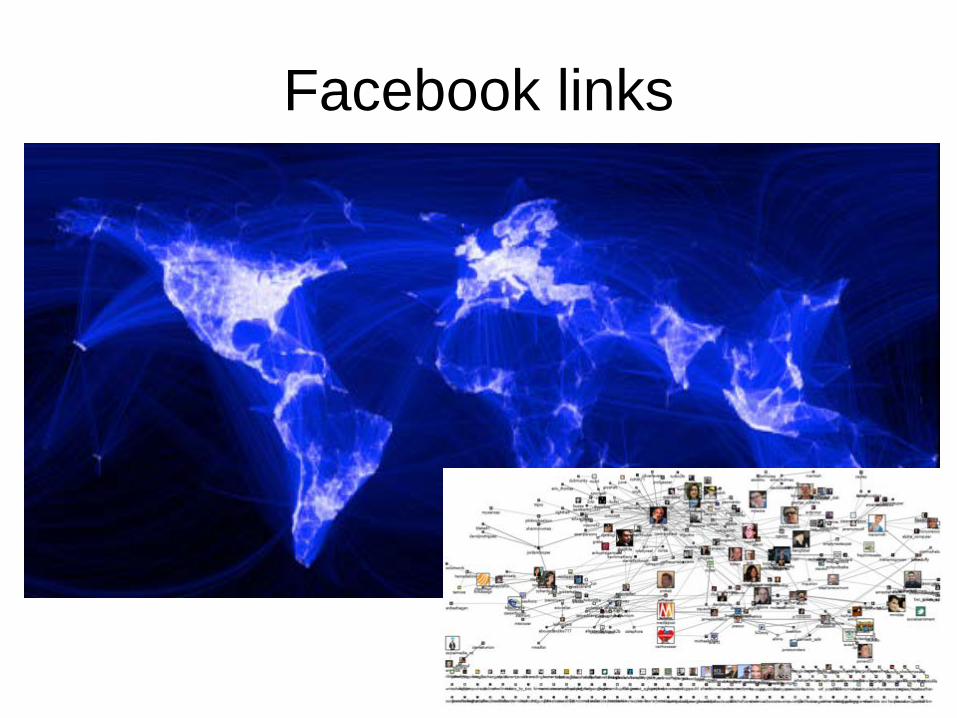
Facebook links
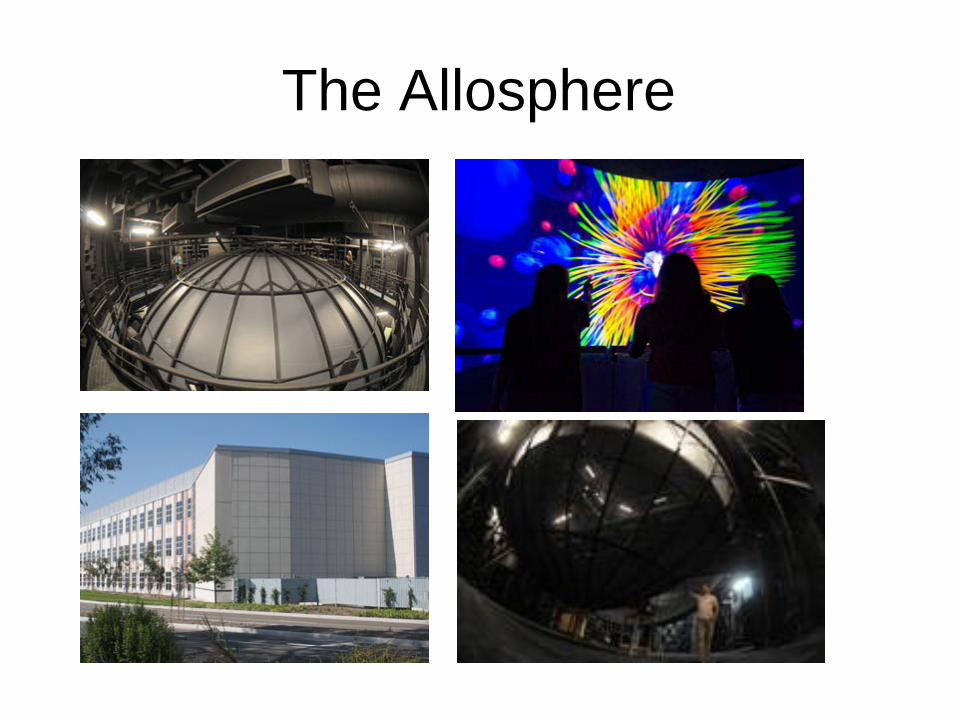
The Allosphere
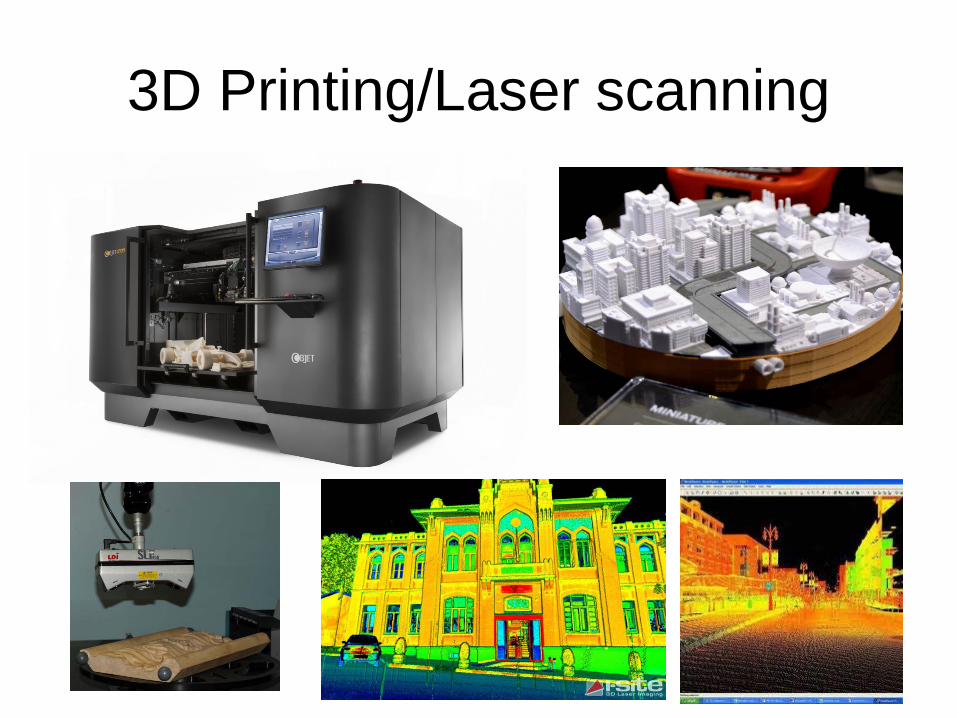
3D Printing/Laser scanning
Summary • Medieval origins of simple statistical graphics • Close link to astronomy • More rediscovery, e.g. Descartes • Most modern methods have origins from 17th-
19th century • Playfair an important pioneer • Berghaus pioneered rise of thematic Atlas • Rediscovery as visual analytics/geovisualization,
but far better tools!