GEOG 1011: Landscapes and Water, fall 2005 Adina Racoviteanu.
26
GEOG 1011: Landscapes and Water, fall 20 Adina Racoviteanu
-
date post
20-Dec-2015 -
Category
Documents
-
view
216 -
download
2
Transcript of GEOG 1011: Landscapes and Water, fall 2005 Adina Racoviteanu.
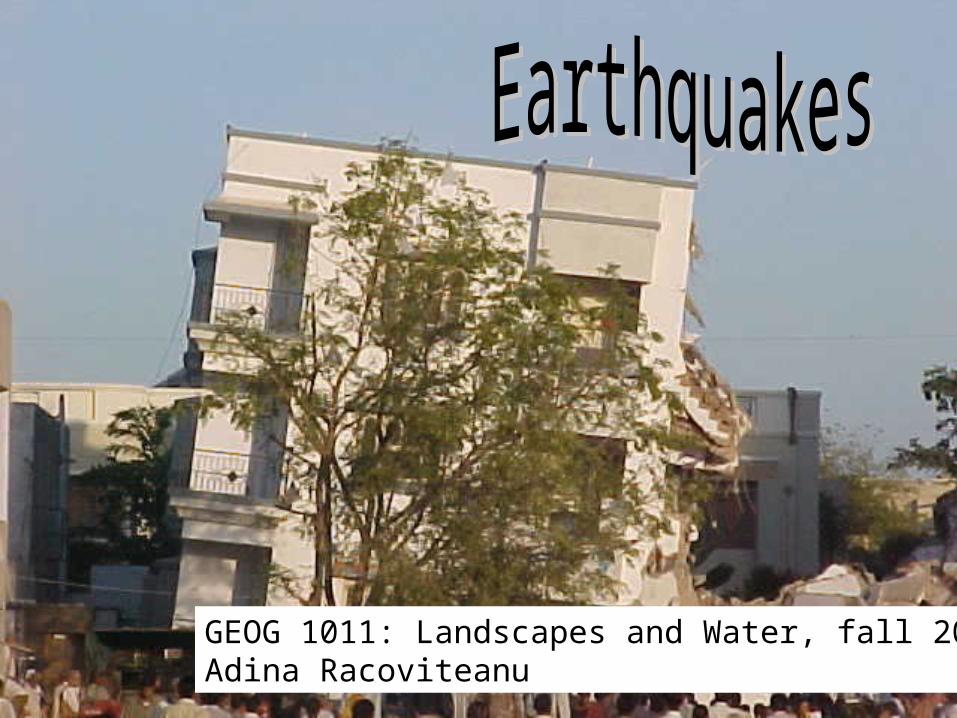
GEOG 1011: Landscapes and Water, fall 2005Adina Racoviteanu

Objectives
• Relate earthquake activity to plate tectonics • Define earthquake, and identify the focus and
epicenter of an earthquake. • Describe the types of waves emitted during an
earthquake. • Distinguish between earthquake intensity and
magnitude. • Review some current methods of earthquake
prediction.

Why do earthquakes occur?
• Fractures, faults
• Energy released
and propagates in all directions as seismic waves causing
earthquakes
focusepicenter

Where do earthquakes occur:
1) Most earthquakes occur along the edge of the oceanic and continental plate
2) Along faults: normal, reverse, transform

definitions
• Earthquake = Vibration of the Earth produced by the rapid release of energy
• Seismic waves = Energy moving outward from the focus of an earthquake
• Focus= location of initial slip on the fault; where the earthquake origins
• Epicenter= spot on Earth’s surface directly above the focus

Seismic waves: forms• P-waves:
– called compressional, or push-pull waves– Propagate parralel to the direction in which the wave is moving– Move through solids, liquids
• S-waves:– Called shear waves– Propagate the movement perpendicular to the direction in which the wave ismoving
• Surface waves (L-waves or long waves).– Complex motion– Up-and-down and side-to-side– Slowest– Most damage to structures, buildings

Seismic waves: properties
• Velocity: function of the physical properties of the rock the wave is traveling through– Velocity increases with rock density– Velocity changes when passing from one
material to another (increases/decreases)– Liquids: S-waves do not get transmitted through
liquid; P-waves slow down
• Why is this important?
–If we know the velocity of the wave, we can inferthe type of rock it traveled through- that’s how we map the interior of the Earth!!!

Measuring earthquakes
• Seismometers: instruments that detect seismic waves
• SeismographsRecord intensity, height and amplitude of seismic waves

Locating the shaking
• Measure time between P and S waves on a seismogram
• Need at least 3 seismographs

Earthquake size: two ways to measure
1) Magnitude: Richter Scale• Measures the energy released by fault
movement• related to the maximum amplitude of the S
wave measured from the seismogram• Logarithmic-scale; quantitative measure• For each whole number there is a 31.5 times
increase in energy• eg. an increase from 5 to 7 on the Richter scale =
an increase in energy of 992 times!!
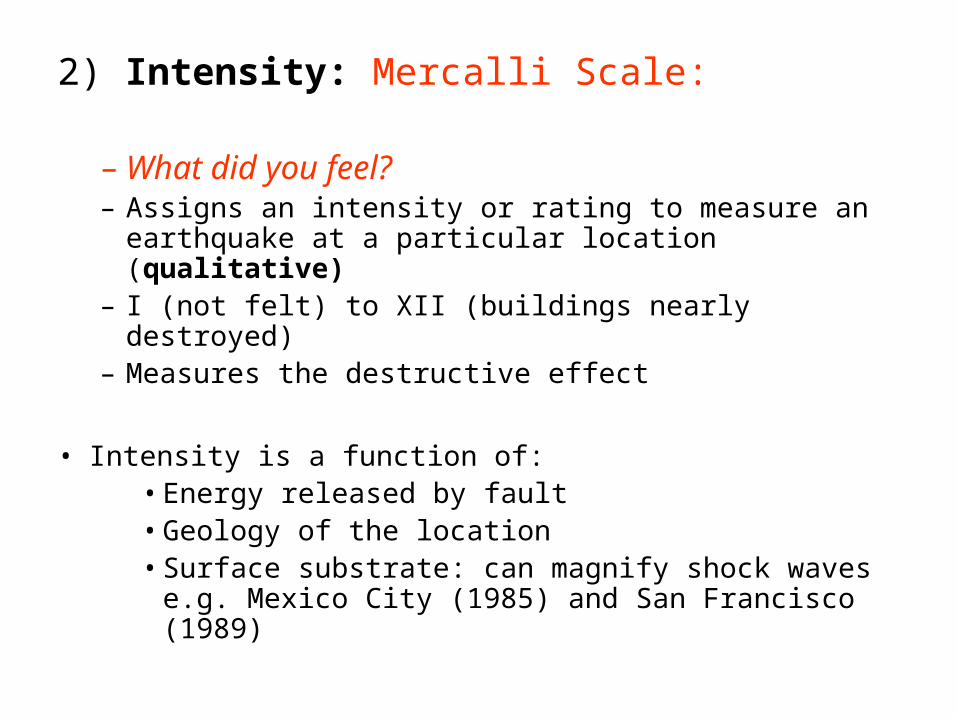
2) Intensity: Mercalli Scale:
– What did you feel?– Assigns an intensity or rating to measure an
earthquake at a particular location (qualitative)– I (not felt) to XII (buildings nearly destroyed)– Measures the destructive effect
• Intensity is a function of:• Energy released by fault• Geology of the location• Surface substrate: can magnify shock waves e.g.
Mexico City (1985) and San Francisco (1989)

Frequency of Occurrence of Earthquakes
Descriptor Magnitude Average Annually
Great 8 and higher 1 ¹
Major 7 - 7.9 17 ²
Strong 6 - 6.9 134 ²
Moderate 5 - 5.9 1319 ²
Light 4 - 4.9 13,000
(estimated)
Minor 3 - 3.9 130,000
(estimated)
Very Minor 2 - 2.9 1,300,000
(estimated)
¹ Based on observations since 1900. ² Based on observations since 1990.

Recent Earthquake Activity in the World

Largest earthquake in the world
Chile : 1960 May 22 19:11:14 UTC Magnitude 9.5
•More than 2,000 killed, 3,000 injured, 2,000,000 homeless, and $550 million damage in southern Chile• tsunami caused 61 deaths•$75 million damage in Hawaii;• 138 deaths and $50 million damage in Japan; •32 dead and missing in the Philippines; and $500,000 damage to the west coast of the United States.


Most Destructive Known Earthquakes on Record in the World
Date Location Deaths Magnitude Comments
May 31, 1970 Peru 66,000 7.9 $530,000,000damage, great rockslide, floods.
July 27, 1976 China, Tangshan
255,000(official)
7.5 Estimated death toll as high as 655,000.
Sept 19, 1985 MexicoMichoacan
9500(official)
8.0 Estimated death toll as high as 30,000Old lake bed magnified shock waves by 500%
2001 Jan 26 India 20,023 7.7 166,836 injured,
600,000 homeless
.
2004 Dec 26 Sumatra 283,106 9.0 Deaths from earthquake and tsunami
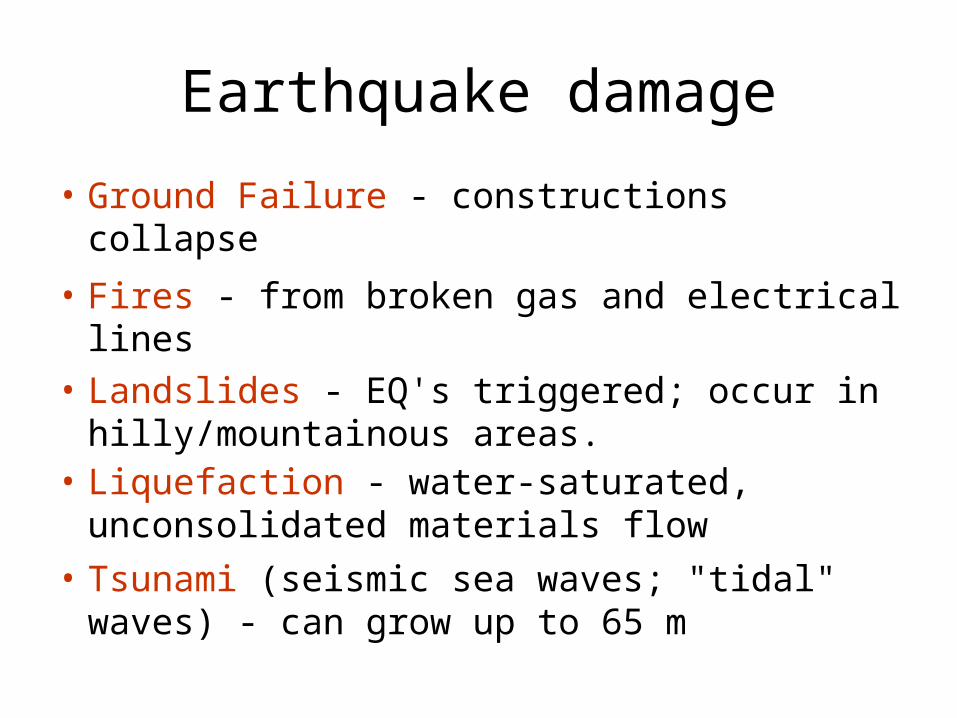
Earthquake damage
• Ground Failure - constructions collapse
• Fires - from broken gas and electrical lines
• Landslides - EQ's triggered; occur in hilly/mountainous areas.
• Liquefaction - water-saturated, unconsolidated materials flow
• Tsunami (seismic sea waves; "tidal" waves) - can grow up to 65 m
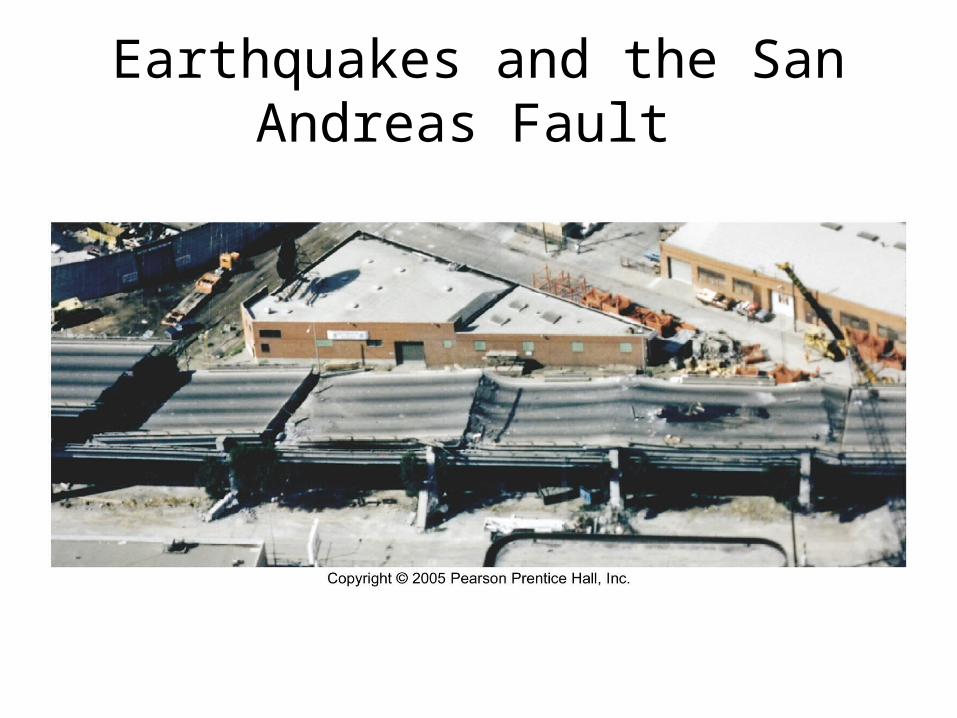
Earthquakes and the San Andreas Fault


Landslides: May 30, 1970 Peru disaster
Magnitude: 7.9
•A large mass of ice and rock slid from a vertical face on Nevado Huascaran, the highest peak in Peru
•Debris reached a velocity of 280 km/hr
•traveled 11 km horizontally in about 4 minutes at a mean velocity of 165 km/hr.
•Buried the towns of Yungay and Ranrahirca, The death toll in both villages was 20,000.

The town of Huaraz flattened

India, Gujarat earthquakeJan 26, 2001

Jun 23, 2001 S.Peru earthquake
Arequipa

Earthquake risk and prediction
• Long-term methods
1) seismic hazard maps
2) probability analysis based on: - historical EQ records - geologic EQ records - slip-rate on active faults - frequency and magnitude of recent EQ's
Real-time 24 Hour
Forecast
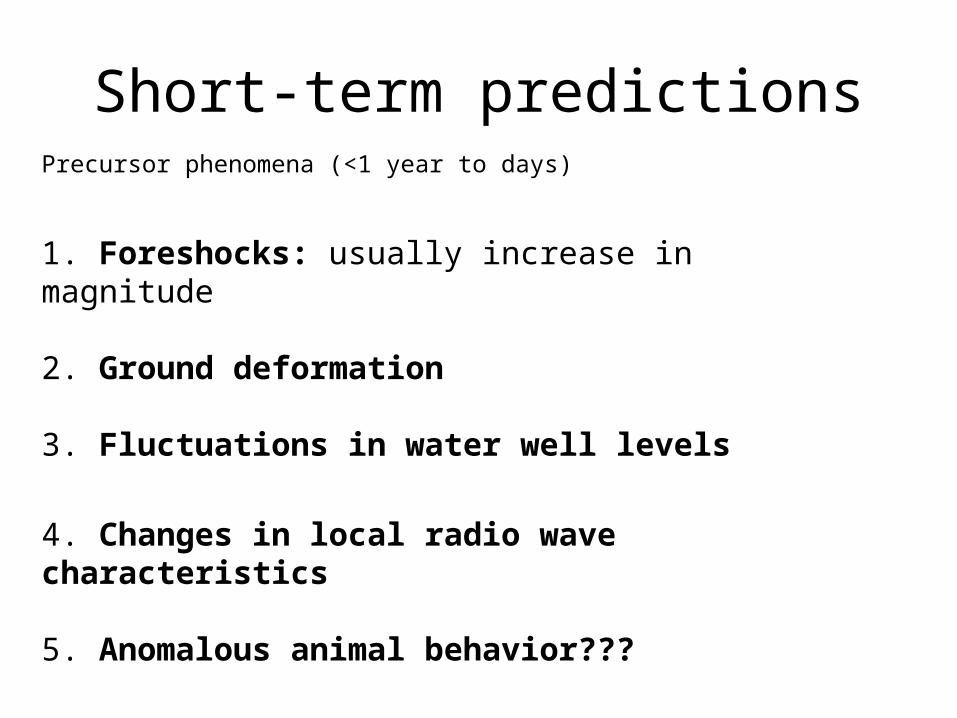
Short-term predictionsPrecursor phenomena (<1 year to days)
1. Foreshocks: usually increase in magnitude
2. Ground deformation
3. Fluctuations in water well levels
4. Changes in local radio wave characteristics
5. Anomalous animal behavior???

Impacts of Earthquake Prediction