Geoff Crowley , Chad Fish, Charles Swenson, Gary Bust...
28
Geoff Crowley , Chad Fish, Charles Swenson, Gary Bust, Aroh Barjatya, Miguel Larsen, and USU Student Team 1 NSF-Funded Dual-satellite Space Weather Mission Project Funded October 2009 (6 months ago)
Transcript of Geoff Crowley , Chad Fish, Charles Swenson, Gary Bust...

Geoff Crowley, Chad Fish, Charles Swenson, Gary Bust,
Aroh Barjatya, Miguel Larsen, and USU Student Team
1
NSF-Funded Dual-satellite Space Weather Mission
Project Funded October 2009 (6 months ago)

2

3
•11 Students & 5 professionals
•Review Panel (7 SDL Staff )

4
10+ Students and ~5 Professionals
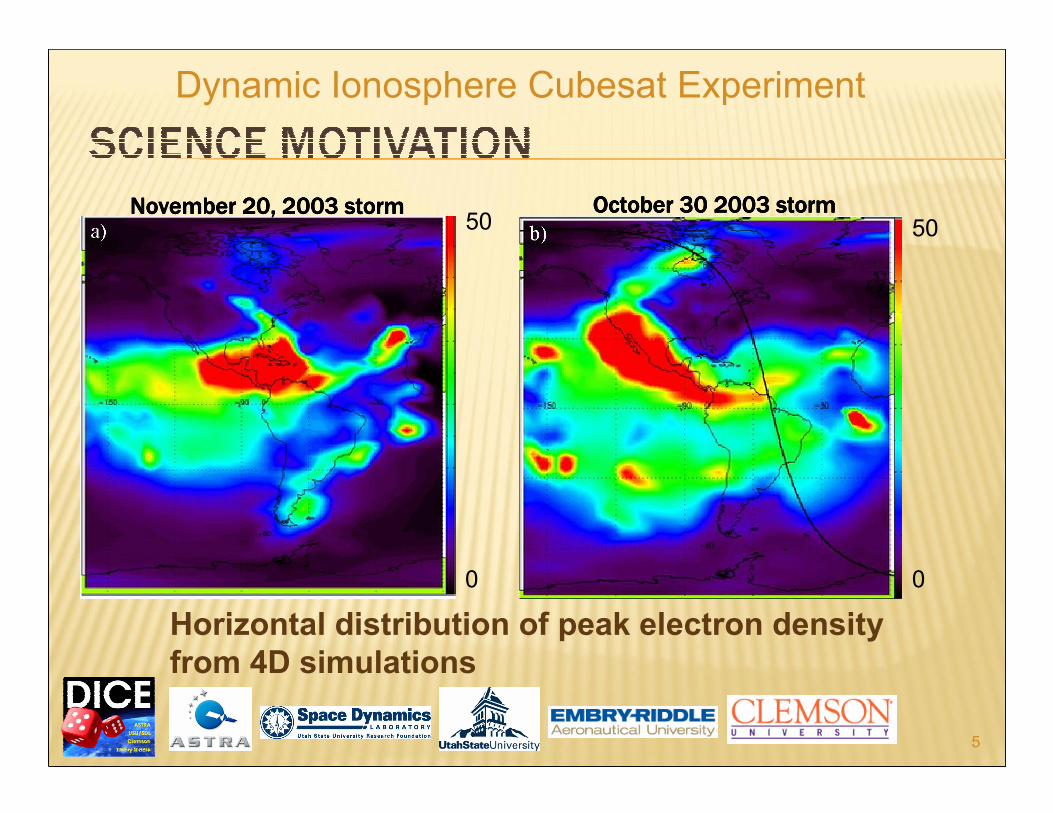
Dynamic Ionosphere Cubesat Experiment
5
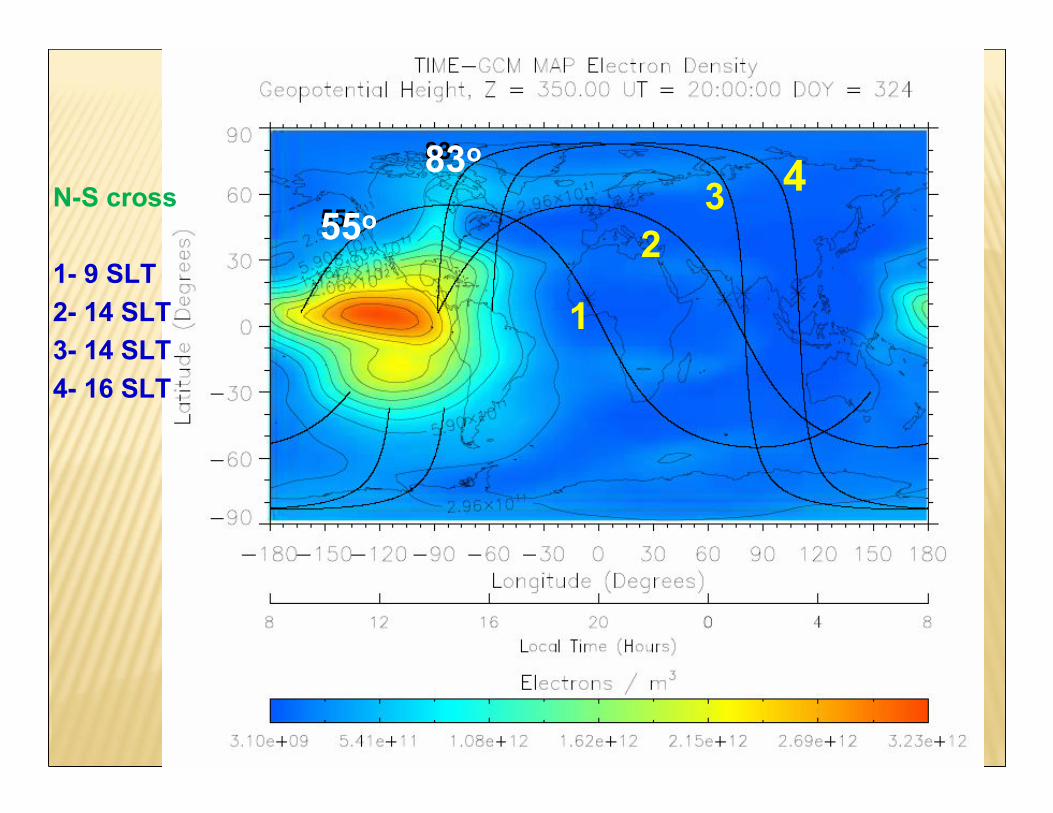
Horizontal distribution of peak electron density
from 4D simulations
November 20, 2003 storm November 20, 2003 storm November 20, 2003 storm November 20, 2003 storm October 30 2003 storm October 30 2003 storm October 30 2003 storm October 30 2003 storm 50
0 0
50

TEC Plume Mapped to Equatorial
Plane
John Foster
MIT Haystack Observatory
6
Foster et al, JGR 2004
Dynamic Ionosphere Cubesat Experiment

Courtesy Jerry Goldstein

1. Investigate the physical processes responsible for formation of the geomagnetic Storm Enhanced Density (SED) bulge in the noon to post-noon sector during magnetic storms.
2. Investigate the physical processes responsible for the formation of the SED plume at the base of the SED bulge and the transport of the high density SED plume across the magnetic pole.
3. Investigate the relationship between the penetration electric fields and the formation and evolution of SED:
8
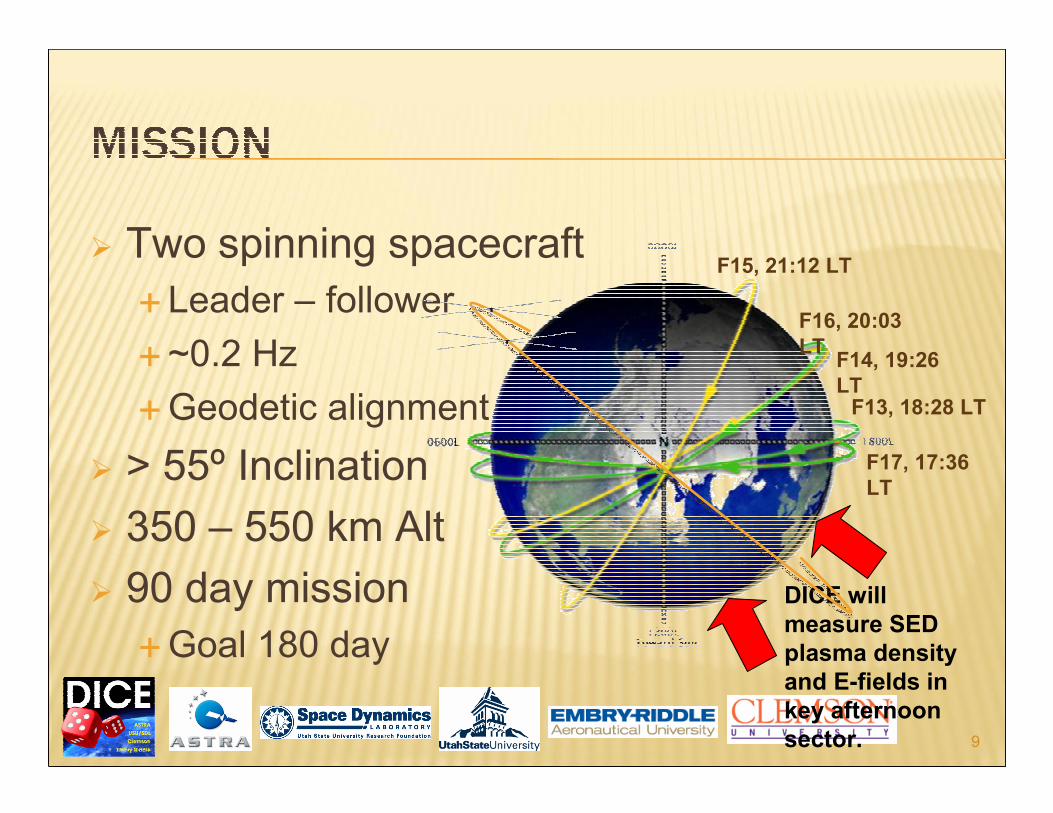
� Two spinning spacecraft
�Leader – follower
�~0.2 Hz
�Geodetic alignment
� > 55º Inclination
� 350 – 550 km Alt
� 90 day mission
�Goal 180 day
9
F17, 17:36
LT
F15, 21:12 LT
F16, 20:03
LTF14, 19:26
LTF13, 18:28 LT
DICE will
measure SED
plasma density
and E-fields in
key afternoon
sector.
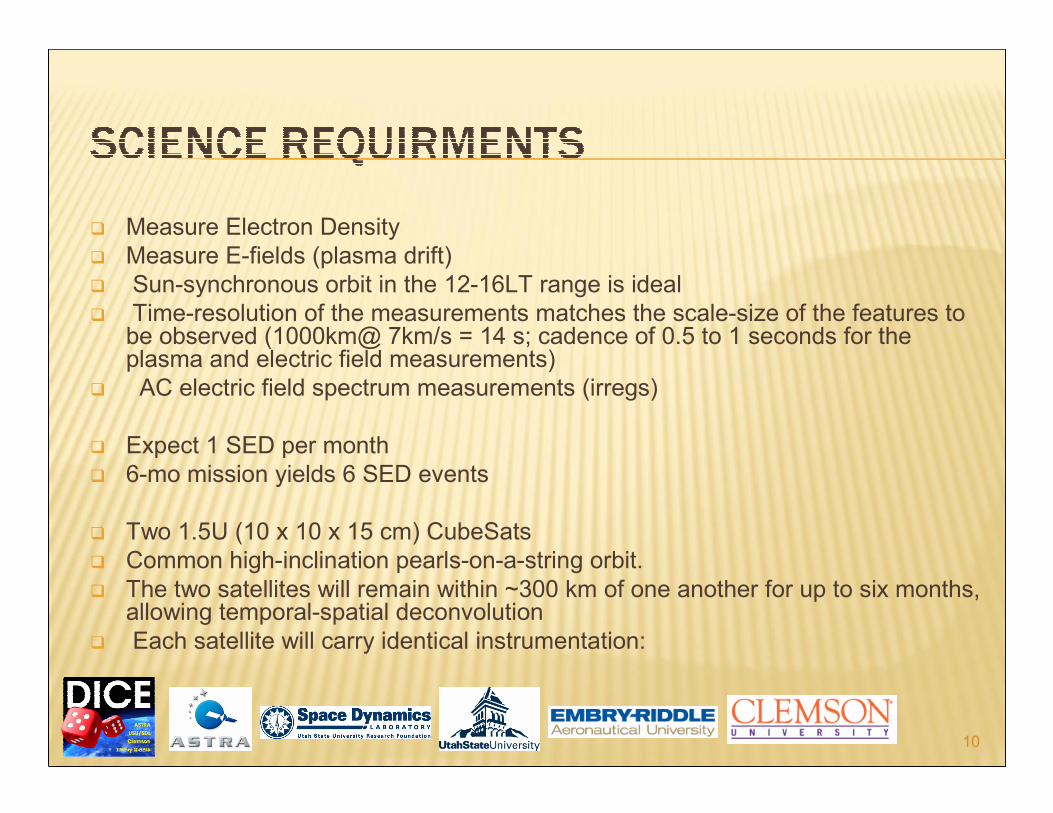
� Measure Electron Density
� Measure E-fields (plasma drift)
� Sun-synchronous orbit in the 12-16LT range is ideal
� Time-resolution of the measurements matches the scale-size of the features to be observed (1000km@ 7km/s = 14 s; cadence of 0.5 to 1 seconds for the plasma and electric field measurements)
� AC electric field spectrum measurements (irregs)
� Expect 1 SED per month
� 6-mo mission yields 6 SED events
� Two 1.5U (10 x 10 x 15 cm) CubeSats
� Common high-inclination pearls-on-a-string orbit.
� The two satellites will remain within ~300 km of one another for up to six months, allowing temporal-spatial deconvolution
� Each satellite will carry identical instrumentation:
10

� Electric Field ~0.2
mV/m
� Double Probe Technique
� 10 m wire booms
� ~80 Hz sample rate
� Plasma Density
~102cm-3
� Dual Langmuir Probes
� ~80 Hz sample rate
� Magnetic Field ~5 nT
� Dual Magnetometers
� ~80 Hz sample rate 11
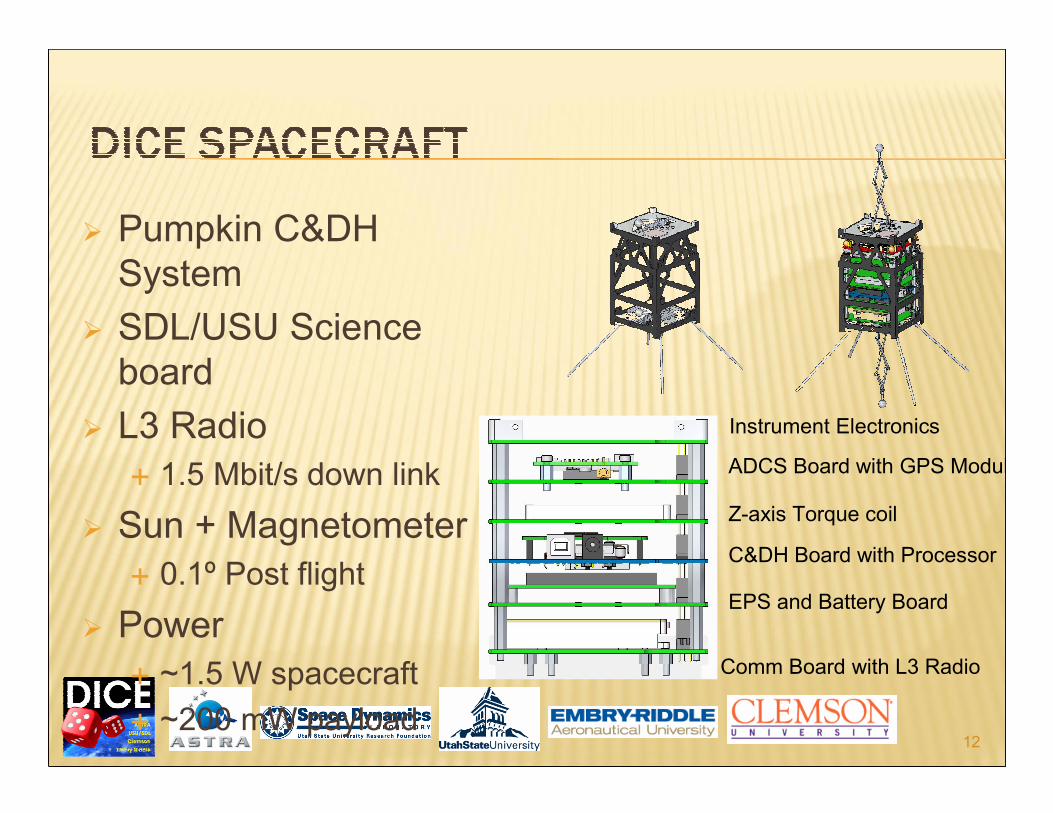
� Pumpkin C&DH
System
� SDL/USU Science
board
� L3 Radio
� 1.5 Mbit/s down link
� Sun + Magnetometer
� 0.1º Post flight
� Power
� ~1.5 W spacecraft
� ~200 mW payload12
Instrument Electronics
ADCS Board with GPS Module
C&DH Board with Processor
EPS and Battery Board
Comm Board with L3 Radio
Z-axis Torque coil

� EFP Booms - 5m
� 10 m tip to tip
� DCP + Mag- 8cm
� UHF Comms – 14cm� (460 – 470 MHz, 1.5 Mbit)
� TiNi Aerospace Micro
Frangibolt
13
14

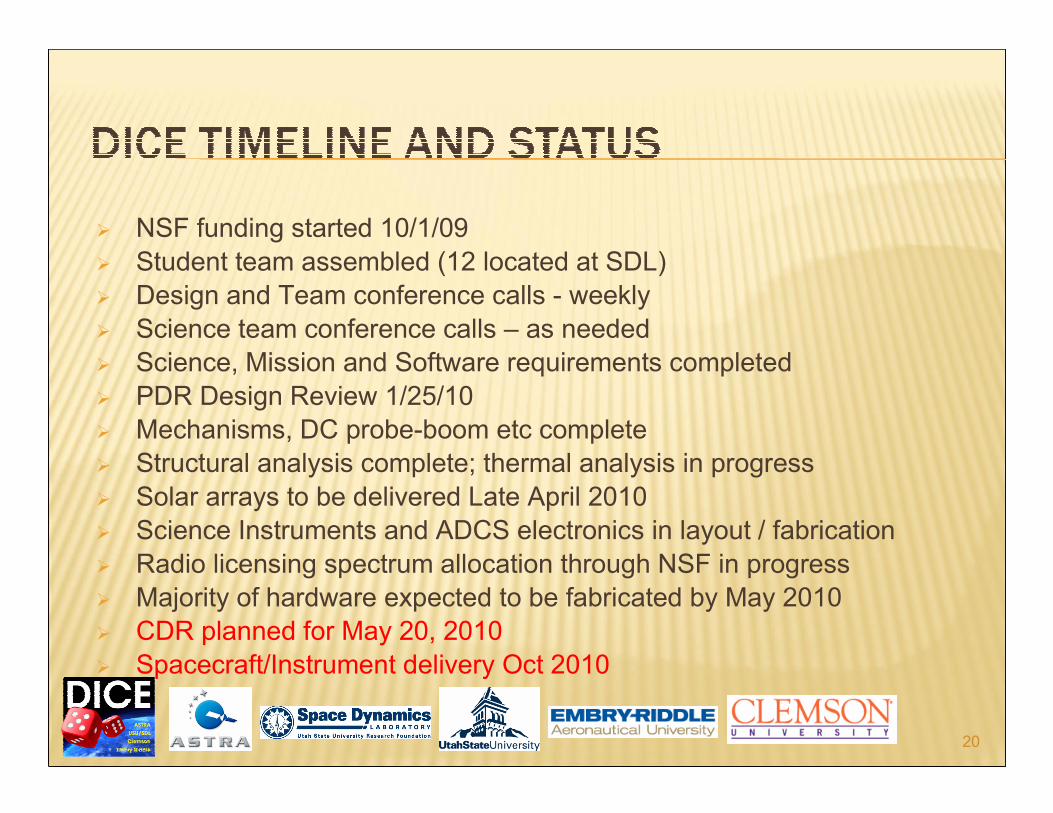
� NSF funding started 10/1/09
� Student team assembled (12 located at SDL)
� Design and Team conference calls - weekly
� Science team conference calls – as needed
� Science, Mission and Software requirements completed
� PDR Design Review 1/25/10
� Mechanisms, DC probe-boom etc complete
� Structural analysis complete; thermal analysis in progress
� Solar arrays to be delivered Late April 2010
� Science Instruments and ADCS electronics in layout / fabrication
� Radio licensing spectrum allocation through NSF in progress
� Majority of hardware expected to be fabricated by May 2010
� CDR planned for May 20, 2010
� Spacecraft/Instrument delivery Oct 2010
15
Observations of Gravity Waves in HIRDLS
Data
55o
83o
55o
83o
1
2
34
N-S cross
1- 9 SLT
2- 14 SLT
3- 14 SLT
4- 16 SLT
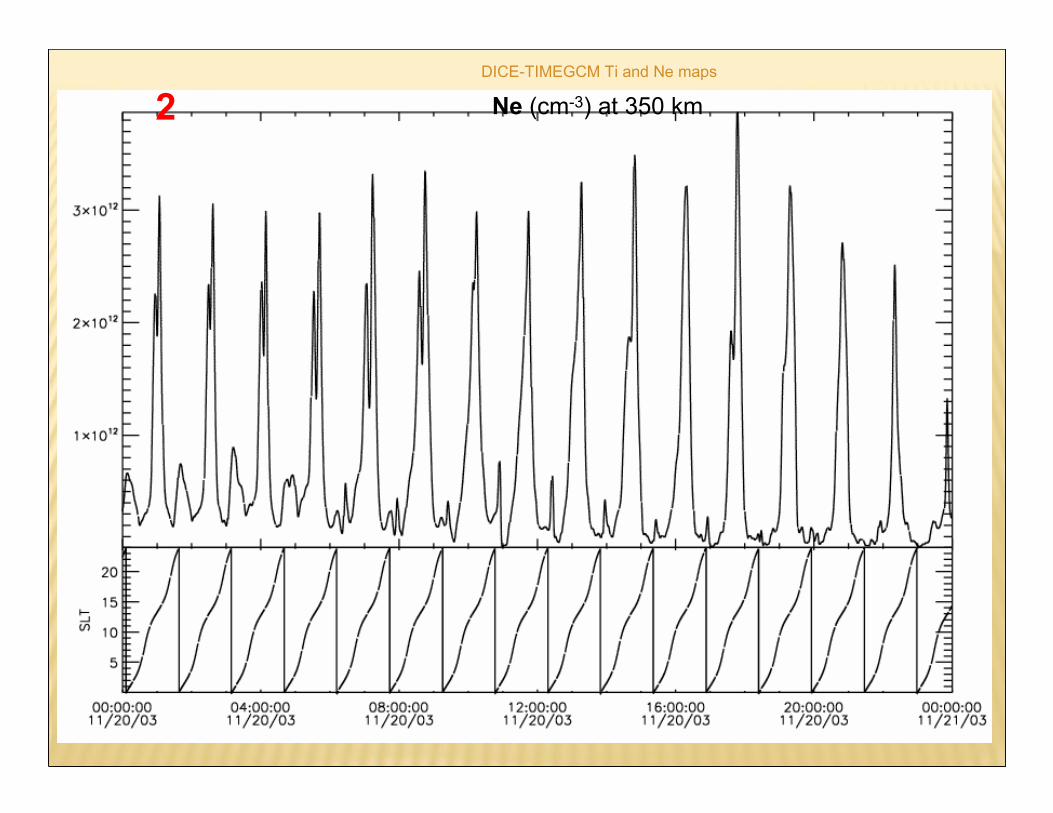
DICE-TIMEGCM Ti and Ne maps
Ne (cm-3) at 350 km2

Observations of Gravity Waves in HIRDLS
Data
N-S cross
1- 9 SLT
2- 14 SLT
3- 14 SLT
4- 16 SLT
55o
83o
1
2 3 4

19
� Device Drivers - Testing Complete
� Messaging - Testing Complete
� Timed Messaging - Testing Complete
� Telemetry Module - Individual Testing Complete
� Attitude Determination Software - Testing Complete
� Attitude Control Software – Testing in progress
� Mode Manager - Implementation Complete. Testing in progress
� Uplink Task - Implementation in progress
� Device Control Library - Implementation in progress
� Ground Station Software - Implementation in progress
� NSF funding started 10/1/09
� Student team assembled (12 located at SDL)
� Design and Team conference calls - weekly
� Science team conference calls – as needed
� Science, Mission and Software requirements completed
� PDR Design Review 1/25/10
� Mechanisms, DC probe-boom etc complete
� Structural analysis complete; thermal analysis in progress
� Solar arrays to be delivered Late April 2010
� Science Instruments and ADCS electronics in layout / fabrication
� Radio licensing spectrum allocation through NSF in progress
� Majority of hardware expected to be fabricated by May 2010
� CDR planned for May 20, 2010
� Spacecraft/Instrument delivery Oct 2010
20

Fall AGU 2009
21

Fall AGU 2009
22

� Dynamic Ionosphere Cubesat Experiment (DICE)G. Crowley1; C. S. Fish2; G. S. Bust1; C. Swenson2; A. Barjatya3; M. F. Larsen4
1. ASTRA, San Antonio, TX, United States. 2. Utah State University/Space Dynamics Laboratory (USU/SDL), Logan, UT, United States. 3. Embry-Riddle Aeronautical University, Daytona Beach, FL, United States. 4. Clemson University, Clemson, SC, United States.
� The Dynamic Ionosphere Cubesat Experiment (DICE) mission has been selected for flight under the NSF "CubeSat-based Science Mission for Space Weather and Atmospheric Research" program. The mission has three scientific objectives: (1) Investigate the physical processes responsible for formation of the midlatitude ionospheric Storm Enhanced Density (SED) bulge in the noon to post-noon sector during magnetic storms; (2) Investigate the physicalprocesses responsible for the formation of the SED plume at the base of the SED bulge and the transport of the high density SED plume across the magnetic pole; (3) Investigate the relationship between penetration electric fields and the formation and evolution of SED.
The mission consists of two identical Cubesats launched simultaneously. Each satellite carries a fixed-bias DC Langmuir Probe (DCP) to measure in-situ ionospheric plasma densities, and an Electric Field Probe (EFP) to measure DC and AC electric fields. These measurements will permit accurate identification of storm-time features such as the SED bulge and plume, together with simultaneous co-located electric field measurements which have previously been missing. The mission team combines expertise from ASTRA, Utah State University/Space Dynamics Laboratory (USU/SDL), Embry-Riddle Aeronautical University and Clemson University.
23

24

Table 1: Science to Mission Functionality Requirements Traceability Matrix
Science Objective 1: Investigate formation of the SED bulge over the USA
Measurement
Requirements
Instrument Requirements Mission Requirements
Measure RMS Fluctuations
in Electric Field and Plasma
Density: 1. Make co-located DC
electric field and plasma
density measurements at a ≤
10 km on-orbit resolution
2. Make < 10 meter (AC)
resolution electric field
measurements at a ≤ 10 km
on-orbit resolution
3. Make measurements on a
constellation platform of ≥ 2
spacecraft that are within 200
km of each other
Electric Field:
1. Max range of ± 0.6 V/m
2. Min threshold of 0.6 mV/m 3. Min resolution of 0.15 mV/m
4. DC sample rate ≥ 4 Hz
5. Telemeter DC data at ≥ 4 Hz
6. AC sample rate ≥ 4 kHz
7. Telemeter AC FFT power
information at ≥ 1 Hz (3 points)
Plasma (Ion) Density:
1. Range of 2x10⁹ - 2 x10
13 m
-3
2. Min resolution of 3 x10⁸ m-3
3. Sample rate ≥ 1 Hz
3. 4. Telemeter data at ≥ 1 Hz
1. Constellation size ≥ 2 satellites
2. Spacecraft spin ≥ 0.8 Hz
3. Spacecraft spin axis aligned to geodetic axis to within 10 º (1σ)
4. Spacecraft spin stabilized to within 1º (1σ)
about principal spin axis
5. Spacecraft knowledge to within 1º (1σ)
5. Constellation time synchronization ≤ 1 second
6. Orbital insertion inclination between 55 - 98 º
(ideally sun-synchronous at 14-16LT)
7. Orbital insertion altitude between 350 - 800
km
8. Circular orbits with eccentricity of ≤ 0.015
9. Spacecraft separation speed of ≤ 20 km/month
10. Storage/downlink ≥ 31 Mbits/day.
11. Lifetime ≥ 6 months
Science Objective 2: Investigate formation of the SED plume over the USA
Measurement Requirements Instrument Requirements Mission Requirements
Same as Science Objective 1 Same as Science Objective 1 Same as Science Objective 1
(downlink included in Objective 1)
Science Objective 3: Investigate correlation of PPE with formation and evolution of SED
Measurement Requirements Instrument Requirements Mission Requirements
Same as Science Objective 1 Same as Science Objective 1 Same as Science Objective 1
(downlink included in Objective 1)
1.1.1 Instrumentation Design


Channel Rate Word Size Bit RateName Hz bits bits/s #/Orbit spatial (km)
Electric Field V12 80 16 1280 444276 0.10
Electric Field V34 80 16 1280 444276 0.10Density DC Probe 1 80 16 1280 444276 0.10
Density DC Probe 2 80 16 1280 444276 0.10
Magnetometer X-Axis 80 18 1440 444276 0.10
Magnetometer Y-Axis 80 18 1440 444276 0.10Magnetometer Z-Axis 80 18 1440 444276 0.10
GPS Receiver 0.00072 4096 2.95 4 10646.86
Sun sensor elevation 1.00 16 16.00 5553 7.67
Sun phase sensor 1.00 48 48.00 5553 7.67
Power system (battery) 0.03 48 1.60 166604 230.06
Temp Monitor 1 0.03 8 0.27 166604 230.06
Temp Monitor 2 0.03 8 0.27 166604 230.06
Temp Monitor 3 0.03 8 0.27 166604 230.06
Temp Monitor 4 0.03 8 0.27 166604 230.06
Temp Monitor 5 0.03 8 0.27 166604 230.06
Spacecraft Clock 1.00 48 48.00 5553 7.67
Everything else 0.03 128 4.27 166604 230.06
Rate collected on orbit Total 9562.15 bits/s
Sample Period

Required Down Link
Design Element Symbol Value Units
Rate collected on orbit Rcollected 9562.15 bits/s
Downlink telemetry rate Rtransmitted 1.50E+06 bits/s
Packet overhead 7% Unitless
Available telemetry rate 1388672 Bits/s
Factor of Safety α 1.05 Unitless
Contact Time Percent τc 0.75% Unitless
Down link rate Rd 1338701 bits/s
Telemetry Margin 4% Unitless
Estimated Daily DownlinkAverage Daily Data Dump 103.41 M Bytes
Required Daily Data Dump 98.49 M Bytes
Average Contact Time per Day 648.00 s
Estimated contacts/day 2
Estimated usable contacts duration 324.00 s
Estimated usable contacts duration 5.40 min
Estimated Dump/Contact 51.71 M Bytes
Required Telemetry BufferDesign Element Symbol Value Units
Onboard Collection Rate Rc 9562.15 bits/s
Factor of Safety α 4
Max Time Between Contacts τc 58482 s
Required Telemetry Buffer 2.E+09 Bits
Required Telemetry Buffer 266.65 M Bytes
Required Telemetry Buffer 2133.23 M Bits
Required Transmitter PowerDesign Element Symbol Value Units
Transmitter RF Power 1 Watts
Transmitter Efficiency 25%
Transmitter Power 4.00 Watts
Orbit Average On time 41.65 S
Orbit Average Power 30.00 mW
Required Ground Station StorageDesign Element Symbol Value Units
Baseband Bandwidth 10 MHz
Digitization bits 8 bits
Baseband Sampling Rate 40 MHz
Baseband Sampled Data Rate 320 Mbits/s
Average Data in an Overpass 103680 Mbits/s
Storage Required Per Pass 12.66 G bytes