Geoengineering Spatial Mapping for Safe and Economic ...
28
ISSN:2372-0743 print International Journal of Ground Sediment & Water Vol. 11 ISSN:2373-2989 on line 2020 595 DOI: 10.5281/zenodo.4275598 Geoengineering Spatial Mapping for Safe and Economic Design of Building and Earthwork Structures in Northern Part of Ondo State, Nigeria Olumuyiwa Olusola Falowo 1* , Williams Kola Olabisi 1 1 Department of Civil Engineering Technology, Rufus Giwa Polytechnic, Owo, Nigeria * Corresponding author Email: [email protected] Abstract: The objectives of the study are to assess the engineering competence of the subsoil and develop a subsoil competence map for northern parts of Ondo State, Nigeria, using integrated remote sensing, geotechnical, geophysical and geological investigations, and hydrogeological measurements. The generated subsoil competence map was obtained by integrating the results data of these parameters measured: topsoil resistivity and thickness, plasticity index, shear strength, allowable bearing pressure, soil association, lineament density, and groundwater level. Based on the design, the obtained settlement values were within the 25 mm commonly recommended. Consequently, the map classified the study area into moderate competence (60%), high competence (35%), and very high competence (5%). The corrosivity map of the topsoil shows predominant moderate to mildly corrosivity, prominently in Ose and Akoko areas and constitutes about 70 %. This type of corrosivity is suitable for buried communication equipment and electrodes. In conclusion, shallow foundations such as pad or raft foundation of reinforced concrete can be adopted for buildings. Also, the soil geotechnical properties will support adequately road structures and various earthworks. However, areas characterized by moderate competence material can be improved by less expensive mechanical compaction and proper use of admixtures (lime, cement, bituminous addition, sand/gravel grading) to increase bearing capacity, compaction, and shear strength, which will invariably reduce compressibility, settlement, and permeability. ◆Research Paper
Transcript of Geoengineering Spatial Mapping for Safe and Economic ...

ISSN:2372-0743 print International Journal of Ground Sediment & Water
Vol. 11 ISSN:2373-2989 on line 2020
595
DOI: 10.5281/zenodo.4275598
Geoengineering Spatial Mapping for Safe and Economic Design of Building and Earthwork
Structures in Northern Part of Ondo State, Nigeria
Olumuyiwa Olusola Falowo1*, Williams Kola Olabisi1
1Department of Civil Engineering Technology, Rufus Giwa Polytechnic, Owo, Nigeria
* Corresponding author Email: [email protected]
Abstract: The objectives of the study are to assess the engineering competence of the subsoil
and develop a subsoil competence map for northern parts of Ondo State, Nigeria, using
integrated remote sensing, geotechnical, geophysical and geological investigations, and
hydrogeological measurements. The generated subsoil competence map was obtained by
integrating the results data of these parameters measured: topsoil resistivity and thickness,
plasticity index, shear strength, allowable bearing pressure, soil association, lineament
density, and groundwater level. Based on the design, the obtained settlement values were
within the 25 mm commonly recommended. Consequently, the map classified the study area
into moderate competence (60%), high competence (35%), and very high competence (5%).
The corrosivity map of the topsoil shows predominant moderate to mildly corrosivity,
prominently in Ose and Akoko areas and constitutes about 70 %. This type of corrosivity is
suitable for buried communication equipment and electrodes. In conclusion, shallow
foundations such as pad or raft foundation of reinforced concrete can be adopted for
buildings. Also, the soil geotechnical properties will support adequately road structures and
various earthworks. However, areas characterized by moderate competence material can be
improved by less expensive mechanical compaction and proper use of admixtures (lime,
cement, bituminous addition, sand/gravel grading) to increase bearing capacity, compaction,
and shear strength, which will invariably reduce compressibility, settlement, and
permeability.
◆Research Paper
◆

ISSN:2372-0743 print International Journal of Ground Sediment & Water
Vol. 11 ISSN:2373-2989 on line 2020
596
Keywords: Soil competence, foundation, groundwater level, bearing capacity, remote
sensing
Introduction
Engineering structures are designed and constructed with long life expectancy, however,
the increasing rate of structural collapse such as buildings, roads, drainages, bridges (Dimuna,
2010; Fagbenle and Oluwunmi, 2010), in Nigeria is becoming worrisome (Faseki et al., 2016;
Adebowale et al., 2016; Chendo and Obi, 2015; Amadi et al., 2012). In recent years, reports of
the collapse of these structures had been attributed to inadequate bearing pressure, poor
building materials, foundation failures, inadequate knowledge of the physical parameters
governing the competency of the soil supporting engineering structures, lack of supervision,
etc. Although several structures have collapsed, even though efficiently built with standard
materials, well supervised and managed, and the design plan was adequately followed and
properly executed, yet still failed. Therefore, it boils down to this question, “Was there any
pre-foundation site investigation?” before the construction of such structures. Therefore,
failures of structures do not happen suddenly, but rather systematically at the design, and
construction phases. Also, many engineers usually assume the bearing capacity of many sites
based on experience rather than by empirical deduction. Consequently, the importance of
engineering site investigation cannot be over-emphasized in the construction industry, as the
information it furnishes would in a long run assist in the safe and economic design of civil
engineering structures (Olayanju et al., 2017. The primary purpose of all site investigations
is to obtain the data needed for analysis and design (Oyedele et al., 2011; Ayolabi et al., 2012).
A Physical property governing the stability of structures includes but is not limited to
these: unit weights, porosity, consolidation, specific gravity, consistency limits of the soil in
association in water, bearing capacity, shear strength, compaction characteristics (Murthy,
1984; Meyerhof, 1951). Also, these properties depend on the nature of soil or rock in terms
of mineralogical contents, texture, and geologic structures (Oyedele et al., 2011; Bayode et al.,
2012; Faseki et al., 2016). Therefore, for engineering site investigation to be effective, it must
employ an integrated method or multidisciplinary approach. It should involve
geomorphological, geological, groundwater studies, remote sensing, geophysical

ISSN:2372-0743 print International Journal of Ground Sediment & Water
Vol. 11 ISSN:2373-2989 on line 2020
597
investigation, geotechnical investigation/analysis, and borehole logging. Therefore many
researchers have failed in this area by not using combined methods or integrated approach,
especially where geophysical methods are used; many failed to constrain the interpretation
of their geophysical results with borehole logging. Also, many couldn’t map or take
cognizance of the groundwater table and flow direction. All these information gaps in the
previous works were considered in this study by integrating all these methods to evaluate
and characterized the northern part of Ondo State into different engineering subsoil
competence zones, for construction purposes and building development. The findings of the
study would aid the structural engineer and builders in the design of appropriate structures
and earthwork that command professional feat.
Geophysical, geochemical, and geotechnical methods are widely used in engineering
foundation assessment/subsoil exploration. Geotechnical investigation of the soil is discrete,
invasive, and expensive; while the geophysical investigation is continuous, non-invasive, and
cost-effective (Oyedele et al., 2014; Robert, 2010). The geophysical method is capable of
investigating, detecting, and determining soil geotechnical properties, inhomogeneity of the
subsurface, etc. Some of the commonly employed geophysical methods in engineering site
investigation are the electrical method (vertical electrical sounding, very low frequency
electromagnetic) seismic, magnetic, gravity, borehole logging. The advantages of geophysical
methods are speed, cost-effectiveness. Cone penetration test and standard penetration test
are the two most commonly used in-situ geotechnical methods (Ngah and Nwankwoala, 2013;
Nwankwoala and Amadi, 2013; Oghenero et al., 2014; Youdeowei and Nwankwoala, 2013).
They are the very rugged, accurate, and fast (but costly) method of characterizing the soil in
terms of strength, layering, and deformation characteristics. Also, laboratory soil analysis is
usually combined with a field test to determine geotechnical soil properties such as
classification, chemical, and mechanical properties (Vickers, 1978; Tomlinson, 1999; Falowo
and Ajiboye, 2020; Falowo, 2020; Oke and Amadi, 2008). Therefore, this study is aimed at
establishing a subsoil engineering competence map for the northern part of Ondo State,
Nigeria for the safe and economic design of buildings, roads, drainages, etc.

ISSN:2372-0743 print International Journal of Ground Sediment & Water
Vol. 11 ISSN:2373-2989 on line 2020
598
Material and Methods
Study Area
The study area is located within the northern part of Ondo State, Nigeria (Fig. 1). The
selected areas include Owo, Akoko, and Use. These areas are located within longitudes 5°20 E
and 6°10 E and latitudes 6°30 N and 7°40 N. The area is accessible through the Benin - Ifon
highway, Abuja - Lokoja Highway, and Ado-Akure Highway. The study area has a
topographical elevation varying from 80 – 750 m above the sea level. The northern part of
the study area is a rugged terrain (i.e. hilly) especially in the Akoko area (Marans and Rodgers,
1975) (Fig. 2). The lowlands are widespread at the Ute and Okeluse axes of the area with a
gentle slope, while the gradient of the northern areas is generally steep. Another aspect of
the relief of the area is the prevalence of many erosion gullies along hill slopes (Fig. 3). The
gullies are very common and rather devastating in Owo, Ifon, Ikare, Oke Agbe, and Isua.
The mean annual temperature is between 21°C and 33°C (Fig. 4) with a mean
temperature of 24°C and a mean humidity of 80%. The mean temperature is highest at the
end of the Harmattan (averaging 28°C), which is from the middle of January to the onset of
the rains in the middle of March. The area is situated within the tropical rain forest region,
with a climate characterized by dry and wet seasons. According to the Federal Meteorological
Survey (Federal Meteorological Survey, 1982), the annual rainfall ranges between 1000 and
1800 mm, with a mean annual rainfall of 1500 mm (Fig. 4c). The vegetation is the rainforest
type and is composed of teak, Melina/pulpwood (Fig. 1), tall crowned trees mixed with thick
undergrowth, and woody savannah. The vegetation is of distinct arrangement with tall trees
of about 60 m in height, with smaller herbaceous plants found below them.
The geology of the study area is of Precambrian Basement rocks of Southwestern Nigeria
and includes the Migmatized gneissic complex (MGC) of Achaean to early Proterozoic age
(Dada, 1999) N-S trending Schist Belts of Upper Proterozoic age (Rahman, 1988) and the
Older Granitoid of Pan African age. The major rocks in the area comprise migmatite, granite
gneiss, fine-grained quartzite, pegmatite and quartzo-feldspathic veins, schist, and quartz
schist. These rock types dominate Owo and Akoko areas, notably along Owo – Oba Akoko,
Iwaro – Akungba, Akungba – Supare, Ikare, Epinmi, Sosan, Oke Agbe, and Ido Ani.
ISSN:2372-0743 print International Journal of Ground Sediment & Water
Vol. 11 ISSN:2373-2989 on line 2020
599
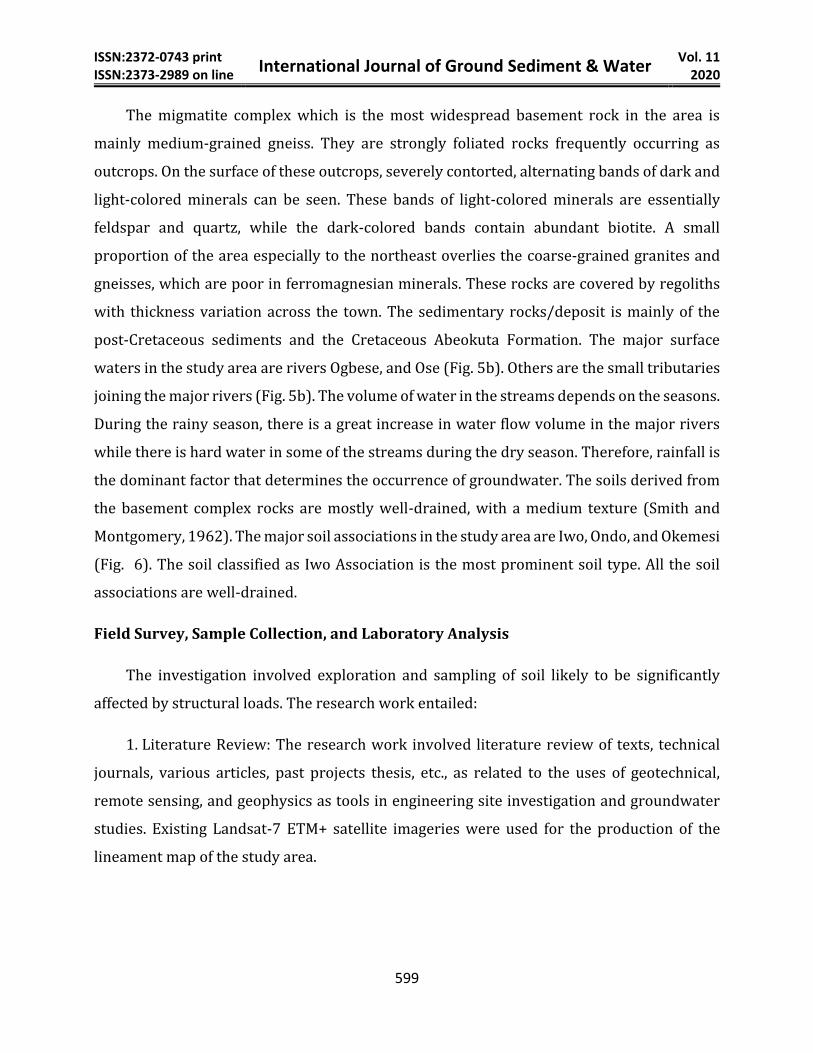
The migmatite complex which is the most widespread basement rock in the area is
mainly medium-grained gneiss. They are strongly foliated rocks frequently occurring as
outcrops. On the surface of these outcrops, severely contorted, alternating bands of dark and
light-colored minerals can be seen. These bands of light-colored minerals are essentially
feldspar and quartz, while the dark-colored bands contain abundant biotite. A small
proportion of the area especially to the northeast overlies the coarse-grained granites and
gneisses, which are poor in ferromagnesian minerals. These rocks are covered by regoliths
with thickness variation across the town. The sedimentary rocks/deposit is mainly of the
post-Cretaceous sediments and the Cretaceous Abeokuta Formation. The major surface
waters in the study area are rivers Ogbese, and Ose (Fig. 5b). Others are the small tributaries
joining the major rivers (Fig. 5b). The volume of water in the streams depends on the seasons.
During the rainy season, there is a great increase in water flow volume in the major rivers
while there is hard water in some of the streams during the dry season. Therefore, rainfall is
the dominant factor that determines the occurrence of groundwater. The soils derived from
the basement complex rocks are mostly well-drained, with a medium texture (Smith and
Montgomery, 1962). The major soil associations in the study area are Iwo, Ondo, and Okemesi
(Fig. 6). The soil classified as Iwo Association is the most prominent soil type. All the soil
associations are well-drained.
Field Survey, Sample Collection, and Laboratory Analysis
The investigation involved exploration and sampling of soil likely to be significantly
affected by structural loads. The research work entailed:
1. Literature Review: The research work involved literature review of texts, technical
journals, various articles, past projects thesis, etc., as related to the uses of geotechnical,
remote sensing, and geophysics as tools in engineering site investigation and groundwater
studies. Existing Landsat-7 ETM+ satellite imageries were used for the production of the
lineament map of the study area.

ISSN:2372-0743 print International Journal of Ground Sediment & Water
Vol. 11 ISSN:2373-2989 on line 2020
600
Fig. 1 Land Use Map of the Study Area showing predominant Teak/Gmelina Plantation and
Disturbed Forest. Inset: Location of Ondo State on Nigeria Map (Adapted from Daramola et
al., 2009)
Fig. 2 Topographical Elevation of the study area (a) Hill Shaded obtained from ASTER DEM
data (b) Triangular irregular Network
2000
2100
2200
1900
1800
1700
OkitipupaIrele
Ore
Ode Aye
Ilu Titun
Ile OlujiAlade
Ondo
Ifon
Oba Ile
Igbara Oke
Akure
Ilara
Iju
Ita Ogbolu
Adejubu
Uso
Owo
Supare
Ikare Akoko
1500
Undisturbed forest
Teak/Gmelina Plantation
Rock Outcrop
Reservoir
Natural Waterbodies
Forest Plantation
Urban Centres
RoadsRiversAnnual RainfallTree Crop PlantationDisturbed Forest
Dominant Trees/Wood
Mangrove Forest
30 30 km0
6 00
6 30
7 00
7 30
4 30 5 00 5 30 6 00
I
I
I
I
I I I I
ONDO
EDO
DELTA
EKITI
OSUN
OYO
OGUN
LAGOS
Emure Ile
Study Area
MAIDUGURI
ENUGU
MAKURDI
ILORIN
SOKOTO
KANO
LAGOS
IBADAN
ABUJA
N
AKURE
1600
Oke Agbe
Ogbagi
Isua
Okeluse
Ido Ani
(b)(a)

ISSN:2372-0743 print International Journal of Ground Sediment & Water
Vol. 11 ISSN:2373-2989 on line 2020
601
Fig. 3 Slope Map of the Study area with northern areas showing very steep gradient, while
Owo and Ose are a predominantly gentle slope
Fig. 4 (a) Annual minimum temperature across Nigeria showing a range of 20 - 23 °C in the
study area (b) Annual maximum temperature ranging from 31 – 33 °C (c) Annual mean
precipitation across Nigeria with a range of 1000 – 1800mm in the study area.
(a)
(b)(a)
(c)

ISSN:2372-0743 print International Journal of Ground Sediment & Water
Vol. 11 ISSN:2373-2989 on line 2020
602
Fig. 5 Local Geology Map of the Study Area with the Basement rocks occupying 90% of the
area, while the sedimentary rocks/deposits occupy a little portion of the southern area (b)
Drainage Map of the Study area showing a predominantly Dendritic Drainage Patterns.
Fig. 6 Soil Map of the Study Area (Extracted from Smith and Montgomery, 1962)
(a) (b)
IYERE
IPELE
OWO
ISUA
EMUREODARIGBO
EPORO
AGOPANU R. IPORO
OGBAGI
IRUN
SUKU
OSOURO
OYIN
OKE-AGBE
AUGA
ISHEIKAREAGBALUKU
IDOFINAKUNGBA
ETIORO
OBAIKUN
IWARO
OKA-ILE
OSE AREA
OWO AREA
AKOKO AREA
OMUO
ISINBODE
ODE
AGBADO
5 30O I 5 55
O I7 00
O I
5 30O I
5 30O I
5 30O I
5 45O I
LEGEND
OKEMESI
SOIL ASSOCIATION
ONDO
Roads
River
Streams
IWO
0 5 km
SCALE
Town/Villages

ISSN:2372-0743 print International Journal of Ground Sediment & Water
Vol. 11 ISSN:2373-2989 on line 2020
603
2. Reconnaissance Studies and Desk Study: The purpose of the site reconnaissance is to
confirm and obtain additional information from the site. This includes taking notes of the
geologic and topographic setting of the area, taking photographs of the site. A personal
interview was made with residents of the area with the relevant information which will assist
in carrying out the research successfully. Also, sample points locations for geotechnical
investigation were marked and pegged respectively. The desk study included
reviewing/updating and reconciling the information obtained during the reconnaissance
study and those obtained during the review of journals and various articles. Subsequently,
the following information was reviewed:
(a) Geological Maps/Report: The geological map/report together with an
understanding mode of origin of the rocks and the associated depositional process enabled a
preliminary assessment of ground condition.
(b) Topographical Map: The topographical map was used to examine the terrain,
access, and site condition. The topographic map was confirmed through site reconnaissance.
(c) Site Histories and Details of Adjacent Development: Also important
information such as land use before the current development and underground services (like
buried pipes and utilities) were acquired before the planning and conduct of the field test.
3. Geophysical Investigation: The geophysical investigation involving electrical
resistivity (Vertical Electrical Sounding (VES) and Dipole-Dipole profiling); Very Low-
Frequency Electromagnetic (VLF-EM) were carried out along thirty-six traverses (Fig. 7). The
geographic coordinates of data stations were taken using GARMIN’S GPS 12 - Channel model.
One hundred and three (103) sounding stations were occupied with current electrode
spacing varied from 1 to 225m.
4. Geotechnical Investigation: Twenty-four soil samples were taken according to the
geology/rock units in the area (at a depth less than 3m) from borough pits (Fig. 7). These
samples were subjected to grain size analysis, specific gravity determination; natural
moisture content test, consistency limit test, compaction test, cone penetrometer test,
undrained triaxial test, shear strength, and bearing capacity were determined.
5. Hydro-geological Measurement: This includes the determination of the hydraulic
head of wells/borehole and measurement of static water levels from three hundred and two
(302) water wells using a water level meter recorder (Fig. 7).
The geophysical data were interpreted qualitatively and quantitatively, as related to the
objectives of the study. Profiles, maps, geoelectric section, graphs, chart were produced from
the interpretation of both geophysical, geotechnical, and hydrogeological data.

ISSN:2372-0743 print International Journal of Ground Sediment & Water
Vol. 11 ISSN:2373-2989 on line 2020
604
Fig. 7 Data Acquisition Map of Study Area showing the Vertical Electrical Sounding Stations,
Borehole Points, and Geotechnical Sampling Points
ISSN:2372-0743 print International Journal of Ground Sediment & Water
Vol. 11 ISSN:2373-2989 on line 2020
605
Results and Discussion
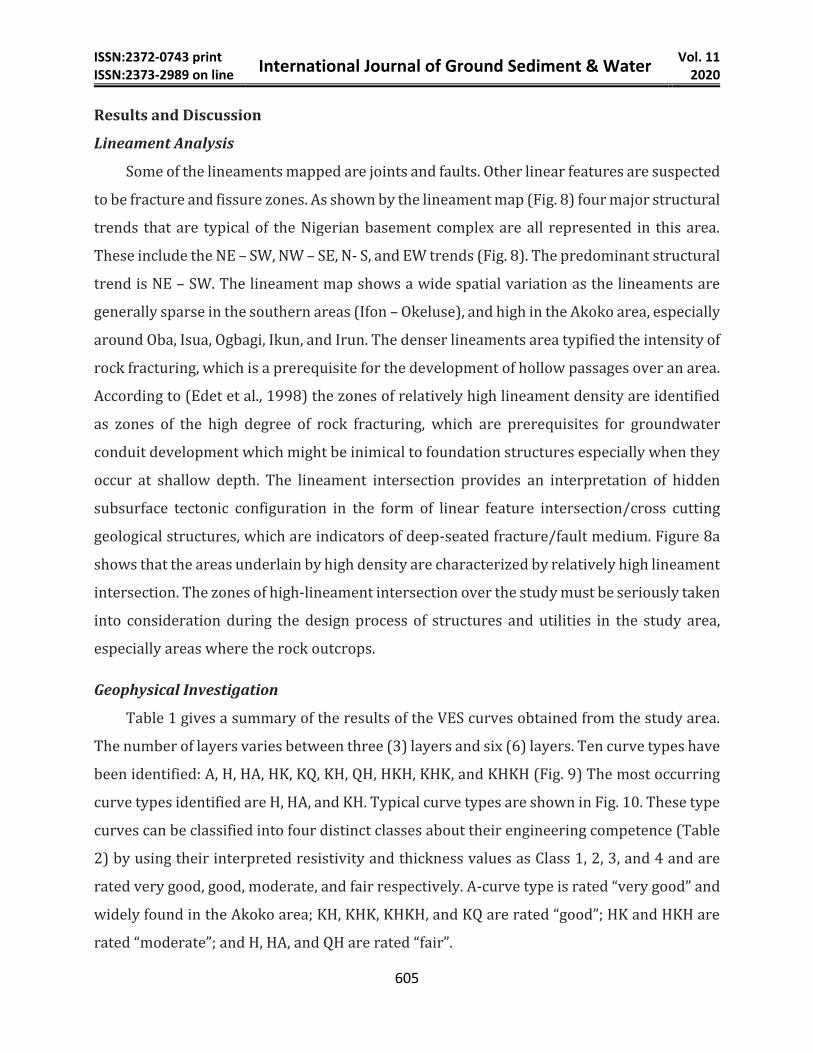
Lineament Analysis
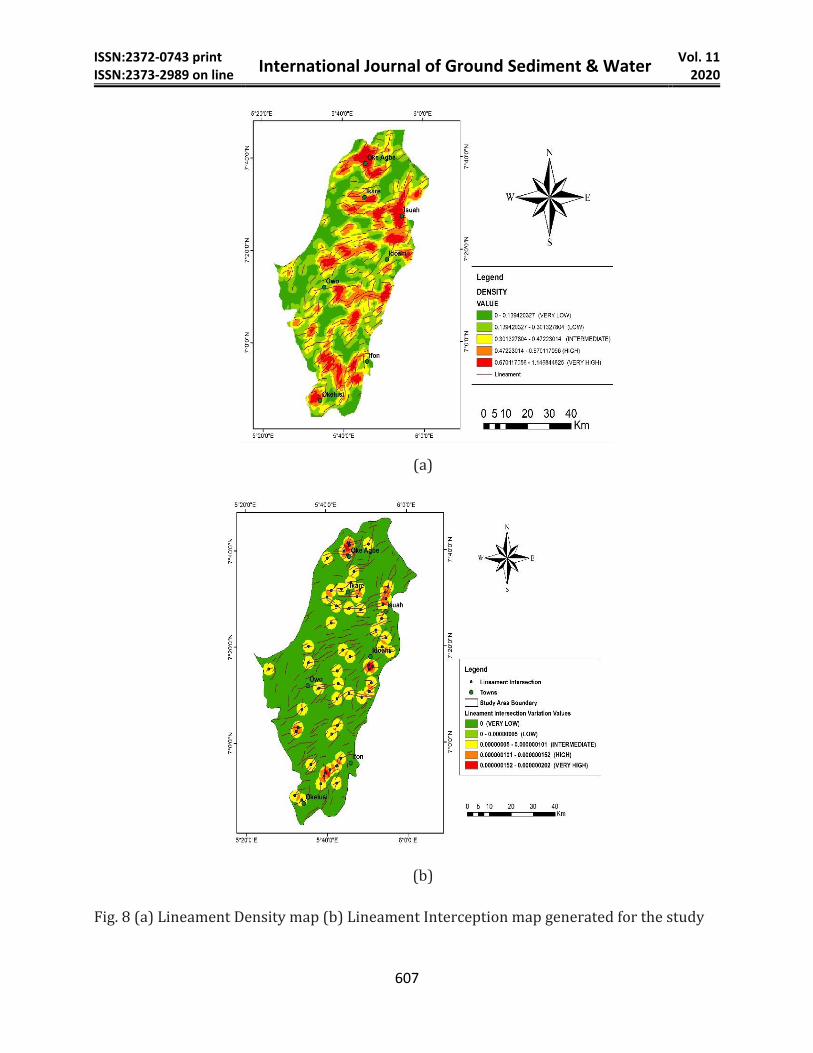
Some of the lineaments mapped are joints and faults. Other linear features are suspected
to be fracture and fissure zones. As shown by the lineament map (Fig. 8) four major structural
trends that are typical of the Nigerian basement complex are all represented in this area.
These include the NE – SW, NW – SE, N- S, and EW trends (Fig. 8). The predominant structural
trend is NE – SW. The lineament map shows a wide spatial variation as the lineaments are
generally sparse in the southern areas (Ifon – Okeluse), and high in the Akoko area, especially
around Oba, Isua, Ogbagi, Ikun, and Irun. The denser lineaments area typified the intensity of
rock fracturing, which is a prerequisite for the development of hollow passages over an area.
According to (Edet et al., 1998) the zones of relatively high lineament density are identified
as zones of the high degree of rock fracturing, which are prerequisites for groundwater
conduit development which might be inimical to foundation structures especially when they
occur at shallow depth. The lineament intersection provides an interpretation of hidden
subsurface tectonic configuration in the form of linear feature intersection/cross cutting
geological structures, which are indicators of deep-seated fracture/fault medium. Figure 8a
shows that the areas underlain by high density are characterized by relatively high lineament
intersection. The zones of high-lineament intersection over the study must be seriously taken
into consideration during the design process of structures and utilities in the study area,
especially areas where the rock outcrops.
Geophysical Investigation
Table 1 gives a summary of the results of the VES curves obtained from the study area.
The number of layers varies between three (3) layers and six (6) layers. Ten curve types have
been identified: A, H, HA, HK, KQ, KH, QH, HKH, KHK, and KHKH (Fig. 9) The most occurring
curve types identified are H, HA, and KH. Typical curve types are shown in Fig. 10. These type
curves can be classified into four distinct classes about their engineering competence (Table
2) by using their interpreted resistivity and thickness values as Class 1, 2, 3, and 4 and are
rated very good, good, moderate, and fair respectively. A-curve type is rated “very good” and
widely found in the Akoko area; KH, KHK, KHKH, and KQ are rated “good”; HK and HKH are
rated “moderate”; and H, HA, and QH are rated “fair”.

ISSN:2372-0743 print International Journal of Ground Sediment & Water
Vol. 11 ISSN:2373-2989 on line 2020
606
Geoelectrical Maps
The topsoil competence and corrosivity map of the uppermost 5 m and depth to
basement rock over the study area are presented in Figures 11-13 respectively. The topsoil
constitutes the layer within which a normal engineering foundation is founded especially in
the basement complex (Olorunfemi, 2008), and can be qualitatively evaluated from layer
resistivity and the geotechnical parameter. Figure 11 shows a predominant moderate
competence in Okeluse, Elegbeka, Amurin, Owo, Ipele, Ido Ani, Imeri, and about constitutes
about 60 % of the Akoko area. The moderate competent soil accounts for 70 % of topsoil with
a resistivity between 100 Ω-m and 350 Ω-m. Areas that show incompetency include Ikun, Oba,
and Aiyegunle and account for 15 % with a resistivity less than 100 Ω-m. High competent
areas are observed in Isijogun, Arigidi, Ehinogbe, Agbaluku, and Ajowan. These areas are
underlain by quartzite, granite, granite gneiss and gneiss, and account for about 15 %.
Therefore, civil engineering foundation structure can be carried out in the study area without
any failure expectation (on the basis of resistivity values obtained), while Ikun, Aiyegunle,
and Oba can be graded or stabilized with more competent soil like laterite, sand, or gravel to
increase their density, compaction, and bearing capacity.
The corrosivity map of the topsoil shows predominant moderate to mildly corrosivity
and very prominently in Ose and Akoko areas, and constitute about 70 %. The essentially
non-corrosive areas which account for 10 % are observed in Ajowa, Agbaluku, Ehinogbe, and
Isijogun. However, the corrosivity of the subsoil in the study area shows that Akoko area is
essentially non-corrosive except few places like Oba, Ikun, Ipesi, some parts of Irun. Our area
and Ose are moderately/mildly corrosive. Figure 13 shows the overburden thickness/depth
to basement rock across the study area. It shows that Akoko area (except Oke Agbe, Agbaluku,
and part of Ikare) are generally characterized by thin overburden thickness less than 10 m
and signifies shallow depth to basement rock and low depth of weathering; while Owo and
Ose have thick overburden thickness ranging from 10 m to 50 m.
ISSN:2372-0743 print International Journal of Ground Sediment & Water
Vol. 11 ISSN:2373-2989 on line 2020
607
(a)
(b)
Fig. 8 (a) Lineament Density map (b) Lineament Interception map generated for the study

ISSN:2372-0743 print International Journal of Ground Sediment & Water
Vol. 11 ISSN:2373-2989 on line 2020
608
Table 1 Curve Types and their Statistical Frequency obtained from the Study Area
Location/Curve
Type
HKH H HA HK KHKH KQ KH A KHK QH Total No.
of VES
Curves
Owo Area 2 15 2 4 3 1 6 2 - - 35
Akoko Area - 25 9 - - - 1 8 - - 43
Ose Area 3 5 5 - - 1 8 - 1 2 25
Frequency
(unit)
5 45 16 4 3 2 15 10 1 2 -
Frequency (%) 4.8 43.6 15.5 3.8 2.9 1.9 14.5 9.7 0.9 1.9 -
Fig. 9 Curve Types obtained in the Study Area with a predominant H-Curve
Fig. 10 Typical Curve Types obtained in the Study Area
0
10
20
30
40
50
HKH H HA HK KHKH KQ KH A KHK QH
Fre
qu
ency
(%
)
Curve Type
(a) HKH
(b) H
(a) KHKH
(c) HKH
ISSN:2372-0743 print International Journal of Ground Sediment & Water
Vol. 11 ISSN:2373-2989 on line 2020
609
The corrosivity map of the topsoil shows predominant moderate to mildly corrosivity
and very prominently in Ose and Akoko areas, and constitute about 70 %. The essentially
non-corrosive areas which account for 10 % are observed in Ajowa, Agbaluku, Ehinogbe, and
Isijogun. However, the corrosivity of the subsoil in the study area shows that the Akoko area
is essentially non-corrosive except few places like Oba, Ikun, Ipesi, some parts of Irun. Our
area and Ose are moderately/mildly corrosive. Figure 13 shows the overburden
thickness/depth to basement rock across the study area. It shows that Akoko area (except
Oke Agbe, Agbaluku, and part of Ikare) are generally characterized by thin overburden
thickness less than 10 m and signifies shallow depth to basement rock and low depth of
weathering; while Owo and Ose have thick overburden thickness ranging from 10 m to 50 m.
Hydrogeological Measurement
A good set of reliable groundwater level measurements is the best foundation on which
to build an understanding of a groundwater system. Groundwater conditions play an
important part in the stability of foundations. If the water table lies very close to the base of
footings, the bearing capacity and settlement characteristics of the soil would be affected. The
water level in the well represents the water table or phreatic surface. Static water level refers
to the level of water in a well or borehole under normal, undisturbed, no- pumping conditions.
The hydraulic head obtained in the area was used to determine the groundwater flow
direction as presented in Figure 14. The static water level measured in Owo varies from 1.2
m to 14.7 m with an average of 6.5 m. In the Akoko area, it ranges between 0.8 m and 15.2
with an average of 1.8 m; while in the Ose area, it is between 3.1 – 15.9 m and an average of
10 m. The hydraulic head recorded in Ose and Owo ranges between 40 m (Okeluse) – 390 m
(Ido Ani) and 240 to 390 m respectively. Akoko area varies between 290 and 540 m (Irun,
Arigidi, Oke Agbe). The general groundwater flow direction is south. Consequently, the SWL
in the northern areas is very high indicating a likelihood of high-water levels during the rainy
season (which could even lead to spring condition), which may affect basement/foundation
footings, and subsequently compromise the integrity of such structures.

ISSN:2372-0743 print International Journal of Ground Sediment & Water
Vol. 11 ISSN:2373-2989 on line 2020
610
Fig. 11 Map showing Topsoil Competence with prominent moderate competence
Fig. 12 Map showing Topsoil Corrosivity, with pronounced mildly/Essentially noncorrosive

ISSN:2372-0743 print International Journal of Ground Sediment & Water
Vol. 11 ISSN:2373-2989 on line 2020
611
Fig. 13 Map of Depth to Basement of the Study area
Fig. 14 An overlay of Contoured Static Water Level and 1-Grid Vector Layer obtained in the
Study Area with presumably North-South Flow direction.

ISSN:2372-0743 print International Journal of Ground Sediment & Water
Vol. 11 ISSN:2373-2989 on line 2020
612
Geotechnical Investigation
The summary of the geotechnical results is presented in Tables 3-5. The various values
of Natural Moisture Content (NMC) obtained from laboratory tests are presented in Table 3.
The natural moisture content gives information on the condition of the soil. The natural
moisture content of soils varied from 4.3 % to 17.4 %, with an average of 10.4 %. The samples
have low moisture content in their natural state. The tested soils show % fines (percentage
passing 0.002 mm) variation of 14.5 – 54.6 %, with an average of 33.3 %. The % of sand and
gravel in the sampled soils vary from 42.2 % to 76 % and 1.1 % to 5.5 % respectively.
Therefore the soils are dominated by sand and clay (clayey sand) except in One area where
the soils are dominantly clay (with classification group of sand-clay).
Based on British Standard BS 1377 (1990) if the percentage fine is less than 35 % it is
adjudged a good foundation material. Therefore, the soil samples can be generally classified
as suitable foundation material since the mean % of fines are less than 35%. However,
samples taken from the Ose area need some level of stabilization due to the high % of fines
(clay) with high plasticity (Nwankwoala and Warmate, 2014; Falowo and Otuaga, 2020). The
specific gravity correlates well with the mechanical strength of subgrade and depends on the
amount of sand and also on mineral constituents and mode of formation of the soil. The
specific gravity (Gs) for all the soil samples and vary between 2.64 - 2.76 with an average of
2.70, these values portray resistant soil material (Brink et al., 1992).
The liquid limit, plastic limit, and plasticity index of the soil samples vary from 22.2 % to
54.2 %, 11.0 % to 26.6 %, and 2.95 % to 29.05 %, with average values of 39.8 %, 23.2 %, and
16.2% respectively. Good foundation materials must among other significant criteria be of
low plasticity such that its resistance to swelling, total expansion, and linear shrinkage should
be minimal. The high plasticity index and liquid limit values are indicative of poor
engineering properties. The Federal Ministry of Works and Housing (1972) recommended
liquid limits of 50 % maximum, plastic limits of 30 % maximum, plasticity index of 20 %
maximum for civil engineering foundation/construction material. The liquid limit of the soils
is generally less than 50 %, while the plastic limits are generally lower than 30 % and the
plasticity index is generally lower than 20 % except for samples AK 5 and 6 which are greater
ISSN:2372-0743 print International Journal of Ground Sediment & Water
Vol. 11 ISSN:2373-2989 on line 2020
613
than 20 %. Hence, most of the studied soils fall within the specification. Linear shrinkage is
an important parameter in the evaluation of material soils for foundation construction. It has
been suggested that a linear shrinkage (LS) value below 8 % is indicative of a soil that is good
for foundation material (Brink et al., 1992; Madedor, 1983). The lower the linear shrinkage,
the lesser the tendency of the soil to shrink when desiccated. The values range between 7.4 %
and 13.4 % with an average value of 9.8 %, these soils can be classified as medium good
material.
The importance of the compaction test is to improve the desirable load-bearing capacity
properties of soil as a foundation material. The best for foundation engineering structures is
one with high MDD at low OMC. The OMC varies from 10.4 % and 27.5 % with an average of
17.1 %. The MDD ranges from 1532 - 2065 Kg/m³, with a mean value of 1820 Kg/m³. The
degree of compaction is sensitive to moisture content, thus the higher the value of MDD and
the lower OMC, the more suitable the material to sustain any load imposed. All the soil
samples have MDD at moderately low OMC. However, MDD values are a little bit lower in the
Ose area with a range of 1532 – 1749 Kg/m³. Cohesion is the ability of the soil to resist
shearing stress. The cohesion of the studied soils varies between 51.5 kPa – 102 kPa and an
average of 88.3 kPa. The values of the angle of friction are between 20.4° and 32.5°. This range
of value is classified as hard soil material (Holtz and Kovacs, 1981). The shear strength varies
from 151.7 kPa to 237.4 kPa and an average of 187 kPa (Table 4). These values indicate
moderately cohesive material with high shear strength.
The cone penetrometer test was carried out in order to obtain geotechnical parameters
required for the design of the foundation support for civil engineering structures. From Table
5, the maximum cone resistance values of 100 Kg/cm² to 126 Kg/cm² indicative of clayey
sand and lateritic material were obtained between depths of 1.4 m and 3.0 m. Six major
geological layers are delineated comprising clay, clay silt, silty clay, sandy clay, clay sand, and
lateritic clay. Therefore, the soils show a high degree of competence at Owo at a depth range
of 1.0 – 2.5 m, 1.0 m in the Akoko area, and 3.0 m in the Ose area. The allowable bearing
capacity of the soils in Owo, Ose and Akoko areas varies from 17 KN/m² to 293 KN/m², 20
KN/m² to 309 KN/m², and 10 KN/m² to 270 KN/m² respectively.
ISSN:2372-0743 print International Journal of Ground Sediment & Water
Vol. 11 ISSN:2373-2989 on line 2020
614
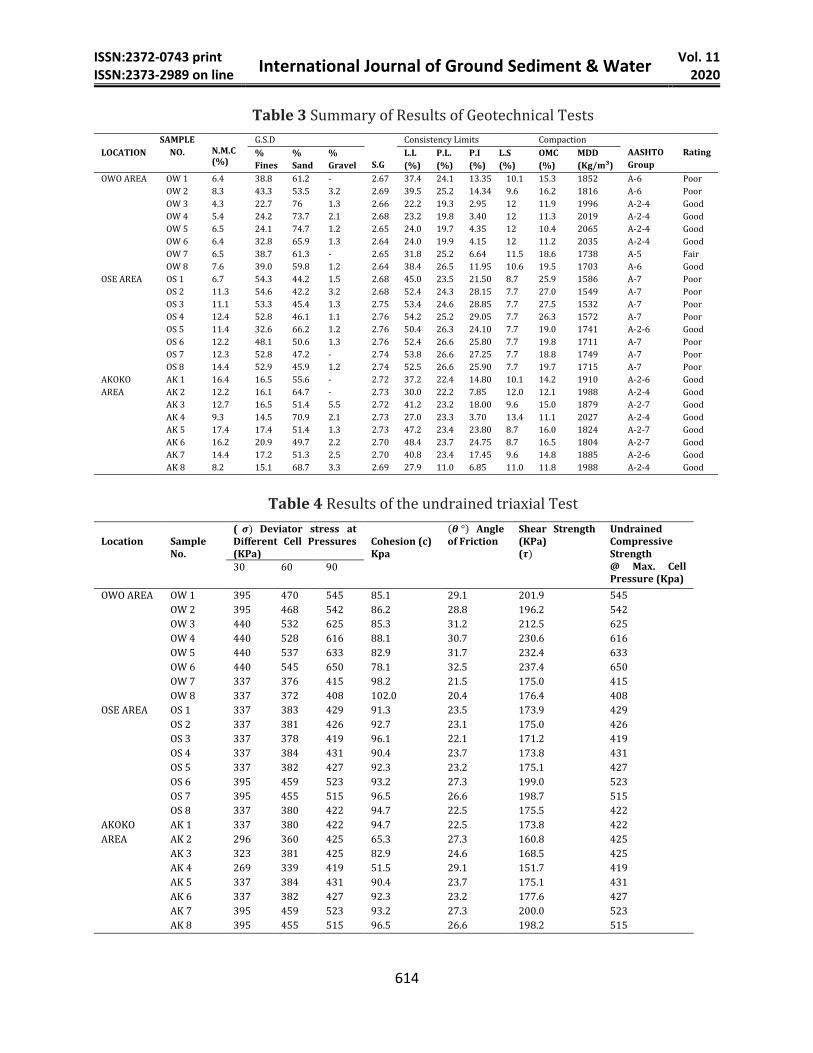
Table 3 Summary of Results of Geotechnical Tests
LOCATION
SAMPLE
NO.
N.M.C (%)
G.S.D
S.G
Consistency Limits Compaction
AASHTO
Group
Rating %
Fines
%
Sand
%
Gravel
L.L
(%)
P.L.
(%)
P.I
(%)
L.S
(%)
OMC
(%)
MDD
(Kg/m³)
OWO AREA OW 1 6.4 38.8 61.2 - 2.67 37.4 24.1 13.35 10.1 15.3 1852 A-6 Poor
OW 2 8.3 43.3 53.5 3.2 2.69 39.5 25.2 14.34 9.6 16.2 1816 A-6 Poor
OW 3 4.3 22.7 76 1.3 2.66 22.2 19.3 2.95 12 11.9 1996 A-2-4 Good
OW 4 5.4 24.2 73.7 2.1 2.68 23.2 19.8 3.40 12 11.3 2019 A-2-4 Good
OW 5 6.5 24.1 74.7 1.2 2.65 24.0 19.7 4.35 12 10.4 2065 A-2-4 Good
OW 6 6.4 32.8 65.9 1.3 2.64 24.0 19.9 4.15 12 11.2 2035 A-2-4 Good
OW 7 6.5 38.7 61.3 - 2.65 31.8 25.2 6.64 11.5 18.6 1738 A-5 Fair
OW 8 7.6 39.0 59.8 1.2 2.64 38.4 26.5 11.95 10.6 19.5 1703 A-6 Good
OSE AREA OS 1 6.7 54.3 44.2 1.5 2.68 45.0 23.5 21.50 8.7 25.9 1586 A-7 Poor
OS 2 11.3 54.6 42.2 3.2 2.68 52.4 24.3 28.15 7.7 27.0 1549 A-7 Poor
OS 3 11.1 53.3 45.4 1.3 2.75 53.4 24.6 28.85 7.7 27.5 1532 A-7 Poor
OS 4 12.4 52.8 46.1 1.1 2.76 54.2 25.2 29.05 7.7 26.3 1572 A-7 Poor
OS 5 11.4 32.6 66.2 1.2 2.76 50.4 26.3 24.10 7.7 19.0 1741 A-2-6 Good
OS 6 12.2 48.1 50.6 1.3 2.76 52.4 26.6 25.80 7.7 19.8 1711 A-7 Poor
OS 7 12.3 52.8 47.2 - 2.74 53.8 26.6 27.25 7.7 18.8 1749 A-7 Poor
OS 8 14.4 52.9 45.9 1.2 2.74 52.5 26.6 25.90 7.7 19.7 1715 A-7 Poor
AKOKO
AREA
AK 1 16.4 16.5 55.6 - 2.72 37.2 22.4 14.80 10.1 14.2 1910 A-2-6 Good
AK 2 12.2 16.1 64.7 - 2.73 30.0 22.2 7.85 12.0 12.1 1988 A-2-4 Good
AK 3 12.7 16.5 51.4 5.5 2.72 41.2 23.2 18.00 9.6 15.0 1879 A-2-7 Good
AK 4 9.3 14.5 70.9 2.1 2.73 27.0 23.3 3.70 13.4 11.1 2027 A-2-4 Good
AK 5 17.4 17.4 51.4 1.3 2.73 47.2 23.4 23.80 8.7 16.0 1824 A-2-7 Good
AK 6 16.2 20.9 49.7 2.2 2.70 48.4 23.7 24.75 8.7 16.5 1804 A-2-7 Good
AK 7 14.4 17.2 51.3 2.5 2.70 40.8 23.4 17.45 9.6 14.8 1885 A-2-6 Good
AK 8 8.2 15.1 68.7 3.3 2.69 27.9 11.0 6.85 11.0 11.8 1988 A-2-4 Good
Table 4 Results of the undrained triaxial Test
Location
Sample No.
( 𝝈) Deviator stress at Different Cell Pressures (KPa)
Cohesion (c) Kpa
(𝜽 °) Angle of Friction
Shear Strength (KPa) (𝝉)
Undrained Compressive Strength @ Max. Cell Pressure (Kpa)
30 60 90
OWO AREA OW 1 395 470 545 85.1 29.1 201.9 545
OW 2 395 468 542 86.2 28.8 196.2 542
OW 3 440 532 625 85.3 31.2 212.5 625
OW 4 440 528 616 88.1 30.7 230.6 616
OW 5 440 537 633 82.9 31.7 232.4 633
OW 6 440 545 650 78.1 32.5 237.4 650
OW 7 337 376 415 98.2 21.5 175.0 415
OW 8 337 372 408 102.0 20.4 176.4 408
OSE AREA OS 1 337 383 429 91.3 23.5 173.9 429
OS 2 337 381 426 92.7 23.1 175.0 426
OS 3 337 378 419 96.1 22.1 171.2 419
OS 4 337 384 431 90.4 23.7 173.8 431
OS 5 337 382 427 92.3 23.2 175.1 427
OS 6 395 459 523 93.2 27.3 199.0 523
OS 7 395 455 515 96.5 26.6 198.7 515
OS 8 337 380 422 94.7 22.5 175.5 422
AKOKO
AREA
AK 1 337 380 422 94.7 22.5 173.8 422
AK 2 296 360 425 65.3 27.3 160.8 425
AK 3 323 381 425 82.9 24.6 168.5 425
AK 4 269 339 419 51.5 29.1 151.7 419
AK 5 337 384 431 90.4 23.7 175.1 431
AK 6 337 382 427 92.3 23.2 177.6 427
AK 7 395 459 523 93.2 27.3 200.0 523
AK 8 395 455 515 96.5 26.6 198.2 515
ISSN:2372-0743 print International Journal of Ground Sediment & Water
Vol. 11 ISSN:2373-2989 on line 2020
615
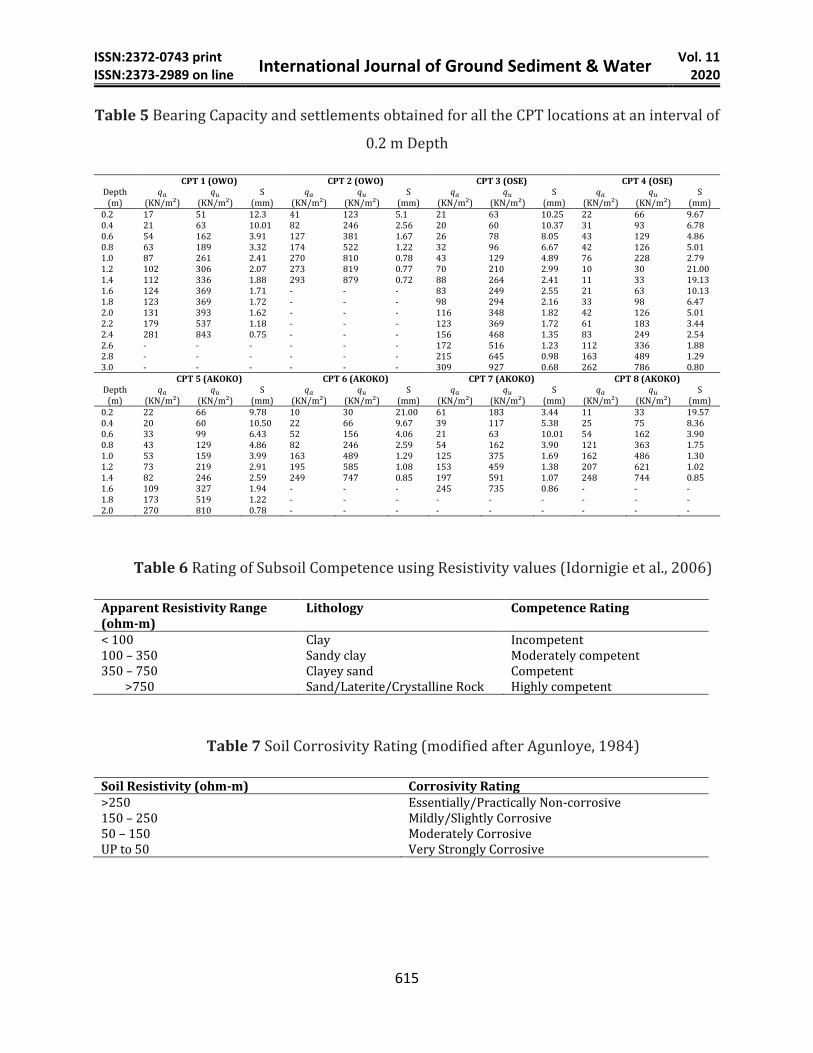
Table 5 Bearing Capacity and settlements obtained for all the CPT locations at an interval of
0.2 m Depth
CPT 1 (OWO) CPT 2 (OWO) CPT 3 (OSE) CPT 4 (OSE) Depth
(m) 𝑞𝑎
(KN/m²) 𝑞𝑢
(KN/m²) S
(mm) 𝑞𝑎
(KN/m²) 𝑞𝑢
(KN/m²) S
(mm) 𝑞𝑎
(KN/m²) 𝑞𝑢
(KN/m²) S
(mm) 𝑞𝑎
(KN/m²) 𝑞𝑢
(KN/m²) S
(mm) 0.2 17 51 12.3 41 123 5.1 21 63 10.25 22 66 9.67 0.4 21 63 10.01 82 246 2.56 20 60 10.37 31 93 6.78 0.6 54 162 3.91 127 381 1.67 26 78 8.05 43 129 4.86 0.8 63 189 3.32 174 522 1.22 32 96 6.67 42 126 5.01 1.0 87 261 2.41 270 810 0.78 43 129 4.89 76 228 2.79 1.2 102 306 2.07 273 819 0.77 70 210 2.99 10 30 21.00 1.4 112 336 1.88 293 879 0.72 88 264 2.41 11 33 19.13 1.6 124 369 1.71 - - - 83 249 2.55 21 63 10.13 1.8 123 369 1.72 - - - 98 294 2.16 33 98 6.47 2.0 131 393 1.62 - - - 116 348 1.82 42 126 5.01 2.2 179 537 1.18 - - - 123 369 1.72 61 183 3.44 2.4 281 843 0.75 - - - 156 468 1.35 83 249 2.54 2.6 - - - - - - 172 516 1.23 112 336 1.88 2.8 - - - - - - 215 645 0.98 163 489 1.29 3.0 - - - - - - 309 927 0.68 262 786 0.80
CPT 5 (AKOKO) CPT 6 (AKOKO) CPT 7 (AKOKO) CPT 8 (AKOKO) Depth
(m) 𝑞𝑎
(KN/m²) 𝑞𝑢
(KN/m²) S
(mm) 𝑞𝑎
(KN/m²) 𝑞𝑢
(KN/m²) S
(mm) 𝑞𝑎
(KN/m²) 𝑞𝑢
(KN/m²) S
(mm) 𝑞𝑎
(KN/m²) 𝑞𝑢
(KN/m²) S
(mm) 0.2 22 66 9.78 10 30 21.00 61 183 3.44 11 33 19.57 0.4 20 60 10.50 22 66 9.67 39 117 5.38 25 75 8.36 0.6 33 99 6.43 52 156 4.06 21 63 10.01 54 162 3.90 0.8 43 129 4.86 82 246 2.59 54 162 3.90 121 363 1.75 1.0 53 159 3.99 163 489 1.29 125 375 1.69 162 486 1.30 1.2 73 219 2.91 195 585 1.08 153 459 1.38 207 621 1.02 1.4 82 246 2.59 249 747 0.85 197 591 1.07 248 744 0.85 1.6 109 327 1.94 - - - 245 735 0.86 - - - 1.8 173 519 1.22 - - - - - - - - - 2.0 270 810 0.78 - - - - - - - - -
Table 6 Rating of Subsoil Competence using Resistivity values (Idornigie et al., 2006)
Apparent Resistivity Range (ohm-m)
Lithology Competence Rating
< 100 Clay Incompetent 100 – 350 Sandy clay Moderately competent 350 – 750 Clayey sand Competent
>750 Sand/Laterite/Crystalline Rock Highly competent
Table 7 Soil Corrosivity Rating (modified after Agunloye, 1984)
Soil Resistivity (ohm-m) Corrosivity Rating >250 Essentially/Practically Non-corrosive 150 – 250 Mildly/Slightly Corrosive 50 – 150 Moderately Corrosive UP to 50 Very Strongly Corrosive
ISSN:2372-0743 print International Journal of Ground Sediment & Water
Vol. 11 ISSN:2373-2989 on line 2020
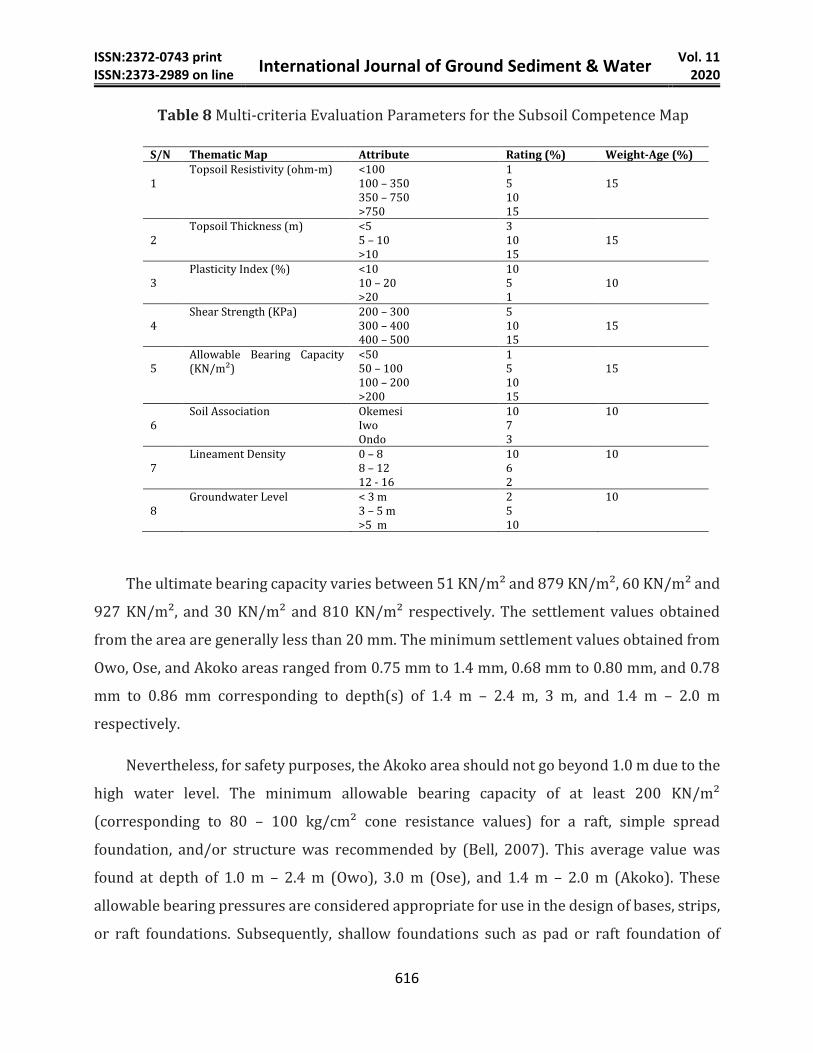
616
Table 8 Multi-criteria Evaluation Parameters for the Subsoil Competence Map
S/N Thematic Map Attribute Rating (%) Weight-Age (%) 1
Topsoil Resistivity (ohm-m) <100 100 – 350 350 – 750 >750
1 5 10 15
15
2
Topsoil Thickness (m) <5 5 – 10 >10
3 10 15
15
3
Plasticity Index (%) <10 10 – 20 >20
10 5 1
10
4
Shear Strength (KPa) 200 – 300 300 – 400 400 – 500
5 10 15
15
5
Allowable Bearing Capacity (KN/m²)
<50 50 – 100 100 – 200 >200
1 5 10 15
15
6
Soil Association Okemesi Iwo Ondo
10 7 3
10
7
Lineament Density 0 – 8 8 – 12 12 - 16
10 6 2
10
8
Groundwater Level < 3 m 3 – 5 m >5 m
2 5 10
10
The ultimate bearing capacity varies between 51 KN/m² and 879 KN/m², 60 KN/m² and
927 KN/m², and 30 KN/m² and 810 KN/m² respectively. The settlement values obtained
from the area are generally less than 20 mm. The minimum settlement values obtained from
Owo, Ose, and Akoko areas ranged from 0.75 mm to 1.4 mm, 0.68 mm to 0.80 mm, and 0.78
mm to 0.86 mm corresponding to depth(s) of 1.4 m – 2.4 m, 3 m, and 1.4 m – 2.0 m
respectively.
Nevertheless, for safety purposes, the Akoko area should not go beyond 1.0 m due to the
high water level. The minimum allowable bearing capacity of at least 200 KN/m²
(corresponding to 80 – 100 kg/cm² cone resistance values) for a raft, simple spread
foundation, and/or structure was recommended by (Bell, 2007). This average value was
found at depth of 1.0 m – 2.4 m (Owo), 3.0 m (Ose), and 1.4 m – 2.0 m (Akoko). These
allowable bearing pressures are considered appropriate for use in the design of bases, strips,
or raft foundations. Subsequently, shallow foundations such as pad or raft foundation of

ISSN:2372-0743 print International Journal of Ground Sediment & Water
Vol. 11 ISSN:2373-2989 on line 2020
617
reinforced concrete can be adopted in the study area (Schmertmann, 1978). Therefore, the
thematic maps of the topsoil resistivity and thickness, plasticity index, soil association,
allowable bearing capacity, shear strength, lineament density, and static water level are
integrated to generate a sub-soil competence map for the study area by allocating different
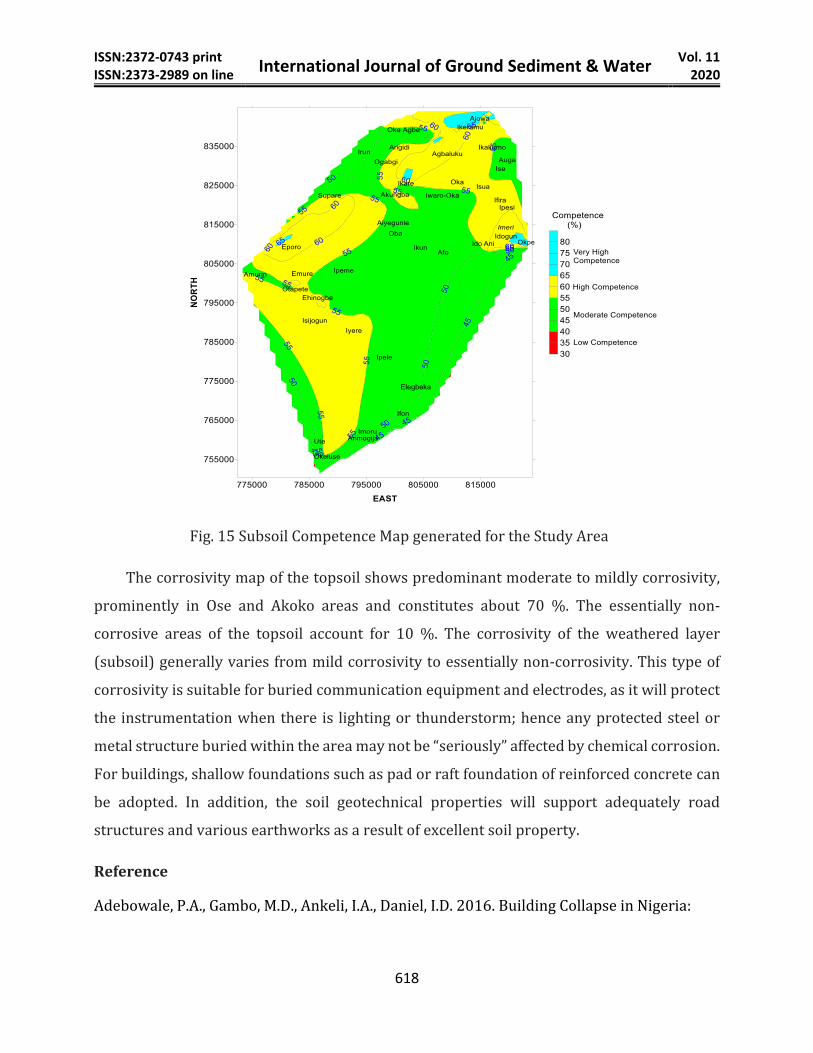
weights/ratings to each of these parameters as shown in Tables 6-8. Figure 15 shows the
generated subsoil competence map of the study area. The map classifies the study area into
low competence (<40 %), moderate competence (40 % - 55 %), and high competence (55 %
- 65 %) and very high (>65 %). Low competence area is not represented on the map, while
moderate competence accounts for 60 %. The high and very high competence areas account
for 35 % to 5% respectively. The very high competence occurs as small closures in Ajowa,
Ikeramu, Eporo, parts of Ikare, Arigidi, and Ido Ani. The moderate competence areas are
prominent in parts of Owo, Ose, and Akoko areas. In Owo, it’s observed in Ipeme, Ipele, and
Amurin. Also, in Ose, it is widespread in Elegbeka, Ifon, Imoru, Arimigija, and Oculus. In
addition, moderate competence is noticed in the Akoko area around Oba, Ikun, Afo, Iwao Oka,
Ikakumo, Irun, Oke Agbe, Auga, and Ise. Furthermore, the high competence subsoil is
observed in Owo (Eporo, Otapete, Ehinogbe, Isijogun, Iyer, and Ute); and Akoko (Agbaluku,
Oka, Isua, Ifira, and Ipesi).
Conclusion
The engineering competence of the subsoil in the selected northern area of Ondo State
was conducted, and the results of various parameters measured were integrated to generate
an engineering competence map for the study area. The research work was able to meet up
with its set objectives except that it has not been able to (fully) determine the geotechnical
capability of the rock units in the area to support engineering structures such as building,
road, dam, etc. The generated subsoil competence map classified the study area into low
competence (<40 %), moderate competence (40 % - 55 %), and high competence (55 % -
65 %) and very high (>65 %). Moderate competence account for 60 %, the high and very high
competence areas account for 35 % and 5% respectively.
ISSN:2372-0743 print International Journal of Ground Sediment & Water
Vol. 11 ISSN:2373-2989 on line 2020
618
Fig. 15 Subsoil Competence Map generated for the Study Area
The corrosivity map of the topsoil shows predominant moderate to mildly corrosivity,
prominently in Ose and Akoko areas and constitutes about 70 %. The essentially non-
corrosive areas of the topsoil account for 10 %. The corrosivity of the weathered layer
(subsoil) generally varies from mild corrosivity to essentially non-corrosivity. This type of
corrosivity is suitable for buried communication equipment and electrodes, as it will protect
the instrumentation when there is lighting or thunderstorm; hence any protected steel or
metal structure buried within the area may not be “seriously” affected by chemical corrosion.
For buildings, shallow foundations such as pad or raft foundation of reinforced concrete can
be adopted. In addition, the soil geotechnical properties will support adequately road
structures and various earthworks as a result of excellent soil property.
Reference
Adebowale, P.A., Gambo, M.D., Ankeli, I.A., Daniel, I.D. 2016. Building Collapse in Nigeria:

ISSN:2372-0743 print International Journal of Ground Sediment & Water
Vol. 11 ISSN:2373-2989 on line 2020
619
Issues and Challenges. Conference of the International Journal of Arts & Sciences, 9(1), pp.
99–108.
Agunloye, O. 1984. Soil aggressivity along steel pipeline route at Ajaokuta. Journal of Mining
Geology, 21(1 & 2): pp. 97-101.
Amadi, A.N., Eze, C.J., Igwe, C.O., Okunlola, I.A., and Okoye, N.O. (2012). Architect’s and
Geologist’s view on the causes of building failures in Nigeria. Modern Applied Science, 6
(6): 31 – 38.
Ayolabi, E.A., Folorunso, A.F., Jegede, O.E. 2012. An Application of 2D Electrical Resistivity
Tomography in Geotechnical Investigations of Foundation Defects: A Case Study. Journal
of Geology and Mining Research, 3(12), pp. 142–151.
Bayode, S., Omosuyi, G.O., Abdullahi, H.I. 2012. Post –foundation Engineering Geophysical
investigation in Part of the Federal University of Technology, Akure, Southwestern
Nigeria. Journal of Emerging Trends and Engineering Apply Science, 3(1), pp. 203–210.
Bell, F.G. 2007. Engineering geology, second edition, Elsevier Ltd, 581pp.
Brink, A.B.A., Parridge, J.C., and Williams, A.A.B. 1992. Soil Survey for Engineering, Claredon,
Oxford.
British Standard 1990. British Standard Methods of Test for soils for Civil Engineering
Purposes, B.S. 1377: Part 2. Published by the British Standards Institution, pp 8 – 200.
Chendo, I.G., Obi, N.I. 2015. Building collapse in Nigeria: the causes, effects, consequences and
remedies. International Journal of Civil Engineering, Construction and Estate
Management, 3(4), pp.41–49.
Dada, S.S. 1999. Pb-Pb and Sm-Nd Isotope Study of Metaigneous Rocks of Kaduna Region:
implications for Archaean Crustal Development in Northern Nigeria. Global Journal of
Pure and Applied Science, (6) 7pp.
Daramola, J.O., Adekunle, M.F., Olaniyi, M.O., and Alayaki, F.M. 2009. Diagnostic Survey
Report of Ondo State Agricultural Production, Institute of Food Security, Environmental
Resources and Agricultural Research, University of Agriculture, Abeokuta, Nigeria pp.
171. Available www.unaab.edu.ng/ifserar
Dimuna, K.O. 2010. Incessant Incidents of Building Collapse in Nigeria: A Challenge to
Stakeholders. Global Journal of Researches in Engineering, 2(4), pp. 75–84.
Edet, A.E., Okereke, C.S., Teme, S.C., and Esu, E.O. 1998. Application of remote sensing data
ISSN:2372-0743 print International Journal of Ground Sediment & Water
Vol. 11 ISSN:2373-2989 on line 2020
620
to groundwater exploration: a case study of Cross River State, Southeastern Nigeria.
Hydrogeology Journal, 6(3) pp 394-404.
http://dx.doi.org/1010.1007/s100400050162
Fagbenle, O.I., Oluwunmi, A.O. 2010. Building Failure and Collapse in Nigeria: the Influence of
the Informal Sector. Journal of Sustainable Development, 3(4), pp. 268–276.
Falowo, O.O. 2020. Engineering Site Investigation and Shallow Foundation Design in Ore Area
of Ondo State, Nigeria. RMZ Material and Geoenvironmental Journal, pp. 13. DOI:
10.2478/rmzmag-2020-0004
Falowo, O.O., Otuaga, M.P. 2020. Subsoil Engineering Characterization and Foundation Design
in geologically derived Coastal Sands of Ilaje Area of Ondo State, Nigeria. International
Journal for Research in Engineering Applications 7 Management (IJREAM), Vol. 6, Issue 1,
pp. 458-468. doi: 10.35291/2454-9150.2020.0333
Falowo, O.O., Ajiboye, O. 2020. In-situ Foundation Characterization and Design in Ese Odo
Local Government Area of Ondo State, Southwestern Nigeria. Global Journal of
Engineering and Technology Advances, 03(02), 001-018.
https://doi.org/10.30574/gjeta.2020.3.2.0026
Faseki, O.E., Olatinpo, O.A., Taiwo, O.B. 2016. Ground Investigation of an Engineering Site at
Point Road, Apapa, Lagos, Nigeria. Journal of Engineering and Energy Research, 6(1), pp.
1–20.
Federal Meteorological Survey 1982. Atlas of the Federal Republic of Nigeria, Second Edition.
Federal Surveys, Lagos, Nigeria 160pp.
Federal Ministry of Works and Housing 1972. Highway Manual Part 1, Road and Bridge
Design, Federal Ministry of Works and Housing, Lagos.
Holtz, W.G., and Kovacs, W.D. 1981. An Introduction to Geotechnical Engineering, Prentice-
Hall Publishers, New Jersey 733pp.
Idornigie, A.I., Olorunfemi, M.O., and Omitogun, A.A. 2006. Integration of remotely sensed and
geophysical data sets in engineering site characterization in a Basement complex of
southwestern Nigeria. Journal of Applied Sciences Research, 2(9) pp. 541-552.
Madedor, A.C. 1983. Pavement design guidelines and practice for different geological area in
Nigeria. In: Ola S.A. (Ed) tropical soil of Nigeria in engineering practice. A.A. Balkema,
Rotterdam, pp. 291-297.

ISSN:2372-0743 print International Journal of Ground Sediment & Water
Vol. 11 ISSN:2373-2989 on line 2020
621
Marans, R.W., and Rodgers, W. 1975. Toward an understanding of community satisfaction: In
Hawley A.H. and Rock V.P. (Eds). Metropolitan America in Contemporary Perspective,
London: Wiley Publishing.
Meyerhof, G.G. 1951. The Ultimate Bearing Capacity of Foundations. Geotechnique, Vol. 2.
Murthy, V.N.S. 1984. Soil Mechanics and Foundation Engineering, Dhanpart Rah and Sons,
India, 763pp.
Murthy, V.N.S. 2007. Advanced Foundation Engineering, Geotechnical Engineering Series.
CBS Publishers and Distributors Ltd., New Delhi – 110002, India, 795pp.
Ngah, S.A., and Nwankwoala, H.O. 2013. Evaluation of Geotechnical Properties of the Sub-soil
for Shallow Foundation Design in Onne, Rivers State, Nigeria. The Journal of Engineering
and Science, Vol. 2 (11): 08 – 16.
Nwankwoala, H.O., and Amadi, A.N. 2013. Geotechnical Investigation of Sub-soil and Rock
Characteristics in parts of Shiroro-Muya-Chanchaga Area of Niger State, Nigeria.
International Journal of Earth Sciences and Engineering, Vol.6 (1):8 – 17.
Nwankwoala, H.O., and Warmate, T. (2014). Geotechnical Assessment of Foundation
Conditions of a Site in Ubima, Ikwerre Local Government Area, Rivers State, Nigeria.
International Journal of Engineering Research and Development (IJERD), 9(8): 50 – 63.
Olayanju, G.M., Mogaji, K.A., Lim, H.S., Ojo, T.S. 2017. Foundation integrity assessment
using integrated geophysical and geotechnical techniques: case study in crystalline
basement complex, southwestern Nigeria. Jour. Geophy. Eng. 14 (3).
Olorunfemi, M.O. 2008. Voyage on the Skin of the Earth: A Geophysical Experience. Inaugural
Lecture 211, Obafemi Awolowo University, Ile-Ife, 75 pp.
Oyedele, K.F., Adeoti, L., Oladele, S., Kamil, A. 2014. Investigation of a Proposed Four Story
Building Sites Using Geophysical and Laboratory Engineering Testing Methods in Lagos,
Nigeria. International Journal of Scientific Research in Knowledge, 2(2), pp. 83–91.
Oyedele, K.F., Oladele, S., Adedoyin, O. 2011. Application of Geophysical and Geotechnical
Methods to Site Characterization for Construction Purposes at Ikoyi, Lagos, Nigeria.
Journal of Earth Sciences and Geotechnical Engineering, 1(1), pp. 87–100.
Oghenero, A.E., Akpokodje, E.G., and Tse, A.C. 2014. Geotechnical Properties of Subsurface
Soils in Warri, Western Niger Delta, Nigeria. Journal of Earth Sciences and Geotechnical
Engineering, 4(1): 89 – 102.

ISSN:2372-0743 print International Journal of Ground Sediment & Water
Vol. 11 ISSN:2373-2989 on line 2020
622
Oke, S.A., and Amadi, A.N. 2008. An assessment of the geotechnical properties of the sub-soil
of parts of Federal University of Technology, Minna, Gidan Kwano Campus, for
foundation design and construction. Journal of Science, Education and Technology, Vol. 1
(2):87 – 102.
Rahaman, M.A. 1988. Review of the basement Geology of Southwestern Nigeria. In Kogbe (Ed):
Geology of Nigeria. Rocks view (Nig) Ltd, Jos. Nigeria, pp 39-56.
Robert, J.N. 2010. Geotechnical Site Characterization and Field Investigation Methods;
Anticipate and Identify Subsurface Conditions to Manage Risks. Whitlock dalrymple
poston & associates, p.c.
Schmertmann, J.H. 1978. Guidelines for Cone Penetration Test: Performance and Design. US
Department of Transportation, Washington, DC.
Smith, A.J., and Montgomery, R.F. 1962. Soils and land use in Central Western Nigeria. The
Government of Western Nigeria, Ibadan Publication.
Tomlinson, M.J. 1999. Foundation Design and Construction 6th Edition, Longman, 536 pp.
Vickers, B. 1978. Laboratory Work in Soil Mechanics, Second Edition.
Youdeowei, P.O., and Nwankwoala, H.O. 2013. Suitability of soils as bearing media at a
freshwater swamp terrain in the Niger Delta. Journal of Geology and Mining Research,
Vol. 5(3): 58 – 64.
This paper DOI: 10.5281/zenodo.4275598
Journal Website: http://ijgsw.comze.com/
You can submit your paper to email: [email protected]