Fast computation of the geoelectric field using the method ...

GEOELECTRICAL SURVEYS FOR THE FEASIBILITY STUDY OF THE BAWANUR DAM SITE
Pavel Bláha1, Vít �erný2, Roman Duras3, Jan Fousek4, Otto Horský5, Milan Lazecký6, Jan Oprchal7, Petr Tábo�ík8,Ali Peshawa9, Bakhtiar Q. Aziz10
AbstractGeoelectric surveys, particularly resistivity measurements, still account for a large amount of work in using geophysical methods
for surveys of shallow depths. The advantage is that they are not so demanding for instrumentation; the disadvantage is that it is necessary to introduce galvanic electricity. This disadvantage becomes more significant especially in arid regions, notably in the dry season. If the client of geophysical work insists in the application of this method, then it is necessary to find suitable instrumentation, and to modify the procedures for measurement and the method for the maximum possible reduction of transition resistances in electrode earthing. The paper describes the way of solving a similar task at the feasibility study stage of the survey of the Bawanur dam profile in Iraqi Kurdistan.
Orienta�ní geoelektrický pr�zkum p�ehradního místa Bawanur Geoelektrická m��ení, zejména pak v odporové variant�, p�edstavují stále velkou �ást prací p�i používání geofyzikálních metod
v pr�zkumu malých hloubek. Jejich výhodou je relativn� malý nárok na p�ístrojové vybavení, nevýhodou pak nutnost galvanického zavád�ní proudu. Tato nevýhoda nabývá na významu zejména v aridních oblastech, a to zvlášt� v období sucha. Pokud objednatel geofyzikálních prací trvá na aplikaci této metody, pak je pot�ebné najít vhodné p�ístrojové vybavení, upravit metodiku m��ení a zp�sob,jakým se co nejvíce sníží p�echodové odpory p�i uzem�ování elektrod. V �lánku je popsán zp�sob, jak jsme podobnou úlohu �ešili p�iorienta�ním pr�zkumu p�ehradního profilu Bawanur v iráckém Kurdistánu.
Keywords vertical electrical sounding, electrical resistivity tomography, satellite images, a survey for dam sites
1. IntroductionDam construction experiences a very interesting trend throughout the world. This trend is not the same in all countries of the world,
but markedly differs in each country. It can be simply said that whereas in advanced countries of the world the construction of new water structures is in decline, in the other countries it is booming. The key circumstance which causes this trend is the growth of the population in these countries and the dramatic rise of their demands for high-quality drinking water and the lack of water for power engineering and agricultural purposes. The Czech association CREA has won the tender for the survey and project of the Bawanur dam in Iraqi Kurdistan. The joint-stock company Geotest is responsible for the engineering-geological part of this project. The contracting authority of the tender, The General Directorate of Dams and Reservoirs in Erbil, required in the first stage of survey to carry out geoelectrical measurements using
- 14 -
the method of vertical electrical sounding. At the end of the fieldwork, the initial requirement was unexpectedly changed and electricalresistivity tomography was required instead of vertical electrical sounding by the investor.
2. General Geology, Geomorphology and Tectonics The geological formations of the foothills of northern Iraq, forming the front of the Arab Platform, are the continuation of the
formation that underlies the Persian Gulf and is the remnant of the Tethys Sea. In northern Iraq, three basic regional stratigraphic and tectonic units are currently defined. In the north, there is a thrust zone (Nappe Mountains) of the Early Mesozoic Age; in the central part, a high folded zone of the Cretaceous Age; and finally, in the south-eastern part of northern Iraq, a low folded zone of Tertiary sediments. The currently existing geological structure of northern Iraq is the result of the dramatic Alpine folding in the Pliocene, during which the Zagros Nappe Mountains emerged. The subsequent accelerated epeirogenetic upheaval, which was taking place until the end of the Pliocene, resulted in the deposition of the conglomerate Bakhtiary Formation with thicknesses of 2 – 2.5 km. Geotectonic episodes that began in the Pleistocene led to the renewal of movements along fault lines, to the rise of mountain ranges and to the subsidence of interjacent valleys.
The area, investigated in conjunction with the construction of the Bawanur dam, lies in the low folded zone. The pre-Quaternarybedrock consists of the Upper Bakhtiary Formation, which is of the Upper Miocene to Pliocene Age. The formation several hundred meters thick is formed by terrigenous clastic sediments. The formation includes sediments of different grain size ranging from claystones through siltstones and sandstones to conglomerates. Their deposition is irregular both in the vertical and horizontal directions. The trend of the growth in the grain size can be observed very roughly in the sedimentary rocks upwards; therefore conglomerates prevail in the uppermost layers. Some sources, however, report the opposite trend, particularly in the main basin structures (Buday, Tiracek1980).
The Quaternary sediments form the fill of the tectonically predisposed valley, create accumulation terraces along the stream andcover late Tertiary formations on accumulation plains. In general, it is extremely difficult to distinguish the boundary between the Quaternary sediments and the Upper Bakhtiary Formation if it creates their bedrock, due to the almost identical lithology and the lack of index fossils. The recent river sediments in narrow valley form deposits several meters thick, having the character of sands and the different content of loams. In the particular case of the studied section of the braided Sirwan River in the trough-shaped valley, which is further remolded by the chaotic extraction of building aggregate, the recent deposits are practically indistinguishable from the terrace sediments.
In northern Iraq, it is possible to define three main types of relief: mountain ranges, uplands in their foothills, and extensiveaccumulation plains. These types are directly bound to the regional tectonic division, the current shape of which is the result of the Alpine orogenesis. The areas of tectonic manifestations and the intensely folded foreland of the Zagros Mountains are characterized by vast mountain ranges which follow identical orogenic trends. The sharp reduction of the occurrence of rugged mountain ranges characterizes the uplands of the foothills followed by accumulation plains.
The territory where there is our area of study lies in the low folded foothills which can be divided into the following morphologicallydefined groups: anticline ridges, denudation uplands and river accumulation plains.
- 15 -
- 16 -
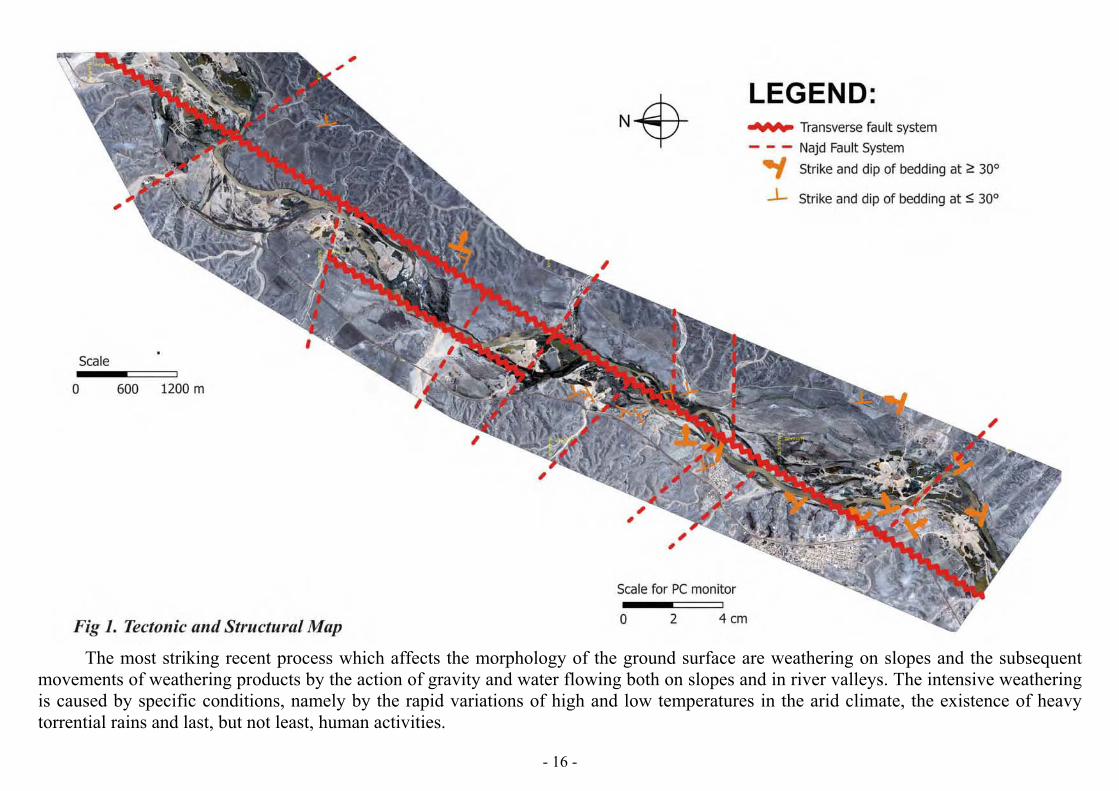
The most striking recent process which affects the morphology of the ground surface are weathering on slopes and the subsequentmovements of weathering products by the action of gravity and water flowing both on slopes and in river valleys. The intensive weatheringis caused by specific conditions, namely by the rapid variations of high and low temperatures in the arid climate, the existence of heavy torrential rains and last, but not least, human activities.

- 17 -
The valley of the Sirwan River by the Municipality of Bawanur lies in the area of a denudation upland, which is more developed onthe eastern slope. The pronounced manifestations of denudation and erosion in that area led to the origin of the very rugged surface, which can be described as badlands. The denudation upland to the west of the river forms only discontinuous areas and passes into a vast accumulation plain.
In some sections of the valley, the upland is rimmed by an accumulation terrace of the river. On the western slope, the accumulation terrace is more extensive (the whole Municipality of Bawanur is situated on it). It is probably of the Quaternary Age and is not continuous on both of the slopes due to the erosion action of the river. It consists of conglomerates with less firm crystalline calcareous cement and lies horizontally or sub-horizontally over the sedimentary rocks of the Upper Bakhtiary Formation.
The river valley itself has a trough-shaped asymmetrical form. The surface of the valley bottom, in which the river has erraticbehaviour, is markedly affected by the extraction of building aggregate and it is difficult to distinguish incised meanders and deep pools from abandoned mining pits. The slopes of the valley are formed both by steep river bluffs and flatter slopes on the deposited banks.
At the mouth of the lateral valleys (wadis), usually inconspicuous and mostly washed-out alluvial cones are molded. Wadis are farmore frequent and larger on the western bank.
In the area of the survey, it is possible to observe tectonic lines which belong to the main tectonic systems of Iraq. It is particularly the Sirwan Fault, which is determinant for the direction of the riverbed in the section north-east of the Municipality of Bawanur. This fault
is part of the Transverse Fault System of the general NE–SW direction and farther to the SW it forms the boundary between the CentralIraqi Block and the Mesopotamian Block. The lines that belong to the Najd Fault System of the general NW–SE direction are more frequent in this area. Evidently, these are minor lines accompanying the Kirkuk Fault Zone. The activity of this system in the Plio–Pleistocene Age can be connected with the existence of sub-vertical discontinuities in the conglomerates of the Bakhtiary Formation.
The tectonic and structural map of the whole area under investigation (the dam site and the backwater area) is given in Fig. 1.
3. Satellite Images as the Background Information for Further Survey Work In the engineering-geological survey for the Bawanur dam and ancillary facilities, images from five satellites were used: SPOT,
LANDSAT 7 (scanner ETM+), Terra (scanner ASTER), ENVISAT and Worldview2. The images from SPOT, freely accessible at GoogleEarth, were used for obtaining the first information on the bedding of conglomerate sequences and the major tectonic fracturing of the rock mass in the area under investigation. The freely available image was filtered to achieve its better legibility, and hence the better possibility of acquiring basic geological data. The difference between the original image and the filtered image is shown in Fig. 2. In the image, it was possible to interpret well the different strike of the layers that belong to different geological units. On the right side of the valley, the strike was about 295 °, on the left side 315 °. As in the case of the bedding, it was also possible to identify all four main tectonic lines from the satellite image. The principal direction influencing significantly the geological evolution of the valley runs from NNE to SSW. The weakness of the rocks of this fault has been used also by the Sirwan River.
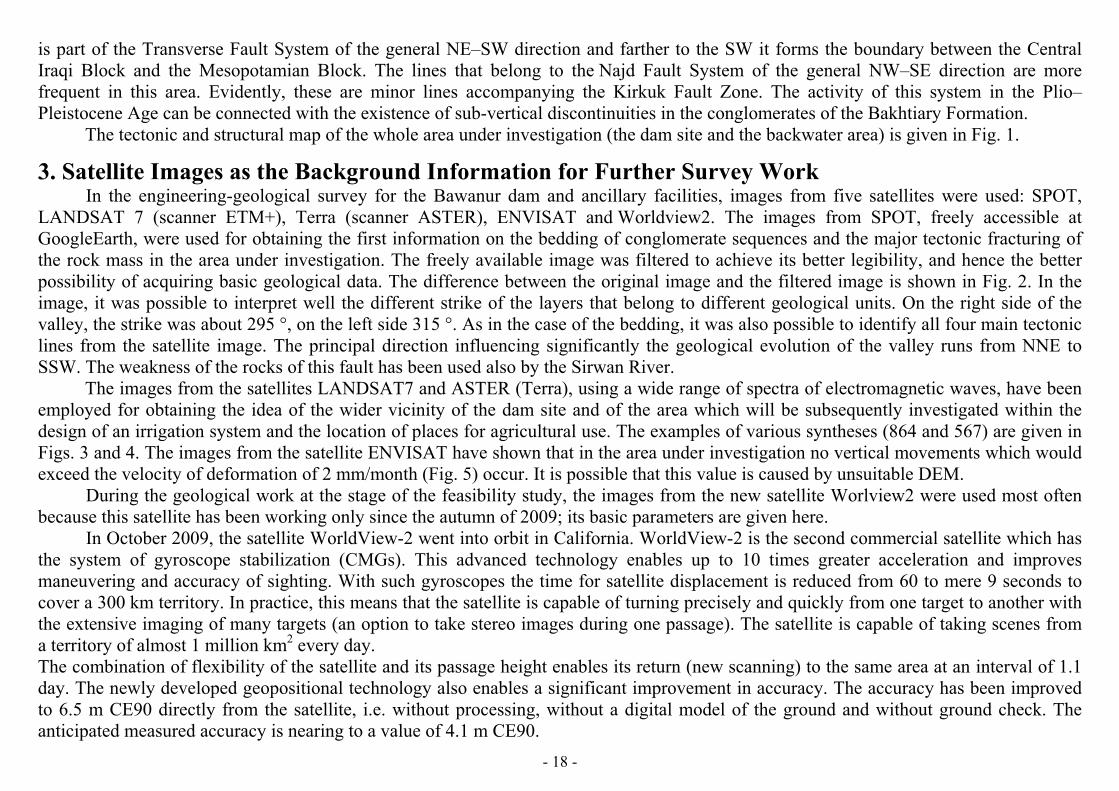
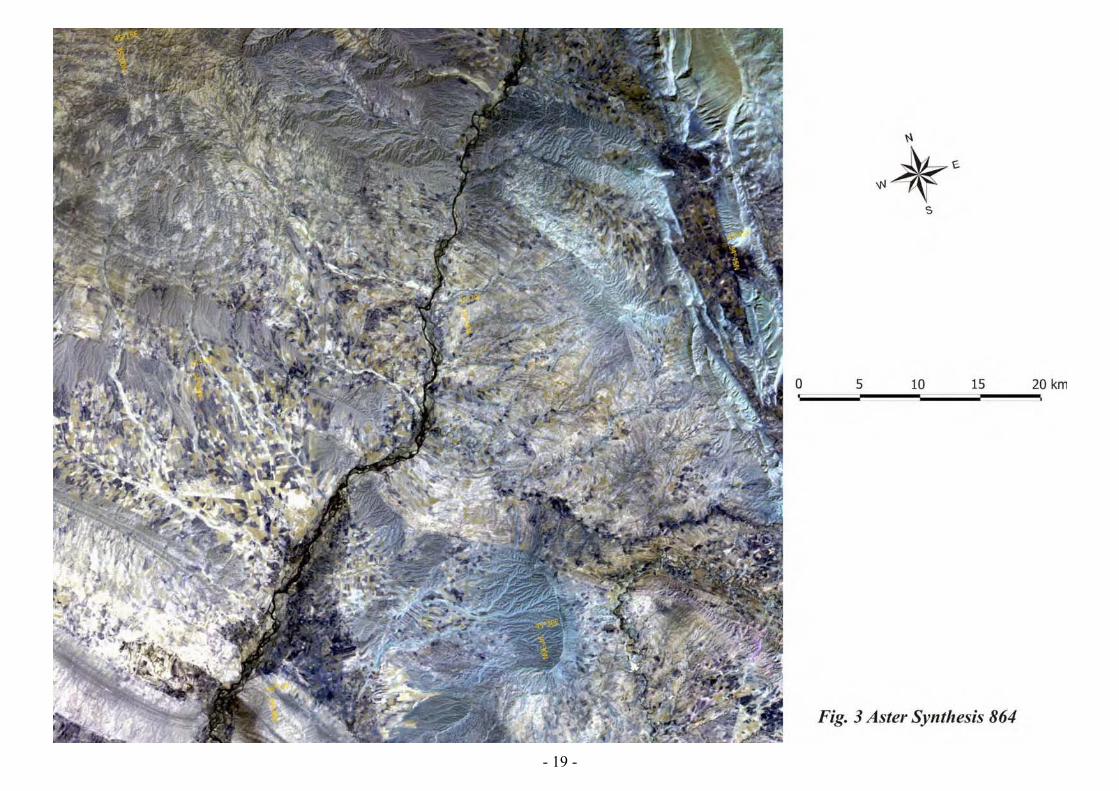
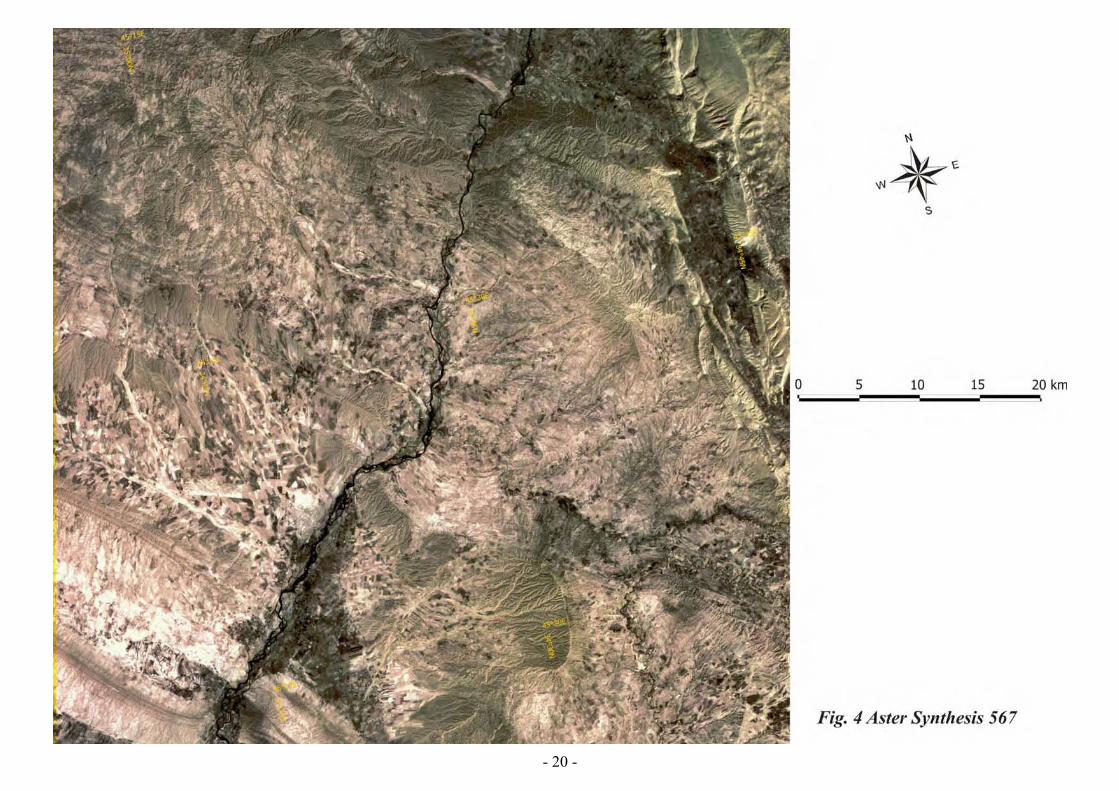
The images from the satellites LANDSAT7 and ASTER (Terra), using a wide range of spectra of electromagnetic waves, have been employed for obtaining the idea of the wider vicinity of the dam site and of the area which will be subsequently investigated within the design of an irrigation system and the location of places for agricultural use. The examples of various syntheses (864 and 567) are given in Figs. 3 and 4. The images from the satellite ENVISAT have shown that in the area under investigation no vertical movements which would exceed the velocity of deformation of 2 mm/month (Fig. 5) occur. It is possible that this value is caused by unsuitable DEM.
During the geological work at the stage of the feasibility study, the images from the new satellite Worlview2 were used most oftenbecause this satellite has been working only since the autumn of 2009; its basic parameters are given here.
In October 2009, the satellite WorldView-2 went into orbit in California. WorldView-2 is the second commercial satellite which hasthe system of gyroscope stabilization (CMGs). This advanced technology enables up to 10 times greater acceleration and improvesmaneuvering and accuracy of sighting. With such gyroscopes the time for satellite displacement is reduced from 60 to mere 9 seconds to cover a 300 km territory. In practice, this means that the satellite is capable of turning precisely and quickly from one target to another with the extensive imaging of many targets (an option to take stereo images during one passage). The satellite is capable of taking scenes from a territory of almost 1 million km2 every day. The combination of flexibility of the satellite and its passage height enables its return (new scanning) to the same area at an interval of 1.1 day. The newly developed geopositional technology also enables a significant improvement in accuracy. The accuracy has been improvedto 6.5 m CE90 directly from the satellite, i.e. without processing, without a digital model of the ground and without ground check. The anticipated measured accuracy is nearing to a value of 4.1 m CE90.
- 18 -
- 19 -
- 20 -

- 21 -
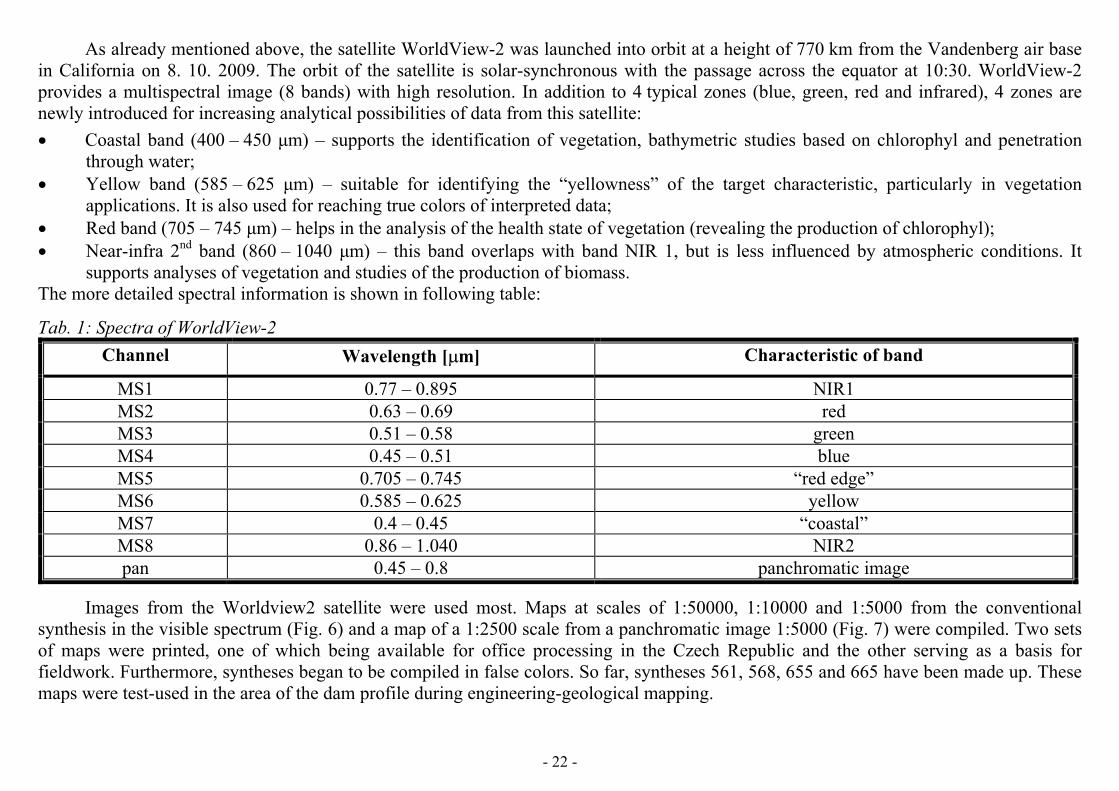
As already mentioned above, the satellite WorldView-2 was launched into orbit at a height of 770 km from the Vandenberg air basein California on 8. 10. 2009. The orbit of the satellite is solar-synchronous with the passage across the equator at 10:30. WorldView-2 provides a multispectral image (8 bands) with high resolution. In addition to 4 typical zones (blue, green, red and infrared), 4 zones are newly introduced for increasing analytical possibilities of data from this satellite: � Coastal band (400 – 450 �m) – supports the identification of vegetation, bathymetric studies based on chlorophyl and penetration
through water; � Yellow band (585 – 625 �m) – suitable for identifying the “yellowness” of the target characteristic, particularly in vegetation
applications. It is also used for reaching true colors of interpreted data; � Red band (705 – 745 �m) – helps in the analysis of the health state of vegetation (revealing the production of chlorophyl); � Near-infra 2nd band (860 – 1040 �m) – this band overlaps with band NIR 1, but is less influenced by atmospheric conditions. It
supports analyses of vegetation and studies of the production of biomass. The more detailed spectral information is shown in following table:
Tab. 1: Spectra of WorldView-2 Channel Wavelength [�m] Characteristic of band
MS1 0.77 – 0.895 NIR1MS2 0.63 – 0.69 redMS3 0.51 – 0.58 greenMS4 0.45 – 0.51 blueMS5 0.705 – 0.745 “red edge” MS6 0.585 – 0.625 yellowMS7 0.4 – 0.45 “coastal”MS8 0.86 – 1.040 NIR2pan 0.45 – 0.8 panchromatic image
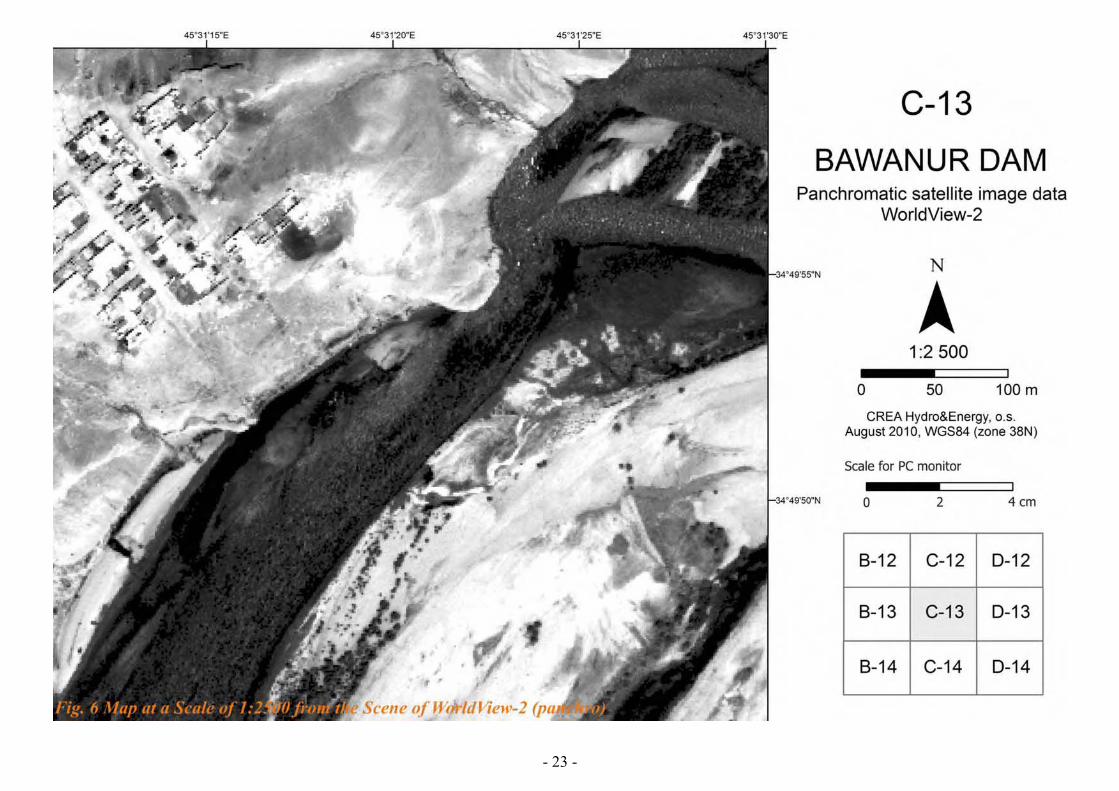
Images from the Worldview2 satellite were used most. Maps at scales of 1:50000, 1:10000 and 1:5000 from the conventional synthesis in the visible spectrum (Fig. 6) and a map of a 1:2500 scale from a panchromatic image 1:5000 (Fig. 7) were compiled. Two sets of maps were printed, one of which being available for office processing in the Czech Republic and the other serving as a basis for fieldwork. Furthermore, syntheses began to be compiled in false colors. So far, syntheses 561, 568, 655 and 665 have been made up. These maps were test-used in the area of the dam profile during engineering-geological mapping.
- 22 -
- 23 -

- 24 -
4. Field Measurement4.1 Comparison of Different Types of Apparatus
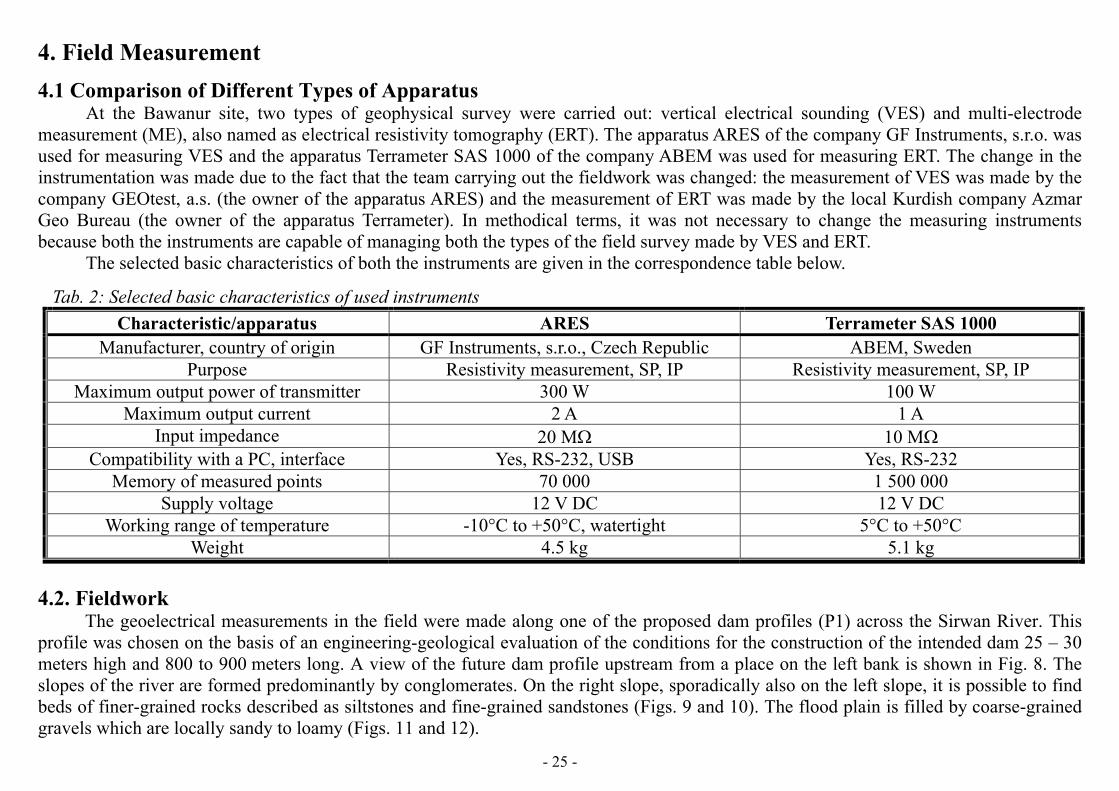
At the Bawanur site, two types of geophysical survey were carried out: vertical electrical sounding (VES) and multi-electrode measurement (ME), also named as electrical resistivity tomography (ERT). The apparatus ARES of the company GF Instruments, s.r.o. was used for measuring VES and the apparatus Terrameter SAS 1000 of the company ABEM was used for measuring ERT. The change in the instrumentation was made due to the fact that the team carrying out the fieldwork was changed: the measurement of VES was made by the company GEOtest, a.s. (the owner of the apparatus ARES) and the measurement of ERT was made by the local Kurdish company Azmar Geo Bureau (the owner of the apparatus Terrameter). In methodical terms, it was not necessary to change the measuring instrumentsbecause both the instruments are capable of managing both the types of the field survey made by VES and ERT.
The selected basic characteristics of both the instruments are given in the correspondence table below.
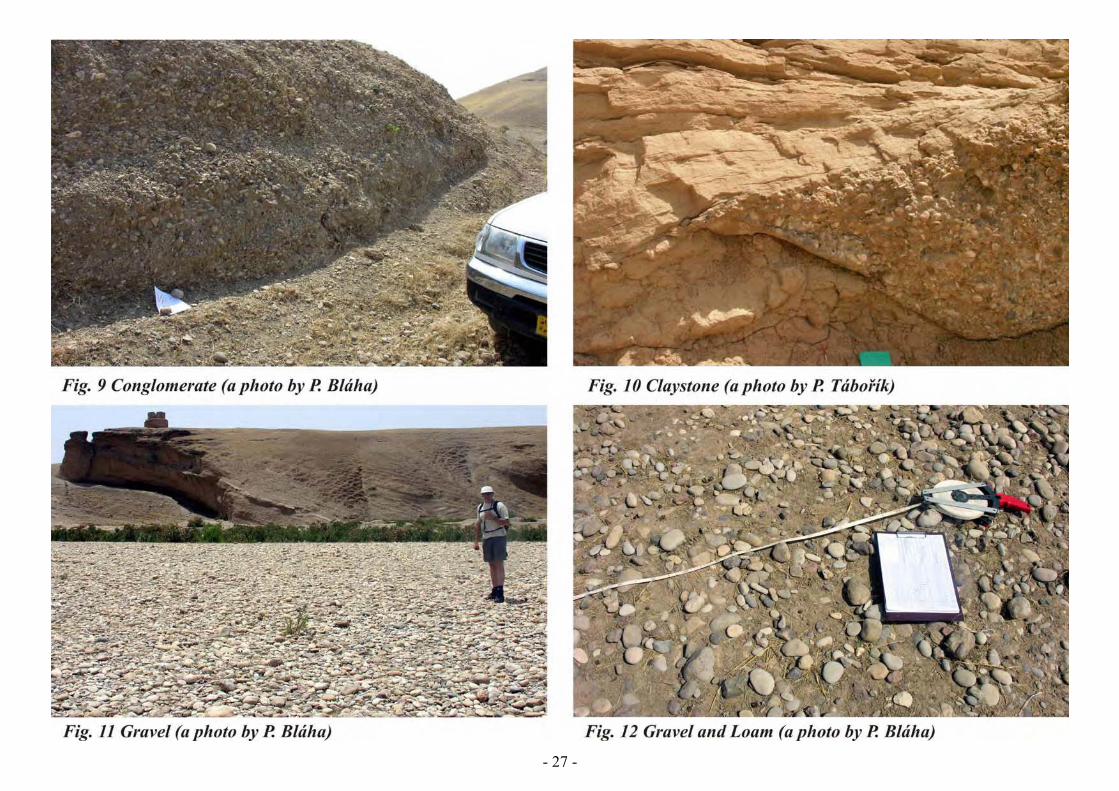
4.2. Fieldwork The geoelectrical measurements in the field were made along one of the proposed dam profiles (P1) across the Sirwan River. This
profile was chosen on the basis of an engineering-geological evaluation of the conditions for the construction of the intended dam 25 – 30 meters high and 800 to 900 meters long. A view of the future dam profile upstream from a place on the left bank is shown in Fig. 8. The slopes of the river are formed predominantly by conglomerates. On the right slope, sporadically also on the left slope, it is possible to find beds of finer-grained rocks described as siltstones and fine-grained sandstones (Figs. 9 and 10). The flood plain is filled by coarse-grained gravels which are locally sandy to loamy (Figs. 11 and 12).
Tab. 2: Selected basic characteristics of used instrumentsCharacteristic/apparatus ARES Terrameter SAS 1000
Manufacturer, country of origin GF Instruments, s.r.o., Czech Republic ABEM, Sweden Purpose Resistivity measurement, SP, IP Resistivity measurement, SP, IP
Maximum output power of transmitter 300 W 100 W Maximum output current 2 A 1 A
Input impedance 20 M� 10 M�Compatibility with a PC, interface Yes, RS-232, USB Yes, RS-232
Memory of measured points 70 000 1 500 000 Supply voltage 12 V DC 12 V DC
Working range of temperature -10°C to +50°C, watertight 5°C to +50°C Weight 4.5 kg 5.1 kg
- 25 -

- 26 -
made only in the morning, after that the integrated thermal protector of the instrument was constantly turning off the apparatus.
The geophysical work in the field was carried out at two stages. At the first one, the measurement was made using the method ofvertical electrical sounding (referred to hereinafter as VES), and at the second one, the method of electrical resistivity tomography (referred to hereinafter as ERT) was used. Both the stages were implemented under extreme climatic conditions, i.e. in the dry season when there had not been rain for four months. During the period of fieldwork, the temperatures reached up to 48°C in the shade. The measurement could be
- 27 -
- 28 -
ents, Brno) which combines an amp-meter, n such a way so that they could always create a profile
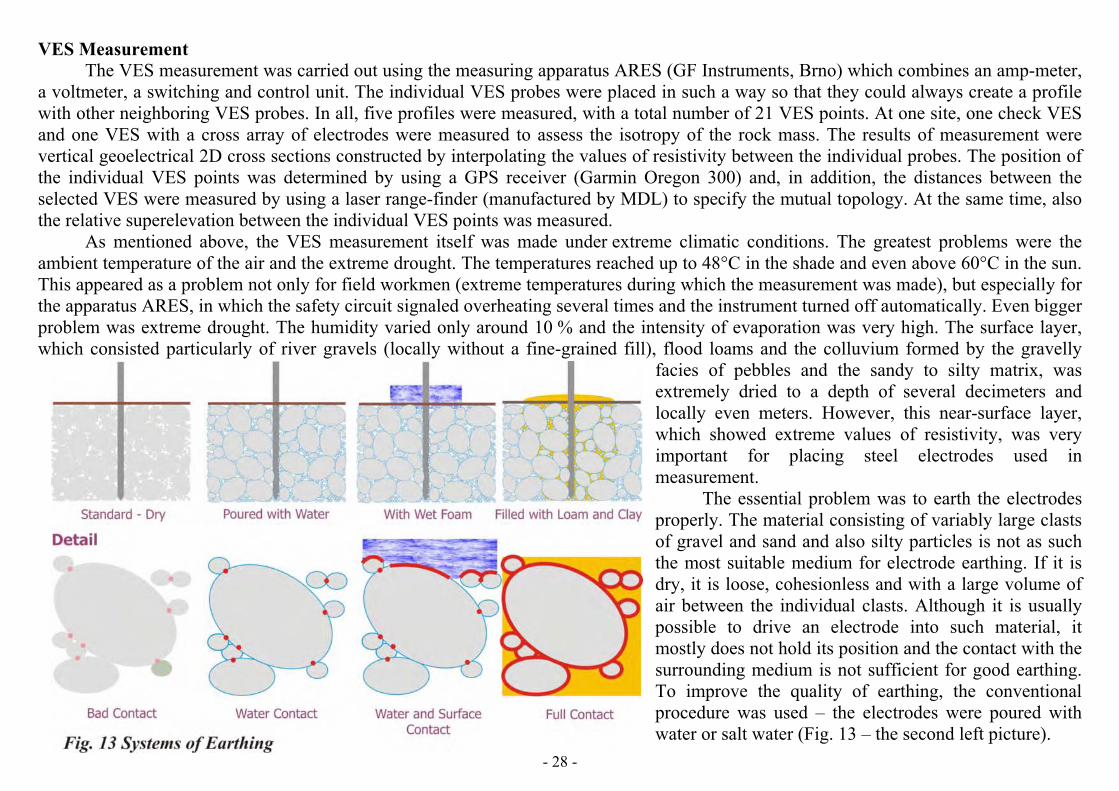
with other neighboring VES probes. In all, five profiles were measured, with a total number of 21 VES points. At one site, one check VES and one VES with a cross array of electrodes were measured to assess the isotropy of the rock mass. The results of measurement werevertical geoelectrical 2D cross sections constructed by interpolating the values of resistivity between the individual probes. The position of the individual VES points was determined by using a GPS receiver (Garmin Oregon 300) and, in addition, the distances between theselected VES were measured by using a laser range-finder (manufactured by MDL) to specify the mutual topology. At the same time, also the relative superelevation between the individual VES points was measured. As mentioned above, the VES measurement itself was made under extreme climatic conditions. The greatest problems were the ambient temperature of the air and the extreme drought. The temperatures reached up to 48°C in the shade and even above 60°C in the sun. This appeared as a problem not only for field workmen (extreme temperatures during which the measurement was made), but especially for the apparatus ARES, in which the safety circuit signaled overheating several times and the instrument turned off automatically. Even bigger problem was extreme drought. The humidity varied only around 10 % and the intensity of evaporation was very high. The surface layer,which consisted particularly of river gravels (locally without a fine-grained fill), flood loams and the colluvium formed by the gravelly
facies of pebbles and the sandy to silty matrix, was extremely dried to a depth of several decimeters and locally even meters. However, this near-surface layer, which showed extreme values of resistivity, was very important for placing steel electrodes used in measurement.
The essential problem was to earth the electrodes properly. The material consisting of variably large clasts of gravel and sand and also silty particles is not as such the most suitable medium for electrode earthing. If it is dry, it is loose, cohesionless and with a large volume of air between the individual clasts. Although it is usually possible to drive an electrode into such material, it mostly does not hold its position and the contact with the surrounding medium is not sufficient for good earthing. To improve the quality of earthing, the conventional procedure was used – the electrodes were poured with water or salt water (Fig. 13 – the second left picture).
VES Measurement The VES measurement was carried out using the measuring apparatus ARES (GF Instrum
a voltmeter, a switching and control unit. The individual VES probes were placed i

- 29 -

Under normal conditions, this procedure is usually sufficient, but not at the site of the dam profile at Bawanur. Efforts were made to solve the insufficient contact with the bedrock by using foam plates which were properly moistened and which should have markedly improved the contact surface with the bedrock. Also in this case, not common water but salted water was used. Neither was this method sufficient. Another step included foam plates (Fig. 14) and penetrating electrodes, again with no success (Fig. 13 – the second right picture and Fig. 15). Finally, silty sediments (flood loams) were used. These were mixed with salt water and a thin paste was made (Fig. 16). This was used for pouring the penetrating electrodes. First, the vicinity of the electrode was sufficiently moistened with salt water and then the fine thin paste was applied, filling the pores of the uppermost layers of the bedrock, and a conductive contact “cake” of the salt loamy paste was made on the surface around the electrode (Fig. 13 – on the very right side and Fig. 17). On the surface of the “cake”, a crust was quickly created, preventing evaporation which would be otherwise very rapid. This way of earthing appeared as working.
Another parameter which had to be modified during measurement was the intensity (magnitude) of the output voltage of the instrument. 20 mV (the relative unit of the instrument) set as a default became evident as utterly insufficient in these extreme conditions; a one order higher voltage was then progressively chosen. The transition resistance reached even hundreds of ohm-meters, and thus adverse effects occurred, accompanying this situation. High transition resistances have a very bad effect on the measurement of voltage, when the potential is conducted from the earth through electrodes with very bad earthing; thus, interference of two types can appear on the potential input to ARES.
The first is electromagnetic noise, during which a higher or lower voltage would be measured at random – a large standard deviationof measurement would occur. At the site, this type of disturbances was considered as little probable because the designed dam is planned to be constructed in a little populated area. Not far downstream from below the dam site, there is a small town of Bawanur, in which, however, practically no industrial activity exists. The largest source of interference could only be air-conditioning units. Interference of the other type can be the capacity and inductive couplings to the current conductors (through the air and/or the earth, and also inside the instrument). These are shown by a small standard deviation (interference is constant), but utterly unreasonable measured values. The indicator that the earthing is not fully in order is also the fact that the measured DC potential on the potential electrodes is often two orders of magnitude higher than the useful voltage itself.
Despite the initial difficulties we had been coping with for several days, in the end it turned out that the pouring the electrodes with the thin conductive paste was the optimal method for electrode earthing which, together with the setting of the highest output voltage of the instrument designed for the measurement of induced polarization, proved useful. Then, measurements were made in a standard way withoutmuch complication except for a few cases – if not taking account of the extreme conditions for the fieldwork. The instruments as well as the operators were protected by the shadow of a parasol during all the measurements. At the moment when the instrument was left in the direct sun, the measurement stopped (Figs. 18 and 19).
ERT Measurement Because of the relatively large technical equipment, a local geophysical company was contracted for carrying out the measurement of
ERT in the field. The objective of this measurement was to create a 2D picture of the geological structure to a depth of about 40 meters due
- 30 -

- 31 -¨

to the parameters of the method and the possibilities of the site under investigation, a total of four profiles were measured, two of which through the axis of the main dam profile. The instrumentation of the company ABEM was chosen for the measurement, namely Terrameter SAS1000. The instrument was chosen particularly due to the relatively high input resistance and the possibility of repeated measurementson individual electrodes. In most cases, ERT is usually measured by means of so-called “multi-cable” or “multi-electrode cable” sections. These sections are extended along a considered profile, electrodes are grounded and the whole profile is measured automatically using the control processor of the measuring apparatus, which selects and sets the array of electrodes. Because of the long experience gained by the local company and the extreme conditions, this procedure of measurement was replaced by a method probably somewhat less sophisticated though, but all the more efficient.
Multi-cable sections were not used, but two pairs of electrodes (current ones A and B and potential ones M and N), the placing ofwhich was made by rodmen who installed electrodes to the next position always at a command of the operator and they were moved according to prearranged schemata (Figs. 20 and 21). Thus, the array of electrodes changed basically the same as in the use of multi-cable sections and the operator substituted for the automatic switching unit. This procedure, maybe complicated at first sight, however, enabled the control of the individual measurements on the electrodes. If necessary, the operator could then let the earthing of electrodes adjust until the moment when the transition resistance already enabled the measurement to be made with an acceptable error. This continuous control of the results of measurement thus ensured the good collection of data which could not have been obtained by using cable sections. The problem with earthing was solved by using longer metallic electrodes (about 60 cm), which were poured with water. The measurementusing the ERT method was not made in such extreme conditions as the VES measurement.
The location of ERT profiles was made similarly to that in the measurement of VES, i.e. by using GPS coordinates, and the topography expressed in the relative superelevation of the ground was measured by a laser telemeter. The introduction of the so-called “relief corrections” is very important for the processing of the resulting 2D inverse model (2D geoelectrical cross section).
5. Modeling of the Geological Structure In common practice, the geophysical survey methods are aimed at the solution of the so-called inversion modeling, i.e. the geological
structure is judged on the basis of the knowledge of the manifestation of a physical quantity. The models of the geological medium enable the characteristics of the geological features to be defined in a simple way so that they reflect the assumed on-site conditions as much as possible. Based on the definition of the medium, the manifestations of physical quantities are subsequently investigated (resistivity, heat distribution, the velocity of the propagation of elastic waves, etc.). The given study is called forward modeling. The modeling software for the monitoring of resistivity manifestations above a defined medium (forward modeling) is usually part of the software package for the interpretation of results of multi-electrode measurements.
The modeling software applied to the solution of the distribution of resistivity values in the investigated area of Bawanur is namedRES2DMOD, the author of which is the Malaysian programmer M. H. Loke. The program supplements the interpretation software of thecompany GEOTOMO Software, the core of which consists of the inversion modeling program RES2DINV.
- 32 -
The first step in the development of a model of a rock medium with defined parameters is to determine geometrical characteristics of the whole model and its individual parts. This is followed by the construction of a precisely structured header containing 33 lines of coded information about the length of a profile, the spacing of electrodes, the number of structures and their representative values of resistivity, etc. On one model it is possible to apply 16 media of different resistivity; the length of the model depends on the number of electrodes and their spacing. RES2DMOD enables calculations with 101 electrodes. The definition of the type of the array of electrodes is also important: Wenner, Wenner-Schlumberger, pole-pole, pole-dipole, etc.
The assembly and tuning of the model according to the input requirements is followed by the process of calculating the resistivity manifestation of the modeled medium as it would look like in the real measurement on the real field. The output of modeling can be exported to the format which can be directly used by the inversion program RES2DINV, which enables the interpretation algorithms to be set so that their result matches the real (modeled) features as faithfully as possible.
Construction of ModelsSuch models for calculations were chosen, which would provide as much information as possible about the manifestation of the
given geological structure on the field of apparent resistivity and on the resulting interpreted field of resistivity. Because no direct exploratory workings were available at the site or in its nearest vicinity, which would be suitable for parametric measurements, the sizes of resistivity for the individual media were entered on the basis of the results of vertical electrical sounding in the individual exposures. In all, twelve models were constructed, tracking especially the manifestation of the geological structure below the thick layer of gravels.
Evaluation of Model Calculations In addition, we observed whether the distance between the individual electrodes in field measurements had a fundamental effect on
the search for a thin conductive layer. In all models the same resistivity was kept for individual types of lithology; for gravels it was 265 ohm-meters, for underlying conglomerates 75 ohm-meters, and for “claystones” 12 ohm-meters. The mathematical models were calculated for similar electrode spacing planned for field measurements, i.e. 6 and 10 meters. The results confirmed the theoreticalassumptions as well as the notions of the Kurdish and Czech geophysicists. After summarizing all of these sources of data, it was decided to measure with the Schlumberger electrode array with the basic ten- meter electrode spacing in the field. Only on the profile on the left slope, the five-meter electrode spacing was chosen. The reason was the attempt to verify the theoretical assumptions by real field measurement. In the following text concerning the models, only cases with the electrode spacing of six meters are presented.
Already at the first sight of the pictures, it is obvious that the inversion modeling of the task does not produce the boundaries which were entered into the model, but that the field of the distribution of resistivity is much more complicated than the original model. The causes can be searched for both in the principle of the ERT method and in the graphic depiction of the results of the inversion modeling of the task. The ERT method does not enable the determination of resistivity in any point of the studied section, but in a limited number of points given by the electrode spacing, by the number of electrodes included in the measurement and, in certain cases, also by the conditions of the field measurement. After re-calculation, a network of points with defined values of resistivity is obtained and now there is a problem how to depict this network. Neither the tabular presentation of results nor the numerical depiction of resistivity in the section is concise,
- 33 -

without giving a picture of the geological structure to the user. Therefore, the results are depicted by using contours of resistivity. All methods for converting the values of resistivity in the network to the contours of resistivity, however, produce distortion. Mostly professional geophysicists are aware of this circumstance, but the great majority of geologists are not conscious of it at all. It may be the mistake of geophysicists that they show geologists the section processed by two methods of contour plotting, i.e. by two methods of gridding, instead of showing them the resistivity section obtained from one inverse calculation.
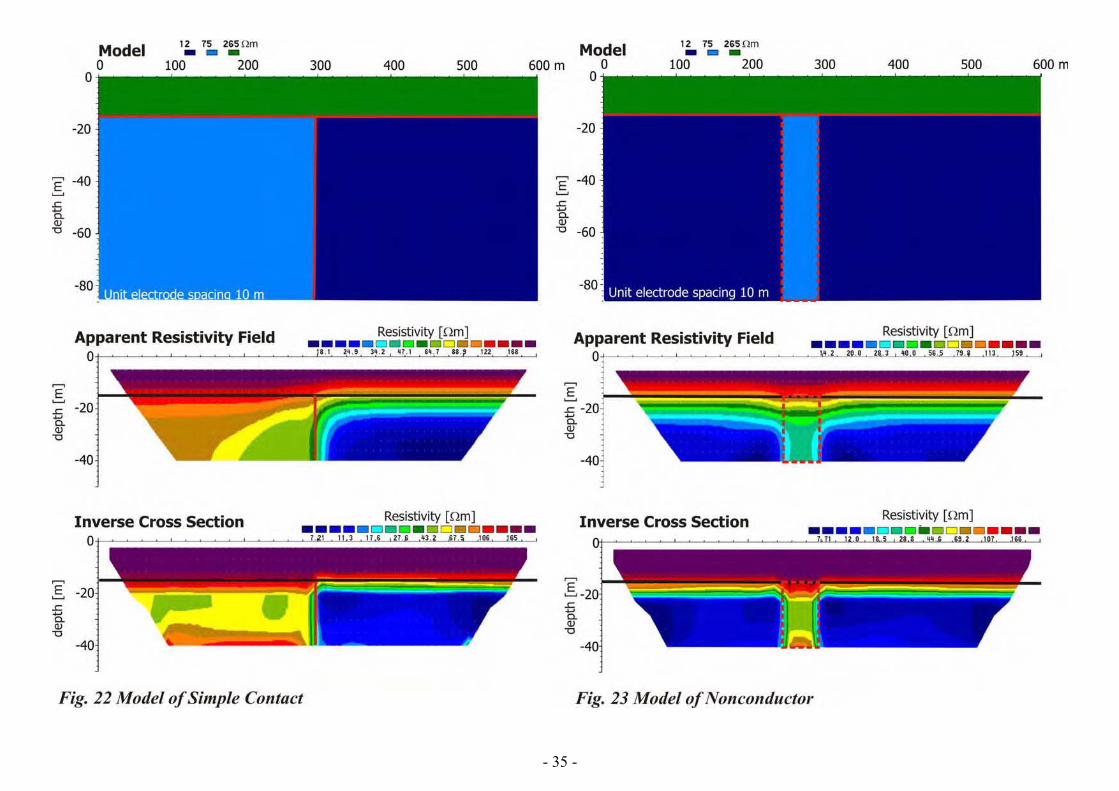
The conductive layer in the bedrock is modeled with a dip of about 15° and this dip is maintained in most of the other cases. Theprogram RES2DINV does not permit any oblique plane to enter; the layer of “claystones” is, therefore, replaced by a set of rectangles so that their set approximates the idea of the obliquely deposited layer of pelitic sediments as much as possible. All the results are depicted in the figures as exaggerated, i.e. the horizontal and vertical scales are different!
The vertical contact of a conductor with a non-conductor (Fig. 22) Based on the results of modeling by the ERT method, the position of the base of gravel sediments and the boundary between the
conductor and the non-conductor in the bedrock will be identified. The optical perception that the boundary above conglomerates is different from that above claystones (according to the color description of the resistivity field) is deceptive. It must be borne in mind that the resistivities of the underlying conductor are different from those of the underlying non-conductor and thus it is not possible to place the base of gravels in the lower boundary of the high-resistivity layer but it is necessary to look for it roughly in the layer which has a resistivity of about 170 ohm-meters above the non-conductor – conglomerate, and 110 ohm-meters above the conductor, i.e. in theinflection points of the vertical change in resistivity. The sharp horizontal change in resistivity in the bedrock corresponds well to the conductor/non-conductor boundary. The precise boundary does not lie in the average of the resistivity of the conductor and the non-conductor, but is shifted towards the conductive medium. This phenomenon is not unusual in resistivity methods but is encounteredrelatively often.
The vertical non-conductor (Fig. 23) All the findings that hold true for the determination of boundaries between different media described in the preceding models are also
applicable in this case. The only new fact is the anomaly of relatively high resistivity values at greater depths of the modeled non-conductor. This anomaly is deceptive and has no real justification. On the other hand, it must be stated that the absolute values of resistivity interpreted from the model do not reach the values set in the model. It can be seen that the sizes of resistivity obtained by the interpretation of field measurements are not the real resistivities of the medium.
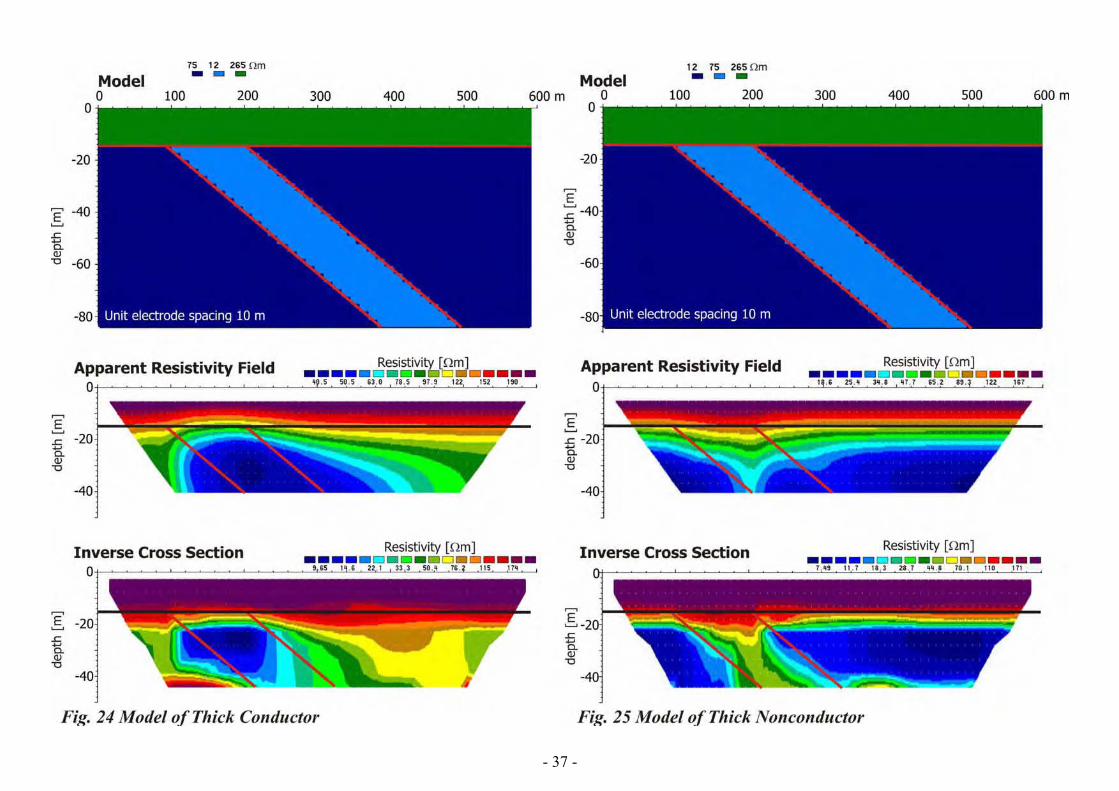
The oblique thick conductor (Fig. 24)It can be clearly seen on this model how the resistivity of the underlying rocks changes the pattern of the contours of resistivity and hence how it visually distorts not a quite professional interpretation of the measurement of electrical resistivity tomography. For example, the difference in the base of the layer, 115 ohm-meters, is six meters. It is thus always necessary in the interpretation of inverse sections to take account of the geological regularities and the character of geoelectric boundaries.
- 34 -
- 35 -
- 36 -
The conductive layer itself is not indicated to a depth of 40 meters in such intensity as is just below the layer of gravels. Neither does the pattern of the anomaly enable the angle of the dip of the conductive layer to be interpreted. The field of resistivity in the remaining part of the bedrock strongly fluctuates changing from 55 to more than 200 ohm-meters. It can be inferred from this fact that the character of the rock medium cannot be precisely described from the distribution of resistivity in the bedrock.
The oblique thick non-conductor (Fig. 25)The conclusions drawn from the modeling of this case are similar as with modeling the vertical non-conductor. The measured
resistivity reaches nowhere near the size of resistivity set in the model. The base of gravels plotted using a simple estimate would be about 10 meters deeper than is the set depth in the model. The field of resistivity outside the anomalous body is smoother than it was in the preceding case. The real value of resistivity (or smaller) was interpreted roughly in the middle of the length of the area under investigation. It is interesting that the interpreted minimum values of resistivity are roughly half the values set in the model.
Two conductive layers (Fig. 26) The base of gravels here lies slightly above the inflection point of resistivity changes. The beginning of the “claystone” layers is
indicated by a jump in the smooth pattern of the iso-ohm of about 80 ohm-meters (yellow color), just as by the anomalies of resistivitybelow 40 ohm-meters (blue color). The resistivity values of the “claystone” layer do not reach its real resistivity – 12 ohm-meters – in anypoint. The resistivity values of conglomerate correspond roughly to the reality. The indication of the dipping of the “claystone” layers to greater depths is not distinct and it will not be possible to determine it in practical field measurements. The reason is changes in the resistivity of the conglomerate formation, which will fully disguise changes caused by the “claystone” layer. The only indication by which it can be possible to determine at least the direction of the dip of layers is the pattern of resistivity in the horizontal direction. Here it applies that the changes in resistivity are substantially more gradual in the direction of the dip than in the direction in which the “claystones” do not continue.
One conductive oblique layer and one vertical layer (Fig. 27) The same what has been said in the preceding model applies to the determination of the base of gravels. The difference in the indication of the oblique conductor and the vertical conductor is also clear. The low-resistivity anomaly above the oblique conductor is prolonged along its dip, whereas the anomaly above the vertical conductor is narrow and symmetrical by the vertical axis. However, in the vertical conductor, the value of the interpreted resistivity does not reach the set quantity at all; the minimum value is about three times larger than the set value.
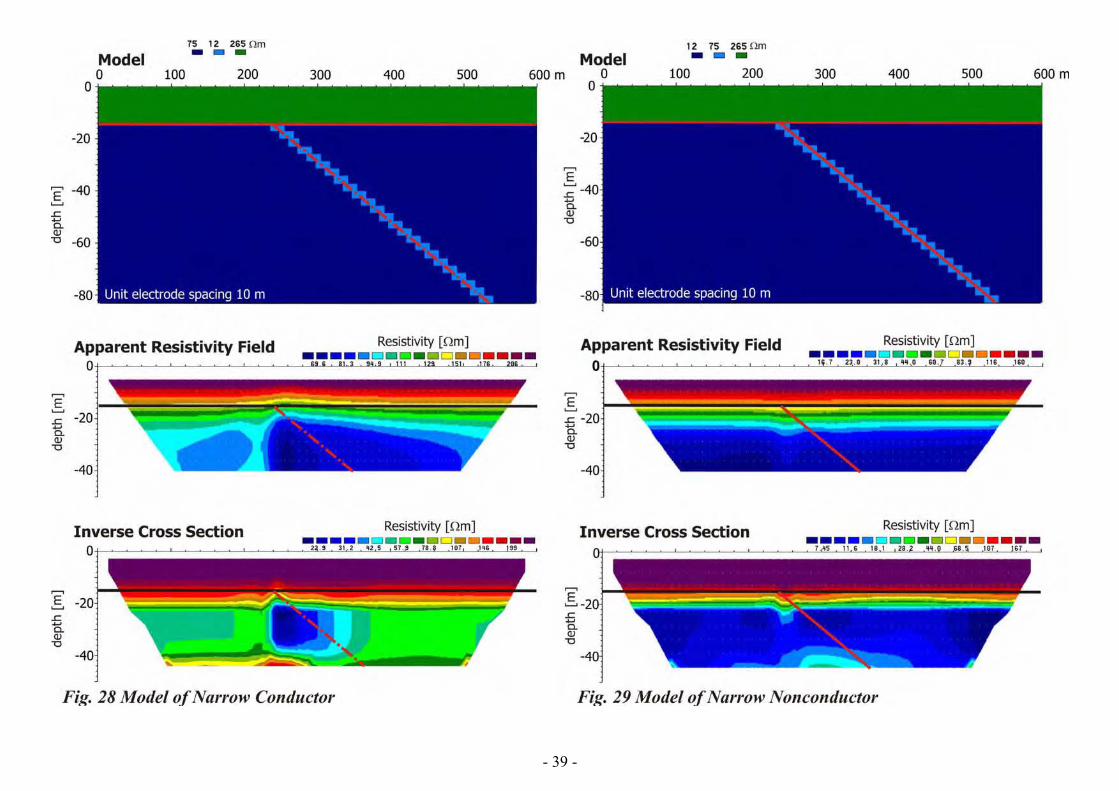
The single conductive layer (Fig. 28) The beginning of the “claystone” layer in the bedrock corresponds to the real position of this layer on the model. However, the
graphic output of the modeling clearly shows that it is not possible to determine the real dip of this layer from the results obtained from the ERT method. It is interesting that the resistivities increase at the base of the area under investigation. According to the set model, this effect has no justification and is only a certain response resulting from the principle of indirect survey methods.
- 37 -

- 38 -
- 39 -
- 40 -
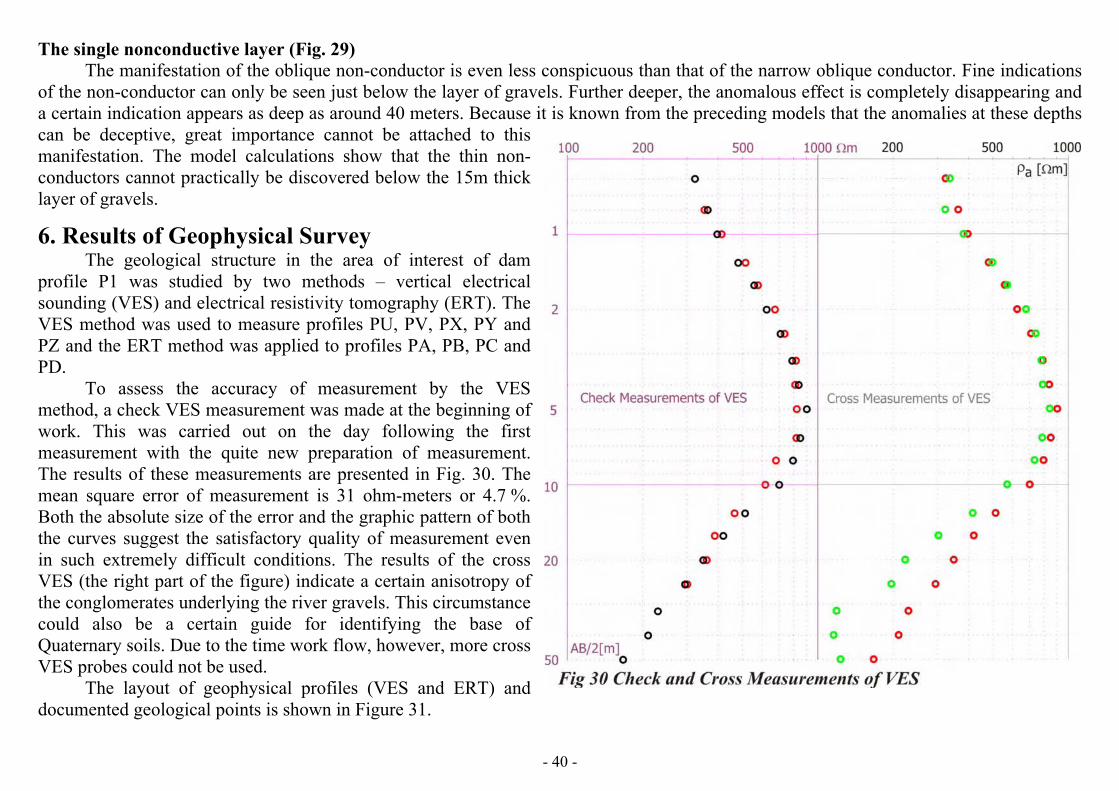
The single nonconductive layer (Fig. 29) The manifestation of the oblique non-conductor is even less conspicuous than that of the narrow oblique conductor. Fine indications
of the non-conductor can only be seen just below the layer of gravels. Further deeper, the anomalous effect is completely disappearing and a certain indication appears as deep as around 40 meters. Because it is known from the preceding models that the anomalies at these depths can be deceptive, great importance cannot be attached to this manifestation. The model calculations show that the thin non-conductors cannot practically be discovered below the 15m thick layer of gravels.
6. Results of Geophysical Survey The geological structure in the area of interest of dam
profile P1 was studied by two methods – vertical electrical sounding (VES) and electrical resistivity tomography (ERT). The VES method was used to measure profiles PU, PV, PX, PY and PZ and the ERT method was applied to profiles PA, PB, PC and PD.
To assess the accuracy of measurement by the VES method, a check VES measurement was made at the beginning of work. This was carried out on the day following the first measurement with the quite new preparation of measurement. The results of these measurements are presented in Fig. 30. The mean square error of measurement is 31 ohm-meters or 4.7 %. Both the absolute size of the error and the graphic pattern of both the curves suggest the satisfactory quality of measurement even in such extremely difficult conditions. The results of the cross VES (the right part of the figure) indicate a certain anisotropy of the conglomerates underlying the river gravels. This circumstance could also be a certain guide for identifying the base of Quaternary soils. Due to the time work flow, however, more cross VES probes could not be used.
The layout of geophysical profiles (VES and ERT) and documented geological points is shown in Figure 31.
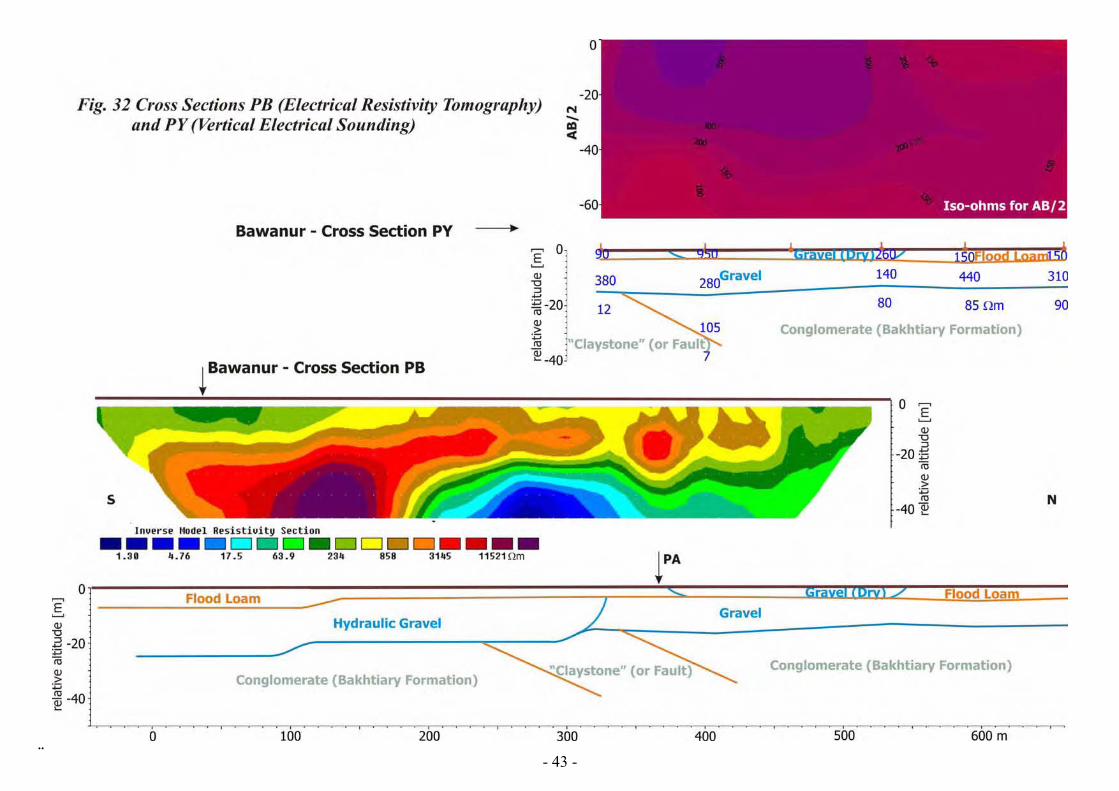
Profiles PY and PB (Fig. 32) Both of them followed roughly through the middle of the floodplain of the Sirwan River. They run along the easternmost course of
this river (Fig. 32). VES measurements prevail in the northern section of the profile, ERT measurements in the southern section. The results obtained from resistivity sounding methods show that the thickness of gravels increases toward the south, from about 15 meters to25 meters. The uppermost layer of the river terrace sediments consists of flood loams and gravels that can occur practically as much with no admixture as with a high content of loam.
Beneath the terrace, sedimentary rocks were identified both conglomerates and “claystones”. The occurrence of a layer of claystoneswas confirmed by both of the geoelectrical methods and this layer was also identified by perpendicular profile PA (see below). Theresistivity values of the “claystones” vary around 10 ohm-meters.
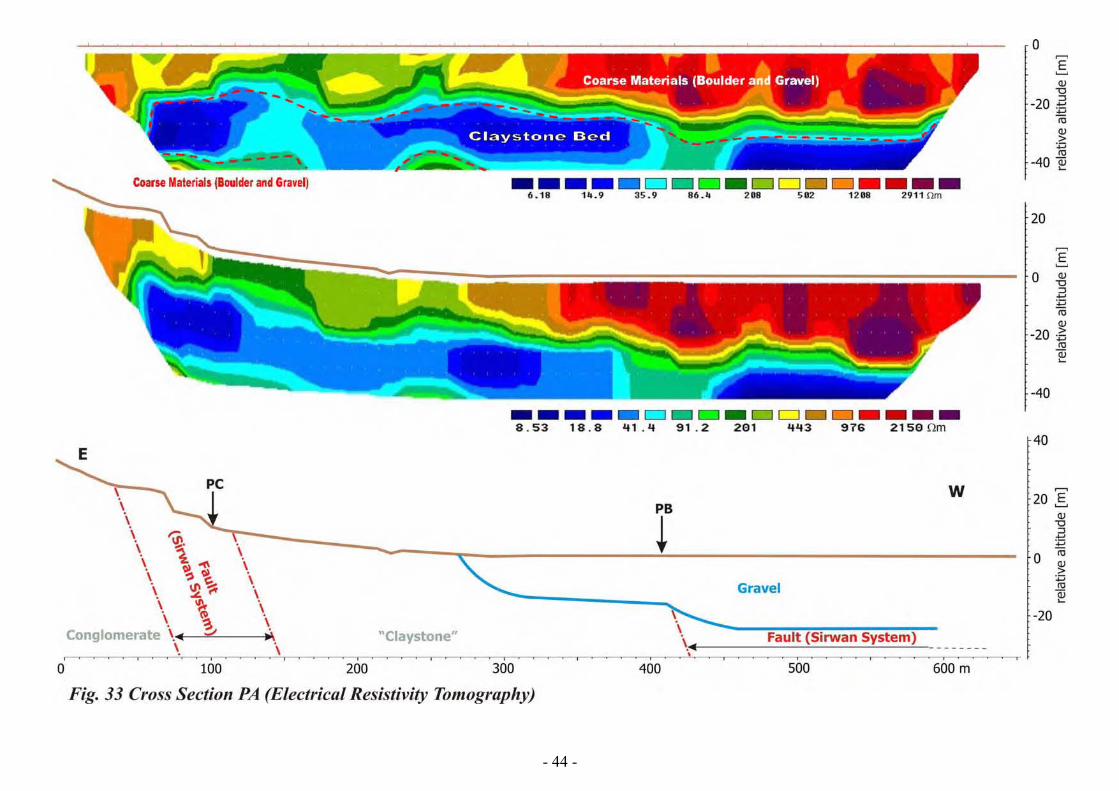
Profile PA (Fig. 33) The profile followed through the valley of the Sirwan River and was measured only by the ERT method. The beginning of the profile
is on the left bank of the main course of the Sirwan River by the right side of the main valley. Beneath the current course of the Sirwan River, the thickness of gravels increases up to about 25 meters, i.e. it is the similar thickness that was also identified at the southern end of profile PB. The gravels beneath the main course of the river show high resistivity values along their whole thickness, i.e. they are pure, with no clayey admixture. This means that this part of the terrace will be highly permeable. The increased thickness of gravels is most likely caused by a tectonic fracturing of the underlying rocks. The thickness of the fractured zone of the major tectonic direction of the course of the Sirwan River will be at least 400 meters. Another fracture, probably accompanying the main zone, was identified at the eastern edge of the profile. It is the fracture which was already described above in the text regarding profile PC.
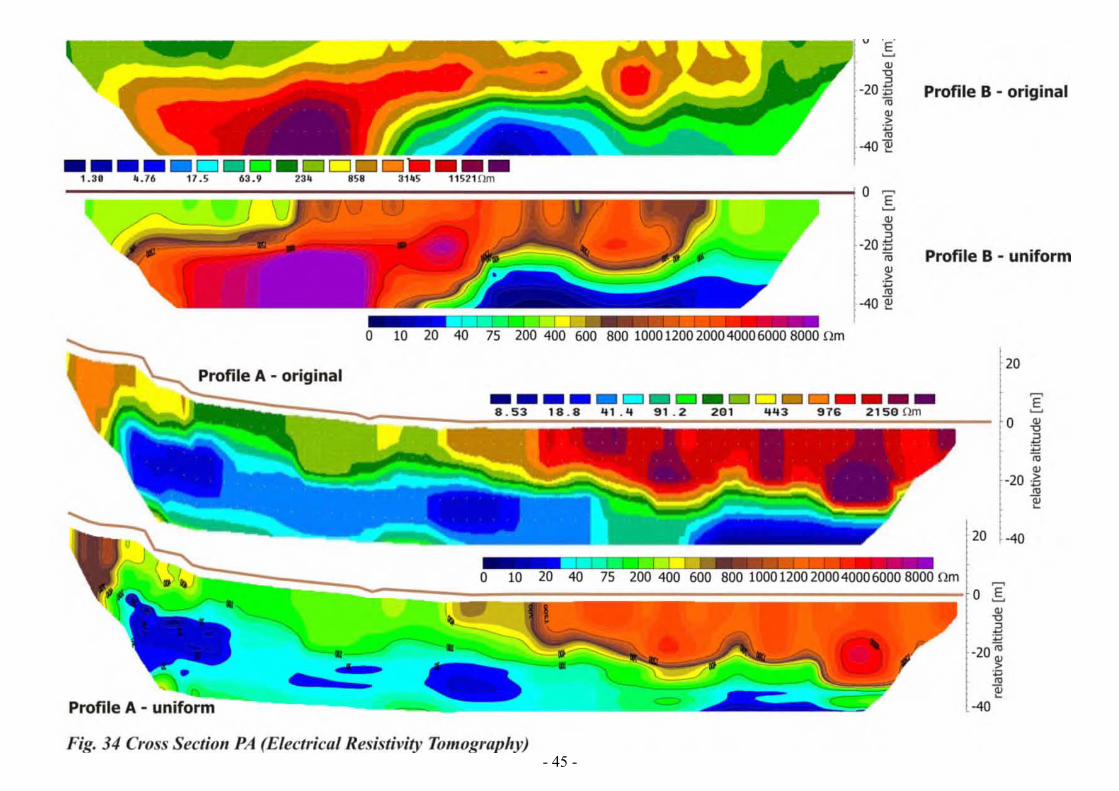
As already described at the beginning of this chapter, the conversion of the interpreted values to the contours of resistivity has a great effect on the resulting field of resistivity. Fig. 34 shows the comparison of the original contours obtained using the program RES2DINV by the Kurdish colleagues, having a uniform range of resistivity compiled by the Czech research team. The pattern of the contours along both the profiles shows that the essential results of both the methods are identical, but both the systems differ in details.
Based on all of the geophysical measurements and their geological interpretation, an engineering-geological section (PII) through the dam site was constructed (Fig. 35).
7. ConclusionThis paper is concerned with the problems of geoelectric measurements in arid regions, in the places with insufficient base maps. The
experience gained shows that at the present time it is possible to work without problems also at the sites for which practically no maps are available. Satellite imagery with high resolution, the possibility to use digital models of earth surface and fieldwork with modern laser range finders fully substitutes the lack of base maps. In our case it has turned out that the images from the Worldview2 satellite give better “geodetic background information” than classical maps.
- 41 -

- 42 -
- 43 -¨
- 44 -
- 45 -

- 46 -
rst
inant
,
HORSKÝ O., BLÁHA P.: Inženýrskogeologický pr�zkum pro p�ehrady (in Czech, The Application of Engineering Geology to Dam Construction), Repronis, Ostrava, 2009, ISBN 978-80-7329-207-2, p. 1-224.
LJACHOVICKIJ, P. M. – CHMELEVSKOJ, V. K. – JAŠ�ENKO, Z. G.: Inženernaja geofyzika, Moskva: Nedra, 1989, s. 1 – 145.
The extreme long drought and the ground surface practically with no loamy cover required introducing a new system of electrode earthing. After a certain struggle, the conventional system of penetrating electrodes was used together with pouring them with a thin salt loamy mixture. This method of measurement enabled the fieldwork to be successfully completed.
The combination of both the methods of geoelectrical sounding enabled the good background information to be provided for the fidesigns of the dam at the Bawanur P1 dam site. It was successful to determine the areas of the Quaternary sediments, mainly gravels, less flood loams. It was equally possible in the bedrock to distinguish the areas with predominant conglomerates from those with predomclaystones.
References: BLÁHA, P. – MÜLLER, K.: Application of Geophysical Methods in Geotechnic and Construction, Praha: EGRSE, 2003, 1 – 2. BLÁHA, P. – �ERNÝ, V. – DURAS, R. – FOUSEK, J. – HORSKÝ, O. – NOVOTNÁ, J. – OPRCHAL, J. – TÁBOÍK, P. – ALI, P. – AZIZ, B., “BAWANUR”
Feasibility Study & Design for Bawanur Dam & Garmian Irrigation Canal in Garmian, Phase 1 – Feasibility Study Report, 4. Geology Study Report, CREA, Brno, 2010, MS.
BUDAY T. – TYRACEK J.: The Regional Geology of Iraq – stratigraphy and paleontology, (Ed. Kassab I.M., Saad Z. J.), Baghdad, 1980, GARCÍA YAGÜE, A.: Temas de Geología aplicada a las Obras Públicas, Madrid: Colegio de I.C.C. y P, 2000. GELDART L. P., SHERIFF R. E., TELFORD W. M.: Applied Geophysics – Second Edition, Press Syndicate of the University of Cambridge, Melbourne, 1990. GOODMAN, R. E. :Engineering Geology, John Wiley & Sons, 1993.
- 47 -
LOKE, M. H. RES2DMOD ver. 3.01: Rapid 2D resistivity forward modelling using the finite difference and finite-element methods, Software manual, (C)2002.LOKE, M. H., BARKER, R. D.: Rapid least-square inversion of apparent resistivity pseudosections by a quasi-Newton method, Geophysical Prospecting, Vol. 44,
1996, p. 131–152 LOVRIE, W. Fundamentals of Geophysics, Second edition, Cambridge: University Press, 2007. MASSARCH, K. R.: Geophysical Methods for Geotechnical, Geoenvironment and Geodynamic Site Characterization, Melbourne: Contribution on 3rd
IWAGRSE, 2000. VALLEJO, G. L.: Ingeniería Geológica. Madrid: Pearson Educación, 2002, WALTHAM, A. C.: Foundations of Engineering Geology, Blackie Academic & Professional, 1995. WEST, T. R.: Geology Applied to Engineering, New Jersey: Prentice Hall, 1995. SAAD Z. J., GOFF J. C.: Geology of Iraq, Dolin, Prague, 2006. STEVANOVIC Z., MARKOVIC M.: Hydrogeology of Northern Iraq, FAO, Rome, 2004. ZIN�ENKO, V. S. – KOZAK, N. M.: Osnovy geofyzi�eskich metodob issledovanij, Moskva: RGGU, 2005.
Literature of organizations and companies:1. Code of Practice for Subsurface Exploration for Earth and Rockfill Dams, Bureau of Indian Standards, Doc. WRD 05(451), 2006.2. GISAT News No.67 (III/2009).
Electronic literature:http://www.satimagingcorp.com/satellite-sensors/worldview-2.html http://www.gisat.cz, http://asterweb.jpl.nasa.gov
Authors:1 Doc. RNDr. Pavel Bláha DrSc., Geotest, a.s., 106 00 Praha 10, Švehlova 26, [email protected] Ing. Vít �erný, Geotest, a.s., 659 01 Brno, Šmahova 112, [email protected] 3 Ing. Roman Duras, Geotest, a.s., 709 00 Ostrava, 28. �íjna 287, [email protected] 4 Ing. Jan Fousek, Geotest, a.s., 659 01 Brno, Šmahova 112, [email protected] Ing. Otto Horský CSc., EGT, 631 00 Brno, B�enkova 28, [email protected] Ing. Milan Lazecký, VŠB TUO, 708 33 Ostrava, 17. listopadu 1733, [email protected] 7 Mgr. Jan Oprchal, Geotest, a.s., 659 01 Brno, Šmahova 112, [email protected] 8 RNDr. Petr Tábo�ík, Ostravská universita – P�írodov�decká fakulta, 30. dubna 22, [email protected] M. Ali Peshawa, Dr., Ph.D., University of Sulaymaniyah, [email protected] 10 Bakhtiar Q. Aziz, Assist. Prof. Dr. Aziz, Ph.D., University of Sulaymaniyah, [email protected]