Geodetic measurements of vertical crustal velocity …smalley/electronic pubs...Geodetic...
11
Geodetic measurements of vertical crustal velocity in West Antarctica and the implications for ice mass balance Michael Bevis and Eric Kendrick School of Earth Sciences, Ohio State University, 275 Mendenhall Laboratory, 125 South Oval Mall, Columbus, Ohio 43210, USA ([email protected]) Robert Smalley Jr. Center for Earthquake Research and Information, University of Memphis, 3876 Central Avenue, Ste. 1, Memphis, Tennessee 38152, USA Ian Dalziel Institute for Geophysics, University of Texas at Austin, J. J. Pickle Research Campus, Building 196, 10100 Burnet Road (R2200), Austin, Texas 78758-4445, USA Dana Caccamise School of Earth Sciences, Ohio State University, 275 Mendenhall Laboratory, 125 South Oval Mall, Columbus, Ohio 43210, USA Ingo Sasgen Deutsches GeoForschungsZentrum, Telegrafenberg, A20 323, D-14473 Potsdam, Germany Michiel Helsen Institute for Marine and Atmospheric Research, Utrecht University, Princetonplein 5, 3584 CC Utrecht, P.O. Box 8000, NL-3508 TA Utrecht, Netherlands F. W. Taylor Institute for Geophysics, University of Texas at Austin, J. J. Pickle Research Campus, Building 196, 10100 Burnet Road (R2200), Austin, Texas 78758-4445, USA Hao Zhou, Abel Brown, David Raleigh, Michael Willis, Terry Wilson, and Stephanie Konfal School of Earth Sciences, Ohio State University, 275 Mendenhall Laboratory, 125 South Oval Mall, Columbus, Ohio 43210, USA [1] We present preliminary geodetic estimates for vertical bedrock velocity at twelve survey GPS stations in the West Antarctic GPS Network, an additional survey station in the northern Antarctic Peninsula, and eleven continuous GPS stations distributed across the continent. The spatial pattern of these velocities is not consistent with any postglacial rebound (PGR) model known to us. Four leading PGR models appear to be overpredicting uplift rates in the Transantarctic Mountains and West Antarctica and underpredicting them in the peninsula north of 65°. This discrepancy cannot be explained in terms of an elastic response to modern ice loss (except, perhaps, in part of the peninsula). Therefore, our initial geodetic results suggest that most GRACE ice mass rate estimates, which are critically dependent on a PGR correction, are systematically biased and are overpredicting ice loss for the continent as a whole. G 3 G 3 Geochemistry Geophysics Geosystems Published by AGU and the Geochemical Society AN ELECTRONIC JOURNAL OF THE EARTH SCIENCES Geochemistry Geophysics Geosystems Article Volume 10, Number 10 13 October 2009 Q10005, doi:10.1029/2009GC002642 ISSN: 1525-2027 Click Here for Full Article Copyright 2009 by the American Geophysical Union 1 of 11
Transcript of Geodetic measurements of vertical crustal velocity …smalley/electronic pubs...Geodetic...
Geodetic measurements of vertical crustal velocityin West Antarctica and the implications for ice mass balance
Michael Bevis and Eric KendrickSchool of Earth Sciences, Ohio State University, 275 Mendenhall Laboratory, 125 South Oval Mall, Columbus, Ohio43210, USA ([email protected])
Robert Smalley Jr.Center for Earthquake Research and Information, University of Memphis, 3876 Central Avenue, Ste. 1, Memphis,Tennessee 38152, USA
Ian DalzielInstitute for Geophysics, University of Texas at Austin, J. J. Pickle Research Campus, Building 196, 10100 Burnet Road(R2200), Austin, Texas 78758-4445, USA
Dana CaccamiseSchool of Earth Sciences, Ohio State University, 275 Mendenhall Laboratory, 125 South Oval Mall, Columbus, Ohio43210, USA
Ingo SasgenDeutsches GeoForschungsZentrum, Telegrafenberg, A20 323, D-14473 Potsdam, Germany
Michiel HelsenInstitute for Marine and Atmospheric Research, Utrecht University, Princetonplein 5, 3584 CC Utrecht, P.O. Box 8000,NL-3508 TA Utrecht, Netherlands
F. W. TaylorInstitute for Geophysics, University of Texas at Austin, J. J. Pickle Research Campus, Building 196, 10100 Burnet Road(R2200), Austin, Texas 78758-4445, USA
Hao Zhou, Abel Brown, David Raleigh, Michael Willis, Terry Wilson,and Stephanie Konfal
School of Earth Sciences, Ohio State University, 275 Mendenhall Laboratory, 125 South Oval Mall, Columbus, Ohio43210, USA
[1] We present preliminary geodetic estimates for vertical bedrock velocity at twelve survey GPS stationsin the West Antarctic GPS Network, an additional survey station in the northern Antarctic Peninsula, andeleven continuous GPS stations distributed across the continent. The spatial pattern of these velocities isnot consistent with any postglacial rebound (PGR) model known to us. Four leading PGR models appearto be overpredicting uplift rates in the Transantarctic Mountains and West Antarctica and underpredictingthem in the peninsula north of 65�. This discrepancy cannot be explained in terms of an elastic response tomodern ice loss (except, perhaps, in part of the peninsula). Therefore, our initial geodetic results suggestthat most GRACE ice mass rate estimates, which are critically dependent on a PGR correction, aresystematically biased and are overpredicting ice loss for the continent as a whole.
G3G3GeochemistryGeophysics
Geosystems
Published by AGU and the Geochemical Society
AN ELECTRONIC JOURNAL OF THE EARTH SCIENCES
GeochemistryGeophysics
Geosystems
Article
Volume 10, Number 10
13 October 2009
Q10005, doi:10.1029/2009GC002642
ISSN: 1525-2027
ClickHere
for
FullArticle
Copyright 2009 by the American Geophysical Union 1 of 11
Components: 5670 words, 5 figures, 1 table.
Keywords: geodesy; geodynamics; postglacial rebound; GPS; GRACE; ice mass balance.
Index Terms: 1240 Geodesy and Gravity: Satellite geodesy: results (6929, 7215, 7230, 7240); 1211 Geodesy and Gravity:
Non-tectonic deformation; 1218 Geodesy and Gravity: Mass balance (0762, 1223, 1631, 1836, 1843, 3010, 3322, 4532).
Received 20 May 2009; Revised 31 July 2009; Accepted 28 August 2009; Published 13 October 2009.
Bevis, M., et al. (2009), Geodetic measurements of vertical crustal velocity in West Antarctica and the implications for ice
mass balance, Geochem. Geophys. Geosyst., 10, Q10005, doi:10.1029/2009GC002642.
1. Introduction
[2] The GRACE satellite mission, which measurestemporal changes in Earth’s gravity field, can infernear-surface mass changes with unprecedentedprecision, but in Antarctica (as in Greenland) theseestimates are unusually ambiguous, becauseGRACE cannot distinguish between changes inice mass and nearby changes in rock mass associ-ated with postglacial rebound (PGR) [Le Meur andHuybrechts, 2001; Velicogna and Wahr, 2002].Therefore, numerical models of PGR are usedduring or after the analysis of GRACE observa-tions to account for the viscous influx of rock massinto the study area, and thereby isolate the changesin ice mass [Velicogna and Wahr, 2006; Chen etal., 2006; Ramillien et al., 2006, Sasgen et al.,2007a]. Over much of Antarctica, this ‘‘PGRcorrection’’ is larger than the resulting estimate ofice mass change, sometimes much larger [Velico-gna and Wahr, 2006]. This vulnerability is worry-ing because there are many disparate predictionsfor contemporary uplift rates in Antarctica, andlittle really firm basis for choosing between them.For example, we contrast the predictions of PGRmodels ICE-5G (VM2) [Peltier, 2004] and IJ05(6A) [Ivins and James, 2005, see Figure 6A] inFigure 1. These disagreements are not surprising,since PGR models are based on (1) an ice historymodel and (2) a geomechanical model (parameter-ized in terms of the thickness of the lithosphere, theunderlying mantle viscosity structure, etc.), neitherof which are strongly constrained by observations.Indeed, because PGR beneath and adjacent to anactively evolving ice sheet is sensitive to the detailsof crustal and mantle rheology, and these detailsare not known with the necessary level of accuracy,many theorists produce suites of PGR predictionsby combining a single ice history model with a setof geomechanical scenarios [Ivins and James,2005; Wang et al., 2008]. Predictions of PGR canbe improved by reducing the underlying uncertain-
ties in rock rheology (e.g., using seismology) andice history (e.g., using glacial geomorphology andstratigraphy). They can also be tested and im-proved by utilizing geodetic observations of crustalmotion [Milne et al., 2004], which is our approach.
2. Geodetic Measurements
[3] Between late 2001 and early 2006, the WestAntarctic GPS Network (WAGN, also known asProject WAGN) constructed a network of 18 bed-rock GPS stations (W01–W18) on nunataks acrossvarious parts of West Antarctica and along theTransantarctic Mountains (TAM) between the Rossand Weddell seas. It also reoccupied preexistingsurvey markers MBL1 [Donnellan and Luyendyk,2004] (near W12) and HAAG (near W15)(Figures 2 and 3). We use the term ‘‘WAGN area’’to describe the extent of this network, i.e., toindicate the TAM plus West Antarctica minus theAntarctic Peninsula. Two survey markers wereinstalled at all WAGN sites, except at sites W06,W12 and W15, and both monuments (designated Aand B) were observed simultaneously whenevercircumstances allowed. The WAGN survey marker,a level steel plate bolted into bedrock, serves as anoriented mounting surface for a custom-designed,fixed height antenna mast. This design reducesantenna setup noise to negligible levels, and allowsany WAGN station to be upgraded to a continuousreference station without changing the position ofthe GPS antenna. This upgrade process began dur-ing the 2007/08 field season as part of the new PolarEarth Observing Network (POLENET) project. Sofar only twelve of the WAGN sites (includingHAAG and MBL1) have been observed over a totaltime span of 3 years or more, thereby allowinguseful vertical velocity estimates to be formed.
[4] All WAGN data were incorporated into a muchlarger time series of observations from >240 con-tinuous GPS (CGPS) stations selected from the
GeochemistryGeophysicsGeosystems G3G3
bevis et al.: vertical crustal velocity in antarctica 10.1029/2009GC002642
2 of 11

global tracking network of the International GNSSService. This global time series extended fromJanuary 1996 through March 2008. We usedGAMIT/GLOBK software [Herring et al., 2006]to estimate a daily network polyhedron and aconsistent set of GPS satellite orbital solutions,both expressed in the ITRF 2005 reference frame.This software incorporates ‘‘absolute’’ models ofphase center variation for each satellite antenna.We then used a generalized Helmhert transforma-tion [Kendrick et al., 2001] to shift our stationposition time series into a reference frame whichwas realized by simultaneously minimizing (1) thehorizontal velocities of a set (HREF) of 11 CGPSstations located within the Antarctic plate and(2) the vertical velocities of a set (VREF) of202 CGPS stations almost entirely located between60� N and 60� S (Figure 2). After this transforma-
tion is achieved, the RMS horizontal velocity of theHREF stations is 1.0 mm/yr, and the RMS verticalvelocity of the VREF stations is 0.6 mm/yr.
[5] The vertical reference set VREF was selectedbecause nearly all global PGR models indicate thatvery little net vertical motion occurs in the area (the‘‘VREF zone’’) sampled by these stations. Eventhough northern North America, Greenland, north-ern Eurasia, southern Patagonia and Antarctica areall moving upward on average (due to PGR), andso there must be a net downward movement in theintervening areas, the total area of continent un-dergoing moderate or rapid rates of uplift is sosmall in relation to that of the rest of the world thatsubsidence typically occurs with a velocity whichis small compared to the peak rates of uplift. Inparticular, the average vertical velocity predicted
Figure 1. The rates of crustal uplift predicted by the PGR models IJ05 (6A) and ICE-5G (VM2). The red arrowsand boxes depict the geodetic vertical velocity solutions (in mm/yr) and their 95% confidence intervals. The rates ofpurely elastic uplift (mm/yr) predicted for each site are shown in brackets. The blue area shows the continent to adepth of 2000 m. The gray areas indicate floating ice sheets.
GeochemistryGeophysicsGeosystems G3G3
bevis et al.: vertical crustal velocity in antarctica 10.1029/2009GC002642bevis et al.: vertical crustal velocity in antarctica 10.1029/2009GC002642
3 of 11
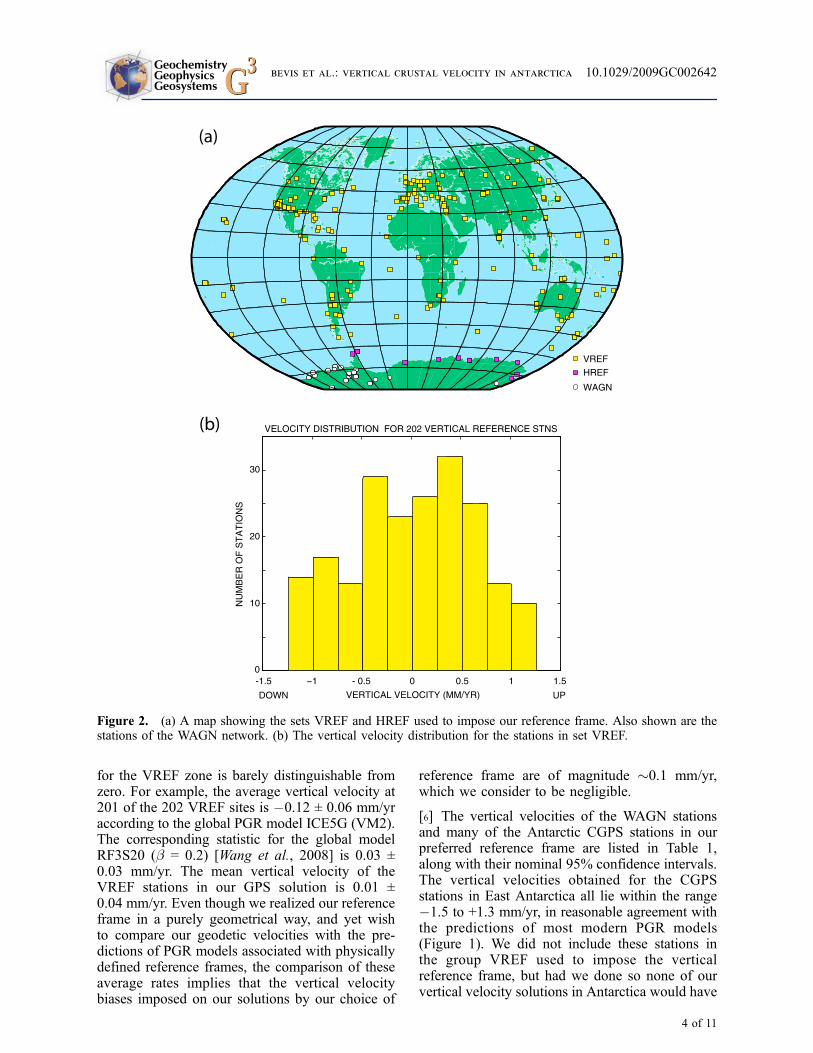
for the VREF zone is barely distinguishable fromzero. For example, the average vertical velocity at201 of the 202 VREF sites is �0.12 ± 0.06 mm/yraccording to the global PGR model ICE5G (VM2).The corresponding statistic for the global modelRF3S20 (b = 0.2) [Wang et al., 2008] is 0.03 ±0.03 mm/yr. The mean vertical velocity of theVREF stations in our GPS solution is 0.01 ±0.04 mm/yr. Even though we realized our referenceframe in a purely geometrical way, and yet wishto compare our geodetic velocities with the pre-dictions of PGR models associated with physicallydefined reference frames, the comparison of theseaverage rates implies that the vertical velocitybiases imposed on our solutions by our choice of
reference frame are of magnitude �0.1 mm/yr,which we consider to be negligible.
[6] The vertical velocities of the WAGN stationsand many of the Antarctic CGPS stations in ourpreferred reference frame are listed in Table 1,along with their nominal 95% confidence intervals.The vertical velocities obtained for the CGPSstations in East Antarctica all lie within the range�1.5 to +1.3 mm/yr, in reasonable agreement withthe predictions of most modern PGR models(Figure 1). We did not include these stations inthe group VREF used to impose the verticalreference frame, but had we done so none of ourvertical velocity solutions in Antarctica would have
Figure 2. (a) A map showing the sets VREF and HREF used to impose our reference frame. Also shown are thestations of the WAGN network. (b) The vertical velocity distribution for the stations in set VREF.
GeochemistryGeophysicsGeosystems G3G3
bevis et al.: vertical crustal velocity in antarctica 10.1029/2009GC002642
4 of 11
changed by more than 0.1 mm/yr. In this sense ourvertical reference frame is robust. It is gratifying, ifsomewhat surprising, to note that if we utilized alocal (‘‘cratonic’’) reference frame ‘‘attached’’ toEast Antarctica, our vertical velocity estimateswould remain almost unchanged.
[7] The horizontal velocities observed at theWAGN stations, HAAG, and MBL1 are every-where small (their RMS value is just 1.6 mm/yr)supporting previous suggestions that almost theentire Antarctic continent constitutes part of asingle tectonic plate [Donnellan and Luyendyk,2004; Dietrich et al., 2004]. We shall discuss these
modest horizontal movements elsewhere. We notethat all nearly collocated (‘‘A’’ and ‘‘B’’) stationshave no significant relative horizontal velocities,implying that the rocks into which these monu-ments were set are not locally unstable. The A andB monuments are typically 5–15 m apart.
[8] Redundant determinations of vertical velocitywere made at sites W01–W05, and W07, and theseall agree well except for the pair at W02 (PecoraEscarpment). The stations MBL1 and W12A arenearly colocated, and only slightly discrepant. Wesuspect that the velocity estimate at W02B wasbiased downward because the second (and last)
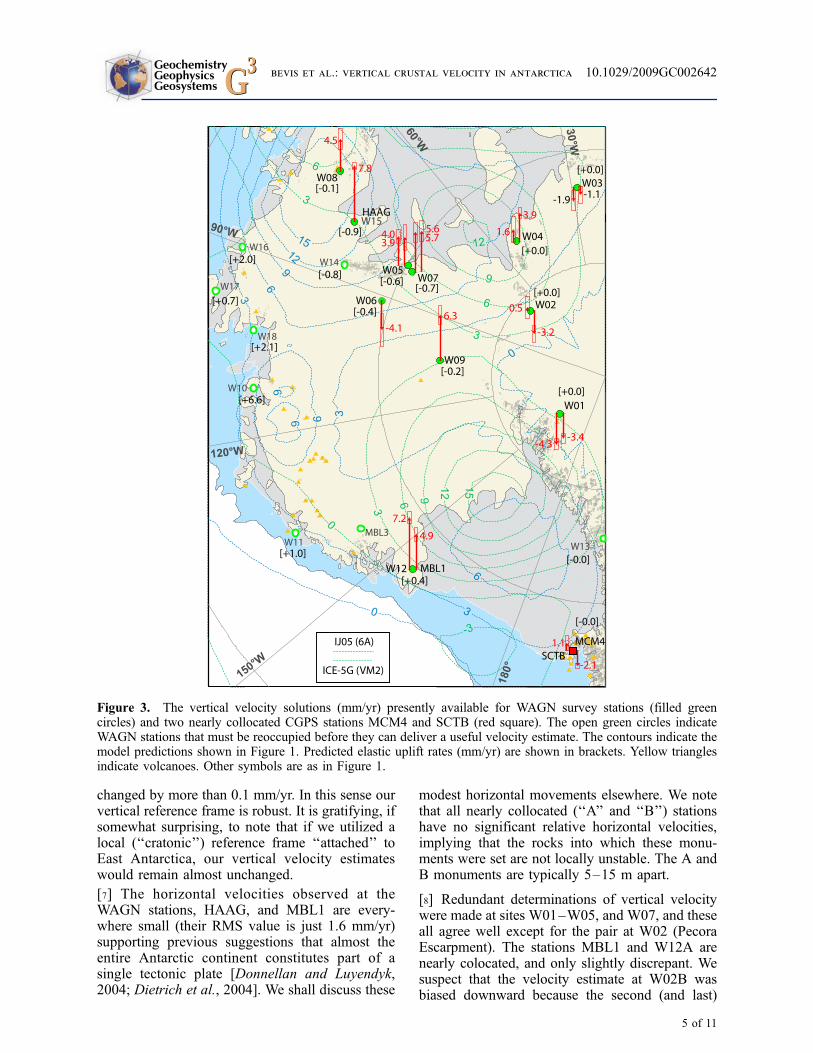
Figure 3. The vertical velocity solutions (mm/yr) presently available for WAGN survey stations (filled greencircles) and two nearly collocated CGPS stations MCM4 and SCTB (red square). The open green circles indicateWAGN stations that must be reoccupied before they can deliver a useful velocity estimate. The contours indicate themodel predictions shown in Figure 1. Predicted elastic uplift rates (mm/yr) are shown in brackets. Yellow trianglesindicate volcanoes. Other symbols are as in Figure 1.
GeochemistryGeophysicsGeosystems G3G3
bevis et al.: vertical crustal velocity in antarctica 10.1029/2009GC002642
5 of 11

occupation of this station occurred much earlier inthe summer than did the first occupation, and sothe annual oscillation in station height driven byseasonal snow and ice loads ‘‘leaked’’ into thesecular velocity estimate. This aliasing problemcan be significant when the station has beenoccupied only twice, the total observational timespan is 4 years or less, and the phase shifts between
occupation dates are appreciable (�1 month). Thiscombination of factors has occurred at two addi-tional stations (W09A and W012) though theseasonal phase shifts there were considerablysmaller. If our aliasing hypothesis is correct, thenthe velocity at W12A and W09A could be biasedby as much as +1.5 and �1.0 mm/yr, respectively.We will get further insights into this process as
Table 1. Geodetic Solution for the WAGN Stations and Various CGPS Stations in Antarcticaa
Stnm Latitude Longitude Tspan Epochs vu su vel Station Name
East Antarctic StationsDAV1 –68.58 77.97 11.5 2361 –1.4 0.2 –1.1 DavisDAVR –68.58 77.97 5.0 623 –0.9 0.7 –1.1 Davis (same antenna as DAV1)DUM1 –66.67 140.00 9.4 2515 –1.5 0.2 –0.6 Dumont d’UrvilleMAW1 –67.60 62.87 12.2 2489 –0.8 0.2 –0.4 MawsonSYOG –69.01 39.58 12.2 2638 0.6 0.2 0.3 SyowaVESL –71.67 –2.84 9.4 1898 1.3 0.3 –0.5 VesleskarvetCAS1 –66.28 110.52 12.2 2489 0.5 0.2 –0.8 Casey Base
Antarctic Peninsula Stations and Frei BaseOHIG –63.32 –57.90 6.1 629 7.6 1.0 0.9 O’HigginsOHI2 –63.32 –57.90 6.1 1600 7.0 0.7 0.9 O’HigginsOHI3 –63.32 –57.90 5.1 1208 6.5 0.8 0.9 O’HigginsPALM –64.78 –64.05 9.3 2563 4.8 0.3 4.1 Palmer StationSPPT –64.29 –61.05 4.0 5 7.5 1.8 4.5 Spring Point (survey station)FREI –62.19 –58.98 4.8 744 –2.9 0.7 0.6 Frei (not in Antarctic plate)
West Antarctica and the Transantarctic MountainsMCM4 –77.84 166.67 12.2 2694 –2.1 0.4 –0.0 McMurdo CGPSSCTB –77.85 166.76 3.3 1167 1.1 1.0 –0.0 Scott Base CGPSW01A –87.42 –149.43 4.0 16 –4.3 0.8 0.0 Mount HoweW01B –87.42 –149.44 4.0 18 –3.4 0.7 0.0 Mount HoweW02A –85.61 –68.56 6.0 17 0.5 1.5 0.0 Pecora EscarpmentW02B –85.61 –68.56 3.9 7 –3.2 1.2 0.0 Pecora EscarpmentW03A –81.58 –28.40 3.9 7 –1.9 1.4 0.0 Whichaway NunataksW03B –81.58 –28.40 3.9 7 –1.1 1.2 0.0 Whichaway NunataksW04A –82.86 –53.20 3.0 13 1.6 1.8 0.0 Cordiner PeaksW04B –82.86 –53.20 5.1 18 3.9 0.8 0.0 Cordiner PeaksW05A –80.04 –80.56 5.1 54 4.0 1.0 –0.6 Wilson NunataksW05B –80.04 –80.56 3.0 32 3.9 1.8 –0.6 Wilson NunataksW06A –79.63 –91.28 3.0 10 –4.1 2.3 –0.4 Mount JohnsW07A –80.32 –81.43 5.1 50 5.6 1.4 –0.7 Patriot HillsW07B –80.32 –81.54 5.0 18 5.7 1.5 –0.7 Patriot HillsW08A –75.28 –72.18 5.0 23 4.5 1.5 –0.1 Mount Suggs aka Behrendt MountainsW09A –82.68 –104.40 3.0 25 6.3 1.3 –0.2 Whitmore MountainsW12A –78.03 –155.02 4.1 17 7.2 0.8 0.4 Mount PatersonMBL1 –78.03 –155.02 7.1 39 4.9 1.0 0.4 Mount Paterson (JPL), near W12AHAAG –77.04 –78.29 12.0 18 7.8 0.5 –0.9 Haag Nunatak (BAS), near W15
WAGN Sites Presently Without Velocity SolutionsW10 –74.55 –111.88 6.6 Bear PeninsulaW11 –74.78 –136.79 1.0 Cape BurksW13 –83.13 159.51 –0.0 Moody NunatakW14 –77.52 –86.77 –0.8 Howard NunataksW15 –77.04 –78.29 –0.9 Haag NunatakW16 –73.11 –90.30 2.0 Lepley NunatakW17 –72.53 –97.56 0.7 Thurston IslandW18 –74.43 –102.48 2.1 Backer Islands
aListed are the station code, its latitude and longitude, the time span between the first and last station occupations, the number of measurement
epochs, the vertical velocity in mm/yr (positive upward), and its uncertainty (the half-width of the nominal 95% confidence level). Also listed is theestimated rate of purely elastic rebound (vel) in mm/yr. Stnm, four-letter station code.
GeochemistryGeophysicsGeosystems G3G3
bevis et al.: vertical crustal velocity in antarctica 10.1029/2009GC002642
6 of 11
more WAGN stations are converted to CPGSstations. Because strong seasonal (elastic) signalsare often driven by local environmental load cycles[e.g., Bevis et al., 2005], it is not practical to useremote CGPS stations (i.e., the IGS stations) toassess the potential impact of seasonal signalaliasing at WAGN stations occupied only in surveymode.
[9] The CGPS stations at Scott Base (SCTB) andMcMurdo Station (MCM4) are both located on thevolcanically active Ross Island. Although they areonly �2.4 km apart, their vertical velocities aresignificantly different. We infer that MCM4, builton a mound of basaltic gravel, which appears to beengineering fill, is subject to local subsidence.Since SCTB was constructed on bedrock, we preferthis solution despite its shorter observational timespan.
[10] The vertical velocity solutions obtained withinthe WAGN area (Figure 3) are rather surprising.Four stations (W01, W02, W03 and W06) appearto be subsiding in areas where nearly all PGRmodels predict uplift or no appreciable movement,and the uplift rates observed at W04, thoughpositive, are substantially lower than most modelpredictions for this location. The same situationoccurs at CGPS station SCTB at Scott Base. Incontrast, two stations (W12/MBL1 and W09) areuplifting at rates that substantially exceed nearly allmodel predictions. No PGR model known to usmatches our geodetic results. For example, ICE-5G(VM2) greatly overpredicts the uplift rate observedat W04, and IJ05 (6A) greatly overpredicts theuplift rate observed at stations W08 and HAAG.
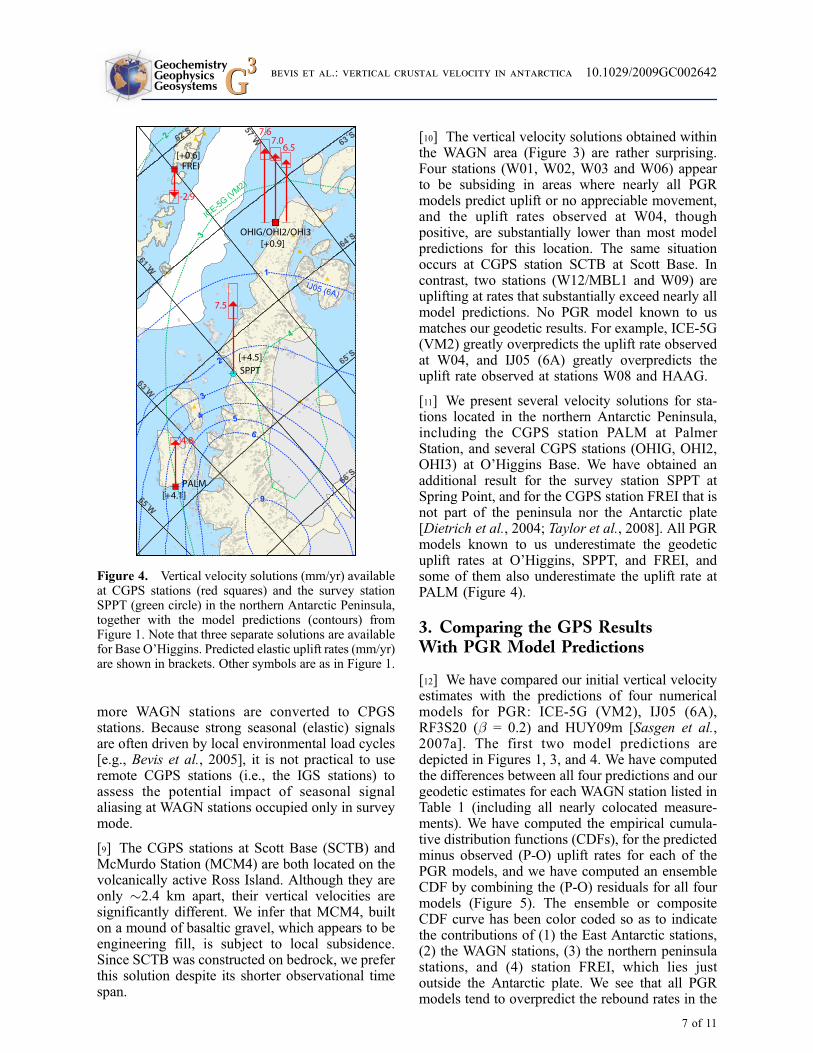
[11] We present several velocity solutions for sta-tions located in the northern Antarctic Peninsula,including the CGPS station PALM at PalmerStation, and several CGPS stations (OHIG, OHI2,OHI3) at O’Higgins Base. We have obtained anadditional result for the survey station SPPT atSpring Point, and for the CGPS station FREI that isnot part of the peninsula nor the Antarctic plate[Dietrich et al., 2004; Taylor et al., 2008]. All PGRmodels known to us underestimate the geodeticuplift rates at O’Higgins, SPPT, and FREI, andsome of them also underestimate the uplift rate atPALM (Figure 4).
3. Comparing the GPS ResultsWith PGR Model Predictions
[12] We have compared our initial vertical velocityestimates with the predictions of four numericalmodels for PGR: ICE-5G (VM2), IJ05 (6A),RF3S20 (b = 0.2) and HUY09m [Sasgen et al.,2007a]. The first two model predictions aredepicted in Figures 1, 3, and 4. We have computedthe differences between all four predictions and ourgeodetic estimates for each WAGN station listed inTable 1 (including all nearly colocated measure-ments). We have computed the empirical cumula-tive distribution functions (CDFs), for the predictedminus observed (P-O) uplift rates for each of thePGR models, and we have computed an ensembleCDF by combining the (P-O) residuals for all fourmodels (Figure 5). The ensemble or compositeCDF curve has been color coded so as to indicatethe contributions of (1) the East Antarctic stations,(2) the WAGN stations, (3) the northern peninsulastations, and (4) station FREI, which lies justoutside the Antarctic plate. We see that all PGRmodels tend to overpredict the rebound rates in the
Figure 4. Vertical velocity solutions (mm/yr) availableat CGPS stations (red squares) and the survey stationSPPT (green circle) in the northern Antarctic Peninsula,together with the model predictions (contours) fromFigure 1. Note that three separate solutions are availablefor Base O’Higgins. Predicted elastic uplift rates (mm/yr)are shown in brackets. Other symbols are as in Figure 1.
GeochemistryGeophysicsGeosystems G3G3
bevis et al.: vertical crustal velocity in antarctica 10.1029/2009GC002642
7 of 11
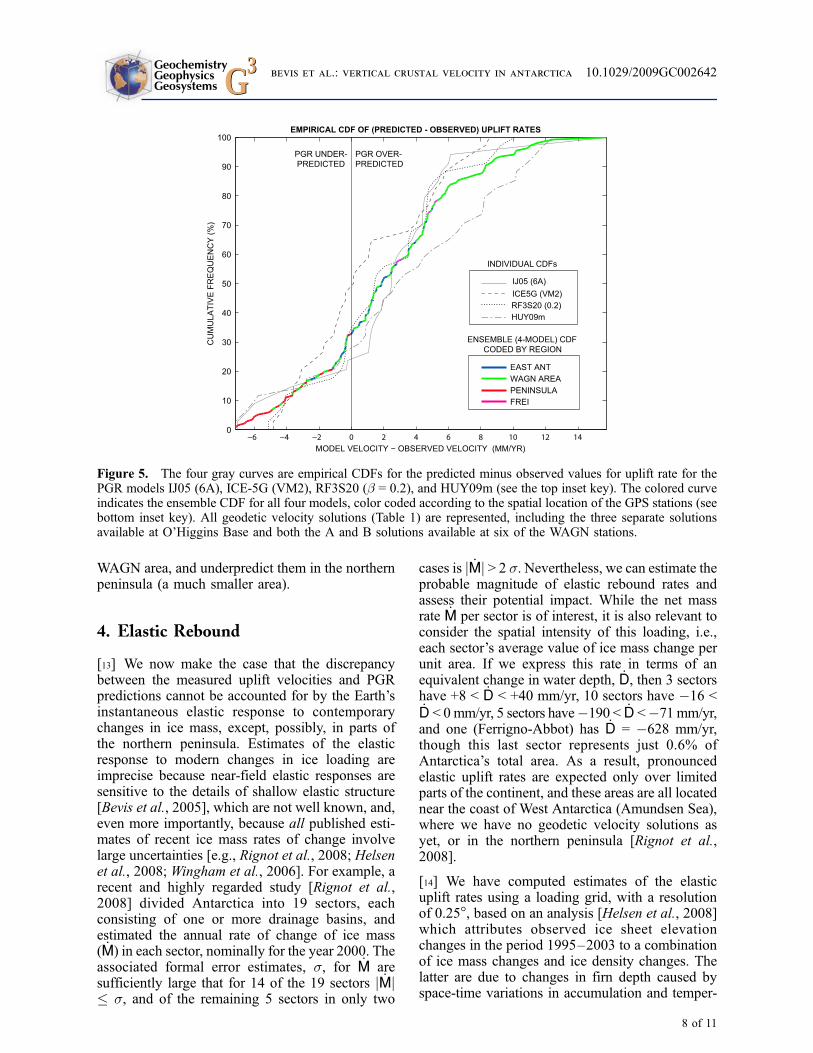
WAGN area, and underpredict them in the northernpeninsula (a much smaller area).
4. Elastic Rebound
[13] We now make the case that the discrepancybetween the measured uplift velocities and PGRpredictions cannot be accounted for by the Earth’sinstantaneous elastic response to contemporarychanges in ice mass, except, possibly, in parts ofthe northern peninsula. Estimates of the elasticresponse to modern changes in ice loading areimprecise because near-field elastic responses aresensitive to the details of shallow elastic structure[Bevis et al., 2005], which are not well known, and,even more importantly, because all published esti-mates of recent ice mass rates of change involvelarge uncertainties [e.g., Rignot et al., 2008; Helsenet al., 2008; Wingham et al., 2006]. For example, arecent and highly regarded study [Rignot et al.,2008] divided Antarctica into 19 sectors, eachconsisting of one or more drainage basins, andestimated the annual rate of change of ice mass( _M) in each sector, nominally for the year 2000. Theassociated formal error estimates, s, for _M aresufficiently large that for 14 of the 19 sectors j _Mj� s, and of the remaining 5 sectors in only two
cases is j _Mj > 2 s. Nevertheless, we can estimate theprobable magnitude of elastic rebound rates andassess their potential impact. While the net massrate _M per sector is of interest, it is also relevant toconsider the spatial intensity of this loading, i.e.,each sector’s average value of ice mass change perunit area. If we express this rate in terms of anequivalent change in water depth, _D, then 3 sectorshave +8 < _D < +40 mm/yr, 10 sectors have �16 <_D < 0mm/yr, 5 sectors have�190 < _D <�71mm/yr,and one (Ferrigno-Abbot) has _D = �628 mm/yr,though this last sector represents just 0.6% ofAntarctica’s total area. As a result, pronouncedelastic uplift rates are expected only over limitedparts of the continent, and these areas are all locatednear the coast of West Antarctica (Amundsen Sea),where we have no geodetic velocity solutions asyet, or in the northern peninsula [Rignot et al.,2008].
[14] We have computed estimates of the elasticuplift rates using a loading grid, with a resolutionof 0.25�, based on an analysis [Helsen et al., 2008]which attributes observed ice sheet elevationchanges in the period 1995–2003 to a combinationof ice mass changes and ice density changes. Thelatter are due to changes in firn depth caused byspace-time variations in accumulation and temper-
Figure 5. The four gray curves are empirical CDFs for the predicted minus observed values for uplift rate for thePGR models IJ05 (6A), ICE-5G (VM2), RF3S20 (b = 0.2), and HUY09m (see the top inset key). The colored curveindicates the ensemble CDF for all four models, color coded according to the spatial location of the GPS stations (seebottom inset key). All geodetic velocity solutions (Table 1) are represented, including the three separate solutionsavailable at O’Higgins Base and both the A and B solutions available at six of the WAGN stations.
GeochemistryGeophysicsGeosystems G3G3
bevis et al.: vertical crustal velocity in antarctica 10.1029/2009GC002642
8 of 11
ature [Helsen et al., 2008]. We modified thisloading field in the northern peninsula by substitutingthe mass rates estimated by Rignot et al. [2004].Using this loading grid, designated H08+, the Earth’selastic response was computed using the spectralmethod of Sasgen et al. [2007b]. For this study weused a spherical harmonic expansion truncated atdegree and order 512, and we adopted the purelyradial structure of PREM [Dziewonski and Anderson,1981] to represent Earth’s elastic structure.
[15] The predicted rates of elastic rebound areindicated for each GPS station in Figures 1, 3, and4. The elastic rebound rates predicted for the EastAntarctic stations fall in the range�1.1 to +0.3 mm/yr. For the WAGN stations with geodetic velocityestimates the predicted elastic rates fall betweenextremes of �0.9 mm/yr at HAAG and +0.4 mm/yr at station MBL1 (+0.4 mm/yr), though more thanhalf of the predictions fall in the range �0.17 to+0.03 mm/yr. Clearly our elastic rebound predic-tions cannot account for the several mm/yr biasbetween the geodetic velocities and the PGR pre-dictions for East Antarctica and the WAGN area(Figure 5), even if we assume that average reboundrates increased by a factor of two or three betweenthe period 1995–2003, for which our loading gridapplies, and for 2002–2005/7 when the observeddisplacements accumulated. Elastic reboundmay bea much more important component of verticalcrustal velocity in parts of the northern peninsula.We predict elastic uplift rates of 4.1 mm/yr at PALMand 4.5 mm/yr at SPPT, though only 0.9 mm/yr atO’Higgins Base near the tip of the peninsula.
[16] It is difficult to assess how elastic rebound rateshave varied since 1995. Net ice mass loss in thepeninsula accelerated from�25 ± 45 Gt/yr in 1996,to �28 ± 45 Gt/yr in 2000 and �60 ± 46 Gt/yr in2006 [Rignot et al., 2008]. However, the individualformal errors are so large that the implied rate ofacceleration (�3.6 ± 6.4 Gt/yr) is not significantlydifferent from zero. We note that our geodeticmeasurements at O’Higgins Base imply no signifi-cant increase in its vertical velocity, since theestimate of 7.6 ± 1.0 mm/yr for OHIG was obtainedin 1996.3–2002.1, whereas the velocity estimates of7.0 ± 0.7 mm/yr for OHI2 and 6.5 ± 0.8 mm/yr forOHI3 represent the time periods 2002.1–2008.3and 2003.2–2008.3, respectively.
5. Discussion
[17] The most uncertain element in most geodeticsolutions is the formal estimate of its uncertainty.
Could our measurement errors at the WAGN sta-tions be larger than our formal error estimates(Table 1) by say �1 mm/yr, and perhaps by�2 mm/yr at a small number of stations? Certainlythat is possible. But it is extremely unlikely thaterrors in our geodetic solutions can account forsystematic biases with absolute magnitudes of>4 mm/yr in the northern peninsula and >7 mm/yrin the WAGN area (Figure 5). We have been usingsurvey GPS to measure the vertical crustal velocityfield at about two dozen stations in southernPatagonia for many years, and we have noticed thatour latest velocity solution, which is based on totalobservational time spans of 6–12 years at moststations, does not differ by more than�2 mm/yr fromour first vertical velocity solution, which was obtainedusing time spans of 4–5 years at most stations.
[18] We conclude that all four PGR models con-sidered here tend to underpredict geodetic upliftrates in the northern peninsula, and overpredictthem in the WAGN area. Elastic rebound signalscan account for part of the discrepancy in thepeninsula, but cannot explain the PGR predictionbias detected elsewhere. Significant elastic signalsare expected for stations W10, W11, and W16–W18, which we are still waiting to reobserve. Sincethe PGR models are positively biased outside ofthe peninsula, the suggestion is that most recentGRACE-based studies of ice mass balance inAntarctica have overestimated recent rates of iceloss. This systematic bias would be amplified instudies that used a spatial averaging filter thatdeemphasizes the northern peninsula.
[19] We can estimate the potential magnitude of theice mass biases by noting that if the averagevelocity prediction bias of �5 mm/yr evident inFigure 5 is developed over �2 � 106 km2, an areasomewhat smaller than that of West Antarctica, thiswould cause an apparent but spurious ice loss of�33 Gt yr�1, which is a significant fraction of allpublished ice mass rates derived from GRACE[Velicogna and Wahr, 2006; Chen et al., 2006;Ramillien et al., 2006; Sasgen et al., 2007a].However, it is not possible to arrive at an accuratenumerical estimate of the impact of our geodeticmeasurements on GRACE ice mass change solu-tions without finding a reliable means to interpolatebetween our point measurements of vertical crustalvelocity. Clearly, the most reasonable basis fordoing this is to assimilate our geodetic results intothe leading classes of PGR models, and allow thesesophisticated models to perform the interpolationbased on their model physics.
GeochemistryGeophysicsGeosystems G3G3
bevis et al.: vertical crustal velocity in antarctica 10.1029/2009GC002642
9 of 11
[20] As POLENET fieldwork proceeds our geo-detic solutions will improve, and become morenumerous. Given continuous time series at mostof these stations, we will obtain deeper insightsinto elastic loading by observing the bedrockresponse to seasonal loading cycles. We expectthat the substantial differences between Antarcticaice mass rate estimates already derived fromGRACE observations [Velicogna and Wahr,2006; Chen et al., 2006; Ramillien et al., 2006;Sasgen et al., 2007a] will steadily diminish asthese analyses are repeated using later generationsof PGR models that are better constrained bydirect crustal velocity measurements.
[21] At present, inadequate knowledge of the PGRfields in Antarctica limits our ability to gaugelinear (in time) trends in ice mass using GRACE.However, any sudden increase in the rate of iceloss will be resolved unambiguously by GRACEsince the mass rates associated with PGR do notchange significantly over several years. Rapidlyaccelerating changes in ice mass can also bedetected, completely independently of GRACE,by growing networks of GPS stations. In effect,Earth’s instantaneous elastic response to surfaceloading changes will allow us to ‘‘weigh’’ the icesheets using GPS [Hager, 1991; Khan et al., 2007].While observed vertical velocities are a mixture ofPGR and the elastic response to modern loadchanges, any sudden increase in vertical crustalvelocity will unambiguously reveal an increase inthe rate of ice loss.
[22] Higher than expected rates of PGR in thepeninsula, and lower than expected rates in theWAGN area, can be explained, in part, by imper-fections in our ice history models [e.g., Bentley,2009]. But we suspect that the influence that neo-tectonic setting has on isostatic response times,already demonstrated in Patagonia [Ivins andJames, 2004], is also a key factor in Antarctica.
Acknowledgments
[23] This research was funded by the Office of Polar Pro-
grams at the U.S. National Science Foundation. Logistical
support was provided by the U.S. Antarctic Program. GPS
measurements made after 2006, in the framework of WAGN’s
successor project POLENET, were supported by field engi-
neers from UNAVCO, Inc. We thank the Jet Propulsion
Laboratory for providing their early GPS data from station
MBL1 and the British Antarctic Survey and the Technical
University of Dresden for providing us with early GPS data
from station HAAG. Reviews by R. Reilinger and M. Ham-
burger were greatly appreciated.
References
Bentley, M. (2009), The Antarctic palaeo record and its role inimproving predictions of future Antarctic Ice Sheet change,J. Quat. Sci., doi:10.1002/jqs.1287, in press.
Bevis, M., et al. (2005), Seasonal fluctuations in the mass of theAmazon River system and Earth’s elastic response, Geophys.Res. Lett., 32, L16308, doi:10.1029/2005GL023491.
Chen, J., C. Wilson, D. Blankenship, and B. Tapley (2006),Antarctic mass rates from GRACE, Geophys. Res. Lett., 33,L11502, doi:10.1029/2006GL026369.
Dietrich, R., et al. (2004), Plate kinematics and deformationstatus of the Antarctica Peninsula based on GPS, GlobalPlanet. Change, 42, 313–321, doi:10.1016/j.gloplacha.2003.12.003.
Donnellan, A., and B. Luyendyk (2004), GPS evidence fora coherent Antarctica plate and for postglacial rebound inMarie Byrd Land, Global Planet. Change, 42, 305–311,doi:10.1016/j.gloplacha.2004.02.006.
Dziewonski, A., and D. L. Anderson (1981), PreliminaryReference Earth Model, Phys. Earth Planet. Inter., 25,297–356, doi:10.1016/0031-9201(81)90046-7.
Hager, B. (1991), Weighing the ice sheets using space geo-desy: A way to measure changes in ice sheet mass, EosTrans. AGU, 17, 91.
Helsen, M., et al. (2008), Elevation changes in Antarcticamainly determined by accumulation variability, Science,320, 1626–1629, doi:10.1126/science.1153894.
Herring, T., R. King, and S. McClusky (2006), GAMIT andGLOBK Reference Manuals, Release 10.3, Mass. Inst. ofTechnol., Cambridge.
Ivins, E., and T. James (2004), Bedrock response to LlanquihueHolocene and present-day glaciation in southernmost SouthAmerica, Geophys. Res. Lett., 31, L24613, doi:10.1029/2004GL021500.
Ivins, E. R., and T. S. James (2005), Antarctic glacial isostaticadjustment: A new assessment, Antarct. Sci., 17, 541–553,doi:10.1017/S0954102005002968.
Kendrick, E., M. Bevis, R. Smalley, and B. Brooks (2001),An integrated crustal velocity field for the central Andes,Geochem. Geophys. Geosyst., 2(11), 1066, doi:10.1029/2001GC000191.
Khan, S., et al. (2007), Elastic uplift in southeast Greenlanddue to rapid ice mass loss, Geophys. Res. Lett., 34, L21701,doi:10.1029/2007GL031468.
Le Meur, E., and P. Huybrechts (2001), A model computationof the temporal changes of surface gravity and geoidal signalinduced by the evolving Greenland ice sheet, Geophys. J.Int., 145, 835–849, doi:10.1046/j.1365-246x.2001.01442.x.
Milne, G., et al. (2004), Continuous GPS measurements ofpostglacial adjustment in Fennoscandia: 2. Modeling results,J. Geophys. Res., 109, B02412, doi:10.1029/2003JB002619.
Peltier, R. (2004), Global glacial isostasy and the surface of theice-age Earth: The ICE-5G (VM2) model and GRACE,Annu. Rev. Earth Planet. Sci., 32, 111–149, doi:10.1146/annurev.earth.32.082503.144359.
Ramillien, G., et al. (2006), Interannual variations of the massbalance of the Antarctica and Greenland ice sheets fromGRACE, Global Planet. Change, 53, 198–208, doi:10.1016/j.gloplacha.2006.06.003.
Rignot, E., et al. (2004), Accelerated ice discharge from theAntarctic Peninsula following the collapse of Larsen B iceshelf, Geophys. Res. Lett., 31, L18401, doi:10.1029/2004GL020697.
GeochemistryGeophysicsGeosystems G3G3
bevis et al.: vertical crustal velocity in antarctica 10.1029/2009GC002642
10 of 11

Rignot, E., et al. (2008), Recent Antarctic ice mass loss fromradar interferometry and regional climate modeling, Nat.Geosci., 1, 106–110, doi:10.1038/ngeo102.
Sasgen, I., Z. Martinec, and K. Fleming (2007a), Regional ice-mass changes and glacial-isostatic adjustment in Antarcticafrom GRACE, Earth Planet. Sci. Lett., 264, 391–401,doi:10.1016/j.epsl.2007.09.029.
Sasgen, I., D. Wolf, Z. Marinec, V. Klemann, and J. Hagerdoorn(2007b), Geodetic signatures of glacial changes in Antarctica:Rates of geoid-height change and radial displacement due topresent and pass ice-mass variations, Sci. Tech. Rep. STR05/01,Dtsch. GeoForschungsZent., Potsdam, Germany.
Taylor, F. W., et al. (2008), Kinematics and segmentation ofthe South Shetland Islands–Bransfield basin system, north-ern Antarctic Peninsula, Geochem. Geophys. Geosyst., 9,Q04035, doi:10.1029/2007GC001873.
Velicogna, I., and J. M. Wahr (2002), A method for separatingAntarctic postglacial rebound and ice mass balance usingfuture ICESat Geoscience Laser Altimeter System, GravityRecovery and Climate Experiment, and GPS satellite data, J.Geophys. Res., 107(B10), 2263, doi:10.1029/2001JB000708.
Velicogna, I., and J. M. Wahr (2006), Measurements of time-variable gravity show mass loss in Antarctica, Science, 311,1754–1756, doi:10.1126/science.1123785.
Wang, H., P. Wu, and W. van der Wal (2008), Using postglacialsea level, crust velocities and gravity-rate-of-change to con-strain the influence of thermal effects onmantle heterogeneities,J. Geodyn., 46, 104–117, doi:10.1016/j.jog.2008.03.003.
Wingham, D., A. Shepherd, A. Muir, and G. Marshall (2006),Mass balance of the Antarctic ice sheet, Philos. Trans. R.Soc. London, Ser. A, 364, 1627–1635, doi:10.1098/rsta.2006.1792.
GeochemistryGeophysicsGeosystems G3G3
bevis et al.: vertical crustal velocity in antarctica 10.1029/2009GC002642
11 of 11