GEOCHEMISTRY OF MANGANESE OXIDES AND AGE OF … · GEOCHEMISTRY OF MANGANESE OXIDES AND AGE OF...
150
GEOCHEMISTRY OF MANGANESE OXIDES AND AGE OF MINERALIZATION AT THE SANTA EULALIA MINING DISTRICT, MEXICO By Heather Casey Submitted in partial fulfillment of the requirements for the Degree of Master of Science in Geology at New Mexico Institute of Mining and Technology Earth and Environmental Sciences Department Socorro, New Mexico June 2011
Transcript of GEOCHEMISTRY OF MANGANESE OXIDES AND AGE OF … · GEOCHEMISTRY OF MANGANESE OXIDES AND AGE OF...

GEOCHEMISTRY OF MANGANESE OXIDES AND AGE OF MINERALIZATION
AT THE SANTA EULALIA MINING DISTRICT, MEXICO
By
Heather Casey
Submitted in partial fulfillment of the requirements
for the Degree of Master of Science in Geology at
New Mexico Institute of Mining and Technology
Earth and Environmental Sciences Department
Socorro, New Mexico
June 2011
ABSTRACT
The Santa Eulalia Mining District, 22 km east of Chihuahua City, is one of the
largest silver-lead-zinc producers in Mexico. The significance of this deposit is reflected
in the large number of diverse studies on the base metal chimney and mantos deposits.
This study focuses on a less studied feature of the district known as the argentiferous
manganese oxide mineralization (AMOM) and whether it is part of the main stage of ore
mineralization.
Electron microprobe and X-ray diffraction analyses determined the manganese
oxide mineralogy consists of cryptomelane, coronadite, birnessite, todorokite mixed with
goethite, talc, illite, and other clays. Stable isotope analyses of carbonates within and
outside the AMOM indicate clear changes across the contact of manganese altered and
unaltered limestone values. For comparison, calcite from the Luis Lopez Manganese
District, south of Socorro, New Mexico, was analyzed for carbon and oxygen stable
isotopes and was found to show a covariant relationship. Three different samples of
AMOM, one cryptomelane and two todorokite, were dated using the 40
Ar/39
Ar method.
The dates obtained from step-heating are 10.31 ± 0.13Ma and 10.37 ± 0.11Ma (dendrites)
and 9.4 ± 0.5Ma and 9.6 ± 0.4Ma (veins) for the cryptomelane and 5.1 ± 1.7Ma and 1.9 ±
0.4Ma for the todorokites. Four intrusive rock samples from drill hole Cp 1813 were
previously dated using K/Ar and were re-dated during this study using 40
Ar/39
Ar. From
the results obtained, the age of the felsite, quartz monzonite, upper diabase sill, and lower

diabase sill are 33.06 ± 0.11Ma, 38.7 ± 0.6Ma, 73.0 ± 1.3Ma, and 72.3 ± 1.5Ma,
respectively.
Previous workers determined the felsites were the source of fluids responsible for
the mineralization of the Ag-Pb-Zn (Cu) ore bodies. The ages of the AMOM samples are
clearly younger than the main sulfide mineralization. The AMOM is either a weathering
product of older sulfide ores or a superimposed mineralization event associated with
Basin and Range tectonics.
Keywords: Santa Eulalia, Manganese Oxide, 40
Ar/39
Ar Geochronology, Stable Isotopes
ii
TABLE OF CONTENTS
Page
LIST OF FIGURES………………………………………………………………………iv
LIST OF TABLES………………………………………………………………………...x
1. INTRODUCTION……………………………………………………………………...1
1.1 General Geology of Santa Eulalia……………………………………………..2
1.1.1 Igneous Intrusions…………………………………………………...4
1.1.2 Ore bodies…………………………………………………………...5
1.1.3 Sulfide Mineralization………………………………………………6
1.1.4 Fluid Inclusions……………………………………………………...7
1.1.5 Stable Isotope Geochemistry………………………………………..8
1.1.6 Source of Sulfide Ore Fluids……………………………………….10
1.1.7 K/Ar Geochronology………………………………………………11
1.1.8 AMOM of Santa Eulalia…………………………………………...12
1.2 Dating of Manganese Oxides………………………………………………...15
1.3 Luis Lopez Manganese District……………………………………………...19
1.4 Objectives of Current Study………………………………………………….21
2. METHODS……………………………………………………………………………22
2.1 Mineral Identification………………………………………………………..22
2.1.1 Electron Microprobe Analyses…………………………………….22
2.1.2 X-ray Diffraction Analyses………………………………………...23
2.2 Stable Isotope Geochemistry………………………………………………...24
2.3 40
Ar/39
Ar Geochronology Sample Preparation and Analyses………………..25
2.3.1 Intrusive Rocks Sample Preparation……………………………….25
2.3.2 Manganese Oxides Sample Preparation……………………………26
2.3.3 Irradiation Procedures……………………………………………...27
2.3.4 Analytical Methods………………………………………………...28
3. RESULTS……………………………………………………………………………..29
3.1 Mineralogical Identification………………………………………………….29
3.1.1 Electron Microprobe Analyses…………………………………….29
3.1.2 X-ray Diffraction Analyses………………………………………...33
3.1.3 Synthesis of Electron Microprobe and X-ray Diffraction………….36
3.2 Stable Isotope Geochemistry………………………………………………...38
3.3 40
Ar/39
Ar Geochronology…………………………………………………….45

iii
3.3.1 Intrusive Rocks…………………………………………………….46
3.3.2 Manganese Oxides…………………………………………………54
4. DISCUSSION…………………………………………………………………………59
4.1 Mineralogy and Geochronology of the Intrusive Rocks……………………..59
4.1.1 Mineral Identification……………………………………………...59
4.1.2 Geochronology……………………………………………………..60
4.2 Mineralogy and Geochronology of the AMOM……………………………..62
4.2.1 Mineral Identification……………………………………………...62
4.2.2 Geochronology……………………………………………………..63
4.3 Stable Isotope at Santa Eulalia……………………………………………….64
4.4 The Origin of AMOM………………………………………………………..66
4.4.1 Weathering Model for AMOM at Santa Eulalia…………………...66
4.4.2 Hot Spring Model for AMOM at Santa Eulalia……………………67
4.5 Stable Isotopes at Luis Lopez………………………………………………..72
5. CONCLUSION………………………………………………………………………..75
APPENDIX A. SAMPLE PHOTOS…………………………………………………….77
APPENDIX B. ELECTRON MICROPROBE ANALYSES……………………………85
APPENDIX C. X-RAY DIFFRACTION………………………………………………..91
C.1 Intrusive Rocks………………………………………………………………91
C.2 Manganese Oxides…………………………………………………………100
APPENDIX D. STABLE ISOTOPES………………………………………………….112
APPENDIX E. 40
AR/39
AR GEOCHRONOLOGY…………………………………….115
E.1 Intrusive Rocks Data……………………………………………………….115
E.1.1 Data Tables……………………………………………………….115
E.1.2 Step-heating Spectra……………………………………………...119
E.1.3 Isochrons………………………………………………………….122
E.2 Manganese Oxides Data……………………………………………………125
E.2.1 Data Tables……………………………………………………….125
E.2.2 Step-heating Spectra……………………………………………...128
E.2.3 Isochrons………………………………………………………….129
REFERENCES…………………………………………………………………………133
iv
LIST OF FIGURES
Page
Figure 1-1: Area map. Modified from (Haynes and Kesler, 1988)…………………….…1
Figure 1-2: Stratigraphic column for the Sierra Santa Eulalia, Chihuahua, Mexico with
K/Ar dates and sulfur isotopes (Megaw, 1990) …………………….…………………….3
Figure 1-3: Schematic drawing of the cross-cutting relationships between the felsites and
diabase sills and the lamprophyres……………………………………………………....11
Figure 1-4: Conceptual model for the hydrothermal formation of the Luis Lopez
Manganese District, New Mexico……………………………………………………......15
Figure 1-5: Coronadite Group crystal structure. The elements in the tunnel site indicate
this is the mineral cryptomelane………………………………………………………....17
Figure 1-6: Location of the Luis Lopez Manganese District in New Mexico……….......19
Figure 2-1: Photograph of the SE-PKM-1 thin section used for microprobe analyses….27
Figure 3-1: All microprobe analyses plotted with %K2O versus %MnO…………….….30
Figure 3-2: Relationship of manganese oxides and other minerals in SE-PKM microprobe
backscatter image………………………………………………………………………...30
Figure 3-3: Microprobe data using data points with at least 44% MnO and at least 2% of
one of the components, eliminating high Fe or Ca data points and trace elements……...32
Figure 3-4: Microprobe data using points with at least 44% MnO and at least 2% of one
of the components, eliminating high Fe, high Ca data points and analyses with K2O, PbO,
and ZnO less than 2%........................................................................................................33

v
Figure 3-5: SE-PKM-1 scans of separates dated using the 40
Ar/39
Ar method…………...34
Figure 3-6: The two todorokite separates dated using the 40
Ar/39
Ar method……………35
Figure 3-7: Flow chart of proceses followed to identify the minerals in the AMOM…...37
Figure 3-8: Microprobe data %K2O vs. % MnO plotted by inferred mineral…...………38
Figure 3-9: δ13
C vs. δ18
O values for calcite and limestone (Megaw, 1990) and new
limestone samples (this study) for Santa Eulalia………………………………………...40
Figure 3-10: Santa Eulalia δ13
C plotted against distance from ore veins in meters
(Megaw, 1990)…………………………………………………………………………...40
Figure 3-11: Santa Eulalia δ18
O plotted against distance from ore veins in meters
(Megaw, 1990)…………………………………………………………………………...41
Figure 3-12: δ13
C and δ18
O values of calcite for Luis Lopez and Water Canyon, New
Mexico…………………………………………………………………………………...41
Figure 3-13: Luis Lopez data with δ13
CHCO3- vs. δ18
OH2O……………………………….42
Figure 3-14: δ13
C vs. δ18
O of calcite of seven rocks at the MCA mine………………….43
Figure 3-15: δ13
C vs. δ18
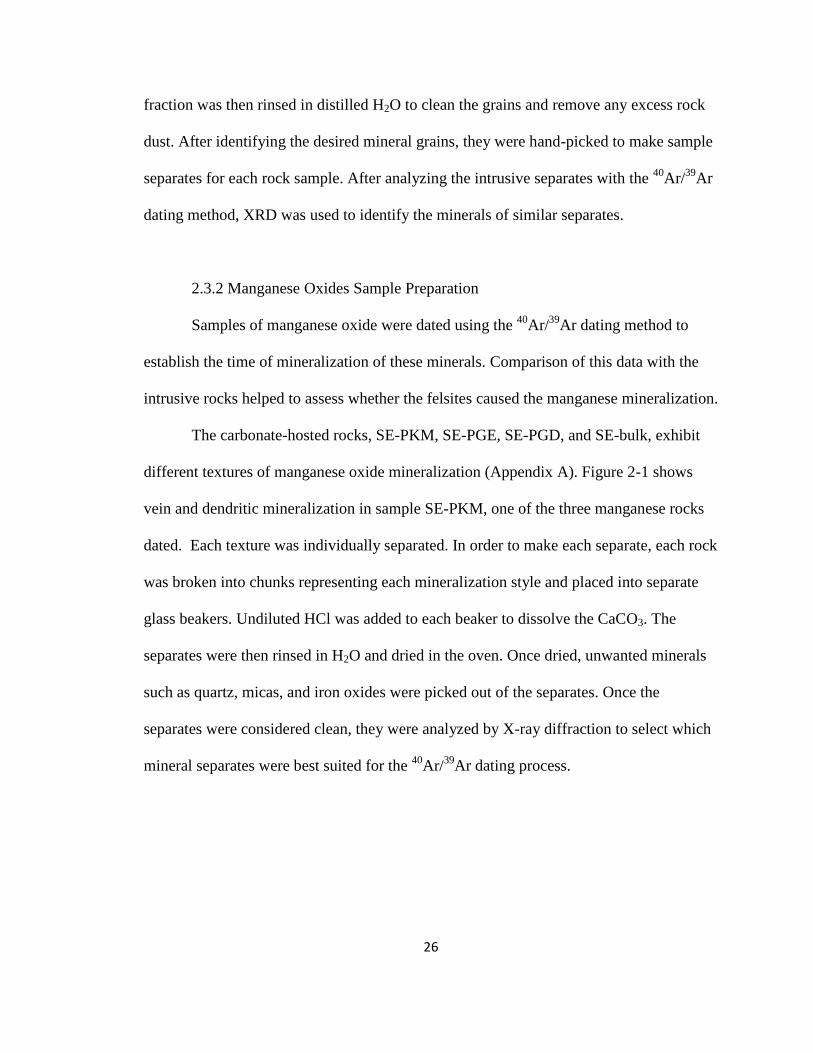
O of calcite from two rocks at Nogal Canyon…………………44
Figure 3-16: δ13
C vs. δ18
O of calcite of two rocks at the Black Canyon mine…………..44
Figure 3-17: δ13
C vs. δ18
O of calcite of six rocks at Water Canyon……………………..45
Figure 3-18: West-East cross-section of drill hole Cp1813, looking North…………..…46
Figure 3-19: 40
Ar/39
Ar Step-Heating Spectra for Runs 59516-01, 59517-01 (Felsic Core).
Plagioclase (black) and groundmass (red)……………………………………………….48
Figure 3-20: 40
Ar/39
Ar Step-Heating Spectra for Runs 59518-01, 59519-05 (Cp1813
2070’). Plagioclase (black) and K-feldspar (red)………………………………………...49
Figure 3-21: Inverse Isochron for Run 59518-01 (Cp 1813 2070’, plagioclase)………...50

vi
Figure 3-22: Inverse Isochron for Run 59519-05 (Cp 1813 2070’, K-feldspar)………...50
Figure 3-23: 40
Ar/39
Ar Step-Heating Spectra for Runs 59511-01, 59514-01, 59516-01
(Cp1813 92’, Core 1, and Felsic Core). Cloudy plagioclase from Cp1813 92’ (black),
Core 1(red), and Felsic Core (green)…………………………………………………….51
Figure 3-24: 40
Ar/39
Ar Step-Heating Spectra for Runs 59510-01, 59513-01 (Cp1813 92’
and Core 1). Separates from Cp1813 92’ (black) and Core 1 (red) initially thought to be
clear plagioclase………………………………………………………………………….53
Figure 3-25: 40
Ar/39
Ar Step-Heating Spectra for Runs 59512-01, 59515-01 (Cp1813 92’
and Core 1). Biotite from Cp1813 92’ (black) and Core 1 (red)………………………...54
Figure 3-26: 40
Ar/39
Ar Step-Heating Spectra for SE-PKM-1: a) Runs 59771-01 and
59772-02 (veins); b) Runs 59773-01 and 59774-01 (dendrites)…………………………56
Figure 3-27: 40
Ar/39
Ar Step-Heating Spectra for Runs 59775-01, 59776-01 (SE-bulk and
SE-PGE). Todorokite from SE-bulk (black) and SE-PGE (red)…………………………58
Figure 4-1: K/Ar (black) (Clark et al., 1979; Megaw, 1990) and 40
Ar/39
Ar (red) age
distribution for the intrusive rocks……………………………………………………….62
Figure 4-2: Relationship of carbon and oxygen isotope values within AMOM and
unaltered limestone. Courtesy of Megaw (1990)………………………………………...65
Figure 4-3: Schematic weathering model for the formation of AMOM based on Spurr
(1911) and observations of Megaw (1990)………………………………………………67
Figure 4-4: Location of Santa Eulalia, outlined in black, and Peña Blanca, outlined in red,
near Chihuahua, Mexico (Mexicana, 1985)……………………………………………...68
Figure 4-5: Model for deep fluid circulation and precipitation of hydrothermal minerals in
faults (Lueth et al., 2005)………………………………………………………………...69

vii
Figure 4-6: Schematic cross-section of possible relationships between RGR, manganese,
and hot spring mineralization…………………………………………………………….71
Figure 4-7: Schematic model for the precipitation of AMOM at Santa Eulalia with fluid
movement based on Mailloux et al. (1999) (red) and fluid movement based on basin
dewatering-MVT type from the east (blue)……………………………………………...72
Figure A-1: SEPKM rock sample………………………………………………………..77
Figure A-2: SEPGD rock sample………………………………………………………...77
Figure A-3: SEPGE rock sample………………………………………………………...77
Figure A-4: SE-bulk rock sample………………………………………………………..78
Figure A-5: MCA-1 rock sample………………………………………………………...78
Figure A-6: MCA-2 rock sample………………………………………………………...78
Figure A-7: MCA-3 rock sample………………………………………………………...79
Figure A-8: MCA-4 rock sample………………………………………………………...79
Figure A-9: MCA-5 rock sample………………………………………………………...79
Figure A-10: MCA-6 rock sample……………………………………………………….80
Figure A-11: MCA-7 rock sample……………………………………………………….80
Figure A-12: Nogal-1 rock sample………………………………………………………80
Figure A-13: Nogal-2 rock sample………………………………………………………81
Figure A-14: PG-1 rock sample………………………………………………………….81
Figure A-15: PG-2 rock sample………………………………………………………….81
Figure A-16: BC-1 rock sample………………………………………………………….82
Figure A-17: BC-2 rock sample………………………………………………………….82
Figure A-18: Nancy #9189 rock sample, 15.5cm (6 in) across………………………….82
Figure A-19: 003301 rock sample……………………………………………………….83

viii
Figure A-20: 003303 rock sample……………………………………………………….83
Figure A-21: 003304 rock sample……………………………………………………….83
Figure A-22: 003304A rock sample……………………………………………………..84
Figure A-23: 003304B rock sample……………………………………………………...84
Figure A-24: 003308 rock sample……………………………………………………….84
Figure C-1: “Clear plagioclase” from Cp1813 92’………………………………………91
Figure C-2: “Clear plagioclase” from Core 1……………………………………………92
Figure C-3: “Cloudy plagioclase” from Felsic core……………………………………..94
Figure C-4: “Cloudy plagioclase” from Cp1813 2070’………………………………….95
Figure C-5: “Cloudy plagioclase” from Cp1813 92’…………………………………….96
Figure C-6: “Cloudy plagioclase” from Core 1………………………………………….97
Figure C-7: “K-feldspar”from Cp1813 2070’……………………………………………97
Figure C-8: Biotite from Cp1813 92’……………………………………………………98
Figure C-9: Biotite from Core 1………………………………………………………….98
Figure C-10: SE-PKM-1, vein A……………………………………………………….102
Figure C-11: SE-PKM-1, vein A hard………………………………………………….104
Figure C-12: SE-PKM-1, cluster D…………………………………………………….106
Figure C-13: SE-PKM-1, dendrite E…………………………………………………...108
Figure C-14: SE-bulk-1, dendrite A…………………………………………………….110
Figure C-15: SE-PGE-1, dendrite A……………………………………………………111
Figure D-1: Mexican calcite plotted with a) δ13
C and b) δ18
O…………………………112
Figure D-2: Correction curves for data a) δ13
C, b) δ18
O………………………………..112
Figure E-1: Step-heating spectra for Felsic core………………………………………..119
Figure E-2: Step-heating spectra for Cp1813 2070’……………………………………119

ix
Figure E-3: Step-heating spectra for Cp1813 92’………………………………………120
Figure E-4: Step-heating spectra for Core 1……………………………………………121
Figure E-5: Inverse Isochron for Run 59516-01 (Felsic Core, plagioclase)……………122
Figure E-6: Inverse Isochron for Run 59517-01 (Felsic Core, groundmass)…………..122
Figure E-7: Inverse Isochron for Run 59518-01 (Cp 1813 2070’, plagioclase)………..122
Figure E-8: Inverse Isochron for Run 59519-05 (Cp 1813 2070’, K-feldspar)………...123
Figure E-9: Inverse Isochron for Run 59511-01 (Cp 1813 92’, cloudy plagioclase)…..123
Figure E-10: Inverse Isochron for Run 59514-01 (Core 1, cloudy plagioclase)……….123
Figure E-11: Inverse Isochron for Run 59513-01 (Core 1, clear plagioclase)………….124
Figure E-12: Inverse Isochron for Run 59510-01 (Cp 1813 92’, clear plagioclase)…...124
Figure E-13: Inverse Isochron for Run 59512-01 (Cp 1813 92’, biotite)………………124
Figure E-14: Inverse Isochron for Run 59515-01 (Core 1, biotite)…………………….125
Figure E-15: Step-heating spectra for SE-PKM………………………………………..128
Figure E-16: Step-heating spectra from SE-bulk and SE-PGE………………………...129
Figure E-17: Inverse isochron for SE-PKM-1 vein A………………………………….129
Figure E-18: Inverse isochron for SE-PKM-1 vein A (hard)…………………………..130
Figure E-19: Inverse isochron for SE-PKM-1 dendrite D……………………………...130
Figure E-20: Inverse isochron for SE-PKM-1 dendrite E……………………………...131
Figure E-21: Inverse isochron for SE-bulk……………………………………………..131
Figure E-22: Inverse isochron for SE-PGE…………………………………………….132

x
LIST OF TABLES
Page
Table 3-1: Manganese oxide minerals and formulas (Vasconcelos, 1999; Back and
Mandarino, 2008)………………………………………………………………………...33
Table 3-2: Minerals identified in six manganese oxide separates……………………….35
Table B-1: Microprobe data for SE-PKM-1, SE-PGD, SE-PGE-1, SE-PGE-2, SE-bulk-1,
SE-bulk-2, and SE-bulk-3………………………………………………………………..85
Table D-1: Isotope standards…………………………………………………………...112
Table D-2: All Luis Lopez and Santa Eulalia data……………………………………..112
Table E-1: Argon isotopic data for intrusive separates…………………………………115
Table E-2: Argon isotopic data for manganese oxide separates………………………..125

This thesis is accepted on behalf of the
Faculty of the Institute by the following committee:
________________________________________________________________________ Advisor
________________________________________________________________________
________________________________________________________________________
________________________________________________________________________
________________________________________________________________________
________________________________________________________________________
Date
I release this document to the New Mexico Institute of Mining and Technology.
________________________________________________________________________
Student’s Signature Date

1
1. INTRODUCTION
The Santa Eulalia District is located approximately 22 kilometers east of
Chihuahua City, Mexico (Figure 1-1) and is one of the most extensively studied base
metal manto deposits in the world (Megaw, 1990). Santa Eulalia is an important silver-
lead-zinc district that has been mined for hundreds of years (Hewitt, 1968). Previous
workers noted a close relationship between the felsite intrusions and the sulfide
mineralization. This study addresses the question of whether a less studied part of the
deposit, known as the argentiferous manganese oxide mineralization (AMOM), is part of
the main stage of ore mineralization. If the AMOM is part of the main ore stage, it may
provide a broad alteration halo for further exploration of the sulfide deposits.
Figure 1-1: Area map. Modified from (Haynes and Kesler, 1988).
. Chihuahua City

2
1.1 General Geology of Santa Eulalia
Aspects of previous work include field observations of mineral location (Spurr,
1911; Prescott, 1916; Walker and Walker, 1956; Hewitt, 1968), type of ore bodies
(Hewitt, 1968; Megaw, 1986b; Megaw, 1990), and mineral zoning (Spurr, 1911; Prescott,
1916; Hewitt, 1968; Malakhov, 1968; Walter, 1985; Bond, 1986; Aguirre, 1987; Megaw,
1990; Lueth et al., 2000). Other work has been done in fluid inclusions (Megaw, 1990),
stable isotopes (Ohmoto, 1972; Miranda and Megaw, 1986; Megaw, 1990), and K/Ar
dating (Clark et al., 1979; Megaw, 1990).
The Santa Eulalia District is separated into two sub-distinct areas known as the
West Camp and the East Camp. Both areas are located within the Sierra Santa Eulalia
close to a major tectonic boundary (Figure 1-1). The rock units of the Sierra Santa Eulalia
(Figure 1-2) include lower Cretaceous limestone and evaporites folded into a doubly
plunging anticline, which were then covered by lower Tertiary volcanic and
volcaniclastic rocks. Mid-Tertiary ash-flow tuffs and basalts from the Santo Domingo
Caldera overlie the lower Tertiary volcanic rocks. The sierra extends 30 km from north to
south and 18 km from east to west (Hewitt, 1968; Campa, 1985; Megaw, 1986b; Megaw,
1990).

3
Figure 1-2: Stratigraphic column for the Sierra Santa Eulalia, Chihuahua, Mexico with
K/Ar dates and sulfur isotopes (Megaw, 1990).

4
1.1.1 Igneous Intrusions
There are eleven igneous intrusions identified in the Santa Eulalia District
(Megaw, 1986b; Megaw, 1990), but only the deep quartz monzonite, diabase sills,
felsites, and lamprophyres (Figure 1-2) were considered in this study.
The quartz monzonite in the district is known to be “greenish, medium-grained,
equigranular holocrystalline intrusive rock composed of plagioclase, k-feldspar, augite,
hornblende, and magnetite with rare quartz” (Hewitt, 1968; Megaw, 1986b; Megaw,
1990).
The diabase sills “have been identified as dolerite, diabase, diabasic dolerite,
doleritic diabase, and sodic diorite by R. J. Coloby and F. F. Grout and as a quartz-
bearing dolerite approaching a quartz monzonite by C. P. Berkey” (Hewitt, 1968). The
sills are “greenish, fine to medium-grained, aphanitic to porphyritic basic intrusive rock
composed of plagioclase laths, hornblende, and sparse olivine” (Megaw, 1986b; Megaw,
1990). Although the normative classification is nepheline monzonite, this rock has
historically been called a diabase and that classification will be kept throughout this paper
(Hewitt, 1968; Megaw, 1990).
Megaw (1990) noted that the felsite “contains sparse quartz, K-feldspar, and
plagioclase phenocrysts in a very fine-grained to aphanitic matrix of quartz and feldspar”.
More specifically, Max P. Erickson identified samples as “quartz porphyries with 3mm
phenocrysts of quartz, orthoclase, albite, and plagioclase” (Hewitt, 1968). This rock type
can be found in the West Camp as dikes and sills and in the East Camp as the “core of the
symmetrically zoned San Antonio skarns” (Hewitt, 1968).

5
The lamprophyres “consist of fine-grained plagioclase and hornblende in an
aphanitic groundmass of plagioclase and mafics. They cut ore and all other intrusive
rocks and are compositionally distinct” (Megaw, 1986b).
1.1.2 Ore bodies
The ore bodies of Santa Eulalia take on many forms including mantos, chimneys,
replacement veins, and associated bedding replacement (Hewitt, 1968). The West Camp
contains mantos and chimneys of massive sulfides, while the East Camp is mostly made
of “symmetrically zoned, intrusion-cored skarns with associated massive sulfides”
(Megaw, 1986b).
The localization of ore bodies at Santa Eulalia has been a topic of extensive study.
Most studies have focused on structural ore controls. One proposed idea is an intersection
of a vertical fissure containing ore fluids and a favorable limestone results in a manto,
while two fissures intersecting results in a chimney (Spurr, 1911; Hewitt, 1968). This
may be most evident in the southern block (Hewitt, 1968). Prescott (1916) noted the four
main fissure trends of N-S, N10E, N10W, and N30W were important for silver-lead-zinc
fluid movement. All other trends were noted as important for oxidizing fluids. Prescott
(1916) also felt the northerly trending fractures were the important pre-mineral ore
structures. Some believe certain ore bodies may be controlled by fractures, but not all ore
bodies can be explained by this idea (Benham, 1928a). Another idea is ore bodies form in
locations containing ore-bearing solutions where a favorable route to the surface is
present (Walker and Walker, 1956; Hewitt, 1968).

6
1.1.3 Sulfide Mineralization
Sulfide mineralization is the most important ore mineralogy of the district
comprising pyrrhotite, pyrite, sphalerite, and galena with local chalcopyrite and
arsenopyrite and trace amounts of other sulfides (Megaw, 1990; Lueth et al., 2000). Other
minerals reported in the district include discrete grains of native silver, acanthite
(pseudomorphous after argentite), pyrargyrite, argentopyrite, and polybasite (Megaw,
1986c) as well as gold and fizelyite (Megaw, 1990).
Bond (1986) described the zoning in the East Camp as “silicate-rich to sulfide-
rich mineral assemblage as one passes upwards in the San Antonio graben and outwards
from the San Antonio dike.” Arsenopyrite, pyrrhotite, and chalcopyrite were observed to
increase with depth, while galena decreases with depth (Bond, 1986). He also noted the
increase of black, manganiferous calcite veinlets and pink limestone from the eighth level
upwards (Bond, 1986). Minerals in the East Camp also exhibit geochemical zonation. At
the San Antonio mine, lead and antimony concentrations in ores increase toward the
surface, whereas arsenic, bismuth, silver, and selenium increase with depth (Lueth et al.,
2000). Lueth et al. (2000) noted silver values of galena in skarn ore are higher than silver
values in manto samples. Zoning is also revealed by metal ratios, with ratios determined
by Bond (1986) and Walter (1985) showing increases in Ag/Pb, and Cu/Ag and decreases
in Ag/Zn, Pb/Zn, Pb/Cu, Pb/Bi, and Sb/Bi with depth (Lueth et al., 2000).
The West Camp exhibits a large-scale metal zonation, but no obvious zonation is
noted within individual ore bodies (Megaw, 1990), also noted by Prescott (1916). Lueth
et al. (2000) noted ores in the northern West Camp are higher in Ag, Fe, and Si and
poorer in As, Pb, Zn compared to the southern ore bodies. They also noted galenas from

7
chimney deposits tend to have higher concentrations of silver and antimony than the
mantos, although samples from deep mantos are similar to chimneys, and silver and
antimony values are consistently higher near the Condesa fracture than in samples from
the Central West Camp. Similar to the metal zonation, the metal ratios in the West camp
are relatively consistent within individual ore bodies (Aguirre, 1987), but they vary
slightly on a larger scale (Lueth et al., 2000). Silicate ore bodies usually have higher
Ag/Sb and Ag/Pb ratios than chimneys and breccias (Megaw, 1990; Lueth et al., 2000).
While there is an over-all trend of N/NW for the ore bodies of the Santa Eulalia
District, there is a NE trend for the deep sulfide mantos in the southern block and for
those ore bodies in the lower fossiliferous bed, as well as, a W/SW trend for the northern
end of the district (Hewitt, 1968).
1.1.4 Fluid Inclusions
Megaw (1990) has extensively analyzed fluid inclusions for the Santa Eulalia
District. He found that skarn and sulfide-hosted fluorite from the East Camp show
primary inclusion homogenization temperatures from 150 to 450 °C, with the majority
between 175 to 350 °C. The salinities for the East Camp are as high as 26.3 equivalent
wt% NaCl for primary inclusions, with some samples indicating salinities as low as 2 to
8 and 7 to 10 equivalent wt% NaCl (Megaw, 1990). Secondary inclusions for the East
Camp have homogenization temperatures of 80 to 200 °C, with apparent salinities of
between 0.5 and 3.5 equivalent wt% NaCl (Megaw, 1990).
Megaw (1990) also studied fluid inclusions for the West Camp and found that
primary fluid inclusions show a homogenization temperature range of 175 to 400 °C,

8
with the majority falling between 200 and 375 °C. Maximum salinities of 26.3 equivalent
wt% NaCl were found for the West Camp with some samples indicating salinities as low
as 2 to 11 equivalent wt% NaCl (Megaw, 1990). The secondary inclusions for the West
Camp indicate temperatures with between 180 to 275 °C and salinities between 0.5 and 4
equivalent wt% NaCl (Megaw, 1990).
Lueth et al. (2000) found temperatures between 268 °C and 477 °C based on
temperature calculations for sulfur isotope equilibrium pairs of sphalerite and galena.
These temperatures are mostly consistent with but a little higher than the temperatures of
homogenization of fluid inclusions for both camps. Lueth et al. (2000) compared
variations in Ag and Sb concentrations in galena to experimental data of Amcoff (1976)
and found a maximum solid solution of 5 atomic percent would correspond to
crystallization temperatures below 217 °C. They also found Ag-Sb substitution to be
strongest in the deepest portions of the West camp and suggest it may reflect temperature
control near inferred fluid sources. Other previous workers found that ore minerals did
not begin to precipitate until the felsites dikes and sills breached the diabase sills; this
may coincide with a thermal boundary (Hewitt, 1968; Megaw, 1990; Lueth et al., 2000).
Although, there is a suggestion of a temperature gradient across the district, Megaw
(1990) noted there is insufficient distribution of fluid inclusion data points to document
such a feature.
1.1.5 Stable Isotope Geochemistry
Many units in the Santa Eulalia District have been studied for their isotopic
values. The unaltered Finlay Limestone gives values of -0.8 ‰ and 21.8 ‰ for δ13
C and

9
δ18
O, respectively (Megaw, 1990). The δ13
C value is within the normal range and δ18
O
value is considered lower than the accepted value for the Cretaceous limestone (Veizer
and Hoefs, 1976; Megaw, 1990). Megaw (1990) also studied the sulfur isotopes at Santa
Eulalia and noted that anhydrite from the Cuchillo Formation and cubic pyrite from the
black, organic-rich, shaly upper portion of the Cuchillo Formation have very different
δ34
S values of +15.6 ‰ and -28 ‰, respectively. Both of these values are considered
normal for the specific types of units (Ohmoto and Rye, 1979; Claypool et al., 1980;
Megaw, 1990). The sulfur isotopes of galena in the district which are in isotopic
equilibrium with sphalerite also have a large range of values from -16.18 to +4.2 ‰
(Megaw, 1990).
Megaw (1990) noted the East Camp experienced an erratic and polyphase history
of mineralization, typical of telescoped mineralization, resulting in no consistent isotopic
pattern. This part of the district has a wide range and higher sulfur isotopic values over
short distances attributed to the superimposed mineralization with higher concentrations
of dissolved sulfur species compared to the West camp where the isotope range is similar
(although more negative) and spread out over greater distances (Ohmoto, 1972; Megaw,
1990).
The West Camp exhibits a crude zoning pattern with elevation and distance from
the deep southern chimney deposits (Megaw, 1990). The variation in sulfur isotope
compositions is over 15 ‰ ranging from -15.83 to -0.87 ‰ δ34
S (Lueth et al., 2000).
Miranda (1986) noted normal sulfides with values between -7 and -11 ‰ δ34
S (CDT),
while values averaging -13.4 ‰ are typical of mineralization in the Condesa Breccia, the
Condesa Chimney, and the Inglaterra Silicate Body. The most negative values found near

10
the southern chimneys, such as the Condesa fracture, also exhibit the highest Ag and Sb
values, and the least negative values in the upper and northern portions of the camp, such
as the Central West camp, exhibit low to moderate Ag and Sb values in galena (Lueth et
al., 2000). Miranda (1986) also noted other areas of the Condesa Fissure exhibit sulfur
values similar to the normal West Camp values and suggests the sulfides in the Condesa
zone were emplaced during different pulses of mineralization. The range in sulfur
isotopes values and zoning is attributed to a combination of varying initial δ34
S values
and Rayleigh distillation (Megaw, 1990).
There is no direct correlation between sulfur isotopes and fluid inclusion
temperatures, salinity, ore type, ore metal ratios, or iron sulfide species in either camp
(Megaw, 1990). According to Lueth et al. (2000), the sulfur isotope zonation, galena Ag-
Sb substitution, and galena Ag/Sb ratios may reflect distance from inferred fluid sources
resulting from temperature gradients which were influenced by changing sulfur/metal
ratios and resulted in isotopic disequilibrium between sulfide species (Ohmoto, 1972;
Megaw, 1990).
1.1.6 Source of Sulfide Ore Fluids
Megaw (1990) interpreted the felsite intrusions to be the source of fluids for the
sulfide mineralization due to the close temporal and spatial association between
mineralization and brecciation and the felsites. It was noted that a series of distinctive
felsite intrusions were emplaced before, during, and after mineralization. Ore body
emplacement and variable geochemical conditions are indicated by fluid inclusion,
mineralographic, and felsite cross-cutting relationships. This suggests minerals were

11
deposited from separate fluid packets with different initial δ34
S values that overlapped in
time and space (Megaw, 1990).
1.1.7 K/Ar Geochronology
Some units in the Santa Eulalia area have previously been dated using the K/Ar
method (Figure 1-2). These units gave ages of 31.7 Ma for a sanidine in a high potassium
calc-alkalic rhyolite (Megaw and McDowell, 1983), 37.8 Ma for plagioclase phenocrysts
in a quartz monzonite (Megaw, 1990), 37.5 Ma for plagioclase from two diabase sill end
members in the West Camp (Clark et al., 1979), 26.6 Ma for feldspar from two felsites in
the West Camp (Clark et al., 1979), and 32.2 ± 0.4 Ma for a hornblende from the Potosi
Dike lamprophyre (Megaw, 1990). The lamprophyres crosscut felsites, diabase sills, and
the intrusive breccias, indicating that the lamprophyres should be younger (Figure 1-3).
In addition, the lamprophyres are mineralized or altered where they contact ore bodies.
This presents a discrepancy due to the K/Ar dates indicating that the felsite, which is
thought to be the mineralization source in the district, is younger than the cross-cutting
and mineralized lamprophyres (Megaw, 1990).
Figure 1-3: Schematic drawing of the cross-cutting relationships between the felsites and
diabase sills and the lamprophyres.
Quartz Monzonite
Diabase sills
Felsites
Lamprophyre

12
1.1.8 AMOM of Santa Eulalia
The main mineralization at Santa Eulalia is the sulfide mineralization, but another
less studied type of mineralization found within the district is the argentiferous
manganese oxide mineralization (AMOM). This type of mineralization is found in both
the East and West camps and is hosted in limestone and the volcanic capping rocks
(Megaw, 1990).
Spurr (1911) has extensively described mineral zoning in the district and noted
that AMOM is located within 9 to 15 m of major ore bodies and contains 35 to 1500 ppm
of silver with silver content decreasing with distance from the ore bodies. He found that
silver decreases and manganese increases with depth, but the manganese disappears at
greater depths (Spurr, 1911). Hewitt (1968) noted the presence of lead-zinc-iron ores with
modest silver ranging from 250 to 400 g in the southern normal sulfides and “irony” ore
with minor lead content and rich in silver with content as high as 1 kg in the northern
oxide bodies.
AMOM can be found in several locations throughout the district. The Finlay
Limestone hosts most of the best developed limestone-hosted AMOM with it located
adjacent to, above, and/or below oxidized normal sulfide mantos and chimneys, silicate
bodies, and skarns that lie within 400 m of the surface (Spurr, 1911; Megaw, 1986a,
1987; Megaw, 1990). Well developed AMOM is also found in the East Camp along the
West Fault of the San Antonio Graben and along both faults of the Dinamita Graben in
the area between the Dinamita and Josefina Shafts (Megaw, 1990). Minor amounts of
AMOM have been found in the San Antonio Mine adjacent to unoxidized ores hosted by
the Lagrima Formation and oxide ores in the basal limestone Capping Series

13
Conglomerate (Bond, 1987; Megaw, 1990). The AMOM is hosted in volcanic rocks in
both the West and East Camps. AMOM in the West Camp preferentially affects the
Capping Series members that lie below the lowermost fined-grained andesitic tuff bed
and in the East Camp it is most pervasive on the hill immediately south of the San
Antonio Shaft (Megaw, 1990). According to X-ray diffraction analyses performed by
Megaw (1990), the main manganese minerals hosted in limestone are pyrolusite,
coronadite, and hollandite, but the volcanic-hosted manganese minerals are hollandite,
ramsdellite, coronadite, pyrolusite, todorokite, hetaerolite, groutite, and nsutite.
Manganese and silver minerals are not always found together and it has been noted that
while silver decreases with depth, the manganese minerals increase (Spurr, 1911; Megaw,
1990). Megaw (1990) noted that although grades vary, assays of veinlet fillings
exceeding 25 ppm silver and 0.5 % lead are common, and Spurr (1911) noted AMOM
containing 35 to 1500 ppm silver occurs within 9-15 m of major ore bodies with the
silver content decreasing progressively away from ore bodies. Elements in limestone-
hosted AMOM were qualitatively analyzed by argon-plasma spectrophotometry (Megaw,
1987) and quantitatively by atomic absorption and neutron activation analysis (Bond,
1987; Megaw, 1990). Anomalous levels of Ag, Pb, Zn, Cu, Cd, Mn, Fe, and Ba were
identified (Megaw, 1990). The East Camp AMOM has high levels of V, Cd, Co, Ni, Bi,
which are also found in higher concentrations in East Camp ores than in West Camp ores
(Burnham, 1959; Bond, 1987).
The origin of AMOM in the district is controversial. Some considered the AMOM
to be hypogene and a valuable exploration tool (Kimball, 1870; Dahlgren, 1883; Rice,
1908; Prescott, 1910; Megaw, 1990), but Spurr (1911) thought the AMOM was formed

14
due to ore body oxidation and was unrelated to primary minerals dispersion. After Spurr
made his conclusions about the AMOM, some workers did continue to map AMOM in
detail (Benham, 1928b, 1929; Clendenin, 1933). The AMOM at Santa Eulalia has been
found in some strata occupied by sulfide mineralization (Megaw, 1990). Megaw (1987)
found the anomalous levels of Ag, Pb, Zn, Cu, Cd, Mn, Fe, and Ba drop to background
levels after crossing out of the AMOM. Megaw (1990) thought that the presence of Santa
Eulalia AMOM above ore bodies, the presence of sulfides within the AMOM, the
anomalous metal content, and its occurrence in the sulfide zone of the San Antonio Mine,
strongly indicate it is a hypogene product and related to the sulfide mineralization.
Santa Eulalia and Luis Lopez are examples of districts with complex manganese-
oxide mineral deposits. A potential model for hypogene AMOM was presented for the
Luis Lopez Manganese District, south of Socorro, New Mexico (Lueth et al., 2004). They
proposed this district formed under similar conditions as Santa Eulalia. Figure 1-4 is a
conceptual model for Luis Lopez (Lueth et al., 2004). Features, including the locations of
the quartz monzonite, felsites, sulfide mineralization, and AMOM, of Santa Eulalia have
been placed on the diagram. The felsites at Santa Eulalia do not reach the surface as they
do in the Luis Lopez district, and instead of playa sediments, Santa Eulalia has volcanic
capping rocks. If this model is used for Santa Eulalia, the felsites represent the source of
the sulfide mineralization. As the hot fluids move away from the primary location of the
felsites in the hydrothermal system, the fluids cool and deposit the AMOM distal to the
sulfide mineralization.

15
Figure 1-4: Conceptual model for the hydrothermal formation of the Luis Lopez
Manganese District, New Mexico. Comments in parentheses (AMOM, Sulfide
Mineralization, Felsites, and Quartz Monzonite) pertain to the Santa Eulalia District,
Mexico. Modified from Lueth et al. (2004).
Although many think the AMOM is hypogene, Megaw (1990) suggests there may
be supergene manganese oxide mineralization present in the district. It has been noted
that hydrothermal and supergene manganese minerals may be hard to differentiate
because minerals precipitated from a manganese-bearing hydrothermal solution that
becomes increasingly oxidized under shallow level, low temperature conditions, may be
the same as manganese oxide minerals formed in a supergene environment (Crerar et al.,
1980; Megaw, 1990). Megaw (1990) suggests the presence of groutite and todorokite
may indicate local supergene overprints on the hypogene AMOM.
1.2 Dating of Manganese Oxides
Manganese minerals are less commonly dated by K/Ar and 40
Ar/39
Ar methods
than other minerals. No manganese oxides were previously dated in the Santa Eulalia
area. Many studies, mostly focused on hypogene processes, have shown that coronadite
(Quartz Monzonite)
(Felsites)
(AMOM)
(Sulfide Mineralization)
16
group manganese oxide minerals can be dated using the K/Ar method (Yahvili and
Gukasyan, 1974; Varentsov and Golovin, 1987; Pracejus, 1989; Segev et al., 1991;
Vasconcelos et al., 1992; Lippolt and Hautmann, 1995; Vasconcelos, 1999). Vasconcelos
(1992, 1994) found that supergene coronadite group manganese oxides produce reliable
dates using K/Ar and 40
Ar/39
Ar dating methods.
Manganese oxide minerals are commonly fine-grained and may be subject to
recoil. If crystal domains are less than 5 microns the 39
Ar recoil may influence the step-
heating spectra (Huneke and Smith, 1976). Although manganese oxides are usually
subject to recoil, some studies have found the recoil loss is relatively small and does not
prevent successful dating (Vasconcelos et al., 1994a; Vasconcelos et al., 1995; Ruffet et
al., 1996; Vasconcelos, 1999). A more recent study by Lueth et al. (2004) utilized
hydrothermal manganese oxide minerals in the Luis Lopez district, New Mexico. In this
study, they found loss of 39
Ar related to recoil to be minimal and found the age
determinations to agree with field observations.
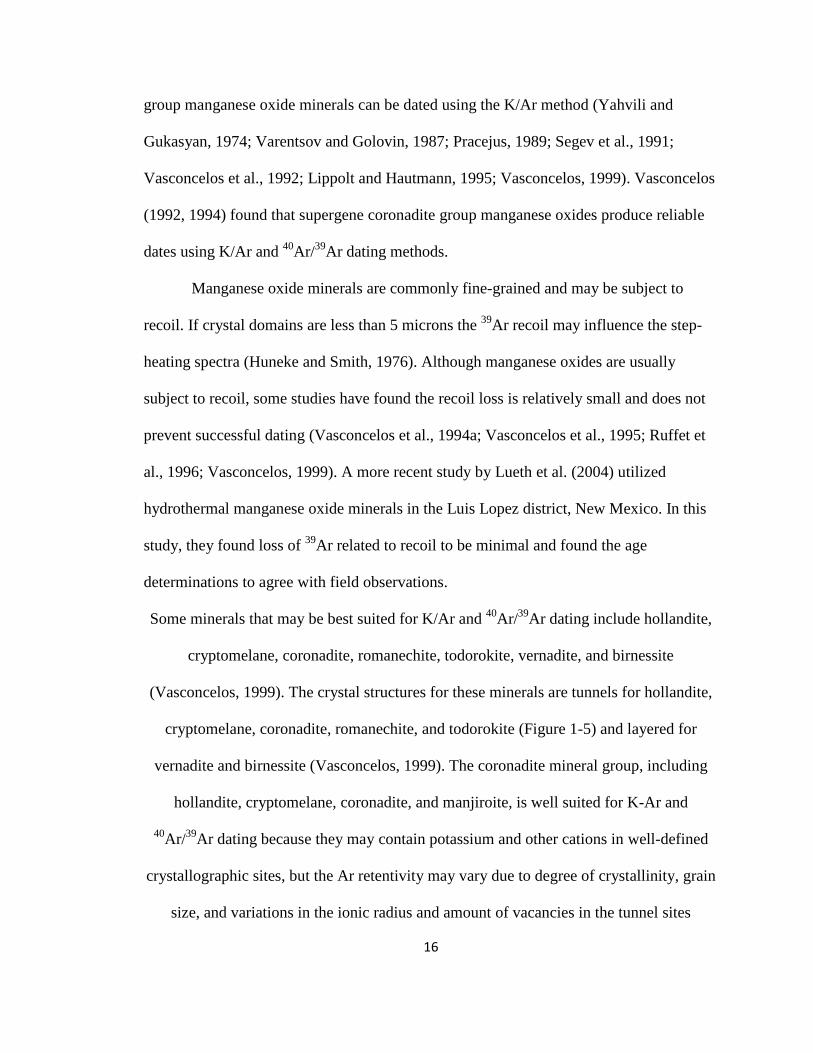
Some minerals that may be best suited for K/Ar and 40
Ar/39
Ar dating include hollandite,
cryptomelane, coronadite, romanechite, todorokite, vernadite, and birnessite
(Vasconcelos, 1999). The crystal structures for these minerals are tunnels for hollandite,
cryptomelane, coronadite, romanechite, and todorokite (Figure 1-5) and layered for
vernadite and birnessite (Vasconcelos, 1999). The coronadite mineral group, including
hollandite, cryptomelane, coronadite, and manjiroite, is well suited for K-Ar and
40Ar/
39Ar dating because they may contain potassium and other cations in well-defined
crystallographic sites, but the Ar retentivity may vary due to degree of crystallinity, grain
size, and variations in the ionic radius and amount of vacancies in the tunnel sites

17
(Vasconcelos, 1999). Manganese oxide minerals may hold many different elements in
their crystal structure, and it has been noted that Ba+2, K+, Pb+, and other large cations
Figure 1-5: Coronadite Group crystal structure. The elements in the tunnel site indicate
this is the mineral cryptomelane.
occupying the A site give stability to the coronadite group structure (Burns and Burns,
1979; Miura, 1986; Tsuji et al., 1993). If smaller cations occupy the A sites in the
crystallographic structure, the mineral may be more susceptible to cation exchange
(Burns and Burns, 1979) and thermal transformations (Vasconcelos et al., 1994b).
The first and most common coronadite group mineral dated by K/Ar or 40
Ar/39
Ar
is cryptomelane (Chukhrov et al., 1966; Vasconcelos, 1992). Cryptomelane is well suited
for dating due to the high potassium content (up to 5.5 wt%) and the high K and 40
Ar*
retentivity in the tunnel sites (Vasconcelos et al., 1995). The cryptomelane mineral has a
crystallographic structure of a 2 x 2 tunnel (Figure 1-5). Vasconcelos (1999) compared
cryptomelane using three different methods including TEM to look at the thermal
behavior (Vasconcelos et al., 1994b), Ar analyses in a temperature-controlled resistance
H2O
Ar
K
5.5 Å

18
furnace (RF) (Vasconcelos et al., 1995), and thermogravimetric analyses for the same
samples. He found the collapse of the tunnel structure and not volume diffusion of the
elements within the tunnel sites is responsible for the release of K and Ar from the tunnel
sites.
Another mineral that may be appropriate for dating is todorokite. Todorokite is a
complex 3 x 3 tunnel structure (Post and Bish, 1988). Vasconcelos (1999) noted water
molecules in the todorokite crystal structure may be found in both well-defined
crystallographic sites and as a disordered water component. Todorokite can hold up to
10-12 wt% water in the crystallographic structure (Bish and Post, 1989), which is
released when heating from 200 to 500 °C, resulting in significant weight loss
(Vasconcelos, 1999). Although manganese oxides have a tunnel structure, they are not
capable of the same amount of cation exchange as zeolites, because the manganese oxide
tunnels are not linked infinitely in the tunnel direction (Bish and Post, 1989). A study
performed by Vasconcelos (1999), analyzed a todorokite sample crushed to different
sieve sizes and analyzed at two different labs. Although the samples have similar
potassium values, they show different results. One interpretation is that todorokite may
not retain Ar quantitatively in the tunnel sites and Ar loss may result from crushing or the
bake-out process performed before analyses (Vasconcelos, 1999). There is still much
work needed to determine the appropriateness of using todorokite for these dating
methods.
Birnessite is another mineral that is a potential candidate for either K/Ar or
40Ar/
39Ar dating. It has been shown by electron diffraction patterns and Rietveld
refinement to have a layered structure with ordered interlayer water molecules and

19
cations (Post, 1990). The Na-birnessite structure has been shown to collapse from 7 to 5
Å in the vacuum of an electron microscope (Post, 1990). This is possibly due to the loss
of interlayer water creating an unstable structure that may prevent successful analyses of
birnessite dated by K/Ar and 40
Ar/39
Ar (Vasconcelos, 1999). More work will need to be
performed to determine the suitability of birnessite for these dating methods.
1.3 Luis Lopez Manganese District
The Luis Lopez Manganese District is located southwest of Socorro, NM (Figure
1-6) within the eastern part of the Socorro caldera (Eggleston et al., 1983). It contains
several manganese deposits including the MCA, Tower, Nancy, Black Canyon, and
Gloriana mines, as well as other areas.
Figure 1-6: Location of the Luis Lopez Manganese District in New Mexico.
Temperatures of homogenization determined by Norman et al. (1983) indicate a
dynamic system repeatedly changing between hydrostatic and lithostatic pressures. This
Las Cruces
Luis Lopez
Manganese District
Socorro
Albuquerque
Santa Fe

20
may be explained by open fractures with hydrostatic pressure, which are then filled by
precipitated minerals resulting in lithostatic pressure, and then new fractures forming
with hydrostatic pressure (Norman et al., 1983). This process may explain the banded
mineralization seen in the district.
In a previous study by Eggleston et al. (1983), samples from different mines in the
Luis Lopez district were analyzed for oxygen and carbon isotopic compositions. This
data revealed an area of δ18
O enrichment over the “red alteration zone,” thought to be
formed from hydrothermal processes (Eggleston et al., 1983). Although Eggleston et al.
(1983) proposed the idea of rhyolitic volcanism near Socorro Peak as the source of heat
to drive the hydrothermal system, Lueth et al. (2004) goes even further by proposing the
heat source is an upper crustal composite granitic pluton associated with the Socorro
Peak rhyolite lava domes. The δ13
C values of -2.5 and -0.5 ‰ (PDB) are similar to other
epithermal vein deposits (Ohmoto and Rye, 1979; Eggleston et al., 1983), and Eggleston
et al. (1983) suggest the Luis Lopez manganese deposits formed from a circulating
hydrothermal system dominated by meteoric water. In this hypothesis, they thought δ18
O
rich waters leached manganese from the Hells Mesa Tuff, which was then precipitated to
formed the manganese deposits, which are dated between 6.33 and 6.71 Ma (Lueth et al.,
2004). Lueth et al. (2004) noted an unaltered rhyolite dike and a compositionally and
texturally equivalent rhyolite plug, dated at 11.05 ± 0.05 Ma and 10.99 ± 0.06 Ma,
respectively, in the Hells Mesa Tuff. Both cut the “red alteration zone” while the rhyolite
plug is cut by manganese veins (Lueth et al., 2004). Due to the incompatibility of the
model proposed by Eggleston et al. (1983) with the field relationships and the age dates,

21
the overall theory of the processes is plausible, but the source of the manganese proposed
by Eggleston et al. (1983) seems less likely.
Lueth et al. (2004) proposed a model for the formation of the Luis Lopez deposits
(Figure 1-4). This model indicates a hydrothermal system formed from hot fluids
circulating and moving progressively to the south. As the hydrothermal fluids moved
away from the rhyolite intrusions in the caldera and cooled, they precipitated the
manganese oxide minerals along faults and fractures. The Luis Lopez District is thought
to be similar to the Santa Eulalia District (Megaw, 1990; Lueth et al., 2004), and the
general genetic model for the Luis Lopez Manganese District (Figure 1-4) may be used to
represent similar processes at Santa Eulalia.
1.4 Objectives of Current Study
There are four main objectives for this study: 1) Identify the manganese oxide
minerals in each sample; 2) Evaluate oxygen and carbon isotopes for information
concerning the source of fluid, evolution of fluid, etc.; 3) Re-date the intrusive rocks
using the 40
Ar/39
Ar method to resolve previous inconsistencies in the K/Ar dating of
Megaw (1990); 4) Date manganese oxides from the AMOM and compare to the ages of
the intrusive rocks, especially the felsite intrusions, to determine if sulfide and AMOM
are contemporaneous.
22
2. METHODS
The data for Santa Eulalia was collected from samples sent by P.K.M. Megaw and
P.C. Goodell (UTEP). The four manganese oxide samples from Santa Eulalia are from
the West Camp, hosted in limestone, and include SE-PKM, collected by P.K.M. Megaw,
and SE-PGE, SE-PGD, and SE-bulk, collected by P.C. Goodell. The four intrusive rocks
from Santa Eulalia include Core 1, Felsite Core, Cp1813 2070’, and Cp1813 92’,
collected by P.K.M. Megaw. The data for Luis Lopez and Water Canyon was measured
from samples collected by V. Lueth and samples personally collected during this study.
2.1 Mineralogical Identification
Three methods were employed for the mineral identification. These include
petrographic microscope work, electron microprobe analyses, and X-ray diffraction
analyses. The petrographic work was only used to identify mineral grains used for the
40Ar/
39Ar dating process while preparing mineral separates of the intrusive and
manganese oxide rocks at New Mexico Institute of Mining and Technology.
2.1.1 Electron Microprobe Analyses
Microprobe quantitative point analyses were made to identify the types and
relative amounts of certain elements in the samples, including K, Mn, Zn, Pb, Ba, Na,
23
Ag, Fe, Si, and Ca. This data helped provide guidance for what part of the sample may
exhibit relatively higher amounts of K and may prove more useful for 40
Ar/39
Ar dating of
the manganese oxides. The relative amounts of the elements may also indicate the
presence of certain manganese oxide minerals, which can then be confirmed during the
X-ray diffraction analyses.
Electron Microprobe analyses were performed at New Mexico Institute of Mining
and Technology on the Cameca SX-100 microprobe. Quantitative point analyses were
performed on seven thin sections made from four Santa Eulalia rock samples, SE-PKM,
SE-PGE, SE-PGD, and SE-bulk. The beam current was 20 nA producing a spot size of
approximately 1 mm. The counting times were 40 seconds for Na and Ba, 10 sec for Zn
and Ag, and 20 sec for Mg, Si, K, Ca, Mn, Fe, S, and Pb. All microprobe data can be
found in Appendix B.
2.1.2 X-ray Diffraction Analyses
X-ray diffraction (XRD) analyses were performed to identify the type of
manganese oxide and other minerals present in each sample. This helped to understand
which separates contain fewer unnecessary minerals such as quartz, calcite, or goethite,
as well as, to understand the behavior of the samples during the 40
Ar/39
Ar dating process.
XRD analyses were obtained for manganese oxide and matrix separates of four
carbonate rock samples, SE-PKM, SE-PGE, SE-PGD, and SE-bulk, and mineral
separates of four intrusive rocks, Core 1, Felsite Core, Cp1813 2070’, and Cp1813 92’.
The XRD separates were prepared by taking the separate made for 40
Ar/39
Ar analyses and
crushing to powder. The powder was place on an XRD sample holder, making sure to
24
keep it below the top of the holder, and placed in the Panalytical X’pert Pro XRD
machine at New Mexico Institute of Mining and Technology. The samples were run from
a 2θ position of 6.0084 to 69.9794 with a step size of 0.0170. The scan step time was
10.1600 seconds for short scans and 152.4000 seconds for longer runs. All analyses were
run with a continuous scan, a scanning PSD mode, a 2θ PSD length of 2.12, a 2θ offset of
0.0000, Cu as the anode material, and in spinning mode. The machine was set to 40 mA
and 45 kV. The manganese oxide samples prepared for 40
Ar/39
Ar analyses were analyzed
with XRD to determine if they were appropriate for dating analyses, where as the
intrusive separates were analyzed to help interpret the 40
Ar/39
Ar step heating analyses. All
XRD data can be found in Appendix C.
2.2 Stable Isotope Geochemistry
Rock samples were prepared and carbon and oxygen stable isotope data was
collected to determine the origin of fluids responsible for AMOM mineralization in the
Santa Eulalia District. Previous δ18
O and δ13
C data for the Luis Lopez areas of the MCA
Mine, Tower Mine, and Gloriana Mine from a previous class project at New Mexico
Institute of Mining and Technology collected under the supervision of A. Campbell and
new isotopic data from the Luis Lopez areas of the MCA Mine, Nogal Canyon, Pretty
Girl Mine, Black Canyon Mine, and Nancy Mine along with data from the Water
Canyon, (Magdalena area) were compared to new data from Santa Eulalia to see if the
mineralization of the two districts is similar.
Carbon and oxygen isotope data were collected for four Santa Eulalia samples,
fifteen Luis Lopez samples, and six Water Canyon samples. The samples were prepared

25
by crushing and weighing out ~0.25 mg of the material, including ~0.25 mg for the
CaCO3 standards and ~0.50 mg for the BaCO3 standard, and placing in a round bottom
vial. The vial is capped with a green cap containing a gray septum. A blank with no
sample was placed at the beginning of the run, then the standards, and after the standards
every eighth vial contained a duplicate separate of the lab standard Mexican Calcite.
After all the vials were prepared with the separates, they were flushed with He for ~3
minutes. After the He flush, ~10 drops of phosphoric acid were added to each vial,
excluding the blank which contained no sample. The vials sat in the heating block at 45
°C for four hours before the run was started. The samples were run on the Finnigan Delta
XP Plus Isotope Ratio Mass Spectrometer with a PAL autosampler and Gas Bench II
continuous flow gas delivery system. All stable isotope data can be found in Appendix D.
2.3 40
Ar/39
Ar Geochronology Sample Preparation and Analyses
2.3.1 Intrusive Rocks Sample Preparation
This study involved dating intrusive rock samples to better understand the timing
of magmatism in the area. Previous dates were determined using the K/Ar method. This
study uses the 40
Ar/39
Ar method, which gives dates that are more precise and can account
for argon loss or non-atmospheric argon. In addition, this study attempts to resolve an
incompatibility between the K/Ar dates of the lamprophyre and the K/Ar dates of the
diabase sills and felsites, relative to cross-cutting relationships.
The four intrusive rock samples, Core 1 (lower diabase sill), Felsic Core (felsite),
Cp1813 2070’ (quartz monzonite), and Cp1813 92’ (upper diabase sill), were crushed and
sieved to a size of approximately 250 to 400 µm to minimize composite grains. The sieve
26
fraction was then rinsed in distilled H2O to clean the grains and remove any excess rock
dust. After identifying the desired mineral grains, they were hand-picked to make sample
separates for each rock sample. After analyzing the intrusive separates with the 40
Ar/39
Ar
dating method, XRD was used to identify the minerals of similar separates.
2.3.2 Manganese Oxides Sample Preparation
Samples of manganese oxide were dated using the 40
Ar/39
Ar dating method to
establish the time of mineralization of these minerals. Comparison of this data with the
intrusive rocks helped to assess whether the felsites caused the manganese mineralization.
The carbonate-hosted rocks, SE-PKM, SE-PGE, SE-PGD, and SE-bulk, exhibit
different textures of manganese oxide mineralization (Appendix A). Figure 2-1 shows
vein and dendritic mineralization in sample SE-PKM, one of the three manganese rocks
dated. Each texture was individually separated. In order to make each separate, each rock
was broken into chunks representing each mineralization style and placed into separate
glass beakers. Undiluted HCl was added to each beaker to dissolve the CaCO3. The
separates were then rinsed in H2O and dried in the oven. Once dried, unwanted minerals
such as quartz, micas, and iron oxides were picked out of the separates. Once the
separates were considered clean, they were analyzed by X-ray diffraction to select which
mineral separates were best suited for the 40
Ar/39
Ar dating process.

27
Figure 2-1: Photograph of the SE-PKM-1 thin section used for microprobe analyses.
Relationship of veins and dendrites is shown.
2.3.3 Irradiation Procedures
The intrusive rock mineral separates were placed in 20-hole irradiation trays and
irradiated for approximately 10 hours, and the manganese oxide mineral separates were
placed in 6-hole irradiation trays and irradiated for approximately 7 hours. Both
irradiation batches were irradiated along with 28.02 Ma (Renne et al., 1998) neutron
fluence monitor Fish Canyon sanidine in the USGS TRIGA reactor at the Denver Federal
Center, Colorado. Once the samples returned from the reactor, they were loaded into laser
trays for analyses. The intrusive rock separates were placed in a 61-hole laser tray in a
manner that resembled a checkered pattern, skipping holes that are next to other holes
with separates in them, and the manganese oxide separates were loaded into a 10-hole
laser tray.
Vein
Dendrites
0.25 in

28
2.3.4 Analytical Methods
Each separate was step-heated to produce an age-spectrum. The step-heating
schedule depended on the type of separate. To determine the heating schedule for the K-
feldspar, a similar K-feldspar was step-heated to see how much argon was released at
certain temperatures. For the other intrusive rock minerals, we used heating schedules
previously determined for the specific mineral. The step-heating schedules for the
manganese oxide separates were determined by running a manganese oxide separate
using a previously determined schedule used at NMGRL to see if it was appropriate for
the manganese oxide samples.
The step-heating was performed by heating with the NMGRL CO2 laser and
analyzed in the MAP 215-50 at New Mexico Institute of Mining and Technology,
Socorro, New Mexico. The intrusive rock samples were heated for 30 seconds at each
specified temperature, and the manganese oxide samples were heated for 45 seconds at
the specified temperatures. The clean up times for the intrusive rocks for the 1st and 2
nd
stages were 90 seconds each for all minerals except the biotite, where they were 120
seconds each. The manganese oxide sample clean up times for the 1st and 2
nd stages were
540 seconds and 180 seconds, respectively. The CO2 laser beam was defocused to about
4x4 mm for the intrusive rock samples and about 6x6 mm for the manganese oxide
samples to heat the separates more evenly. The detectors used for the intrusive rocks
include both the Multiplier and Faraday, with the Faraday detector only being used when
the sample yielded large 37
Ar beams, and only the Multiplier was used for the manganese
oxide samples. The data tables, J factors, watts for each heating step, and correction
factors can be found in Appendix E.

29
3. RESULTS
3.1 Mineral Identification
Microprobe and X-ray diffraction analyses were performed for four rocks from
Santa Eulalia to determine the mineralogy of the manganese oxides. All data for
microprobe and XRD analyses are located in Appendix B and C, respectively.
3.1.1 Electron Microprobe Analyses
Two hundred and twenty-seven points have been quantitatively analyzed in four
different rock samples (Appendix B) from Santa Eulalia. Fifty-three of the points have at
least 59 %FeO. One of the 227 points has 85 %CaO. Of the points with at least 44
%MnO, 25 have at least 13 %PbO, 1 has at least 10 %ZnO, and 20 have at least 2 %K2O
(Figure 3-1). During microprobe analyses, the samples were determined to have
manganese oxides intimately intergrown with other minerals, such as calcite (Figure 3-2).
Initially, the microprobe analyses were focused on evaluating the potential
effectiveness of using the 40
Ar/39
Ar dating method for the manganese oxides. The
manganese oxides must contain enough K2O, to be useful in the 40
Ar/39
Ar dating method.
Figure 3-1 shows %MnO ranging from 0 to about 95 % and %K2O from 0 to almost 5 %.
The four rocks have different ranges in K2O, while the ranges of MnO for the samples are

30
similar. SEPKM and SEPGE have the largest range of %K2O and SEPKM has the largest
range of %MnO.
Figure 3-1: All microprobe analyses plotted with %K2O versus %MnO.
Figure 3-2: Relationship of manganese oxides (gray) and other minerals, such as calcite
(black) in SE-PKM microprobe backscatter image. Elements with higher atomic weights
are lighter in color than those with lower atomic weights.

31
Ternary diagrams were constructed to indicate which manganese minerals are
present in those microprobe analyses that contain at least 44 %MnO. A minimum of 44
%MnO was chosen because this is the lowest %MnO value greater than those determined
to be mixed phases and non-manganese phases. XRD analyses were used to confirm the
interpretations from the microprobe analyses.
The ternary diagram in figure 3-3 shows the microprobe analyses containing at
least 44 %MnO and normalized to the three components of K2O+PbO+ZnO, CaO, and
MgO. Only points with at least 44 %MnO were used in this figure to ensure high Fe,
possibly goethite, and calcite data points were not reassigned as a manganese mineral,
and all the points on the diagram have at least 2 % of one of the components to ensure
trace elements are not included in the mineral identification. This diagram is mainly used
to identify the birnessite and todorokite data points. There are two main groupings of
points on this diagram that plot close to the CaO - MgO side of the diagram. These
groups are interpreted to be birnessite and todorokite. Due to the similarity in the
chemical formulas of birnessite and todorokite (Table 3-1) it is difficult to differentiate
between the two minerals through chemical analyses. X-ray diffraction analyses were
used to differentiate between the two minerals.
Figure 3-4 is a ternary diagram with the components of K2O, PbO, and ZnO. The
analyses on this diagram contain at least 44 %MnO, at least 2% of one of the
components, and the points are normalized to the three components. This diagram is used
to differentiate cryptomelane, coronadite, and chalcophanite in the electron microprobe
data sets. Numerous analyses plot close to the K2O corner along the K2O - ZnO side of
the diagram and contain less than 20 %PbO. These points are interpreted to be

32
cryptomelane because of high manganese (~65-75 %MnO, with most between 70 and 73
%MnO) and high potassium (~2-5 %K2O, with most between 3.5 and 4.3 %K2O). The
points that plot close to PbO are interpreted to be coronadite because of high lead (~13-
30 %PbO) and high manganese (~45-60 %MnO) content and low amounts of iron,
calcium, potassium, sodium, and other elements, as indicated by electron microprobe
analyses. There are two points that plots in the corner of ZnO. The one closest to the ZnO
corner is interpreted to be chalcophanite because of the high zinc (~10 %ZnO) and high
manganese (~60 %MnO) content, and the other point is todorokite or birnessite because
of the high manganese (~65 %MnO), high calcium (~2 %CaO), high magnesium (~2
%MgO), and potassium of moderate level (~0.5 %K2O). There is one point that plots
towards the center of the diagram and is interpreted to be birnessite or todorokite because
of the moderate manganese (~59 %MnO), high calcium (~3.5 %CaO), high magnesium
(~1.4 %MgO), and moderate potassium (~0.7 %K2O).
Figure 3-3: Microprobe data using data points with at least 44% MnO and at least 2% of
one of the components, eliminating high Fe or Ca data points and trace elements. The
data are normalized to the components of K2O+PbO+ZnO, CaO, and MgO.
birnessite and todorokite

33
Figure 3-4: Microprobe data using points with at least 44% MnO and at least 2% of one
of the components, eliminating high Fe, high Ca data points and analyses with K2O, PbO,
and ZnO less than 2%. The data are normalized to the components of K2O, PbO, and
ZnO.
Table 3-1: Manganese oxide minerals and formulas (Vasconcelos, 1999; Back and
Mandarino, 2008).
Mineral Formula Group
Cryptomelane (K,Ba)1-2Mn8O16.xH2O Coronadite
Coronadite (Pb,Ba,K)1-2Mn8O16.xH2O Coronadite
Chalchophanite (Zn,Fe,Mn)Mn3O7.3H2O Chalcophanite
Todorokite (Ca,Na,K)(Mg,Mn2+
)Mn5O12.xH2O Coronadite
Birnessite (Na,Ca,K)(Mg,Mn)Mn6O14.5H2O Birnessite
3.1.2 X-ray Diffraction Analyses
Several separates were prepared for X-ray diffraction analyses from four rock
samples containing manganese oxides hosted in carbonate from Santa Eulalia. These
were analyzed to identify both minerals in the manganese oxides and in the carbonates of
each rock. Table 3-2 summarizes the XRD results of the manganese oxide separates.

34
Separates similar to those run for 40
Ar/39
Ar analyses of the intrusive rocks were also
prepared and run. All XRD scans are located in Appendix C.
Four separates from SE-PKM-1 were analyzed using XRD during preparation for
40Ar/
39Ar analyses and are presented in figure 3-5. The presence of many similar peaks
indicates the mineral separates share a similar mineralogy. Although the four separates
have many peaks in common, there are a few peaks that only show up in a few of the
scans. Cryptomelane and coronadite peaks are identified in all four separates, indicating
the presence of the minerals in all the separates for SE-PKM-1. Talc was present for the
veins, but absent for the dendrites. Goethite was found within the dendrites, but absent
for the veins. Other minerals such as birnessite, quartz, and illite were also identified in
some of the separates.
Figure 3-5: SE-PKM-1 scans of separates dated using the 40
Ar/39
Ar method. The red and
blue are from veins and the green and magenta are from dendrites.
10 15 20 25 30 35 40 45 50 55 60 652Theta (°)
0
100
400
900
1600
Inte
nsity (
counts
)
Ta
Ta
C, C
o, B
C = Cryptomelane Gy= Gypsum Co= Coronadite I = Illite B = Birnessite Ta = Talc T = Todorokite G = Goethite Q = Quartz Ca= Calcite
C, C
o, I
C, C
o, T
a
C, C
o, G
C, C
o, B
, Q
B, T
a C
, Co
, B, Q
C, C
o, B
C
, Co
, B, T
a, Q
Ta, Q
C, C
o, B
, Ta,
Q Q
, G
C, C
o, G
I, Q
C, C
o, Q
, G
Q
C, C
o, Q
, G
C, C
o, B
, Q, G
B
B

35
The separates from SE-bulk-1 and SE-PGE-1 were analyzed using XRD during
preparation for 40
Ar/39
Ar analyses and are presented in figure 3-6. These two separates
have many similar peaks for the mineral todorokite indicating the presence of the mineral
in both separates. SE-bulk-1 has many peaks corresponding to calcite that do not show up
in the SE-PGE-1 separate indicating the presence of more calcite in SE-bulk-1. The
presence of more calcite in SE-bulk-1 may be due to the calcite being intimately
intergrown with the manganese minerals (Figure 3-2).
Figure 3-6: The two todorokite separates dated using the 40
Ar/39
Ar method. The red is
SE-bulk-1 and the blue is SE-PGE-1.
Table 3-2: Minerals indentified in six manganese oxide separates. The scan colors for SE-
PKM-1 correspond to colors in figure 3-5, and scan colors for SE-bulk-1 and SE-PGE-1
correspond to figure 3-6.
10 15 20 25 30 35 40 45 50 55 60 652Theta (°)
0
100
400
900
Inte
nsity (
counts
)
Sample Scan Color Mineral Morphology Manganese Minerals Other Minerals
SE-PKM-1 red Vein Birnessite, Coronadite, Cryptomelane Talc, Other clays
blue Vein Birnessite, Coronadite, Cryptomelane Quartz, Illite, Talc, Other clays
green Dendrite Coronadite, Cryptomelane Goethite, Quartz
magenta Dendrite Birnessite, Coronadite, Cryptomelane Quartz
SE-bulk-1 red Dendrite Todorokite Calcite, Quartz
SE-PGE-1 blue Dendrite Todorokite Goethite, Quartz, Illite
C= Cryptomelane Gy=Gypsum Co=Coronadite I= Illite B= Birnessite Ta= Talc T= Todorokite G= Goethite Q= Quartz Ca=Calcite
T
T
Q
Ca
Ca
T
T, C
a
T, C
a
T, C
a T,
Ca
T, C
a, Q
Ca
I
I, Q
T T
T, Q
Ca
Ca
Ca
Ca

36
3.1.3 Synthesis of Electron Microprobe and X-ray Diffraction
Figure 3-7 shows the processes followed to determine the minerals present in the
AMOM samples. Using both the microprobe and XRD analyses, mineralogies were
assigned to the quantitative microprobe data points and plotted in figure 3-8. The
manganese minerals determined through microprobe analyses are cryptomelane
(including low K cryptomelane), birnessite, todorokite, coronadite, and chalcophanite
(Figure 3-8). Other minerals inferred by the microprobe data include calcite and a high Fe
phase, possibly goethite. There are also a few mixed phase microprobe points, possibly
resulting from the microprobe beam hitting more than one crystal therefore analyzing
more than one mineral in the sample, designated as unknown (Figure 3-8). XRD analyses
confirm many of the minerals inferred by the microprobe analyses including
cryptomelane, birnessite, todorokite, coronadite, calcite, and goethite. XRD analyses also
indicate the presence of quartz and clay minerals including talc and illite. No
chalcophanite was found during the XRD analyses, but chalcophanite shares many of the
same major XRD peaks as cryptomelane and coronadite and may have been overlooked.
Birnessite and todorokite have similar quantitative analyses in the microprobe analyses
and XRD analyses were used to differentiate between them in the microprobe analyses.
Microprobe and XRD analyses of the AMOM samples did not detect any significant
silver and no sulfosalts were found in the samples studied.

37
Figure 3-7: Flow chart of processes followed to identify the minerals in the AMOM.
Figure 3-8 shows some interesting relationships between different potassium and
manganese values. There are two groupings of birnessite. One group contains between 1
and 1.75 %K2O and MnO just below 70 %. The other group contains approximately 0
%K2O and MnO around 75 to 80 %. This may be due to the substitution of different
elements in the birnessite structure. Sodium, calcium, and potassium can substitute for
one another in one structure site, while magnesium and manganese can substitute for each
other in another structure site (Vasconcelos, 1999). Another interesting feature seen in
this figure is that as the %MnO and %K2O covary until the manganese reaches about 70
%. At about 70 %MnO, the potassium can range up to increase to almost 5 %K2O.
Different manganese oxide minerals can be interpreted at specific areas along this curve.
The major and trace elements of AMOM at Santa Eulalia are similar to other manganese
deposits. Major and trace elements at the Luis Lopez district in New Mexico show
manganese of about 40 to 50 %Mn, lead of about 0.45 to 5 %Pb, and zinc of about 0.04
to 0.60 %Zn (Norman et al., 1983).
Electron Microprobe Analyses X-ray Diffraction Analyses
Ternary Diagrams
Mineral Identification
Re-check Mineral Identifications
against Electron Microprobe and
X-ray Diffraction Analyses

38
Figure 3-8: Microprobe data %K2O vs. %MnO plotted by inferred mineral.
3.2 Stable Isotope Geochemistry
Carbon and oxygen isotopes were analyzed for limestones from the Santa Eulalia
District, Mexico and calcites from the Luis Lopez Manganese District and Water Canyon
areas, New Mexico. The reproducibility of δ13
C on duplicate samples ranges from 0.04 to
0.38 ‰, with an average of ± 0.12 ‰ and the reproducibilty of δ18
O on duplicate samples
ranges from 0.13 to 0.40 ‰, with an average of ± 0.20 ‰. All stable isotope data for
Santa Eulalia, Luis Lopez, and Water Canyon are located in Appendix D.
All data for Santa Eulalia, including limestone and calcite values determined by
Megaw (1990) and during this study, are plotted in figure 3-9. The limestone values
range from -7.6 to 3.0 ‰ δ13
C and 13.5 to 24.3 ‰ δ18
O. δ13
C values of new Santa Eulalia
limestone samples range from -7.6 to -2.2 ‰ and δ18
O values range from 16.6 to 23.6 ‰
(Figure 3-9), and three hydrothermal calcite separates have values of -10.1, -10.0, and -

39
1.6 ‰ δ13
C and 12.8, 12.7, and 15.4 ‰ δ18
O, respectively. The background values of the
Finlay Limestone near Santa Eulalia are approximately -0.8 ‰ and 21.8 ‰ for δ13
C and
δ18
O, respectively (Megaw, 1990). δ13
C and δ18
O data reported by Megaw (1990) were
plotted against distance from ore veins in figures 3-10 and 3-11, respectively. Both δ13
C
and δ18
O values become lighter nearer the vein.
Old and new δ13
C and δ18
O values of calcite for Luis Lopez are plotted in figure
3-12 along with new calcite data for Water Canyon. δ13
C values for Luis Lopez range
from -7.7 to 1.2 ‰ and δ18
O values range from 11.6 to 24.5 ‰. δ13
C values for Water
Canyon range from -0.6 to -4.3 ‰ and δ18
O values range from 15.3 to 19.7 ‰. The
values in figure 3-12 show an inverse relationship between the δ13
C and δ18
O values.
The δ13
CHCO3- and δ18
OH2O were calculated for Luis Lopez from δ13
C and δ18
O
values of calcite, using equation from Deines et al. (1974) and Kim and O’Neil (1997)
and average temperatures determined by Norman et al. (1983), and are plotted in figure
3-13. This figure shows the range of δ13
CHCO3- is from -6.5 to 2 ‰ and the range of
δ18
OH2O is from 10 to 25 ‰. Fluid values were not calculated for all calcite values,
including Water Canyon, Nogal Canyon, and Pretty Girl, due to the lack of temperature
information.

40
Figure 3-9: δ13
C vs. δ18
O values for calcite and limestone (Megaw, 1990) and new
limestone samples (this study) for Santa Eulalia.
Figure 3-10: Santa Eulalia δ13
C plotted against distance from ore veins in meters
(Megaw, 1990). Unaltered Finaly Limestone is considered background with δ13
C value of
-0.8 ‰.
-12
-10
-8
-6
-4
-2
0
2
4
10 15 20 25
δ1
3 C
δ18O
Deep Drill Samples
New Samples
Buena Tierra Mine ore calcite
Buena Tierra Mine limestone
Mn Altered Finlay LS N West Camp
San Antonio Mine ore calcite
San Antonio Mine limestone
Unaltered Finlay LS
-12
-10
-8
-6
-4
-2
0
2
4
0 25 50 75 100 125 150 175 200 225
δ1
3 C
Distance (m)
Deep Drill Samples
Buena Tierra Mine ore calcite
Buena Tierra Mine limestone
Mn Altered Finlay LS N West Camp
San Antonio Mine ore calcite
San Antonio Mine limestone
Unaltered Finlay LS

41
Figure 3-11: Santa Eulalia δ18
O plotted against distance from ore veins in meters
(Megaw, 1990). Unaltered Finaly Limestone is considered background with δ18
O value of
21.8 ‰.
Figure 3-12: δ13
C and δ18
O values of calcite for Luis Lopez and Water Canyon, New
Mexico.
12
14
16
18
20
22
24
26
0 25 50 75 100 125 150 175 200 225
δ1
8 O
Distance (m)
Deep Drill Samples
Buena Tierra Mine ore calcite
Buena Tierra Mine limestone
Mn Altered Finlay LS N West Camp
San Antonio Mine ore calcite
San Antonio Mine limestone
Unaltered Finlay LS
-8
-7
-6
-5
-4
-3
-2
-1
0
1
2
10 12 14 16 18 20 22 24 26
δ1
3 C
δ18O
New MCA
New Nogal Canyon
New Pretty Girl
New Black Canyon
New Nancy
New Water Canyon
Old Tower Mine
Old MCA
Old Gloriana

42
Figure 3-13: Luis Lopez data with δ13
CHCO3- vs. δ18
OH2O. Equations from Deines et al.
(1974) and Kim and O’Neil (1997) and temperatures determined by Norman et al. (1983)
were used to calculate δ13
CHCO3- and δ18
OH2O, respectively.
Rock samples at Luis Lopez and Water Canyon show variations in the carbon and
oxygen isotopes between calcite bands. Figures 3-14 through 3-17 show the carbon and
oxygen calcite values of individual rocks from different locations. Sequential carbonate
bands were sampled. In some rock samples the order of calcite band formation may be
inferred by textures and are labeled with numbers, with “1” being the first formed. The
order of calcite band formation in other rocks is not as easily inferred and is labeled with
letters to designate the relative timing even though it is not clear which end of the trend is
first.
Most rock samples at the MCA mine (Figure 3-14) exhibit a strikingly linear
trend in the carbon and oxygen isotope values. Some rock samples, such as MCA-1,
MCA-2, and MCA-7 do not vary along this linear trend, but instead exhibit a small
-7.00
-6.00
-5.00
-4.00
-3.00
-2.00
-1.00
0.00
1.00
2.00
3.00
9.00 11.00 13.00 15.00 17.00 19.00 21.00 23.00 25.00
δ1
3 CH
CO
3-
δ18OH2O
MCA
Black Canyon
Nancy
Old Tower Mine
Old MCA
Old Gloriana

43
variation around one end of the over-all trend. MCA-4 has one point that is different than
the over-all linear trend of the rock, but this point is not too far from the over-all trend of
the MCA mine.
Figure 3-14: δ13
C vs. δ18
O of calcite of seven rocks at the MCA mine.
Figures 3-15 and 3-16 show the carbon and oxygen values of calcite of individual
rock samples at Nogal Canyon and Black Canyon mine, respectively. The rock Nogal-2
shows a small variation in carbon and oxygen isotopes before moving along a linear trend
with progressively heavier oxygen and lighter carbon values (Figure 3-15). The rock BC-
2 shows a large variation in carbon and oxygen isotopes values that jump back and forth
along a linear trend (Figure 3-16).
-6
-5
-4
-3
-2
-1
0
1
11 13 15 17 19 21 23 25
δ1
3 C
δ18O
MCA-1
MCA-2
MCA-3
MCA-4
MCA-5
MCA-6
MCA-71
5
A
D
1
4
1
4A
H
1
22
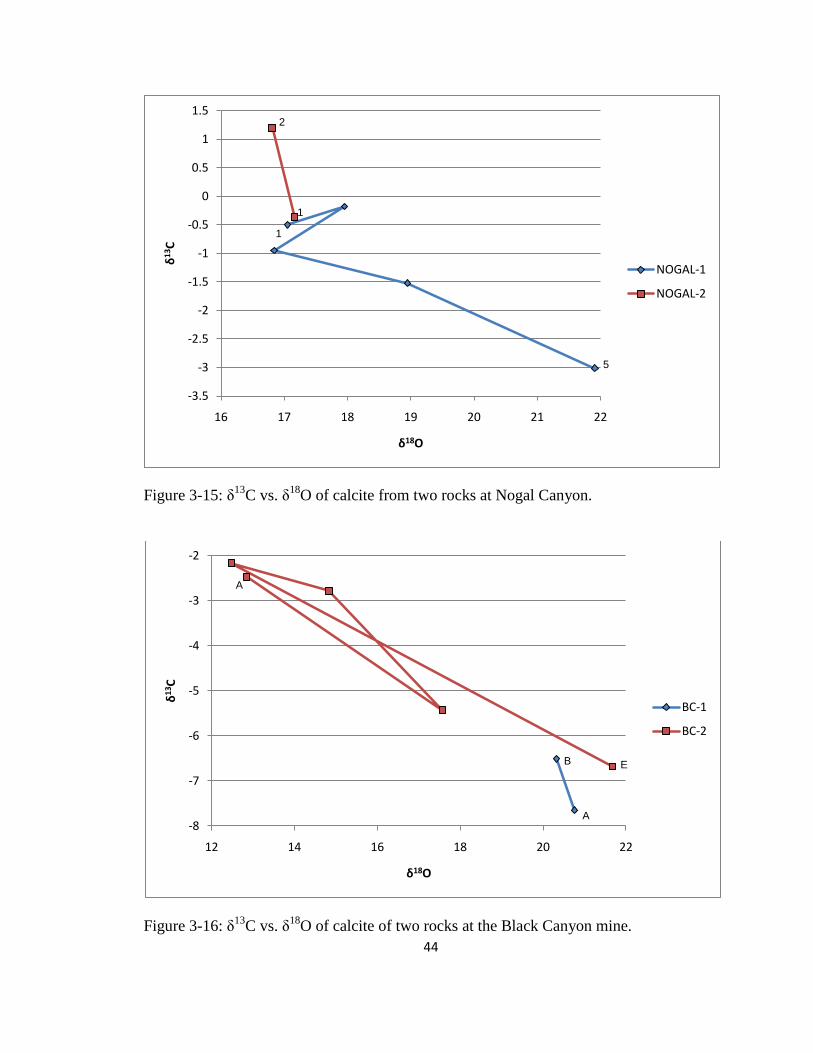
44
Figure 3-15: δ13
C vs. δ18
O of calcite from two rocks at Nogal Canyon.
Figure 3-16: δ13
C vs. δ18
O of calcite of two rocks at the Black Canyon mine.
-3.5
-3
-2.5
-2
-1.5
-1
-0.5
0
0.5
1
1.5
16 17 18 19 20 21 22
δ1
3 C
δ18O
NOGAL-1
NOGAL-2
1
5
1
2
-8
-7
-6
-5
-4
-3
-2
12 14 16 18 20 22
δ1
3 C
δ18O
BC-1
BC-2
A
B
A
E

45
Figure 3-17 shows the carbon and oxygen values of calcite of individual rock
samples at Water Canyon. This figure shows two major lines of variation where one is
shifted from the other with a similar slope. There is great variability in the carbon and
oxygen values among the different rock samples at Water Canyon. Some samples show a
progression along the major linear trend (003304B and 003308), but other samples jump
back and forth along the over-all trend (003301, 003304, and 003304A).
Figure 3-17: δ13
C vs. δ18
O of calcite of six rocks at Water Canyon.
3.3 40
Ar/39
Ar Geochronology
As described above, intrusive rocks and manganese oxides from Santa Eulalia
were analyzed using the 40
Ar/39
Ar dating method. All data tables, individual step-heating
spectra, and isochrons are in Appendix E.
-4.5
-4
-3.5
-3
-2.5
-2
-1.5
-1
-0.5
15 16 17 18 19 20
δ1
3 C
δ18O
'003301
'003303
'003304
'003304A
'003304B
'003308
15
A
B
1
2
21
3
A
D
A
C
A
C

46
3.3.1 Intrusive Rocks
The four intrusive rock samples analyzed using the 40
Ar/39
Ar method in this study
are from the Santa Eulalia drill hole Cp1813 (Figure 3-18). The samples include a felsite
with unknown depth (Felsic Core), a quartz monzonite from 2070’ (Cp1813 2070’), and
two diabase sills with one from 92’ (Cp1813 92’), known as the upper sill, and one from
unknown depth (Core 1), known as the lower sill.
Figure 3-18: West-East cross-section of drill hole Cp1813, looking North. Approximate
locations of the four rock units are shown. Modified from (Hewitt, 1968).
Plagioclase and groundmass step-heating results for Felsic Core are presented in
figure 3-19. The age spectra for both separates are fairly flat. They also meet the plateau
criteria with at least three contiguous steps with overlapping ages containing at least 50 %
of the gas released. The plateaus contain approximately 70 % and 96 % of the gas for
Quartz monzonite
Felsite
Upper sill
Lower sill

47
groundmass and plagioclase, respectively. The individual steps for the groundmass
separate are more precise than the steps for the plagioclase separate. The plagioclase
plateau age is 34.3 ± 0.5 Ma. The groundmass plateau age is 33.06 ± 0.11 Ma. The
plateau ages of the plagioclase and groundmass separates do not agree within 2σ error.
The plagioclase separate has a lower 40
Ar*, reaching a maximum of about 40 %, than the
groundmass separate, which reaches a maximum of about 90 %. The plagioclase Cl/K is
higher, with an average around 0.003, than the groundmass Cl/K, which has an average
around 0.00003. The plagioclase K/Ca averages around 0.1, compared to the groundmass
K/Ca of about 4. The plagioclase and groundmass isochrons show 40
Ar/36
Ar intercepts
similar to atmospheric argon (295.5) with isochron ages of 33.6 ± 1.3 Ma and 33.4 ± 0.6
Ma, respectively (Figures E-5 and E-6 in Appendix E).

48
Figure 3-19: 40
Ar/39
Ar Step-Heating Spectra for Runs 59516-01, 59517-01 (Felsic Core).
Plagioclase (black) and groundmass (red).
Plagioclase and K-feldspar step-heating results for Cp1813 2070’ are shown in
figure 3-20. The age spectra are discordant and do not meet the plateau criteria because it
does not contain at least three contiguous steps containing at least 50 % of the gas
released. The precision of individual analytical steps of the two separates are similar. For
the plagioclase, a weighted-mean age was calculated for steps I through M and resulted in
an age of 43.9 ± 0.9 Ma. For the K-feldspar, a weight-mean age was calculated for steps
E through J and resulted in an age of 41.4 ± 0.8 Ma. The plagioclase and K-feldspar
separates do not agree within 2σ error. The 40
Ar* for both minerals start low at around 20
to 35 % and rise to around 70 %. The plagioclase Cl/K is higher, with an average around
0.006, than the K-feldspar Cl/K, which has an average around 0.003. The plagioclase
40Ar/
39Ar Step-Heating Spectra for Runs 59516-01, 59517-01 (Felsic Core)
0
20
40
60
80
100
0.0001
0.001
0.01
0.1
1
10
0 10 20 30 40 50 60 70 80 90 100
30
35
40
A
B C
D E
F
G
HI
J
Integrated Age (59516-01) = 34.5 ± 1.0 Ma
34.3 ± 0.5 Ma (MSWD = 1.14, n = 9)
A
BC D E F G
H
I J
Integrated Age (59517-01) = 32.92 ± 0.18 Ma
33.06 ± 0.11 Ma (MSWD = 1.64, n = 5)Data at 2-s igma, res ults at 2-s igma
Cumulative %39Ar Released
% 40Ar*
Cl/K
K/Ca
Apparent
Age (Ma)

49
K/Ca is lower, at around 0.3, than the K-feldspar K/Ca, which has an average around 6.
Figures 3-21 and 3-22 show 40
Ar/36
Ar intercepts greater than atmospheric argon (295.5),
360 ± 4 and 340 ± 20, respectively. The isochron ages are 38.7 ± 0.6 Ma for plagioclase
and 38.3 ± 1.9 Ma for K-feldspar.
Figure 3-20: 40
Ar/39
Ar Step-Heating Spectra for Runs 59518-01, 59519-05 (Cp1813
2070’). Plagioclase (black) and K-feldspar (red).
40Ar/
39Ar Step-Heating Spectra for Runs 59518-01, 59519-05 (Cp 1813 2070')
20
40
60
80
0.001
0.01
0.1
1
10
0 10 20 30 40 50 60 70 80 90 100
30
40
50
60
G
HI J
K L
M
Integrated Age (59518-01) = 47.1 ± 0.4 Ma
A
B
CD
EF
GH
I
J
Integrated Age (59519-05) = 41.8 ± 0.4 Ma
Data at 2-s igma, res ults at 2-s igma
Cumulative %39Ar Released
% 40Ar*
Cl/K
K/Ca
Apparent
Age (Ma)
43.9 ± 0.9 Ma
41.4 ± 0.8 Ma
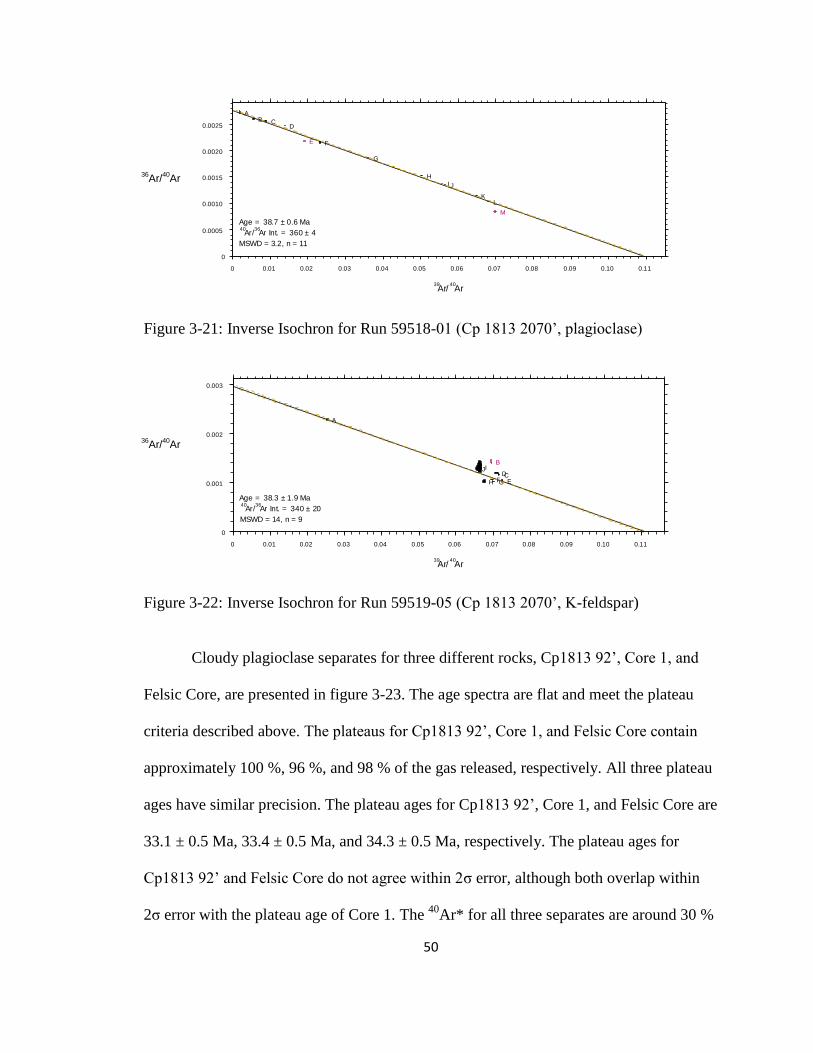
50
Figure 3-21: Inverse Isochron for Run 59518-01 (Cp 1813 2070’, plagioclase)
Figure 3-22: Inverse Isochron for Run 59519-05 (Cp 1813 2070’, K-feldspar)
Cloudy plagioclase separates for three different rocks, Cp1813 92’, Core 1, and
Felsic Core, are presented in figure 3-23. The age spectra are flat and meet the plateau
criteria described above. The plateaus for Cp1813 92’, Core 1, and Felsic Core contain
approximately 100 %, 96 %, and 98 % of the gas released, respectively. All three plateau
ages have similar precision. The plateau ages for Cp1813 92’, Core 1, and Felsic Core are
33.1 ± 0.5 Ma, 33.4 ± 0.5 Ma, and 34.3 ± 0.5 Ma, respectively. The plateau ages for
Cp1813 92’ and Felsic Core do not agree within 2σ error, although both overlap within
2σ error with the plateau age of Core 1. The 40
Ar* for all three separates are around 30 %
Isochron for Run 59518-01 (Cp 1813 2070')
0 0.01 0.02 0.03 0.04 0.05 0.06 0.07 0.08 0.09 0.10 0.11
0
0.0005
0.0010
0.0015
0.0020
0.0025
AB C
D
E F
G
H
I J
KL
M
Age = 38.7 ± 0.6 Ma40
Ar/36
Ar Int. = 360 ± 4
MSWD = 3.2, n = 11
39Ar/
40Ar
Isochron for Run 59519-05 (Cp 1813 2070')
0 0.01 0.02 0.03 0.04 0.05 0.06 0.07 0.08 0.09 0.10 0.11
0
0.001
0.002
0.003
A
B
CD
EFGH
IJ
Age = 38.3 ± 1.9 Ma40
Ar/36
Ar Int. = 340 ± 20
MSWD = 14, n = 9
39Ar/
40Ar
36Ar/
40Ar
36Ar/
40Ar

51
or less. The Felsic Core separate has the highest 40
Ar* with a maximum of about 34 %.
The plagioclase separates for Cp1813 92’ and Core 1 show similar Cl/K patterns and both
have an average around 0.001. The Cl/K for Felsic Core has a similar shape as the other
two separates, but it has higher Cl/K values ranging between 0.001 and 0.01. Cp1813 92’
and Core 1 have similar K/Ca values with an average around 1 and Core 1 rising to 2.
The Felsic Core plagioclase has a similar K/Ca pattern compared to the other two
separates, but it has lower K/Ca with an average around 0.1. Figures E-5, E-9, and E-10
(Appendix E) show 40
Ar/36
Ar intercepts similar to atmospheric argon (295.5) and
isochron ages of 33.6 ± 1.3 Ma for Felsic Core, 33.0 ± 0.9 Ma for Cp1813 92’, and 33.4 ±
1.1 Ma for Core 1.
Figure 3-23: 40
Ar/39
Ar Step-Heating Spectra for Runs 59511-01, 59514-01, 59516-01
(Cp1813 92’, Core 1, and Felsic Core). Cloudy plagioclase from Cp1813 92’ (black),
Core 1(red), and Felsic Core (green).
40Ar/
39Ar Step-Heating Spectra for Runs 59511-01, 59514-01, 59516-01 (Cp 1813 92, Core 1 and Felsic Core)
0
10
20
30
0.001
0.01
0.01
0.1
1
0 10 20 30 40 50 60 70 80 90 100
25
30
35
40
45
B
C
D
E
F
G HI
J
K L M
Integrated Age (59511-01) = 33.3 ± 1.4 Ma
33.1 ± 0.5 Ma (MSWD = 1.61, n = 11)
B
C
D
E
F G
HI
J
KL
M
NO
Integrated Age (59514-01) = 33.5 ± 1.5 Ma
33.4 ± 0.5 Ma (MSWD = 1.12, n = 13)
A
B C
D EF
G
HI
JIntegrated Age (59516-01) = 34.5 ± 1.0 Ma
34.3 ± 0.5 Ma (MSWD = 1.14, n = 9)Data at 2-s igma, res ults at 2-s igma
Cumulative %39Ar Released
% 40Ar*
Cl/K
K/Ca
Apparent
Age (Ma)
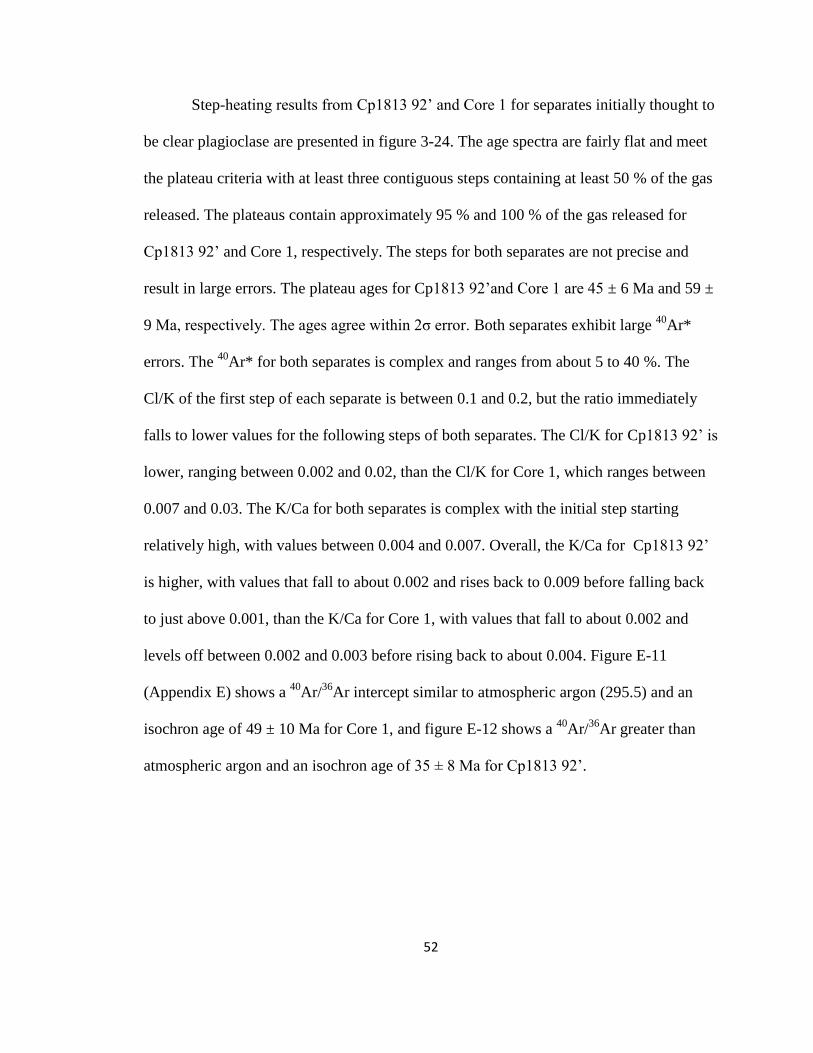
52
Step-heating results from Cp1813 92’ and Core 1 for separates initially thought to
be clear plagioclase are presented in figure 3-24. The age spectra are fairly flat and meet
the plateau criteria with at least three contiguous steps containing at least 50 % of the gas
released. The plateaus contain approximately 95 % and 100 % of the gas released for
Cp1813 92’ and Core 1, respectively. The steps for both separates are not precise and
result in large errors. The plateau ages for Cp1813 92’and Core 1 are 45 ± 6 Ma and 59 ±
9 Ma, respectively. The ages agree within 2σ error. Both separates exhibit large 40
Ar*
errors. The 40
Ar* for both separates is complex and ranges from about 5 to 40 %. The
Cl/K of the first step of each separate is between 0.1 and 0.2, but the ratio immediately
falls to lower values for the following steps of both separates. The Cl/K for Cp1813 92’ is
lower, ranging between 0.002 and 0.02, than the Cl/K for Core 1, which ranges between
0.007 and 0.03. The K/Ca for both separates is complex with the initial step starting
relatively high, with values between 0.004 and 0.007. Overall, the K/Ca for Cp1813 92’
is higher, with values that fall to about 0.002 and rises back to 0.009 before falling back
to just above 0.001, than the K/Ca for Core 1, with values that fall to about 0.002 and
levels off between 0.002 and 0.003 before rising back to about 0.004. Figure E-11
(Appendix E) shows a 40
Ar/36
Ar intercept similar to atmospheric argon (295.5) and an
isochron age of 49 ± 10 Ma for Core 1, and figure E-12 shows a 40
Ar/36
Ar greater than
atmospheric argon and an isochron age of 35 ± 8 Ma for Cp1813 92’.

53
Figure 3-24: 40
Ar/39
Ar Step-Heating Spectra for Runs 59510-01, 59513-01 (Cp1813 92’
and Core 1). Separates from Cp1813 92’ (black) and Core 1 (red) were initially thought
to be clear plagioclase, but in fact are calcite.
Step-heating results for biotite from Cp1813 92’ and Core 1 are presented in
figure 3-25. The age spectra are discordant and do not meet plateau criteria because they
do not contain at least three contiguous steps containing at least 50 % of the gas released.
The precision for individual analytical steps of the two separates is similar, but Cp1813
92’ is a little more precise than Core 1. Weighted-mean ages calculated for Cp1813 92’
and Core 1 are 73.0 ± 1.3 Ma for steps G through I and 72.3 ± 1.5 Ma for steps H through
J, respectively. The weighted-mean ages agree within 2σ error. The 40
Ar* for both
separates start around 0 % and rise throughout the runs. The 40
Ar* for Cp1813 92’ is
higher, rising to around 80 %, than for Core 1, rising to around 60 %. Both separates
show similar Cl/K patterns with the steps starting relatively higher than the rest of the
40Ar/
39Ar Step-Heating Spectra for Runs 59510-01, 59513-01 (Cp 1813 92 and Core 1)
0
20
40
60
0
0.01
0.02
0.03
0
0.002
0.004
0.006
0.008
0.010
0 10 20 30 40 50 60 70 80 90 100
0
50
100
150
200
250
A
B C D
E F
GH
I
J
Integrated Age (59510-01) = 56 ± 11 Ma
45 ± 6 Ma (MSWD = 1.46, n = 8)
A
B CD
EF
G
H
I
J
Integrated Age (59513-01) = 62 ± 14 Ma
59 ± 9 Ma (MSWD = 1.64, n = 10)
Data at 2-s igma, results at 2-sigma
Cumulative %39Ar Released
% 40Ar*
Cl/K
K/Ca
Apparent
Age (Ma)

54
steps. The Cl/K for Cp 1813 92’ starts higher, with values starting around 0.02, than Core
1, with values starting around 0.01. Both separates have Cl/K values that fall below 0.01
with Cp1813 92’ falling below the values for Core 1. Figures E-13 and E-14 (Appendix
E) show 40
Ar/36
Ar intercepts less than atmospheric argon (295.5) and isochron ages of
75.3 ± 0.7 Ma for Cp1813 92’ and 77 ± 3 Ma for Core 1.
Figure 3-25: 40
Ar/39
Ar Step-Heating Spectra for Runs 59512-01, 59515-01 (Cp1813 92’
and Core 1). Biotite from Cp1813 92’ (black) and Core 1 (red).
3.3.2 Manganese Oxides
Six separates from three rock samples, SE-PKM-1, SE-bulk, and SE-PGE, were
analyzed using the 40
Ar/39
Ar dating method. Too little sample was obtained from SE-
PGD to perform any analyses.
59512-01, 59515-01 (Cp 1813 92' and Core 1)
0
40
80
0.004
0.006
0.008
0
2
4
0 10 20 30 40 50 60 70 80 90 100
0
20
40
60
80
100
A
B
C
D
E FG H
I
Integrated Age (59512-01) = 68.9 ± 0.8 Ma
A
B
C
D
E
FG
H I J
Integrated Age (59515-01) = 66.2 ± 1.2 Ma
Data at 2-sigma, results at 2-sigma
Cumulative %39
Ar Released
% 40Ar*
Cl/K
K/Ca
Apparent
Age (Ma)
73.0 ± 1.3 Ma
72.3 ± 1.5 Ma

55
Four cryptomelane separates from SE-PKM-1 are presented in figure 3-26. The
age spectra for all four separates are mostly flat except in the beginning steps where they
continue to step up. The ages of the individual analytical steps for the dendrite separates
are more precise than those for the veins. All the separates meet plateau criteria. The
plateaus for the veins contain approximately 85 % and 95 % and the plateaus for the
dendrites contain approximately 82 % and 68 % of the gas released. The plateau ages for
the dendrites are slightly younger (9.4 ± 0.5 Ma and 9.6 ± 0.4 Ma) than the plateau ages
for the veins (10.31 ± 0.13 Ma and 10.37 ± 0.11 Ma). This relationship is also shown in
the integrated ages. The plateau ages of the dendrites agree within 2σ error and the
plateau ages of the veins agree within 2σ error, but the difference between the dendrite
and vein ages is significant at 2σ error. All four separates start with a 40
Ar* around 0 %.
The dendrites have higher 40
Ar* values, reaching around 70 % before falling back to 5 to
20 %, than the veins, with values that rise to around 20 % before falling back to 0 to 5 %.
The Cl/K for all four separates start around 0.08 to 0.4, then fall to 0.01 to 0.02, with one
separate falling to 0.003. The Cl/K for two of the samples levels off around 0.02 to 0.03
and the other two separates rise again to 0.05 and 0.2. The K/Ca for three of the separates
starts around 2 before rising slightly and falling below 2. The K/Ca for the fourth separate
stays around 1 through the analysis. Figures E-17, E-18, and E-19 (Appendix E) show
40Ar/
36Ar intercepts similar to atmospheric argon (295.5) and E-20 shows a
40Ar/
36Ar
intercept just less than atmosphere, and the isochron ages are 10.2 ± 1.3 Ma and 10.8 ±
1.2 Ma for the veins and 10.4 ± 0.3 Ma and 10.6 ± 0.3 Ma for the dendrites.
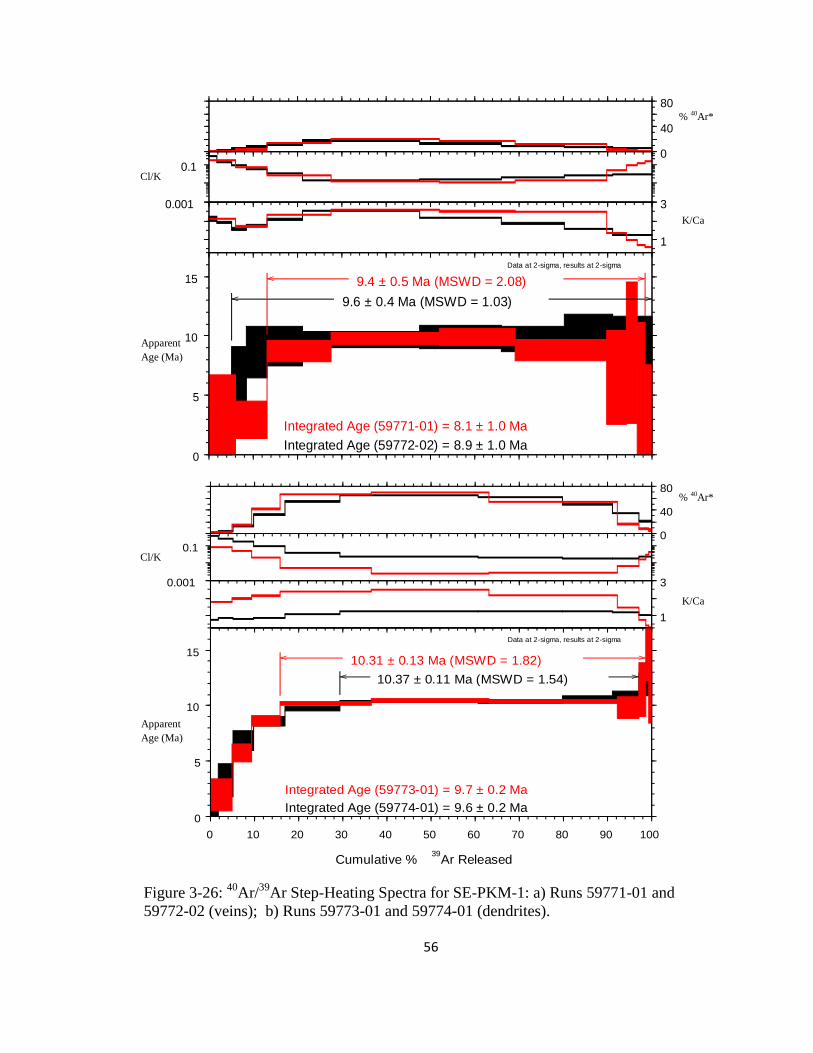
56
Figure 3-26: 40
Ar/39
Ar Step-Heating Spectra for SE-PKM-1: a) Runs 59771-01 and
59772-02 (veins); b) Runs 59773-01 and 59774-01 (dendrites).
59772-02, 59771-01 (SE-PKM-1 vein A hard and SE-PKM-1 vein A )
0
40
80
0.001
0.1
1
3
0 10 20 30 40 50 60 70 80 90 100
0
5
10
15
Integrated Age (59772-02) = 8.9 ± 1.0 Ma
9.6 ± 0.4 Ma (MSWD = 1.03)
Integrated Age (59771-01) = 8.1 ± 1.0 Ma
9.4 ± 0.5 Ma (MSWD = 2.08)
Data at 2-sigma, results at 2-sigma
Cumulative %39
Ar Released
59774-01, 59773-01 (SE-PKM-1 cluster E and SE-PKM-1 cluster D)
0
40
80
0.001
0.1
1
3
0 10 20 30 40 50 60 70 80 90 100
0
5
10
15
Integrated Age (59774-01) = 9.6 ± 0.2 Ma
10.37 ± 0.11 Ma (MSWD = 1.54)
Integrated Age (59773-01) = 9.7 ± 0.2 Ma
10.31 ± 0.13 Ma (MSWD = 1.82)
Data at 2-sigma, results at 2-sigma
Cumulative %39
Ar Released
% 40Ar*
Cl/K
K/Ca
Apparent
Age (Ma)
% 40Ar*
Cl/K
K/Ca
Apparent
Age (Ma)

57
Two todorokite separates from SE-bulk and SE-PGE are presented in figure 3-27.
The age spectra are fairly flat and meet the plateau criteria with at least three contiguous
steps containing at least 50 % of the gas released. The plateaus for SE-bulk and SE-PGE
contain approximately 100 % and 89 % of the gas released, respectively. The steps for
SE-bulk are more precise than the steps for SE-PGE. Both separates have low 40
Ar*
values that start around 0 % and slowly rise to almost 20 % before falling back down
slightly. As the %39
Ar released increases, the errors in 40
Ar* increase. The Cl/K for Se-
bulk is lower, with values that slowly fall from 0.2 to 0.1 through the analysis, than SE-
PGE, with values that stay around 0.4 through the analysis. The K/Ca for SE-bulk starts
higher, with values around 0.25, than SE-PGE, which has values around 0.35. After the
initial steps the K/Ca for SE-bulk, with values that fall to around 0.4 before rising to 0.08,
falls below values for SE-PGE, with values that fall to about 0.1 and rise back to about
0.3. The plateau ages for SE-bulk and SE-PGE are 1.9 ± 0.4 Ma and 5.1 ± 1.7 Ma,
respectively. The plateau ages are within 2σ error of the total gas ages for each of the
separates. The plateau ages do not agree within 2σ error. Figures E-21 and E-22
(Appendix E) show 40
Ar/36
Ar intercepts similar to atmospheric argon (295.5) and
isochron ages are 1.9 ± 0.5 Ma and 4.3 ± 1.5 Ma for SE-bulk and SE-PGE, respectively.

58
Figure 3-27: 40
Ar/39
Ar Step-Heating Spectra for Runs 59775-01, 59776-01 (SE-bulk and
SE-PGE). Todorokite from SE-bulk (black) and SE-PGE (red).
40Ar/
39Ar Step-Heating Spectra for Runs 59775-01, 59776-01 (SE-bulk big A and SE-PGE fingers A)
0
20
40
0.1
1
0.1
0.2
0 10 20 30 40 50 60 70 80 90 100
-5
0
5
10
15
20
Integrated Age (59775-01) = 2.0 ± 1.4 Ma
1.9 ± 0.4 Ma (MSWD = 0.92)
Integrated Age (59776-01) = 6 ± 2 Ma
5.1 ± 1.7 Ma (MSWD = 1.82)
Data at 2-s igma, res ults at 2-s igma
Cumulative %39
Ar Released
% 40Ar*
Cl/K
K/Ca
Apparent
Age (Ma)

59
4. DISCUSSION
4.1 Mineralogy and Geochronology of the Intrusive Rocks
Four intrusive rocks from drill hole Cp1813 (Figure 3-18) were analyzed using X-
ray diffraction and the 40
Ar/39
Ar dating method. XRD was used to identify the minerals
analyzed in the 40
Ar/39
Ar analyses. The dating was performed to better understand the
timing of emplacement for the intrusive rocks and clear up a discrepancy between the
K/Ar dates and field relationships.
4.1.1 Mineral Identification
X-ray diffraction was used to identify the minerals present in separates from the
intrusive rocks prepared for 40
Ar/39
Ar analyses. The separates used for XRD analyses are
not the same aliquots used for the dating analyses because the XRD was deemed
necessary only after the step-heating spectra results. Most of the visual mineral
identification performed during sample preparation for the dating process was correct, but
two of the separates, thought to be a clear plagioclase, were incorrectly identified. Figure
3-24 shows the step-heating spectra for the “clear plagioclases’ and both separates exhibit
large 40
Ar* and age errors. XRD results from these separates (Figures C-1 and C-2) show
peaks for calcite. This means the minerals prepared for 40
Ar/39
Ar analyses were really
calcite and not plagioclase and these samples will not be considered further.

60
The other mineral separates analyzed by XRD include cloudy plagioclase, K-
feldspar, and biotite. The analyses of cloudy plagioclase (Figures C-3 though C-6)
indicate the presence of albite and montmorillonite; albite, anorthoclase, and marialite;
albite; and anorthoclase for Felsic core, Cp1813 2070’, Cp1813 92’, and Core 1,
respectively. The K-feldspar for Cp1813 2070’ (Figure C-7) was determined to be
anorthoclase. Figures C-8 and C-9 are the biotite separates for Cp1813 92’ and Core 1,
respectively.
4.1.2 Geochronology
Felsite- The groundmass step-heating plateau age of 33.06 ± 0.11 Ma is more
precise than the plagioclase step-heating plateau age of 34.3 ± 0.5 Ma at 2σ because the
groundmass separate exhibits a higher radiogenic yield and greater K2O% than the
plagioclase. The age of 33.06 ± 0.11 Ma is considered the best age for the felsites (Figure
3-19). The previously determined K/Ar age of 26.6 Ma (Clark et al., 1979) is deemed
inaccurate, and the age of 33.06 ± 0.11 Ma determined through 40
Ar/39
Ar dating is
considered the most appropriate age for the felsite. This 40
Ar/39
Ar age confirms the
geologic interpretation made by Megaw (1990) that the felsites are older than the 32.2 ±
0.4 Ma lamprophyres.
Quartz Monzonite- The plagioclase and K-feldspar mineral separates exhibit
40Ar/
36Ar intercepts greater than atmosphere (Figure 3-21, 3-22), which may be
interpreted as excess argon. Therefore, the isochron ages are considered the best ages for
the mineral separates. The plagioclase 40
Ar/36
Ar intercept is more precise than the
intercept for the K-feldspar, and the MSWD is better at 3.2 for eleven steps for the

61
plagioclase than the MSWD of 14 for nine steps for the K-feldspar. For these reasons the
plagioclase isochron age of 38.7 ± 0.6 Ma is better constrained than the K-feldspar
isochron age of 38.3 ± 1.9 Ma at 2σ error and is considered the best age for this rock.
Diabase Sills- The ages of all three of the minerals are consistent between the two
diabase sill samples (Figures 3-23 through 3-25). Step-heating spectra from the “clear
plagioclase,” now known to be calcite, show large errors (Figure 3-24) and will not be
considered in the age determinations for the rocks. The biotite step-heating spectra start
young and increase in age as the amount of 37
Ar released increases, which suggests argon
loss (Heizler et al., 1988). An artifact of this argon loss is the 40
Ar/36
Ar intercepts are less
than atmosphere. The biotite separates approach minimum ages of 73.0 ± 1.3 Ma and
72.3 ± 1.5 Ma for Cp1813 92’ and Core 1, respectively. The cloudy plagioclase separates
for both rocks are interpreted to be re-set to a younger age, similar in age to the felsite,
than the crystallization age of the rocks. It is interpreted that the felsite heated the diabase
sills enough to re-set the cloudy plagioclase ages and only started to re-set the biotite ages
for the two rocks. Therefore the best ages for the diabase sills are the minimum ages of
the biotite separates with 73.0 ± 1.3 Ma for the upper sill and 72.3 ± 1.5 Ma for the lower
sill.
Figure 4-1 shows the age distributions of the K/Ar and 40
Ar/39
Ar dates for the
intrusive rocks. There are three different pulses of magmatism in the district with the
diabase sills intruding at minimum ages of 73.0 ± 1.3 Ma and 72.3 ± 1.5 Ma, the quartz
monzonite intruding at 38.7 ± 0.6 Ma, the felsites intruding at 33.06 ± 0.11 Ma, and
finally the lamprophyres intruding at 32.2 ± 0.4 Ma. The K/Ar age of the felsite was
found to be inaccurate and the new felsite age determined the felsite is older than the

62
lamprophyre. This more accurate age resolves an inconsistency in the K/Ar dates and is
now consistent with cross-cutting relationship identified in the field by Megaw (1990).
Figure 4-1: K/Ar (black) (Clark et al., 1979; Megaw, 1990) and 40
Ar/39
Ar (red) age
distribution for the intrusive rocks. Ages on the diagram do not necessarily correspond to
individual ages. The errors for the 40
Ar/39
Ar ages are at 1σ error. For convenience, the
K/Ar errors are set at 1, except for the lamprophyre where it is set at 0.4.
4.2 Mineralogy and Geochronology of the AMOM
4.2.1 Mineral Identification
Previous attempts have been made to identify the manganese minerals of the
Argentiferous Manganese Oxide Mineralization (AMOM) at Santa Eulalia (Prescott,
1916; Hewitt, 1968; Megaw, 1990). Megaw (1990) compiled a list of minerals identified
in the carbonate-hosted surface alteration and AMOM including aragonite,
argentojarosite, calcite, cryptomelane, dolomite, fluorite, galena, goethite, gypsum,
Ana
lyses
Pro
ba
bili
ty
Felsite
Lower Diabase Sill
Upper Diabase Sill Felsite
Lamprophyre
Quartz Monzonite
Quartz Monzonite
Diabase Sill
Age (Ma)
33.06
32.2
26.6
72.3
73.0
38.7
37.8 37.5

63
hematite, hollandite, “limonite”, plumbojarosite, proustite, pyrargyrite, pyrolusite, quartz,
ramsdellite, native silver, and “wad.” This study indentified cryptomelane, coronadite,
chalcophanite, birnessite, and todorokite as the manganese minerals and goethite, quartz,
as well as clays including talc and illite in the carbonate-hosted AMOM (Table 3-2).
Although many minerals identified in this study have previously been noted at
Santa Eulalia, this study shows a greater variety of AMOM minerals to be hosted in the
carbonate than previous studies. The list of minerals identified in this study more closely
matches the volcanic-hosted minerals than the carbonate-hosted list of minerals compiled
by Megaw (1990) for Santa Eulalia. The manganese minerals identified in the AMOM at
Santa Eulalia are not unique to the location. Many geothermal systems and ore deposits
not associated with magmatic hydrothermal systems also exhibit similar mineralogies
(Hewett and Radtke, 1967; Radtke et al., 1967; Chafetz et al., 2004).
4.2.2 Geochronology
Six manganese oxide separates from three rock samples were analyzed using the
40Ar/
39Ar method. Four of these separates are cryptomelane from SE-PKM-1. Of these
four separates, two are from veins and two are from manganese oxide dendrites. The
step-heating spectra gives plateau ages of 10.31 ± 0.13 Ma and 10.37 ± 0.11 Ma for the
veins and 9.4 ± 0.5 Ma and 9.6 ± 0.4 Ma for the dendrites (Figure 3-26). The difference
in ages between the two textures (Figure 2-1) may indicate that manganese mineralization
in this rock occurred over a period of 1 million years with the dendrites forming within
the rock and then about 1 million years later the veins cut through the rock.

64
The other two separates analyzed, using the 40
Ar/39
Ar method, are todorokite from
SE-bulk and SE-PGE. The step-heating spectra give plateau ages of 1.9 ± 0.4 Ma and 5.1
± 1.7 Ma for SE-bulk and SE-PGE, respectively (Figure 3-27). All three rocks containing
manganese oxide are of different ages indicating episodic mineralization events over a
long duration of time. The manganese oxide rocks are younger than the felsites by 22.69
to 31.16 million years indicating the manganese oxide mineralization is not temporally
related to the felsites. This also indicates that the AMOM we analyzed is not from the
same mineralizing event at the sulfide mineralization. Some of the AMOM occurrences,
especially those with Ag, may be part of the sulfide mineralization process, and some
AMOM may be a supergene mineralization related to the sulfide ores. Without additional
dating of the various AMOM occurrences and understanding the processes forming the
AMOM, it is unclear whether the presence of AMOM as an exploration tool is applicable
to finding additional sulfide ores.
4.3 Stable Isotopes of Santa Eulalia
The carbon and oxygen stable isotope values for Santa Eulalia are plotted in
figure 3-9. Because most of the samples analyzed were limestone and may not have been
in equilibrium with hydrothermal fluids, we are not able to calculate fluid compositions
for this trend. The carbon and oxygen values get lighter approaching the sulfide veins or
veins with no ore (Figures 3-10 and 3-11). The δ13
C values are above background levels,
unaltered limestone values, except for the manganese altered limestone analyses taken
close to the ore vein and the ore calcite for the Buena Tierra Mine and San Antonio Mine.
The δ18
O values are all below background levels, unaltered limestone values, except for

65
two limestone samples from the Buena Tierra Mine. The Buena Tierra limestone δ18
O
value at 230 m is depleted because the sample location is close to another vein (Megaw,
1990). Megaw (1990) found the carbon and oxygen isotope values are at background
levels in the unaltered limestone and are depleted within the AMOM (Figure 4-2). It is
apparent that AMOM is epigenetic.
Figure 4-2: Relationship of carbon and oxygen isotope values within AMOM and
unaltered limestone. Courtesy of Megaw (1990).
The carbon and oxygen isotope systematics for Santa Eulalia and Luis Lopez are
very different. Santa Eulalia displays a direct correlation between the carbon and oxygen
isotopes (Figures 3-10 and 3-11), but Luis Lopez exhibits an inverse relationship in the
δ13
C and δ18
O values of calcite and in the δ13
CHCO3- and δ18
OH2O fluid values (Figures 3-
12 and 3-13).
66
4.4 The Origin of AMOM
The ages for the three manganese oxide rocks, dated in this study using the
40Ar/
39Ar method, indicate they formed around three distinct times of approximately 10
Ma, 5 Ma, and 2 Ma for SE-PKM, SE-PGE, and SE-bulk, respectively. These ages are
more than 20 Ma younger than the felsites, of approximately 34 Ma, which are inferred to
be the source of sulfide mineralization. Due to the difference in ages, the AMOM
analyzed in this study was not formed during the main stage of sulfide mineralization.
The AMOM studied for this project at Santa Eulalia is episodic over 8 million
years as seen by the three distinct ages of approximately 10 Ma, 5 Ma, and 2 Ma. In
addition, Megaw (1990) noted the AMOM is found above, below, or next to the sulfide
mineralization suggesting no clear stratigraphic control. No magmatic activity coincident
with the ages determined for AMOM is apparent in the study area. A model representing
the processes responsible for the AMOM needs to account for these important
characteristics.
Two models, a weathering model and a hot spring model, may account for the
characteristics observed and explain the processes that formed the AMOM at Santa
Eulalia. These models will be discussed, but more evidence is needed to determine which
model best accounts for the characteristics of the AMOM at Santa Eulalia.
4.4.1 Weathering Model for AMOM at Santa Eulalia
Manganese oxides may form due to weathering processes as suggested by Spurr
(1911) (Figure 4-3). Fluids, usually with a meteoric origin, percolate down from the
surface and weather the sulfides and dissolved constituents are precipitated in other

67
minerals such as manganese minerals. It may be difficult to differentiate between
manganese oxides formed during weathering and manganese oxides formed due to
hypogene processes. The ages of manganese oxides formed due to weathering should be
younger than the sulfides they originate from. Due to the weathering fluids originating
stratigraphically higher than the sulfides, the manganese oxides should be located either
next to or below the sulfides. Because the AMOM is found above, next to, or below
sulfide mineralization, and in the volcanic series, it seems the formation of the AMOM
due to weathering is less likely unless there was a stratigraphically higher sulfide that has
been weathered away.
Figure 4-3: Schematic weathering model for the formation of AMOM based on Spurr
(1911) and observations of Megaw (1990).
4.4.2 Hot Spring Model for AMOM at Santa Eulalia
Santa Eulalia is located near a major north-south trending fault (Figure 4-4) in
Mexico that separates major tectono-stratigraphic terranes. Along this same fault are

68
other mineral deposits of similar age which are not associated with magmatism. Peña
Blanca, a uranium deposit approximately 50 km north of Chihuahua, Mexico (Figure 4-4)
is located west of the major north-south trending fault. It is associated with deep seated
upwelling of thermal waters similar to many hot springs along the Rio Grande Rift (Lueth
et al., 2005). Interestingly the hydrothermal jarosite at Peña Blanca was determined to be
9.42 ± 0.11 Ma (Lueth et al., 2005), which is similar to the AMOM ages determined for
the veins in SE-PKM at Santa Eulalia.
Figure 4-4: Location of Santa Eulalia, outlined in black, and Peña Blanca, outlined in red,
near Chihuahua, Mexico (Mexicana, 1985).
29°00’
28°30’
Major
Fault
Sierra
Del Nido 29°30’
-106°30’ -106°00’ -107°00’

69
Other galena-barite-fluorite ore deposits along the Rio Grande Rift (RGR-type of
McLemore, et al. 1998) in the Southern Basin and Range in Mexico have hydrothermal
jarosite ages that illustrate episodic mineralization events occurring over 10 million years
of time (Lueth et al., 2005). A good example of their work is the Hansonburg mining
district in New Mexico with a wide range of hypogene jarosite mineralization ages at
3.79 ± 0.16 Ma, several ages around 6 Ma, and 7.97 ± 0.44 Ma. Lueth et al. (2005)
proposed the jarosite at Peña Blanca and other areas of galena-barite-fluorite deposits
along the Rio Grande Rift were formed by deep circulation of saline brines within Rio
Grande Rift and basin and range style faults that rupture and move periodically creating a
conduit for the fluids (Figure 4-5). Their model is based heavily on geological
information from Clemons (1996) and hydrologic modeling of Mailloux et al. (1999).
Figure 4-5: Model for deep fluid circulation and precipitation of hydrothermal minerals in
faults (Lueth et al., 2005).

70
RGR deposits and manganese oxides may occur in similar hydrothermal
environments and are spatially found together in some areas such as a hot spring area at
San Diego Mountain near Hatch, New Mexico (Seager et al., 1971; Lueth et al., 2005) in
which jarosite and manganese oxides are spatially related. Figure 4-6 shows a schematic
cross-section of the possible relationships between jarosite and manganese mineralization
and the hot spring deposits that formation at the surface. The close association of galena-
barite-fluorite (RGR) deposits and manganese mineralization has been noted by others
(McLemore et al., 1998; Witcher, 1998). The close association of hot springs and
manganese mineralization was noted long ago by Wells (1918) when describing the
manganese oxides forming in a hot spring environment at the Ellis deposit near Truth or
Consequences, New Mexico when he said;
“At the southeast end of the manganiferous beds, hot springs from which the town
is named issue from the limestone underlying the sandstone. In view of the
structure of the ore and the presence of springs at one extremity of the mineralized
section, it seems highly probable that these deposits have been due to manganese-
bearing solutions rising upward through pipes and conduits and entering an
oxidizing environment which caused the deposition of manganese in an oxide
form.”
Areas along the Rio Grande Rift with manganese deposits also have active
geothermal waters. Manganese oxide deposits, believed to have been formed in a hot
spring environment, at Tortuga Mountain near Las Cruces, New Mexico (King and
Kelley, 1980) are located in close proximity to the Las Cruces Geothermal Field (Lueth
et al., 2002). Lueth et al. (2005) also found the fluids responsible for the precipitation of
jarosite at Peña Blanca and other RGR deposits have a similar isotopic composition as
geothermal waters in the area today.

71
Figure 4-6: Schematic cross-section of possible relationships between RGR, manganese,
and hot spring mineralization. AMOM mineralization is not necessarily associated with
RGR deposits.
The model proposed by Lueth et al. (2005) for the formation of RGR deposits is
adapted for the formation of the AMOM at Santa Eulalia and is presented in figure 4-7.
The Calera-del Nido tectonic block, containing Sierra del Nido (Figure 4-4), formed from
basin and range tectonics in Chihuahua, Mexico, has been uplifted (Mauger, 1981) and
may have created a regional groundwater flow from west to east similar to the model
presented by Mailloux et al. (1999). Due to the possible regional ground water flow from
west to east, in this model meteoric water flows down faults in the west, circulates deep,
and flows back up through eastern faults. Alternatively, fluids may be derived from the
basins of the Chihuahua Trough and may move from east to west. As the fluids move up
the faults and reach the right conditions, it precipitates the manganese oxide minerals.
This model may better represent the processes that formed the AMOM at Santa Eulalia.
Hot spring deposit Ground surface
AMOM
RGR deposit
Fluid conduit (e.g.
fault or fracture)
Heated fluid

72
Figure 4-7: Schematic model for the precipitation of AMOM at Santa Eulalia with fluid
movement based on Mailloux et al. (1999) (red) and fluid movement based on basin
dewatering-MVT type from the east (blue). The cross-section is based on Mauger
(1983a), Mauger (1983b), and Pingitore Jr., et al. (1983).
4.5 Stable Isotopes of Luis Lopez
The initial hypothesis that AMOM is related to the sulfide mineralization
warranted the stable isotope study of Luis Lopez and comparison to Santa Eulalia. The
variation in carbon and oxygen isotope values for Luis Lopez and Santa Eulalia are very
different. Luis Lopez exhibits an inverse relationship in the δ13
C and δ18
O values of
calcite and in the calculated δ13
CHCO3- and δ18
OH2O fluid values (Figures 3-12 and 3-13),
whereas Santa Eulalia has more of a coupled relationship between the carbon and oxygen
isotopes (Figures 3-10 and 3-11). Because the stable isotope data at the two locations are
so different, the Luis Lopez Manganese District will be treated and presented separate
from Santa Eulalia.
One interpretation of the relationship of the δ13
CHCO3- and δ18
OH2O fluid values at
Luis Lopez (Figure 3-13) is mixing of two fluids. Both fluid end members exhibit oxygen
isotope values that are considered heavy. The end member fluid with the heavy carbon,
Sierra del Nido
Santa Eulalia
Chihuahua City Peña Blanca
Meteoric Water
Heated Fluids
Chihuahua
Trough Aldama Platform Calera del Nido
7000ft
5600ft
4200ft
West East

73
about 2.0 ‰ δ13
CHCO3-, and oxygen of about 9.5 ‰ δ18
OH2O, values may be similar to
fluids from a playa lake environment, where organic fractionation makes the carbon
isotope heavier, but there is a meteoric component for the oxygen that had undergone
Rayleigh fractionation. Playa lakes are known in the local geologic record (Chapin and
Lindley, 1986) and have been hypothesized to have been responsible for K-
metasomatism and enrichment in δ18
O of rocks. The other end member has very heavy
oxygen, about 24.7 ‰ δ18
OH2O, with light carbon, about -6.4 ‰ δ13
CHCO3-. It is more
difficult to understand the fluid end member this may represent.
A second interpretation of the variation in carbon and oxygen calcite values is
temperature variation with a constant δ13
CHCO3- and δ18
OH2O fluid value. Using end
member mineralization temperatures determined by Norman et al. (1983) by fluid
inclsion analyses for different Luis Lopez mine areas and equations from Deines et al.
(1974) and Kim and O’Neil (1997) the carbon and oxygen isotopes of calcite were
calculated, respectively. Using an average and constant fluid value of -2.0 ‰ δ13
CHCO3-
and 17.3 ‰ δ18
OH2O for the MCA mine with temperatures of 175 and 375 °C the values
of -3.4 and -3.1 ‰ for δ13
C and 25.1 and 12.7 ‰ for δ18
O were calculated, respectively.
These calculations result in a potential variation of 0.3 ‰ in δ13
C and 12.4 ‰ in δ18
O.
These effects of temperature on fractionation may account for the range in mineral
oxygen values seen at Luis Lopez, but it does not explain the range in composition of the
carbon.
The fluid source and controls for the calcite isotopic composition at Luis Lopez is
still unclear. Although the trend looks like it may represent a mixing line, only one end
member fluid is easy to understand and the source of fluid for the second end member is
74
still unidentified. The extremely heavy oxygen isotopic composition of this end member
is decidedly unusual. The individual calcite bands of rocks at Luis Lopez and Water
Canyon mostly vary along linear trends indicating mixing as one of the controls on the
formation of the calcite bands (Figures 3-14 through 3-17). Although several samples
show variation along the linear trend, the direction of movement, toward the upper or
lower end member, is not consistent. What ever caused the variation seems to have varied
in a cyclic, not monotonic, fashion. The oxygen isotopes of the calcite may represent a
range in temperatures, but the carbon cannot be explained by changes in temperature and
what may cause the changes in temperature is unclear. Although only two possible
controls on the formation of the calcite bands are presented here, there may be other
processes such as boiling or effervescence that were not considered in detail.

75
5. CONCLUSIONS
40
Ar/39
Ar dating analyses determined the ages of the felsite, quartz monzonite,
upper diabase sill, and lower diabase sill at Santa Eulalia as 33.06 ± 0.11 Ma, 38.7 ± 0.6
Ma, 73.0 ± 1.3 Ma, and 72.3 ± 1.5 Ma, respectively. The new ages of the felsite and
diabase sills resolve the incompatibility of the K/Ar between ages of the felsite, diabase
sills, and lamprophyres. The new ages put the felsite and diabase sills as older than the
lamprophyres, and the ages are now compatible with field relationships. The diabase sills
show evidence of resetting by the hydrothermal system associated with the felsites.
The mineralogy of the AMOM determined through electron microprobe and X-
ray diffraction analyses include cryptomelane, coronadite, birnessite, and todorokite as
the manganese oxides, as well as calcite, quartz, goethite, and clays including illite and
talc. The ages of the AMOM are approximately 10 Ma, 5 Ma, and 2 Ma and indicate the
AMOM analyzed in this study did not form during the main stage of sulfide
mineralization caused by the felsite.
The formation of the AMOM analyzed in this study may be explained by two
different models. The weathering model and the hot spring model may account for the
characteristics observed at Santa Eulalia. The weathering model would require a
stratigraphically higher sulfide deposit that has been weathered away. The hot spring
model depends on the circulation of deep basinal fluids that rise up through faults and
deposit the manganese minerals. More AMOM samples need to be examined to
76
determine if there is more than one kind of AMOM present at Santa Eulalia and the
appropriateness of each model to represent the processes that formed the specific AMOM
observed.
There is a direct relationship between carbon and oxygen stable isotope values at
Santa Eulalia. Both the carbon and oxygen are depleted close to veins and are near
background levels further from veins.
The carbon and oxygen isotopes at Luis Lopez and Water Canyon exhibit an
inverse relationship, and the individual bands of calcite in different rocks mostly vary
along linear trends. There are three possible explanations for the isotope values at Luis
Lopez: 1) Mixing of two fluids, with one end member a playa lake fluid with a meteoric
influence. The other end member is more difficult to explain; 2) Changes in temperature
can account for the range in oxygen values, but the changes in the carbon values due to
temperature are too small to account for the changes seen; or 3) There may be other
processes, such as boiling and effervescence, which were not fully examined here.

77
APPENDIX A. SAMPLE PHOTOS
Santa Eulalia AMOM
Figure A-1: SEPKM rock sample.
Figure A-2: SEPGD rock sample.
Figure A-3: SEPGE rock sample.

78
Figure A-4: SE-bulk rock sample.
Luis Lopez
Figure A-5: MCA-1 rock sample.
Figure A-6: MCA-2 rock sample.

79
Figure A-7: MCA-3 rock sample.
Figure A-8: MCA-4 rock sample.
Figure A-9: MCA-5 rock sample.

80
Figure A-10: MCA-6 rock sample.
Figure A-11: MCA-7 rock sample.
Figure A-12: Nogal-1 rock sample.

81
Figure A-13: Nogal-2 rock sample.
Figure A-14: PG-1 rock sample.
Figure A-15: PG-2 rock sample.
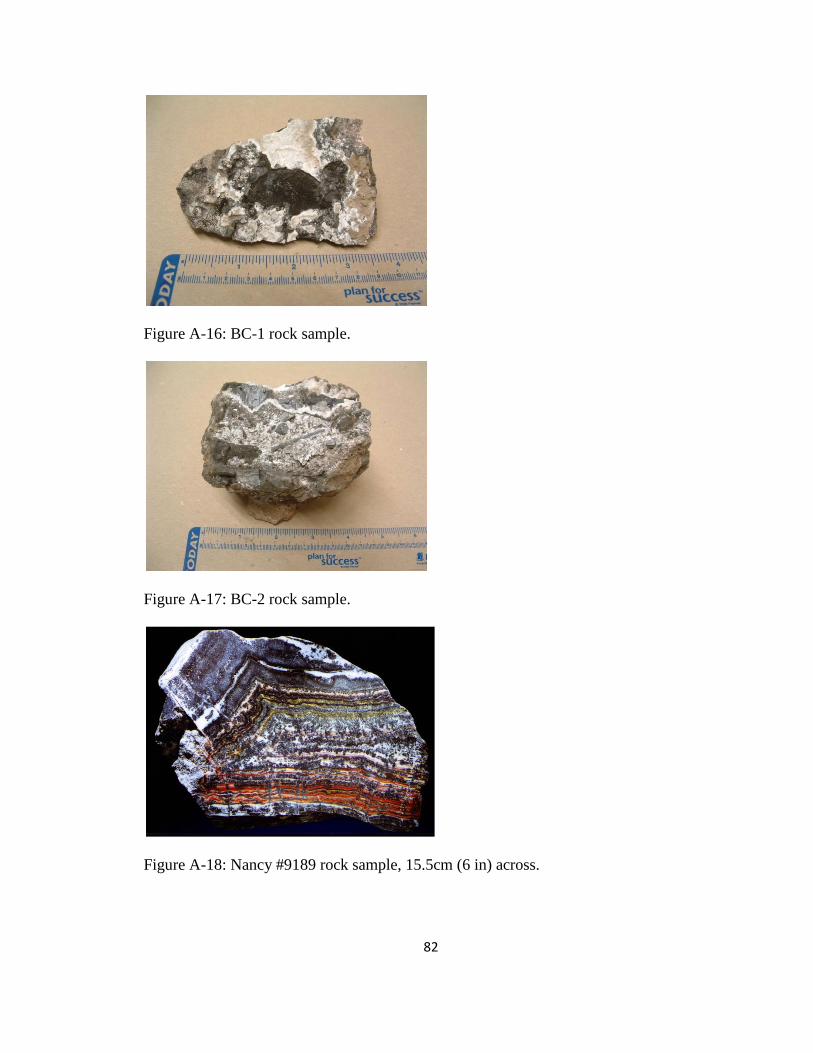
82
Figure A-16: BC-1 rock sample.
Figure A-17: BC-2 rock sample.
Figure A-18: Nancy #9189 rock sample, 15.5cm (6 in) across.

83
Water Canyon
Figure A-19: 003301 rock sample.
Figure A-20: 003303 rock sample.
Figure A-21: 003304 rock sample.

84
Figure A-22: 003304A rock sample.
Figure A-23: 003304B rock sample.
Figure A-24: 003308 rock sample.

85
APPENDIX B. ELECTRON MICROPROBE ANALYSES
Table B-1: Microprobe data for SE-PKM-1, SE-PGD, SE-PGE-1, SE-PGE-2, SE-bulk-1,
SE-bulk-2, and SE-bulk-3.
Comment SiO2 SO2 MgO CaO MnO FeO ZnO BaO PbO Na2O K2O Ag2O Total Mineral
sepkm-01 2.12 0.00 0.00 0.46 2.04 77.70 0.64 0.00 1.26 0.03 0.01 0.00 84.26 Fe phase
sepkm-02 3.55 0.03 0.00 0.50 1.70 73.74 0.43 0.00 1.00 0.03 0.01 0.00 80.99 Fe phase
sepkm-03 3.35 0.00 0.00 0.43 1.67 78.81 0.53 0.00 0.94 0.05 0.00 0.03 85.81 Fe phase
sepkm-04 2.49 0.01 0.00 0.47 2.24 77.53 0.55 0.08 1.47 0.04 0.02 0.00 84.91 Fe phase
sepkm-05 0.15 0.09 0.14 2.72 70.03 0.66 0.50 0.06 0.03 1.20 3.32 0.00 78.90 cryptomelane
sepkm-06 0.00 0.03 0.28 2.81 71.31 1.32 0.58 0.06 0.09 1.16 2.23 0.00 79.87 low K cryptomelane
sepkm-07 0.00 0.06 0.87 3.84 64.70 1.00 1.28 0.02 0.48 0.92 0.62 0.00 73.80 birnessite
sepkm-08 0.00 0.03 0.72 3.21 65.48 0.55 0.85 0.02 0.02 0.78 1.16 0.00 72.82 birnessite
sepkm-09 0.00 0.03 0.09 2.35 75.70 0.67 0.44 0.01 0.00 1.02 4.30 0.00 84.61 cryptomelane
sepkm-010 0.00 0.05 0.34 2.67 71.27 0.95 0.62 0.03 0.31 1.10 2.68 0.00 80.01 low K cryptomelane
sepkm-011 0.00 0.01 1.31 3.36 65.12 1.09 1.29 0.05 0.02 1.05 0.58 0.00 73.87 birnessite
sepkm-012 0.00 0.03 0.84 3.34 68.50 0.90 0.91 0.04 0.14 1.02 1.02 0.00 76.72 birnessite
sepkm-013 0.00 0.05 0.26 3.24 69.46 0.57 0.70 0.16 0.00 1.12 2.01 0.00 77.56 cryptomelane
sepkm-014 0.00 0.02 1.28 3.28 67.11 1.34 1.33 0.04 0.20 1.10 0.54 0.00 76.24 birnessite
sepkm-015 0.00 0.01 0.67 3.58 67.56 0.93 0.92 0.12 0.24 1.02 1.07 0.00 76.10 birnessite
sepkm-016 0.00 0.00 0.02 1.79 72.38 2.46 0.17 0.09 0.19 0.88 4.85 0.00 82.83 cryptomelane
sepkm-017 0.00 0.03 0.03 2.22 70.69 1.78 0.30 0.08 0.16 0.82 4.84 0.00 80.96 cryptomelane
sepkm-018 0.00 0.03 0.64 3.98 69.20 0.97 0.84 0.06 0.11 1.09 1.24 0.00 78.15 birnessite
sepkm-019 1.84 0.02 0.00 0.48 3.92 74.65 0.77 0.01 2.06 0.04 0.01 0.00 83.80 Fe phase
sepkm-020 1.88 0.01 0.00 0.48 3.57 76.46 0.53 0.13 1.84 0.04 0.01 0.00 84.95 Fe phase
sepkm-021 3.30 0.00 0.00 0.50 3.07 76.26 0.47 0.00 1.39 0.06 0.02 0.00 85.06 Fe phase
sepkm-022 0.12 0.00 0.02 0.08 79.46 0.12 0.51 0.03 0.07 0.01 0.00 0.00 80.42 birnessite
sepkm-023 0.16 0.01 0.00 0.01 76.13 0.16 0.77 0.00 0.00 0.00 0.00 0.00 77.23 birnessite
sepkm-024 0.04 0.01 0.00 0.05 94.50 0.20 1.06 0.00 0.00 0.03 0.00 0.00 95.90 high Mn phase
sepkm-025 0.07 0.00 0.00 0.41 53.70 0.84 0.26 0.02 29.81 0.00 0.00 0.00 85.12 coronadite
sepkm-026 0.09 0.01 0.00 0.17 52.54 1.30 0.85 0.02 31.12 0.02 0.03 0.00 86.14 coronadite
sepkm-027 2.17 0.00 0.00 0.58 4.38 75.37 0.77 0.00 1.85 0.04 0.01 0.00 85.17 Fe phase
sepkm-028 1.66 0.00 0.00 0.49 3.78 76.31 0.58 0.05 1.57 0.05 0.03 0.00 84.51 Fe phase
sepkm-029 3.62 0.00 0.00 0.56 3.35 73.63 0.63 0.03 0.96 0.03 0.04 0.00 82.84 Fe phase
sepkm-030 3.00 0.02 0.00 0.80 3.29 73.28 0.61 0.12 0.91 0.04 0.02 0.00 82.07 Fe phase
sepkm-031 0.15 0.02 0.02 0.24 75.75 0.80 0.71 0.02 0.04 0.07 0.00 0.00 77.80 birnessite
sepkm-032 0.00 0.02 0.00 0.13 76.56 1.05 0.75 0.08 0.09 0.02 0.00 0.00 78.71 birnessite
sepkm-033 0.11 0.00 0.00 0.61 53.39 0.17 0.53 0.02 28.42 0.00 0.00 0.00 83.25 coronadite
sepkm-034 0.00 0.00 0.00 0.16 69.92 1.87 0.49 0.03 35.90 0.02 0.00 0.00 108.39 coronadite, mixed phase
sepkm-035 2.30 0.00 0.00 0.47 3.27 77.11 0.65 0.03 1.52 0.02 0.02 0.00 85.40 Fe phase
sepkm-036 2.04 0.01 0.00 0.49 3.62 76.46 0.68 0.04 1.51 0.06 0.03 0.00 84.92 Fe phase
sepkm-037 3.55 0.00 0.00 0.53 3.11 74.83 0.58 0.00 1.04 0.04 0.03 0.00 83.71 Fe phase

86
sepkm-038 3.96 0.03 0.00 0.41 3.34 72.61 0.71 0.01 1.00 0.06 0.04 0.00 82.16 Fe phase
sepkm-039 0.00 0.01 0.07 2.98 67.76 1.06 0.45 0.00 0.70 1.15 1.72 0.00 75.90 birnessite
sepkm-040 0.18 0.01 0.00 1.31 69.91 1.85 0.55 0.07 0.51 0.74 3.94 0.00 79.08 cryptomelane
sepkm-041 0.00 0.04 0.84 4.36 67.08 0.51 1.10 0.06 0.04 1.02 0.79 0.00 75.85 birnessite
sepkm-042 0.00 0.02 0.94 4.11 65.75 0.58 1.24 0.00 0.10 0.94 0.65 0.00 74.31 birnessite
sepkm-043 0.00 0.05 0.67 4.12 64.96 0.51 1.01 0.00 0.09 0.94 0.81 0.00 73.16 birnessite
sepgd-01 1.67 0.01 0.00 0.90 1.33 77.58 0.69 0.08 0.88 0.01 0.02 0.00 83.16 Fe phase
sepgd-02 0.10 0.13 0.94 7.04 58.74 1.39 0.01 0.00 0.18 0.14 0.70 0.00 69.36 todorokite
sepgd-03 0.01 0.02 1.06 5.57 65.88 0.64 0.02 0.01 0.05 0.08 0.70 0.00 74.03 todorokite
sepgd-04 0.00 0.02 1.01 5.76 64.18 0.60 0.02 0.04 0.05 0.07 0.71 0.00 72.45 todorokite
sepgd-05 0.20 0.04 0.90 5.57 61.19 6.10 0.12 0.00 0.20 0.06 0.54 0.00 74.92 todorokite
sepgd-06 0.00 0.04 1.14 6.05 64.21 0.27 0.05 0.04 0.23 0.10 0.57 0.00 72.70 todorokite
sepgd-07 0.01 0.06 1.01 5.79 64.67 1.35 0.00 0.06 0.12 0.06 0.59 0.00 73.72 todorokite
sepgd-08 0.38 0.06 1.14 6.26 66.89 0.17 0.03 0.00 0.06 0.12 0.63 0.00 75.72 todorokite
sepgd-09 0.00 0.03 1.09 5.89 64.69 0.84 0.00 0.00 0.09 0.09 0.52 0.00 73.23 todorokite
sepgd-010 0.00 0.14 1.07 6.28 62.50 0.61 0.03 0.04 0.09 0.55 0.57 0.00 71.88 todorokite
sepgd-011 0.12 0.02 1.23 5.71 66.54 0.27 0.02 0.00 0.08 0.12 0.74 0.00 74.84 todorokite
sepgd-012 0.00 0.02 1.09 5.74 64.10 0.32 0.03 0.00 0.07 0.09 0.71 0.00 72.17 todorokite
sepgd-013 0.03 0.06 0.99 5.26 66.02 0.41 0.02 0.00 0.00 0.15 0.62 0.00 73.56 todorokite
sepgd-014 0.26 0.03 0.90 5.67 64.26 0.38 0.05 0.01 0.00 0.13 0.62 0.00 72.29 todorokite
sepgd-015 1.93 0.01 0.00 1.38 1.90 75.26 0.82 0.00 0.92 0.04 0.02 0.00 82.27 Fe phase
sepge-1-01 1.63 0.07 0.00 0.76 3.52 67.72 0.80 0.02 1.23 0.04 0.03 0.00 75.82 Fe phase
sepge-1-02 1.82 0.04 0.00 1.04 5.64 70.05 0.79 0.00 1.31 0.02 0.02 0.00 80.73 Fe phase
sepge-1-03 0.00 0.01 0.83 5.86 65.98 0.21 0.22 0.00 0.22 0.17 0.59 0.00 74.09 todorokite
sepge-1-04 0.21 0.04 0.85 5.36 66.30 0.17 0.36 0.01 0.23 0.14 0.57 0.00 74.22 todorokite
sepge-1-05 0.00 0.05 0.63 5.67 63.71 0.29 0.12 0.00 0.15 0.13 0.61 0.00 71.35 todorokite
sepge-1-06 0.00 0.05 0.71 5.24 67.18 0.35 0.17 0.12 0.03 0.12 0.58 0.00 74.54 todorokite
sepge-1-07 1.28 0.01 0.00 0.68 3.69 69.77 0.70 0.00 1.42 0.05 0.03 0.01 77.63 Fe phase
sepge-1-08 0.00 0.06 0.89 5.02 65.79 0.40 0.32 0.00 0.08 0.09 0.58 0.00 73.23 todorokite
sepge-1-09 0.00 0.03 0.80 5.08 61.43 0.62 0.20 0.00 0.14 0.12 0.60 0.00 69.01 todorokite
sepge-1-010 0.00 0.02 0.79 4.90 64.72 0.17 0.23 0.06 0.07 0.11 0.58 0.00 71.64 todorokite
sepge-1-011 1.17 0.03 0.00 0.72 5.60 65.41 0.80 0.00 1.22 0.07 0.06 0.00 75.09 Fe phase
sepge-1-012 0.06 0.07 0.85 4.57 64.19 2.74 0.13 0.00 0.21 0.12 0.68 0.00 73.61 todorokite
sepge-1-013 0.00 0.04 0.82 4.84 60.54 0.91 0.22 0.00 0.28 0.09 0.60 0.00 68.34 todorokite
sepge-1-014 0.00 0.01 0.80 4.60 62.19 0.25 0.17 0.04 0.15 0.08 0.71 0.00 68.99 todorokite
sepge-1-015 0.00 0.03 0.77 4.93 62.92 0.21 0.16 0.00 0.00 0.13 0.65 0.00 69.80 todorokite
sepge-1-016 1.20 0.02 0.00 2.04 9.03 59.91 0.99 0.11 1.98 0.08 0.07 0.00 75.44 Fe phase, mixed phase
sepge-1-017 0.08 0.01 0.81 6.18 62.99 0.16 0.26 0.13 0.29 0.13 0.59 0.00 71.61 todorokite
sepge-1-018 0.00 0.02 0.83 5.68 63.63 0.17 0.39 0.06 0.04 0.10 0.57 0.00 71.48 todorokite
sepge-1-019 1.52 0.03 0.00 1.41 1.42 73.18 1.01 0.01 1.81 0.07 0.03 0.00 80.48 Fe phase
sepge-1-020 0.07 0.04 1.24 7.61 65.20 0.11 0.11 0.00 0.02 0.16 0.61 0.00 75.17 todorokite
sepge-1-021 0.00 0.02 0.87 7.09 65.02 0.17 0.19 0.05 0.08 0.15 0.64 0.00 74.28 todorokite

87
sepge-1-022 0.00 0.05 1.19 5.61 69.03 0.57 0.14 0.00 0.02 0.09 1.13 0.00 77.83 todorokite
sepge-1-023 0.00 0.07 1.07 6.23 68.44 0.72 0.15 0.06 0.05 0.11 1.20 0.00 78.09 todorokite
sepge-2-01 0.01 0.02 1.19 6.19 69.66 1.19 0.11 0.04 0.04 0.14 0.72 0.00 79.29 todorokite
sepge-2-02 0.19 0.02 1.03 5.74 61.37 5.10 0.16 0.00 0.08 0.17 0.64 0.00 74.49 todorokite
sepge-2-03 2.36 0.02 0.00 1.33 1.69 73.40 1.21 0.00 2.07 0.00 0.02 0.00 82.11 Fe phase
sepge-2-04 0.00 0.03 0.73 6.71 64.65 0.17 0.21 0.08 0.00 0.19 0.51 0.00 73.28 todorokite
sepge-2-05 0.00 0.00 0.66 6.16 64.48 0.86 0.13 0.03 0.00 0.11 0.47 0.00 72.90 todorokite
sepge-2-06 2.06 0.02 0.00 0.98 2.55 73.37 0.73 0.00 1.12 0.04 0.03 0.00 80.90 Fe phase
sepge-2-07 2.45 0.02 0.00 1.03 3.19 74.16 0.38 0.00 0.80 0.01 0.01 0.00 82.04 Fe phase
sepge-2-08 1.40 0.03 0.00 0.74 4.66 72.26 1.20 0.04 1.82 0.06 0.12 0.00 82.34 Fe phase
sepge-2-09 1.44 0.06 0.00 0.78 4.56 72.65 1.32 0.07 2.02 0.06 0.14 0.00 83.10 Fe phase
sepge-2-010 0.20 0.07 0.43 1.58 70.80 0.40 0.93 0.00 0.05 0.57 3.96 0.00 78.99 cryptomelane
sepge-2-011 0.00 0.04 0.18 1.84 73.09 0.33 0.40 0.01 0.13 0.57 4.25 0.00 80.82 cryptomelane
sepge-2-012 0.06 0.07 0.46 2.22 70.54 0.82 0.76 0.00 0.24 0.51 3.52 0.00 79.22 cryptomelane
sepge-2-013 0.01 0.06 0.97 1.87 72.06 0.58 1.44 0.00 0.07 0.48 3.62 0.00 81.15 cryptomelane
sepge-2-014 0.00 0.07 0.73 2.43 64.90 2.36 1.13 0.00 0.23 0.41 2.99 0.00 75.25 cryptomelane
sepge-2-015 0.00 0.07 0.12 2.04 73.66 0.32 0.21 0.11 0.00 0.58 4.16 0.00 81.29 cryptomelane
sepge-2-016 0.00 0.07 0.12 2.31 70.87 0.19 0.21 0.07 0.03 0.56 4.19 0.00 78.61 cryptomelane
sepge-2-017 0.36 0.07 0.19 1.88 67.12 0.65 0.21 0.05 0.14 0.45 3.78 0.00 74.92 cryptomelane
sepge-2-018 0.07 0.04 0.14 1.90 64.23 0.41 0.16 0.02 0.04 0.47 3.90 0.00 71.39 cryptomelane
sepge-2-019 0.00 0.11 1.03 6.38 68.03 0.31 0.08 0.02 0.09 0.24 0.71 0.00 77.01 todorokite
sepge-2-020 0.00 0.03 1.00 6.15 63.08 0.21 0.22 0.01 0.00 0.21 0.62 0.00 71.53 todorokite
sepge-2-021 0.03 0.12 0.29 1.84 70.97 0.42 0.20 0.04 0.00 0.55 4.19 0.00 78.63 cryptomelane
sepge-2-022 0.00 0.06 0.24 2.94 69.63 0.10 0.17 0.00 0.06 0.60 3.33 0.00 77.14 cryptomelane
sepge-2-023 0.00 0.12 0.18 1.90 70.41 0.32 0.26 0.11 0.00 0.60 4.00 0.00 77.90 cryptomelane
sebulk-1-01 0.56 0.00 0.01 1.15 44.24 10.47 1.04 0.14 24.22 0.06 0.04 0.00 81.92 coronadite
sebulk-1-02 0.24 0.00 0.05 1.04 50.93 3.97 1.31 0.00 25.81 0.08 0.03 0.00 83.44 coronadite
sebulk-1-03 3.87 0.03 0.07 0.76 0.12 70.16 0.88 0.11 0.72 0.06 0.01 0.00 76.77 Fe phase
sebulk-1-04 3.93 0.04 0.07 0.52 0.00 73.87 0.82 0.02 0.66 0.04 0.03 0.00 80.00 Fe phase
sebulk-1-05 4.15 0.00 0.09 0.47 0.00 78.01 0.97 0.00 0.79 0.03 0.01 0.01 84.54 Fe phase
sebulk-1-06 4.35 0.01 0.08 0.50 0.03 76.21 0.79 0.02 0.81 0.02 0.01 0.05 82.86 Fe phase
sebulk-1-07 2.57 0.06 0.00 0.79 0.11 81.83 0.30 0.05 0.11 0.07 0.03 0.00 85.92 Fe phase
sebulk-1-08 4.29 0.06 0.10 0.57 0.04 72.81 0.90 0.00 0.75 0.08 0.23 0.03 79.85 Fe phase
sebulk-1-09 3.11 0.06 0.02 0.49 0.00 75.32 1.29 0.01 0.38 0.02 0.00 0.00 80.70 Fe phase
sebulk-1-
010 2.99 0.05 0.05 0.53 0.06 73.54 1.26 0.00 0.14 0.04 0.00 0.01 78.65 Fe phase
sebulk-1-
011 0.16 0.00 0.04 1.17 48.52 2.34 1.71 0.00 28.56 0.10 0.07 0.00 82.65 coronadite
sebulk-1-
012 3.49 0.02 0.00 0.78 0.09 78.07 0.66 0.00 0.33 0.02 0.00 0.00 83.47 Fe phase
sebulk-1-
013 2.12 0.03 0.00 0.80 0.05 81.92 0.26 0.07 0.08 0.04 0.00 0.01 85.38 Fe phase
sebulk-1-
014 4.52 0.00 0.09 0.39 0.01 73.62 1.25 0.03 0.78 0.05 0.00 0.03 80.77 Fe phase
sebulk-1-
015 1.80 0.45 0.29 1.88 0.33 80.08 0.79 0.02 0.00 0.33 0.02 0.00 85.97 Fe phase
sebulk-1-
016 0.00 0.00 2.24 3.10 67.32 0.20 0.73 0.00 0.02 0.63 0.84 0.00 75.09 todorokite
sebulk-1-
017 0.01 0.02 2.17 3.74 67.25 0.21 0.77 0.00 0.00 0.70 0.82 0.00 75.67 todorokite

88
sebulk-1-
018 0.02 0.04 2.25 3.32 69.01 0.29 0.68 0.13 0.00 0.65 0.82 0.00 77.21 todorokite
sebulk-1-
019 0.04 0.04 2.32 3.25 64.81 0.38 0.70 0.04 0.06 0.69 0.85 0.00 73.18 todorokite
sebulk-1-
020 0.00 0.04 2.33 3.10 64.67 0.39 0.64 0.02 0.02 0.69 0.82 0.00 72.72 todorokite
sebulk-1-
021 0.00 0.02 2.23 3.70 63.85 0.28 0.80 0.04 0.02 0.71 0.84 0.00 72.48 todorokite
sebulk-1-
022 3.82 0.04 0.09 0.43 0.02 72.37 1.70 0.14 0.14 0.05 0.00 0.01 78.80 Fe phase
sebulk-1-
023 3.52 0.03 0.00 0.73 0.07 79.43 0.37 0.00 0.79 0.03 0.02 0.00 85.00 Fe phase
sebulk-1-
024 3.67 0.02 0.04 0.46 0.02 74.49 1.07 0.05 0.48 0.03 0.02 0.00 80.35 Fe phase
sebulk-1-
025 2.68 0.06 0.00 0.53 0.00 72.79 1.99 0.00 0.69 0.04 0.00 0.03 78.82 Fe phase
sebulk-1-
026 0.00 0.02 2.27 2.98 65.93 0.22 0.70 0.07 0.00 0.59 0.88 0.00 73.65 todorokite
sebulk-1-
027 0.00 0.02 2.26 3.23 65.08 0.30 0.79 0.00 0.00 0.63 0.82 0.00 73.13 todorokite
sebulk-1-
028 0.00 0.06 2.24 3.28 65.20 0.38 0.77 0.03 0.00 0.61 0.82 0.00 73.39 todorokite
sebulk-1-
029 0.00 0.00 2.28 3.17 64.40 0.54 0.70 0.06 0.01 0.63 0.83 0.00 72.61 todorokite
sebulk-1-
030 0.01 0.01 2.26 2.99 65.84 0.42 0.76 0.00 0.09 0.58 0.82 0.00 73.79 todorokite
sebulk-1-
031 2.34 0.00 0.02 0.80 54.45 0.42 0.61 0.00 25.21 0.04 0.01 0.00 83.89 coronadite
sebulk-1-
032 4.06 0.02 0.33 1.19 3.86 67.31 0.66 0.02 0.03 0.06 0.07 0.00 77.61 Fe phase
sebulk-1-
033 0.15 0.02 0.00 85.08 0.75 0.04 0.07 0.00 0.00 0.01 0.01 0.04 86.16 calcite
sebulk-1-
034 0.00 0.02 2.22 3.70 65.82 1.53 0.77 0.08 0.02 0.82 0.87 0.00 75.84 todorokite
sebulk-1-
035 0.00 0.00 2.21 3.44 65.75 0.73 0.81 0.00 0.05 0.89 0.86 0.00 74.74 todorokite
sebulk-1-
036 0.00 0.03 2.35 3.34 66.85 0.31 0.98 0.07 0.00 0.81 0.81 0.00 75.54 todorokite
sebulk-1-
037 0.00 0.01 2.31 4.13 66.96 0.57 0.91 0.00 0.07 0.93 0.96 0.00 76.85 todorokite
sebulk-2-01 0.00 0.00 0.01 0.47 61.66 0.93 0.36 0.04 20.23 0.14 0.45 0.00 84.30 coronadite
sebulk-2-02 0.22 0.00 0.12 1.03 51.01 3.56 0.74 0.00 24.79 0.07 0.09 0.00 81.62 coronadite
sebulk-2-03 0.08 0.01 2.16 2.97 63.22 3.52 0.66 0.02 0.90 0.57 0.79 0.00 74.89 todorokite
sebulk-2-04 0.00 0.01 2.12 3.13 64.31 0.54 0.78 0.00 1.11 0.58 0.86 0.00 73.43 todorokite
sebulk-2-05 0.02 0.05 2.68 3.38 63.85 0.38 0.65 0.05 0.47 2.66 0.91 0.00 75.11 todorokite
sebulk-2-06 0.00 0.03 1.39 3.51 59.44 1.30 0.59 0.02 2.94 0.42 0.73 0.00 70.37 todorokite
sebulk-2-07 1.47 0.03 0.04 0.99 33.48 25.45 0.87 0.01 15.72 0.03 0.00 0.00 78.09 mixed phase
sebulk-2-08 0.05 0.01 0.36 1.50 56.32 2.27 0.66 0.05 17.52 0.13 0.59 0.00 79.46 coronadite
sebulk-2-09 0.00 0.01 2.34 3.25 65.35 0.74 0.78 0.00 0.35 0.62 0.85 0.00 74.27 todorokite
sebulk-2-
010 0.24 0.02 1.95 3.23 58.22 3.57 0.70 0.04 0.53 0.50 0.77 0.00 69.77 todorokite
sebulk-2-
011 0.03 0.01 2.19 3.22 64.73 2.12 0.81 0.00 1.04 0.56 0.85 0.00 75.54 todorokite
sebulk-2-
012 0.00 0.02 2.26 3.53 67.80 0.85 0.86 0.13 0.52 0.59 0.89 0.00 77.44 todorokite
sebulk-2-
013 0.00 0.01 2.47 3.43 64.99 0.33 0.68 0.07 0.20 0.60 0.85 0.00 73.62 todorokite
sebulk-2-
014 0.19 0.01 0.03 0.84 50.86 3.60 0.60 0.00 26.11 0.08 0.03 0.00 82.35 coronadite
sebulk-2-
015 0.14 0.00 0.07 0.93 54.89 3.52 0.62 0.12 23.56 0.09 0.08 0.00 84.02 coronadite
sebulk-2-
016 0.30 0.00 0.03 0.91 48.99 4.86 0.59 0.04 26.92 0.06 0.01 0.00 82.70 coronadite
sebulk-2-
017 0.00 0.00 2.25 3.03 67.32 0.26 0.66 0.03 0.31 0.71 0.88 0.00 75.44 todorokite
sebulk-2-
018 0.00 0.02 2.14 3.31 62.18 0.79 0.76 0.07 0.89 0.64 0.83 0.00 71.62 todorokite
sebulk-2-
019 0.00 0.00 2.45 2.95 67.24 0.33 0.62 0.00 0.28 0.75 0.87 0.00 75.48 todorokite
sebulk-2-
020 0.48 0.00 0.63 2.30 48.01 4.66 0.49 0.00 9.28 0.26 0.42 0.00 66.52 coronadite, mixed phase
sebulk-2-
021 1.99 0.06 0.05 0.53 0.00 80.68 0.27 0.00 0.86 0.03 0.00 0.00 84.46 Fe phase
sebulk-2-
022 3.81 0.02 0.00 0.66 0.04 80.78 0.15 0.01 0.43 0.02 0.00 0.05 85.97 Fe phase

89
sebulk-2-
023 4.57 0.02 0.17 0.35 0.00 72.62 0.72 0.04 0.43 0.02 0.01 0.00 78.96 Fe phase
sebulk-2-
024 2.13 0.02 0.32 0.28 0.05 77.85 0.19 0.02 0.01 0.00 0.00 0.13 80.99 Fe phase
sebulk-2-
025 3.87 0.07 0.05 0.63 0.00 71.28 1.30 0.10 0.41 0.07 0.00 0.00 77.78 Fe phase
sebulk-2-
026 1.50 0.03 0.40 0.30 0.00 79.62 0.13 0.00 0.00 0.01 0.00 0.09 82.08 Fe phase
sebulk-2-
027 2.49 0.02 0.40 0.16 0.00 77.17 0.13 0.07 0.20 0.03 0.00 0.01 80.68 Fe phase
sebulk-2-
028 3.80 0.00 0.16 1.06 0.07 71.73 1.14 0.01 0.17 0.04 0.00 0.07 78.23 Fe phase
sebulk-2-
029 0.05 0.01 2.39 3.01 67.42 0.40 0.70 0.03 0.09 0.63 0.93 0.00 75.66 todorokite
sebulk-2-
030 0.11 0.03 2.10 3.54 64.21 1.73 0.71 0.05 0.14 0.65 0.85 0.00 74.11 todorokite
sebulk-2-
031 0.00 0.00 2.43 2.96 65.48 0.38 0.70 0.00 0.03 0.62 0.83 0.00 73.42 todorokite
sebulk-2-
032 0.00 0.06 1.62 4.18 62.05 2.13 0.75 0.00 0.50 0.49 0.73 0.00 72.51 todorokite
sebulk-2-
033 0.00 0.02 2.29 3.19 66.96 0.38 0.71 0.00 0.52 0.57 0.86 0.00 75.51 todorokite
sebulk-2-
034 0.00 0.02 2.37 3.04 63.95 0.23 0.82 0.00 0.18 0.61 0.83 0.00 72.04 todorokite
sebulk-2-
035 0.00 0.03 1.84 3.76 65.23 1.97 0.69 0.02 0.24 0.51 0.80 0.00 75.10 todorokite
sebulk-2-
036 0.00 0.02 2.30 3.23 64.86 0.33 0.70 0.02 0.20 0.66 0.90 0.00 73.21 todorokite
sebulk-3-01 0.43 0.01 0.27 1.51 54.79 3.56 0.71 0.23 20.75 0.14 0.20 0.00 82.60 coronadite
sebulk-3-02 0.27 0.00 0.04 0.46 60.05 0.54 0.52 0.11 24.08 0.10 0.35 0.00 86.51 coronadite
sebulk-3-03 0.03 0.00 0.08 1.28 57.51 1.82 0.55 0.00 19.36 0.15 0.27 0.00 81.04 coronadite
sebulk-3-04 0.00 0.05 0.31 2.62 57.34 3.82 0.66 0.02 13.00 0.25 0.44 0.00 78.50 coronadite
sebulk-3-05 0.00 0.02 1.01 1.67 60.68 0.39 10.71 0.00 0.45 0.38 0.24 0.00 75.56 chalcophanite
sebulk-3-06 0.00 0.06 1.86 3.31 64.93 2.22 0.67 0.04 1.32 0.51 0.77 0.00 75.67 todorokite
sebulk-3-07 0.00 0.03 2.12 3.07 63.56 0.92 0.67 0.02 1.04 0.52 0.82 0.00 72.76 todorokite
sebulk-3-08 0.00 0.02 2.21 3.38 66.04 0.82 0.67 0.05 0.49 0.63 0.82 0.00 75.13 todorokite
sebulk-3-09 0.00 0.03 2.18 3.33 63.32 1.28 0.73 0.00 0.50 0.62 0.85 0.00 72.84 todorokite
sebulk-3-
010 1.03 0.10 1.02 2.54 48.48 20.13 0.49 0.03 1.18 0.36 0.42 0.00 75.76 mixed phase
sebulk-3-
011 0.22 0.04 2.30 3.33 64.07 0.26 0.67 0.00 0.62 0.57 0.82 0.00 72.90 todorokite
sebulk-3-
012 0.00 0.03 2.31 3.16 67.44 0.33 0.69 0.00 0.54 0.65 0.84 0.00 75.99 todorokite
sebulk-3-
013 0.15 0.00 0.02 1.14 56.13 1.26 0.49 0.00 22.50 0.03 0.25 0.00 81.97 coronadite
sebulk-3-
014 0.00 0.03 2.30 3.02 66.31 0.28 0.66 0.00 0.62 0.65 0.89 0.00 74.76 todorokite
sebulk-3-
015 0.00 0.02 2.31 3.24 63.19 0.36 0.69 0.00 0.44 0.66 0.85 0.00 71.76 todorokite
sebulk-3-
016 0.00 0.11 1.69 3.97 63.44 1.62 0.62 0.00 1.00 0.59 0.75 0.00 73.79 todorokite
sebulk-3-
017 0.00 0.04 2.23 3.11 63.15 0.63 0.62 0.09 0.71 0.62 0.83 0.00 72.03 todorokite
sebulk-3-
018 0.17 0.04 2.16 3.02 64.59 0.28 0.71 0.08 0.82 0.56 0.81 0.00 73.25 todorokite
sebulk-3-
019 0.00 0.08 1.84 4.40 65.08 1.62 0.67 0.03 0.84 0.67 0.82 0.00 76.06 todorokite
sebulk-3-
020 0.03 0.19 1.58 4.09 65.29 4.68 0.56 0.01 0.94 0.59 0.71 0.00 78.67 todorokite
sebulk-3-
021 0.00 0.03 2.45 3.35 65.53 0.37 0.66 0.04 0.62 0.68 0.84 0.00 74.58 todorokite
sebulk-3-
022 0.00 0.02 2.26 3.25 67.09 0.35 0.64 0.00 0.40 0.70 0.83 0.00 75.53 todorokite
sebulk-3-
023 0.00 0.04 2.19 3.26 65.61 0.66 0.87 0.02 0.97 0.74 0.91 0.00 75.26 todorokite
sebulk-3-
024 0.03 0.05 1.79 2.31 64.50 0.68 3.24 0.00 0.43 0.56 0.51 0.00 74.08 todorokite
sebulk-3-
025 0.00 0.06 2.39 3.36 64.05 0.42 0.66 0.09 0.04 0.76 0.87 0.00 72.69 todorokite
sebulk-3-
026 0.00 0.02 2.24 3.22 66.39 0.71 0.74 0.05 0.08 0.68 0.86 0.00 74.99 todorokite
sebulk-3-
027 0.00 0.02 2.29 3.17 65.04 0.48 0.71 0.00 0.06 0.71 0.86 0.00 73.34 todorokite
sebulk-3-
028 0.00 0.02 2.13 3.07 64.43 0.72 0.77 0.11 1.18 0.77 0.85 0.00 74.04 todorokite

90
sebulk-3-
029 0.00 0.16 2.37 3.36 63.04 0.59 0.82 0.00 0.32 0.78 0.84 0.00 72.26 todorokite
sebulk-3-
030 1.36 0.13 2.16 3.50 64.55 1.42 0.73 0.12 0.26 1.01 0.83 0.00 76.08 todorokite
sebulk-3-
031 0.06 0.11 2.27 2.99 63.99 0.43 0.77 0.06 0.13 0.83 0.86 0.00 72.49 todorokite
sebulk-3-
032 0.00 0.07 2.34 3.28 65.31 0.31 0.65 0.08 0.11 0.92 0.87 0.00 73.94 todorokite
sebulk-3-
033 0.00 0.08 2.21 3.18 63.93 0.46 0.81 0.00 0.22 0.78 0.86 0.00 72.52 todorokite
sebulk-3-
034 0.22 0.07 1.90 3.06 60.28 5.57 0.73 0.05 0.45 0.71 0.74 0.00 73.79 todorokite
sebulk-3-
035 0.00 0.01 2.38 3.08 64.51 0.39 0.75 0.00 0.00 0.68 0.91 0.00 72.70 todorokite
sebulk-3-
036 0.00 0.01 2.34 2.95 66.93 0.38 0.68 0.03 0.03 0.63 0.83 0.00 74.80 todorokite
sebulk-3-
037 0.00 0.05 2.17 3.36 62.70 1.03 0.73 0.00 0.08 0.67 0.82 0.00 71.59 todorokite
sebulk-3-
038 0.43 0.11 0.06 0.74 59.32 1.32 0.54 0.00 22.70 0.10 0.29 0.00 85.60 coronadite
sebulk-3-
039 0.17 0.01 0.00 0.57 54.29 0.41 0.48 0.04 25.50 0.05 0.13 0.00 81.64 coronadite
sebulk-3-
040 0.17 0.02 0.03 0.51 58.60 0.72 0.29 0.07 24.09 0.07 0.16 0.00 84.71 coronadite
sebulk-3-
041 0.14 0.00 0.05 0.55 55.08 0.43 0.41 0.01 23.66 0.06 0.23 0.00 80.62 coronadite
sebulk-3-
042 0.14 0.02 0.01 1.08 52.08 0.85 0.34 0.14 17.47 0.10 0.63 0.00 72.86 coronadite
sebulk-3-
043 0.02 0.03 2.35 3.19 66.35 0.33 0.82 0.00 0.66 0.72 0.81 0.00 75.27 todorokite
sebulk-3-
044 0.00 0.02 2.20 2.76 64.18 0.59 0.60 0.00 0.96 0.77 0.78 0.00 72.86 todorokite
sebulk-3-
045 0.08 0.05 2.30 3.14 65.67 0.36 0.68 0.05 1.00 0.77 0.85 0.00 74.94 todorokite
sebulk-3-
046 0.00 0.03 2.39 3.00 66.35 0.73 0.74 0.12 0.11 1.00 0.97 0.00 75.43 todorokite
sebulk-3-
047 0.06 0.03 2.39 3.09 64.29 0.80 0.66 0.00 0.00 0.97 0.95 0.00 73.23 todorokite
sebulk-3-
048 0.04 0.05 2.28 3.21 67.20 0.60 0.63 0.00 0.12 0.97 0.95 0.00 76.05 todorokite
sebulk-3-
049 0.00 0.01 2.53 2.33 61.01 0.59 1.57 0.02 0.15 0.88 0.69 0.00 69.78 todorokite
sebulk-3-
050 0.00 0.03 2.35 2.96 66.51 0.40 0.65 0.02 0.03 0.93 1.00 0.00 74.88 todorokite
Highlighted totals are greater than two standard deviations for the specified mineral.

91
APPENDIX C. X-RAY DIFFRACTION
C.1 Intrusive Rocks
Pos. [°2Th.] Height [cts] FWHM
Left [°2Th.]
d-spacing
[Å]
Rel. Int. [%] Tip Width Matched by
29.437080 677.415200 0.122400 3.03183 100.00 0.1469 01-072-
1652; 01-
075-6049
Visible Ref. Code Score Compound
Name
Displacement
[°2Th.]
Scale Factor Chemical
Formula
* 01-072-1652 12 Calcium
Carbonate
0.000 0.172 Ca C O3
* 01-075-6049 22 Calcium
Carbonate
0.000 0.598 Ca ( C O3 )
Figure C-1: “Clear plagioclase” from Cp1813 92’
Position [°2Theta] (Copper (Cu))
10 20 30 40 50 60
Counts
0
1000
2000
3000
Cp1813 92' 40min_2

92
Pos. [°2Th.] Height [cts] FWHM
Left [°2Th.]
d-spacing
[Å]
Rel. Int. [%] Tip Width Matched by
29.443960 12854.2700
00
0.133824 3.03113 100.00 0.1606 01-075-
6049
31.475930 206.861500 0.133824 2.83993 1.61 0.1606 01-075-
6049
60.980440 403.988400 0.100368 1.51816 3.14 0.1204 01-075-
6049
65.590650 132.923500 0.100368 1.42216 1.03 0.1204 01-075-
6049
Visible Ref. Code Score Compound
Name
Displaceme
nt [°2Th.]
Scale Factor Chemical
Formula
* 01-072-7652 No
Matching
Lines
Carbon
Nitrogen
0.000 0.000 C3 N4
* 01-075-6049 26 Calcium
Carbonate
0.000 0.239 Ca ( C O3 )
Figure C-2: “Clear plagioclase” from Core 1
Position [°2Theta] (Copper (Cu))
10 20 30 40 50 60
Counts
0
10000
20000
Core 1 40min_2

93
Pos. [°2Th.] Height [cts] FWHM
Left [°2Th.]
d-spacing
[Å]
Rel. Int. [%] Tip Width Matched by
9.143161 109.784000 0.401472 9.66444 21.70 0.4818 00-007-
0051
12.011290 505.853800 0.100368 7.36237 100.00 0.1204 00-007-
0051
24.339600 55.829350 0.669120 3.65400 11.04 0.8029 01-073-
9850
28.372040 153.852800 0.100368 3.14317 30.41 0.1204 01-073-
9850; 00-
058-2010
Visible Ref. Code Score Compound
Name
Displaceme
nt [°2Th.]
Scale Factor Chemical
Formula
* 01-073-9850 Unmatched
Strong
Sodium
Aluminum
Silicate
0.000 0.271 Na ( Al Si3
O8 )
* 00-003-0009 No
Matching
Lines
Iron
Magnesium
Aluminum
Silicate
0.000 0.000 Si3.74
Al2.03
Fe0.03
Mg0.20 O11
* 00-007-0051 2 Sodium
Calcium
Aluminum
Magnesium
Silicon
Hydroxide
Hydrate
0.000 2.933 ( Na , Ca
)0.3 ( Al ,
Mg )2 Si2
O10 ( O H
)2 ·n H2 O
* 00-012-0204 No Sodium 0.000 0.000 Nax ( Al ,
Position [°2Theta] (Copper (Cu))
10 20 30 40 50 60
Counts
0
1000
2000
3000
Felsic core 40min

94
Matching
Lines
Magnesium
Aluminum
Silicate
Hydroxide
Hydrate
Mg )2 Si4
O10 ( O H
)2 ·z H2 O
* 00-058-2010 No
Matching
Lines
Sodium
Aluminum
Magnesium
Silicate
Hydroxide
Hydrate
0.000 0.000 Na0.3 ( Al ,
Mg )2 Si4
O10 ( O H
)2 ·x H2 O
Figure C-3: “Cloudy plagioclase” from Felsic core
Pos. [°2Th.] Height [cts] FWHM
Left [°2Th.]
d-spacing
[Å]
Rel. Int. [%] Tip Width Matched by
28.012240 478.953000 0.133824 3.18272 100.00 0.1606 01-073-
9850
29.586670 164.476400 0.100368 3.01684 34.34 0.1204 01-071-
0924
31.412050 85.402380 0.167280 2.84556 17.83 0.2007 01-076-
0803; 01-
073-9850;
01-071-
0924
Position [°2Theta] (Copper (Cu))
10 20 30 40 50 60
Counts
0
1000
2000
3000
Cp1813 2070' 40min

95
Visible Ref. Code Score Compound
Name
Displaceme
nt [°2Th.]
Scale Factor Chemical
Formula
* 01-076-0803 Unmatched
Strong
Sodium
Potassium
Aluminum
Silicate
0.000 0.129 ( Na0.7
K0.3 ) (
Al1.02
Si2.98 O8 )
* 01-073-9850 Unmatched
Strong
Sodium
Aluminum
Silicate
0.000 0.218 Na ( Al Si3
O8 )
* 01-071-0924 Unmatched
Strong
Sodium
Calcium
Aluminum
Silicate
Chloride
0.000 1.198 Na6.32
Ca1.52
Al7.37
Si16.75 O48
Cl1.90
Figure C-4: “Cloudy plagioclase” from Cp1813 2070’
Pos. [°2Th.] Height [cts] FWHM
Left [°2Th.]
d-spacing
[Å]
Rel. Int. [%] Tip Width Matched by
13.893430 1326.32400
0
0.100368 6.36894 16.35 0.1204 01-073-
9850
22.086690 577.166800 0.100368 4.02137 7.11 0.1204 01-073-
9850
24.253380 111.799000 0.117096 3.66680 1.38 0.1405 01-073-
9850
27.956870 8112.08900
0
0.100368 3.18889 100.00 0.1204 01-073-
9850
31.242020 161.182600 0.117096 2.86066 1.99 0.1405 01-073-
Position [°2Theta] (Copper (Cu))
10 20 30 40 50 60
Counts
0
5000
10000
Cp1813 92' 40min

96
9850
38.537600 31.048770 0.401472 2.33424 0.38 0.4818 01-073-
9850
42.452440 69.184430 0.133824 2.12760 0.85 0.1606 01-073-
9850
57.758010 33.056810 0.200736 1.59495 0.41 0.2409 01-073-
9850
Visible Ref. Code Score Compound
Name
Displacement
[°2Th.]
Scale Factor Chemical
Formula
* 01-073-9850 17 Sodium
Aluminum
Silicate
0.000 0.227 Na ( Al Si3
O8 )
Figure C-5: “Cloudy plagioclase” from Cp1813 92’
Pos. [°2Th.] Height [cts] FWHM
Left [°2Th.]
d-spacing
[Å]
Rel. Int. [%] Tip Width Matched by
6.069730 92.758630 0.401472 14.54942 25.23 0.4818
27.895250 367.658400 0.117096 3.19580 100.00 0.1405 01-076-
0803
Visible Ref. Code Score Compound
Name
Displacement
[°2Th.]
Scale Factor Chemical
Formula
* 01-076-0803 10 Sodium 0.000 0.272 ( Na0.7 K0.3
Position [°2Theta] (Copper (Cu))
10 20 30 40 50 60
Counts
0
1000
2000
3000
Core 1 40min

97
Potassium
Aluminum
Silicate
) ( Al1.02
Si2.98 O8 )
Figure C-6: “Cloudy plagioclase” from Core 1
Pos. [°2Th.] Height [cts] FWHM
Left [°2Th.]
d-spacing
[Å]
Rel. Int. [%] Tip Width Matched by
6.094523 110.477200 0.401472 14.49029 100.00 0.4818
27.518010 63.184960 0.200736 3.23875 57.19 0.2409 01-076-
0803
27.940900 105.834700 0.133824 3.19068 95.80 0.1606 01-076-
0803
Visible Ref. Code Score Compound
Name
Displaceme
nt [°2Th.]
Scale Factor Chemical
Formula
* 01-076-0803 Unmatched
Strong
Sodium
Potassium
Aluminum
Silicate
0.000 0.664 ( Na0.7
K0.3 ) (
Al1.02
Si2.98 O8 )
Figure C-7: “K-feldspar”from Cp1813 2070’
Position [°2Theta] (Copper (Cu))
10 20 30 40 50 60
Counts
0
1000
2000
3000
Cp1813 2070' 40min_2

98
Pos. [°2Th.] Height [cts] FWHM
Left [°2Th.]
d-spacing
[Å]
Rel. Int. [%] Tip Width Matched by
8.718917 548.934900 0.401472 10.13371 52.70 0.4818 01-080-
1106
17.530200 1041.60900
0
2.944128 5.05499 100.00 3.5330 01-080-
1106
19.259860 827.275400 1.605888 4.60474 79.42 1.9271 01-080-
1106
21.485140 165.007800 2.408832 4.13258 15.84 2.8906 01-080-
1106
44.109700 41.820560 5.888256 2.05143 4.01 7.0659 01-080-
1106
Visible Ref. Code Score Compound
Name
Displacement
[°2Th.]
Scale Factor Chemical
Formula
* 01-080-1106 3 Potassium
Iron
Magnesium
Aluminum
Silicate
Hydroxide
0.000 0.978 K Fe Mg2 (
Al Si3 O10 )
( O H )2
Figure C-8: Biotite from Cp1813 92’
Position [°2Theta] (Copper (Cu))
10 20 30 40 50 60
Counts
0
5000
10000
Cp1813 92' 40min_3

99
Pos. [°2Th.] Height [cts] FWHM
Left [°2Th.]
d-spacing
[Å]
Rel. Int. [%] Tip Width Matched by
8.287720 409.330100 3.264000 10.65996 37.41 3.9168 01-080-
1106
17.454420 1094.21300
0
4.569600 5.07677 100.00 5.4835 01-080-
1106
20.986200 260.291000 3.590400 4.22969 23.79 4.3085 01-080-
1106
44.267860 40.709230 7.833600 2.04447 3.72 9.4003 01-080-
1106
Visible Ref. Code Score Compound
Name
Displaceme
nt [°2Th.]
Scale Factor Chemical
Formula
* 01-080-1106 No
Matching
Lines
Potassium
Iron
Magnesium
Aluminum
Silicate
Hydroxide
0.000 0.000 K Fe Mg2 (
Al Si3 O10 )
( O H )2
Figure C-9: Biotite from Core 1
Position [°2Theta] (Copper (Cu))
10 20 30 40 50 60
Counts
0
5000
10000
Core 1 40min_3

100
C.2 Manganese Oxides
Pos. [°2Th.] Height [cts] FWHM
Left [°2Th.]
d-spacing
[Å]
Rel. Int. [%] Tip Width Matched by
9.577715 178.676100 0.133824 9.22690 32.85 0.1606 00-003-
0881
12.667150 44.240380 0.535296 6.98261 8.13 0.6424 00-044-
1386; 01-
084-2049;
00-043-
1456
19.073140 543.958300 0.200736 4.64940 100.00 0.2409 00-003-
0881
25.597640 40.521720 0.267648 3.47720 7.45 0.3212 00-044-
1386; 01-
084-2049
26.717310 109.122900 0.133824 3.33397 20.06 0.1606
28.678910 258.884800 0.167280 3.11023 47.59 0.2007 00-044-
1386; 01-
084-2049;
00-003-
0881
35.712730 17.639100 0.802944 2.51213 3.24 0.9635 00-044-
1386; 00-
043-1456;
00-003-
0881
37.754330 256.685600 0.301104 2.38084 47.19 0.3613 00-044-
1386; 01-
084-2049
Position [°2Theta] (Copper (Cu))
10 20 30 40 50 60
Counts
0
500
1000
SEPKM-1 short1

101
38.870380 27.366060 0.401472 2.31501 5.03 0.4818 00-044-
1386; 01-
084-2049;
00-043-
1456
41.014310 29.844830 0.401472 2.19882 5.49 0.4818 00-044-
1386; 01-
084-2049;
00-003-
0881
41.915040 30.329170 0.401472 2.15362 5.58 0.4818 00-044-
1386; 01-
084-2049;
00-043-
1456
48.409410 120.684700 0.401472 1.87879 22.19 0.4818 00-043-
1456; 00-
003-0881
49.672250 33.299720 0.669120 1.83394 6.12 0.8029 00-044-
1386; 01-
084-2049;
00-043-
1456
58.709990 28.759790 0.535296 1.57134 5.29 0.6424 00-044-
1386; 01-
084-2049;
00-043-
1456
60.051100 49.182420 0.535296 1.53941 9.04 0.6424 00-044-
1386; 01-
084-2049;
00-043-
1456; 00-
003-0881
63.427040 31.674090 0.535296 1.46536 5.82 0.6424 00-003-
0881
66.844830 39.647180 0.535296 1.39849 7.29 0.6424 00-044-
1386; 01-
084-2049;
00-043-
1456; 00-
003-0881
Visible Ref. Code Score Compound
Name
Displaceme
nt [°2Th.]
Scale Factor Chemical
Formula
* 00-044-1386 22 Potassium
Manganese
Oxide
0.000 0.339 K2-x Mn8
O16
* 01-084-2049 29 Lead
Manganese
Oxide
0.000 0.335 Pb1.34 Mn8
O16
* 00-043-1456 0 Sodium
Manganese
0.000 6.684 Na0.55 Mn2
O4 ·1.5 H2

102
Oxide
Hydrate
O
* 00-003-0881 Unmatched
Strong
Magnesium
Silicate
Hydroxide
0.000 0.432 Mg3 Si4
O10 ( O H
)2
Figure C-10: SE-PKM-1, vein A
Pos. [°2Th.] Height [cts] FWHM
Left [°2Th.]
d-spacing
[Å]
Rel. Int. [%] Tip Width Matched by
9.589890 273.259600 0.117096 9.21521 36.49 0.1405 00-003-
0881
12.651480 37.949020 0.535296 6.99122 5.07 0.6424 00-044-
1386; 01-
084-2049;
00-043-
1456
19.087600 748.840300 0.133824 4.64591 100.00 0.1606 00-003-
0881
24.970730 43.997170 0.200736 3.56306 5.88 0.2409 00-043-
1456
25.634230 40.397810 0.267648 3.47232 5.39 0.3212 00-044-
1386; 01-
084-2049;
00-002-
0056
26.765510 62.930540 0.133824 3.32807 8.40 0.1606 01-074-
1811; 00-
Position [°2Theta] (Copper (Cu))
10 20 30 40 50 60
Counts
0
500
1000
SEPKM-1 short2
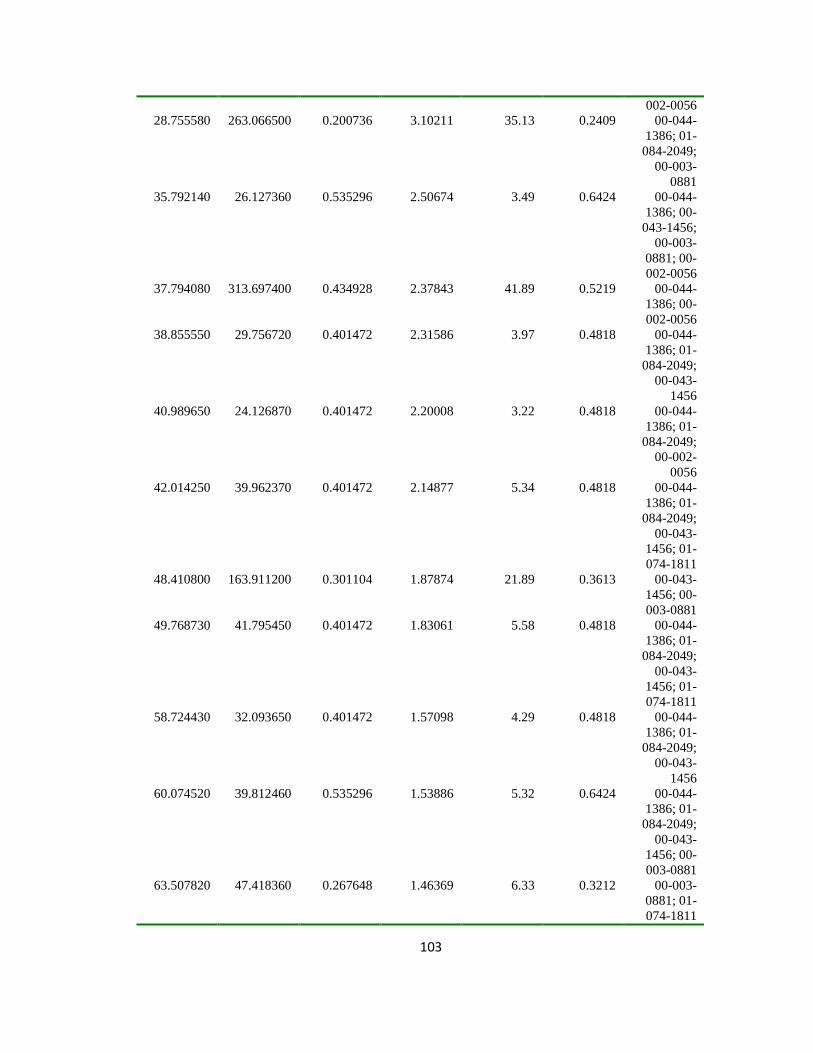
103
002-0056
28.755580 263.066500 0.200736 3.10211 35.13 0.2409 00-044-
1386; 01-
084-2049;
00-003-
0881
35.792140 26.127360 0.535296 2.50674 3.49 0.6424 00-044-
1386; 00-
043-1456;
00-003-
0881; 00-
002-0056
37.794080 313.697400 0.434928 2.37843 41.89 0.5219 00-044-
1386; 00-
002-0056
38.855550 29.756720 0.401472 2.31586 3.97 0.4818 00-044-
1386; 01-
084-2049;
00-043-
1456
40.989650 24.126870 0.401472 2.20008 3.22 0.4818 00-044-
1386; 01-
084-2049;
00-002-
0056
42.014250 39.962370 0.401472 2.14877 5.34 0.4818 00-044-
1386; 01-
084-2049;
00-043-
1456; 01-
074-1811
48.410800 163.911200 0.301104 1.87874 21.89 0.3613 00-043-
1456; 00-
003-0881
49.768730 41.795450 0.401472 1.83061 5.58 0.4818 00-044-
1386; 01-
084-2049;
00-043-
1456; 01-
074-1811
58.724430 32.093650 0.401472 1.57098 4.29 0.4818 00-044-
1386; 01-
084-2049;
00-043-
1456
60.074520 39.812460 0.535296 1.53886 5.32 0.6424 00-044-
1386; 01-
084-2049;
00-043-
1456; 00-
003-0881
63.507820 47.418360 0.267648 1.46369 6.33 0.3212 00-003-
0881; 01-
074-1811

104
66.959930 35.737070 0.401472 1.39637 4.77 0.4818 00-044-
1386; 01-
084-2049;
00-043-
1456; 00-
003-0881;
01-074-
1811
Visible Ref. Code Score Compound
Name
Displaceme
nt [°2Th.]
Scale Factor Chemical
Formula
* 00-044-1386 19 Potassium
Manganese
Oxide
0.000 0.269 K2-x Mn8
O16
* 01-084-2049 28 Lead
Manganese
Oxide
0.000 0.224 Pb1.34 Mn8
O16
* 00-043-1456 0 Sodium
Manganese
Oxide
Hydrate
0.000 7.277 Na0.55 Mn2
O4 ·1.5 H2
O
* 00-003-0881 Unmatched
Strong
Magnesium
Silicate
Hydroxide
0.000 0.308 Mg3 Si4
O10 ( O H
)2
* 01-074-1811 0 Silicon
Oxide
0.000 5.596 Si O2
* 00-002-0056 Unmatched
Strong
Potassium
Aluminum
Silicate
Hydroxide
0.000 0.664 K Al2 Si3
Al O10 ( O
H )2
Figure C-11: SE-PKM-1, vein A hard

105
Pos. [°2Th.] Height [cts] FWHM
Left [°2Th.]
d-spacing
[Å]
Rel. Int. [%] Tip Width Matched by
6.216909 25.495160 0.802944 14.20530 2.80 0.9635
12.755100 141.539600 0.267648 6.93466 15.55 0.3212 00-044-
1386; 01-
084-2049
18.168390 62.308090 0.401472 4.87884 6.84 0.4818 00-044-
1386; 01-
084-2049;
00-029-
0713
20.976010 172.370400 0.100368 4.23172 18.93 0.1204 01-070-
7344; 00-
029-0713
26.754040 910.382200 0.117096 3.32947 100.00 0.1405 01-070-
7344
28.694600 182.096300 0.401472 3.10856 20.00 0.4818 00-044-
1386; 01-
084-2049
36.642380 68.419510 0.200736 2.45050 7.52 0.2409 00-044-
1386; 01-
084-2049;
01-070-
7344; 00-
029-0713
37.557320 248.430200 0.301104 2.39288 27.29 0.3613 00-044-
1386; 01-
084-2049
39.565190 56.077840 0.267648 2.27595 6.16 0.3212 01-070-
7344
Position [°2Theta] (Copper (Cu))
10 20 30 40 50 60
Counts
0
500
1000
1500
SEPKM-1 short9

106
41.884860 49.799400 0.468384 2.15511 5.47 0.5621 00-044-
1386; 01-
084-2049
50.199790 71.408040 0.401472 1.81590 7.84 0.4818 00-044-
1386; 01-
070-7344
60.007740 96.654170 0.267648 1.54042 10.62 0.3212 00-044-
1386; 01-
084-2049;
01-070-
7344
65.317230 24.259600 0.535296 1.42745 2.66 0.6424 00-044-
1386; 01-
084-2049;
00-029-
0713
68.179520 43.455300 0.535296 1.37433 4.77 0.6424 00-044-
1386; 01-
084-2049;
01-070-
7344; 00-
029-0713
Visible Ref. Code Score Compound
Name
Displacement
[°2Th.]
Scale Factor Chemical
Formula
* 00-044-1386 30 Potassium
Manganese
Oxide
0.000 0.280 K2-x Mn8
O16
* 01-084-2049 25 Lead
Manganese
Oxide
0.000 0.160 Pb1.34 Mn8
O16
* 01-070-7344 15 Silicon Oxide 0.000 0.208 Si O2
* 00-029-0713 1 Iron Oxide
Hydroxide
0.000 0.183 Fe +3 O ( O
H )
Figure C-12: SE-PKM-1, cluster D

107
Pos. [°2Th.] Height [cts] FWHM
Left [°2Th.]
d-spacing
[Å]
Rel. Int. [%] Tip Width Matched by
6.245989 32.562010 0.802944 14.13923 9.20 0.9635
12.711220 124.580100 0.334560 6.95850 35.18 0.4015 00-044-
1386; 01-
084-2048;
00-043-
1456
18.076310 51.423460 0.401472 4.90349 14.52 0.4818 00-044-
1386; 01-
084-2048
20.894050 50.080020 0.200736 4.24814 14.14 0.2409 01-070-
7344
26.705670 354.113000 0.133824 3.33539 100.00 0.1606 01-070-
7344
28.745930 90.181320 0.401472 3.10313 25.47 0.4818 00-044-
1386; 01-
084-2048
37.512580 192.015600 0.334560 2.39563 54.22 0.4015 00-044-
1386; 01-
084-2048
41.921740 44.702680 0.535296 2.15330 12.62 0.6424 00-044-
1386; 01-
084-2048;
00-043-
1456
50.122270 50.236050 0.401472 1.81852 14.19 0.4818 00-044-
1386; 01-
084-2048;
00-043-
Position [°2Theta] (Copper (Cu))
10 20 30 40 50 60
Counts
0
200
400
600
800
SEPKM-1 short10

108
1456; 01-
070-7344
60.062790 55.310430 0.535296 1.53914 15.62 0.6424 00-044-
1386; 01-
084-2048;
00-043-
1456; 01-
070-7344
65.342480 39.723610 0.401472 1.42696 11.22 0.4818 00-044-
1386; 01-
084-2048;
00-043-
1456; 01-
070-7344
Visible Ref. Code Score Compound
Name
Displaceme
nt [°2Th.]
Scale Factor Chemical
Formula
* 00-044-1386 24 Potassium
Manganese
Oxide
0.000 0.481 K2-x Mn8
O16
* 01-084-2048 9 Lead
Manganese
Oxide
0.000 0.240 Pb1.07 Mn8
O16
* 00-043-1456 No
Matching
Lines
Sodium
Manganese
Oxide
Hydrate
0.000 0.000 Na0.55 Mn2
O4 ·1.5 H2
O
* 01-070-7344 21 Silicon
Oxide
0.000 0.499 Si O2
Figure C-13: SE-PKM-1, dendrite E

109
Pos. [°2Th.] Height [cts] FWHM
Left [°2Th.]
d-spacing
[Å]
Rel. Int. [%] Tip Width Matched by
6.345348 28.261470 0.802944 13.91805 6.31 0.9635
9.203472 448.218000 0.184008 9.60124 100.00 0.2208 00-038-
0475
18.413490 97.219540 0.334560 4.81445 21.69 0.4015 00-038-
0475
26.657480 125.122000 0.100368 3.34131 27.92 0.1204 01-070-
7344
29.427570 247.680800 0.117096 3.03278 55.26 0.1405 00-005-
0586; 00-
038-0475
35.997390 47.355570 0.200736 2.49291 10.57 0.2409 00-005-
0586
39.388980 64.456220 0.167280 2.28572 14.38 0.2007 00-005-
0586; 01-
070-7344;
00-038-
0475
43.168350 61.856370 0.200736 2.09396 13.80 0.2409 00-005-
0586; 00-
038-0475
47.495680 53.469180 0.200736 1.91278 11.93 0.2409 00-005-
0586; 00-
038-0475
48.522970 48.875020 0.200736 1.87466 10.90 0.2409 00-005-
0586; 00-
038-0475
65.780510 15.011180 0.802944 1.41852 3.35 0.9635 00-005-
0586; 01-
Position [°2Theta] (Copper (Cu))
10 20 30 40 50 60
Counts
0
500
1000
SE bulk-1 short1

110
070-7344;
00-038-
0475
Visible Ref. Code Score Compound
Name
Displacement
[°2Th.]
Scale Factor Chemical
Formula
* 00-005-0586 38 Calcium
Carbonate
0.000 0.594 Ca C O3
* 01-070-7344 10 Silicon Oxide 0.000 0.148 Si O2
* 00-038-0475 10 Sodium
Manganese
Oxide
Hydrate
0.000 0.810 Na Mn6 O12
·3 H2 O
Figure C-14: SE-bulk-1, dendrite A
Pos. [°2Th.] Height [cts] FWHM
Left [°2Th.]
d-spacing
[Å]
Rel. Int. [%] Tip Width Matched by
6.210003 44.335000 0.401472 14.22108 20.72 0.4818
9.146000 213.960100 0.133824 9.66144 100.00 0.1606 00-038-
0475
18.357690 49.316480 0.267648 4.82896 23.05 0.3212 00-038-
0475
26.591760 81.751460 0.133824 3.34942 38.21 0.1606 01-070-
7344
Position [°2Theta] (Copper (Cu))
10 20 30 40 50 60
Counts
0
200
400
600
SE-PGE-1 short1

111
Visible Ref. Code Score Compound
Name
Displaceme
nt [°2Th.]
Scale Factor Chemical
Formula
* 01-070-7344 13 Silicon
Oxide
0.000 0.319 Si O2
* 00-038-0475 9 Sodium
Manganese
Oxide
Hydrate
0.000 0.426 Na Mn6
O12 ·3 H2 O
* 00-029-0713 No
Matching
Lines
Iron Oxide
Hydroxide
0.000 0.000 Fe +3 O ( O
H )
* 00-002-0056 Unmatched
Strong
Potassium
Aluminum
Silicate
Hydroxide
0.000 0.206 K Al2 Si3
Al O10 ( O
H )2
Figure C-15: SE-PGE-1, dendrite A

112
APPENDIX D. STABLE ISOTOPES
Figure D-1: Mexican calcite plotted with a) δ13
C and b) δ18
O.
Figure D-2: Correction curves for data a) δ13
C, b) δ18
O.
Table D-1: Isotope standards
d13C PDB d18O PDB SMOW
Measured Given Measured Given Given
IAEA-CO-9 -43.0316 -47.3 1.7632 -15.4 15.03
IAEA-CO-9 -43.7058 -47.3 1.3714 -15.4 15.03
Solenhofen 2.2857 -1.06 12.7483 -4.14 26.64
Solenhofen 2.4317 -1.06 12.6127 -4.14 26.64
NBS-18 Carbonatite -1.6026 -5.04 -6.1572 -23.05 7.16
NBS-18 Carbonatite -1.4889 -5.04 -6.5451 -23.05 7.16
Table D-2: All Luis Lopez and Santa Eulalia data.
Sample Mineral δ
13C
Measured
δ18
O
Measured
δ13
CHCO3-
Calculated
δ18
OH2O
Calculated
T (°C)
δ13
C
Calculated
δ18
O
Calculated
T (°C)
δ13
C
Calculated
δ18
O
Calculated
Luis Lopez
MCA location: Zone 13S, 0319045N, 3758491E, elevation: 5322 ± 35 ft MCA-1-A Calcite -4.7 23.8 -3.5 21.8 175 -4.8 29.6 375 -4.6 17.2
MCA-1-B Calcite -5.5 23.1 -4.3 21.0 175 -5.7 28.9 375 -5.4 16.4
MCA-1-C Calcite -5.6 24.5 -4.3 22.4 175 -5.7 30.2 375 -5.4 17.8
MCA-1-D Calcite -4.0 24.4 -2.7 22.4 175 -4.1 30.2 375 -3.8 17.8
MCA-1-E Calcite -5.4 24.6 -4.2 22.5 175 -5.5 30.3 375 -5.3 17.9
MCA-2-A Calcite -0.6 13.5 0.7 11.5 175 -0.7 19.3 375 -0.5 6.9
MCA-2-B Calcite 0.7 12.5 1.9 10.5 175 0.6 18.3 375 0.8 5.9
MCA-2-C Calcite 0.2 13.2 1.5 11.1 175 0.1 19.0 375 0.4 6.5
MCA-2-D Calcite 0.6 12.4 1.9 10.4 175 0.5 18.2 375 0.8 5.8
2.503.003.50
0 20 40 60 80 100
δ1
3 C
Line Number
Mexican Calcite
24.00
24.50
0 50 100
δ1
8 O
Line Number
Mexican Calcite
y = 1.0182x - 3.4639R² = 0.9989
-6
-4
-2
0
-5 0 5
Giv
en
d1
3C
Measured d13C
Series1
Linear (Series1)
y = 1.0233x + 13.662R² = 0.9998
0
10
20
30
-20 0 20G
ive
n d
18
O
Measured d18O
Series1
Linear (Series1)

113
MCA-3-A Calcite -2.0 18.1 -0.8 16.1 175 -2.1 23.9 375 -1.9 11.5
MCA-3-B Calcite -2.5 18.3 -1.2 16.3 175 -2.6 24.1 375 -2.3 11.7
MCA-3-C Calcite -2.0 17.3 -0.7 15.3 175 -2.1 23.1 375 -1.8 10.7
MCA-3-D Calcite -4.6 23.5 -3.4 21.4 175 -4.7 29.2 375 -4.5 16.8
MCA-4-A Calcite -0.2 12.7 1.1 10.6 175 -0.3 18.5 375 0.0 6.0
MCA-4-B Calcite -0.4 12.6 0.9 10.6 175 -0.5 18.4 375 -0.2 6.0
MCA-4-C Calcite -0.1 19.2 1.1 17.2 175 -0.2 25.0 375 0.0 12.6
MCA-4-D Calcite -2.2 17.8 -0.9 15.8 175 -2.3 23.6 375 -2.0 11.2
MCA-5 Calcite -0.4 11.6 0.8 9.5 175 -0.6 17.3 375 -0.3 4.9
MCA-6-A Calcite -2.7 19.9 -1.5 17.8 175 -2.9 25.6 375 -2.6 13.2
MCA-6-B Calcite -3.1 19.8 -1.9 17.7 175 -3.2 25.6 375 -3.0 13.1
MCA-6-C Calcite -3.5 19.4 -2.2 17.3 175 -3.6 25.2 375 -3.3 12.7
MCA-6-D Calcite -3.2 19.3 -2.0 17.3 175 -3.4 25.1 375 -3.1 12.7
MCA-6-E Calcite -0.9 17.3 0.3 15.3 175 -1.0 23.1 375 -0.8 10.7
MCA-6-F Calcite -0.7 16.0 0.5 14.0 175 -0.9 21.8 375 -0.6 9.4
MCA-6-G Calcite 0.2 14.3 1.5 12.3 175 0.1 20.1 375 0.3 7.7
MCA-6-H Calcite 0.2 14.1 1.4 12.0 175 0.0 19.9 375 0.3 7.4
MCA-7-A Calcite 0.0 12.6 1.2 10.5 175 -0.2 18.3 375 0.1 5.9
MCA-7-B Calcite 0.0 12.3 1.2 10.2 175 -0.1 18.1 375 0.1 5.6
MCA-7-C Calcite -0.6 13.6 0.7 11.6 175 -0.7 19.4 375 -0.5 7.0
Nogal Canyon location: Zone 13S, 0320428N, 3754041E, elevation: 5013 ± 35 ft NOGAL-1-A Calcite -3.0 21.9
NOGAL-1-B Calcite -1.5 19.0 NOGAL-1-C Calcite -1.0 16.8 NOGAL-1-D Calcite -0.2 18.0 NOGAL-1-E Calcite -0.5 17.1 NOGAL-2-A Calcite 1.2 16.8 NOGAL-2-B Calcite -0.4 17.2 Pretty Girl location: Zone 13S, 0316546N, 3758751E, elevation: 5703 ± 21 ft
PG-1 Calcite -3.4 19.9 PG-2 Calcite -5.3 22.1 BC-1-A Calcite -7.7 20.8 -6.4 18.7 175 -7.8 26.5 300 -7.6 17.8
BC-1-B Calcite -6.5 20.3 -5.3 18.3 175 -6.6 26.1 300 -6.5 17.3
BC-2-A Calcite -2.5 12.8 -1.2 10.8 175 -2.6 18.6 300 -2.4 9.8
BC-2-B Calcite -5.4 17.6 -4.2 15.5 175 -5.6 23.3 300 -5.4 14.6
BC-2-C Calcite -2.8 14.8 -1.5 12.8 175 -2.9 20.6 300 -2.7 11.8
BC-2-D Calcite -2.2 12.5 -0.9 10.4 175 -2.3 18.3 300 -2.1 9.5
BC-2-E Calcite -6.7 21.7 -5.4 19.6 175 -6.8 27.4 300 -6.6 18.7
NANCY-A Calcite 0.0 12.8 1.3 12.3 225 0.0 16.1 300 0.1 11.4
NANCY-B Calcite -0.2 13.2 1.0 12.7 225 -0.3 16.5 300 -0.2 11.8
Water Canyon
003301-A Calcite -0.7 15.6 003301-B Calcite -2.5 17.6 003301-C Calcite -1.0 16.2 003301-D Calcite -1.5 17.0 003301-E Calcite -0.6 15.3 003303-A Calcite -4.3 19.7 003303-B Calcite -1.5 16.8 003304-A Calcite -1.2 17.3 003304-B Calcite -1.3 18.6 003304-C Calcite -1.1 17.1 003304-D Calcite -1.7 18.3 003304-E Calcite -1.2 17.2 003304A-A Calcite -0.6 17.5 003304A-B Calcite -1.8 18.3 003304A-C Calcite -1.3 18.7 003304A-D Calcite -1.2 17.5 003304B-A Calcite -1.7 19.4 003304B-B Calcite -1.5 17.6 003304B-C Calcite -1.1 17.2 003308-A Calcite -0.6 15.8 003308-B Calcite -0.9 16.0 003308-C Calcite -1.1 16.3 Data from Campbell
Luis Lopez
TM1-1 Calcite -5.3 21.9 -4.2 24.2 150 -5.6 34.4 400 -5.3 18.5
TM1-2 Calcite -5.3 22.1 -4.2 24.3 150 -5.6 34.6 400 -5.3 18.7
TM1-3 Calcite -5.0 19.6 -3.8 21.9 150 -5.2 32.1 400 -4.9 16.2
TM2-1 Calcite -6.2 21.8 -5.0 24.1 150 -6.5 34.3 400 -6.1 18.4
TM2-2 Calcite -5.3 21.8 -4.2 24.1 150 -5.6 34.3 400 -5.3 18.4 TM2-2 (Dup) Calcite -5.3 21.6 -4.2 23.8 150 -5.6 34.0 400 -5.3 18.2
TM2-3 Calcite -5.1 21.5 -4.0 23.8 150 -5.4 34.0 400 -5.1 18.2
TM2-4 Calcite -6.3 22.4 -5.1 24.7 150 -6.5 34.9 400 -6.2 19.1
MCA-1 Calcite -2.7 20.7 -1.4 18.7 125 -2.9 31.6 375 -2.6 14.1

114
MCA2-1 Calcite -3.0 22.3 -1.7 20.2 125 -3.2 33.1 375 -2.9 15.6
MCA-4 Calcite -4.3 21.8 -3.1 19.8 125 -4.6 32.7 375 -4.2 15.2 MCA-4 (Dup) Calcite -4.3 21.9 -3.0 19.8 125 -4.5 32.7 375 -4.2 15.2
MCA-6 Calcite 0.6 13.2 1.9 11.2 125 0.4 24.1 375 0.8 6.6
MCA-7 Calcite -2.4 22.0 -1.1 19.9 125 -2.6 32.8 375 -2.3 15.3 MCA-ED WHITECC Calcite -0.2 11.8 1.1 9.7 125 -0.4 22.6 375 -0.1 5.2 MCA-ED BLACKCC Calcite 0.5 12.1 1.8 10.1 125 0.3 22.9 375 0.6 5.5
G-4 Calcite -6.1 20.9 -4.8 20.4 160 -6.3 29.6 360 -6.0 16.5
G-4 (Dup) Calcite -6.1 20.8 -4.8 20.3 160 -6.3 29.5 360 -6.0 16.4
G-1 Calcite -6.8 21.8 -5.5 21.3 160 -7.0 30.5 360 -6.7 17.4
G-2 Calcite -2.2 12.1 -1.0 11.6 160 -2.4 20.8 360 -2.2 7.7
G-3 Calcite -6.1 20.8 -4.9 20.3 160 -6.3 29.5 360 -6.0 16.3
Santa Eulalia
28°37’23.82”N, 105°52’26.55”W, elevation: 1942 m 28°37’29.65”N, 105°52’30.79”W, elevation: 1963 m
SE-PKM-1 Limestone -4.2 16.6 SE-PGD-1 Limestone -2.9 23.3 SE-PGE-1 Limestone -2.2 23.6 SE-BULK-1 Limestone -7.6 19.5
Data from Megaw (1990) unaltered
Finlay LS Limestone -0.8 21.8
Perpendicular to Chorro fissure 18th level Buena Tierra Mine
In ore Calcite -1.6 15.42 At contact Limestone 1.33 14.27
Limestone 1.2 14.1
0.5m from ore Limestone 2.96 18.74
1m from ore Limestone 2.46 17.97 5m from ore Limestone 2.45 17.76 25m from
ore Limestone 2.96 21.86 100m from
ore Limestone 3.04 24.26 230m from
ore (near Peru fissure) Limestone 2.45 17.76
Binigno LS Cp1813 455m Limestone -0.56 15.48
Manganese Altered Finlay LS N West Camp Center of
alteration Limestone -3.92 16.25 Altered and
fresh contact Limestone -2.61 18.16
0.5m from contact Limestone -1.84 21.66
Unaltered in altered area Limestone -1.85 21.32
Fresh 100m from alteration Limestone 0.2 21.06
Perpendicular to skarn mineralization San Antonio Mine In ore Calcite -10.12 12.82
Calcite -10.01 12.72
At skarn contact Limestone 2.3 13.49
0.5m from ore Limestone 2.44 14.48
1m from ore Limestone 2.58 13.55 12m from
ore Limestone 2.71 14.59 50m from
ore Limestone 2.33 18.53
Benigno LS SA 955 198m Limestone -0.28 14.33

115
APPENDIX E. 40
AR/39
AR GEOCHRONOLOGY
E.1 Intrusive Rocks Data
The sensitivity for the intrusive rocks for the multiplier is 5.13e-17
moles/pA,
while the discrimination for the multiplier is 1.006 ± 0.001.
E.1.1 Data Tables
Table E-1: Argon isotopic data for intrusive separates.
ID Power 40Ar/
39Ar
39ArK K/Ca Cl/K 40
Ar* 39
Ar Age ±1s
(Watts) (x 10-15 mol) (%) (%) (Ma) (Ma)
Cp 1813 92, plag (clear), 2.37 mg, J=0.0023647±0.09%, D=1.006±0.001, NM-231F, Lab#=59510-01
Xi A 1 408.9 0.032 0.006 0.24 12.6 2.9 220.68 39.90
B 2 47.67 0.055 0.002 0.008 24.6 7.8 59.06 17.96
C 3 48.44 0.144 0.003 0.015 16.4 20.5 38.56 9.82
D 4 39.68 0.118 0.004 0.008 20.4 31.0 37.95 8.68
E 4 22.11 0.308 0.009 0.005 44.7 58.2 43.43 3.32
F 5 36.16 0.092 0.002 0.012 36.3 66.4 65.84 12.62
G 5 35.13 0.112 0.003 0.010 24.1 76.3 40.40 8.88
H 6 26.44 0.157 0.002 0.011 35.9 90.2 47.71 9.72
I 7 61.38 0.082 0.002 0.027 24.8 97.4 76.82 13.96
Xi J 8 53.78 0.029 0.001 0.016 51.6 100.0 157.51 35.16
Integrated age ± 2s 1.130 0.003 K2O=0.08% 55.89 11.13
Plateau ± 2s steps B-I 1.069 0.004±0.004 94.6 45.03 6.19
Isochron±2s steps B-I40
Ar/36
Ar= 316.3±26.5 38.86 8.36
Cp 1813 92, plag (cloudy), 10.52 mg, J=0.0023657±0.09%, D=1.006±0.001, NM-231F, Lab#=59511-01
Xi A 1 4933.4 0.132 1.1 0.010 0.0 0.1 -8.35 92.87
Xi B 1 1199.6 0.784 1.2 0.009 1.6 0.4 79.19 20.69
C 1 460.5 1.041 0.63 0.008 2.5 1.0 47.81 8.46
D 1 118.4 2.893 0.64 0.003 5.8 2.4 29.26 2.23
E 1 69.66 3.454 0.38 0.001 10.4 4.1 30.54 1.30
F 2 59.17 2.716 0.20 0.001 12.7 5.4 31.81 1.23
G 2 74.60 5.94 0.14 0.002 10.5 8.3 33.35 1.31
H 4 45.59 28.93 0.52 0.001 16.8 22.5 32.40 0.74
I 4 42.33 25.52 0.69 0.001 18.6 35.1 33.23 0.71
J 5 32.55 20.92 0.67 0.001 23.6 45.3 32.47 0.52
K 5 30.72 26.36 0.92 0.001 25.7 58.3 33.41 0.47
L 6 32.26 48.8 1.0 0.001 24.6 82.3 33.54 0.48
M 7 29.74 36.14 0.95 0.002 26.8 100.0 33.66 0.46
Integrated age ± 2s 203.6 0.66 K2O=3.14% 33.32 1.43
Plateau ± 2s steps C-M 202.7 0.80 ±0.58 99.6 33.09 0.53
Isochron±2s steps C-M40
Ar/36
Ar= 294.7±1.8 33.43 0.85
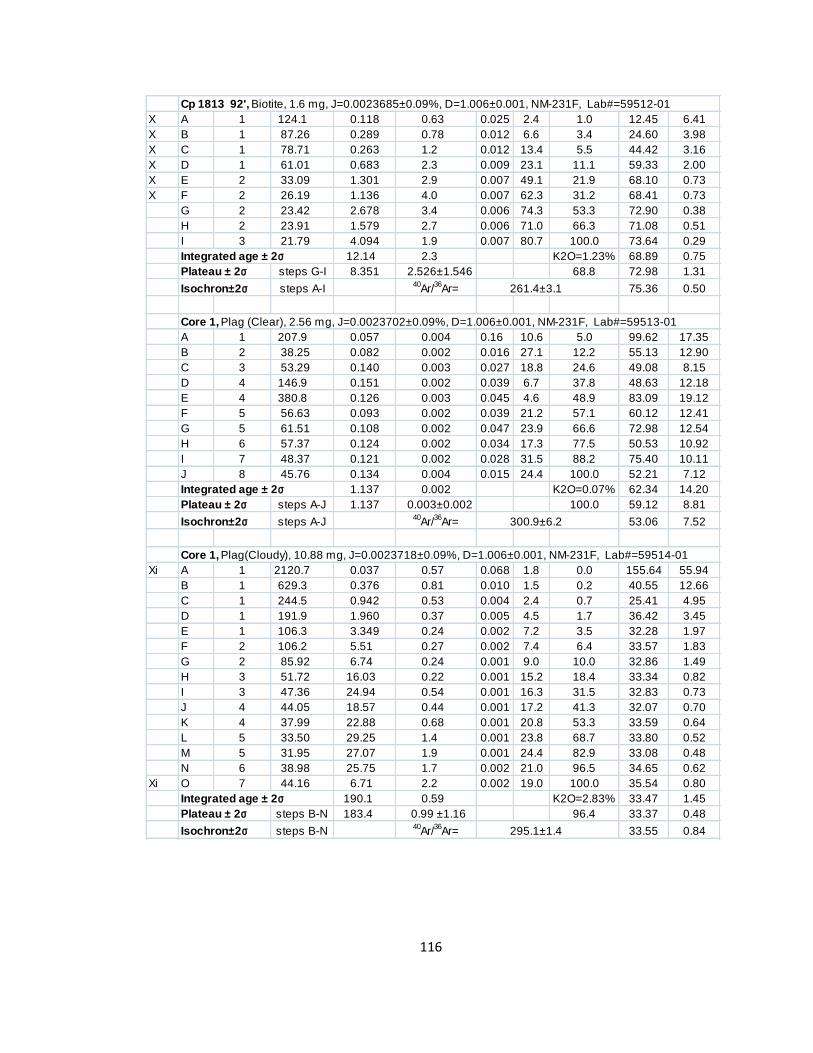
116
Cp 1813 92', Biotite, 1.6 mg, J=0.0023685±0.09%, D=1.006±0.001, NM-231F, Lab#=59512-01
X A 1 124.1 0.118 0.63 0.025 2.4 1.0 12.45 6.41
X B 1 87.26 0.289 0.78 0.012 6.6 3.4 24.60 3.98
X C 1 78.71 0.263 1.2 0.012 13.4 5.5 44.42 3.16
X D 1 61.01 0.683 2.3 0.009 23.1 11.1 59.33 2.00
X E 2 33.09 1.301 2.9 0.007 49.1 21.9 68.10 0.73
X F 2 26.19 1.136 4.0 0.007 62.3 31.2 68.41 0.73
G 2 23.42 2.678 3.4 0.006 74.3 53.3 72.90 0.38
H 2 23.91 1.579 2.7 0.006 71.0 66.3 71.08 0.51
I 3 21.79 4.094 1.9 0.007 80.7 100.0 73.64 0.29
Integrated age ± 2s 12.14 2.3 K2O=1.23% 68.89 0.75
Plateau ± 2s steps G-I 8.351 2.526±1.546 68.8 72.98 1.31
Isochron±2s steps A-I40
Ar/36
Ar= 261.4±3.1 75.36 0.50
Core 1, Plag (Clear), 2.56 mg, J=0.0023702±0.09%, D=1.006±0.001, NM-231F, Lab#=59513-01
A 1 207.9 0.057 0.004 0.16 10.6 5.0 99.62 17.35
B 2 38.25 0.082 0.002 0.016 27.1 12.2 55.13 12.90
C 3 53.29 0.140 0.003 0.027 18.8 24.6 49.08 8.15
D 4 146.9 0.151 0.002 0.039 6.7 37.8 48.63 12.18
E 4 380.8 0.126 0.003 0.045 4.6 48.9 83.09 19.12
F 5 56.63 0.093 0.002 0.039 21.2 57.1 60.12 12.41
G 5 61.51 0.108 0.002 0.047 23.9 66.6 72.98 12.54
H 6 57.37 0.124 0.002 0.034 17.3 77.5 50.53 10.92
I 7 48.37 0.121 0.002 0.028 31.5 88.2 75.40 10.11
J 8 45.76 0.134 0.004 0.015 24.4 100.0 52.21 7.12
Integrated age ± 2s 1.137 0.002 K2O=0.07% 62.34 14.20
Plateau ± 2s steps A-J 1.137 0.003±0.002 100.0 59.12 8.81
Isochron±2s steps A-J40
Ar/36
Ar= 300.9±6.2 53.06 7.52
Core 1, Plag(Cloudy), 10.88 mg, J=0.0023718±0.09%, D=1.006±0.001, NM-231F, Lab#=59514-01
Xi A 1 2120.7 0.037 0.57 0.068 1.8 0.0 155.64 55.94
B 1 629.3 0.376 0.81 0.010 1.5 0.2 40.55 12.66
C 1 244.5 0.942 0.53 0.004 2.4 0.7 25.41 4.95
D 1 191.9 1.960 0.37 0.005 4.5 1.7 36.42 3.45
E 1 106.3 3.349 0.24 0.002 7.2 3.5 32.28 1.97
F 2 106.2 5.51 0.27 0.002 7.4 6.4 33.57 1.83
G 2 85.92 6.74 0.24 0.001 9.0 10.0 32.86 1.49
H 3 51.72 16.03 0.22 0.001 15.2 18.4 33.34 0.82
I 3 47.36 24.94 0.54 0.001 16.3 31.5 32.83 0.73
J 4 44.05 18.57 0.44 0.001 17.2 41.3 32.07 0.70
K 4 37.99 22.88 0.68 0.001 20.8 53.3 33.59 0.64
L 5 33.50 29.25 1.4 0.001 23.8 68.7 33.80 0.52
M 5 31.95 27.07 1.9 0.001 24.4 82.9 33.08 0.48
N 6 38.98 25.75 1.7 0.002 21.0 96.5 34.65 0.62
Xi O 7 44.16 6.71 2.2 0.002 19.0 100.0 35.54 0.80
Integrated age ± 2s 190.1 0.59 K2O=2.83% 33.47 1.45
Plateau ± 2s steps B-N 183.4 0.99 ±1.16 96.4 33.37 0.48
Isochron±2s steps B-N40
Ar/36
Ar= 295.1±1.4 33.55 0.84
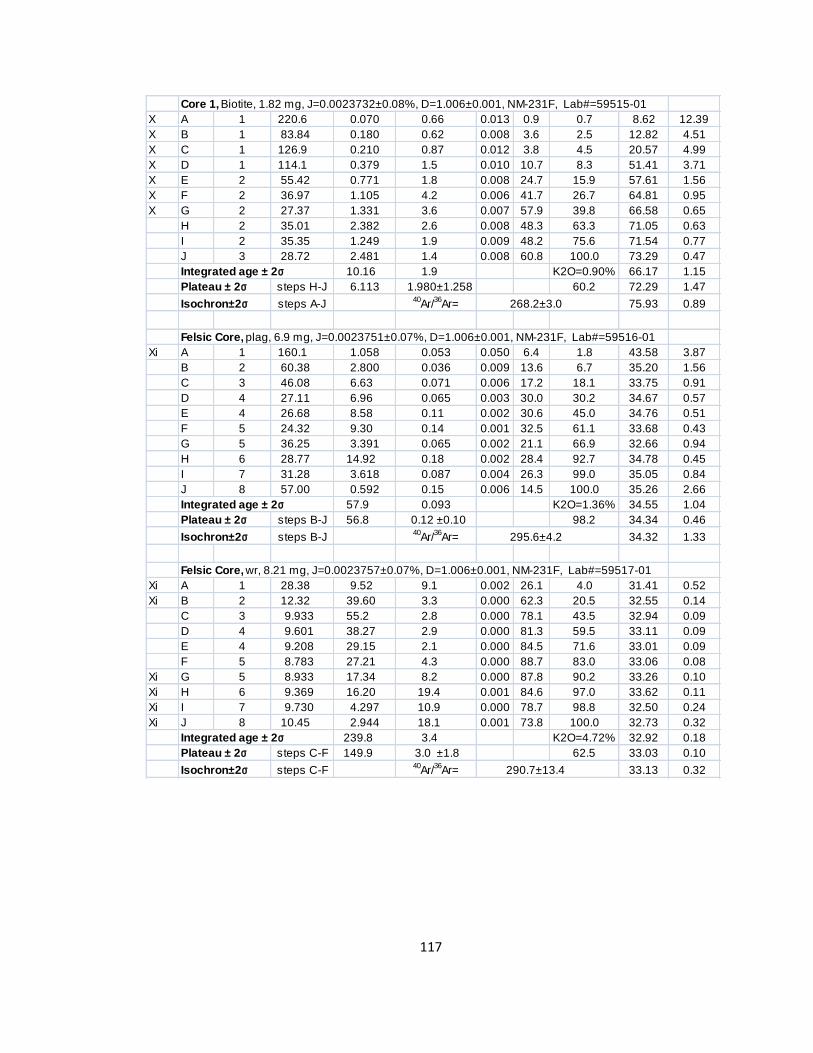
117
Core 1, Biotite, 1.82 mg, J=0.0023732±0.08%, D=1.006±0.001, NM-231F, Lab#=59515-01
X A 1 220.6 0.070 0.66 0.013 0.9 0.7 8.62 12.39
X B 1 83.84 0.180 0.62 0.008 3.6 2.5 12.82 4.51
X C 1 126.9 0.210 0.87 0.012 3.8 4.5 20.57 4.99
X D 1 114.1 0.379 1.5 0.010 10.7 8.3 51.41 3.71
X E 2 55.42 0.771 1.8 0.008 24.7 15.9 57.61 1.56
X F 2 36.97 1.105 4.2 0.006 41.7 26.7 64.81 0.95
X G 2 27.37 1.331 3.6 0.007 57.9 39.8 66.58 0.65
H 2 35.01 2.382 2.6 0.008 48.3 63.3 71.05 0.63
I 2 35.35 1.249 1.9 0.009 48.2 75.6 71.54 0.77
J 3 28.72 2.481 1.4 0.008 60.8 100.0 73.29 0.47
Integrated age ± 2s 10.16 1.9 K2O=0.90% 66.17 1.15
Plateau ± 2s steps H-J 6.113 1.980±1.258 60.2 72.29 1.47
Isochron±2s steps A-J40
Ar/36
Ar= 268.2±3.0 75.93 0.89
Felsic Core, plag, 6.9 mg, J=0.0023751±0.07%, D=1.006±0.001, NM-231F, Lab#=59516-01
Xi A 1 160.1 1.058 0.053 0.050 6.4 1.8 43.58 3.87
B 2 60.38 2.800 0.036 0.009 13.6 6.7 35.20 1.56
C 3 46.08 6.63 0.071 0.006 17.2 18.1 33.75 0.91
D 4 27.11 6.96 0.065 0.003 30.0 30.2 34.67 0.57
E 4 26.68 8.58 0.11 0.002 30.6 45.0 34.76 0.51
F 5 24.32 9.30 0.14 0.001 32.5 61.1 33.68 0.43
G 5 36.25 3.391 0.065 0.002 21.1 66.9 32.66 0.94
H 6 28.77 14.92 0.18 0.002 28.4 92.7 34.78 0.45
I 7 31.28 3.618 0.087 0.004 26.3 99.0 35.05 0.84
J 8 57.00 0.592 0.15 0.006 14.5 100.0 35.26 2.66
Integrated age ± 2s 57.9 0.093 K2O=1.36% 34.55 1.04
Plateau ± 2s steps B-J 56.8 0.12 ±0.10 98.2 34.34 0.46
Isochron±2s steps B-J40
Ar/36
Ar= 295.6±4.2 34.32 1.33
Felsic Core, wr, 8.21 mg, J=0.0023757±0.07%, D=1.006±0.001, NM-231F, Lab#=59517-01
Xi A 1 28.38 9.52 9.1 0.002 26.1 4.0 31.41 0.52
Xi B 2 12.32 39.60 3.3 0.000 62.3 20.5 32.55 0.14
C 3 9.933 55.2 2.8 0.000 78.1 43.5 32.94 0.09
D 4 9.601 38.27 2.9 0.000 81.3 59.5 33.11 0.09
E 4 9.208 29.15 2.1 0.000 84.5 71.6 33.01 0.09
F 5 8.783 27.21 4.3 0.000 88.7 83.0 33.06 0.08
Xi G 5 8.933 17.34 8.2 0.000 87.8 90.2 33.26 0.10
Xi H 6 9.369 16.20 19.4 0.001 84.6 97.0 33.62 0.11
Xi I 7 9.730 4.297 10.9 0.000 78.7 98.8 32.50 0.24
Xi J 8 10.45 2.944 18.1 0.001 73.8 100.0 32.73 0.32
Integrated age ± 2s 239.8 3.4 K2O=4.72% 32.92 0.18
Plateau ± 2s steps C-F 149.9 3.0 ±1.8 62.5 33.03 0.10
Isochron±2s steps C-F40
Ar/36
Ar= 290.7±13.4 33.13 0.32
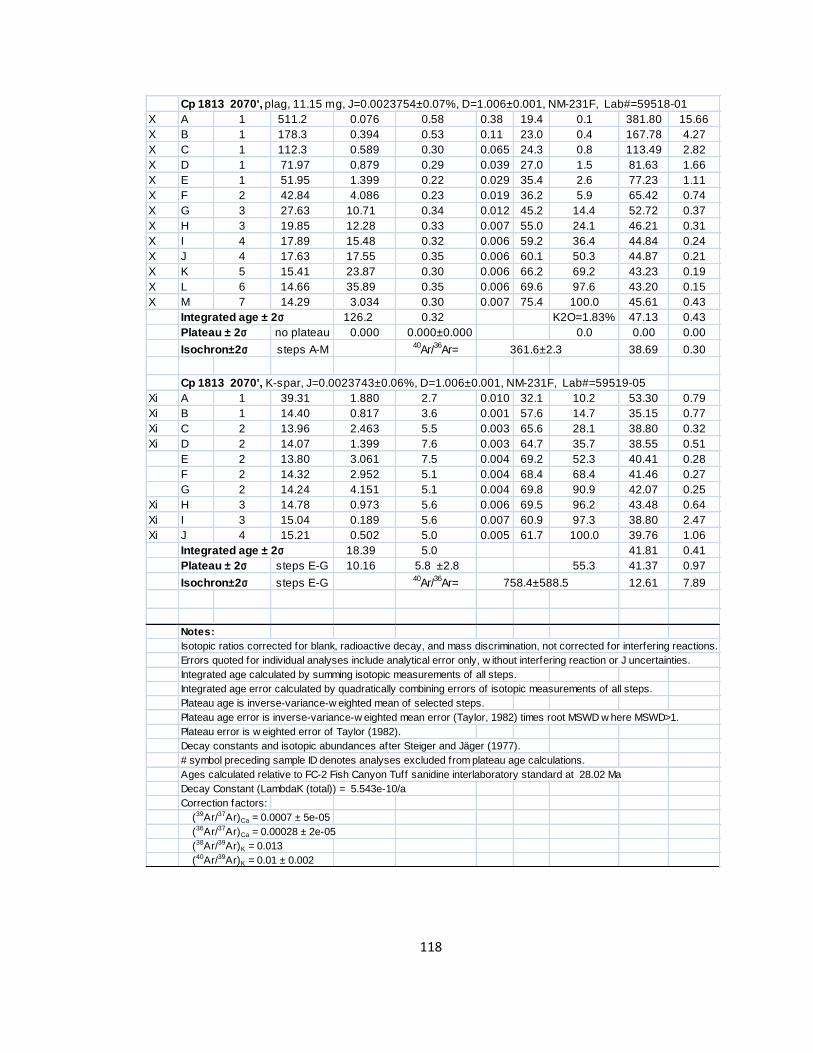
118
Cp 1813 2070', plag, 11.15 mg, J=0.0023754±0.07%, D=1.006±0.001, NM-231F, Lab#=59518-01
X A 1 511.2 0.076 0.58 0.38 19.4 0.1 381.80 15.66
X B 1 178.3 0.394 0.53 0.11 23.0 0.4 167.78 4.27
X C 1 112.3 0.589 0.30 0.065 24.3 0.8 113.49 2.82
X D 1 71.97 0.879 0.29 0.039 27.0 1.5 81.63 1.66
X E 1 51.95 1.399 0.22 0.029 35.4 2.6 77.23 1.11
X F 2 42.84 4.086 0.23 0.019 36.2 5.9 65.42 0.74
X G 3 27.63 10.71 0.34 0.012 45.2 14.4 52.72 0.37
X H 3 19.85 12.28 0.33 0.007 55.0 24.1 46.21 0.31
X I 4 17.89 15.48 0.32 0.006 59.2 36.4 44.84 0.24
X J 4 17.63 17.55 0.35 0.006 60.1 50.3 44.87 0.21
X K 5 15.41 23.87 0.30 0.006 66.2 69.2 43.23 0.19
X L 6 14.66 35.89 0.35 0.006 69.6 97.6 43.20 0.15
X M 7 14.29 3.034 0.30 0.007 75.4 100.0 45.61 0.43
Integrated age ± 2s 126.2 0.32 K2O=1.83% 47.13 0.43
Plateau ± 2s no plateau 0.000 0.000±0.000 0.0 0.00 0.00
Isochron±2s steps A-M40
Ar/36
Ar= 361.6±2.3 38.69 0.30
Cp 1813 2070', K-spar, J=0.0023743±0.06%, D=1.006±0.001, NM-231F, Lab#=59519-05
Xi A 1 39.31 1.880 2.7 0.010 32.1 10.2 53.30 0.79
Xi B 1 14.40 0.817 3.6 0.001 57.6 14.7 35.15 0.77
Xi C 2 13.96 2.463 5.5 0.003 65.6 28.1 38.80 0.32
Xi D 2 14.07 1.399 7.6 0.003 64.7 35.7 38.55 0.51
E 2 13.80 3.061 7.5 0.004 69.2 52.3 40.41 0.28
F 2 14.32 2.952 5.1 0.004 68.4 68.4 41.46 0.27
G 2 14.24 4.151 5.1 0.004 69.8 90.9 42.07 0.25
Xi H 3 14.78 0.973 5.6 0.006 69.5 96.2 43.48 0.64
Xi I 3 15.04 0.189 5.6 0.007 60.9 97.3 38.80 2.47
Xi J 4 15.21 0.502 5.0 0.005 61.7 100.0 39.76 1.06
Integrated age ± 2s 18.39 5.0 41.81 0.41
Plateau ± 2s steps E-G 10.16 5.8 ±2.8 55.3 41.37 0.97
Isochron±2s steps E-G40
Ar/36
Ar= 758.4±588.5 12.61 7.89
Notes:
Isotopic ratios corrected for blank, radioactive decay, and mass discrimination, not corrected for interfering reactions.
Errors quoted for individual analyses include analytical error only, w ithout interfering reaction or J uncertainties.
Integrated age calculated by summing isotopic measurements of all steps.
Integrated age error calculated by quadratically combining errors of isotopic measurements of all steps.
Plateau age is inverse-variance-w eighted mean of selected steps.
Plateau age error is inverse-variance-w eighted mean error (Taylor, 1982) times root MSWD w here MSWD>1.
Plateau error is w eighted error of Taylor (1982).
Decay constants and isotopic abundances after Steiger and Jäger (1977).
# symbol preceding sample ID denotes analyses excluded from plateau age calculations.
Ages calculated relative to FC-2 Fish Canyon Tuff sanidine interlaboratory standard at 28.02 Ma
Decay Constant (LambdaK (total)) = 5.543e-10/a
Correction factors:
(39Ar/37Ar)Ca = 0.0007 ± 5e-05
(36Ar/37Ar)Ca = 0.00028 ± 2e-05
(38Ar/39Ar)K = 0.013
(40Ar/39Ar)K = 0.01 ± 0.002

119
E.1.2 Step-heating Spectra
Figure E-1: Step-heating spectra for Felsic core
Figure E-2: Step-heating spectra for Cp1813 2070’
Felsic Core (59516-01)
0.0001
0.01
0 20 40 60 80 100
28
30
32
34
36
38
40
A
B C
DE
F
G
HI
J
Integrated Age = 34.5 ± 1.0 Ma
34.3 ± 0.5 Ma (MSWD = 1.14)Data at 2-s igma, res ults at 2-sigma
Felsic Core (59517-01)
0
40
80
0.1
10
0 20 40 60 80 100
A
BC D E F G
H
IJ
Integrated Age = 32.92 ± 0.18 Ma
33.06 ± 0.10 Ma (MSWD = 1.64)
Data at 2-s igma, res ults at 2-sigma
Cumulative %39
Ar Released
Cp 1813 2070' (59518-01)
0.001
0.01
0 20 40 60 80 100
30
40
50
60
G
HI J
K L
M
Integrated Age = 47.1 ± 0.4 Ma
Data at 2-s igma, res ults at 2-sigma
Cp 1813 2070' (59519-05)
20
60
0.1
1
10
0 20 40 60 80 100
A
B
CD
EF
GH
I
J
Integrated Age = 41.8 ± 0.4 Ma
Data at 2-s igma, res ults at 2-sigma
Cumulative %39
Ar Released
%40Ar*
Cl/K
K/Ca
Apparent
Age (Ma)
%40Ar*
Cl/K
K/Ca
Apparent
Age (Ma)

120
Figure E-3: Step-heating spectra for Cp1813 92’
Cp 1813 92 (59511-01)
0.0001
0.01
0 20 40 60 80 100
0
20
40
60
80
100
B
C
DEFG H I J K L M
Integrated Age = 33.3 ± 1.4 Ma
33.1 ± 0.5 Ma (MSWD = 1.61)
Data at 2-s igma, results at 2-sigma
Cp 1813 92 (59510-01)
0 20 40 60 80 100
BC D
EF
G
H
I
J
Integrated Age = 56 ± 11 Ma
45 ± 6 Ma (MSWD = 1.46)Data at 2-s igma, results at 2-sigma
Cp 1813 92' (59512-01)
0
40
80
0.001
0.1
10
0 20 40 60 80 100
A
B
C
D
E F
GH
I
Integrated Age = 68.9 ± 0.7 Ma
Data at 2-s igma, results at 2-sigma
Cumulative %39
Ar Released
%40Ar*
Cl/K
K/Ca
Apparent
Age (Ma)
%40Ar*
Cl/K
K/Ca
Apparent
Age (Ma)

121
Figure E-4: Step-heating spectra for Core 1
Core 1 (59514-01)
0.0001
0.01
0 20 40 60 80 100
0
50
100
C
DE F G H I J K L M N O
Integrated Age = 33.5 ± 1.4 Ma
33.4 ± 0.5 Ma (MSWD = 1.12)
Data at 2-s igma, results at 2-sigma
Core 1 (59513-01)
0 20 40 60 80 100
A
BC
D
E
F
G
H
I
J
Integrated Age = 62 ± 14 Ma
59 ± 9 Ma (MSWD = 1.64)Data at 2-s igma, results at 2-sigma
Core 1 (59515-01)
0
40
80
0.001
0.1
10
0 20 40 60 80 100
A
B
C
D
E
FG
H I J
Integrated Age = 66.2 ± 1.2 Ma
Data at 2-s igma, results at 2-sigma
Cumulative %39
Ar Released
%40Ar*
Cl/K
K/Ca
Apparent
Age (Ma)
%40Ar*
Cl/K
K/Ca
Apparent
Age (Ma)

122
E.1.3 Isochrons
Figure E-5: Inverse Isochron for Run 59516-01 (Felsic Core, plagioclase)
Figure E-6: Inverse Isochron for Run 59517-01 (Felsic Core, groundmass)
Figure E-7: Inverse Isochron for Run 59518-01 (Cp 1813 2070’, plagioclase)
Isochron for Run 59516-01 (Felsic Core)
0 0.01 0.02 0.03 0.04 0.05 0.06 0.07 0.08 0.09 0.10 0.11 0.12 0.13
0
0.001
0.002
0.003
A
BC
DEF
G
HI
J
Age = 33.6 ± 1.3 Ma40
Ar/36
Ar Int. = 298 ± 4
MSWD = 1.5, n = 10
39Ar/
40Ar
Isochron for Run 59517-01 (Felsic Core)
0 0.01 0.02 0.03 0.04 0.05 0.06 0.07 0.08 0.09 0.10 0.11 0.12 0.13
0
0.001
0.002
0.003
A
B
CD
EFG
H
IJAge = 33.4 ± 0.6 Ma
40Ar/
36Ar Int. = 280 ± 30
MSWD = 5.6, n = 8
39Ar/
40Ar
Isochron for Run 59518-01 (Cp 1813 2070')
0 0.01 0.02 0.03 0.04 0.05 0.06 0.07 0.08 0.09 0.10 0.11
0
0.0005
0.0010
0.0015
0.0020
0.0025
AB C
D
E F
G
H
I J
KL
M
Age = 38.7 ± 0.6 Ma40
Ar/36
Ar Int. = 360 ± 4
MSWD = 3.2, n = 11
39Ar/
40Ar
36Ar/
40Ar
36Ar/
40Ar
36Ar/
40Ar

123
Figure E-8: Inverse Isochron for Run 59519-05 (Cp 1813 2070’, K-feldspar)
Figure E-9: Inverse Isochron for Run 59511-01 (Cp 1813 92’, cloudy plagioclase)
Figure E-10: Inverse Isochron for Run 59514-01 (Core 1, cloudy plagioclase)
Isochron for Run 59519-05 (Cp 1813 2070')
0 0.01 0.02 0.03 0.04 0.05 0.06 0.07 0.08 0.09 0.10 0.11
0
0.001
0.002
0.003
A
B
CD
EFGH
IJ
Age = 38.3 ± 1.9 Ma40
Ar/36
Ar Int. = 340 ± 20
MSWD = 14, n = 9
39Ar/
40Ar
Isochron for Run 59511-01 (Cp 1813 92)
0 0.01 0.02 0.03 0.04 0.05 0.06 0.07 0.08 0.09 0.10 0.11 0.12 0.13
0
0.001
0.002
0.003
ABCD
EF
G
HI
JKLM
Age = 33.0 ± 0.9 Ma40
Ar/36
Ar Int. = 295.6 ± 1.8
MSWD = 1.9, n = 13
39Ar/
40Ar
Isochron for Run 59514-01 (Core 1)
0 0.01 0.02 0.03 0.04 0.05 0.06 0.07 0.08 0.09 0.10 0.11 0.12 0.13
0
0.001
0.002
0.003
AB CDEF G
HI JK
L MN
O
Age = 33.4 ± 1.1 Ma40
Ar/36
Ar Int. = 295.7 ± 1.8
MSWD = 1.9, n = 15
39Ar/
40Ar
36Ar/
40Ar
36Ar/
40Ar
36Ar/
40Ar

124
Figure E-11: Inverse Isochron for Run 59513-01 (Core 1, clear plagioclase)
Figure E-12: Inverse Isochron for Run 59510-01 (Cp 1813 92’, clear plagioclase)
Figure E-13: Inverse Isochron for Run 59512-01 (Cp 1813 92’, biotite)
Isochron for Run 59513-01 (Core 1)
0 0.01 0.02 0.03 0.04 0.05 0.06 0.07 0.08
0
0.001
0.002
0.003 A
B
C
DE
FG
H
I
J
Age = 49 ± 10 Ma40
Ar/36
Ar Int. = 302 ± 7
MSWD = 1.4, n = 9
39Ar/
40Ar
Isochron for Run 59510-01 (Cp 1813 92)
0 0.01 0.02 0.03 0.04 0.05 0.06 0.07 0.08 0.09 0.10 0.11 0.12
0
0.001
0.002
0.003 A
B
CD
E
F
G
H
I
J
Age = 35 ± 8 Ma40
Ar/36
Ar Int. = 328 ± 19
MSWD = 1.8, n = 9
39Ar/
40Ar
Isochron for Run 59512-01 (Cp 1813 92')
0 0.005 0.010 0.015 0.020 0.025 0.030 0.035 0.040 0.045 0.050 0.055
0
0.001
0.002
0.003
AB
C
D
E
F
GH
I
Age = 75.3 ± 0.7 Ma40
Ar/36
Ar Int. = 267 ± 5
MSWD = 1.4, n = 5
39Ar/
40Ar
36Ar/
40Ar
36Ar/
40Ar
36Ar/
40Ar

125
Figure E-14: Inverse Isochron for Run 59515-01 (Core 1, biotite)
E.2 Manganese Oxides Data
The detector used for the manganese oxide samples was the Multiplier with a
sensitivity of 4.61e-17
moles/pA and discrimination of 1.002 ± 0.001.
E.2.1 Data Tables
Table E-2: Argon isotopic data for manganese oxide separates.
Isochron for Run 59515-01 (Core 1)
0 0.005 0.010 0.015 0.020 0.025 0.030 0.035 0.040 0.045 0.050 0.055
0
0.001
0.002
0.003
ABC
D
E
F
G
HI
J
Age = 77 ± 3 Ma40
Ar/36
Ar Int. = 269 ± 10
MSWD = 8.9, n = 8
39Ar/
40Ar
ID Pow er 40Ar/39Ar 37Ar/39Ar 36Ar/39Ar 39ArK K/Ca Cl/K 40Ar* 39Ar Age ±1σ
(Watts) (x 10-3) (x 10-15 mol) (%) (%) (Ma) (Ma)
SE-PKM-1 vein A , cryptomelane, 4.92 mg, J=0.0016418±0.12%, D=1.002±0.001, NM-236H, Lab#=59771-01
Xi A 2 118.3 0.2470 397.2 1.37 2.1 0.22 0.8 6.2 2.8 1.9
B 3 40.31 0.3047 133.2 1.57 1.7 0.091 2.4 13.3 2.91 0.78
C 4 22.47 0.2223 66.09 3.16 2.3 0.032 13.1 27.6 8.71 0.45
D 5 16.82 0.1989 45.77 5.41 2.6 0.015 19.6 52.1 9.75 0.26
E 6 21.05 0.2061 59.94 3.81 2.5 0.014 15.9 69.3 9.89 0.35
F 7 28.33 0.2071 85.83 4.54 2.5 0.018 10.5 89.9 8.78 0.45
G 8 101.2 0.3826 335.2 0.985 1.3 0.063 2.2 94.3 6.5 2.0
Xi H 9 164.5 0.5440 546.9 0.541 0.94 0.12 1.8 96.8 8.5 3.0
Xi I 10 201.3 0.7224 676.5 0.405 0.71 0.14 0.7 98.6 4.2 3.5
Xi J 11 240.3 0.8858 817.3 0.307 0.58 0.19 -0.5 100.0 -3.3 5.4
Integrated age ± 2s n=10 MSWD=10.57 22.1 2.0 K2O=1.05% 8.1 1.0
Plateau ± 2s steps B-G n=6 MSWD=15.42 19.5 2.3 ±1.0 88.1 9.1 1.3
Isochron±2s steps B-G n=6 MSWD=10.50 40Ar/36Ar= 284.7±3.6 11.17 0.73
36Ar/
40Ar

126
SE-PKM-1 vein A hard, cryptomelane, 5.18 mg, J=0.0016479±0.13%, D=1.002±0.001, NM-236H, Lab#=59772-02
Xi A 2 262.6 0.2440 895.3 0.340 2.1 0.33 -0.7 1.9 -5.8 4.9
Xi B 3 92.03 0.2694 309.8 0.613 1.9 0.16 0.6 5.3 1.5 1.8
C 4 58.59 0.3318 192.1 0.584 1.5 0.12 3.2 8.5 5.5 1.8
D 5 40.18 0.2937 126.2 0.859 1.7 0.070 7.2 13.2 8.6 1.1
E 6 29.43 0.2470 89.28 1.46 2.1 0.040 10.4 21.3 9.08 0.82
F 7 19.42 0.2039 54.72 4.79 2.5 0.018 16.8 47.7 9.65 0.33
G 8 27.26 0.2387 81.07 3.35 2.1 0.021 12.2 66.2 9.85 0.50
H 9 37.08 0.2776 114.5 2.56 1.8 0.025 8.8 80.3 9.68 0.54
I 10 50.59 0.3349 159.8 1.97 1.5 0.031 6.7 91.2 10.04 0.86
J 11 62.14 0.4140 199.5 1.60 1.2 0.040 5.2 100.0 9.5 1.1
Integrated age ± 2s n=10 MSWD=3.98 18.1 1.9 K2O=0.82% 8.93 0.99
Plateau ± 2s steps C-J n=8 MSWD=1.03 17.2 2.0 ±0.8 94.7 9.57 0.44
Isochron±2s steps C-J n=8 MSWD=1.09 40Ar/36Ar= 294.1±3.6 9.9 1.0
SE-PKM-1 cluster D, cryptomelane, 5.09 mg, J=0.0016496±0.14%, D=1.002±0.001, NM-236H, Lab#=59773-01
Xi A 2 35.86 0.2908 119.3 2.12 1.8 0.10 1.8 4.9 1.91 0.72
Xi B 3 13.89 0.2595 40.54 1.99 2.0 0.063 13.9 9.5 5.72 0.41
Xi C 4 7.131 0.2413 14.37 2.72 2.1 0.027 40.7 15.8 8.60 0.23
D 5 5.188 0.2179 6.008 8.94 2.3 0.006 66.1 36.5 10.155 0.090
E 6 5.113 0.2073 5.448 11.6 2.5 0.003 68.8 63.2 10.419 0.073
F 7 6.605 0.2372 10.61 12.6 2.2 0.003 52.8 92.3 10.329 0.088
G 8 21.75 0.3602 62.52 2.09 1.4 0.008 15.1 97.1 9.78 0.48
H 9 49.70 0.6670 155.4 0.662 0.76 0.020 7.7 98.7 11.4 1.2
Xi I 10 80.23 1.154 253.0 0.342 0.44 0.036 6.9 99.5 16.5 2.1
Xi J 11 104.0 1.691 334.4 0.229 0.30 0.055 5.1 100.0 15.7 3.7
Integrated age ± 2s n=10 MSWD=36.49 43.2 2.0 K2O=1.98% 9.65 0.22
Plateau ± 2s steps D-H n=5 MSWD=1.82 35.8 2.2 ±1.4 82.9 10.31 0.13
Isochron±2s steps D-H n=5 MSWD=2.40 40Ar/36Ar= 295.3±3.9 10.32 0.13
SE-PKM-1 cluster E, cryptomelane, 5.36 mg, J=0.0016448±0.07%, D=1.002±0.001, NM-236H, Lab#=59774-01
Xi A 2 80.16 0.6869 271.1 1.04 0.74 0.43 0.1 1.9 0.4 1.4
Xi B 3 37.98 0.6078 125.1 1.83 0.84 0.30 2.8 5.3 3.20 0.74
Xi C 4 19.17 0.6285 57.31 2.51 0.81 0.21 12.0 9.9 6.79 0.44
Xi D 5 9.187 0.5958 21.50 3.82 0.86 0.11 31.4 16.9 8.54 0.20
Xi E 6 6.141 0.4716 9.804 6.73 1.1 0.048 53.4 29.3 9.70 0.10
F 7 5.394 0.4047 6.539 17.1 1.3 0.028 64.8 60.8 10.322 0.057
G 8 5.808 0.4128 7.904 10.4 1.2 0.026 60.3 79.9 10.353 0.082
H 9 7.342 0.4209 12.89 6.17 1.2 0.023 48.6 91.3 10.54 0.14
I 10 10.81 0.4427 24.39 3.20 1.2 0.023 33.6 97.2 10.75 0.24
Xi J 11 19.58 0.4966 52.82 1.54 1.0 0.028 20.4 100.0 11.84 0.50
Integrated age ± 2s n=10 MSWD=35.15 54.3 1.1 K2O=2.37% 9.62 0.20
Plateau ± 2s steps F-I n=4 MSWD=1.54 36.9 1.2 ±0.1 67.8 10.37 0.11
Isochron±2s steps F-I n=4 MSWD=0.06 40Ar/36Ar= 304.5±8.7 10.15 0.22
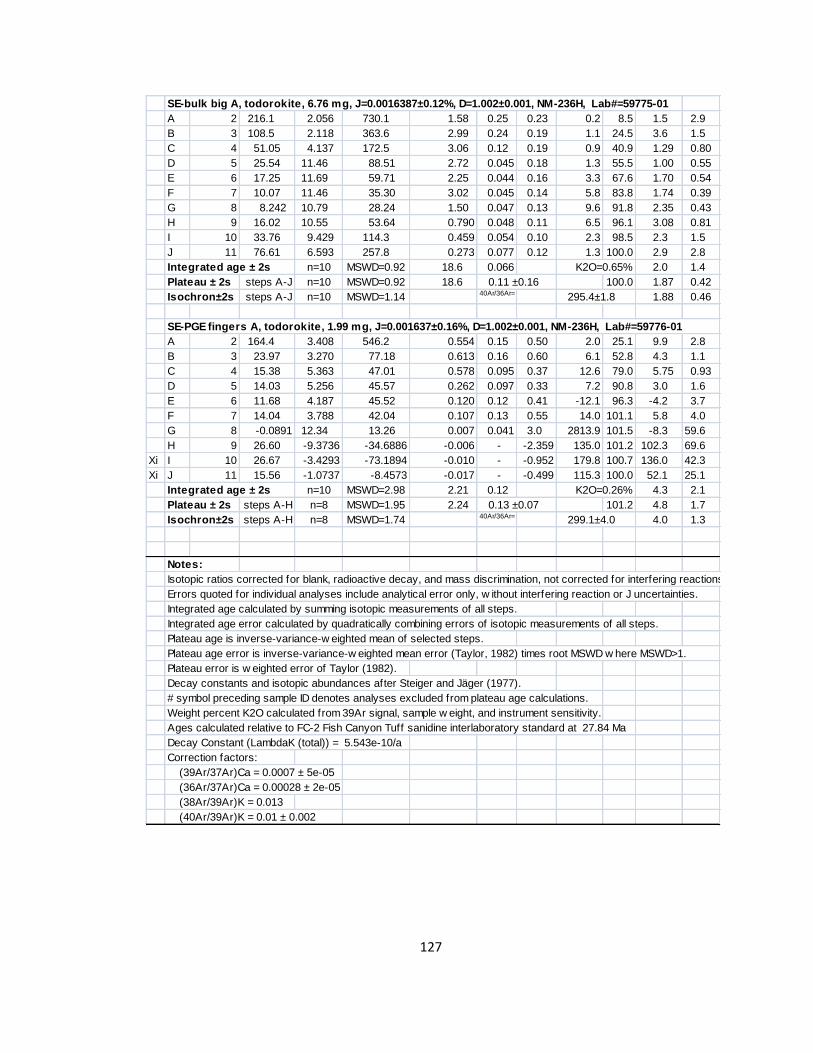
127
SE-bulk big A, todorokite, 6.76 mg, J=0.0016387±0.12%, D=1.002±0.001, NM-236H, Lab#=59775-01
A 2 216.1 2.056 730.1 1.58 0.25 0.23 0.2 8.5 1.5 2.9
B 3 108.5 2.118 363.6 2.99 0.24 0.19 1.1 24.5 3.6 1.5
C 4 51.05 4.137 172.5 3.06 0.12 0.19 0.9 40.9 1.29 0.80
D 5 25.54 11.46 88.51 2.72 0.045 0.18 1.3 55.5 1.00 0.55
E 6 17.25 11.69 59.71 2.25 0.044 0.16 3.3 67.6 1.70 0.54
F 7 10.07 11.46 35.30 3.02 0.045 0.14 5.8 83.8 1.74 0.39
G 8 8.242 10.79 28.24 1.50 0.047 0.13 9.6 91.8 2.35 0.43
H 9 16.02 10.55 53.64 0.790 0.048 0.11 6.5 96.1 3.08 0.81
I 10 33.76 9.429 114.3 0.459 0.054 0.10 2.3 98.5 2.3 1.5
J 11 76.61 6.593 257.8 0.273 0.077 0.12 1.3 100.0 2.9 2.8
Integrated age ± 2s n=10 MSWD=0.92 18.6 0.066 K2O=0.65% 2.0 1.4
Plateau ± 2s steps A-J n=10 MSWD=0.92 18.6 0.11 ±0.16 100.0 1.87 0.42
Isochron±2s steps A-J n=10 MSWD=1.14 40Ar/36Ar= 295.4±1.8 1.88 0.46
SE-PGE fingers A, todorokite, 1.99 mg, J=0.001637±0.16%, D=1.002±0.001, NM-236H, Lab#=59776-01
A 2 164.4 3.408 546.2 0.554 0.15 0.50 2.0 25.1 9.9 2.8
B 3 23.97 3.270 77.18 0.613 0.16 0.60 6.1 52.8 4.3 1.1
C 4 15.38 5.363 47.01 0.578 0.095 0.37 12.6 79.0 5.75 0.93
D 5 14.03 5.256 45.57 0.262 0.097 0.33 7.2 90.8 3.0 1.6
E 6 11.68 4.187 45.52 0.120 0.12 0.41 -12.1 96.3 -4.2 3.7
F 7 14.04 3.788 42.04 0.107 0.13 0.55 14.0 101.1 5.8 4.0
G 8 -0.0891 12.34 13.26 0.007 0.041 3.0 2813.9 101.5 -8.3 59.6
H 9 26.60 -9.3736 -34.6886 -0.006 - -2.359 135.0 101.2 102.3 69.6
Xi I 10 26.67 -3.4293 -73.1894 -0.010 - -0.952 179.8 100.7 136.0 42.3
Xi J 11 15.56 -1.0737 -8.4573 -0.017 - -0.499 115.3 100.0 52.1 25.1
Integrated age ± 2s n=10 MSWD=2.98 2.21 0.12 K2O=0.26% 4.3 2.1
Plateau ± 2s steps A-H n=8 MSWD=1.95 2.24 0.13 ±0.07 101.2 4.8 1.7
Isochron±2s steps A-H n=8 MSWD=1.74 40Ar/36Ar= 299.1±4.0 4.0 1.3
Notes:
Isotopic ratios corrected for blank, radioactive decay, and mass discrimination, not corrected for interfering reactions.
Errors quoted for individual analyses include analytical error only, w ithout interfering reaction or J uncertainties.
Integrated age calculated by summing isotopic measurements of all steps.
Integrated age error calculated by quadratically combining errors of isotopic measurements of all steps.
Plateau age is inverse-variance-w eighted mean of selected steps.
Plateau age error is inverse-variance-w eighted mean error (Taylor, 1982) times root MSWD w here MSWD>1.
Plateau error is w eighted error of Taylor (1982).
Decay constants and isotopic abundances after Steiger and Jäger (1977).
# symbol preceding sample ID denotes analyses excluded from plateau age calculations.
Weight percent K2O calculated from 39Ar signal, sample w eight, and instrument sensitivity.
Ages calculated relative to FC-2 Fish Canyon Tuff sanidine interlaboratory standard at 27.84 Ma
Decay Constant (LambdaK (total)) = 5.543e-10/a
Correction factors:
(39Ar/37Ar)Ca = 0.0007 ± 5e-05
(36Ar/37Ar)Ca = 0.00028 ± 2e-05
(38Ar/39Ar)K = 0.013
(40Ar/39Ar)K = 0.01 ± 0.002

128
E.2.2 Step-heating Spectra
Figure E-15: Step-heating spectra for SE-PKM
SE-PKM-1 vein A (59771-01)
0.001
0.1
0
5
10
15
20
Integrated Age = 8.1 ± 1.0 Ma
9.4 ± 0.5 Ma (MSWD = 2.08)
Data at 2-s igma, res ults at 2-sigma
SE-PKM-1 vein A hard (59772-02)
0
60
1
3
Integrated Age = 8.9 ± 1.0 Ma
9.6 ± 0.4 Ma (MSWD = 1.03)
Data at 2-s igma, res ults at 2-sigma
SE-PKM-1 cluster D (59773-01)
0.001
0.1
0 20 40 60 80 100
0
5
10
15
20
Integrated Age = 9.7 ± 0.2 Ma
10.31 ± 0.13 Ma (MSWD = 1.82)
Data at 2-s igma, res ults at 2-sigma
SE-PKM-1 cluster E (59774-01)
0
60
1
3
0 20 40 60 80 100
Integrated Age = 9.6 ± 0.2 Ma
10.37 ± 0.11 Ma (MSWD = 1.54)
Data at 2-s igma, res ults at 2-sigma
Cumulative %39
Ar Released
%40Ar*
Cl/K
K/Ca
Apparent
Age (Ma)
%40Ar*
Cl/K
K/Ca
Apparent
Age (Ma)

129
Figure E-16: Step-heating spectra from SE-bulk and SE-PGE
E.2.3 Isochrons
Figure E-17: Inverse isochron for SE-PKM-1 vein A
SE-bulk big A (59775-01)
0.2
0.6
1.0
0 20 40 60 80 100
-5
0
5
10
15
20
A
BC D
E FG H
I
JIntegrated Age = 2.0 ± 1.4 Ma
1.9 ± 0.4 Ma (MSWD = 0.92)
Data at 2-s igma, results at 2-sigma
SE-PGE fingers A (59776-01)
0
20
40
0.01
0.1
0 20 40 60 80 100
A
B
C
D
E
FIntegrated Age = 6 ± 2 Ma
5.1 ± 1.7 Ma (MSWD = 1.82)Data at 2-s igma, results at 2-sigma
Cumulative %39
Ar Released
59771-01 (SE-PKM-1 vein A )
0 0.02 0.04 0.06 0.08 0.10 0.12 0.14 0.16 0.18 0.20 0.22 0.24 0.26 0.28 0.30
0
0.0005
0.0010
0.0015
0.0020
0.0025
0.0030
0.0035A
B
C
D
E
F
GHIJ
Age = 10.2 ± 1.3 Ma40Ar/
36Ar Int. = 290 ± 5
MSWD = 7.3, n = 10
39Ar/
40Ar
36Ar/
40Ar
%40Ar*
Cl/K
K/Ca
Apparent
Age (Ma)

130
Figure E-18: Inverse isochron for SE-PKM-1 vein A (hard)
Figure E-19: Inverse isochron for SE-PKM-1 dendrite D
59772-02 (SE-PKM-1 vein A hard)
0 0.02 0.04 0.06 0.08 0.10 0.12 0.14 0.16 0.18 0.20 0.22 0.24 0.26 0.28
0
0.0005
0.0010
0.0015
0.0020
0.0025
0.0030
0.0035A B
C
DE
F
G
HI
J
Age = 10.8 ± 1.2 Ma40Ar/
36Ar Int. = 290 ± 4
MSWD = 2.2, n = 10
39Ar/
40Ar
59773-01 (SE-PKM-1 cluster D)
0 0.02 0.04 0.06 0.08 0.10 0.12 0.14 0.16 0.18 0.20 0.22 0.24 0.26 0.28 0.30
0
0.0005
0.0010
0.0015
0.0020
0.0025
0.0030
0.0035
A
B
C
DE
F
G
HIJ
Age = 10.4 ± 0.3 Ma40Ar/
36Ar Int. = 293 ± 9
MSWD = 2.7, n = 4
39Ar/
40Ar
36Ar/
40Ar
36Ar/
40Ar
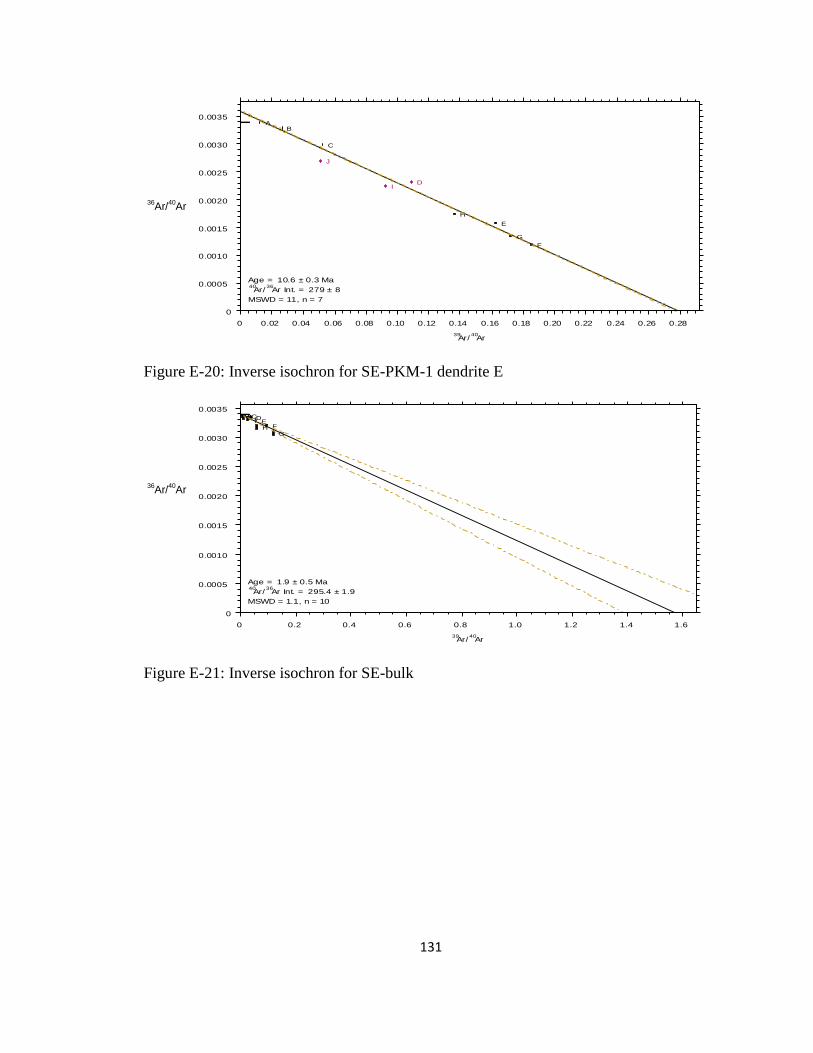
131
Figure E-20: Inverse isochron for SE-PKM-1 dendrite E
Figure E-21: Inverse isochron for SE-bulk
59774-01 (SE-PKM-1 cluster E)
0 0.02 0.04 0.06 0.08 0.10 0.12 0.14 0.16 0.18 0.20 0.22 0.24 0.26 0.28
0
0.0005
0.0010
0.0015
0.0020
0.0025
0.0030
0.0035A
B
C
D
E
F
G
H
I
J
Age = 10.6 ± 0.3 Ma40Ar/
36Ar Int. = 279 ± 8
MSWD = 11, n = 7
39Ar/
40Ar
59775-01 (SE-bulk big A)
0 0.2 0.4 0.6 0.8 1.0 1.2 1.4 1.6
0
0.0005
0.0010
0.0015
0.0020
0.0025
0.0030
0.0035ABCD
EF
GH
IJ
Age = 1.9 ± 0.5 Ma40Ar/
36Ar Int. = 295.4 ± 1.9
MSWD = 1.1, n = 10
39Ar/
40Ar
36Ar/
40Ar
36Ar/
40Ar
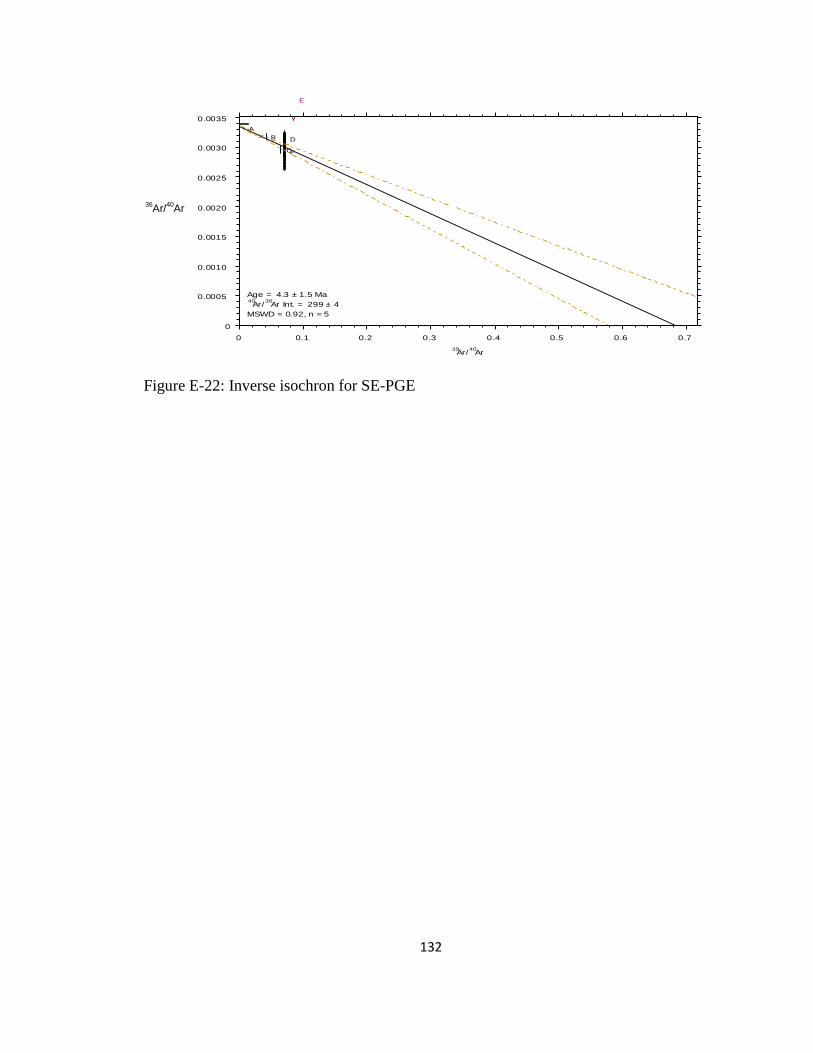
132
Figure E-22: Inverse isochron for SE-PGE
59776-01 (SE-PGE fingers A)
0 0.1 0.2 0.3 0.4 0.5 0.6 0.7
0
0.0005
0.0010
0.0015
0.0020
0.0025
0.0030
0.0035
A
B
C
D
E
F
Age = 4.3 ± 1.5 Ma40Ar/
36Ar Int. = 299 ± 4
MSWD = 0.92, n = 5
39Ar/
40Ar
36Ar/
40Ar

133
REFERENCES
Aguirre, E. F. d. J., 1987, Determinacion del sonamiento en las chimeneas de la Mina
Buenna Tierra, a partir de los cocientes metalicos: Unpub. Professional thesis,
Mexico, University of Guanajuato, 40 p.
Back, M. E., and Mandarino, J. A., 2008, Fleischer's Glossary of Mineral Species 2008:
Tuscon, The Mineralogical Record Inc.
Benham, W. M., 1928a, LaCia. Minera 'LaVentura' S.A., Santa Eulalia, Chihuahua,
Mexico, unpublished private report to American Smelting and Refining Co.
Benham, W. M., 1928b, Santo Domingo mine of the ASARCO, Santa Eulalia District,
Chihuahua, Mexico, unpublished private report to American Smelting and
Refining Co., p. 23.
Benham, W. M., 1929, The Parcionera Group, unpublished private report to American
Smelting and Refining Co., p. 32.
Bish, D. L., and Post, J. E., 1989, Thermal behavior of complex, tunnel-structure
manganese oxides: Am. Mineral, v. 74, p. 177-186.
Bond, B. R., 1986, Mineralogical and Geochemical Zoning, San Antonio Mine, Santa
Eulalia Mining District, Chihuahua, Mexico: in Clark, K.F., Megaw, P.K.M., and
Ruiz, J., eds., Lead-Zinc-Silver Carbonate -Hosted Deposits of northern Mexico:
Society of Economic Geology Guidebook, Nov. 13-17, 1986, p. 233-254.
Bond, B. R., 1987, Selective trace element geochemistry, San Antonio Mine, Santa
Eulalia, Chihuahua, Mexico: Unpub. M.S. thesis, University of Arizona, 193 p.
Burnham, C. W., 1959, Metallogenic Provinces of the southwestern United States and
northern Mexico: New Mexico Bureau of Mines and Mineral Resources, Bulletin,
v. 65, p. 75.
Burns, R. G., and Burns, V. M., 1979, Manganese oxides, in Ribbe, P. H., ed., Marine
Mineral: Washington, DC, Mineral. Soc. Am., p. 1-46.
Campa, M. F., 1985, The Mexican Thrust Belt, in Howell, D. G., ed.,
Tectonostratigraphic Terranes of the Circum Pacific Region: Houston, Circum
Pacific Council for Energy and Mineral Resources, p. 299-313.
Chafetz, H. S., Folk, R. L., and Milliken, K. L., 2004, Carbonate and Mn- and Fe-rich
hot spring deposits, Belen (New Mexico, USA), Yellowstone National Park
(Wyoming, USA), and northeastern Morocco: 32nd International Geological
Congress: Italy, v. 32, part 2, p. 1472.
Chapin, C. E., and Lindley, J. I., 1986, Potassium metasomatism of igneous and
sedimentary rocks in detachment terranes and other sedimentary basins:
Economic implications: Arizona Geological Society Digest, v. 16, p. 118-126.

134
Chukhrov, F. V., Shanin, L. L., and Yermilova, L. P., 1966, Feasibility of absolute-age
determination for potassium-carrying manganese minerals: Int. Geol. Rev., v. 8,
p. 278-280.
Clark, K. F., Damon, P. E., Schutter, S. R., and Shafiqullah, M., 1979, Magmatismo en
el Norte de Mexico en Relacion a los Yacimientos Metaliferos: Assoc. Ing. de
Minas, Met. y Geol. de Mexico., Mem. Tec. XIII, p. 8-57.
Claypool, G. E., Holser, W. T., Kaplan, I. R., Sakai, A., and Zak, I., 1980, The Age
Curves of S and O Isotopes in Marine Sulfate and their Mutual Interpretation:
Chemical Geology, v. 28, p. 199-260.
Clemons, R. E., 1996, Cross section A through D. In: Kelly, R. W. (Ed.), New Mexico
Geological Highway Map: New Mexico Geol. Soc., Socorro, New Mexico.
Clendenin, T. P., 1933, Report on geologic study of West Camp, Santa Eulalia District,
unpublished private report to American Smelting and Refining Co., p. 72.
Crerar, D. A., Cormick, R. K., and Barnes, H. L., 1980, Geochemistry of manganese: an
overview, in Varentsov, I. M., and Grassely, G., eds: Geology and geochemistry
of manganese, v. 1: E. Schweizerbarst'sche Verlag, Stuttgart, p. 293-329.
Dahlgren, C. B., 1883, Historic mines of Mexico: private publication New York, p. 220.
Eggleston, T. L., Norman, D. I., Chapin, C. E., and Savin, S., 1983, Geology, alteration,
and genesis of the Luis Lopez manganese district, New Mexico: in Chapin, C. E.,
and Callender, J. F. (eds.), Socorro region II: New Mexico Geological Society,
Guidebook 34, p. 241-246.
Haynes, F. M., and Kesler, S. E., 1988, Compositions and sources of mineralizing fluids
for chimney and manto limestone-replacement ores in Mexico: Economic
Geology, v. 83, p. 1985-1992.
Heizler, M. T., Lux, D. R., and Decker, E. R., 1988, The age and cooling history of the
Chain of Ponds and Big Island Pond plutons and the Spider Lake Granite, West-
Central Maine and Quebec: American Journal of Science, v. 288, p. 925-952.
Hewett, D. F., and Radtke, A. S., 1967, Silver-bearing black calcite in western mining
districts: Economic Geology, v. 62, p. 1-21.
Hewitt, W. P., 1968, Geology and Mineralization of the Main Mineral Zone of the Santa
Eulalia District, Chihuahua, Mexico: Society of Mining Engineers, Transactions.
Huneke, J. C., and Smith, S. P., 1976, The realities of recoil: 39Ar recoil out of small
grains and anomalous age patterns in 40Ar/39Ar dating: Geochim. Cosmochim.
Acta, v. 7, p. 1987-2008 (Suppl.).
Kimball, J. P., 1870, The silver mines of Santa Eulalia District, Chihuahua, Mexico:
American Journal of Science, 2nd Series, v. 49, p. 161-175.
King, W. E., and Kelley, R. E., 1980, Geology and paleontology of Tortugas Mountain,
Dona Ana County, New Mexico: New Mexico Geology, v. 2, p. 33-35.
Lippolt, H. J., and Hautmann, S., 1995, 40Ar/39Ar ages of Precambrian manganese ore
minerals from Sweden, India and Morocco: Miner. Deposita, v. 30, p. 246-256.
Lueth, V. W., Chamberlin, R. M., and Peters, L., 2004, Age of mineralization in the Luis
Lopez manganese district, Socorro County, New Mexico, as determined by
40Ar/39Ar dating of cryptomelane: New Mexico Bureau of Mines and Mineral
Resources, Bulletin, p. 239-249.

135
Lueth, V. W., Lucas, S. G., Giles, K. A., Kues, B. S., and Witcher, J., 2002, Third-day
road log, from Alamogordo to White Sands, San Agustin Pass, Organ Quarry, and
Tortugas Mountain: New Mexico Geological Society 2002 Field
Conf.Guidebook.
Lueth, V. W., Megaw, P. K. M., Pingitore, N. E., and Goodell, P. C., 2000, Systematic
Variation in Galena Solid-Solution Compositions at Santa Eulalia, Chihuahua,
Mexico: Economic Geology, v. 95, p. 1673-1687.
Lueth, V. W., Rye, R. O., and Peters, L., 2005, "Sour gas" hydrothermal jarosite: ancient
to modern acid-sulfate mineralization in the southern Rio Grande Rift: Chemical
Geology, v. 215, p. 339-360.
Mailloux, B., Person, M., Kelley, S., Dunbar, N., Cather, S., Strayer, L., and Hudleston,
P., 1999, Tectonic controls on the hydrogeology of the Rio Grande Rift, New
Mexico: Water Resour. Res., v. 35, p. 2641-2659.
Malakhov, A. A., 1968, Bismuth and antimony in galenas as indicators of some
conditions of ore formation: Geochemistry International, v. 7, p. 1055-1068.
Mauger, R. L., 1981, Geology and petrology of the central part of the Calera-del Nido
Block, Chihuahua, Mexico: in Uranium in Volcanic and Volcaniclastic Rocks,
Goodell, P. C. and Waters, A. C., editors, AAPG Studies in Geology No. 13, p.
205-242.
Mauger, R. L., 1983a, A geologic study of the Providencia-el Nido Area, Northeast flank
of Sierra del Nido, Central Chihuahua, Mexico: El Paso Geological Society 1983
Field Conf., p. 187-193.
Mauger, R. L., 1983b, The geology and volcanic stratigraphy of the Sierra Sacramento
block near Chihuahua City, Chihuahua, Mexico: El Paso Geological Society 1983
Field Conf. Guidebook, p. 137-156.
McLemore, V. T., Giordano, T. H., Lueth, V. W., and Witcher, J. C., 1998, Origin of
barite-fluorite-galena deposits in the southern Rio Grande Rift, New Mexico:
New Mexico Geological Society 1998 Field Conf.Guidebook, p. 251-263.
Megaw, P. K. M., 1986a, Argentiferous manganese-oxide alteration in wall and capping
rocks of the Santa Eulalia District, Chihuahua, Mexico: Geologic Society of
America, Abstract w/ Programs.
Megaw, P. K. M., 1986b, Geology and Geologic History of the Santa Eulalia Mining
District, Chihuahua, Mexico: in Clark, K.F., Megaw, P.K.M., and Ruiz, J., eds.,
Lead-Zinc-Silver Carbonate -Hosted Deposits of northern Mexico: Society of
Economic Geology Guidebook, Nov. 13-17, 1986, p. 213-232.
Megaw, P. K. M., 1986c, Mineralogy of the Santa Eulalia Mining District, Chihuahua,
Mexico: Rochester Acad. Sci. 13th Mineral. Symposium, April 10-13, p. 21-31.
Megaw, P. K. M., 1987, Oxygen and carbon isotopic shifts between altered and unaltered
limestone in the peripheries of the Santa Eulalia Mining District, Chihuahua,
Mexico: Geologic Society of America, Abstract w/ Programs, v. 19, p. 769.
Megaw, P. K. M., 1990, Geology and Geochemistry of the Santa Eulalia Mining District,
Chihuahua, Mexico: Unpub. PhD thesis, The University of Arizona, 461 p.
Megaw, P. K. M., and McDowell, F. W., 1983, Geology and geochronology of volcanic
rocks of the Sierra Pastorias Caldera Area, Chihuahua, Mexico: El Paso Geol.
Soc. Guidebook for the Fall Field Conf. Oct. 7-9, p. 195-204.

136
Mexicana, Sociedad Geologica, 1985, Plano Geologica Minero, Chihuahua, Mexico,
Sociedad Geologica Mexicana A. C., Delegacion Chihuahua.
Miranda, M. A. G., and Megaw, P. K. M., 1986, Magmatic-Hydrothermal Breccias and
Certain Silver-Lead-Zinc Chimnies of the Potosi Mine, Santa Eulalia District,
Chihuahua, Mexico: in Clark, K.F., Megaw, P.K.M., and Ruiz, J., eds., Lead-
Zinc-Silver Carbonate -Hosted Deposits of northern Mexico: Society of
Economic Geology Guidebook, Nov. 13-17, 1986, p. 255-278.
Miura, H., 1986, The crystal structure of hollandite: Mineral. J., v. 13, p. 119-129.
Norman, D. I., Bazrafshan, K., and Eggleston, T. L., 1983, Mineralization of the Luis
Lopez epithermal manganese deposits in light of fluid inclusion and geologic
studies: in Chapin, C. E., and Callender, J. F. (eds.), Socorro region II: New
Mexico Geological Society, Guidebook 34, p. 247-251.
Ohmoto, H., 1972, Systematics of sulfur and carbon isotopes in hydrothermal ore
deposits: Economic Geology, v. 67, p. 551-579.
Ohmoto, H., and Rye, R. O., 1979, Isotopes of sulfur and carbon: in Barnes, H. L., eds.:
Geochemistry of Hydrothermal Ore Deposits, p. 509-567.
Pingitore Jr., N. E., Stege, B. M., Goodell, P. C., and Lemone, D. V., 1983, Limestone
stratigraphy, Central Sierra Pena Blanca, Chihuahua, Mexico: El Paso Geological
Society 1983 Field Conf., p. 239-246.
Post, J. E., and Bish, D. L., 1988, Rietveld refinement of the todorokite structure: Am.
Mineral, v. 73.
Post, J. E., Veblen, D. R., 1990, Crystal structure and determinations of synthetic sodium,
magnesium, and potassium birnessite using TEM and the Rietveld method: Am.
Mineral, v. 75.
Pracejus, B., 1989, Nature and Formation of Supergene Manganese Deposits on Groote
Eylandt, N. T., Australia., University of Adelaide, 231 p.
Prescott, B., 1910, Report on the fissure systems of Mina Vieja: unpub. private rept. to
ASARCO Mexicana, Oct. 15, 1910, 16p.
Prescott, B., 1916, The Main Mineral Zone fo the Santa Eulalia District: American
Institute of Mining Engineers Transactions, v. 51, p. 57-99.
Radtke, A. S., Taylor, C. M., and Hewett, D. F., 1967, Aurorite, argentian todorokite,
and hydrous silver-bearing lead manganese oxide: Economic Geology, v. 62, p.
186-206.
Renne, P. R., Swisher, C. C., Deino, A. L., Karner, D. B., Owens, T. L., and Depaolo, D.
J., 1998, Intercalibration of standards: absolute ages and uncertainties in 40
Ar/39
Ar
dating: Chemical Geology, v. 145, p. 117-152.
Rice, C. T., 1908, The ore deposits of Santa Eulalia, Mexico: Eng. Mining Jour., v. 85, p.
1229-1233.
Ruffet, G., Innocent, C., Michard, A., Feraud, G., and Beauvais, A., 1996, A
geochronological 40Ar/39Ar and 87Rb/86Sr study of K-Mn oxides from the
weathering sequence of Azul, Brazil: Geochim. Cosmochim. Acta, v. 60, p. 2219-
2232.
Seager, W. R., Hawley, J. W., and Clemons, R. E., 1971, Geology of San Diego
Mountain Area Dona Ana County, New Mexico: New Mexico Bureau of Mines
and Mineral Resources, Bulletin, v. 97.

137
Segev, A., Halicz, L., Lang, B., and Steinitz, G., 1991, K-Ar dating of mangenese
minerals from the Eisenbach region, Black Forest, southwest Germany: Schweiz.
Mineral. Petrogr. Mitt., v. 71, p. 101-114.
Spurr, J. E., 1911, Geology of the Main Mineral Belt of Santa Eulalia District,
Chihuahua, Mexico, unpublished report to American Smelting and Refining Co.,
p. 46.
Tsuji, M., Komarneni, S., and Abe, M., 1993, Ion exchange selectivity for alakali metal
ions on a cryptomelane-type hydrous manganese dioxide: Solvent Extr. Ion.
Exch., v. 11, p. 143-158.
Varentsov, I. M., and Golovin, D. I., 1987, Manganese beds of Groote Eylandt, nothern
Australia: K/Ar dating of cryptomelane minerals and genetic aspects: Dokl. Akad.
Nauk USSR, v. 294, p. 203-207.
Vasconcelos, P. M., 1992, Timing and rates of evolution of hydrochemical systems in
semi-arid and humid environments by application of 40K-40Ar and laser-heating
40Ar/39Ar dating of K-bearing weathering product minerals, University of
California, 242 p.
Vasconcelos, P. M., 1999, K-Ar and 40Ar/39Ar geochronology of weathering processes:
Annu. Rev. Earth Planet Sci., v. 27, p. 183-229.
Vasconcelos, P. M., Becker, T. A., Renne, P. R., and Brimhall, G. H., 1992, Age and
duration of weathering 40K-40Ar and 40Ar/39Ar analysis of K-Mn Oxides:
Science, v. 258, p. 451-455.
Vasconcelos, P. M., Becker, T. A., Renne, P. R., and Brimhall, G. H., 1994a, Direct
dating of weathering phenomena by K-Ar and 40Ar/39Ar analysis of supergene
K-Mn oxides: Geochim. Cosmochim. Acta, v. 58, p. 1635-1665.
Vasconcelos, P. M., Renne, P. R., Becker, T. A., and Wenk, H. R., 1995, Mechanisms
and kinetics of atmospheric, radiogenic, and nucleogenic argon release from
cryptomelane during 40Ar/39Ar analysis: Geochim. Cosmochim. Acta, v. 59, p.
2057-2070.
Vasconcelos, P. M., Wenk, H. R., and Echer, C., 1994b, In situ study of the thermal
behavior of cryptomelane by high voltage and analytical elctron microscopy: Am.
Mineral, v. 79, p. 80-90.
Veizer, J., and Hoefs, J., 1976, The Nature of 18O/16O and 13C/12C Secular Trends in
Sedimentary Carbonate Rocks: Geochimica et Cosmochimica Acta, v. 40, p.
1387-1395.
Walker, R. T., and Walker, W. J., 1956, The Origin and Nature of Ore Deposits: Walker
Association, p. 130-131.
Walter, T. G., 1985, Metals distribution at the San Antonio mine, Santa Eulalia mining
district, Chihuahua, Mexico: Unpublished M.S. thesis, Tuscon, AZ, University of
Arizona, 102 p.
Witcher, J. C., 1998, The Ricon SLH1 Geothermal Well: New Mexico Geological
Society 1998 Field Conf.Guidebook, p. 35-40.
Yahvili, L. P., and Gukasyan, R. K., 1974, Use of cryptomelane for potassium-argon
dating of manganese ore of the Sevkar-Sarigyukh Deposit, Armenia: Trans. Acad.
Sci. USSR Dokl. Earth Sci. Sect., v. 212, p. 49-51.


![Materials Chemistry and Physics€¦ · decomposition of organic sulfur compounds [35–38]. In this paper, two shapes of birnessite potassium manganese oxides, nanotube and nanorod,](https://static.fdocuments.in/doc/165x107/605bf3faf59e354a8806b95c/materials-chemistry-and-physics-decomposition-of-organic-sulfur-compounds-35a38.jpg)


![RESEARCH IN THE SPOTLIGHT · estuary’s sediments are particularly rich in iron and manganese oxides,” points out Prof. Mucci, “[…] and we have available to us 30 years of](https://static.fdocuments.in/doc/165x107/5ffd5b70744d68182878a483/research-in-the-estuaryas-sediments-are-particularly-rich-in-iron-and-manganese.jpg)