
Geochemistry Geophysics G April XX, 2001 Geosystems
26
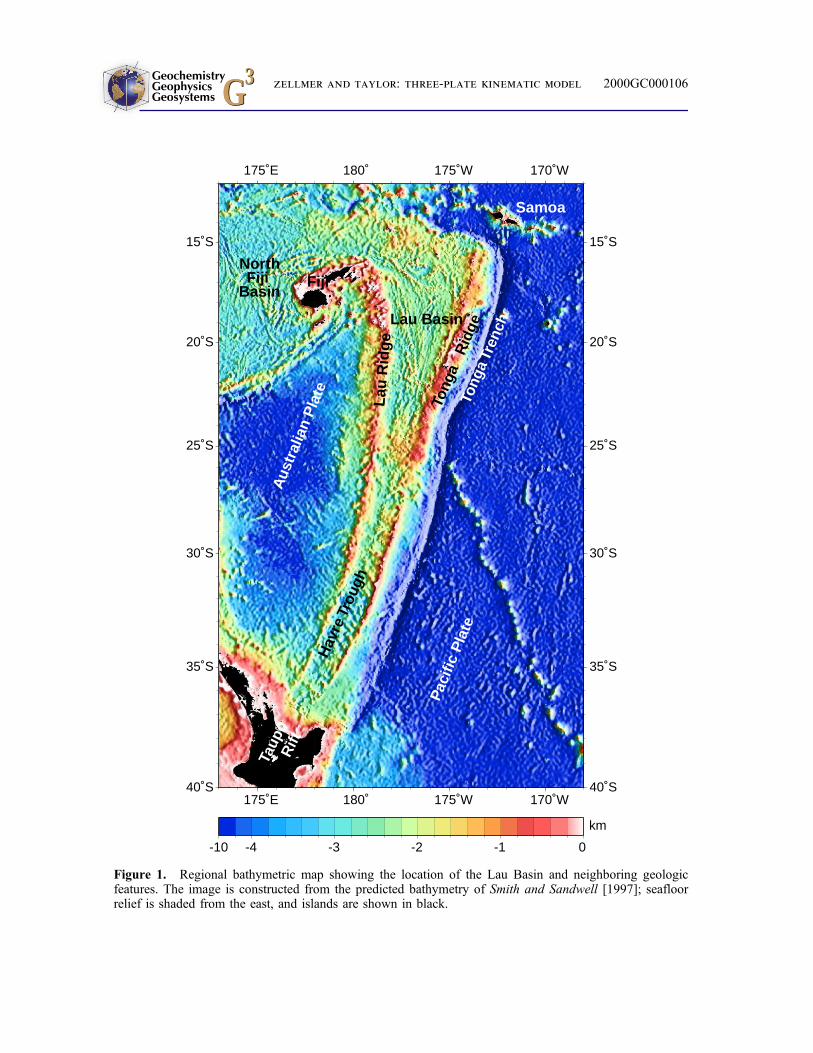
A three-plate kinematic model for Lau Basin opening Kirsten E. Zellmer and Brian Taylor Department of Geology and Geophysics, School of Ocean Earth Science and Technology, University of Hawaii, Honolulu, Hawaii 96822 ([email protected]; [email protected]) [1] Abstract: We present revised compilations of bathymetry, magnetization, acoustic imagery, and seismicity data for the Lau Basin and surrounds. We interpret these data to more precisely locate the plate boundaries in the region and to derive a three-plate kinematic model for the opening of the Lau Basin during the Brunhes Chron. Our tectonic model includes the Niuafo’ou microplate, which is separated from the Australian Plate along the Peggy Ridge-Lau Extensional Transform Zone-Central Lau Spreading Center and from the Tongan Plate along the newly discovered Fonualei Rift and Spreading Center. Our model shows that Australia-Tonga plate motion between 15.58S and 198S is partitioned across the microplate, and it resolves the former apparent conflict between geodetic versus seafloor spreading velocities. Regionally, this implies that the angular rate of opening of the Lau Basin has been faster than that of the Havre Trough to the south and that the rapid current rates of Pacific subduction at the Tonga Trench (240 mm/yr at 168S) have been sustained for at least 0.78 m.y. Keywords: Lau Basin; plate kinematics; microplate; seafloor spreading; geodetic vectors. Index terms: Marine geology and geophysics; plate tectonics; plate motions – recent; Pacific Ocean. Received September 1, 2000; Revised January 25, 2001; Accepted March 1, 2001; Published April XX, 2001. Zellmer, K. E., and B. Taylor, 2001. A three-plate kinematic model for Lau Basin opening, Geochem. Geophys. Geosyst., vol. 2, Paper number 2000GC000106 [8651 words, 13 figures, 7 tables]. Published April XX, 2001. 1. Introduction [2] The Tonga-Fiji region has been key to the understanding of Earth dynamics since the formulation of the plate tectonics paradigm [e.g., Isacks et al., 1968]. The 11-km-deep Tonga Trench is the locus of fastest subduction [Bevis et al., 1995], and the subducted Pacific lithosphere generates a majority of all deep earthquakes [Isacks et al., 1968]. The Lau Basin (Figure 1) was the first back arc basin to be recognized as a young ocean basin formed by splitting a volcanic island arc [Karig, 1970]. Although subsequent models of back arc basin evolution were often two- dimensional and thus assumed only two plates above the subducting lithosphere (see review by Taylor and Karner [1983]; also see Parson and Wright [1996]), Chase [1971] recognized the existence of multiple plates and triple junctions in the opening of the North Fiji Basin. After two decades of controversy G 3 G 3 Geochemistry Geophysics Geosystems Published by AGU and the Geochemical Society AN ELECTRONIC JOURNAL OF THE EARTH SCIENCES Geochemistry Geophysics Geosystems Article Volume 2 April XX, 2001 Paper number 2000GC000106 ISSN: 1525-2027 Copyright 2001 by the American Geophysical Union
Transcript of Geochemistry Geophysics G April XX, 2001 Geosystems
A three-plate kinematic model for Lau Basin
opening
Kirsten E. Zellmer and Brian TaylorDepartment of Geology and Geophysics, School of Ocean Earth Science and Technology, University of Hawaii,
Honolulu, Hawaii 96822 ([email protected]; [email protected])
[1] Abstract: We present revised compilations of bathymetry, magnetization, acoustic imagery, and
seismicity data for the Lau Basin and surrounds. We interpret these data to more precisely locate the
plate boundaries in the region and to derive a three-plate kinematic model for the opening of the Lau
Basin during the Brunhes Chron. Our tectonic model includes the Niuafo'ou microplate, which is
separated from the Australian Plate along the Peggy Ridge-Lau Extensional Transform Zone-Central
Lau Spreading Center and from the Tongan Plate along the newly discovered Fonualei Rift and
Spreading Center. Our model shows that Australia-Tonga plate motion between 15.58S and 198Sis partitioned across the microplate, and it resolves the former apparent conflict between geodetic
versus seafloor spreading velocities. Regionally, this implies that the angular rate of opening of
the Lau Basin has been faster than that of the Havre Trough to the south and that the rapid
current rates of Pacific subduction at the Tonga Trench (�240 mm/yr at 168S) have been
sustained for at least 0.78 m.y.
Keywords: Lau Basin; plate kinematics; microplate; seafloor spreading; geodetic vectors.
Index terms: Marine geology and geophysics; plate tectonics; plate motions±recent; Pacific Ocean.
Received September 1, 2000; Revised January 25, 2001; Accepted March 1, 2001; Published April XX, 2001.
Zellmer, K. E., and B. Taylor, 2001. A three-plate kinematic model for Lau Basin opening, Geochem. Geophys.
Geosyst., vol. 2, Paper number 2000GC000106 [8651 words, 13 figures, 7 tables]. Published April XX, 2001.
1. Introduction
[2] The Tonga-Fiji region has been key to the
understanding of Earth dynamics since the
formulation of the plate tectonics paradigm
[e.g., Isacks et al., 1968]. The 11-km-deep
Tonga Trench is the locus of fastest subduction
[Bevis et al., 1995], and the subducted Pacific
lithosphere generates a majority of all deep
earthquakes [Isacks et al., 1968]. The Lau
Basin (Figure 1) was the first back arc basin
to be recognized as a young ocean basin
formed by splitting a volcanic island arc
[Karig, 1970]. Although subsequent models
of back arc basin evolution were often two-
dimensional and thus assumed only two plates
above the subducting lithosphere (see review
by Taylor and Karner [1983]; also see Parson
and Wright [1996]), Chase [1971] recognized
the existence of multiple plates and triple
junctions in the opening of the North Fiji
Basin. After two decades of controversy
G3G3GeochemistryGeophysics
Geosystems
Published by AGU and the Geochemical Society
AN ELECTRONIC JOURNAL OF THE EARTH SCIENCES
GeochemistryGeophysics
Geosystems
Article
Volume 2
April XX, 2001
Paper number 2000GC000106
ISSN: 1525-2027
Copyright 2001 by the American Geophysical Union
Lau BasinH
avre
Tro
ugh
Tong
a R
idge
Lau
Rid
ge
Fiji North Fiji
Basin
Paci
fic P
late
Aus
tral
ian
Pla
te
Taup
oR
ift
Tong
a Tr
ench
Samoa
-10 -4 -3 -2 -1 0
km
175˚E
175˚E
180˚
180˚
175˚W
175˚W
170˚W
170˚W
40˚S 40˚S
35˚S 35˚S
30˚S 30˚S
25˚S 25˚S
20˚S 20˚S
15˚S 15˚S
Figure 1. Regional bathymetric map showing the location of the Lau Basin and neighboring geologicfeatures. The image is constructed from the predicted bathymetry of Smith and Sandwell [1997]; seafloorrelief is shaded from the east, and islands are shown in black.
GeochemistryGeophysicsGeosystems G3G3 zellmer and taylor: three-plate kinematic model 2000GC000106
[Lawver et al., 1976; Lawver and Hawkins,
1978; Weissel, 1977, 1981; Hamburger and
Isacks, 1988; Parson and Hawkins, 1994],
Taylor et al. [1996] used a magnetization
inversion of bathymetry and magnetic data to
definitively show that the opening of the Lau
Basin was by seafloor spreading processes
fundamentally similar to those occurring at
mid-ocean ridges. Nevertheless, the tectonics
of the Lau Basin region north of 188S remained
poorly understood, and Brunhes Chron spread-
ing rates were reported to be only 75% of the
opening rates measured geodetically [Bevis et
al., 1995]. Revised geodetic results [Bevis,
1997] partially closed the gap between the
two data sets, but a quantitative kinematic
model of Lau Basin opening has not been
attempted previously.
[3] We use a set of recompiled bathymetry,
magnetization, acoustic imagery, and seismicity
data to define a multiple plate kinematic model
that (1) explains a majority of the tectonic
features throughout the Lau Basin, (2) is con-
sistent with both spreading rates determined
from the marine magnetic data and the revised
geodetic velocities, and (3) satisfies rigid plate
criteria. We address the recent tectonics (0.78
Ma to present) and implications of a three-plate
system for Lau Basin opening.
2. Data Compilation
[4] We include new results from three system-
atic surveys to update the Lau Basin data
compilation and magnetization inversion of
Taylor et al. [1996]. R/V Moana Wave cruise
MW9603 surveyed the basin from edge to edge
between 178S and 188350S. A R/V Hakerei
Maru 2 cruise (hereafter referred to as
MMAJ9507) surveyed the spreading axis and
nearby ridge flanks between 198250S and 228S.
R/V Melville cruise BMRG08MV principally
surveyed the forearc region [Wright et al.,
2000]. Swath bathymetry and acoustic imagery
were collected using a Hydrosweep system on
MMAJ9507, the HAWAII MR1 (HMR1) side
scan system on MW9603, and a SeaBeam 2000
system on BMRG08MV. Surveys were navi-
gated using the Global Positioning System
(GPS). Detailed descriptions of these three
surveys and their results will be published
elsewhere (for BMRG08MV, see Wright et al.
[2000]).
2.1. Bathymetry
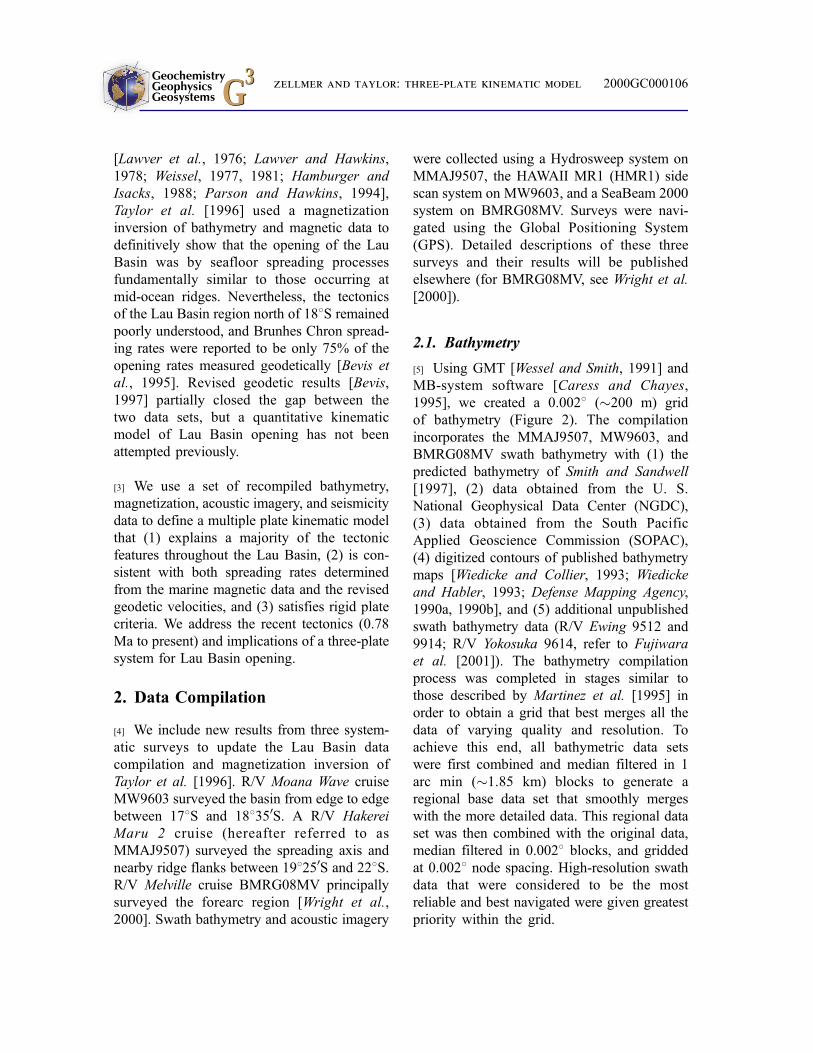
[5] Using GMT [Wessel and Smith, 1991] and
MB-system software [Caress and Chayes,
1995], we created a 0.0028 (�200 m) grid
of bathymetry (Figure 2). The compilation
incorporates the MMAJ9507, MW9603, and
BMRG08MV swath bathymetry with (1) the
predicted bathymetry of Smith and Sandwell
[1997], (2) data obtained from the U. S.
National Geophysical Data Center (NGDC),
(3) data obtained from the South Pacific
Applied Geoscience Commission (SOPAC),
(4) digitized contours of published bathymetry
maps [Wiedicke and Collier, 1993; Wiedicke
and Habler, 1993; Defense Mapping Agency,
1990a, 1990b], and (5) additional unpublished
swath bathymetry data (R/V Ewing 9512 and
9914; R/V Yokosuka 9614, refer to Fujiwara
et al. [2001]). The bathymetry compilation
process was completed in stages similar to
those described by Martinez et al. [1995] in
order to obtain a grid that best merges all the
data of varying quality and resolution. To
achieve this end, all bathymetric data sets
were first combined and median filtered in 1
arc min (�1.85 km) blocks to generate a
regional base data set that smoothly merges
with the more detailed data. This regional data
set was then combined with the original data,
median filtered in 0.0028 blocks, and gridded
at 0.0028 node spacing. High-resolution swath
data that were considered to be the most
reliable and best navigated were given greatest
priority within the grid.
GeochemistryGeophysicsGeosystems G3G3 zellmer and taylor: three-plate kinematic model 2000GC000106
2.2. Magnetic Data and Magnetization
Pattern
[6] Magnetic data from the MMAJ9507,
MW9603, and BMRG08MV cruises were
incorporated with other data available from
the NGDC (Figure 3). Using compilation pro-
cesses described by Martinez et al. [1995], we
created a new 0.5 arc min (�900 m) grid of
magnetic anomaly data. A corresponding 0.5
arc min grid of sampled bathymetry was used
in conjunction with the magnetic anomaly grid
to produce an updated grid of the magnet-
ization distribution (Figure 4) using the inver-
sion method of Parker and Heustis [1974] as
modified by Macdonald et al. [1980]. Despite
applying average crossover corrections to the
magnetics data, some track artifacts remain
-10 -4 -3 -2 -1 0
km
180˚
180˚
179˚W
179˚W
178˚W
178˚W
177˚W
177˚W
176˚W
176˚W
175˚W
175˚W
174˚W
174˚W
173˚W
173˚W
172˚W
172˚W
23˚S 23˚S
22˚S 22˚S
21˚S 21˚S
20˚S 20˚S
19˚S 19˚S
18˚S 18˚S
17˚S 17˚S
16˚S 16˚S
15˚S 15˚S
14˚S 14˚S
Figure 2. Bathymetry of the Lau Basin region, with seafloor fabric shaded from the east and islands filledin black. Systematic survey data from the MMAJ9507 and MW9603 cruises define the central part of thebasin from 178S to 228S.
GeochemistryGeophysicsGeosystems G3G3 zellmer and taylor: three-plate kinematic model 2000GC000106
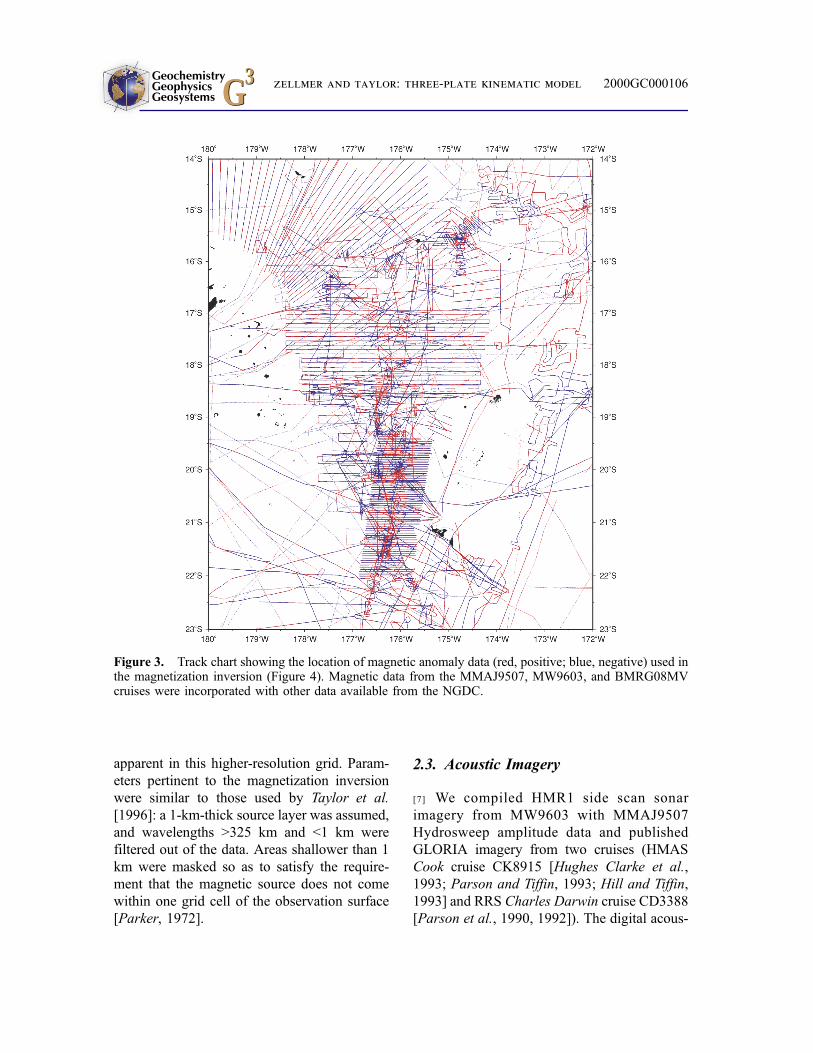
apparent in this higher-resolution grid. Param-
eters pertinent to the magnetization inversion
were similar to those used by Taylor et al.
[1996]: a 1-km-thick source layer was assumed,
and wavelengths >325 km and <1 km were
filtered out of the data. Areas shallower than 1
km were masked so as to satisfy the require-
ment that the magnetic source does not come
within one grid cell of the observation surface
[Parker, 1972].
2.3. Acoustic Imagery
[7] We compiled HMR1 side scan sonar
imagery from MW9603 with MMAJ9507
Hydrosweep amplitude data and published
GLORIA imagery from two cruises (HMAS
Cook cruise CK8915 [Hughes Clarke et al.,
1993; Parson and Tiffin, 1993; Hill and Tiffin,
1993] and RRS Charles Darwin cruise CD3388
[Parson et al., 1990, 1992]). The digital acous-
Figure 3. Track chart showing the location of magnetic anomaly data (red, positive; blue, negative) used inthe magnetization inversion (Figure 4). Magnetic data from the MMAJ9507, MW9603, and BMRG08MVcruises were incorporated with other data available from the NGDC.
GeochemistryGeophysicsGeosystems G3G3 zellmer and taylor: three-plate kinematic model 2000GC000106

tic imagery varies in quality as a function of the
sonar frequency, resolution, and dynamic range
of the three systems. In Figure 5 we used non-
linear histogram normalization to make their
acoustic reflectivity ranges appear similar.
2.4. Seismicity
[8] Three main earthquake seismicity data sets
are plotted in Figure 5: (1) centroid moment
tensor (CMT) focal mechanisms [Pelletier et
al., 1998], (2) a set of shallow earthquakes (<50
km) from the International Seismological Cen-
ter (ISC), and (3) microearthquake locations
ascertained from an Ocean Bottom Seismom-
eter (OBS) array deployed for 3 weeks in 1984
[Eguchi, 1987]. The microearthquake locations
are limited to the vicinity of the OBS array,
which was deployed between 178S, 1778W and
18.58S, 1768W.
-20 -10 -5 0 5 10 20
A/m
180˚
180˚
179˚W
179˚W
178˚W
178˚W
177˚W
177˚W
176˚W
176˚W
175˚W
175˚W
174˚W
174˚W
173˚W
173˚W
172˚W
172˚W
23˚S 23˚S
22˚S 22˚S
21˚S 21˚S
20˚S 20˚S
19˚S 19˚S
18˚S 18˚S
17˚S 17˚S
16˚S 16˚S
15˚S 15˚S
14˚S 14˚S
Figure 4. Seafloor magnetization of the Lau Basin region. The magnetization inversion assumes a 1-km-thick source layer underlying and conformable with the seafloor and is an updated version of that discussedby Taylor et al. [1996]. Areas where the seafloor is shallower than 1 km are masked.
GeochemistryGeophysicsGeosystems G3G3 zellmer and taylor: three-plate kinematic model 2000GC000106
3. Observations at Proposed Plate
Boundaries
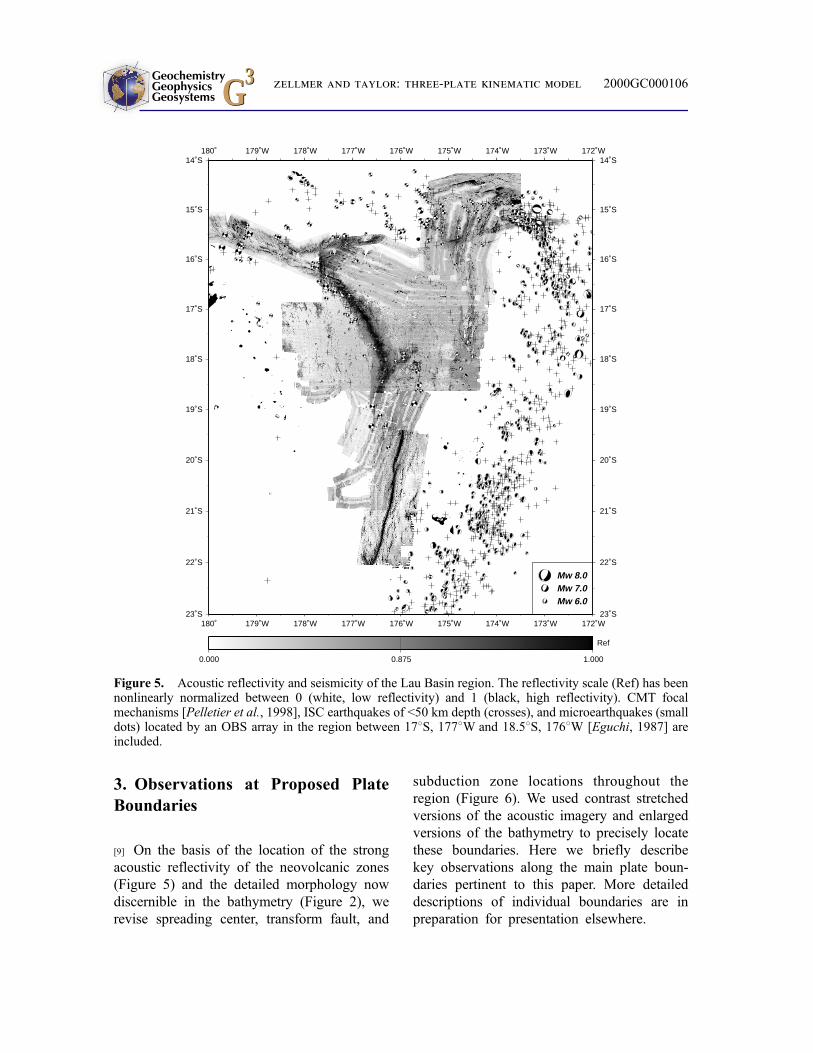
[9] On the basis of the location of the strong
acoustic reflectivity of the neovolcanic zones
(Figure 5) and the detailed morphology now
discernible in the bathymetry (Figure 2), we
revise spreading center, transform fault, and
subduction zone locations throughout the
region (Figure 6). We used contrast stretched
versions of the acoustic imagery and enlarged
versions of the bathymetry to precisely locate
these boundaries. Here we briefly describe
key observations along the main plate boun-
daries pertinent to this paper. More detailed
descriptions of individual boundaries are in
preparation for presentation elsewhere.
0.000 0.875 1.000
Ref
Mw 8.0Mw 7.0Mw 6.0
180˚
180˚
179˚W
179˚W
178˚W
178˚W
177˚W
177˚W
176˚W
176˚W
175˚W
175˚W
174˚W
174˚W
173˚W
173˚W
172˚W
172˚W
23˚S 23˚S
22˚S 22˚S
21˚S 21˚S
20˚S 20˚S
19˚S 19˚S
18˚S 18˚S
17˚S 17˚S
16˚S 16˚S
15˚S 15˚S
14˚S 14˚S
Figure 5. Acoustic reflectivity and seismicity of the Lau Basin region. The reflectivity scale (Ref) has beennonlinearly normalized between 0 (white, low reflectivity) and 1 (black, high reflectivity). CMT focalmechanisms [Pelletier et al., 1998], ISC earthquakes of <50 km depth (crosses), and microearthquakes (smalldots) located by an OBS array in the region between 178S, 1778W and 18.58S, 1768W [Eguchi, 1987] areincluded.
GeochemistryGeophysicsGeosystems G3G3 zellmer and taylor: three-plate kinematic model 2000GC000106
?
??
A
N
T
MTJ
FRSC
NWLSC
PR
LETZ
CLS
CE
LSC
VF
FSC
Tong
a
Tren
ch
Tong
a R
idge
Tofu
a
Volc
anic
Arc
Lau
Rid
ge
Niuatoputapu
Vava’u
Tongatapu
Niuafo’ou
Fonualei
Futuna-Alofi
11
2A22A
1
2
1 J2
J
1
2
1
J J
157
123
77
180˚
180˚
179˚W
179˚W
178˚W
178˚W
177˚W
177˚W
176˚W
176˚W
175˚W
175˚W
174˚W
174˚W
173˚W
173˚W
172˚W
172˚W
24˚S 24˚S
23˚S 23˚S
22˚S 22˚S
21˚S 21˚S
20˚S 20˚S
19˚S 19˚S
18˚S 18˚S
17˚S 17˚S
16˚S 16˚S
15˚S 15˚S
14˚S 14˚S
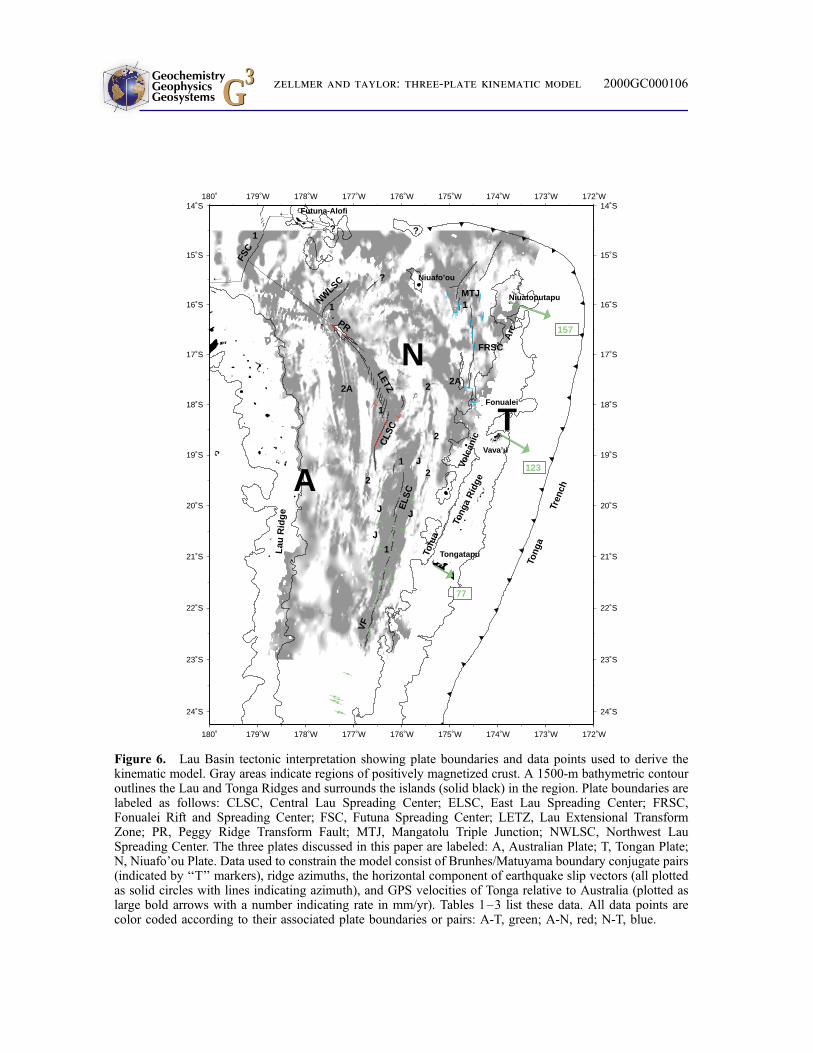
Figure 6. Lau Basin tectonic interpretation showing plate boundaries and data points used to derive thekinematic model. Gray areas indicate regions of positively magnetized crust. A 1500-m bathymetric contouroutlines the Lau and Tonga Ridges and surrounds the islands (solid black) in the region. Plate boundaries arelabeled as follows: CLSC, Central Lau Spreading Center; ELSC, East Lau Spreading Center; FRSC,Fonualei Rift and Spreading Center; FSC, Futuna Spreading Center; LETZ, Lau Extensional TransformZone; PR, Peggy Ridge Transform Fault; MTJ, Mangatolu Triple Junction; NWLSC, Northwest LauSpreading Center. The three plates discussed in this paper are labeled: A, Australian Plate; T, Tongan Plate;N, Niuafo'ou Plate. Data used to constrain the model consist of Brunhes/Matuyama boundary conjugate pairs(indicated by `̀ T'' markers), ridge azimuths, the horizontal component of earthquake slip vectors (all plottedas solid circles with lines indicating azimuth), and GPS velocities of Tonga relative to Australia (plotted aslarge bold arrows with a number indicating rate in mm/yr). Tables 1±3 list these data. All data points arecolor coded according to their associated plate boundaries or pairs: A-T, green; A-N, red; N-T, blue.
GeochemistryGeophysicsGeosystems G3G3 zellmer and taylor: three-plate kinematic model 2000GC000106
Table 1. Brunhes/Matuyama Boundary Pairs (0.78 Myr)
Longitude 1, 8W Latitude 1, 8S Longitude 2, 8W Latitude 2, 8S Plates
176.3997 19.6920 175.7630 19.8798 A-T176.4805 20.3028 175.9311 20.4686 A-T176.4881 20.8154 176.0271 20.9592 A-T176.6011 21.1709 176.1398 21.3143 A-T176.6125 21.3518 176.1739 21.4972 A-T176.5731 17.9792 176.0514 18.2598 A-N175.0469 15.7982 174.3655 15.8532 N-T174.9191 16.1471 174.3022 16.2299 N-T
Table 2. GPS Relative Velocities
Longitude, 8W Latitude, 8S Velocity, mm/yr Azimuth a, deg* Plates
173.7636 15.9467 157 � 4 109 � 2 19 � 2 A-T173.9600 18.5853 123 � 4 120 � 2 30 � 2 A-T175.3089 21.1735 77 � 4 121 � 2 31 � 2 A-T
*Here a is orthogonal to relative motion inferred from the data azimuth.
Table 3. Azimuth Data
Longitude, 8W Latitude, 8S Azimuth a, deg* Source Plates
176.0329 19.8004 18.8 18.8 ridge A-T176.1623 20.4005 17.6 17.6 ridge A-T176.1784 20.6605 18.4 18.4 ridge A-T176.2446 20.9673 18.2 18.2 ridge A-T176.3385 21.2334 18.2 18.2 ridge A-T176.3818 21.4823 14.7 14.7 ridge A-T176.4618 21.7502 18.1 18.1 ridge A-T176.5451 21.9501 24.1 24.1 ridge A-T176.6948 22.4444 18.7 18.7 ridge A-T177.12 23.27 111 21 slip vector A-T177.39 23.71 280 10 slip vector A-T177.30 23.76 105 15 slip vector A-T177.39 23.79 282 12 slip vector A-T177.33 23.83 293 23 slip vector A-T177.24 24.02 115 25 slip vector A-T177.31 24.01 291 21 slip vector A-T
176.3286 18.3759 28.1 28.1 ridge A-N176.4416 18.6072 27.4 27.4 ridge A-N176.5238 18.7694 25.3 25.3 ridge A-N177.4120 16.4348 128.7 38.7 transform A-N177.1830 16.6111 128.7 38.7 transform A-N174.8030 16.0108 ÿ0.6 ÿ0.6 ridge N-T174.5510 16.3359 7.9 7.9 ridge N-T174.5250 16.5716 2.3 2.3 ridge N-T174.4900 16.8533 8.5 8.5 ridge N-T174.61 17.66 100 10 slip vector N-T174.51 17.95 276 6 slip vector N-T
*Here a is orthogonal to relative motion inferred from the data azimuth.
GeochemistryGeophysicsGeosystems G3G3 zellmer and taylor: three-plate kinematic model 2000GC000106
3.1. Peggy Ridge and the Central Lau
Spreading Center
[10] The Peggy Ridge (PR) links to the Central
Lau Spreading Center (CLSC) via a complex
series of left-stepping, en echelon spreading
segments that comprise the Lau Extensional
Transform Zone (LETZ, Figure 6) [Taylor et
al., 1994, 1996]. PR is the only transform fault
in the central Lau Basin, and it lacks significant
curvature. Details of the LETZ mapped during
the MW9603 cruise reveal it to be a zone of en
echelon, overlapping spreading segments, cut
by a strike-slip fault in the north that is at a low
angle (98) and synthetic to PR. Slip vectors
determined from focal mechanisms available
for this region generally do not follow the
�1298 trend that is observed along the cur-
rently active right-lateral PR transform fault.
They have more similar trends to the synthetic
fault (1388) that may accommodate the strike-
slip component of total strain that is partitioned
with easterly extension on surrounding en
echelon fissure ridges (characterized by high
acoustic reflectivity and Brunhes magnetiza-
tion, Figures 4 and 5).
[11] The morphology and trend of the CLSC
[Wiedicke and Habler, 1993] varies along
axis. A distinct and abrupt bend in the ridge
axis at 188570S is confirmed in our bathymetry
and magnetization compilations (Figures 2 and
4). North of 188570S, the southward propaga-
tion of the CLSC has generated seafloor fabric
trending NNE and a north trending outer
pseudofault on the west that bounds crust
older than magnetic anomaly 2. South of
188570S, seafloor fabric trends �1758 in a
narrow zone of recent volcanism with very
little sediment cover. Only at the northern end
of the CLSC can we determine the seafloor
spreading rate, where the Brunhes-Matuyama
boundaries are parallel to the seafloor fabric
and inside the propagation boundaries [Taylor
et al., 1996] (Figure 6).
3.2. East Lau Spreading Center
[12] The southern tip of the CLSC overlaps the
northern segments of the East Lau Spreading
Center (ELSC, Figure 6) [Parson et al., 1990].
The ELSC consists of a left-stepping series of
overlapping spreading segments; the southern-
most are known as the Valu Fa (VF) ridge
[Morton and Sleep, 1985; Turner et al.,
1999]. Only on the highest-resolution swath
bathymetry can the axial segmentation south
of the overlapper at 20.58S be observed as
depicted in Figure 6 (within the apparently
sinuous planform of the high acoustic reflec-
tivity, Figure 5). Our interpretation of the ridge
axis location was independently confirmed by
the EW9914 cruise of Harding et al. [2000],
who studied magma lens distribution and crus-
tal structure between 188S and 238S using
along- and across-axis multichannel seismic
profiles (navigated with D-GPS and colocated
with Hydrosweep swath bathymetry).
[13] As the ELSC angles southward closer to
the Tofua volcanic arc, the depths decrease (to
�1700 m, Figure 2), the axial magnetization
high increases in amplitude (Figure 4), and the
lavas become more arc-like [Vallier et al.,
1991; Pearce et al., 1995]. This may explain
the lack of seafloor subsidence (actual shallow-
ing) away from the spreading axes at 198±218Swhere off-axis areas may formerly have been
more like Valu Fa today. The area between
238160S and 248020S, immediately south of the
ELSC, is marked by a set of normal faulting
earthquakes (Figure 6) that provide evidence
for rifting ahead of the spreading tip.
[14] The Brunhes anomaly associated with the
ELSC is located asymmetrically toward the east
with respect to surrounding magnetic anoma-
lies 2 (Figures 4 and 6). Apparent eastward
ridge jumps are also recorded by both J anoma-
lies sometimes being west of the Brunhes (e.g.,
at 19.58S). Estimated Brunhes Chron spreading
GeochemistryGeophysicsGeosystems G3G3 zellmer and taylor: three-plate kinematic model 2000GC000106
rates along the ELSC predict a trend of north-
ward spreading rate increase that is greater
than, and not consistent with, that observed at
the CLSC (see section 4.1 below). We have not
estimated spreading rates on the ELSC south of
21.58S where the width of the Brunhes anom-
aly significantly narrows, apparently as a result
of southward ridge propagation.
3.3. Fonualei Rift and Spreading Center
[15] The Fonualei Rift and Spreading Center
(FRSC) comprises the spreading centers
extending south of the Mangatolu Triple Junc-
tion (MTJ, also known as the Kings Triple
Junction) [Hawkins and Helu, 1986]. Details
of this rift were first mapped during the
MW9603 cruise, which also revealed that the
western branch of the MTJ is quite short,
whereas the NE branch connects via a large
overlapper with a spreading segment that
continues to the northern Tonga Trench (Fig-
ures 2, 5, and 6; see also Wright et al. [2000]).
The magnetization pattern in this region (Fig-
ure 4) in conjunction with neovolcanic zones
interpreted from the bathymetry and acoustic
imagery (Figures 2 and 5) show that the MTJ
has reoriented during the Brunhes Chron (Fig-
ure 6). South of the MTJ, the positive Brunhes
and surrounding negative Matuyama anoma-
lies can be recognized even though bathyme-
try and magnetics data coverage of this region
is sparser than for the CLSC and ELSC
(Figures 2, 3, and 4). In particular, the mag-
netization inversion between 168150 and 178Scould be significantly improved by more
bathymetry (and magnetics) data. Magnetic
anomalies J and 2 are poorly resolved with
the available data (although both J anomalies
may be present west of the Brunhes as the
result of a ridge jump). Detailed mapping of
the FRSC south of 178S during the MW9603
cruise reveals that the rift flanks reach <1000
m, whereas the graben floor is at an average
depth of 3500 m. Earthquakes south of the
southernmost tip of the FRSC to 188110Sexhibit normal faulting consistent with active
rifting (Figure 5).
3.4. Northwest Lau Spreading Center
[16] Extending northeast from Peggy Ridge
there is a region of positive magnetization and
high acoustic reflectivity (Figures 4 and 5)
identified as the Northwest Lau Spreading
Center (NWLSC, Figure 6) Parson and Tiffin,
1993; Tiffin, 1993]. The spreading axis is a
bathymetric ridge that is flanked by abyssal
hills in a 40-km-wide zone between conjugate
rifted highs (Figure 2). The NWLSC has not
been mapped north of 158300S, although a
narrower spreading segment is offset from,
and overlaps, it eastward (Figures 2 and 4±6).
The plate boundaries in the region of left-lateral
strike-slip earthquakes (Figure 5) between the
recently mapped Futuna Spreading Center [Pel-
letier et al., 2001], the northern Tonga Trench,
and the NWLSC remain unsurveyed.
3.5. Boundaries of the Proposed
Niuafo'ou Microplate
[17] There is a region between the NWLSC, the
PR/LETZ/CLSC and the MTJ/FRSC that is
mostly aseismic and lies south of a �100-km-
wide zone of left-lateral strike-slip earthquakes
north of Niuafo'ou (Figures 5 and 6) [also see
Hamburger and Isacks, 1988; Pelletier et al.,
1998]. We refer to this aseismic region as the
Niuafo'ou (N) microplate (Figure 6). To the
south of this aseismic region, a few earthquakes
are recorded and located, but no distinct narrow
plate boundary can be mapped between the
FRSC and the CLSC or ELSC.
4. A Three-Plate Kinematic Model
4.1. Motivation
[18] The original focus of our kinematic model
was simply to find the location of the Australia-
Tonga pole. Working under the starting hypoth-
GeochemistryGeophysicsGeosystems G3G3 zellmer and taylor: three-plate kinematic model 2000GC000106
Angular Distance From Case 1a A-T Pole (o)
0
20
40
60
80
100
120
140
160
2 3 4 5 6 7 8 9
(a)
ELSC
CLSC
-60
-40
-20
0
20
40
60
80
2 3 4 5 6 7 8 9
(b)
Azi
mut
h to
Pol
e (o )
ELSC
CLSC,PR
Ful
l Rat
e (m
m/y
r)
GeochemistryGeophysicsGeosystems G3G3 zellmer and taylor: three-plate kinematic model 2000GC000106
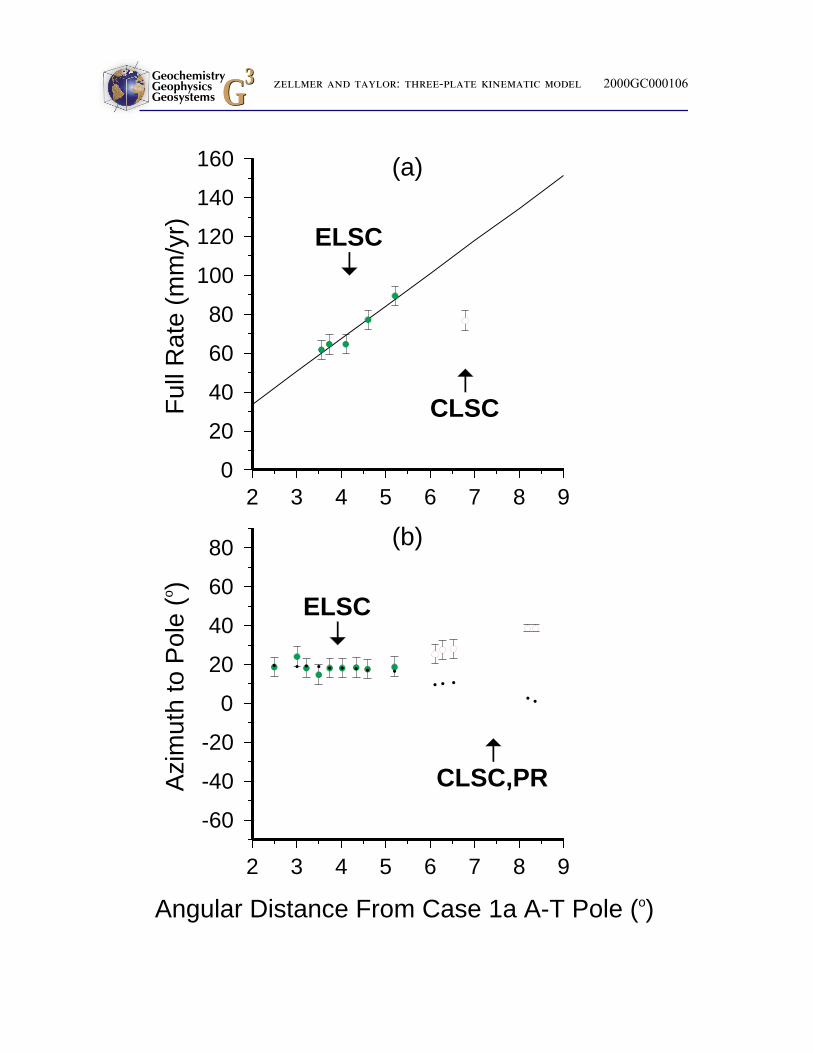
esis that the ELSC and the PR/LETZ/CLSC
plate boundaries were both separating Australia
and Tonga, all of the model constraints for
these two boundaries were initially inverted
together to determine a pole using methods
described in section 5. This calculation
revealed that the model constraints observed
along the PR/LETZ/CLSC system did not fit
well with predictions from an Australia-Tonga
pole derived from the data for the ELSC system
(Figure 7). We realized that motions across the
ELSC and the PR/LETZ/CLSC are not copolar
and that a system of more than two plates is
necessary to adequately model the kinematics
of the Lau Basin.
4.2. Proposed Three-Plate Model
[19] We propose that motion between the
Australian (A) plate and the Tongan (T) plate
is partitioned along the boundaries of the
intervening Niuafo'ou (N) microplate. The
tectonics of the following proposed plate
boundaries are analyzed: (A-T) ELSC, (A-
N) PR, LETZ, CLSC, and (N-T) FRSC. This
proposition requires that an A-N-T triple
junction exist somewhere between the
CLSC-ELSC-FRSC.
4.3. Model Constraints
[20] The following data types are used as model
constraints: (1) spreading rates (finite over 0.78
Ma), (2) GPS relative velocities, (3) the hori-
zontal component of earthquake slip vectors,
(4) transform fault azimuths, and (5) selected
ridge axis azimuths (see below). The data used
in our inversions are plotted in Figure 6 and
listed in Tables 1±3.
[21] Table 1 presents Brunhes/Matuyama boun-
dary pairs that were carefully picked to avoid
complex areas produced by overlapping
spreading centers. By studying their associated
conjugate off-axis morphologies we picked
these pairs of points to have been near the
same location along spreading axes at 0.78
Ma. The Brunhes/Matuyama boundary pairs
are directly associated with spreading rate,
but, when close to Euler poles as here, the
actual rates vary slightly with pole position. We
estimate the spreading rate errors to be �5 mm/
yr (i.e., one standard deviation is 5 mm/yr).
[22] Table 2 lists geodetically determined A-T
opening rates and azimuths as reported by
Bevis [1997]. No geodetic data are currently
available for A-N or N-T motions. Errors on
the geodetic data are �4 mm/yr in rate and �28in azimuth [Bevis, 1997].
[23] Table 3 lists three types of azimuthal data.
Transform fault azimuths were measured along
the active portion of the PR, with an estimated
error of �28. In the absence of any other
transform faults along the LETZ, CLSC,
ELSC, and FRSC, all of which are character-
ized by overlapping spreading segments, we
considered alternate indicators of spreading
direction. We chose to include the azimuths
of ridge axes measured along central straight
segments away from their overlapping tips
(which excluded any measurements from the
LETZ). Our rationale was that, even in areas of
oblique spreading such as the Reykjanes
Ridge, the centers of such sigmoidal spreading
segments or axial volcanic ridges are predom-
inantly orthogonal to the spreading direction
Figure 7. Comparison of (a) measured rates and (b) azimuths (in colored symbols) versus modeled values(in black) predicted by the case 1a A-T pole (refer to Table 4 and section 4.1). The data along the PR/LETZ/CLSC (open symbols) are not predicted by a pole describing the data along the ELSC (solid symbols). Weinfer that the motions across these two boundaries are not copolar, i.e., a system of at least three plates isneeded to adequately describe the kinematics of the Lau Basin.
GeochemistryGeophysicsGeosystems G3G3 zellmer and taylor: three-plate kinematic model 2000GC000106
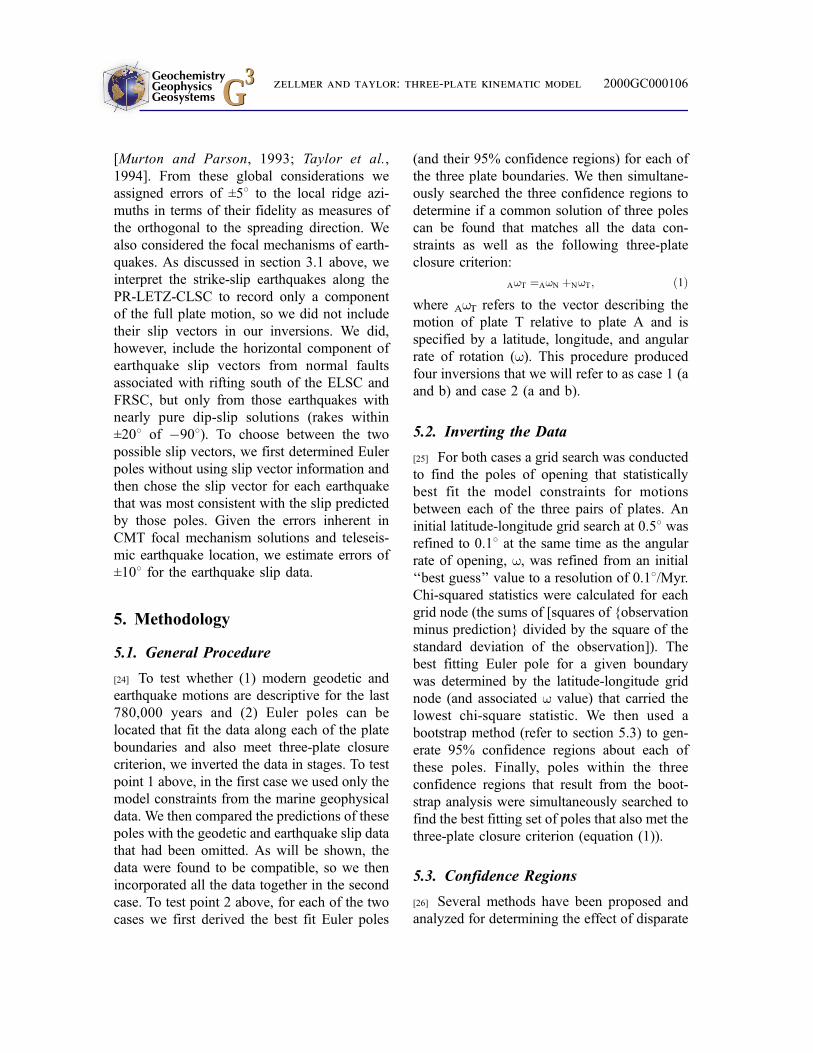
[Murton and Parson, 1993; Taylor et al.,
1994]. From these global considerations we
assigned errors of �58 to the local ridge azi-
muths in terms of their fidelity as measures of
the orthogonal to the spreading direction. We
also considered the focal mechanisms of earth-
quakes. As discussed in section 3.1 above, we
interpret the strike-slip earthquakes along the
PR-LETZ-CLSC to record only a component
of the full plate motion, so we did not include
their slip vectors in our inversions. We did,
however, include the horizontal component of
earthquake slip vectors from normal faults
associated with rifting south of the ELSC and
FRSC, but only from those earthquakes with
nearly pure dip-slip solutions (rakes within
�208 of ÿ908). To choose between the two
possible slip vectors, we first determined Euler
poles without using slip vector information and
then chose the slip vector for each earthquake
that was most consistent with the slip predicted
by those poles. Given the errors inherent in
CMT focal mechanism solutions and teleseis-
mic earthquake location, we estimate errors of
�108 for the earthquake slip data.
5. Methodology
5.1. General Procedure
[24] To test whether (1) modern geodetic and
earthquake motions are descriptive for the last
780,000 years and (2) Euler poles can be
located that fit the data along each of the plate
boundaries and also meet three-plate closure
criterion, we inverted the data in stages. To test
point 1 above, in the first case we used only the
model constraints from the marine geophysical
data. We then compared the predictions of these
poles with the geodetic and earthquake slip data
that had been omitted. As will be shown, the
data were found to be compatible, so we then
incorporated all the data together in the second
case. To test point 2 above, for each of the two
cases we first derived the best fit Euler poles
(and their 95% confidence regions) for each of
the three plate boundaries. We then simultane-
ously searched the three confidence regions to
determine if a common solution of three poles
can be found that matches all the data con-
straints as well as the following three-plate
closure criterion:
AwT �AwN �NwT; �1�where AwT refers to the vector describing the
motion of plate T relative to plate A and is
specified by a latitude, longitude, and angular
rate of rotation (w). This procedure produced
four inversions that we will refer to as case 1 (a
and b) and case 2 (a and b).
5.2. Inverting the Data
[25] For both cases a grid search was conducted
to find the poles of opening that statistically
best fit the model constraints for motions
between each of the three pairs of plates. An
initial latitude-longitude grid search at 0.58 was
refined to 0.18 at the same time as the angular
rate of opening, w, was refined from an initial
`̀ best guess'' value to a resolution of 0.18/Myr.
Chi-squared statistics were calculated for each
grid node (the sums of [squares of {observation
minus prediction} divided by the square of the
standard deviation of the observation]). The
best fitting Euler pole for a given boundary
was determined by the latitude-longitude grid
node (and associated w value) that carried the
lowest chi-square statistic. We then used a
bootstrap method (refer to section 5.3) to gen-
erate 95% confidence regions about each of
these poles. Finally, poles within the three
confidence regions that result from the boot-
strap analysis were simultaneously searched to
find the best fitting set of poles that also met the
three-plate closure criterion (equation (1)).
5.3. Confidence Regions
[26] Several methods have been proposed and
analyzed for determining the effect of disparate
GeochemistryGeophysicsGeosystems G3G3 zellmer and taylor: three-plate kinematic model 2000GC000106

data types and errors on calculated poles of
opening [Wilson, 1993]. The method used here
is based on bootstrap resampling [Efron and
Tibshirani, 1986], in which data inputs are
randomly resampled such that some data values
are selected multiple times while others are left
out. For each of 1000 of these `̀ resampled''
data sets, calculations were completed using the
methods described in section 5.2. This boot-
strap process generated 1000 points scattered
Table 4. Case 1a Pole Solutions
Pole Boundary Longitude, 8W Latitude, 8S w, deg/Myr
A-T ELSC 177.6 24.8 8.7A-N CLSC,PR 171.5 9.6 4.3N-T FRSC 174.9 20.0 11.5
?
?
?
A-N
A-T
N-TA
N
T
Paci
fic P
late
180˚
180˚
178˚
178˚
176˚
176˚
174˚
174˚
172˚
172˚
170˚
170˚
168˚
168˚
26˚
24˚
22˚
20˚
18˚
16˚
14˚
12˚
10˚
8˚
6˚
Longitude (˚W)
(a)
A-N
A-T
N-T
26˚
24˚
22˚
20˚
18˚
16˚
14˚
12˚
10˚
8˚
6˚
2
2
4
4
6
6
8
8
10
10
12
12
14
14
16
16
18
18
ω (˚/Myr)
(b)
Latit
ude
(˚S
)
Figure 8. Euler poles and 95% confidence regions determined from the spreading rate, transform, and ridgeazimuth data (i.e., independent of the earthquake and GPS data). Solid stars show the locations of the case 1apole solutions that best fit the data for each plate pair (refer to Table 4); open stars show the locations of thecase 1b pole solutions, which also meet the three-plate closure criterion (refer to Table 5). Plate boundariesare color coded as in Figure 6. (a) Confidence regions on latitude-longitude projection. (b) Confidenceregions on latitude-w projection (w is the angular rate).
GeochemistryGeophysicsGeosystems G3G3 zellmer and taylor: three-plate kinematic model 2000GC000106
0
20
40
60
80
100
120
140
160
0 1 2 3 4 5 6 7 8 9 10 11
(a)
Ful
l Rat
e (m
m/y
r)
-60
-40
-20
0
20
40
60
80
0 1 2 3 4 5 6 7 8 9 10 11
Azi
mut
h to
Pol
e (o
)
(b)
0
20
40
60
80
100
120
140
160
9 10 11 12 13
(c)
Ful
l Rat
e (m
m/y
r)
-40
-20
0
20
40
60
80
100
9 10 11 12 13
(d)A
zim
uth
to P
ole
(o)
0
20
40
60
80
100
120
140
160
1.5 2.0 2.5 3.0 3.5 4.0 4.5
(e)
Ful
l Rat
e (m
m/y
r)
-80
-60
-40
-20
0
20
40
60
80
1.5 2.0 2.5 3.0 3.5 4.0 4.5
Azi
mut
h to
Pol
e (o
)
(f)
Angular Distance From Case 1a Poles (o)A-T (a, b); A-N (c, d); N-T (e, f)
GeochemistryGeophysicsGeosystems G3G3 zellmer and taylor: three-plate kinematic model 2000GC000106
about each best fit pole solution to represent a
reasonable indication of the possible pole error.
Contours of confidence limits were generated
about the best fitting pole using a density
function and methods described by Wilson
[1993]. The use of a density function allows
for 95% confidence regions to be simultane-
ously derived for all three-pole parameters
(latitude, longitude, and w).
6. Results
6.1. Case 1a
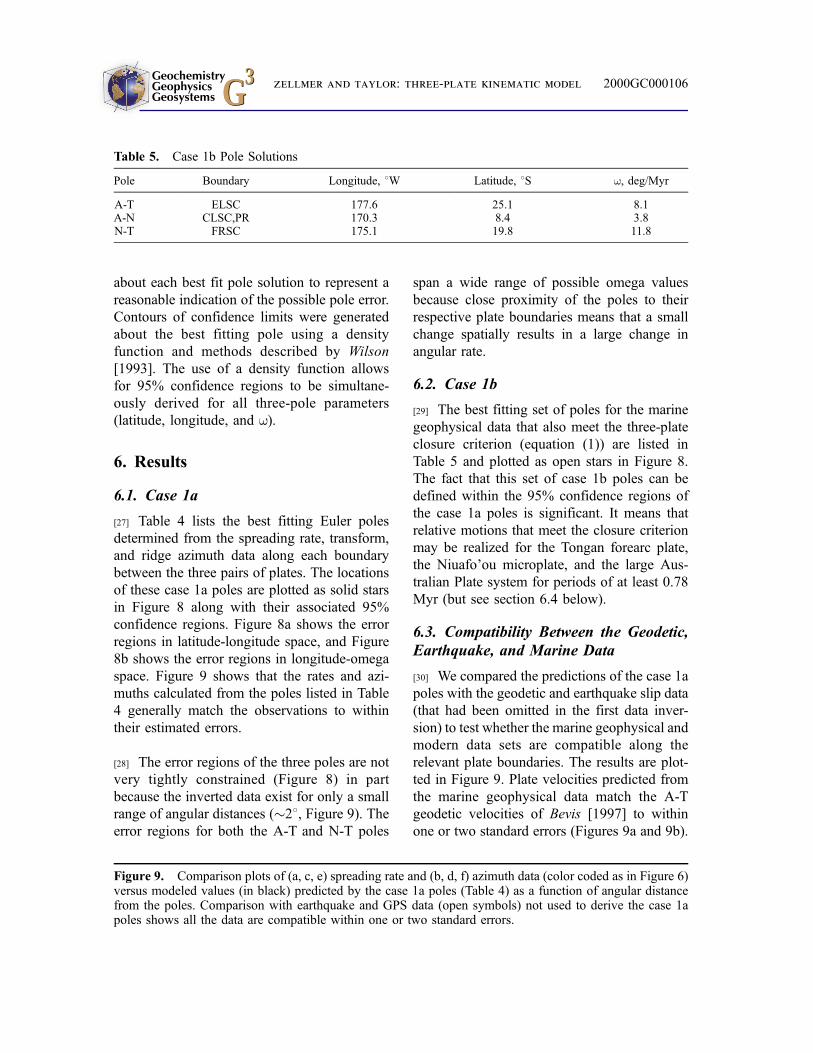
[27] Table 4 lists the best fitting Euler poles
determined from the spreading rate, transform,
and ridge azimuth data along each boundary
between the three pairs of plates. The locations
of these case 1a poles are plotted as solid stars
in Figure 8 along with their associated 95%
confidence regions. Figure 8a shows the error
regions in latitude-longitude space, and Figure
8b shows the error regions in longitude-omega
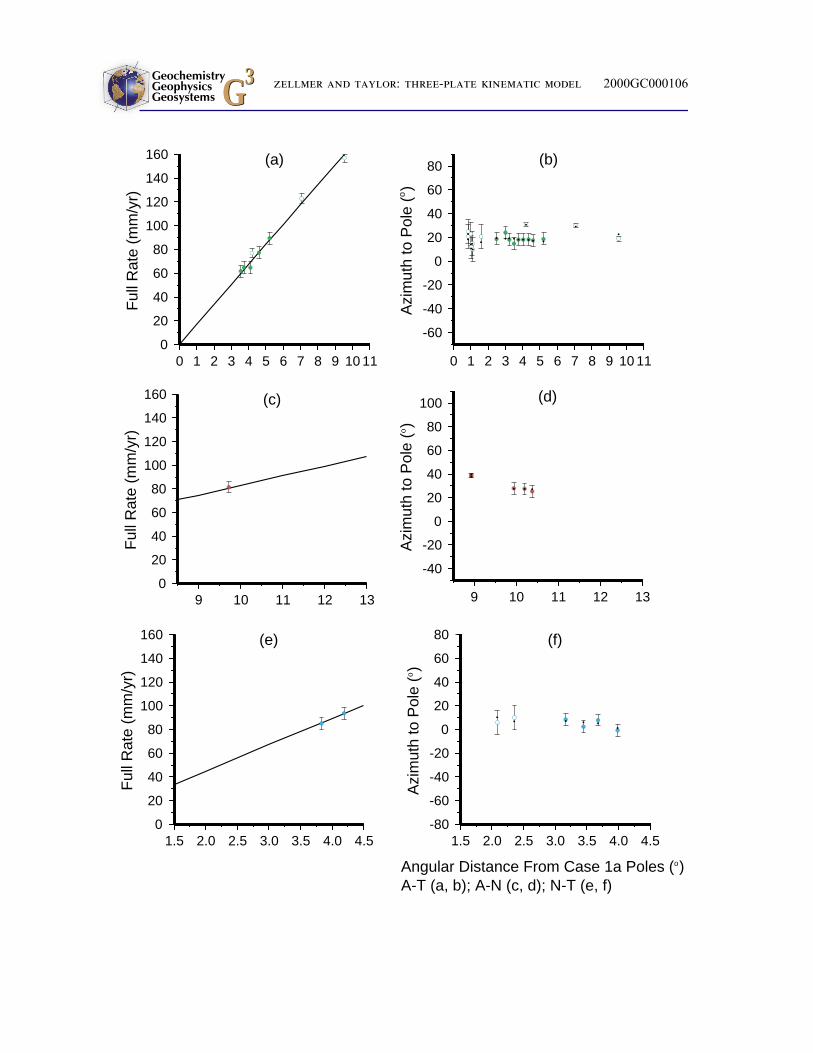
space. Figure 9 shows that the rates and azi-
muths calculated from the poles listed in Table
4 generally match the observations to within
their estimated errors.
[28] The error regions of the three poles are not
very tightly constrained (Figure 8) in part
because the inverted data exist for only a small
range of angular distances (�28, Figure 9). The
error regions for both the A-T and N-T poles
span a wide range of possible omega values
because close proximity of the poles to their
respective plate boundaries means that a small
change spatially results in a large change in
angular rate.
6.2. Case 1b
[29] The best fitting set of poles for the marine
geophysical data that also meet the three-plate
closure criterion (equation (1)) are listed in
Table 5 and plotted as open stars in Figure 8.
The fact that this set of case 1b poles can be
defined within the 95% confidence regions of
the case 1a poles is significant. It means that
relative motions that meet the closure criterion
may be realized for the Tongan forearc plate,
the Niuafo'ou microplate, and the large Aus-
tralian Plate system for periods of at least 0.78
Myr (but see section 6.4 below).
6.3. Compatibility Between the Geodetic,
Earthquake, and Marine Data
[30] We compared the predictions of the case 1a
poles with the geodetic and earthquake slip data
(that had been omitted in the first data inver-
sion) to test whether the marine geophysical and
modern data sets are compatible along the
relevant plate boundaries. The results are plot-
ted in Figure 9. Plate velocities predicted from
the marine geophysical data match the A-T
geodetic velocities of Bevis [1997] to within
one or two standard errors (Figures 9a and 9b).
Table 5. Case 1b Pole Solutions
Pole Boundary Longitude, 8W Latitude, 8S w, deg/Myr
A-T ELSC 177.6 25.1 8.1A-N CLSC,PR 170.3 8.4 3.8N-T FRSC 175.1 19.8 11.8
Figure 9. Comparison plots of (a, c, e) spreading rate and (b, d, f) azimuth data (color coded as in Figure 6)versus modeled values (in black) predicted by the case 1a poles (Table 4) as a function of angular distancefrom the poles. Comparison with earthquake and GPS data (open symbols) not used to derive the case 1apoles shows all the data are compatible within one or two standard errors.
GeochemistryGeophysicsGeosystems G3G3 zellmer and taylor: three-plate kinematic model 2000GC000106
Thus any discrepancies of the geodetic relative
plate velocity values (as revised by Bevis
[1997]) with those independently determined
by marine magnetic data are much less than
the �25% reported by Bevis et al. [1995] and
Taylor et al. [1996]. The horizontal component
of the earthquake slip vectors are within error of
their predicted values. These comparisons indi-
cate that all the data are sufficiently compatible
to be included in a single inversion (case 2).
6.4. Case 2
[31] The results of including the geodetic and
earthquake data with the marine geophysical
data (case 2a for the three pairs of plates and
case 2b in which the poles also meet the three-
plate closure criterion) are reported in Tables 6
and 7 and plotted in Figure 10 as closed and
open stars, respectively. The case 2 poles are
similar to the case 1 poles with two exceptions.
The A-T 95% confidence region shrinks sig-
nificantly because of (1) the increased range of
angular distances and azimuths in the full data
set and (2) the strict match to the geodetic
vectors required for each trial pole, i.e., unlike
the Brunhes boundary pairs, the geodetic vec-
tors are unaffected by the spatial location of the
poles being tested statistically. In contrast, the
N-T 95% confidence region expands as a result
of adding the two earthquake slip vectors to the
data set.
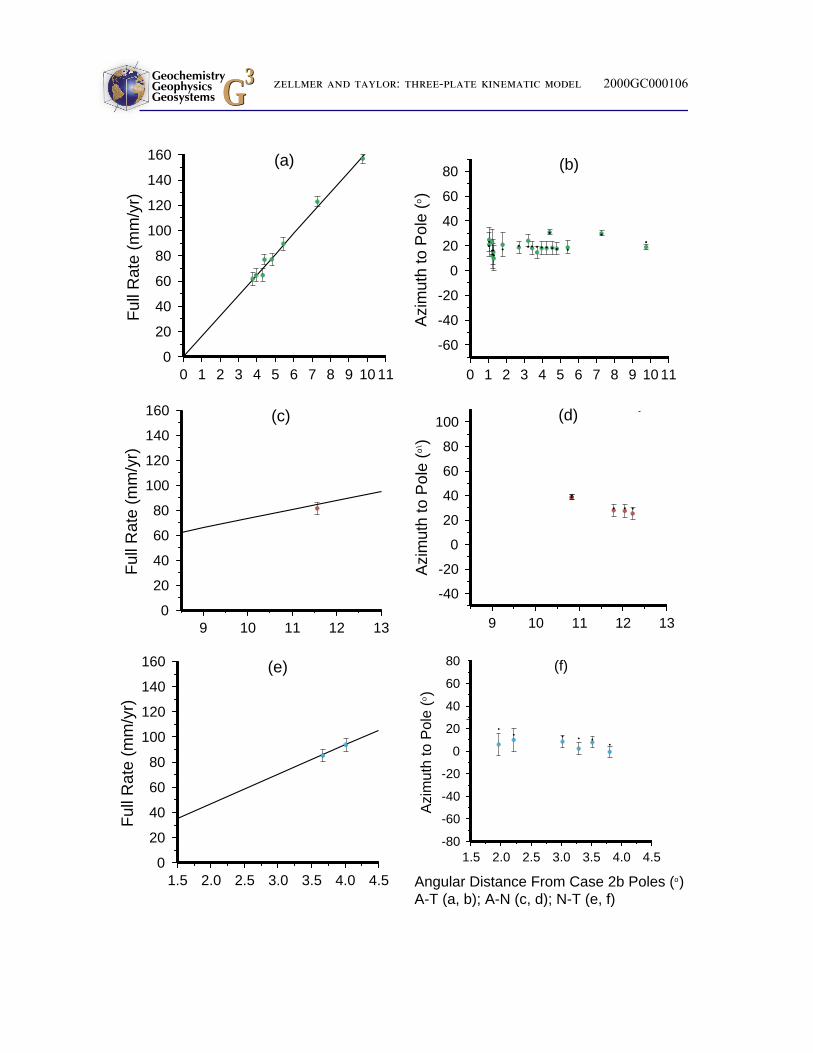
[32] The data compatibility plots of Figure 11
show that nearly all the predictions of the
Case 2a poles remain within the error of the
observations. In contrast, the data compatibil-
ity plots for Case 2b (Figure 12) show that the
compromise required to complete the plate
circuit forces several predicted azimuth values
for the N-T pole slightly outside one standard
error of the observations. This and the fact that
the A-N and N-T poles for case 2b lie near the
edge of the 95% confidence regions for case
2a (Figure 10) suggests that the poles describ-
ing the motions of the Niuafo'ou microplate
relative to Australia and Tonga may have
changed slightly within the last 0.78 Myr.
Such an evolution might be expected given
that both the CLSC and FRSC are propagating
southward and that the FRSC has reoriented
within the Brunhes chron; however, this infer-
ence is at the limit of resolution of the avail-
able data.
6.5. Compilation of Results
[33] The results of our three-plate kinematic
model of Lau Basin opening are summarized
in Figure 13. Observed full spreading rate
values are a function of the spatial location of
the pole and the picked pairs of Brunhes/
Matuyama boundary points. These values are
included in Figure 13 and correspond to the
values plotted in Figure 12. The resultant small
Table 6. Case 2a Pole Solutions
Pole Boundary Longitude, 8W Latitude, 8S w, deg/Myr
A-T ELSC 177.7 25.0 8.4A-N CLSC,PR 171.5 9.6 4.3N-T FRSC 174.9 20.1 11.2
Table 7. Case 2b Pole Solutions
Pole Boundary Longitude, 8W Latitude, 8S w, deg/Myr
A-T ELSC 177.7 25.0 8.4A-N CLSC,PR 170.2 8.2 3.8N-T FRSC 175.2 19.8 12.1
GeochemistryGeophysicsGeosystems G3G3 zellmer and taylor: three-plate kinematic model 2000GC000106
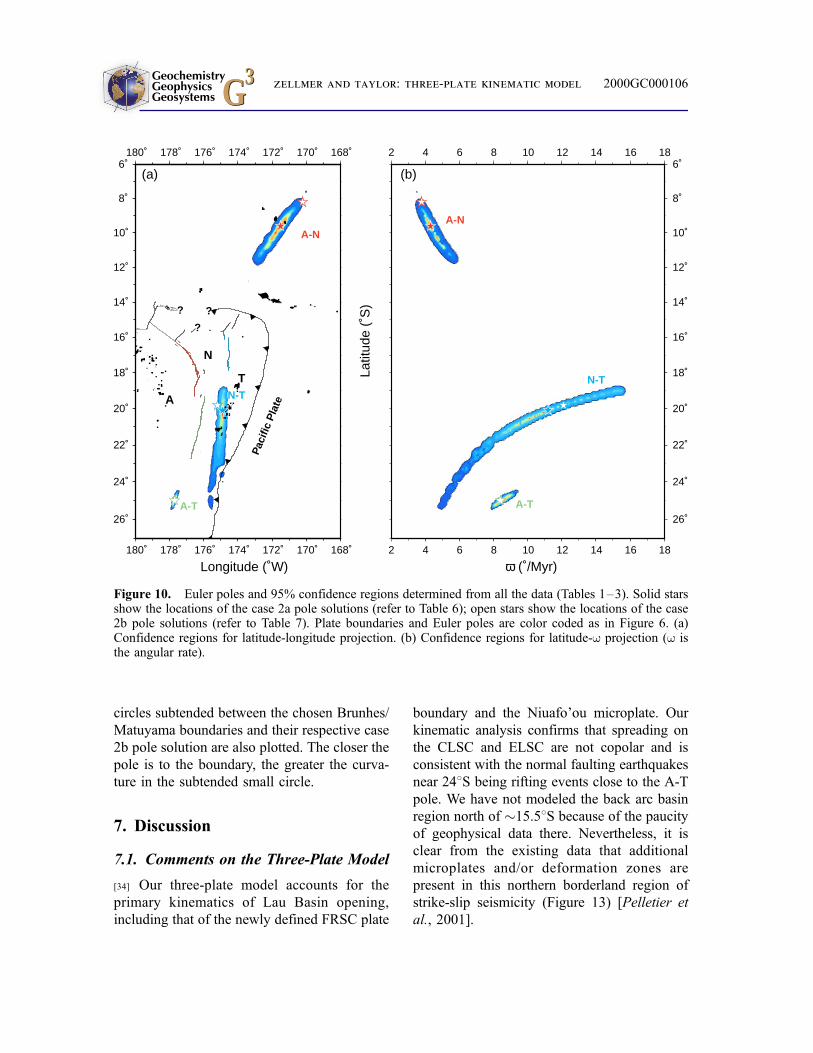
circles subtended between the chosen Brunhes/
Matuyama boundaries and their respective case
2b pole solution are also plotted. The closer the
pole is to the boundary, the greater the curva-
ture in the subtended small circle.
7. Discussion
7.1. Comments on the Three-Plate Model
[34] Our three-plate model accounts for the
primary kinematics of Lau Basin opening,
including that of the newly defined FRSC plate
boundary and the Niuafo'ou microplate. Our
kinematic analysis confirms that spreading on
the CLSC and ELSC are not copolar and is
consistent with the normal faulting earthquakes
near 248S being rifting events close to the A-T
pole. We have not modeled the back arc basin
region north of �15.58S because of the paucity
of geophysical data there. Nevertheless, it is
clear from the existing data that additional
microplates and/or deformation zones are
present in this northern borderland region of
strike-slip seismicity (Figure 13) [Pelletier et
al., 2001].
?
?
?
A-N
A-T
N-TA
N
T
Paci
fic P
late
180˚
180˚
178˚
178˚
176˚
176˚
174˚
174˚
172˚
172˚
170˚
170˚
168˚
168˚
26˚
24˚
22˚
20˚
18˚
16˚
14˚
12˚
10˚
8˚
6˚
Longitude (˚W)
(a)
A-N
A-T
N-T
26˚
24˚
22˚
20˚
18˚
16˚
14˚
12˚
10˚
8˚
6˚
2
2
4
4
6
6
8
8
10
10
12
12
14
14
16
16
18
18
ω (˚/Myr)
(b)
Latit
ude
(˚S
)
Figure 10. Euler poles and 95% confidence regions determined from all the data (Tables 1±3). Solid starsshow the locations of the case 2a pole solutions (refer to Table 6); open stars show the locations of the case2b pole solutions (refer to Table 7). Plate boundaries and Euler poles are color coded as in Figure 6. (a)Confidence regions for latitude-longitude projection. (b) Confidence regions for latitude-w projection (w isthe angular rate).
GeochemistryGeophysicsGeosystems G3G3 zellmer and taylor: three-plate kinematic model 2000GC000106

0
20
40
60
80
100
120
140
160
0 1 2 3 4 5 6 7 8 9 10 11
(a)
Ful
l Rat
e (m
m/y
r)
-60
-40
-20
0
20
40
60
80
0 1 2 3 4 5 6 7 8 9 10 11
Azi
mut
h to
Pol
e (o
)
(b)
0
20
40
60
80
100
120
140
160
9 10 11 12 13
(c)
Ful
l Rat
e (m
m/y
r)
-40
-20
0
20
40
60
80
100
9 10 11 12 13
(d)A
zim
uth
to P
ole
(o)
0
20
40
60
80
100
120
140
160
1.5 2.0 2.5 3.0 3.5 4.0 4.5
(e)
Ful
l Rat
e (m
m/y
r)
-80
-60
-40
-20
0
20
40
60
80
1.5 2.0 2.5 3.0 3.5 4.0 4.5
Azi
mut
h to
Pol
e (o
)
(f)
Angular Distance From Case 2a Poles (o)A-T (a, b); A-N (c, d); N-T (e, f)
GeochemistryGeophysicsGeosystems G3G3 zellmer and taylor: three-plate kinematic model 2000GC000106
[35] A classical narrow southern boundary has
not been identified for the proposed Niuafo'ou
microplate (see section 7.2). However, the
microplate clearly is disparate enough from
the Australian and Tongan plates to be kine-
matically modeled using constraints at the boun-
daries that could be identified. In fact, one of the
main results of our analysis is that the kine-
matics of three plate-scale regions in the Lau
Basin can be described, even given the ambi-
guity of the southern boundary of the Niuafo'ou
microplate and the A-N-T triple junction.
[36] A majority of the geophysical constraints
used as inputs are well matched by the three-
plate kinematic model and the resultant case 2
pole solutions are compatible to within one or
two standard errors of the observed A-T geo-
detic vectors. That the geodetic vectors are
compatible with the marine-magnetic-deter-
mined spreading rates implies that the A-T
plate motion vectors determined geodetically
are applicable since at least 0.78 Ma. This is a
robust conclusion for the A-T pole and data,
independent of the three-plate model and the
interpretation of data on the other plate boun-
daries. That is, the A-T marine, earthquake, and
geodetic data are all compatible within one,
rarely two, standard errors. They jointly define
the best constrained Euler pole (258S, 177.78W,
8.48/m.y.) which is the same for case 2a and
case 2b and almost identical for case 1.
7.2. Nature of Plate Boundaries
[37] Although the three-plate model accounts
for a majority of the tectonic features through-
out the Lau Basin, some of the boundaries in
the A-N-T system cannot be fully understood
within the scope of this kinematic model. The
LETZ, for example, is a complex set of over-
lapping ridges that accommodate both exten-
sional and strike-slip motion. Brunhes-age
lavas have overprinted Matuyama-age crust
within this region.
[38] Most notably, the southern boundary of the
Niuafo'ou microplate has not been identified
despite full swath mapping. The only evidence
of a boundary is the set of scattered seismicity
(including a Mw = 6.5 event) between the
southern tip of the FRSC and the ELSC (Fig-
ures 5 and 13). Therefore, although the kine-
matics for the microplate can be defined, there
may be migrating and/or diffuse plate bounda-
ries that are not accounted for in our model. A
similar situation exists in the Pacific-Nazca-
Cocos triple junction region where the bounda-
ries of the Galapagos microplate are not fully
identifiable [Lonsdale, 1988]. Nevertheless,
using the case 2b solution of the N-T pole,
we can estimate the relative motions between
the microplate and the Tongan plate in the
vicinity of their inferred boundary zone. Near
the southern tip of the FRSC, N-T rates of
relative motion are predicted to be �47 mm/yr
(�5 mm/yr) decreasing to �20 mm/yr (�5 mm/
yr) at the northern tip of the ELSC. The
boundary between the FRSC tip and ELSC
may be rapidly migrating, as is that between
the CLSC and ELSC, in which case a narrow
plate boundary would not necessarily be evi-
dent. Note that our three-plate model also calls
into question the use of the CLSC-ELSC region
as a simple example of bookshelf tectonics
within a large propagating overlapper [Wetzel
et al., 1993].
7.3. Propagation Rates at the CLSC
[39] We can quantify the rates of both the CLSC
propagation and the rates of rapid extension
Figure 11. Comparison of (a, c, e) rate and (b, d, f) azimuth data (colored) versus modeled values (in black)predicted by the case 2a poles (Table 6) that invert all the data.
GeochemistryGeophysicsGeosystems G3G3 zellmer and taylor: three-plate kinematic model 2000GC000106
0
20
40
60
80
100
120
140
160
0 1 2 3 4 5 6 7 8 9 10 11
(a)
Ful
l Rat
e (m
m/y
r)
-60
-40
-20
0
20
40
60
80
0 1 2 3 4 5 6 7 8 9 10 11
Azi
mut
h to
Pol
e (o
)
(b)
0
20
40
60
80
100
120
140
160
9 10 11 12 13
(c)
Ful
l Rat
e (m
m/y
r)
-40
-20
0
20
40
60
80
100
9 10 11 12 13
(d)A
zim
uth
to P
ole
(o\ )
0
20
40
60
80
100
120
140
160
1.5 2.0 2.5 3.0 3.5 4.0 4.5
(e)
Ful
l Rat
e (m
m/y
r)
-80
-60
-40
-20
0
20
40
60
80
1.5 2.0 2.5 3.0 3.5 4.0 4.5
Azi
mut
h to
Pol
e (o
)
(f)
Angular Distance From Case 2b Poles (o)A-T (a, b); A-N (c, d); N-T (e, f)
GeochemistryGeophysicsGeosystems G3G3 zellmer and taylor: three-plate kinematic model 2000GC000106

to the tectonic tip by calculating synthetic
Brunhes/Matuyama boundaries using the case
2b A-N pole. The ratio of the distance between
the propagation boundaries relative to the dis-
tance across the synthetic Brunhes/Matuyama
boundaries gives the age of the propagation
Figure 12. Comparison of (a, c, e) rate and (b, d, f) azimuth data (colored) versus modeled values (in black)predicted by the case 2b poles (Table 7) that invert all the data and meet the three-plate closure criterion.
?
??
157
123
77
82
94
85
90
77
65
65
62
MTJ
FRSC
NWLSC
PR
LETZ
CLS
CE
LSC
VF
FSC
Tong
a
Tren
ch
Tong
a R
idge
Tofu
a
Volc
anic
Arc
Lau
Rid
ge
A
N
T
Paci
fic P
late
11
2A22A
1
2
1 J2
J
1
2
1
J J
Mw 8.0Mw 7.0Mw 6.0
180˚
180˚
179˚W
179˚W
178˚W
178˚W
177˚W
177˚W
176˚W
176˚W
175˚W
175˚W
174˚W
174˚W
173˚W
173˚W
172˚W
172˚W
24˚S 24˚S
23˚S 23˚S
22˚S 22˚S
21˚S 21˚S
20˚S 20˚S
19˚S 19˚S
18˚S 18˚S
17˚S 17˚S
16˚S 16˚S
15˚S 15˚S
14˚S 14˚S
Figure 13. Lau Basin tectonic and kinematic interpretation. To the plate boundary and positivemagnetization base map of Figure 5 are added the seismicity data of Figure 4 and the results from thethree-plate kinematic model of case 2b (Table 7). Plate boundaries, focal mechanisms used in case 2, and smallcircles (subtended about each of the respective poles) plotted between Brunhes/Matuyama boundary conjugatepairs (indicated by `̀ T'' markers), are colored according to their respective pole (A-T, green; A-N, red; N-T,blue). Measured spreading rates and GPS velocities of T relative to A are labeled in mm/yr (within boxes).
GeochemistryGeophysicsGeosystems G3G3 zellmer and taylor: three-plate kinematic model 2000GC000106
boundary as a percentage of 780,000 years.
Using the angular rate and position associated
with the case 2b A-N pole, we estimate that the
age of the propagation boundary at 188570S(Figure 13) is �145,000 yrs, which in turn
implies a propagation rate of 120 mm/yr along
the CLSC. The distance from 188570S to the
tectonic tip (located at the southern terminus of
the CLSC) is �46 km, which implies a very
rapid propagation rate of 320 mm/yr for this
segment.
7.4. Implications for Regional Tectonics
[40] South of the Lau Basin lies the Havre
Trough and the Taupo Rift (Figure 1), a region
known to be actively extending [Parson and
Wright, 1996]. Because the A-T pole is located
near 258S within the bathymetric saddle sepa-
rating the Lau Basin and Havre Trough (Figure
1), it predicts compression farther south. This
observation implies that the extension in the
Havre Trough and Taupo Rift is not copolar
with the Lau Basin opening as described by the
A-T pole; i.e., that the Tonga Ridge is rotating
away from the Lau Ridge faster than an extrap-
olation of Havre Trough opening rates would
imply (Figure 1).
[41] In addition, geodetically determined rates
of Pacific-Tonga motion range from 150 mm/yr
at 218S to 240 mm/yr at 168S [Bevis, 1997]. We
have shown that the three-plate kinematic
model for Lau Basin opening, and particularly
the A-T Euler pole and rates, are compatible
(within one or two standard errors) to the geo-
detically determined A-T plate velocities. We
conclude that subduction of the Pacific Plate at
the Tonga Trench has been at these fast rates
for at least 0.78 Ma.
8. Conclusions
[42] 1. Motions across the ELSC and the PR/
LETZ/CLSC plate boundaries are not copolar.
We define a three-plate system (A-N-T) whose
kinematics statistically match Lau Basin (1)
Brunhes spreading rates, (2) spreading center
and transform fault azimuths, (3) earthquake
focal mechanism slip vectors, and (4) geodeti-
cally determined A-T velocities.
[43] 2. Seafloor spreading rates and azimuths of
the ELSC, and earthquake slip vectors of rifting
events, are compatible (within one or two stand-
ard errors) with the geodetically determined
A-T velocities of Bevis [1997]. By extension,
the geodetically determined Pacific-Tonga rates
of subduction (240 mm/yr at 168S [Bevis,
1997]) are applicable for at least 0.78 Myr.
During this time the angular rate of opening of
the Lau Basin has been faster than that of the
Havre Trough.
[44] 3. Rates of southward propagation of the
CLSC to 188570S are estimated at 120 mm/yr
according to our case 2b A-N pole. South of
188570S, the tectonic tip has rapidly migrated
south at a rate similarly estimated to be 320
mm/yr.
[45] 4. The newly recognized Niuafo'ou micro-
plate lacks a well-defined plate boundary on its
southern border, which may be migrating
southward with the propagating CLSC and its
overlap zone with the ELSC. Nevertheless,
teleseismic earthquakes have not been recorded
in the interior of the microplate, which is
compatible with our three-plate kinematic
model in which A-T motion from 15.58S to
198S is partitioned between A-N motion on PR/
LETZ/CLSC and N-T motion on the FRSC.
Additional microplates and/or deformation
zones are present in a borderland region of
strike-slip seismicity further north.
[46] 5. The poles describing the motions of the
Niuafo'ou microplate relative to Australia and
Tonga may have changed slightly within the
last 0.78 Myr, as might be expected given that
GeochemistryGeophysicsGeosystems G3G3 zellmer and taylor: three-plate kinematic model 2000GC000106

both the CLSC and FRSC are propagating
southward and that the FRSC has reoriented
within the Brunhes chron.
Acknowledgments
[47] The geophysical data compilation required as the
basis for this kinematic analysis would not have been
possible without the generous contributions, often prior to
other publication, of numerous individuals and institu-
tions including the following: Michael Bevis, Sherman
Bloomer, Toshiya Fujiwara, Andrew Goodliffe, Alistair
Harding, John Hughes Clarke, Graham Kent, Fernando
Martinez, Lindsay Parson, Christine Peirce, David
Phillips, Etienne Ruellan, Martin Sinha, Dawn Wright,
Toshitsugu Yamezaki, Metal Mining Agency of Japan,
and the South Pacific Applied Geoscience Commission.
Andrew Goodliffe merged the acoustic reflectivity data
reproduced in Figure 5. Fernando Martinez, Andrew
Goodliffe, and Steve Martel provided insightful advice
throughout this project. Constructive reviews by Lindsay
Parson, Dan Scheirer (in particular), and Don Forsyth (the
Associate Editor) significantly improved the final manu-
script. This work was supported by a grant from the
National Science Foundation.
References
Bevis, M., Geodetic measurements in the Tonga-Lau arc
system (abstract), Eos Trans. AGU, 78, 697±698, 1997.
Bevis, M., F. W. Taylor, B. E. Schutz, J. Recy, B. L.
Isacks, S. Hely, R. Singh, E. Kendrick, J. Stowell, B.
Taylor, and S. Calmant, Geodetic observations of very
rapid convergence and back-arc extension at the Tonga
arc, Nature, 374, 249±251, 1995.
Caress D. W., and Chayes D. N. New software for pro-
cessing sidescan data from sidescan-capable multibeam
sonars, Proc. IEEE Oceans 95 Conf., 997±1000, 1995.
Chase, C. G., Tectonic history of the Fiji Plateau, Geol.
Soc. Am. Bull., 82, 3087±3110, 1971.
Defense Mapping Agency Hydrographic/Topographic
Center, Tonga Islands DMA Chart 83560, Washington
D. C., 1990a.
Defense Mapping Agency Hydrographic/Topographic
Center, Fiji-Iles de Horne DMA, Chart 83034, Wa-
shington, D. C., 1990b.
Efron, B., and R. Tibshirani, Bootstrap methods for stan-
dard errors, confidence intervals, and other measures of
statistical accuracy, Stat. Sci., 1, 54±77, 1986.
Eguchi, T., Microearthquakes and tectonics in an active
back-arc basin: The Lau Basin, Phys. Earth Planet. In-
ter., 56, 210±229, 1987.
Fujiwara, T., T. Yamazaki, and M. Joshima, Bathymetry
and magnetic anomaly of the Havre Trough and south-
ern Lau Basin: From rifting to spreading in back-arc
basins, Earth Planet Sci. Lett., 185, 253±264, 2001.
Hamburger, M. W., and B. L. Isacks, Diffuse back-arc
deformation in the southwestern Pacific, Nature, 332,
599±604, 1988.
Harding, A. J., G. M. Kent, and J. A. Collins, Initial results
from a multichannel seismic survey of the Lau back-arc
basin (abstract), Eos Trans. AGU, 81, F1115, 2000.
Hawkins, J. W., and S. Helu, Polymetallic sulphide de-
posit from `̀ black smoker'' chimney: Lau Basin, Eos
Trans. AGU, 67, 378, 1986.
Hill, P. J., and D. L. Tiffin, Geology, sediment patterns,
and widespread deformation on the sea floor off Western
Samoa revealed by wide-swath imagery, Geo Mar Lett.,
13, 116±125, 1993.
Hughes Clarke, J. E., P. Jarvis, D. Tiffin, R. Price, and L.
Kroenke, Tectonic activity and plate boundaries along
the northern flank of the Fiji Platform, Geo-Mar. Lett.,
13, 98±106, 1993.
Isacks, B., J. Oliver, and L. R. Sykes, Seismology and the
new global tectonics, J.Geophys. Res., 73, 5855±5899,
1968.
Karig, D., Ridges and basins of the Tonga-Kermadec Is-
land arc system, J. Geophys. Res., 75, 239±254, 1970.
Lawver, L. A., and J. W. Hawkins, Diffuse magnetic
anomalies in the marginal basins: Their possible tectonic
and petrologic significance, Tectonophysics, 45, 323±
339, 1978.
Lawver, L. A., J. W. Hawkins, and J. G. Sclater, Magnetic
anomalies and crustal dilation in the Lau Basin, Earth
Planet Sci. Lett., 33, 27±35, 1976.
Lonsdale, P., Structural pattern of the Galapagos Micro-
plate and evolution of the Galapagos Triple Junctions, J.
Geophys. Res., 93, 13,551±13,574, 1988.
Macdonald, K. C., S. P. Miller, S. P. Heustis, and F. N.
Spiess, Three-dimensional modeling of a magnetic re-
versal boundary from inversion of Deep-Tow measure-
ments, J. Geophys. Res., 85, 3670±3680, 1980.
Martinez, F., P. Fryer, N. A. Baker, and T. Yamazaki,
Evolution of backarc rifting: Mariana Trough, 208±
248N, J. Geophys. Res., 100, 3807±3927, 1995.
Morton, J. L., and N. H. Sleep, Seismic reflections from a
Lau Basin magma chamber, in Geology and Offshore
Resources of Pacific Island Arcs-Tonga Region, edited
by D. Scholl and T. Vallier, pp. 441±453, Circum-Pa-
cific Counc. for Energy and Mineral Resour., Houston,
Tex., 1985.
Murton, B. J., and L. M. Parson, Segmentation, volcanism
and deformation of oblique spreading centres: A quan-
titative study of the Reykjanes Ridge, Tectonophysics,
222, 237±257, 1993.
GeochemistryGeophysicsGeosystems G3G3 zellmer and taylor: three-plate kinematic model 2000GC000106
Parker, R. L., The rapid calculation of potential anoma-
lies, Geophys. J. R. Astron. Soc., 31, 447±455, 1972.
Parker, R. L., and S. P. Heustis, The inversion of magnetic
anomalies in the presence of topography, J. Geophys.
Res., 79, 1587±1593, 1974.
Parson, L. M., and J. W. Hawkins, Two-stage ridge pro-
pagation and the geological history of the Lau backarc
basin, Proc. Ocean Drill. Program Sci. Results, 135,
819±828, 1994.
Parson, L. M., and D. L. Tiffin, Northern Lau Basin:
Backarc extension at the leading edge of the Indo-Aus-
tralian Plate, Geo Mar Lett., 13, 107±115, 1993.
Parson, L. M., and I. C. Wright, The Lau-Havre-Taupo
back-arc basin: A southward propagating, multi-stage
evolution from rifting to spreading, Tectonophysics,
263, 1±22, 1996.
Parson, L. M., J. A. Pearce, B. J. Murton, and R. A.
Hodkinson, and the RRS Charles Darwin Scientific
Party, Role of ridge jumps and ridge propagation in
the tectonic evolution of the Lau back-arc basin, south-
west Pacific, Geology, 18, 470±473, 1990.
Parson, L. M., J. W. Hawkins, and P. M. Hunter, Mor-
photectonics of the Lau Basin Seafloor Ð Implications
for the opening history of backarc Basins, Proc. Ocean
Drill. Program Initial Rep., 135, 81±82, 1992.
Pearce, J. A., M. Ernewein, S. H. Bloomer, L. M. Parson,
B. J. Murton, and L. E. Johnson, Geochemistry of Lau
Basin volcanic rocks: Influence of ridge segmentation
and arc proximity,in Volcanism Associated with Exten-
sion at Consuming Plate Margins, edited by J. L.
Smellie, Geol. Soc. Spec. Publ., 81, 53±75, 1995.
Pelletier, B., S. Calmant, and R. Pillet, Current tectonics
of the Tonga-New Hebrides region, Earth Planet Sci
Lett., 164, 263±276, 1998.
Pelletier, B., Y. Lagabrielle, M. BenoõÃt, G. Cabioch, S.
Calmant, E. Garel, C. Guivel, and J. Perrier, Newly
discovered active spreading centers along the North Fiji
Transform Zone (Pacific-Australia Plates Boundary):
Preliminary results of the R/V l'Atalante ALAUFI
cruise (February± March 2000), Ridge Events, 11(1),
7±9, 2001.
Smith, W. H. F., and D. T. Sandwell, Global sea floor
topography from satellite altimetry and ship depth
soundings, Science, 277, 1956±1962, 1997.
Taylor, B., and G. D. Karner, On the evolution of margin-
al basins, Rev. Geophys., 21, 1727±1741, 1983.
Taylor, B., K. Crook, and J. Sinton, Extensional transform
zones and oblique spreading centers, J. Geophys. Res.,
99, 19,707±19,718, 1994.
Taylor, B., K. Zellmer, F. Martinez, and A. Goodliffe,
Sea-floor spreading in the Lau back-arc basin, Earth
Planet Sci. Lett., 144, 35±40, 1996.
Tiffin, D. L., Tectonic and structural features of the Paci-
fic/Indo-Australian plate boundary in the North Fiji-Lau
Basin regions, southwest Pacific, Geo Mar. Lett., 13,
126±131, 1993.
Turner, I. M., C. Peirce, and M. C. Sinha, Seismic
imaging of the axial region of the Valu Fa Ridge, Lau
Basin-The accretionary process of an intermediate back-
arc spreading ridge, Geophys. J. Int., 138, 495±519,
1999.
Vallier, T. L., et al., Subalkaline andesite from Valu Fa
Ridge, a back-arc spreading center in southern Lau Ba-
sin: Petrogenesis, comparative chemistry, and tectonic
implications, Chem. Geol., 91, 227±256, 1991.
Weissel, J. K., Evolution of the Lau Basin by the growth
of small plates, in Island Arcs Deep Sea Trenches and
Back Arc Basins, Maurice Ewing Ser., vol. 1, edited by
M. Talwani and W. C. Pitman, pp. 429 ±436, AGU,
Washington, D. C., 1977.
Weissel, J. K., Magnetic lineations in marginal basins of
the western Pacific, Philos. Trans. R. Soc. London Ser.
A, 300, 223±247, 1981.
Wessel, P., and W. H. F. Smith, Free software helps map
and display data, Eos Trans. AGU, 72(41), 441±446,
1991.
Wetzel, L. R., D. A. Wiens, and M. C. Kleinrock,
Evidence from earthquakes for bookshelf faulting at
large non-transform offsets, Nature, 362, 235± 237,
1993.
Wiedicke, M., and J. Collier, Morphology of the Valu Fa
Spreading Ridge in the Southern Lau Basin, J. Geophys.
Res., 98, 11,769±11,782, 1993.
Wiedicke, M., and W. Habler, Morphotectonic character-
istics of a propagating spreading system in the northern
Lau Basin, J. Geophys. Res., 98, 11,783±11,797, 1993.
Wilson, D., Motion and deformation of Juan de Fuca
Plate, J. Geophys. Res., 98, 16,053±16,071, 1993.
Wright, D. J., S. H. Bloomer, C. J. MacLeod, B. Taylor,
and A. M. Goodliffe, Bathymetry of the Tonga Trench
and Forearc: A map series, Mar. Geophys. Res., 21,
489±512, 2000.
GeochemistryGeophysicsGeosystems G3G3 zellmer and taylor: three-plate kinematic model 2000GC000106


![Geochemistry Geophysics G Geosystems - Geomaggeomag.org/info/Smaus/Doc/emag2.pdf · 1. Introduction [2] Magnetic anomaly maps provide insight into the subsurface structure and composition](https://static.fdocuments.in/doc/165x107/5b0def527f8b9a2c3b8df9c0/geochemistry-geophysics-g-geosystems-introduction-2-magnetic-anomaly-maps.jpg)