GEO4240: 3D Seismic Interpretation Project...interpretation of base Pliocene). • Study the seismic...
5
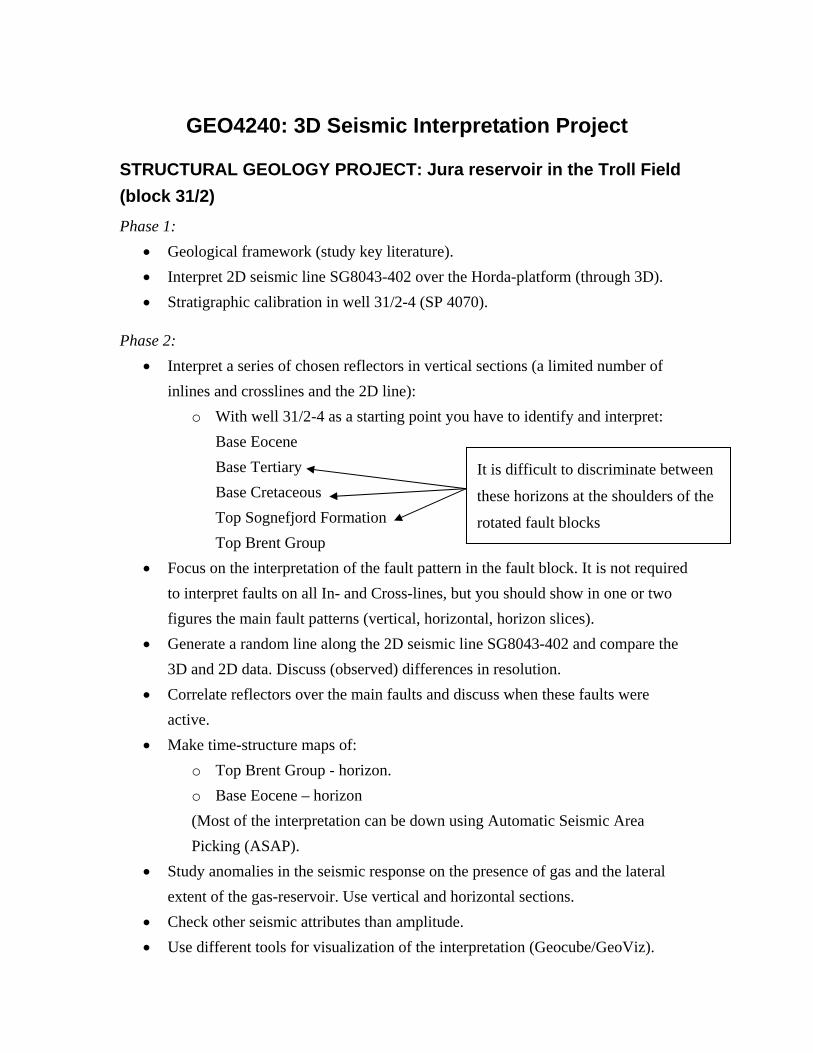
GEO4240: 3D Seismic Interpretation Project STRUCTURAL GEOLOGY PROJECT: Jura reservoir in the Troll Field (block 31/2) Phase 1: • Geological framework (study key literature). • Interpret 2D seismic line SG8043-402 over the Horda-platform (through 3D). • Stratigraphic calibration in well 31/2-4 (SP 4070). Phase 2: • Interpret a series of chosen reflectors in vertical sections (a limited number of inlines and crosslines and the 2D line): o With well 31/2-4 as a starting point you have to identify and interpret: Base Eocene Base Tertiary Base Cretaceous Top Sognefjord Formation Top Brent Group It is difficult to discriminate between these horizons at the shoulders of the rotated fault blocks • Focus on the interpretation of the fault pattern in the fault block. It is not required to interpret faults on all In- and Cross-lines, but you should show in one or two figures the main fault patterns (vertical, horizontal, horizon slices). • Generate a random line along the 2D seismic line SG8043-402 and compare the 3D and 2D data. Discuss (observed) differences in resolution. • Correlate reflectors over the main faults and discuss when these faults were active. • Make time-structure maps of: o Top Brent Group - horizon. o Base Eocene – horizon (Most of the interpretation can be down using Automatic Seismic Area Picking (ASAP). • Study anomalies in the seismic response on the presence of gas and the lateral extent of the gas-reservoir. Use vertical and horizontal sections. • Check other seismic attributes than amplitude. • Use different tools for visualization of the interpretation (Geocube/GeoViz).
Transcript of GEO4240: 3D Seismic Interpretation Project...interpretation of base Pliocene). • Study the seismic...
GEO4240: 3D Seismic Interpretation Project
STRUCTURAL GEOLOGY PROJECT: Jura reservoir in the Troll Field (block 31/2) Phase 1:
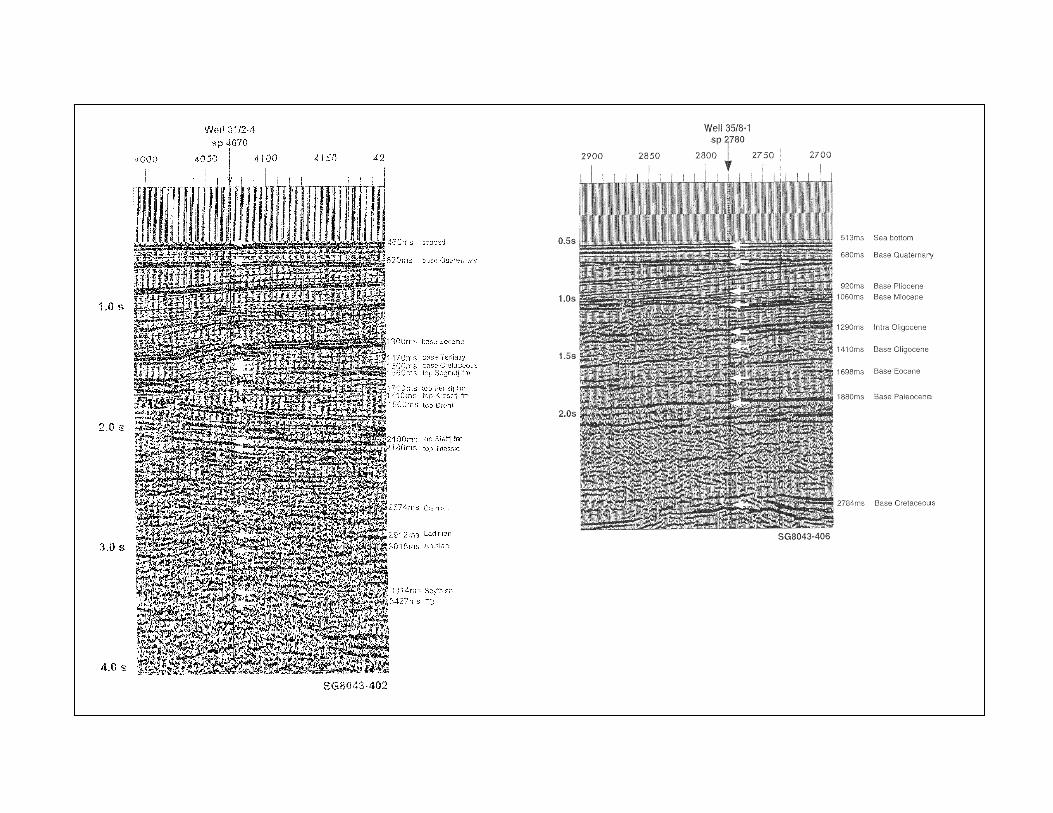
• Geological framework (study key literature). • Interpret 2D seismic line SG8043-402 over the Horda-platform (through 3D). • Stratigraphic calibration in well 31/2-4 (SP 4070).
Phase 2:
• Interpret a series of chosen reflectors in vertical sections (a limited number of inlines and crosslines and the 2D line):
o With well 31/2-4 as a starting point you have to identify and interpret: Base Eocene Base Tertiary Base Cretaceous Top Sognefjord Formation Top Brent Group
It is difficult to discriminate between
these horizons at the shoulders of the
rotated fault blocks
• Focus on the interpretation of the fault pattern in the fault block. It is not required to interpret faults on all In- and Cross-lines, but you should show in one or two figures the main fault patterns (vertical, horizontal, horizon slices).
• Generate a random line along the 2D seismic line SG8043-402 and compare the 3D and 2D data. Discuss (observed) differences in resolution.
• Correlate reflectors over the main faults and discuss when these faults were active.
• Make time-structure maps of: o Top Brent Group - horizon. o Base Eocene – horizon (Most of the interpretation can be down using Automatic Seismic Area Picking (ASAP).
• Study anomalies in the seismic response on the presence of gas and the lateral extent of the gas-reservoir. Use vertical and horizontal sections.
• Check other seismic attributes than amplitude. • Use different tools for visualization of the interpretation (Geocube/GeoViz).
STRATIGRAPHY/SEDIMENTLOGY PROJECT: Miocene channels in block 35/8 Phase 1:
• Geological framework (study key literature). • Interpret 2D seismic line SG8043-406 over the Horda Platform (through 3D). • Stratigraphic calibration of well 35/8-1 (SP 2780)
Phase 2:
• Interpret a series of chosen reflectors in vertical sections (a limited number of inlines and crosslines and the 2D line).
o With well 35/8-1 as a starting point you have to identify and interpret Base Quaternary Base Pliocene Base Miocene Intra Oligocene
• Focus on the interpretation of Miocene channels and Oligocene mud-diapirs. • Generate a random line along 2D seismic line SG8043-406 and compare the 3D
and 2D data. Discuss (observed) differences in resolution. • Make a time-structure map of the base Miocene horizon. • Make a map that shows the thickness of the Miocene sequence (requires
interpretation of base Pliocene). • Study the seismic response and the lateral extent of the Miocene channels and
Oligocene mud-diapirs. Use vertical and horizontal sections and horizon slices. • Check other seismic attributes than amplitude. • Use different tools for visualization of your interpretation (GeoCube).
General guidelines for the interpretation report, course GEO4240 You will write one report per group containing the results of both projects. Each of you should
take the responsibility for one project.
I advice you to read the literature before you start the interpretation. The literature provides you
with a lot of information that directly can help you with your interpretation. Do not wait to long
before you start writing your report. When finished something, write it down!
A typical structure/outline for the report is as follows:
Introduction
Text: Shortly about the objective of and approach to the project
Figures: Location of the research area
Geological setting
Text: Short introduction to the geology (structure, stratigraphy, development) in the
northern North Sea with special emphasis on the main approach to the problem
(see literature list)
Figures: Map + type profile(s) from the key literature
Seismic interpretation
Text: Seismic-well correlation
Interpretation strategy/procedure
Use of different interpretation techniques (Time slice, horizon slice, attributes)
Figures: Seismic section through the well
Seismic examples (different lines, slices)
Results/discussion
2D vs 3D comparisin
Text: Comparison/discussion of seismic resolution
Figures: Random line based on 3D seismic compared with the 2D seismic line present in
the project

Structural or stratigraphic interpretation
Text: Main results and important observations
Figures: Seismic examples (vertical sections, horizontal sections, composed sections,
horizon slices)
Time-structure map on key-horizons (with and without interpolation)
Eventually time-isopach (time-thickness) maps
Attribute maps (dip, azimuth, etc.)
Detailed interpretation
Text: Special phenomena (channels, diapirs, faults, flat spots, etc.)
Figures: Seismic examples
Visualization (3D)
Conclusion
Text: Main results – what have you learnt….?
References