GEO-ENGINEERING PROPERTIES OF LIME TREATED PLASTIC …ethesis.nitrkl.ac.in/6523/1/e-9.pdf ·...
74
GEO-ENGINEERING PROPERTIES OF LIME TREATED PLASTIC SOILS A thesis submitted in partial fulfillment of the requirements for the degree of Master of Technology in Civil Engineering By SUBHASHREE SAMANTASINGHAR Under the guidance of PROF. SURESH PRASAD SINGH DEPARTMENT OF CIVIL ENGINEERING NATIONAL INSTITUTE OF TECHNOLOGY ROURKELA ROURKELA-769008, ORISSA, INDIA MAY 2014
Transcript of GEO-ENGINEERING PROPERTIES OF LIME TREATED PLASTIC …ethesis.nitrkl.ac.in/6523/1/e-9.pdf ·...
GEO-ENGINEERING PROPERTIES OF
LIME TREATED PLASTIC SOILS
A thesis submitted in partial fulfillment of the requirements for the degree of
Master of Technology
in
Civil Engineering
By
SUBHASHREE SAMANTASINGHAR
Under the guidance of
PROF. SURESH PRASAD SINGH
DEPARTMENT OF CIVIL ENGINEERING NATIONAL INSTITUTE OF TECHNOLOGY ROURKELA
ROURKELA-769008, ORISSA, INDIA
MAY 2014
20 1
DEPARTMENT OF CIVIL ENGINEERING NATIONAL INSTITUTE OF TECHNOLOGY ROURKELA
ROURKELA-769008, ORISSA, INDIA
CERTIFICATE
This is to certify that the project entitled “Geo-engineering properties of lime treated plastic
soils” submitted by Subhashree Samantasinghar (Roll No.- 212CE1480) in partial fulfillment
of the requirements for the award of Master of Technology in Civil Engineering (Geotechnical
engineering) during session 2012-14 at National Institute of Technology, Rourkela is an
authentic work carried out by her under my supervision and guidance.
To the best of my knowledge, the matter embodied in this report has not been submitted to any
other university/institute for the award of any degree or diploma.
Date:
Place: Rourkela
Prof. S. P. Singh
Department of Civil Engineering
National Institute of Technology Rourkela

i
ACKNOWLEDGEMENTS
First of all I would like to express my heartfelt gratitude to Prof. S. P. Singh for his able
guidance, support and suggestions throughout the project. I thank NIT Rourkela for giving me
the opportunity to utilize the available resources.
I would like to extend my gratefulness to Dr. S. K. Sarangi, Director and Prof. N. Roy,
Head of the Civil Engineering Department, National Institute of Technology, Rourkela, for their
advice and providing the necessary facilities for my project work.
I am also thankful to all the staff members of Geotechnical Engineering laboratory for their
assistance and co-operation during the course of experimentation.
I am greatly indebted to my parents for their encouragement and endless support that
helped me at every step of life. Their sincere blessings and wishes have enabled me to complete
my work successfully.
Finally yet importantly, I would like to thank all my batch mates who have directly or
indirectly helped me in my project work and shared the moments of joy and sorrow throughout
the period of project work.
I bow to the Devine power, who led me all through.
.
Subhashree Samantasinghar

ii
ABSTRACT
For a long time, we are facing problems like failures of small and big structures. The biggest
problem behind this is swelling soils. This is very unstable soil. Its property varies from hard to
soft and dry to wet. It exhibits swelling and shrinkage with different water content. As a result,
many structures usually face excessive settlement and differential movements, which causes
damage to foundation systems and other structural elements. We are aware about this situation
for a long time, but unable to make improvements due to absence of technologies till now.
Expansive soils are found in many parts of the world like Burma, South Africa, Western USA,
Cuba, Spain, Russia and Indonesia, etc. In India it is found in Rajasthan, Tamilnadu, Madhya
Pradesh, Maharashtra, Gujarat and Orissa.
Plastic soils undergo swelling and shrinkage causes severe distress and damage to the structure
overlaying. Lime has been used as a soil stabilizer from Roman times. Through physico-
chemical modifications, lime can control the plasticity, swelling and shrinkage of soil
effectively. Also, lime can stabilize soil through cementation which increases strength and
stiffness remarkably. This soil modification using lime depends on the type of soil and its
mineralogy, lime content and compaction condition with curing period. The stabilizing effect of
lime has been studied by a number of researchers. The minerals present in the soil has found to
affect the engineering properties of stabilized material and the optimum lime content.
In this work the plasticity characteristics, swell shrinkage properties, compaction characteristics
and strength properties of plastic soils with a wide plasticity range treated with lime has been
evaluated experimentally. Based on the unconfined compressive strength the optimum lime
content of soils has been found out. For this purpose, commercial high plastic clay (i.e.
bentonite) having liquid limit of 340% is mixed with different proportions to a residual soil
having liquid limit 34% and four different soils were synthesized over a wide range of plasticity.
The physical properties of raw soils were found out. The four soils were amended with different
lime content and the index properties as well as engineering properties have been studied by
conducting relevant experiments conforming to Indian standard code of practice. Emphasis was

iii
made to understand the plasticity, swell and shrink characteristics, compaction characteristics
and strength properties of virgin soils and soils amended with different proportions of lime.
Further, the effect of curing period and molding moisture content on unconfined compressive
strength of soils treated with different proportions of lime were evaluated.
Based on the experimental results it is observed that the liquid limit and plasticity reduces as
lime content increases, swell and shrink characteristics decreases with lime content. Also, lime
has a significant effect on strength. Strength of soil increases with lime, but beyond a certain
point, even after increasing lime there is a reduction in strength. High compressive strength is
achieved at the longer curing period. The compressive strength is more on the dry side of
optimum moisture content than wet side, for untreated soil, but when lime is added to the plastic
soils the compressive strength changes depending upon the lime content, moisture content and
curing period.
iv
TABLE OF CONTENTS
CHAPTER PAGE NO.
ACKNOWLWDGEMENTS ………………………………………..…………..………..i
ABSTRACT …………………………………………………………...……....…………ii
TABLE OF CONTENTS …………………………………………………………….….iv
LIST OF TABLES ………………………………………………………………………vii
LIST OF FIGURES …………………………………………………...…………………ix
NOTATIONS AND ABBREVIATIONS ……………………………….……………….xi
1. INTRODUCTION
1.1 INTRODUCTION ………………………………………………………………..1
1.2 EXPANSIVE SOILS …………………………………………………………..…2
1.2.1 Origin and occurrence of expansive soils …………………………..…….2
1.2.2 Problems associated with expansive clay ………………………….……..2
1.2.3 Clay mineralogy ……………………………………………….…….……3
1.2.3.1 Structure of clay minerals …………………………………….…..4
1.2.3.2 Major clay groups………………………………………....………4
1.3 LIME ………………………………………………………………….…………..7
1.4 LIME STABILIZATION ………………………………………….………….…..9
1.4.1 Stabilization mechanism …………………………………………….…..10
1.4.2 Soil –lime reaction ………………………………………………………11
1.4.3 Applications and Benefits of lime stabilization ……………………...….14
2. LITERATUR REVIEW
2.1 INTRODUCTION ……………………..………………………………………..15
2.2 EXPANSIVE SOIL ……………………………………………………………..15
v
2.2.1 Problems associated with expansive soil ……………….……………….16
2.2.2 Identification of expansive soil …………………………...……………..16
2.2.2.1 Standard classification tests ……………………...……..……….17
2.3 LIME STABILIZATION ………………………………………………………..18
2.3.1 Stabilization Mechanism …………………….…………………………..19
2.3.2 Soil – Lime Reactions ………………………...…………………………20
2.3.3 Effects of lime stabilization on geotechnical properties of soil …...…….22
2.4 SCOPE OF PRESENT STUDY ……………………………………………..….24
3. EXPERIMENTAL WORKS AND METHODOLOGY
3.1 INTRODUCTION ………………………………………………..……………..25
3.2 MATERIAL USED ………………………………………………………..……25
3.2.1 Soils …………………………………………….……………………….25
3.2.2 Lime …………………………………………………………….……….26
3.3 SAMPLE PREPARATION AND EXPERIMENTAL PROGRAM ….………...26
3.4 PHYSICAL PROPERTIES OF SOILS ...……………………………….………28
3.4.1 Morphological study of soils ………………………………..…………..29
3.4.2 Mineralogical analysis of soils …………………………………….…….29
3.5 DETERMINATION OF INDEX PROPERTIES
3.5.1 Determination of Specific Gravity ………………………………………31
3.5.2 Determination of Grain Size Distribution ……………………………….31
3.6 DETERMINATION OF ENGINEERING PROPERTIES
3.6.1 Determination of Atterberg Limits ………………………..…………….33
3.6.1.1 Liquid limit …………………………………………….……..…33
3.6.1.2 Plastic limit ………………………………………….………..…34
3.6.1.3 Plasticity index ……………………………………….……….…35
3.6.2 Determination of Free Swell Index …………………………..………….35
3.6.3 Determination of Linear shrinkage …………………………..………….36
3.6.4 Determination of compaction characteristics ……………………………37
3.6.5 Determination of Unconfined Compressive Strength ……………..…….38

vi
4. RESULT AND DISCUSSION
4.1 INDEX PROPERTIES
4.2.1 Specific gravity ………………………………………………….………43
4.2.2 Grain size distribution …………………….………………………….….43
4.2 ENGINEERING PROPERTIES
4.2.1 Atterberg limits ………………………………………………………….43
4.2.1.1 Liquid limit …………………………………………….……..…43
4.2.1.2 Plastic limit ………………………………………….………..…44
4.2.1.3 Plasticity index ……………………………………….……….…45
4.2.2 Free swell index ……………...………………………………………….45
4.2.3 Linear shrinkage …………………………………………………………46
4.2.4 Compaction characteristics ………………………………...……………47
4.2.5 Unconfined compressive strength ………………..……………….……..49
4.2.5.1 Effect of curing on strength of soil ……………………………...49
4.2.5.2 Effect of moisture content on strength of soil ……………….…..53
5. CONCLUSION
5.1 SUMMARY ………………………………………………….………………….57
5.2 CONCLUSIONS ………………………………………………………………..57
5.3 SCOPE OF FUTURE WORK ………………………………..…………………58
REFERENCES ………………………………………………………...………………..59
vii
LIST OF TABLES
TABLE PAGE NO.
Table 2.1 Expansive soil classification based on the liquid limit and plasticity index …….17
Table 2.2 Expansive soil classification based on differential free swell …………………..17
Table 2.2 Expansive soil classification based on linear shrinkage ………………………...18
Table 3.1 IS classification of soil ……………………………………………………….….25
Table 3.2 Test program for soils ……………………………………………………….…. 27
Table 3.3 Engineering properties of soils showing IS classification …………………..…..28
Table 3.4 Physical properties of soils ……………………………………………….….….28
Table 3.5 Qualitative mineralogical composition of materials …...….………………..…...29
Table 3.6 Specific Gravity of the materials ………………………………………………..31
Table 3.7 Liquid limit of soils for different lime content ………………………..…. …….34
Table 3.8 Plastic limit of soils for different lime content ………………..…………...........34
Table 3.9 Plasticity index of soils for different lime content ………………..……………..35
Table 3.10 Free swell index of soils for different lime content ………………………..……36
Table 3.11 Linear shrinkage of soils for different lime content ……………………..….…...37
Table 3.12 Compaction characteristics of soils for different lime content ……….….….…..38
Table3.13 Compressive strength of lime stabilized soil (100%ES) for different curing
periods ……………………………..…………………………………………….40
Table 3.14 Compressive strength of lime stabilized soil mix (50%ES+50%RS) for different
curing periods …………….……….......………………...…………………...…..40
Table 3.15 Compressive strength of lime stabilized soil mix (10%ES+90%RS) for different
curing periods …………...……………………………………………………….40
Table 3.16 Compressive strength of lime stabilized soil (100%RS) for different curing
periods ………………...…………………………...………………………….…41
Table3.17 Compressive strength of lime stabilized soil (100% ES) for varying moisture
contents ………………………………………………………………………….41
viii
Table 3.18 Compressive strength of lime stabilized soil mix (50%ES+50%RS) for varying
moisture contents ……………………………………………………………..…42
Table 3.19 Compressive strength of lime stabilized soil mix (10%ES+90%RS) for varying
moisture contents ………………………………………………………………..42
Table 3.20 Compressive strength of lime stabilized soil (100%RS) for varying moisture
contents ……………………………………………………………………….…42
Table 4.1 Summary of optimum lime content giving maximum strength for soils cured at
different curing periods ………………………………………………….……....53
Table 4.2 Summary of optimum lime content giving maximum strength for soils compacted
at different moisture contents …………………………………………….……...56

ix
LIST OF FIGURES
FIGURE PAGE NO.
Figure 1.1 Basic units of clay minerals ………………………………………………………4
Figure 1.2 (a) Silica sheet and (b) Octahedral sheet ………………………………...………..4
Figure 1.3 Structure of Kaolinite ………………………………………………………….….5
Figure 1.4 Structure of Illite ………………………………………………………………....6
Figure 1.5 Structure of Montmorillonite …………………………………………………..…7
Figure 1.6 Formation of diffused water layer around clay particle …………………………11
Figure 1.7 Molecular structure in (a) untreated clay (b) treated clay ……………………….13
Figure 3.1 Casagrande’s plasticity chart for laboratory classification of fine-grained
soil………………………..………………………………………………………26
Figure 3.2 SEM of (a) Bentonite and (b) Residual soil ……………………….........……….29
Figure 3.3 XRD analysis for (a) Bentonite, (b) Residual soil and (c) Lime ……..…………31
Figure 3.4(a) Grain size distribution curve for bentonite ……………..……………………….32
Figure 3.4(b) Grain size distribution curve of residual soil ………………………………..…..33
Figure 3.5 Liquid limit and plastic limit test for soil ………………………………………..34
Figure 3.6 Free swell test for soil ………………………………………………………...…36
Figure 3.7 Linear shrinkage moulds ……………………….…………………….………….37
Figure 3.8 Compaction test for soil ……………………………………………………..…..38
Figure 3.9 UCS test samples ………………..………………………….…………….....…..39
Figure 4.1 Variations in liquid limit with lime content ………………………………..……44
Figure 4.2 Variations in plastic limit with lime content ………………………………...…..44
Figure 4.3 Variations in plasticity index with lime content …………………………….…..45
Figure 4.4 Variation in free swell index with lime content …………………………………46
Figure 4.5 Variations in linear shrinkage with lime content ……………………………..…46
Figure 4.6 Compaction curves for different soils ……..…………………………………….47
Figure 4.7 Variations in optimum moisture content with lime content ….…………………48
Figure 4.8 Variation in maximum dry density with lime content ………………...……….48

x
Figure 4.9 Stress-strain curves for untreated soils ……………….…………..….……...….49
Figure 4.10 Variation in UCS for lime stabilized soil (100%ES) at different curing period
………...………………………...………………………………...…….….…….50
Figure 4.11 Variation in UCS for lime stabilized soil mix (50%ES+50%RS) at different
curing period ………………………………….……………...……………...…..51
Figure 4.12 Variation in UCS for lime stabilized soil mix (10%ES+90%RS) at different
curing period ………………………………………………...…………………..52
Figure 4.13 Variation in UCS for lime stabilized soil (100%RS) at different curing
period…………………………………………………………...…….……….…52
Figure 4.14 Variation in UCS with moisture content for untreated soils …………….……..53
Figure 4.15 Variation in UCS with moisture content for lime stabilized soil (100%ES)
……………………………………………..……………....………………….….54
Figure 4.16 Variation in UCS with moisture content for lime stabilized soil mix
(10%ES+90%RS) ...…………………….......…………………………….……..54
Figure 4.17 Variation in UCS with moisture content for lime stabilized soil mix
(50%ES+50%RS) ..……………………...…………………………………..…..55
Figure 4.18 Variation in UCS with moisture content for lime stabilized soil (100%RS)
………………………………………….………………...………………………55
xi
NOTATIONS AND ABBREVIATIONS
Cc Co-efficient of curvature
CH Clay of high plasticity
CI Clay of medium plasticity
CL Clay of low plasticity
Cu Co-efficient of uniformity
ES Expansive soil
FSI Free swell index
G Specific gravity
IP Plasticity index
IS Shrinkage index
LSI Linear shrinkage
MDD Maximum dry density
OMC Optimum moisture content
RS Residual soil
UCS Unconfined compressive strength
WL Liquid limit
WP Plastic limit
1
CHAPTER 1
INTRODUCTION
1.1 INTRODUCTION
Soil is one of the most commonly encountered materials in civil engineering. All the structures
except some, which are founded on solid rock, rest ultimately on soil. Geotechnical engineers all
over the world face huge issues, when structures founded on the soil which is expansive in
nature. This expansiveness is imparted to such soils when they contain clay minerals like
montmorillonite, illite, kaolinite etc. in considerable amount. Due to the clay minerals, the
swelling soils expand on wetting and subjected to shrinkage on drying. These soils are
commonly unsaturated.
The problem of instability of structures made on such soil is mainly due to lifting up of the
structures on heaving of soil mass under the foundation on saturation during rainy season and
settlement as a result of shrinkage during summer season. Due to this cavity formed, leading to
loss of contact between the soil and structures at some points. This successively results in
splitting of structure and failure due to loss of shear strength or unequal settlement.
On the contrary, during rainy season the foundation soil swells on imbibitions of water and it is
restrained by the foundation. As a result, an upward swelling pressure is exerted by the soil on
the foundation. As this pressure is not uniform everywhere, the net downward pressure becomes
uneven. Similarly, during the summer season the soil shrinks and this phenomena is not uniform
throughout the soil below the foundation. This additionally results unequal settlement, leading to
progressive failure of structures.
Investigation into the properties of lime treated expansive soils would assess the suitability of
using lime as stabilizer to reduce swelling of expansive soils. This paper presents the effect of
lime stabilization on engineering properties of a lime treate
2
d expansive soil. Soil engineering tests like Atterberg limits, differential free swell test,
shrinkage test, strength test were conducted on virgin soil and soil-lime mixture.
1.2 EXPANSIVE SOILS
Expansive soils creates greatest hazard in arid regions. Expansive soils contain clays and fine
silts swells and shrinks as their moisture content changes. These expansive soils created
problems for the structures, mainly lightweight structures and the structures most commonly
damaged are small buildings, roadways, pipelines and irrigation canals.
The moisture in the soils shows variations due to climatic changes, change in water table,
watering of gardens and lawn, presence of trees and shrubs and leakage from water and drainage
pipes.
1.2.1 Origin and occurrence of expansive soils
Clay mineral is that the key component that passes on swelling characteristics to any standard
non-swelling soils. Montmorillonite has the utmost swelling potential among many varieties of
clay minerals. The origin of such soil is sub aqueous decomposition of blast rocks, or weathering
in situ formation of vital clay mineral takes place under alkaline environments. If there is an
adequate supply of magnesium of ferric or ferrous oxides and alkaline environments along with
adequate silica and aluminum attributable to weathering condition, it will favor the formation of
Montmorillonite. The depth is not deeper at the place of formation for clay with the parent rock
beneath. The alluvium deposits may be much deeper in low lying areas, where these soils are
transported and deposited.
1.2.2 Problems associated with expansive clay
For all types of engineering constructions over expansive soils are not appropriate since they
create issues. However, owing to persistence of those kinds of soils in several parts of India,
different irrigation projects are required to be developed on these deposits. Furthermore,
examples of similar issues have also been recognized in many other parts of the globe. Structures
found in these soils are subjected to differential deflections that cause distress on swelling clays
and produce dangerous damage to the buildings and superstructures. Reduction of water content
causes shrinkage by the evaporation of vegetation, whereas a continuous increase in moisture
3
content causes heave in expansive soil like bentonite. The rise of the water table has got a
notable impaction the movement of foundation on expansive soils
Whether a mass of clay has been compacted by nature or by artificial means, it is unlikely to
expand as much vertically as horizontally. Experiments have shown that the compacted clay soils
exhibits greater value of swelling in the horizontal direction than in vertical direction. So
magnitude of difference in swelling soil being very low, the vertical swelling pressure is
calculated to uplift forces on structure. Due to evaporation in dry season the surface gets reduced
surrounding a building which was erected on clayey layer, but a very little evaporation under the
structure. Thus there will be uneven settlement at plinth level, causing danger to structures.
If a structure is constructed around dry season with foundation laying inside the unstable zone,
the foundation base experiences swelling pressure because of partly saturated soil starts intake of
water during rainy season. This swelling pressure has developed as a result of its constraint
offered by the foundation for free swelling. If imposed pressure on the foundation is less than the
swelling pressure by its structure, the structure is probably going to induce lifted up locally,
which will result in cracks within the superstructure and on the other hand if imposed bearing
pressure is larger than the swelling pressure than structure will be safe. If a structure is
constructed during the wet season, it will experience settlement, depending on the dry season,
whether the bearing pressure is low or high. The imposed bearing pressure ought to be within the
allowable bearing pressure within the wet season for the soil. Thus, for higher practice the
structure has to be constructed during dry season and should be finished before the wet season.
1.2.3 Clay mineralogy
Clay minerals, an important group of sheet silicate family of minerals, which are distinguished
by layered structures composed of polymeric sheets of SiO4tetrahedra linked to sheets of (Al,
Mg, Fe)(O,OH)6octahedra. The geotechnical importance of clay minerals stains from their
ubiquity in soils and sediments, high specific surface area, and ion exchange capacities. Clay
minerals tend to dominate the surface chemistry of soils and sediments. The clay minerals form a
difficult group of minerals to study due to their small size, variable structural composition, and
relative slow kinetics of formation and alteration.

4
1.2.3.1 Structure of clay minerals
Clay minerals are primarily the end product produced by chemical weathering of feldspathic
rock. Chemically, these minerals are basically hydrous aluminum silicates, although often the
aluminum atoms are replaced with atoms of 5other elements, such as magnesium, iron,
potassium, or sodium (Duncan, 1992). The atomic structure of a clay mineral is very complex,
and consists of a variety of combinations and arrangements of two basic building blocks called
the silica tetrahedron and the alumina octahedron as shown in Figure 1.1.
Figure 1.1 Basic units of clay minerals (Craig, 1993)
The various building blocks those make a clay mineral are arranged in orderly sheets are shown
in Figure 1.2 (a) and Figure 2 (b). The particular arrangement and chemical compositions of
these building blocks determines the type of clay mineral and its general characteristics.
(a) (b)
Figure 1.2 (a) Silica sheet and (b) Octahedral sheet (Mitchell, 1993)
1.2.3.2 Major clay groups
Clay minerals are grouped according to chemistry, and its interaction with water. The three main
groups of clay are:
a) kaolinite,
b) illite, and
c) montmorillonite.
5
a) Kaolinite
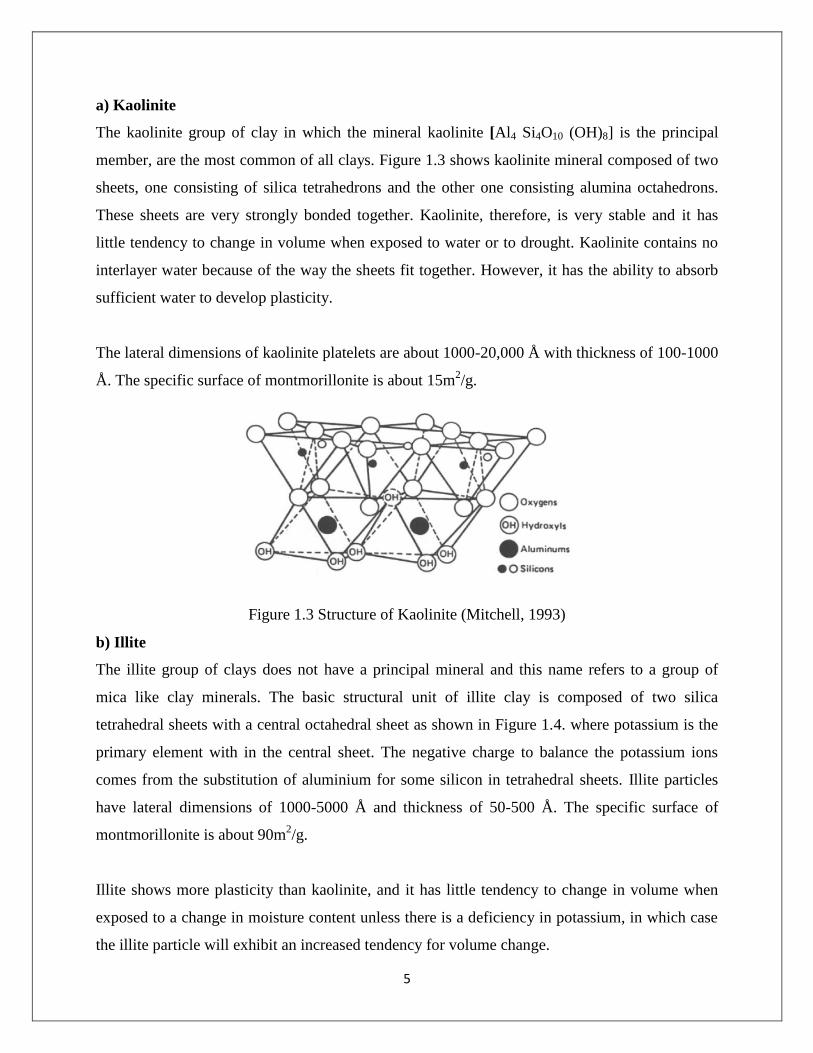
The kaolinite group of clay in which the mineral kaolinite [Al4 Si4O10 (OH)8] is the principal
member, are the most common of all clays. Figure 1.3 shows kaolinite mineral composed of two
sheets, one consisting of silica tetrahedrons and the other one consisting alumina octahedrons.
These sheets are very strongly bonded together. Kaolinite, therefore, is very stable and it has
little tendency to change in volume when exposed to water or to drought. Kaolinite contains no
interlayer water because of the way the sheets fit together. However, it has the ability to absorb
sufficient water to develop plasticity.
The lateral dimensions of kaolinite platelets are about 1000-20,000 Å with thickness of 100-1000
Å. The specific surface of montmorillonite is about 15m2/g.
Figure 1.3 Structure of Kaolinite (Mitchell, 1993)
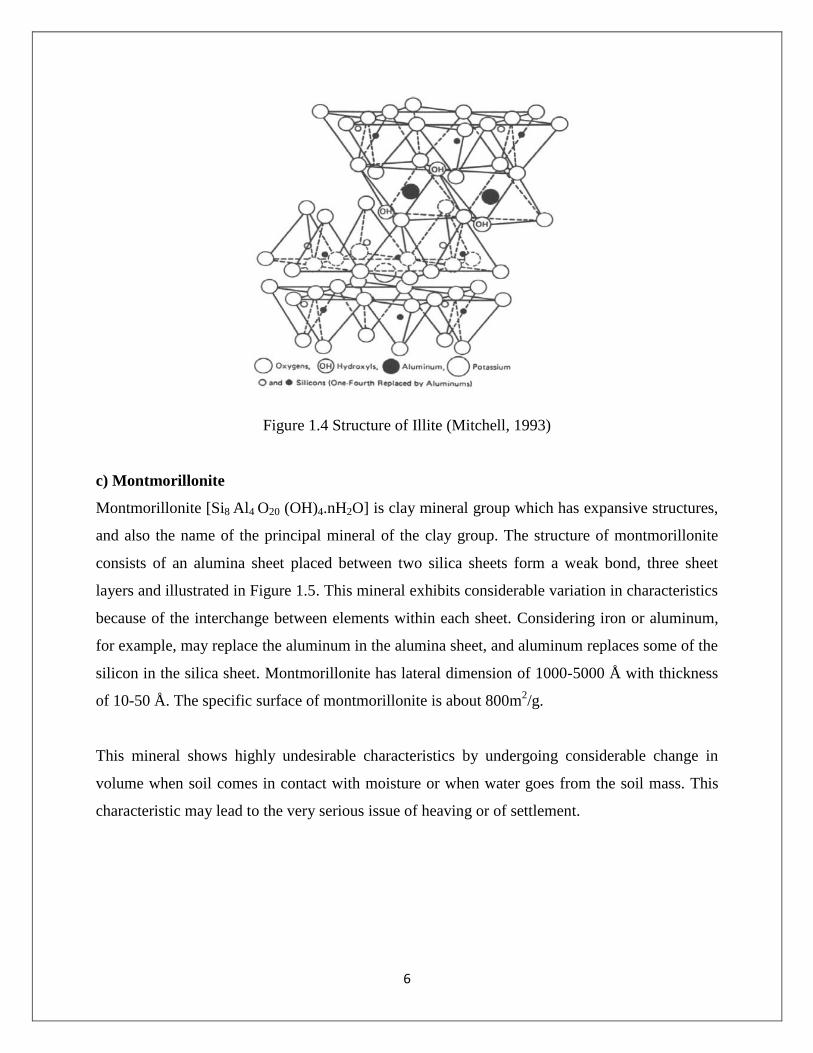
b) Illite
The illite group of clays does not have a principal mineral and this name refers to a group of
mica like clay minerals. The basic structural unit of illite clay is composed of two silica
tetrahedral sheets with a central octahedral sheet as shown in Figure 1.4. where potassium is the
primary element with in the central sheet. The negative charge to balance the potassium ions
comes from the substitution of aluminium for some silicon in tetrahedral sheets. Illite particles
have lateral dimensions of 1000-5000 Å and thickness of 50-500 Å. The specific surface of
montmorillonite is about 90m2/g.
Illite shows more plasticity than kaolinite, and it has little tendency to change in volume when
exposed to a change in moisture content unless there is a deficiency in potassium, in which case
the illite particle will exhibit an increased tendency for volume change.
6
Figure 1.4 Structure of Illite (Mitchell, 1993)
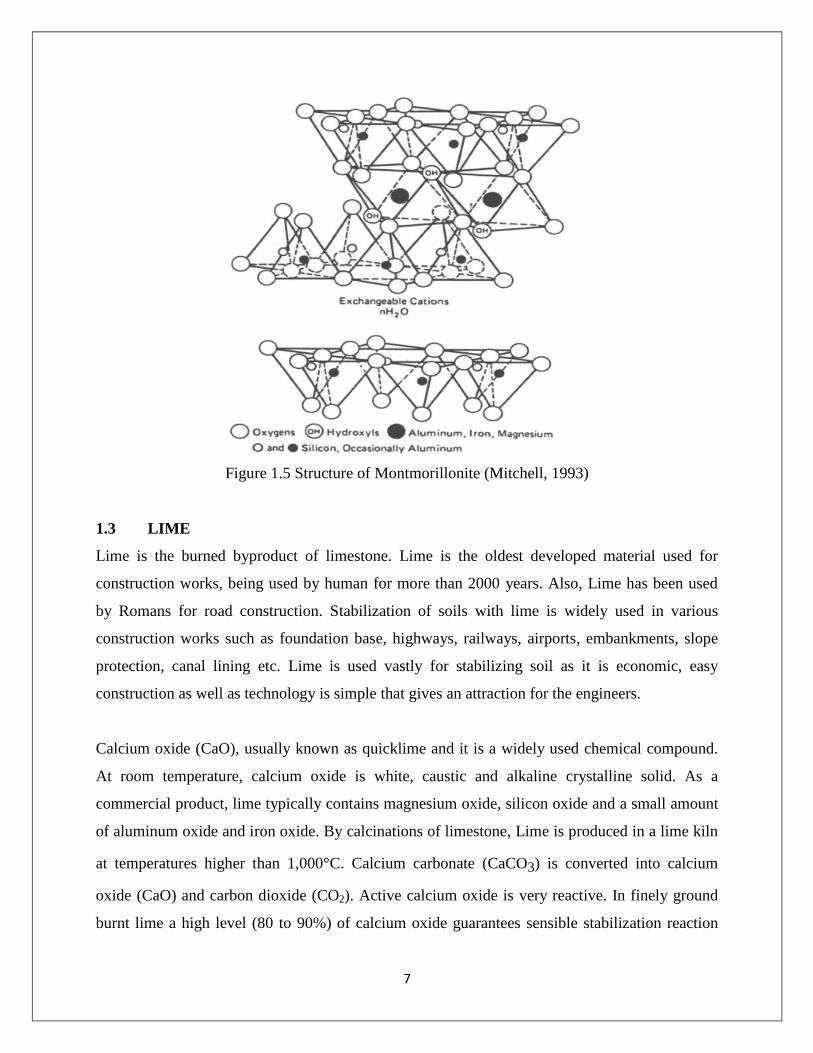
c) Montmorillonite
Montmorillonite [Si8 Al4 O20 (OH)4.nH2O] is clay mineral group which has expansive structures,
and also the name of the principal mineral of the clay group. The structure of montmorillonite
consists of an alumina sheet placed between two silica sheets form a weak bond, three sheet
layers and illustrated in Figure 1.5. This mineral exhibits considerable variation in characteristics
because of the interchange between elements within each sheet. Considering iron or aluminum,
for example, may replace the aluminum in the alumina sheet, and aluminum replaces some of the
silicon in the silica sheet. Montmorillonite has lateral dimension of 1000-5000 Å with thickness
of 10-50 Å. The specific surface of montmorillonite is about 800m2/g.
This mineral shows highly undesirable characteristics by undergoing considerable change in
volume when soil comes in contact with moisture or when water goes from the soil mass. This
characteristic may lead to the very serious issue of heaving or of settlement.
7
Figure 1.5 Structure of Montmorillonite (Mitchell, 1993)
1.3 LIME
Lime is the burned byproduct of limestone. Lime is the oldest developed material used for
construction works, being used by human for more than 2000 years. Also, Lime has been used
by Romans for road construction. Stabilization of soils with lime is widely used in various
construction works such as foundation base, highways, railways, airports, embankments, slope
protection, canal lining etc. Lime is used vastly for stabilizing soil as it is economic, easy
construction as well as technology is simple that gives an attraction for the engineers.
Calcium oxide (CaO), usually known as quicklime and it is a widely used chemical compound.
At room temperature, calcium oxide is white, caustic and alkaline crystalline solid. As a
commercial product, lime typically contains magnesium oxide, silicon oxide and a small amount
of aluminum oxide and iron oxide. By calcinations of limestone, Lime is produced in a lime kiln
at temperatures higher than 1,000°C. Calcium carbonate (CaCO3) is converted into calcium
oxide (CaO) and carbon dioxide (CO2). Active calcium oxide is very reactive. In finely ground
burnt lime a high level (80 to 90%) of calcium oxide guarantees sensible stabilization reaction
8
within the soil, favorable water reduction in the soil and an increase in temperature upon slaking.
Lime can be used in the form of quicklime, hydrated lime, or lime slurry to stabilize the soil.
Quicklime is manufactured chemically by transforming calcium carbonate (limestone – CaCO3)
into calcium oxide. Hydrated lime is formed when quicklime reacts chemically with water.
Hydrated lime reacts with clay Particles and transforms them into a strong cementious matrix
permanently. Mostly the lime used for soil treatment is high calcium lime; it contains not more
than 5 percent magnesium oxide or hydroxide. However, for some cases dolomitic lime is used,
which contains 35 to 46 percent magnesium oxide or hydroxide. Although the magnesium
fraction reacts more slowly than the calcium fraction, dolomitic lime perform well in soil
stabilization.
Sometimes the term “lime” is used to describe agricultural lime that is generally finely ground
limestone, a useful soil modification but not chemically active enough to lead to soil
stabilization.“Lime” is additionally sometimes used to describe byproducts of the lime
manufacturing process such as lime kiln dust, which although contain some reactive lime;
generally have only a fraction of the oxide or hydroxide content of the manufactured product.
The performance of construction work depends on the underlying soils, if it is not stable creates
problem to the structures. By adopting suitable construction techniques and design methods, lime
treatment of the soils can make the unstable soil to stable soil. Lime can be used to modify the
soil of wide range. The reactivity of lime to soil determines the mineralogical properties of soil.
Generally, fine grained soils with plasticity index (more than 10) are considered good for lime
stabilization. Also, soil containing organic material may need additional lime and special
construction techniques adopted. Lime has many effects when mixed with soil:
a) Soil drying,
b) Soil modification, and
c) Soil stabilization.

9
a) Soil drying
Soil drying is a process in which rapid decrease in soil moisture content occur due to
the chemical reaction between water and quicklime. Also, soil drying may happen
due to the addition of dry material into a moist soil.
b) Soil modification
Soil modification effects include: reduction in the plasticity of soil, increases
optimum moisture content, decreases the maximum dry density, improves
compatibility, reduces the soil capacity against swelling and shrinkage, and improved
strength and stability after compaction. These effects usually take place within a short
period of time after the lime is introduced, generally 1 to 48 hours and are more
pronounced in soils with sizable clay content, however may or may not be permanent.
c) Soil stabilization
Lime stabilization occurs in soils containing an appropriate amount of clay and the
mineralogy to produce long-term strength, permanent reduction in shrinkage,
swelling and reduction in soil plasticity with adequate durability to resist the
damaging effects of cyclic freezing and thawing and prolonged soaking.
1.4 LIME STABILIZATION
Stabilization using lime is a longtime practice to modify the characteristics of fine grained soil.
The first field applications in the construction of highway and airfield pavements were reported
in 1950-60. With the proven success of these attempts, the technique was extended as for large
scale soil treatment using lime for stabilization of subgrades also as improvement of bearing
capacity of foundations in the form of lime columns.
Lime stabilization occurs over a longer time period of curing. The effects of lime stabilization
are usually measured after 28 days or longer. A soil that is lime treated additionally may
experience the effects of soil drying and modification. When sufficient amount of lime is added
to the soil, stabilization occurs. Stabilization is different than modification as a remarkable
strength gain occurs by long-term (pozzolanic) reaction, forms calcium silicate hydrate as lime
reacts with silicon and calcium aluminate hydrates produced by aluminates from the clay. This
reaction starts quickly but continues for a longer time period, shows strength gain up to a great
extent as long as the pH of water remains above 10.
10
With increased lime content liquid limit decreases due to suppression of diffuse water layer
surrounding clay particles as electrolyte concentration increases. These results in increasing the
viscosity give resistance against movement of interparticle which in turn increases plastic limit
thus plasticity reduces. Due to long-term stabilization cementitious compounds like calcium
silicate hydrate, calcium alluminium silicate hydrate is formed and improves strength and
stiffness over time. This strength gain occurs up to a certain lime content, after which strength
may reduce.
1.4.1 Stabilization mechanism
When lime is mixed with plastic soil in the presence of water, many reactions occur. Two
immediate reactions: cation exchange, flocculation-agglomeration modifies plasticity and
improves uncured strength and workability. Long-term reaction: pozzolanic reaction is mainly
responsible for strength gain.
Lime is widely used to change the geo-engineering properties of plastic soils. Plastic soils are
more capable of holding large water, negative charges surrounding the clay particles attract the
cations (positive charges) and water dipoles. Thus, there will be an increase in the thickness of
diffuse water layer surrounding the clay particles.
Pozzolanic reaction occurs depending upon the soil characteristics forms cementitious compound
which improves strength and increases durability. Also, this reaction depends largely on curing
period and temperature. The strength improvement is more for a longer time period. The reaction
retards below a temperature below 13 to 16oC and accelerates at higher temperature. However,
the overall strength of soil depends on the soil type, lime content, compaction condition, type of
curing, curing period and curing temperature.

11
Figure 1.6 Formation of diffused water layer around clay particle (Little, 1987)
When lime reacts with atmospheric carbon dioxide, carbonation may occur. This produces
insoluble carbonate which has negative influence on stabilization process and it can be
minimized by avoiding the exposure of lime to air and rainfall.
1.4.2 Soil –lime reaction
Generally fine-grained soil shows cation exchange, flocculation-agglomeration when lime is
added in presence of water. These reactions occur firstly immediately after mixing the lime to the
soil. The following reactions occur when lime is added to the soil:
a) Cation exchange
b) Flocculation
c) Pozzolanic
d) Carboation
a) Cation Exchange
Cation exchange is an important reaction in soil-lime reactions and mainly causes changes
occurring in the plasticity characteristics of soil. The cation replacement takes place in order of
their replacing power
Li +<Na
+<H
+<K
+<NH4
+<Mg
2+<Ca
2+<Al
3+
12
The lower valence cations are replaced by higher valence and smaller cations are replaced by
higher cations having same valence. As sufficient lime is added to the soil, calcium cation from
lime replaces weaker cations from the soil. This cation exchange reduces the thickness of diffuse
water layer surrounding the clay particle thus clay particles comes closer to each other and
flocculation-agglomeration occur. Cation exchange capacity depends on pH of pore water, clay
mineral in the soil. Calcium hydroxide formed due to hydration of quick lime
CaO+H2O→Ca (OH)2+15.6 kcal/mole
It increases the electrolytic concentration and pH of the pore water and dissolves the silicates
(SiO2) and aluminates (Al2O3) from the clay particles. Na+ and other cations adsorbed to the clay
mineral surfaces are exchanged with Ca++
ions.
b) Flocculation
Due to flocculation-agglomeration, the change in texture occurs as clay particles bonded together
and form large size particle. Because of cation exchange electrolyte concentration of water
increases. Soil modification is the net result of cation exchange and flocculation-agglomeration:
1. Reduction of adsorbed water layer and stabilization occurs.
2. Internal friction increases giving higher strength.
3. More workability achieved as plastic soil texture changes to sand like material.
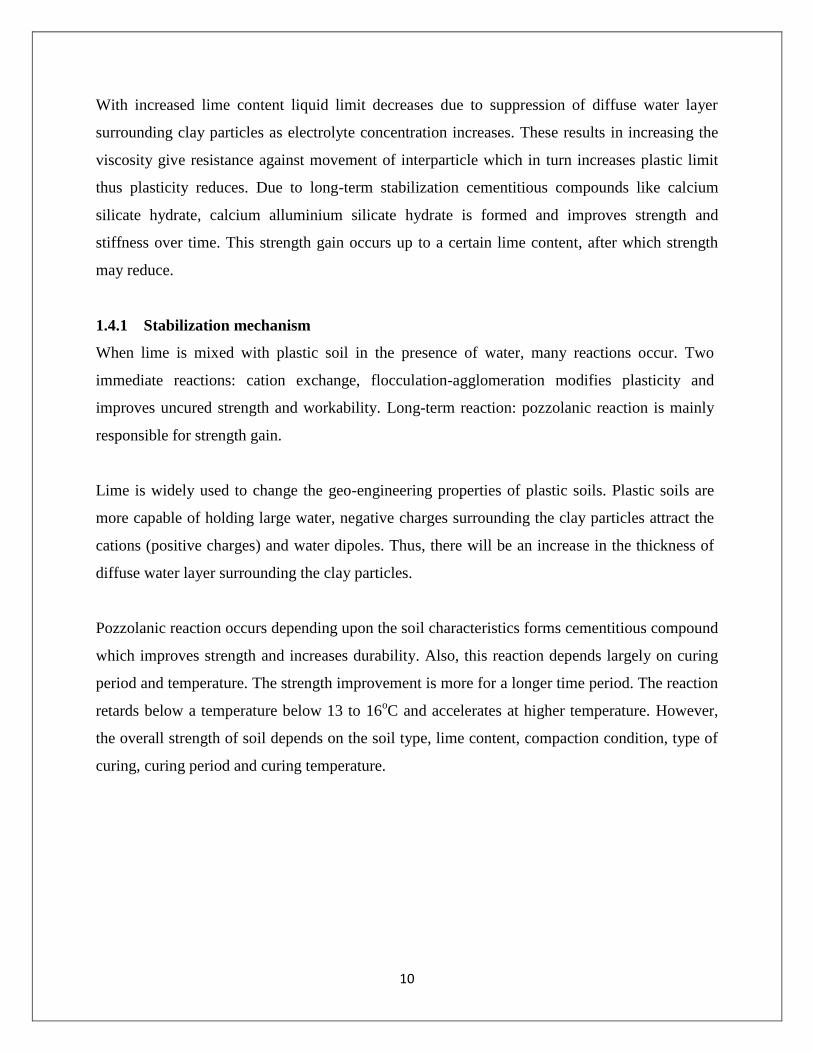
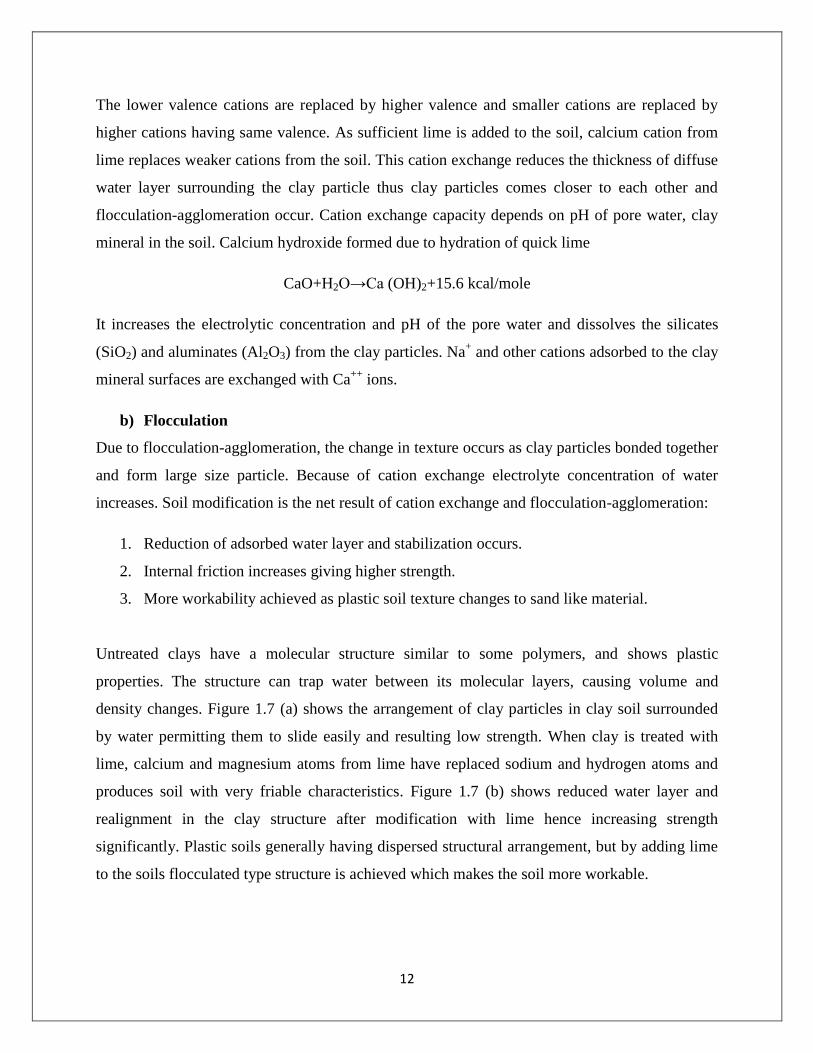
Untreated clays have a molecular structure similar to some polymers, and shows plastic
properties. The structure can trap water between its molecular layers, causing volume and
density changes. Figure 1.7 (a) shows the arrangement of clay particles in clay soil surrounded
by water permitting them to slide easily and resulting low strength. When clay is treated with
lime, calcium and magnesium atoms from lime have replaced sodium and hydrogen atoms and
produces soil with very friable characteristics. Figure 1.7 (b) shows reduced water layer and
realignment in the clay structure after modification with lime hence increasing strength
significantly. Plastic soils generally having dispersed structural arrangement, but by adding lime
to the soils flocculated type structure is achieved which makes the soil more workable.
13
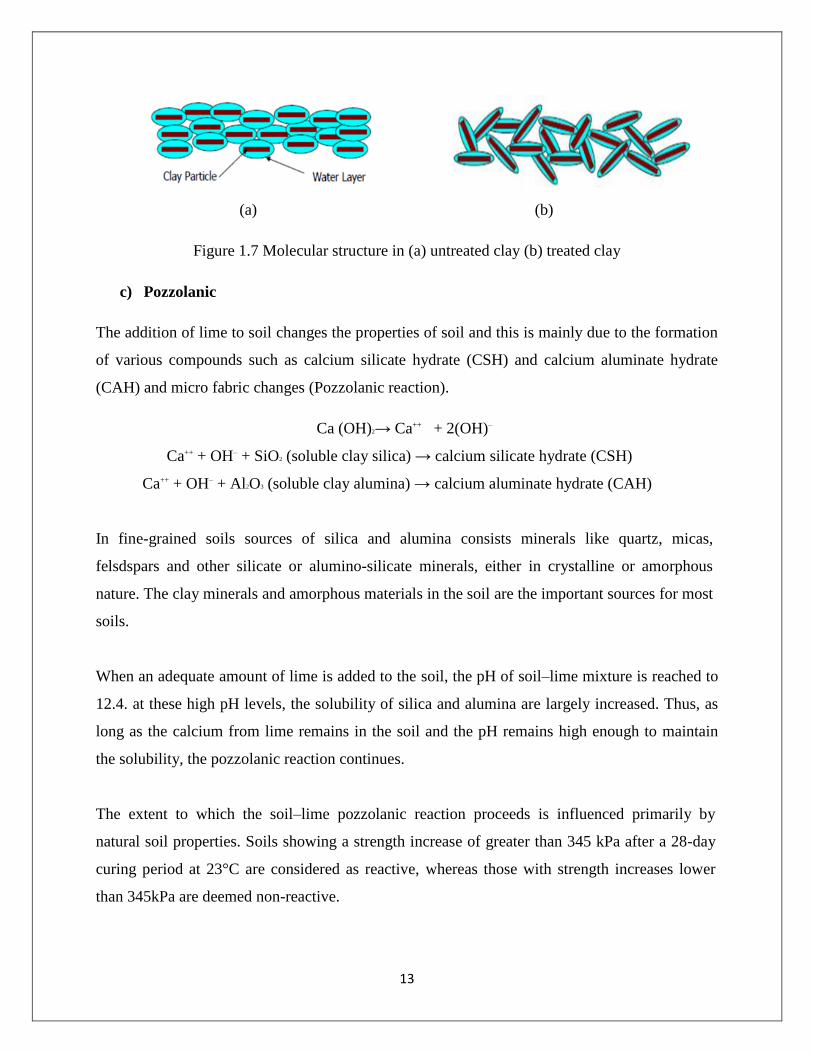
(a) (b)
Figure 1.7 Molecular structure in (a) untreated clay (b) treated clay
c) Pozzolanic
The addition of lime to soil changes the properties of soil and this is mainly due to the formation
of various compounds such as calcium silicate hydrate (CSH) and calcium aluminate hydrate
(CAH) and micro fabric changes (Pozzolanic reaction).
Ca (OH)2→ Ca++ + 2(OH)–
Ca++ + OH– + SiO2 (soluble clay silica) → calcium silicate hydrate (CSH)
Ca++ + OH– + Al2O3 (soluble clay alumina) → calcium aluminate hydrate (CAH)
In fine-grained soils sources of silica and alumina consists minerals like quartz, micas,
felsdspars and other silicate or alumino-silicate minerals, either in crystalline or amorphous
nature. The clay minerals and amorphous materials in the soil are the important sources for most
soils.
When an adequate amount of lime is added to the soil, the pH of soil–lime mixture is reached to
12.4. at these high pH levels, the solubility of silica and alumina are largely increased. Thus, as
long as the calcium from lime remains in the soil and the pH remains high enough to maintain
the solubility, the pozzolanic reaction continues.
The extent to which the soil–lime pozzolanic reaction proceeds is influenced primarily by
natural soil properties. Soils showing a strength increase of greater than 345 kPa after a 28-day
curing period at 23°C are considered as reactive, whereas those with strength increases lower
than 345kPa are deemed non-reactive.

14
Various soil properties and characteristics influence the lime reactivity of a soil, which include
the following:
1. Soil pH 2. Organic carbon content 3. Natural drainage 4. Excessive quantities of exchangeable sodium 5. Clay mineralogy 6. Degree of weathering 7. Presence of carbonates 8. Extractable iron 9. Silica-sesquioxide ratio 10. Silica-alumina ratio
d) Carbonation
Lime carbonation is an unwanted reaction that may also occur in soil–lime mixtures. In this
reaction, lime reacts with carbon dioxide to form calcium carbonate instead of the cementitious
CAHs and CSHs.
1.4.3 Applications and Benefits of lime stabilization
The influence of lime stabilization on engineering properties of soils can be classified as
immediate and long-term modification. Immediate modification involves cation exchange and
flocculation–agglomeration which modifies soil texture and reduces plasticity, swell and shrink
properties. Long-term pozzolanic reaction increases the strength and durability.
Lime is used for various constructions including:
1. Highway construction, airfield pavement and roadways
2. Embankment construction
3. Rural roadways
4. Early & late season construction
5. Parking areas
6. Slope and levee repair
15
CHAPTER 2
LITERATURE REVIEW
2.1 INTRODUCTION
The term expansive soil indicates to soils, which has the tendency to swell when their moisture
content is allowed to increase. The water may come from rain, flooding, leakage of water from
sewer lines or from a reduction in surface evapotranspiration when an area is covered by a
building or pavement. The term cracking soil is also used for these soils as they have the
tendency to shrink and crack when the moisture is allowed to decrease. Soils containing the clay
mineral montmorillonite generally show these properties (Komine and Ogata, 1996; Rao and
Triphaty, 2003).
2.2 EXPANSIVE SOIL
Expansive soils are mostly found in arid and semi-arid regions of the world. The presence of
montmorillonite clay in these soils imparts them swell-shrink potentials (Chen, 1988).
Expansive soils cover nearly 20% of the landmass in India and include almost the entire Deccan
plateau, Western Madhya Pradesh, parts of Gujarat, Andhra Pradesh, Uttar Pradesh, Karnataka,
and Maharashtra (Gopal Ranjan and Rao, 1991).
Expansive soils have been reported from several parts of the world, mainly in the arid or semi-
arid regions of the tropical and temperate zones like Africa, Australia, India, United States and
some regions of Canada. This never means that expansive soils do not exist elsewhere, because
they can be found almost everywhere. In humid regions, ground water tables are present at
shallow depths and moisture changes, which is responsible for changes in volume in soils under
extended drought conditions (Arnold, 1984; Shuai and Fredlund, 1998 and Wayne et al.,
1984).
In general, expansive soils have high plasticity, and are relatively stiff or dense. The expansive
nature of the soil is most obvious near the ground surface where the profile is subjected to

16
seasonal and environmental changes. The pore water pressure is negative initially and the deposit
is generally unsaturated. These soils contain some montmorillonite clay mineral. The expansive
soil problem is dependent on the amount of monovalent cations absorbed to the clay mineral like
sodium (Fredlund and Rahardjo, 1993).
The particles of clay have high negatively charged surfaces that attract free positively charged
cations and water dipoles. Thus, a diffused water layer is formed around the clay particles and
separates the clay particles which make the clay weak and unstable. This phenomenon depends
upon the amount of water present, morphology and mineralogy of the clay. (Little, 1987).
2.2.1 Problems associated with expansive soil
Expansive soils have been called the hidden disaster as the damage cost is more than the
combined damage from natural disaster such as earthquakes, and floods (Jones and Holtz,
1973).
Expansive soils are a worldwide issue that poses many challenges for civil engineers. These are
considered a potential natural hazard, which may cause extensive damage to the structures if not
properly treated. Such soils swell when giving an access to water and shrink after they dry out
(Al-Rawas et al., 2002).
The issues with foundations on expansive soils have included heaving, cracking and break-up of
pavements, roadways, building foundation, slab-on-grade members, channel and reservoir
linings, irrigation systems, water lines, and sewer lines (Cokca, 2001).
It is reported that damage to the structures due to expansive soils has been the most costly natural
hazard in some countries (in United States more than the cost of damage from flooding,
hurricanes, tornados and earthquakes on an average annual basis) for years (Kehew, 1995; Shuai
and Fredlund, 1998).
2.2.2 Identification of expansive soil
In engineering practice, identification of expansive soil is based on standard classification tests
such as liquid limit and plasticity index. However, other laboratory tests such as mineralogical
methods, cation exchange capacity, free swell, California Bearing Ratio, coefficient of linear
17
There are various correlations that are useful in identifying potentially expansive soils. It is also
can be possible to identify them visually. Visual indications include (Wayne et. al., 1984):
1. Deep and wide shrinkage cracks occurring during dry periods
2. Soil is rock-hard when dry, but very sticky and soft when wet
3. Due to expansion of soil damages on the structures.
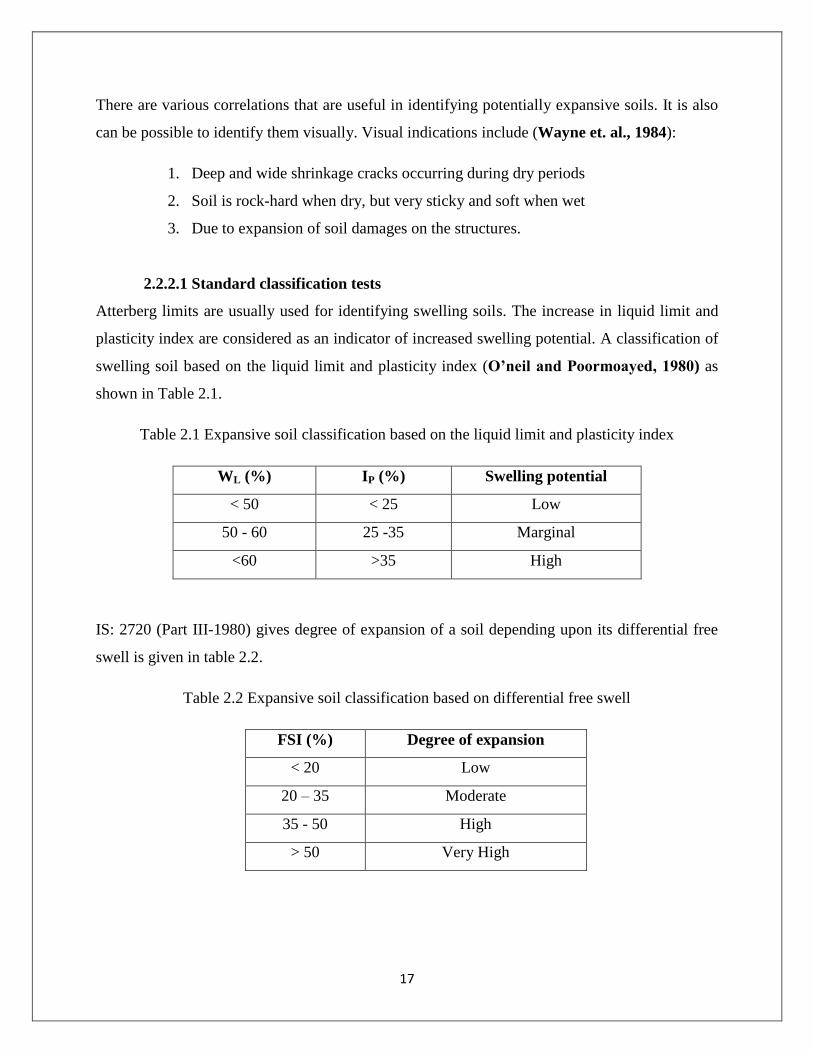
2.2.2.1 Standard classification tests
Atterberg limits are usually used for identifying swelling soils. The increase in liquid limit and
plasticity index are considered as an indicator of increased swelling potential. A classification of
swelling soil based on the liquid limit and plasticity index (O’neil and Poormoayed, 1980) as
shown in Table 2.1.
Table 2.1 Expansive soil classification based on the liquid limit and plasticity index
WL (%) IP (%) Swelling potential
< 50 < 25 Low
50 - 60 25 -35 Marginal
<60 >35 High
IS: 2720 (Part III-1980) gives degree of expansion of a soil depending upon its differential free
swell is given in table 2.2.
Table 2.2 Expansive soil classification based on differential free swell
FSI (%) Degree of expansion
< 20 Low
20 – 35 Moderate
35 - 50 High
> 50 Very High
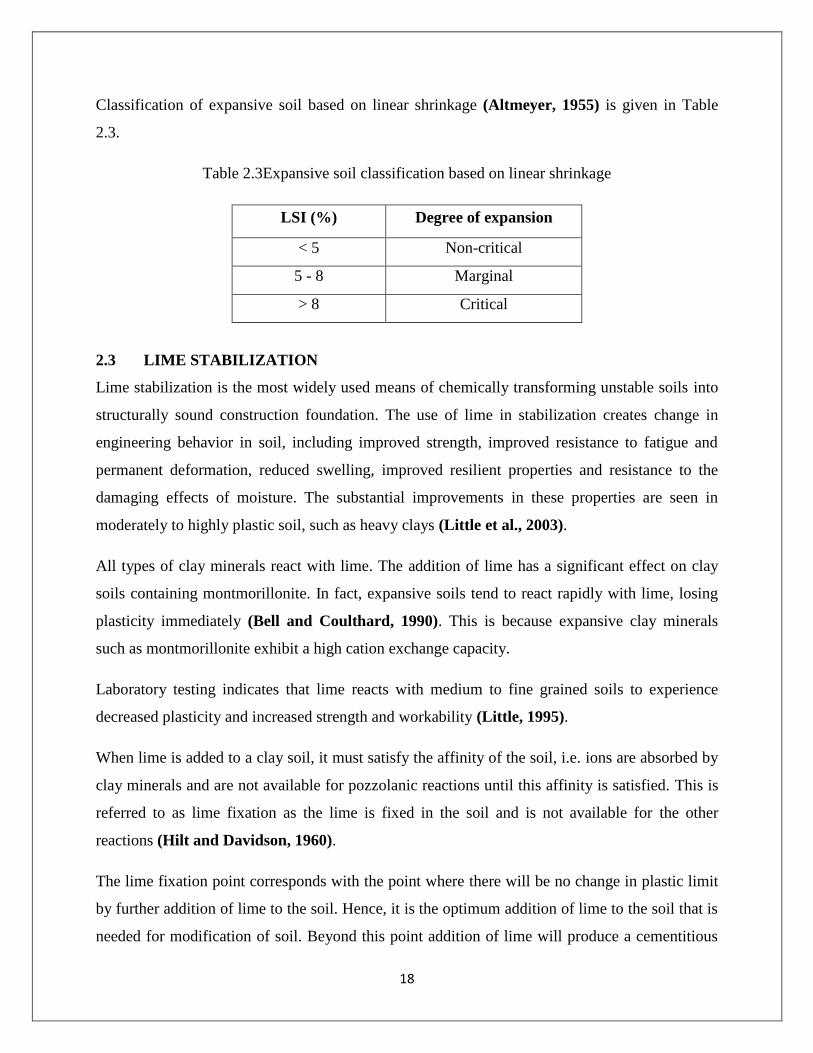
18
Classification of expansive soil based on linear shrinkage (Altmeyer, 1955) is given in Table
2.3.
Table 2.3Expansive soil classification based on linear shrinkage
LSI (%) Degree of expansion
< 5 Non-critical
5 - 8 Marginal
> 8 Critical
2.3 LIME STABILIZATION
Lime stabilization is the most widely used means of chemically transforming unstable soils into
structurally sound construction foundation. The use of lime in stabilization creates change in
engineering behavior in soil, including improved strength, improved resistance to fatigue and
permanent deformation, reduced swelling, improved resilient properties and resistance to the
damaging effects of moisture. The substantial improvements in these properties are seen in
moderately to highly plastic soil, such as heavy clays (Little et al., 2003).
All types of clay minerals react with lime. The addition of lime has a significant effect on clay
soils containing montmorillonite. In fact, expansive soils tend to react rapidly with lime, losing
plasticity immediately (Bell and Coulthard, 1990). This is because expansive clay minerals
such as montmorillonite exhibit a high cation exchange capacity.
Laboratory testing indicates that lime reacts with medium to fine grained soils to experience
decreased plasticity and increased strength and workability (Little, 1995).
When lime is added to a clay soil, it must satisfy the affinity of the soil, i.e. ions are absorbed by
clay minerals and are not available for pozzolanic reactions until this affinity is satisfied. This is
referred to as lime fixation as the lime is fixed in the soil and is not available for the other
reactions (Hilt and Davidson, 1960).
The lime fixation point corresponds with the point where there will be no change in plastic limit
by further addition of lime to the soil. Hence, it is the optimum addition of lime to the soil that is
needed for modification of soil. Beyond this point addition of lime will produce a cementitious
19
compound, which bind the flocculated particles and develops extra strength (Al-Rawas et al.,
2002; Bell, 1996; Mathew and Rao, 1997).
Extended curing times promote pozzolanic reactions, and thereby produce additional cementing
agents (Bell, 1996).The development of cementitious products from pozzolanic reactions should
be a permanent and non-reversible phenomenon.
Pozzolanic reaction continues as pH remains high till sufficient amount of calcium present in
lime to react with silica and alumina (little, 1995).
It has been observed that the amount of silica and alumina present in the clay influences strength
gain i.e. for montmorrilonite lime stabilization is more effective (Lees, 1982).
2.3.1 Stabilization Mechanism
When soil is stabilized with lime, chemical reactions occur between the calcium from lime and
clay minerals from the particles of plastic soil. These chemical reactions may occur in two
phases, with both immediate and long-term benefits.
Cation exchange is the first phase immediate reaction which shows changes in soil texture
immediately. An exchange occurs between calcium from lime and cations from clay mineral,
thus results a suppression in diffuse water layer surrounding the clay particle. This reduction
makes clay particles come closer which in turn causes flocculation and agglomeration and a silt
or sand like material formed.
The long-term reaction is the pozzolanic reaction which results in strength gain. The increase in
pH of pore water occurs due to addition of lime, silica and alumina from clay released from clay
when these become soluble. These react with calcium from lime and form a cementitious
material. This strengthens gradually over time (Eades and Grim, 1960).
There are two major lime stabilization reactions in clay soils, one in the short-term and another
in the long term (Little, 1995). The short term process involves ion exchange between calcium
ions from lime and cations near the surface of clay particle, which occur only if the calcium ion
have a higher charge or if they have a greater concentration than the cations near the clay particle
surface. This ion exchange transforms the soil from a weak dispersed structure to a strong

20
flocculated structure. The long-term pozzolanic reactions begin as an increase in hydroxyl ions
from the lime causes an increase in the pH of the soil water, which will begin to dissolve the
silicate and aluminates sheets of the clay. As the silica and alumina released, they may combine
with calcium from lime to form calcium silicate hydrates and calcium hydrates, which may bind
the clay particles together. Lime has an optimal dosage rate for the maximum possible strength
gain, which depends mainly on soil type and mineralogy.
Little,1995 describes only long-term pozzolanic reactions in the lime stabilization of kaolinite,
while he states that short-term ion exchange must be completed before these same pozzolanic
reactions occur in the lime stabilization of montmorillonite. Therefore, higher dosages of lime
are required to reach the optimal dosage for clays containing more montmorillonite than
kaolinite. Although clays containing montmorillonite may require more lime to reach their
optimal dose, they may be able to achieve higher strengths, since montmorillonite may be more
receptive to pozzolanic reactions due to its high specific surface area, which allows greater
access to silica and/or alumina.
If the lime dosage is so high that the optimal dosage rate is exceeded, the strength gain may
begin to slightly decrease due to a decrease in the dry density of the soil-lime mixture
(Alexander et al. 1972).
2.3.2 Soil – Lime Reactions
The addition of lime to a soil initiates a two stage reaction. Short-term reactions show their effect
right after the addition of lime, while long term reactions are accompanied by a period of time.
The short-term effect of the addition of lime to a clay soil is to cause flocculation and
agglomeration of the clay particles, for cation exchange takes place between the metallic ions of
the clay particles and the calcium ions of the lime. It is this process which is primarily
responsible for the modification of the engineering properties of clay soils when they are treated
with lime (Bell, 1993, 1996).
The long-term reactions are the pozzolanic reactions. The addition of lime to soil produces a
highly alkaline environment, due to the OH- anions from the hydration of lime, which gives rise

21
to a slow solution of silica and alumina from clay particles (Kinuthia et al., 1999; Mathew and
Rao, 1997).
The cementation process develops from the reaction between calcium present in lime and
dissolved silica and alumina from soil, forming calcium-silica-hydrates (CSH), calcium-
alumino-hydrates (CAH), and calcium-alumino-silica-hydrates (CASH) (Nalbantoglu and
Tuncer, 2001).
Ca2+ + 2(OH)- + SiO2 (Clay Silica) CSH
Ca2+ + 2(OH)- + Al2O3 (Clay Alumina) CAH
Ca2+ + 2(OH)- + SiO2 (Clay Silica) + Al2O3 (Clay Alumina) CASH
These cementitious reaction products contribute to flocculation by bonding adjacent soil particles
together and as curing occurs they strengthen the soil. Such pozzolanic reactions are time and
temperature dependent, with strength developing gradually over a long period of time (in some
instances this may take several years).
Apart from pozzolanic reactions, carbonation also results long-term strength increases for soils
stabilized with lime. Carbonation occurs when lime reacts with atmospheric carbon dioxide
produces a relatively insoluble calcium carbonate. This is advantageous after mixing; the slow
process of carbonation and formation of cementitious products can lead to long-term strength
increases (Arman and Munfakh, 1970).
However, prior to mixing, exposure of lime to air should be avoided through proper handling
methods and expedited construction procedures in order to avoid premature carbonation of the
lime (Chou, 1987).
Carbonation is the reaction of lime with carbon dioxide from the air to form weak cementing
agents i.e. calcium carbonate. This is undesirable (Bell, 1993), becoming unstable, calcium-
silica, calcium-alimino alumina, and calcium carbonate if the pH of the lime-stabilized soil drops
sufficiently low. Carbonation reactions are harmful to the long-term strength and durability of
the lime-stabilized soil. Using sufficient amount of lime (to provide enough alkalinity),
compaction of the soil to high density and prompt placement after mixing lime with the soil (to
minimize carbon dioxide penetration) can minimize potential carbonation problems.

22
2.3.3 Effects of lime stabilization on geotechnical properties of soil
A change in soil texture takes place when lime is mixed with clays. With the increase in lime
content, there is an apparent reduction in clay content and a corresponding increase in percentage
of coarse particles (Chen, 1975).
When lime is used to the soil, it improves the engineering properties, and these are due to two
soil-lime reactions i.e. colloidal and pozzolanic reaction.
Colloidal reaction occurs immediately after addition of lime to the soil, which lowers the
plasticity and swelling properties thus, increases workability (Thompson, 1968).
In pozzolanic reaction, pH value increases up to 12. Dissolution of minerals like silica and
alumina from clay occurs and the dissolved substances react with the calcium from lime thus
forms cementitious compounds which help in improving the strength (Ingles, 1964; Yoder and
Witczak, 1975).
The strength improvement in the soil is due to the formation of cementitious compounds like
calcium silicate hydrate (CSH) and calcium aluminate hydrate (CAH) when the soil is stabilized
with lime (Narasimha Rao and Rajesekaran, 1996).
Treatment of fine-grained soil with lime generally results in an increased plasticity index of low-
plasticity soils and the reduction of the plasticity of cohesive soils. The soils become friable and
easy to work (Mateous, 1964; Marks and Haliburton, 1970).
The swelling characteristic of the soil is reduced and the shrinkage limit is increased when lime
is added (Mateous, 1964).
Consistency limit decreases initially with increased lime content, but beyond 5% lime content
there will be a negligible change. As major cementitious compounds formed are gyrolite,
calcium silicate hydrate, and calcium aluminum silicate hydroxide hydrate, lime improves
strength of the soil, but beyond certain limit, further addition of lime strength reduces due to
excess formation of silica gel, a highly porous material (Dash and Hussain, 2012).

23
Liquid limits and plasticity of montmorillonite reduced with the addition of lime. Lime treatment
increases the strength of clay materials. Montmorillonite clays respond much more rapidly to
lime stabilization, and so exhibit earlier gains in strength (Bell, 1996).
The swelling phenomenon in clays is attributed predominantly to the presence of
montmorillonite clay mineral in them. The addition of lime, quicklime (CaO) or hydrated lime
[Ca (OH)2] to expansive soil reduces swelling & swelling pressure and improves strength(Kate,
2009).
The change of expansive soil texture takes place due to the function of cation exchange when
lime is added. Plastic limit increases, liquid limit reduces and the plasticity index decreases when
lime is added (Zhang &Xing, 2002).
The addition of lime to highly plastic clay shows a reduction in shrinkage with increasing
additive percentages. The linear shrinkage decreased from approximately 4 to 7 % with the
addition of 5% lime (Russell, Buhler, Cerato, 2007).
Swelling phenomenon in clays is due to the presence of montmorillonite clay mineral. Bentonite
clay contains sodium montmorillonite as its predominant mineral constituent(Kate, Sunil
Kumar, Bhorkar, 2012).
With the increase in lime content, the maximum dry density of the soil-lime mixes decreases and
optimum moisture content increases. The fall in density is more significant at lower percentages
of lime. Time of curing does not produce much increase in strength upto 4% of lime content
(Arvind Kumar, BaljitsinghWalia, AsheetBjaj, 2007).
Lime reduces the maximum dry density and increases the optimum moisture content of clayey
soils at a given compactive effort (Ladd et al. 1960, Marks and Haliburton 1970).
Strength gain largely depends on the amount of silica and alumina available from the clay itself;
thus, it has been found that lime stabilization is more effective for montmorillonite soils than for
kaolinite soils (Lees et. al, 1982). In a soil-lime mixture the reaction occurring is between lime
and clay minerals. Montmorillonite minerals were shown to require lime in excess of 4-6% of
lime for the development of maximum strength (Eades and Grim, 1960).
24
The plasticity of soil increases with lime as there is an increase in pH. The high alkalinity of soil-
lime mixtures (pH=12) can be considered as being responsible for the modification of soil
behavior (Clare and Cruchley, 1957).
The high alkalinity changes the physico-chemical condition of the mineral surfaces (quick
action), making the development of new cementitious compounds (Rossi et al., 1983), belong
mainly to chemicals such as hydrated tricalcium aluminate, hydrated calcium silicate, hydrated
carbon tetracalcic aluminate, calcium carbonate (calcite), and some unidentified aluminium
silicates.
Some of the cementitious compounds were identified due to treatment of clay with lime using X-
ray diffraction (XRD) studies to be CSHs, CAHs, hillebrandite, etc(Heller and Taylor, 1956;
Midgley, 1957).
In the case of lateritic soils, the more active substances for lime are amorphous silica and
alumina, are the principal components responsible for the reactivity of lateritic soil with lime
(Cabrera and Nwakanma, 1979; Queiroz de Carvalho, 1981, 1983).
2.4 SCOPE OF PRESENT STUDY
Thus, through appraisal of the literature review, it is observed that several attempts have already
been made by researchers to study the effect of additive on stabilization of expansive soil.
However the researches on the plasticity swell and shrink behavior, strength aspect of soils
covering wide ranges of plasticity upon lime stabilization is comparatively less. The
experimental program undertaken investigates:
1. Plasticity characteristics of raw soil and lime treated soil
2. Swell and shrinkage properties of virgin soil and lime stabilized soil
3. Effect of lime on the compaction characteristics of soil
4. Effect of lime content on the strength aspect of lime treated soil.
5. The effect of curing period on unconfined compressive strength values of lime treated
soil
6. The effect of variation in moisture content on unconfined compressive strength of soil

25
CHAPTER 3
EXPERIMENTAL WORK AND METHODOLOGY
3.1 INTRODUCTION
Lime stabilization of plastic soils reduces the problems associated with constructions faced by
the expansiveness of these soils, mostly because of its swell and shrinkage property. So
assessment of the behavior of plastic soil at different condition is required before commencing
the construction activity. Even through adequate substitute for full scale field tests are not
available, tests at laboratory scale provide a measure to control many of the variable encountered
in practice. The trends and behavior pattern observed in the laboratory tests can be used in
understanding the performance of the structures in the field and may be used in formulating
mathematical relationship to predict the behavior of field structures. Details of material used,
sample preparation and testing procedure adopted have been outlined in this chapter.
3.2 MATERIAL USED
An experimental program has been done taking highly expansive montmorillonite soil and a
residual silty soil. Four types of plastic soils have been prepared from the raw soils. These
artificial soils are added with different proportions of lime and a series of tests were conducted.
3.2.1 Soils
Primarily, an expansive soil and a residual soil, which represent the extreme soil type, are used in
this study. The expansive soil is a commercially available bentonite. Its liquid limit and plastic
limit are found to be 340% and 68%. The liquid limit and plastic limit of the residual soil are
found to be 34% and 18% respectively. As per Indian standard soil classification system for fine
grained soil as shown in Figure 3.1, the expansive soil is classified as clay with high plasticity
and the used residual soil is classified as clay with low compressibility following Table 3.1.
Table 3.1 IS classification of soil
Low plasticity WL< 35%
Intermediate plasticity WL< 35% < 50%
High plasticity WL> 50%

26
Figure 3.1 Casagrande’s plasticity chart for laboratory classification of fine-grained soil
3.2.2 Lime
A laboratory hydrated lime [Ca (OH)2] was used as the stabilizing agent. The specific gravity of
the lime used is found to be 2.4.
3.3 SAMPLE PREPARATION AND EXPERIMENTAL PROGRAM
To cover a wide range of plasticity, four different soil samples were constituted by mixing the
expansive soil and residual soil in different proportions (i.e. 100% expansive soil, 50% expansive
soil with 50% residual soil, 10% expansive soil with 90% residual soil, 100% residual soil). All
of these soils amended with different percentage of lime (i.e. 0, 2, 5, 9, 13 percentage by weight
of dry soil) and various engineering properties were studied by conducting the experiments.
Liquid limit tests are done using a mechanical liquid limit device, whereas the plastic limit is
obtained by the thread rolling method as per IS : 2720 (Part 5)-1985. The free swell index is
determined as per IS: 2720(part XL) -1977. The linear shrinkage has been determined as per IS:
2720 (Part 20) - 1992. The Optimum moisture content and dry density of soils were determined
by performing the “standard proctor test” as per IS: 2720 (part VII) - 1965. The strength
improvement of soils will be evaluated using the “unconfined compressive strength (UCS) tests”

27
as per IS: 2720 (part-10)-1991. Also, the change in plasticity, swell and shrink characteristics,
strength by adding lime as additive has been studied by conducting geotechnical experiments on
stabilized soils referring IS: 4332.
The overall testing program is conducted in two phases. In the first phase the index properties
and geotechnical characteristics of the soils were studied by conducting laboratory experiments.
In the second phase, soils are mixed with 2%, 5%, 9% and 13% of lime by dry weight of soil.
The geotechnical properties of these lime stabilized soil samples were evaluated and compared
with that of soil before stabilization. The overall testing program is outlined in Table 3.2.
Table 3.2 Test program for soils
Sl. Test Complying standards Samples Variable Parameters
No. Method
Lime
content
(%) Curing period
(Days)
1.
Liquid and
plastic limit
tests IS:2720(Part 5)-1985 0,2,5,9,13 Immediate LL, PL, PI
2 Free swell
test IS:2720(Part XL)-1977
0,2,5,9,13 Immediate FSI
3.
Linear
shrinkage
test
IS:2720(Part 20)-1992
0,2,5,9,13 Immediate LSI
4.
IS:2720(Part VII)-1980
and 0,2,5,9,13 Immediate OMC, MDD
Light
compaction
test
IS:4332(Part III)-1967
5. UCS test
IS:2720(Part-10)-1991
And
IS:4332(Part V)-1970 0,2,5,9,13 0,7,14,28,60 UCS
28
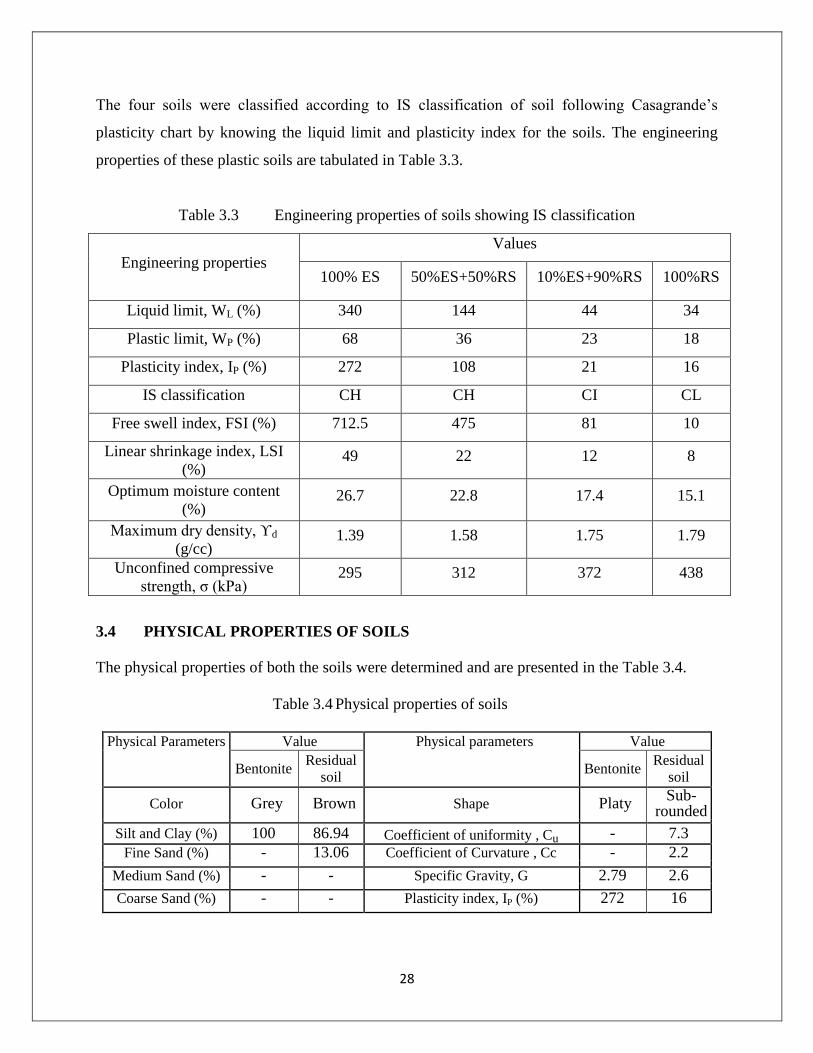
The four soils were classified according to IS classification of soil following Casagrande’s
plasticity chart by knowing the liquid limit and plasticity index for the soils. The engineering
properties of these plastic soils are tabulated in Table 3.3.
Table 3.3 Engineering properties of soils showing IS classification
Engineering properties
Values
100% ES 50%ES+50%RS 10%ES+90%RS 100%RS
Liquid limit, WL (%) 340 144 44 34
Plastic limit, WP (%) 68 36 23 18
Plasticity index, IP (%) 272 108 21 16
IS classification CH CH CI CL
Free swell index, FSI (%) 712.5 475 81 10
Linear shrinkage index, LSI
(%) 49 22 12 8
Optimum moisture content
(%) 26.7 22.8 17.4 15.1
Maximum dry density, ϒd
(g/cc) 1.39 1.58 1.75 1.79
Unconfined compressive
strength, σ (kPa) 295 312 372 438
3.4 PHYSICAL PROPERTIES OF SOILS
The physical properties of both the soils were determined and are presented in the Table 3.4.
Table 3.4 Physical properties of soils
Physical Parameters Value Physical parameters Value
Bentonite Residual
soil Bentonite
Residual
soil
Color Grey Brown Shape Platy Sub-
rounded
Silt and Clay (%) 100 86.94 Coefficient of uniformity , Cu - 7.3
Fine Sand (%) - 13.06 Coefficient of Curvature , Cc - 2.2
Medium Sand (%) - - Specific Gravity, G 2.79 2.6
Coarse Sand (%) - - Plasticity index, IP (%) 272 16
29
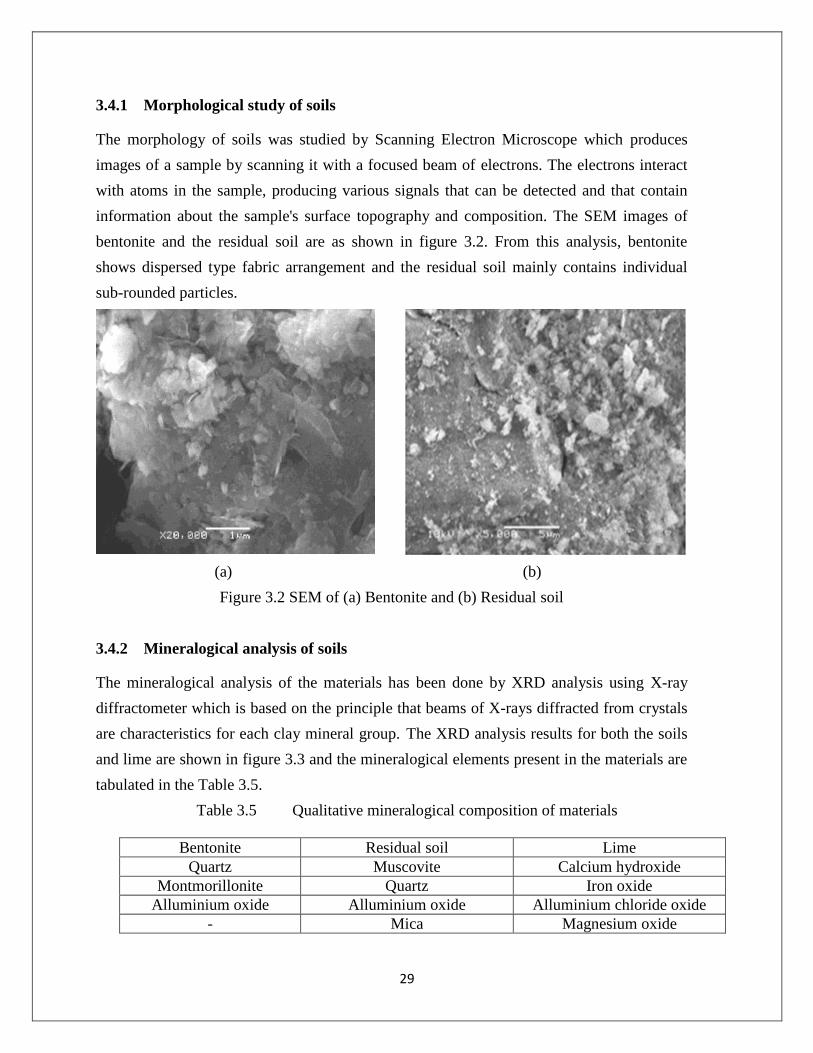
3.4.1 Morphological study of soils
The morphology of soils was studied by Scanning Electron Microscope which produces
images of a sample by scanning it with a focused beam of electrons. The electrons interact
with atoms in the sample, producing various signals that can be detected and that contain
information about the sample's surface topography and composition. The SEM images of
bentonite and the residual soil are as shown in figure 3.2. From this analysis, bentonite
shows dispersed type fabric arrangement and the residual soil mainly contains individual
sub-rounded particles.
(a) (b)
Figure 3.2 SEM of (a) Bentonite and (b) Residual soil
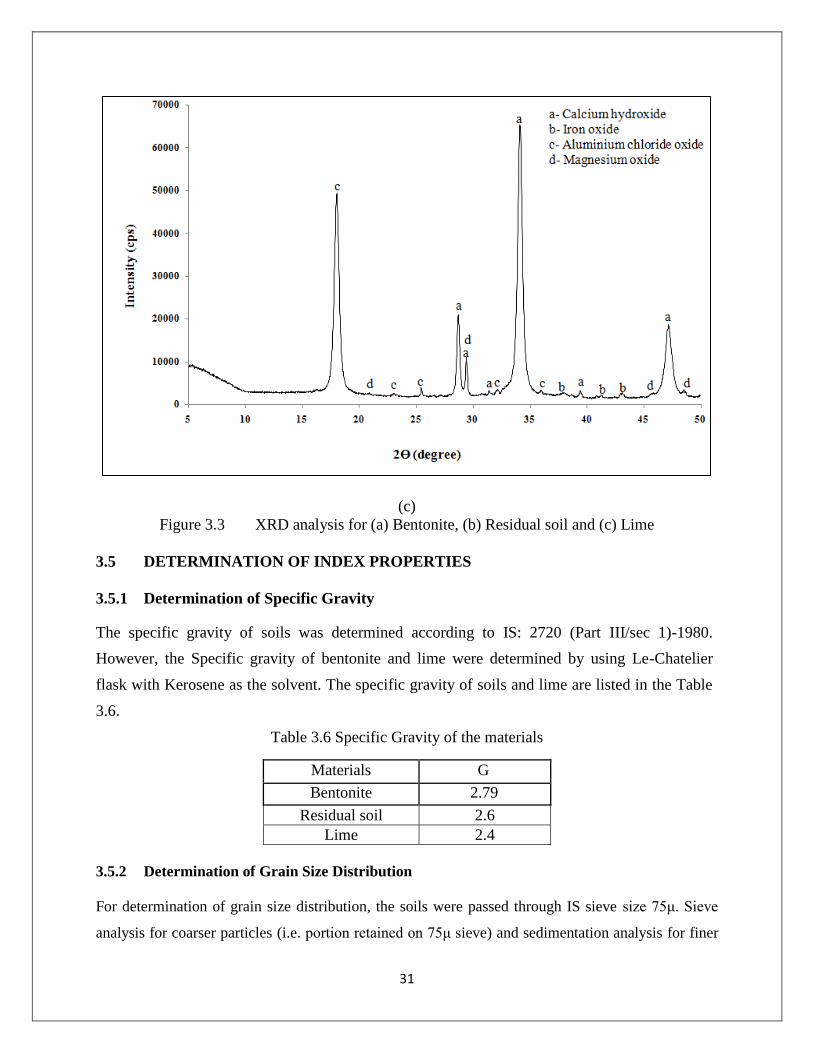
3.4.2 Mineralogical analysis of soils
The mineralogical analysis of the materials has been done by XRD analysis using X-ray
diffractometer which is based on the principle that beams of X-rays diffracted from crystals
are characteristics for each clay mineral group. The XRD analysis results for both the soils
and lime are shown in figure 3.3 and the mineralogical elements present in the materials are
tabulated in the Table 3.5.
Table 3.5 Qualitative mineralogical composition of materials
Bentonite Residual soil Lime
Quartz Muscovite Calcium hydroxide
Montmorillonite Quartz Iron oxide
Alluminium oxide Alluminium oxide Alluminium chloride oxide
- Mica Magnesium oxide

30
(a)
(b)
31
(c)
Figure 3.3 XRD analysis for (a) Bentonite, (b) Residual soil and (c) Lime
3.5 DETERMINATION OF INDEX PROPERTIES
3.5.1 Determination of Specific Gravity
The specific gravity of soils was determined according to IS: 2720 (Part III/sec 1)-1980.
However, the Specific gravity of bentonite and lime were determined by using Le-Chatelier
flask with Kerosene as the solvent. The specific gravity of soils and lime are listed in the Table
3.6.
Table 3.6 Specific Gravity of the materials
Materials G
Bentonite 2.79
Residual soil 2.6
Lime 2.4
3.5.2 Determination of Grain Size Distribution
For determination of grain size distribution, the soils were passed through IS sieve size 75μ. Sieve
analysis for coarser particles (i.e. portion retained on 75μ sieve) and sedimentation analysis for finer

32
particles (i.e. portion passing 75μ sieve) were conducted.
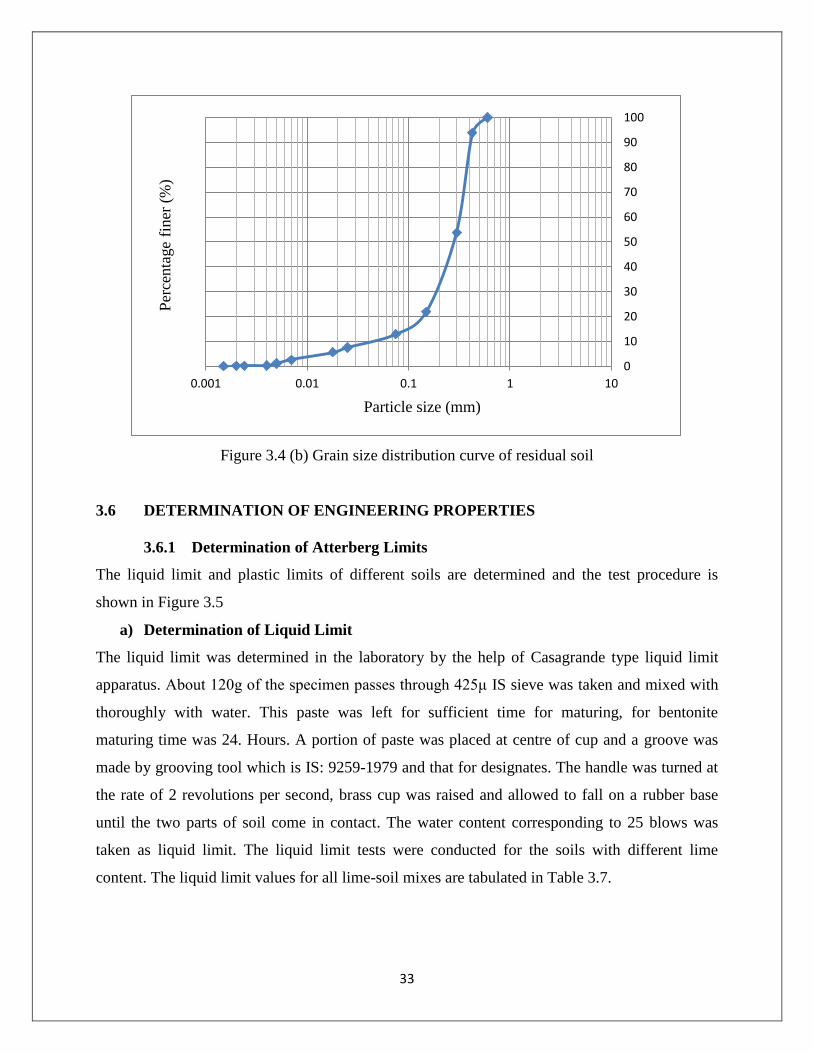
The percentage of soil passing through 75μ IS sieve for bentonite was found to be 100% and incase
of residual soil was 86.94%. Hence, the grain size analysis is done by sedimentation analysis, using a
density hydrometer as following IS: 2720 (part 4)-1985. The grain size distribution curve for
bentonite and the residual soil are shown in Figure 3.4(a) and Figure 3.4(b) respectively.
Figure 3.4(a) Grain size distribution curve for bentonite
The uniformity of the soil can be expressed by uniformity coefficient given by:
Cu = D60/D10
The general shape of particle size distribution curve is described by coefficient of curvature or
coefficient of gradation given by:
Cc = (D30)2/ (D60x D10)
Where,
D60= Particle size such that 60% of the soil is finer than this size
D30=Particle size such that 30% of the soil is finer than this size
D10= Particle size corresponding to10% finer
0
10
20
30
40
50
60
70
80
90
100
0.001 0.01 0.1 1 10
Particle size (mm)
Per
centa
ge
finer
(%
)
33
Figure 3.4 (b) Grain size distribution curve of residual soil
3.6 DETERMINATION OF ENGINEERING PROPERTIES
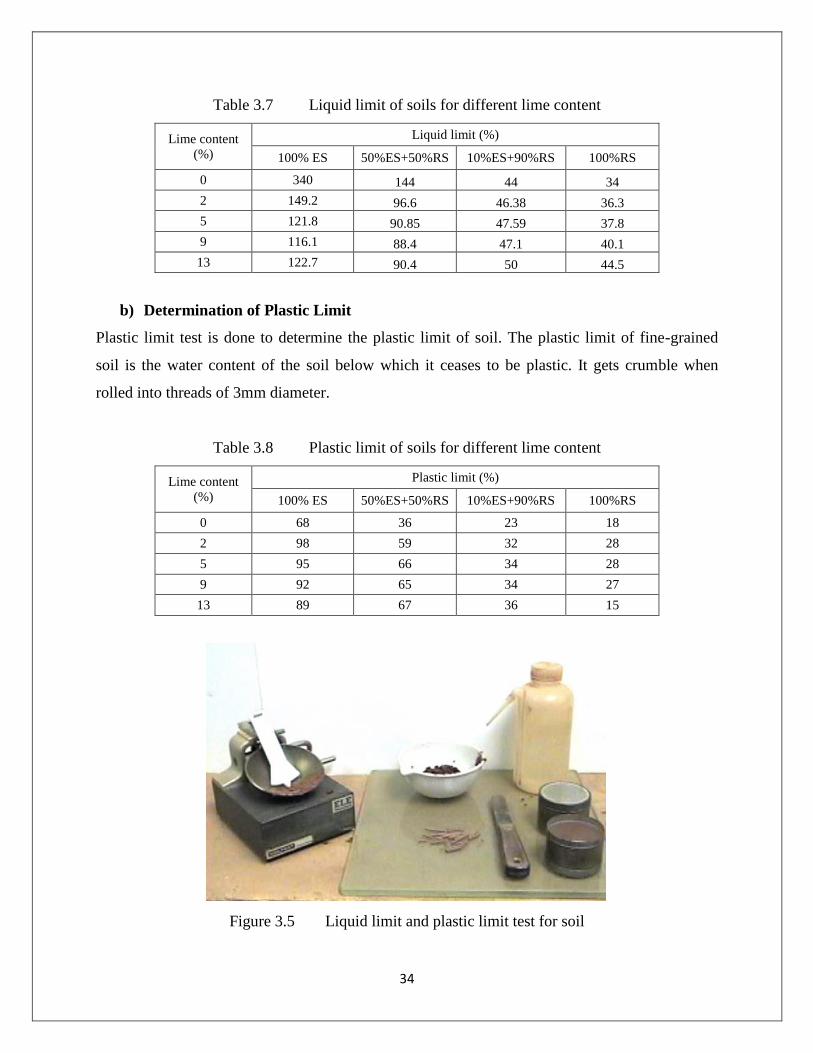
3.6.1 Determination of Atterberg Limits
The liquid limit and plastic limits of different soils are determined and the test procedure is
shown in Figure 3.5
a) Determination of Liquid Limit
The liquid limit was determined in the laboratory by the help of Casagrande type liquid limit
apparatus. About 120g of the specimen passes through 425μ IS sieve was taken and mixed with
thoroughly with water. This paste was left for sufficient time for maturing, for bentonite
maturing time was 24. Hours. A portion of paste was placed at centre of cup and a groove was
made by grooving tool which is IS: 9259-1979 and that for designates. The handle was turned at
the rate of 2 revolutions per second, brass cup was raised and allowed to fall on a rubber base
until the two parts of soil come in contact. The water content corresponding to 25 blows was
taken as liquid limit. The liquid limit tests were conducted for the soils with different lime
content. The liquid limit values for all lime-soil mixes are tabulated in Table 3.7.
0
10
20
30
40
50
60
70
80
90
100
0.001 0.01 0.1 1 10
Per
centa
ge
finer
(%
)
Particle size (mm)
34
Table 3.7 Liquid limit of soils for different lime content
Lime content
(%)
Liquid limit (%)
100% ES 50%ES+50%RS 10%ES+90%RS 100%RS
0 340 144 44 34
2 149.2 96.6 46.38 36.3
5 121.8 90.85 47.59 37.8
9 116.1 88.4 47.1 40.1
13 122.7 90.4 50 44.5
b) Determination of Plastic Limit
Plastic limit test is done to determine the plastic limit of soil. The plastic limit of fine-grained
soil is the water content of the soil below which it ceases to be plastic. It gets crumble when
rolled into threads of 3mm diameter.
Table 3.8 Plastic limit of soils for different lime content
Lime content
(%)
Plastic limit (%)
100% ES 50%ES+50%RS 10%ES+90%RS 100%RS
0 68 36 23 18
2 98 59 32 28
5 95 66 34 28
9 92 65 34 27
13 89 67 36 15
Figure 3.5 Liquid limit and plastic limit test for soil
35
c) Determination of Plasticity Index
Plasticity index is calculated from the relation
Ip = WL - Wp
Where,
Ip = plasticity index in %,
WL = liquid limit in %
WP = plastic limit in %
The values of plasticity index for the soils are tabulated in Table 3.9.
Table 3.9 Plasticity index of soils for different lime content
Lime content
(%)
Plasticity index (%)
100% ES 50%ES+50%RS 10%ES+90%RS 100%RS
0 272 108 21 16
2 51 38 14 9
5 27 25 14 10
9 24 24 14 13
13 34 23 15 15
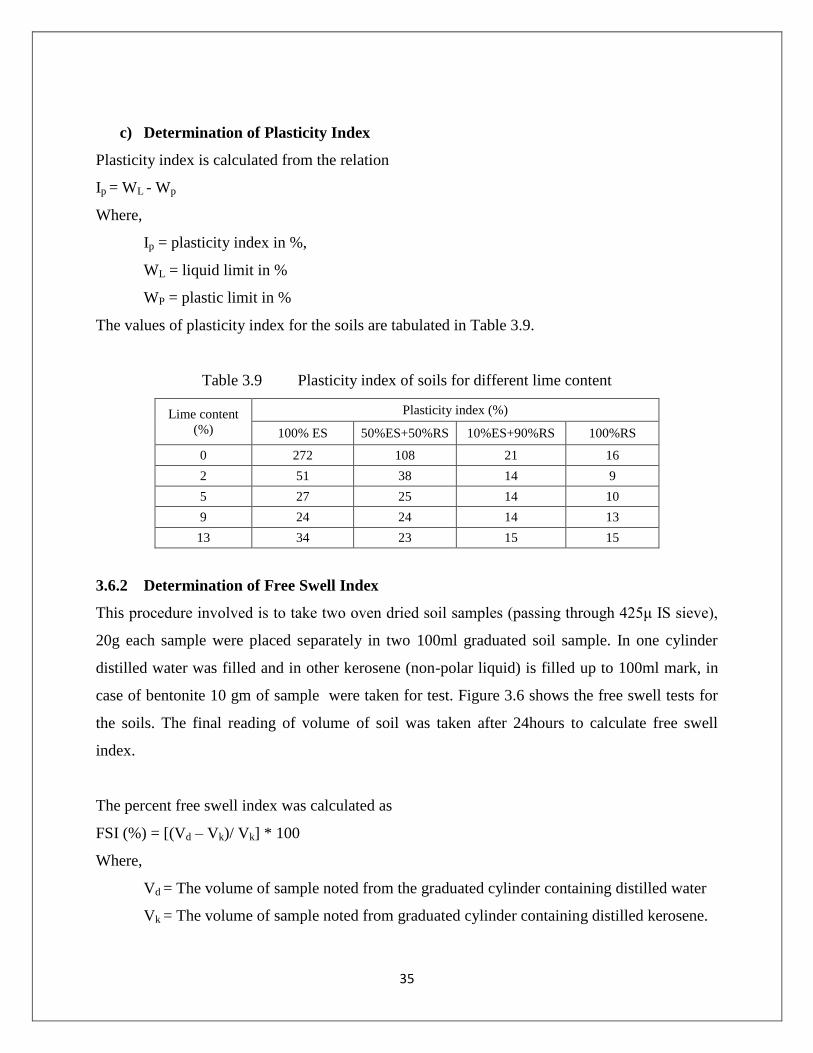
3.6.2 Determination of Free Swell Index
This procedure involved is to take two oven dried soil samples (passing through 425μ IS sieve),
20g each sample were placed separately in two 100ml graduated soil sample. In one cylinder
distilled water was filled and in other kerosene (non-polar liquid) is filled up to 100ml mark, in
case of bentonite 10 gm of sample were taken for test. Figure 3.6 shows the free swell tests for
the soils. The final reading of volume of soil was taken after 24hours to calculate free swell
index.
The percent free swell index was calculated as
FSI (%) = [(Vd – Vk)/ Vk] * 100
Where,
Vd = The volume of sample noted from the graduated cylinder containing distilled water
Vk = The volume of sample noted from graduated cylinder containing distilled kerosene.
36
Figure 3.6 Free swell test for soil
Free Swell Index of different lime-soil mixes were determined from the test and tabulated in
Table 3.10.
Table 3.10 Free swell index of soils for different lime content
Lime content
(%)
Free swell index (%)
100% ES 50%ES+50%RS 10%ES+90%RS 100%RS
0 712.5 475 80.95 10
2 400 52 8.33 -4.54
5 115.38 38.46 16 -8.33
9 120 25.92 3.57 -8
13 75 19 3.33 0
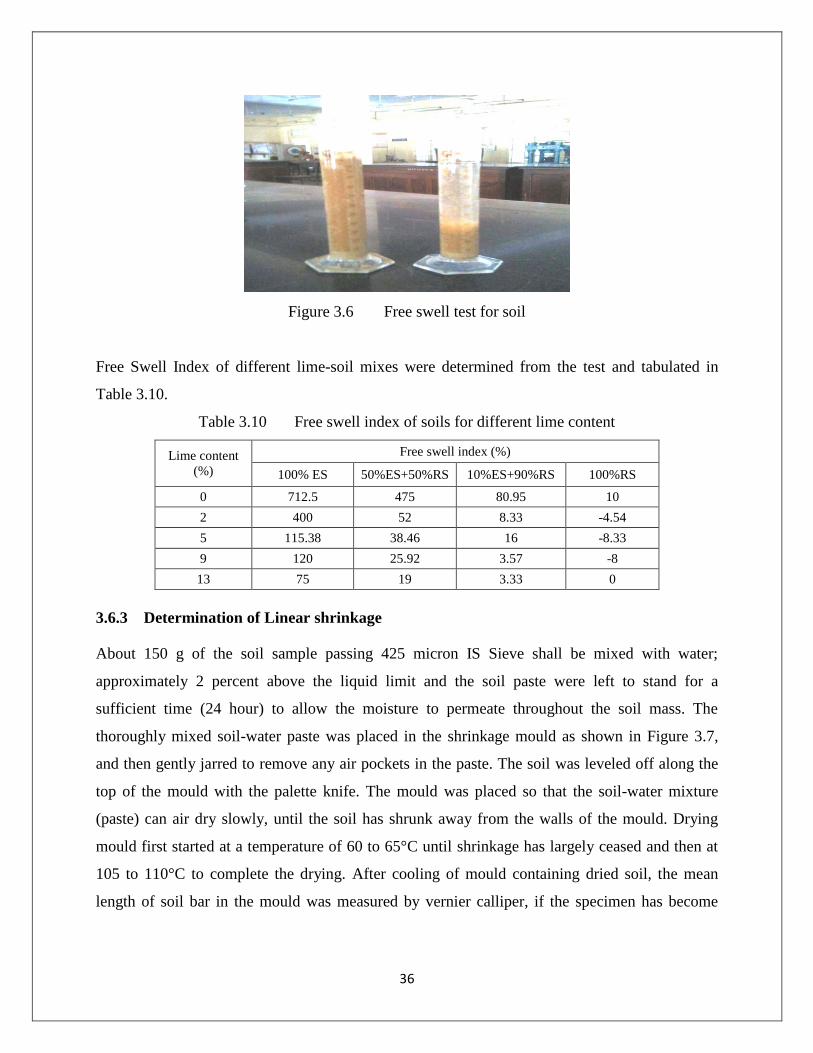
3.6.3 Determination of Linear shrinkage
About 150 g of the soil sample passing 425 micron IS Sieve shall be mixed with water;
approximately 2 percent above the liquid limit and the soil paste were left to stand for a
sufficient time (24 hour) to allow the moisture to permeate throughout the soil mass. The
thoroughly mixed soil-water paste was placed in the shrinkage mould as shown in Figure 3.7,
and then gently jarred to remove any air pockets in the paste. The soil was leveled off along the
top of the mould with the palette knife. The mould was placed so that the soil-water mixture
(paste) can air dry slowly, until the soil has shrunk away from the walls of the mould. Drying
mould first started at a temperature of 60 to 65°C until shrinkage has largely ceased and then at
105 to 110°C to complete the drying. After cooling of mould containing dried soil, the mean
length of soil bar in the mould was measured by vernier calliper, if the specimen has become
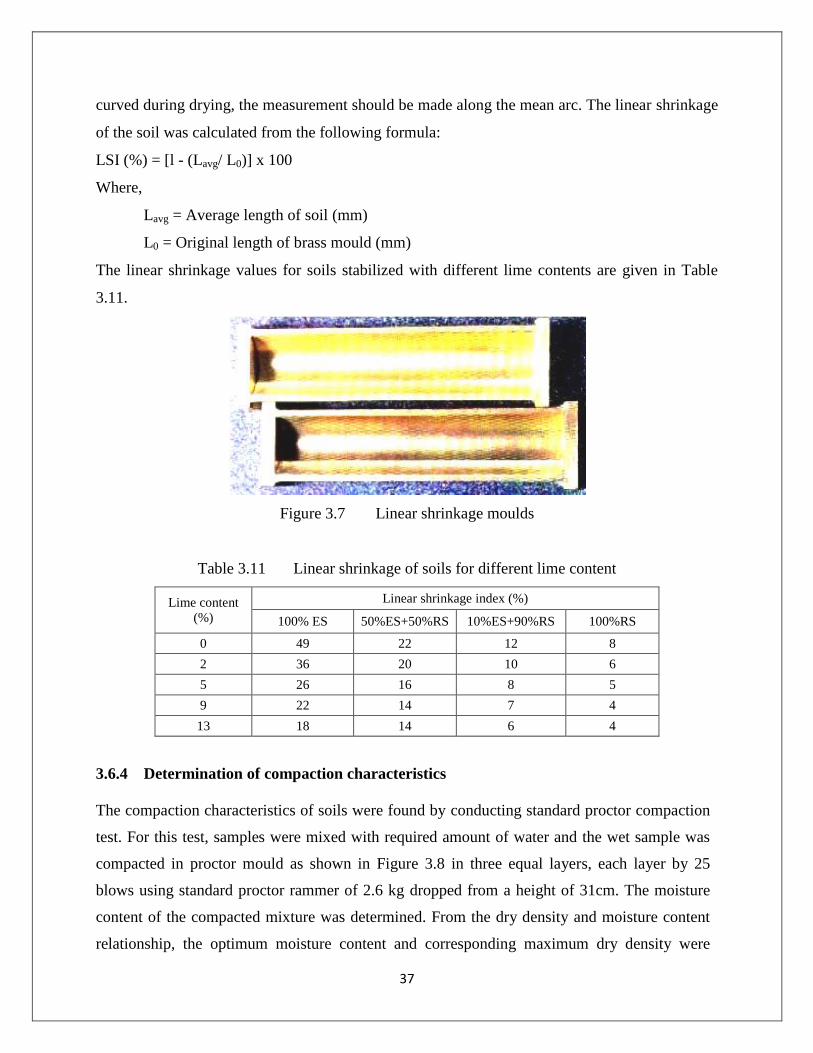
37
curved during drying, the measurement should be made along the mean arc. The linear shrinkage
of the soil was calculated from the following formula:
LSI (%) = [l - (Lavg/ L0)] x 100
Where,
Lavg = Average length of soil (mm)
L0 = Original length of brass mould (mm)
The linear shrinkage values for soils stabilized with different lime contents are given in Table
3.11.
Figure 3.7 Linear shrinkage moulds
Table 3.11 Linear shrinkage of soils for different lime content
Lime content
(%)
Linear shrinkage index (%)
100% ES 50%ES+50%RS 10%ES+90%RS 100%RS
0 49 22 12 8
2 36 20 10 6
5 26 16 8 5
9 22 14 7 4
13 18 14 6 4
3.6.4 Determination of compaction characteristics
The compaction characteristics of soils were found by conducting standard proctor compaction
test. For this test, samples were mixed with required amount of water and the wet sample was
compacted in proctor mould as shown in Figure 3.8 in three equal layers, each layer by 25
blows using standard proctor rammer of 2.6 kg dropped from a height of 31cm. The moisture
content of the compacted mixture was determined. From the dry density and moisture content
relationship, the optimum moisture content and corresponding maximum dry density were

38
determined. Soils were then stabilized with varying percentage of lime. The lime contents were
0%, 2%, 5%, 9%, and 13% of the dry weight of soil. Similar compaction tests were conducted
with varying lime percentages and the optimum moisture contents and maximum dry densities
were determined. This was done to study the effect of lime on compaction characteristic of
soils.
Figure 3.8 Compaction test for soil
Table 3.12 Compaction characteristics of soils for different lime content
Lime
content (%) 100% ES 50%ES+50%RS 10%ES+90%RS 100%RS
OMC
(%)
MDD
(g/cc)
OMC
(%)
MDD
(g/cc)
OMC
(%)
MDD
(g/cc)
OMC
(%)
MDD
(g/cc)
0 26.7 1.39 22.8 1.58 17.4 1.75 15.1 1.79
2 33.13 1.28 27.5 1.43 19.4 1.67 18.25 1.71
5 35 1.28 28.9 1.36 21.2 1.63 18.7 1.67
9 34 1.29 28.6 1.35 20.5 1.6 18.4 1.67
13 34 1.29 29.4 1.38 18.4 1.59 17.8 1.66
3.6.5 Determination of Unconfined Compressive Strength
The Unconfined compressive strength test is one of the common tests used to study the strength
characteristics of soil and stabilized soil. To get Immediate UCS strength, UCS tests on soils and
lime stabilized soil specimens are compacted to their maximum dry densities with optimum

39
moisture contents obtained from standard proctor compaction tests. The UCS tests were
performed for the plastic soils as well as for stabilized soils. For this test, cylindrical specimens
were prepared by compacting to their maximum dry density at optimum moisture content in the
metallic split mould with dimension 50mm (diameter) × 100mm (height). These specimens were
tested in a compression testing machine with strain rate of 1.25% per minute till failure of the
sample.
To determine the effect of curing period on strength property all samples were coated with wax
as shown in Figure 3.9. Wax coat has been made to the test samples to maintain at its specified
moisture content and cured at a temperature of 27º C in a humidity chamber for a period of 0, 7,
14, 28 and 60 days. After curing period and before testing, the wax was removed from the end of
the specimen. The unconfined compressive strengths of specimens were determined from stress
versus strain curves plots and hence the unconfined strength and corresponding failure strain for
different raw soils and lime stabilized soils for different days of curing are obtained. The
compressive strengths for soils stabilized with lime for different curing periods are tabulated in
Table 3.13, Table 3.14, Table 3.15 and Table 3.16.
Figure 3.9 UCS test samples
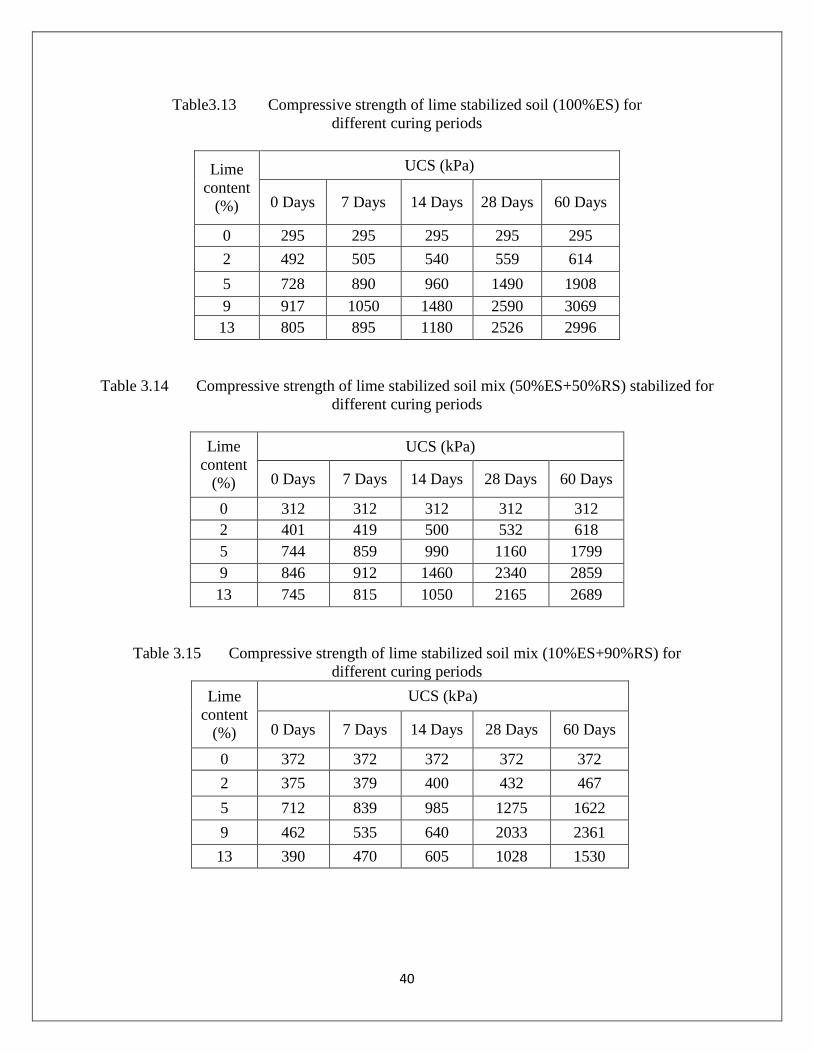
40
Table3.13 Compressive strength of lime stabilized soil (100%ES) for
different curing periods
Lime
content
(%)
UCS (kPa)
0 Days 7 Days 14 Days 28 Days 60 Days
0 295 295 295 295 295
2 492 505 540 559 614
5 728 890 960 1490 1908
9 917 1050 1480 2590 3069
13 805 895 1180 2526 2996
Table 3.14 Compressive strength of lime stabilized soil mix (50%ES+50%RS) stabilized for
different curing periods
Lime
content
(%)
UCS (kPa)
0 Days 7 Days 14 Days 28 Days 60 Days
0 312 312 312 312 312
2 401 419 500 532 618
5 744 859 990 1160 1799
9 846 912 1460 2340 2859
13 745 815 1050 2165 2689
Table 3.15 Compressive strength of lime stabilized soil mix (10%ES+90%RS) for
different curing periods
Lime
content
(%)
UCS (kPa)
0 Days 7 Days 14 Days 28 Days 60 Days
0 372 372 372 372 372
2 375 379 400 432 467
5 712 839 985 1275 1622
9 462 535 640 2033 2361
13 390 470 605 1028 1530

41
Table 3.16 Compressive strength of lime stabilized soil (100%RS) for
different curing periods
Lime
content
(%)
UCS (kPa)
0 Days 7 Days 14 Days 28 Days 60 Days
0 438 438 438 438 438
2 400 430 450 472 469
5 620 750 880 1611 1951
9 531 630 690 740 948
13 358 445 450 473 524
Also, the change in compressive strengths for soils without lime and lime stabilized soils
compacted with varying moisture contents are studied by conducting the UCS test following the
above procedure. The UCS tests were conducted for all the four types of soils with varying
moisture contents i.e. increasing the moisture contents by 10% and 20% and reducing the
moisture contents by 10% and 30% of optimum moisture content. The specimens compacted
with these varying moisture contents were coated with wax and cured for a period of 28 days.
The wax was removed from the specimens after 28 days and before testing the compressive
strength. The compressive strength test results for lime-soils with varying moisture contents are
presented in Table 3.17, Table 3.18, Table 3.19 and Table 3.20.
Table3.17 Compressive strength of lime stabilized soil (100% ES) for varying
moisture contents
Lime
content
(%)
UCS (kPa)
0.7 OMC 0.9 OMC OMC 1.1 OMC 1.2 OMC
0 600 438 295 290 206
2 1050 940 459 416 363
5 1130 1340 1490 910 838
9 1100 1410 2590 2622 2084
13 1050 1400 2526 2600 2678
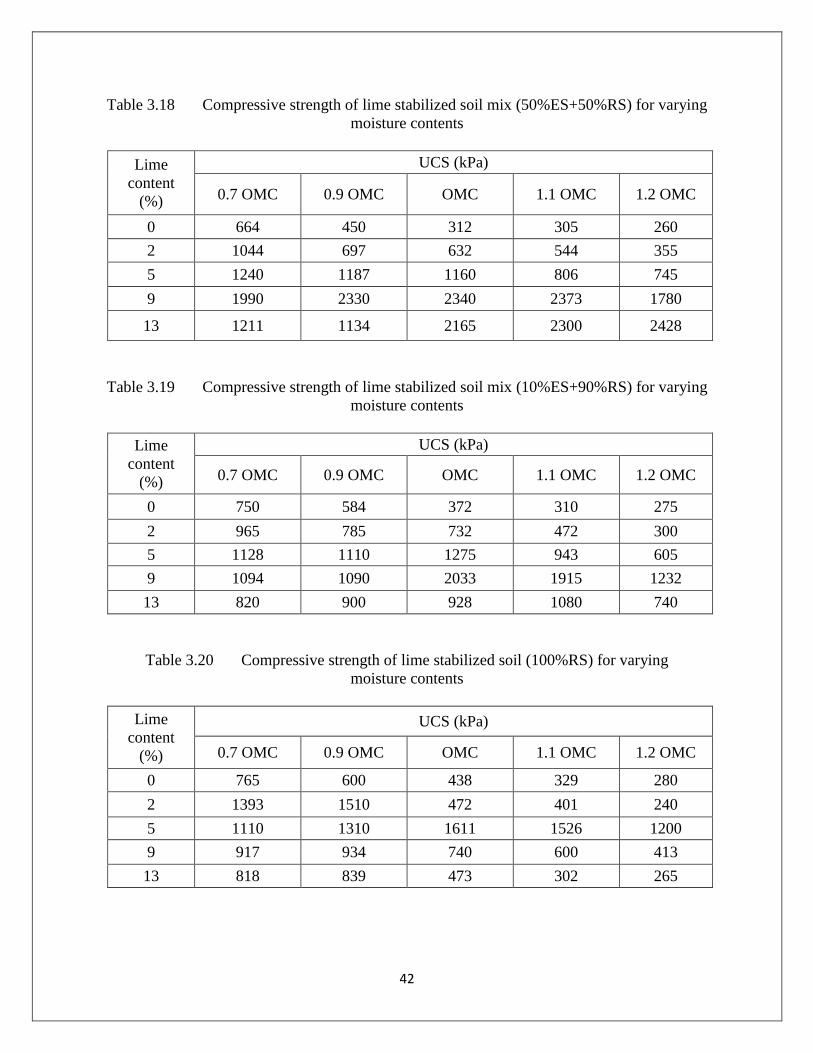
42
Table 3.18 Compressive strength of lime stabilized soil mix (50%ES+50%RS) for varying
moisture contents
Lime
content
(%)
UCS (kPa)
0.7 OMC 0.9 OMC OMC 1.1 OMC 1.2 OMC
0 664 450 312 305 260
2 1044 697 632 544 355
5 1240 1187 1160 806 745
9 1990 2330 2340 2373 1780
13 1211 1134 2165 2300 2428
Table 3.19 Compressive strength of lime stabilized soil mix (10%ES+90%RS) for varying
moisture contents
Lime
content
(%)
UCS (kPa)
0.7 OMC 0.9 OMC OMC 1.1 OMC 1.2 OMC
0 750 584 372 310 275
2 965 785 732 472 300
5 1128 1110 1275 943 605
9 1094 1090 2033 1915 1232
13 820 900 928 1080 740
Table 3.20 Compressive strength of lime stabilized soil (100%RS) for varying
moisture contents
Lime
content
(%)
UCS (kPa)
0.7 OMC 0.9 OMC OMC 1.1 OMC 1.2 OMC
0 765 600 438 329 280
2 1393 1510 472 401 240
5 1110 1310 1611 1526 1200
9 917 934 740 600 413
13 818 839 473 302 265

43
CHAPTER 4
RESULT AND DISCUSSION
4.1 INDEX PROPERTIES
4.1.1 Specific gravity
Specific gravity is one of the important physical properties needed for the use of lime for
geotechnical and other applications. In general, the specific gravity of hydrated lime lies between
2.3 to 2.9 but can for quick lime i.e. 3.2 to 3.4. The average specific gravity of lime used for the
present research found to be 2.4. The specific gravity value for inorganic soil ranges between 2.6
to 2.8 and the value of specific gravity for bentonite and residual soil used are 2.79 and 2.6
respectively.
4.1.2 Grain size distribution
In Figure 3.4 (a), particle size distribution curve for bentonite is situated higher up and to the left
indicating fine grained soil and the bentonite contains silt and clay size particles only. The curve
for residual soil shown in Figure 3.4 (b) represents well graded soil contains particles of different
sizes in good proportion as the coefficient of uniformity and coefficient of curvature for the
residual soil are found to be 7.3 & 2.2 respectively. The particle size of residual soil ranges from
fine sand to clay size.
4.2 ENGINEERING PROPERTIES
4.2.1 Atterberg limits
4.2.1.1 Liquid limit
Influence of lime on liquid limit of soils is shown in Figure 4.1. There is a significant reduction
in liquid limit at 2% of lime content for soils 100%ES and 50%ES+50%RS. Beyond, this lime
content the change in liquid limit is comparatively less. It is also observed that there is not much
more variation in liquid limits for the soils 10%ES+90%RS and 100%RS with increased lime
content. This reduction occur as the lime is added to the soil, Ca+ ions are released into the pore
fluid and results increase in electrolyte concentration which reduces the thickness of diffuse
double layer held around soil particle leading to a lower liquid limit.
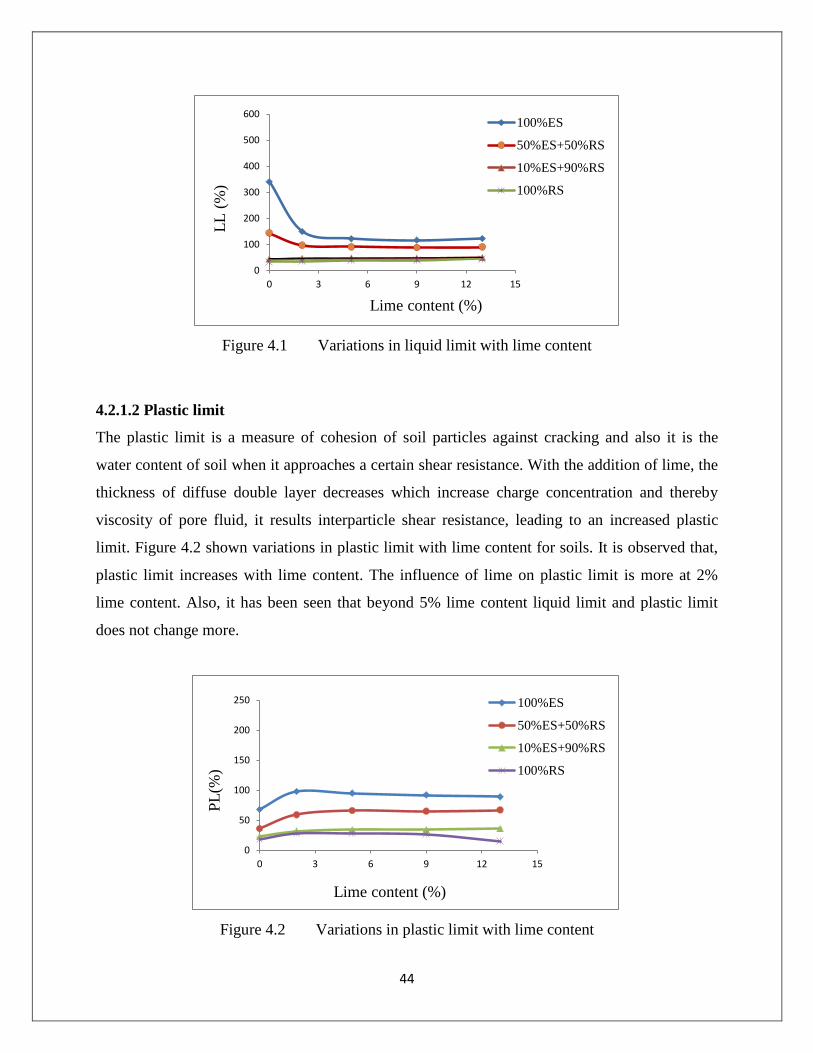
44
Figure 4.1 Variations in liquid limit with lime content
4.2.1.2 Plastic limit
The plastic limit is a measure of cohesion of soil particles against cracking and also it is the
water content of soil when it approaches a certain shear resistance. With the addition of lime, the
thickness of diffuse double layer decreases which increase charge concentration and thereby
viscosity of pore fluid, it results interparticle shear resistance, leading to an increased plastic
limit. Figure 4.2 shown variations in plastic limit with lime content for soils. It is observed that,
plastic limit increases with lime content. The influence of lime on plastic limit is more at 2%
lime content. Also, it has been seen that beyond 5% lime content liquid limit and plastic limit
does not change more.
Figure 4.2 Variations in plastic limit with lime content
0
100
200
300
400
500
600
0 3 6 9 12 15
100%ES
50%ES+50%RS
10%ES+90%RS
100%RS
Lime content (%)
LL
(%
)
0
50
100
150
200
250
0 3 6 9 12 15
100%ES
50%ES+50%RS
10%ES+90%RS
100%RS
PL
(%)
Lime content (%)

45
4.2.1.3 Plasticity index
A decrease in plasticity index has been observed as the lime content increases. The variations in
plasticity index with lime content for soils are shown in Figure 4.3. This variation is more in case
of expansive soil (i.e. 100%ES) at 2% of lime content. Also, it has been seen that, there is
comparatively more reduction in plasticity index in case of soil mix 50%ES+50%RS in compare
to other two soils (i.e. 10%ES+90%RS and 100%RS).
Figure 4.3 Variations in plasticity index with lime content
4.2.2 Free swell index
The variation of free swell index with percentage of lime is illustrated in Figure 4.4. For the soil
100%ES, free swell index reduces largely upto 5% lime content, thereafter the decrease is not
substantial. However, for the soil mix 50%ES+50%RS and 10%ES+90%RS a reduction in free
swell index value is observed upto 2% lime content beyond which the reduction is not there is
not substantial. This indicates that the colloidal reaction in soil of 100%ES continues upto 5%
lime content whereas this stops at 2% lime content for soil mix 50%ES+50%RS and
10%ES+90%RS. It has been observed that for the residual soil or residual soil added with lime,
the free swell index value is either very close to zero or negative. This observation is in line with
the previous researchers who have reported a negative free swell index values for finely powered
non cohesive earth material like rock powder.
0
50
100
150
200
250
300
0 3 6 9 12 15
100%ES
50%ES+50%RS
10%ES+90%RS
100%RS
Lime content (%)
PI
(%)
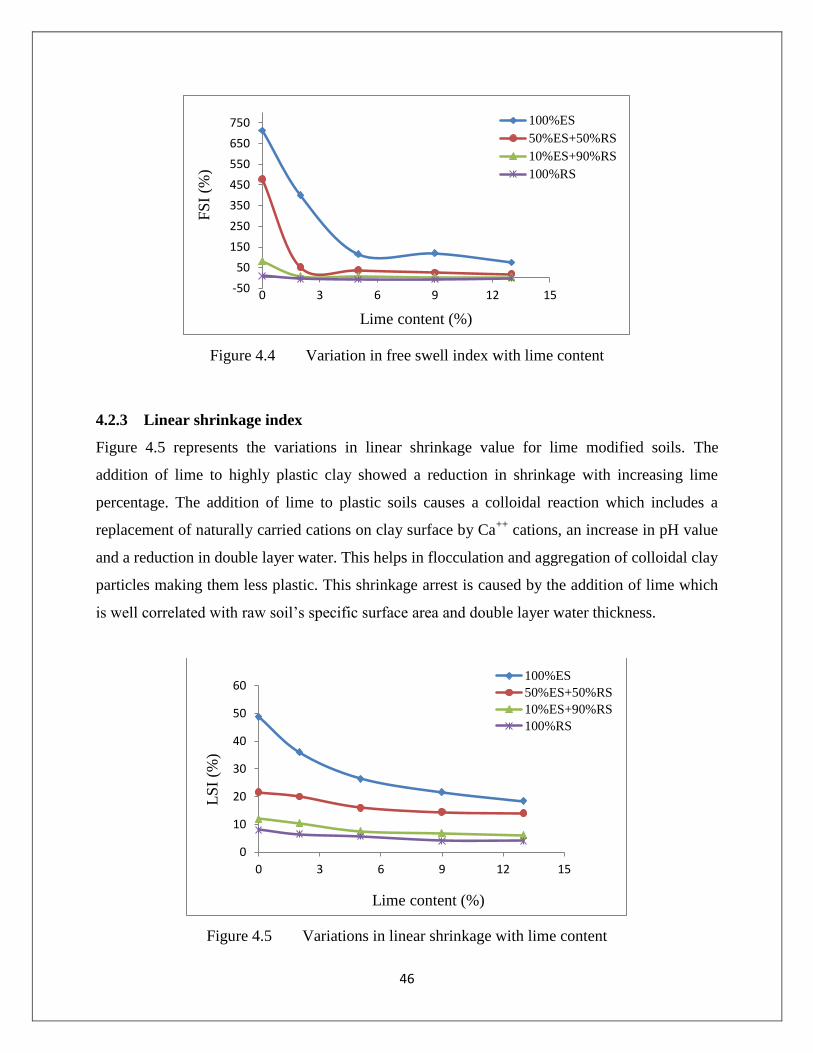
46
Figure 4.4 Variation in free swell index with lime content
4.2.3 Linear shrinkage index
Figure 4.5 represents the variations in linear shrinkage value for lime modified soils. The
addition of lime to highly plastic clay showed a reduction in shrinkage with increasing lime
percentage. The addition of lime to plastic soils causes a colloidal reaction which includes a
replacement of naturally carried cations on clay surface by Ca++
cations, an increase in pH value
and a reduction in double layer water. This helps in flocculation and aggregation of colloidal clay
particles making them less plastic. This shrinkage arrest is caused by the addition of lime which
is well correlated with raw soil’s specific surface area and double layer water thickness.
Figure 4.5 Variations in linear shrinkage with lime content
-50
50
150
250
350
450
550
650
750
0 3 6 9 12 15
100%ES
50%ES+50%RS
10%ES+90%RS
100%RS
FS
I (%
)
Lime content (%)
0
10
20
30
40
50
60
0 3 6 9 12 15
100%ES
50%ES+50%RS
10%ES+90%RS
100%RS
LS
I (%
)
Lime content (%)

47
4.2.4 Compaction characteristics
The compaction characteristics of the soils have been studied by varying the lime content. The
compaction curves showing optimum moisture contents and maximum dry density for different
soils have been shown in Figure 4.6. It is observed that the optimum moisture content is less and
the maximum dry density is more for the soil 100%RS compared to other three soils. However,
the expansive soil (i.e. 100%ES) has minimum dry density and maximum moisture content.
Hence, the more the percentage of bentonite in the residual soil, more the moisture content and
lesser the dry density. This is obvious as the affinity of expansive soil to water is much higher
than the residual soil. The water molecules adsorbed to the surface of the clay minerals and
higher amount of water is needed to lubricate the clay surface.
Figure 4.6 Compaction curves for different soils
Further, compaction characteristics have been studied by adding lime in different percentage to
the soils. It has been observed that, optimum moisture content increases and maximum dry
density decreases with lime content. The variation in compaction characteristics with lime
content have been shown in Figure 4.7 and Figure 4.8. Also, it is seen that the fall in maximum
dry density is significant at lower percentage of lime. At lower percentage of lime reacts very
quickly with soil, base exchange, aggregation and flocculation occurs resulting increased void
ratio leading to a decrease in the density of the mix. Beyond this lime content, addition of lime is
1.2
1.3
1.4
1.5
1.6
1.7
1.8
1.9
2
5 10 15 20 25 30 35 40
100%ES
50%ES+50%RS
10%ES+90%RS
100%RS
Moisture content (%)
Dry
den
sity
(g/c
c)
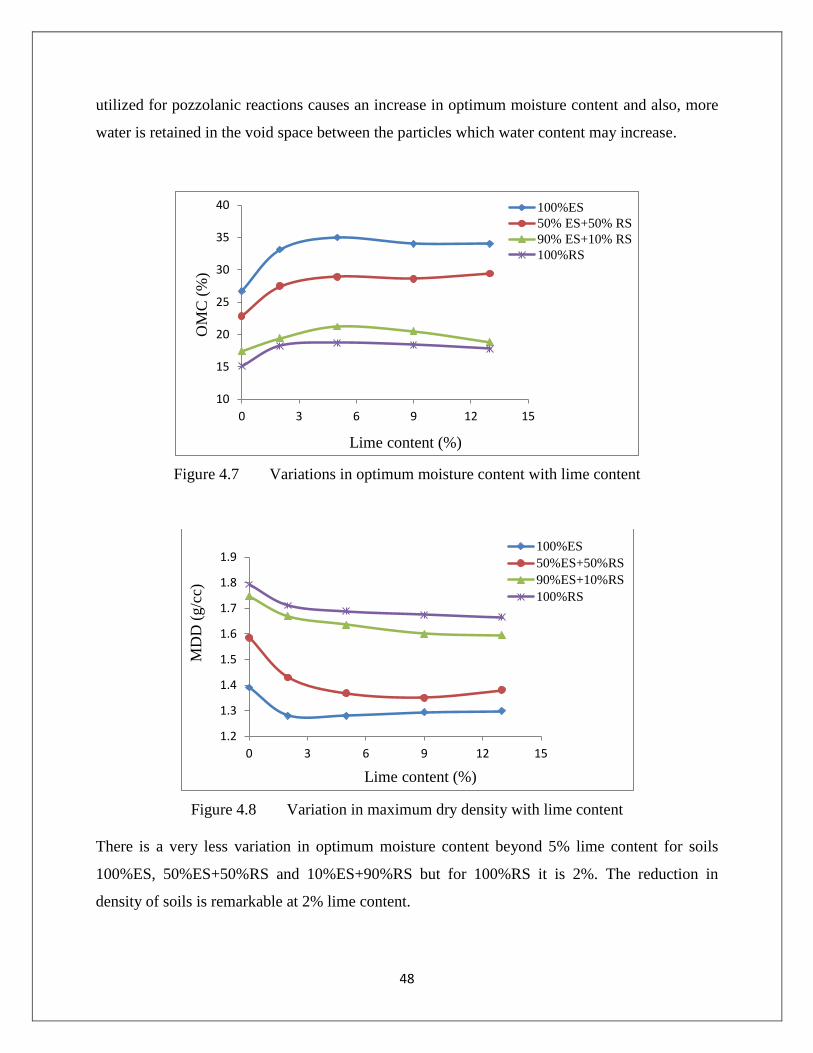
48
utilized for pozzolanic reactions causes an increase in optimum moisture content and also, more
water is retained in the void space between the particles which water content may increase.
Figure 4.7 Variations in optimum moisture content with lime content
Figure 4.8 Variation in maximum dry density with lime content
There is a very less variation in optimum moisture content beyond 5% lime content for soils
100%ES, 50%ES+50%RS and 10%ES+90%RS but for 100%RS it is 2%. The reduction in
density of soils is remarkable at 2% lime content.
10
15
20
25
30
35
40
0 3 6 9 12 15
100%ES
50% ES+50% RS
90% ES+10% RS
100%RS
Lime content (%)
OM
C (
%)
1.2
1.3
1.4
1.5
1.6
1.7
1.8
1.9
0 3 6 9 12 15
100%ES
50%ES+50%RS
90%ES+10%RS
100%RS
Lime content (%)
MD
D (
g/c
c)

49
4.2.5 Unconfined compressive strength
Unconfined compressive strength tests were carried out on untreated soils compacted to their
maximum dry density at optimum moisture content. The unconfined compressive strengths are
obtained from stress-strain curves for different untreated soils the soils as shown in Figure 4.9. It
is observed that for untreated expansive soil (i.e. 100%ES), the compressive strength is less than
the Residual soil (i.e. 100%RS). The expansive soil possesses more 11.6% moisture content than
residual soil and also the dry density is less. As the expansive soil has high optimum moisture
content and lesser maximum dry density, is obvious to show less compressive strength than the
residual soil.
Figure 4.9 Stress-strain curves for untreated soils
4.2.5.1 Effect of curing on strength of soil
Typical strength (i.e. unconfined compressive strength at failure) variation of lime treated soils
after different curing period are depicted in Figure 4.10, Figure 4.11, Figure 4.12 and Figure
4.13. At 2% lime content the strength gain is not remarkable but by increasing the lime content
the strength gain is more significant for all the soils.
0
100
200
300
400
500
0 1 2 3 4 5 6 7 8 9
100%ES 50%ES+50%RS 10%ES+90%RS 100%RS
Strain (%)
Ax
ial
stre
ss (
kP
a)
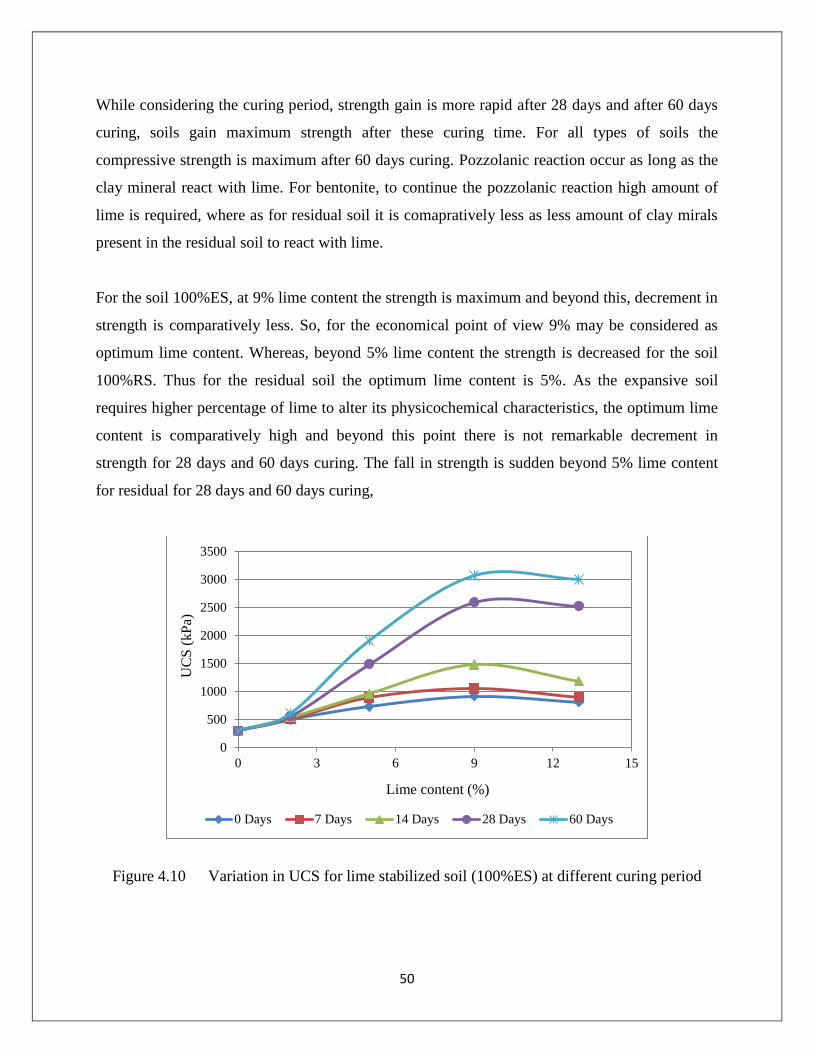
50
While considering the curing period, strength gain is more rapid after 28 days and after 60 days
curing, soils gain maximum strength after these curing time. For all types of soils the
compressive strength is maximum after 60 days curing. Pozzolanic reaction occur as long as the
clay mineral react with lime. For bentonite, to continue the pozzolanic reaction high amount of
lime is required, where as for residual soil it is comapratively less as less amount of clay mirals
present in the residual soil to react with lime.
For the soil 100%ES, at 9% lime content the strength is maximum and beyond this, decrement in
strength is comparatively less. So, for the economical point of view 9% may be considered as
optimum lime content. Whereas, beyond 5% lime content the strength is decreased for the soil
100%RS. Thus for the residual soil the optimum lime content is 5%. As the expansive soil
requires higher percentage of lime to alter its physicochemical characteristics, the optimum lime
content is comparatively high and beyond this point there is not remarkable decrement in
strength for 28 days and 60 days curing. The fall in strength is sudden beyond 5% lime content
for residual for 28 days and 60 days curing,
Figure 4.10 Variation in UCS for lime stabilized soil (100%ES) at different curing period
0
500
1000
1500
2000
2500
3000
3500
0 3 6 9 12 15
0 Days 7 Days 14 Days 28 Days 60 Days
UC
S (
kP
a)
Lime content (%)

51
Figure 4.11 Variation in UCS for lime stabilized soil mix (50%ES+50%RS) at
different curing period
Figure 4.12 Variation in UCS for lime stabilized soil mix (10%ES+90%RS) at
different curing period
0
500
1000
1500
2000
2500
3000
3500
0 3 6 9 12 15
0 Days 7 Days 14 Days 28 Days 60 Days
UC
S (
kP
a)
Lime content (%)
0
500
1000
1500
2000
2500
0 3 6 9 12 15
0 Days 7 Days 14 Days 28 Days 60 Days
UC
S (
kP
a)
Lime content (%)

52
Figure 4.13 Variation in UCS for lime stabilized soil (100%RS) at different curing period
Practically, at a lower lime content strength improvement is negligible as at this stage, lime is
mainly used to meet the initial requirement of soil like reducing thickness of diffuse double layer
due to which plasticity of soil changes. Also, the cementation is too weak and gives a marginal
strength gain. By increasing lime content the improvement in strength gain is remarkable as the
lime is adequate for formation of cementitious compounds once pozzolanic reaction starts. The
compressive strength of soil increases upto certain lime content after this lime content, the
strength starts decreasing. This is because the excess lime behaves as lubricant to the soil
particles as lime has not appreciable friction and cohesion.
However, the strength improvement is also depends upon the curing period. Compressive
strength is high for longer curing period. For low lime content the strength increment is very less
even after a long period of curing. It has been observed that after prolonged curing period and for
appreciable lime content, the compressive strength is maximum.
Optimum lime content varied with soil type and curing period. The summary of optimum lime
content giving maximum compressive strength for the soils after different curing periods are
produced in Table 4.1.
0
500
1000
1500
2000
2500
0 3 6 9 12 15
0 Days 7 Days 14 Days 28 Days 60 Days
UC
S (
kP
a)
Lime content (%)

53
Table 4.1 Summary of optimum lime content giving maximum strength for soils cured at
different curing periods
Curing period (Days) Optimum lime content (%)
100%ES 50%ES+50%RS 10%ES+90%RS 100%RS
0 9 9 5 5
7 9 9 5 5
14 9 9 5 5
28 9 9 9 5
60 9 9 9 5
4.2.5.2 Effect of moisture content on strength of soil
Figure 4.14 shows the effect of moisture content on strength of untreated soils. The strength of
residual soil is more than the expansive soil when compacted at their corresponding optimum
moisture contents.
Figure 4.14 Variation in UCS with moisture content for untreated soils
Untreated soil compacted at a dry side of optimum moisture content shows higher unconfined
compressive strength. If the soil sample is compacted at dry of optimum moisture content, the
structure forms to a flocculated one at same compacted dry density. Flocculated structures have
much higher strength than dispersed one. As the water content increases, water acts as a
0
200
400
600
800
UC
S (
kP
a) 0.7 OMC
0.9OMC
OMC
1.1OMC
1.2OMC

54
lubricating agent and a given compactive energy, soil-structure changes towards a more
dispersed one which is responsible for reduced strength.
Variation in compressive strengthswith moisture content for lime stabilized soils are shown in
Figure 4.15, Figure 4.16, Figure 4.17 and Figure 4.18.
Figure 4.15 Variation in UCS with moisture content for lime stabilized soil (100%ES)
Figure 4.16 Variation in UCS with moisture content for lime stabilized
soil mix (50%ES+50%RS)
0
500
1000
1500
2000
2500
3000
0 2 5 9 13
UC
S (
kP
a)
Lime content (%)
0.7 OMC
0.9OMC
OMC
1.1OMC
1.2OMC
0
500
1000
1500
2000
2500
3000
0 2 5 9 13
UC
S (
kP
a)
Lime content (%)
0.7 OMC
0.9OMC
OMC
1.1OMC
1.2OMC
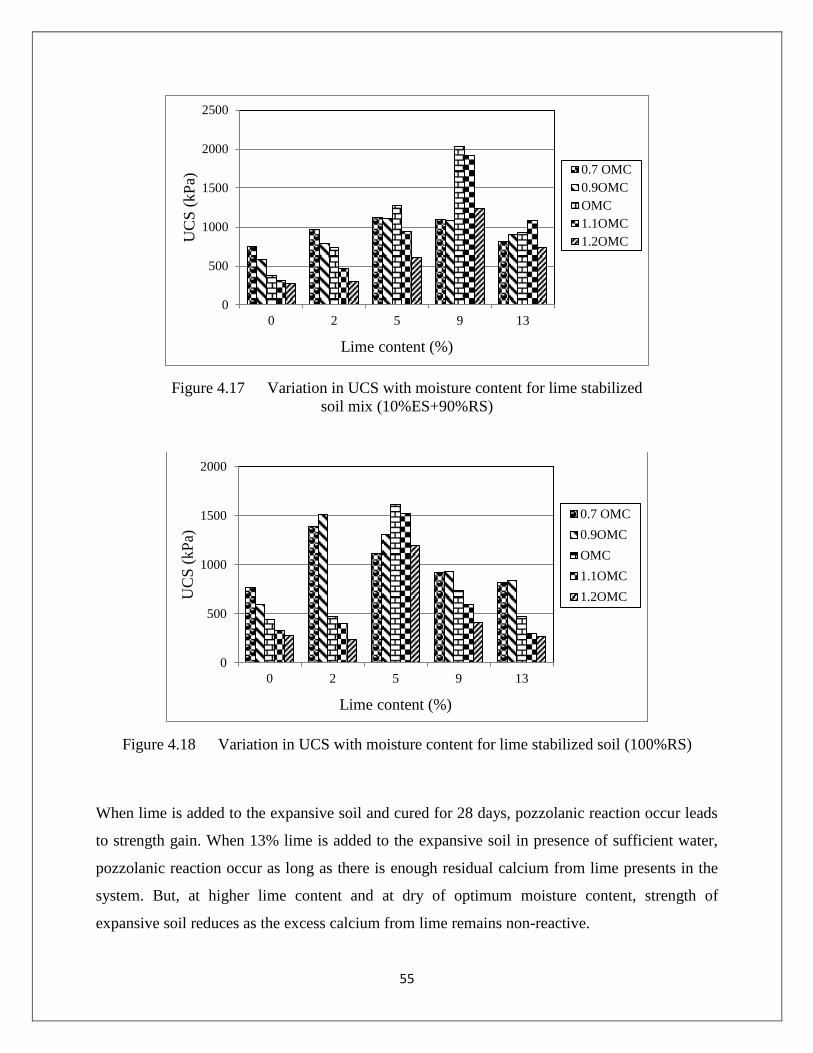
55
Figure 4.17 Variation in UCS with moisture content for lime stabilized
soil mix (10%ES+90%RS)
Figure 4.18 Variation in UCS with moisture content for lime stabilized soil (100%RS)
When lime is added to the expansive soil and cured for 28 days, pozzolanic reaction occur leads
to strength gain. When 13% lime is added to the expansive soil in presence of sufficient water,
pozzolanic reaction occur as long as there is enough residual calcium from lime presents in the
system. But, at higher lime content and at dry of optimum moisture content, strength of
expansive soil reduces as the excess calcium from lime remains non-reactive.
0
500
1000
1500
2000
2500
0 2 5 9 13
UC
S (
kP
a)
Lime content (%)
0.7 OMC
0.9OMC
OMC
1.1OMC
1.2OMC
0
500
1000
1500
2000
0 2 5 9 13
UC
S (
kP
a)
Lime content (%)
0.7 OMC
0.9OMC
OMC
1.1OMC
1.2OMC
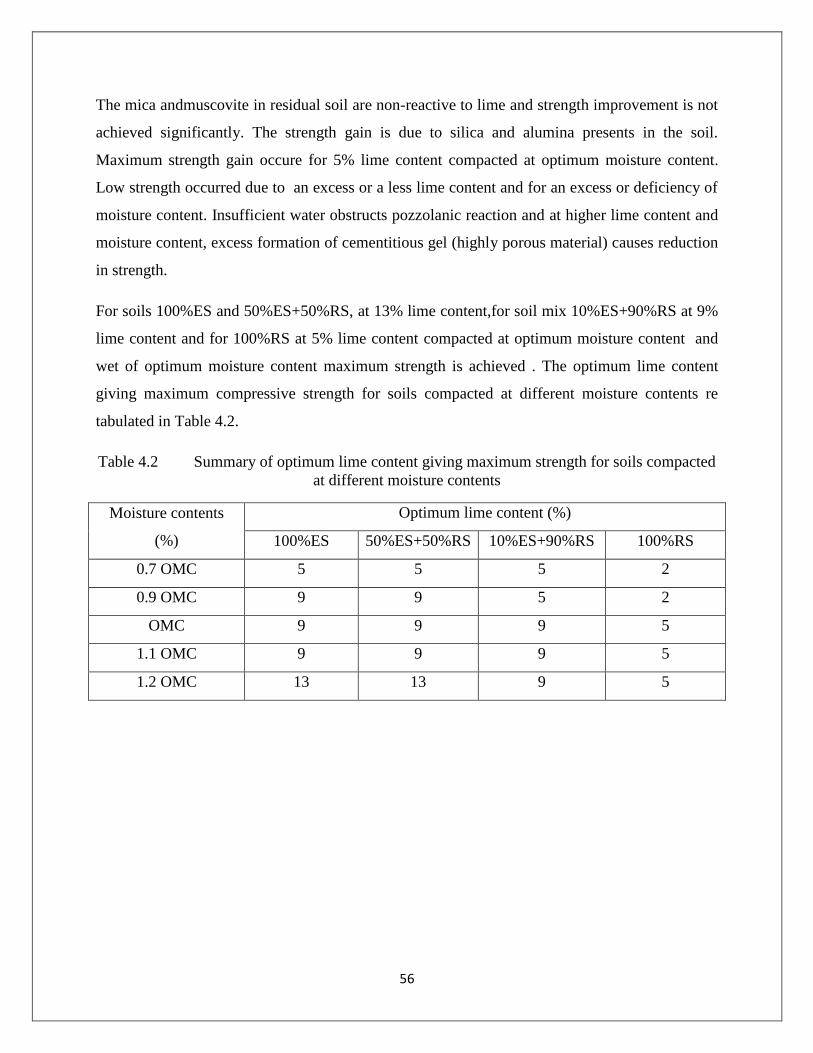
56
The mica andmuscovite in residual soil are non-reactive to lime and strength improvement is not
achieved significantly. The strength gain is due to silica and alumina presents in the soil.
Maximum strength gain occure for 5% lime content compacted at optimum moisture content.
Low strength occurred due to an excess or a less lime content and for an excess or deficiency of
moisture content. Insufficient water obstructs pozzolanic reaction and at higher lime content and
moisture content, excess formation of cementitious gel (highly porous material) causes reduction
in strength.
For soils 100%ES and 50%ES+50%RS, at 13% lime content,for soil mix 10%ES+90%RS at 9%
lime content and for 100%RS at 5% lime content compacted at optimum moisture content and
wet of optimum moisture content maximum strength is achieved . The optimum lime content
giving maximum compressive strength for soils compacted at different moisture contents re
tabulated in Table 4.2.
Table 4.2 Summary of optimum lime content giving maximum strength for soils compacted
at different moisture contents
Moisture contents
(%)
Optimum lime content (%)
100%ES 50%ES+50%RS 10%ES+90%RS 100%RS
0.7 OMC 5 5 5 2
0.9 OMC 9 9 5 2
OMC 9 9 9 5
1.1 OMC 9 9 9 5
1.2 OMC 13 13 9 5
57
CHAPTER 5
CONCLUSION
5.1 SUMMARY
The main objectives of this research were identified as follows:
1. To study the plasticity, swell and shrinkage characteristic of soils
2. To study the compaction characteristics of lime treated soils
3. To study the strength development in lime treated soils and hence to find out the
optimum percentage of lime required to stabilize the soils
To achieve the above objectives, an overview on lime stabilization of clay soil has been done and
also, a review of various studies on geotechnical behaviour (plasticity, swelling, shrinkage and
strength) of lime stabilized expansive soils was carried out and the literature review has been
summarized in chapter 2. Indian standard (Methods of test for soils) codes are followed to
conduct various soil tests.
An extensive experimental program has been undertaken. Four types of soils have been
synthesized taking highly expansive montmorillonite clay and a residual silty soil. The
artificially prepared soils have a wide range of plasticity. These artificial soils are added with
different proportions of lime and a series of tests were conducted to find out their plasticity,
swell and shrinkage characteristics, compaction characteristics and the strength properties.
5.2 CONCLUSIONS
Many of the important engineering properties of soils can be enhanced by the addition of lime.
The properties of such soil-lime mixtures vary and depend upon the type of soil. To develop an
understanding of the possible mechanisms involved, a series of experiments through variation of
parameters were carried out, based on which the following conclusions are drawn:
The liquid limit of soil decreases with an increase in lime content. This result is obtained due to
reduction in thickness of double layer as the electrolyte concentration increases in the pore fluid.

58
1. The plastic limit of soil increases with lime contents as the charge concentration of pore
water increases, the viscosity increases and offers high resistance against interparticle
movement.
2. The plasticity of soil reduces with increased lime content.
3. There is a significant reduction in free swell index of high plastic clay at low lime content
in comparison to other low and medium plastic clays.
4. The amount of shrinkage arrest caused by addition of lime correlated with raw soils
specific surface area. More shrinkage occurred for high plastic clays.
5. The compaction characteristics of soils vary significantly at low lime content. The
optimum moisture content increases and maximum dry density decreases with increased
lime content.
6. The strength of lime treated soil depended on type of soil, lime content, curing period and
moisture content. For high plastic clays maximum strength was achieved at 60 days cured
sample with 9% lime content whereas, for low plastic clay occurred with 5% lime.
7. More strength is achieved at dry side of optimum than wet side of optimum moisture
content for virgin soils. When the soils are cured for 28 days with varying moisture
content, there is a significant increase in strength for high plastic clays when treated with
high lime content with high moisture content, and for low and intermediate plastic clay,
at comparatively low lime content.
5.3 SCOPE OF FUTURE WORK
1. Durability aspects of lime treated soil like drying and wetting, freezing and thawing
actions and response to various chemicals like alkalis, chlorides, sulphides are not
investigated.
2. Research can be extended to find out the hydration products, morphology and microsture
of lime treated soil and co-relations with developed strength.
3. Other geotechnical parameters such as hydraulic conductivity, consolidation parameters
can also be performed.
4. The response of lime stabilized clays under repeated loading can be evaluated.
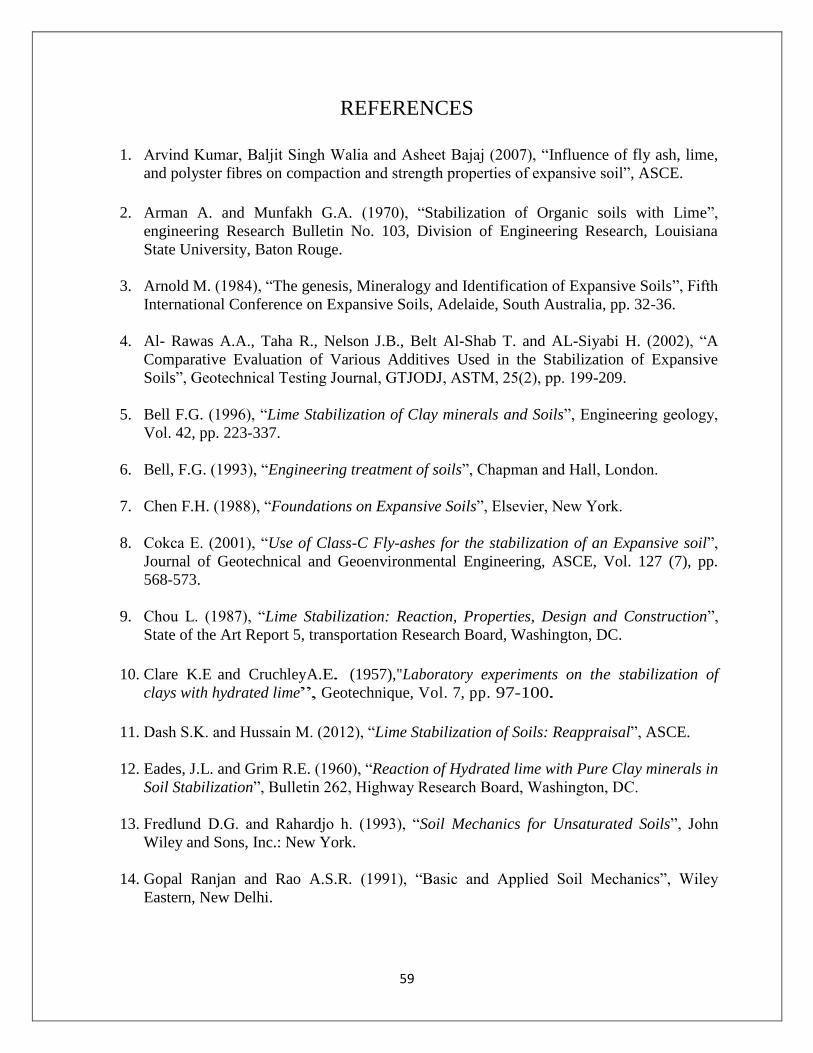
59
REFERENCES
1. Arvind Kumar, Baljit Singh Walia and Asheet Bajaj (2007), “Influence of fly ash, lime,
and polyster fibres on compaction and strength properties of expansive soil”, ASCE.
2. Arman A. and Munfakh G.A. (1970), “Stabilization of Organic soils with Lime”,
engineering Research Bulletin No. 103, Division of Engineering Research, Louisiana
State University, Baton Rouge.
3. Arnold M. (1984), “The genesis, Mineralogy and Identification of Expansive Soils”, Fifth
International Conference on Expansive Soils, Adelaide, South Australia, pp. 32-36.
4. Al- Rawas A.A., Taha R., Nelson J.B., Belt Al-Shab T. and AL-Siyabi H. (2002), “A
Comparative Evaluation of Various Additives Used in the Stabilization of Expansive
Soils”, Geotechnical Testing Journal, GTJODJ, ASTM, 25(2), pp. 199-209.
5. Bell F.G. (1996), “Lime Stabilization of Clay minerals and Soils”, Engineering geology,
Vol. 42, pp. 223-337.
6. Bell, F.G. (1993), “Engineering treatment of soils”, Chapman and Hall, London.
7. Chen F.H. (1988), “Foundations on Expansive Soils”, Elsevier, New York.
8. Cokca E. (2001), “Use of Class-C Fly-ashes for the stabilization of an Expansive soil”,
Journal of Geotechnical and Geoenvironmental Engineering, ASCE, Vol. 127 (7), pp.
568-573.
9. Chou L. (1987), “Lime Stabilization: Reaction, Properties, Design and Construction”,
State of the Art Report 5, transportation Research Board, Washington, DC.
10. Clare K.E and CruchleyA.E. (1957),"Laboratory experiments on the stabilization of
clays with hydrated lime”, Geotechnique, Vol. 7, pp. 97-100.
11. Dash S.K. and Hussain M. (2012), “Lime Stabilization of Soils: Reappraisal”, ASCE.
12. Eades, J.L. and Grim R.E. (1960), “Reaction of Hydrated lime with Pure Clay minerals in
Soil Stabilization”, Bulletin 262, Highway Research Board, Washington, DC.
13. Fredlund D.G. and Rahardjo h. (1993), “Soil Mechanics for Unsaturated Soils”, John
Wiley and Sons, Inc.: New York.
14. Gopal Ranjan and Rao A.S.R. (1991), “Basic and Applied Soil Mechanics”, Wiley
Eastern, New Delhi.

60
15. Hilt G.H. and Davidson D.T. (1960), “Lime Fixation on clayey Soils”, Highway Research
Board, No. 262, pp 20 - 32.
16. Heller L. and Taylor H.G.W.(1956), "Crystallographic data for calcium silicates", Dept.
of Sci. and Ind. Res., Build.Res.Station, H.M. Stationery Office, London.
17. Ingles 0.G. (1964), "The nature and strength of the interparticle bonds in natural and
stabilized soils", Mechanism of soil stabilization, D-9, Proc. Of a colloquium held at
Syndal Victoria, Australia.
18. Jones D.E. and Holtz W.G. (1973), “Expansive soils- The hidden disaster”, Civil Engg.,
ASCE, New York, NY, pp. 87-89.
19. Komine H. and Ogata N. (1996), “Prediction for swelling Characteristics of Compacted
Bentonite”, Canadian Geotechnical Journal, Vol. 33, pp. 11-22.
20. Kehew A.E. (1995), “Geology for Engineers and Environmental Scientists”, Prentice
Hall, 574 pages.
21. Kinithua J.M., Wild S. and Jones G.I. (1999), “Effects of Monovalent and Divalent Metal
Sulphates on Consistency and Compaction of Lime-Stabilized Kaolinite”, Applied Clay
Science, Vol. 14, pp. 27-45.
22. Kate J.M. (2009),” Behaviour of expansive clays treated with lime –flyash admixtures”,
IGC, Guntur, India.
23. Kate J.M., Kumar Sunil, Bhorkar M.P. (1012), “Influence of bentonite proportions on
swelling characteristics of clay mixes”, IGC, Delhi.
24. Little D.L. (1987), “Fundamentals of the Stabilization of Soil with Lime”, Bulletin 332,
NLA, Arlington, V.A.
25. Lees G., Abdelkader M.O. and Hamdani S.K. (1982), “Sodium Chloride as an Additive
in Lime-Soil Stabilization”, Highway Engineer, Vol. 29, No. 12, pp. 2-8.
26. Little D.N. (1995), “Handbook for Stabilization of Pavement Subgrades and Base
Courses with Lime”, Kendall/Hunt, Iowa.
27. Mathew P.K. and Rao S.N. (1997), “Effect of Lime on cation exchange capacity of
Marine Clay”, Journal of Geotechnical and Geoenvironmental Engineering”, Vol. 123,
No. 2, pp. 183-185.
28. Mateous M. (1964), "Soil lime research at Iow a State University", J. Soil Mech. and
Found. Engg. Div., ASCE, 90(2), 127-153.
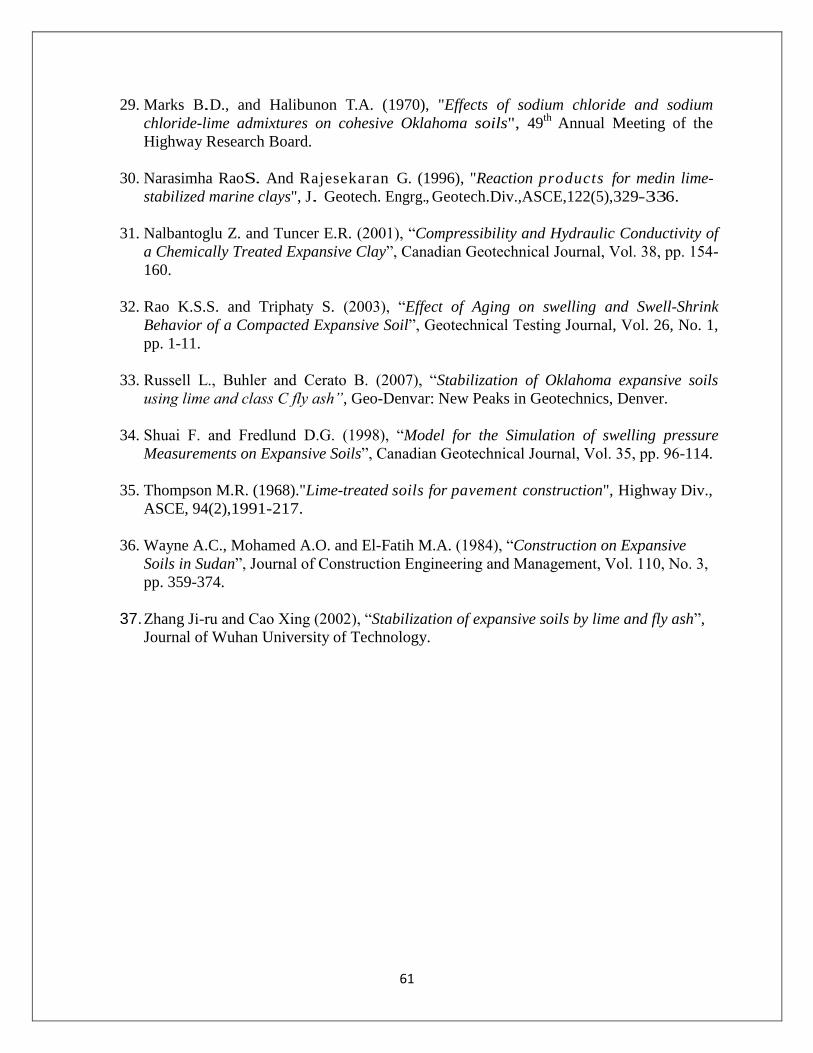
61
29. Marks B.D., and Halibunon T.A. (1970), "Effects of sodium chloride and sodium
chloride-lime admixtures on cohesive Oklahoma soils", 49th
Annual Meeting of the
Highway Research Board.
30. Narasimha RaoS. And Rajesekaran G. (1996), "Reaction products for medin lime-
stabilized marine clays", J. Geotech. Engrg., Geotech.Div.,ASCE,122(5),329-336.
31. Nalbantoglu Z. and Tuncer E.R. (2001), “Compressibility and Hydraulic Conductivity of
a Chemically Treated Expansive Clay”, Canadian Geotechnical Journal, Vol. 38, pp. 154-
160.
32. Rao K.S.S. and Triphaty S. (2003), “Effect of Aging on swelling and Swell-Shrink
Behavior of a Compacted Expansive Soil”, Geotechnical Testing Journal, Vol. 26, No. 1,
pp. 1-11.
33. Russell L., Buhler and Cerato B. (2007), “Stabilization of Oklahoma expansive soils
using lime and class C fly ash”, Geo-Denvar: New Peaks in Geotechnics, Denver.
34. Shuai F. and Fredlund D.G. (1998), “Model for the Simulation of swelling pressure
Measurements on Expansive Soils”, Canadian Geotechnical Journal, Vol. 35, pp. 96-114.
35. Thompson M.R. (1968)."Lime-treated soils for pavement construction", Highway Div.,
ASCE, 94(2),1991-217.
36. Wayne A.C., Mohamed A.O. and El-Fatih M.A. (1984), “Construction on Expansive
Soils in Sudan”, Journal of Construction Engineering and Management, Vol. 110, No. 3,
pp. 359-374.
37. Zhang Ji-ru and Cao Xing (2002), “Stabilization of expansive soils by lime and fly ash”,
Journal of Wuhan University of Technology.