Genomic inferences of domestication events are ...
16
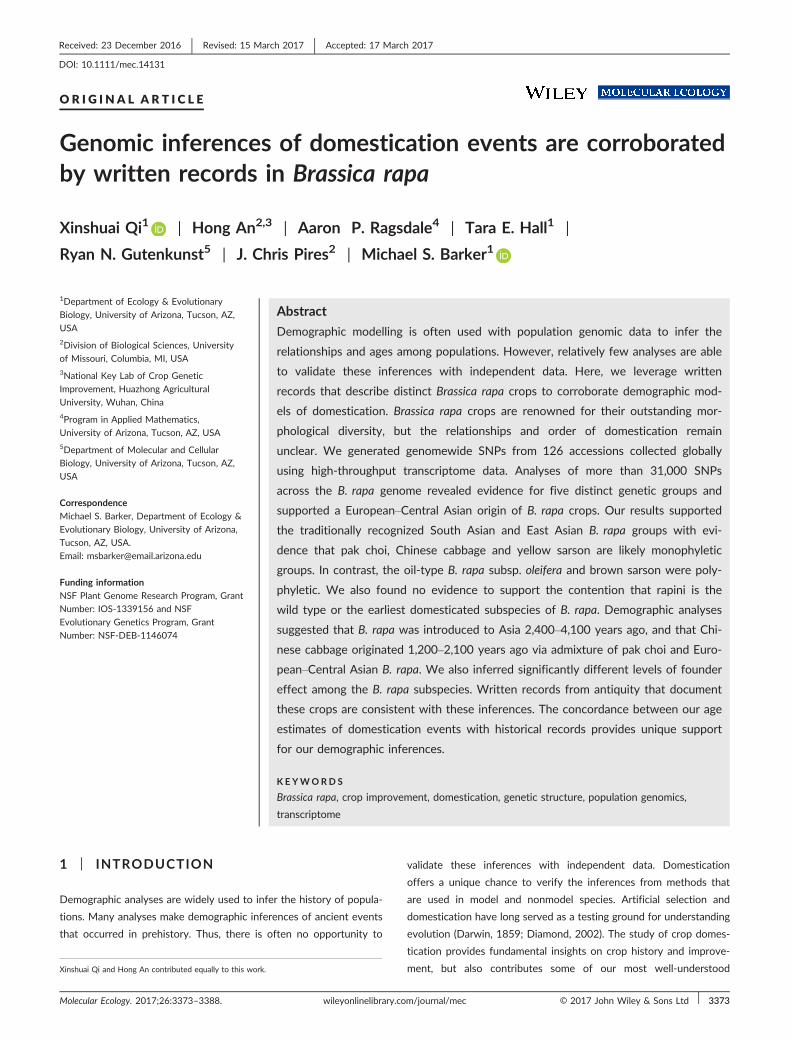
ORIGINAL ARTICLE Genomic inferences of domestication events are corroborated by written records in Brassica rapa Xinshuai Qi 1 | Hong An 2,3 | Aaron P. Ragsdale 4 | Tara E. Hall 1 | Ryan N. Gutenkunst 5 | J. Chris Pires 2 | Michael S. Barker 1 1 Department of Ecology & Evolutionary Biology, University of Arizona, Tucson, AZ, USA 2 Division of Biological Sciences, University of Missouri, Columbia, MI, USA 3 National Key Lab of Crop Genetic Improvement, Huazhong Agricultural University, Wuhan, China 4 Program in Applied Mathematics, University of Arizona, Tucson, AZ, USA 5 Department of Molecular and Cellular Biology, University of Arizona, Tucson, AZ, USA Correspondence Michael S. Barker, Department of Ecology & Evolutionary Biology, University of Arizona, Tucson, AZ, USA. Email: [email protected] Funding information NSF Plant Genome Research Program, Grant Number: IOS-1339156 and NSF Evolutionary Genetics Program, Grant Number: NSF-DEB-1146074 Abstract Demographic modelling is often used with population genomic data to infer the relationships and ages among populations. However, relatively few analyses are able to validate these inferences with independent data. Here, we leverage written records that describe distinct Brassica rapa crops to corroborate demographic mod- els of domestication. Brassica rapa crops are renowned for their outstanding mor- phological diversity, but the relationships and order of domestication remain unclear. We generated genomewide SNPs from 126 accessions collected globally using high-throughput transcriptome data. Analyses of more than 31,000 SNPs across the B. rapa genome revealed evidence for five distinct genetic groups and supported a European–Central Asian origin of B. rapa crops. Our results supported the traditionally recognized South Asian and East Asian B. rapa groups with evi- dence that pak choi, Chinese cabbage and yellow sarson are likely monophyletic groups. In contrast, the oil-type B. rapa subsp. oleifera and brown sarson were poly- phyletic. We also found no evidence to support the contention that rapini is the wild type or the earliest domesticated subspecies of B. rapa. Demographic analyses suggested that B. rapa was introduced to Asia 2,400–4,100 years ago, and that Chi- nese cabbage originated 1,200–2,100 years ago via admixture of pak choi and Euro- pean–Central Asian B. rapa. We also inferred significantly different levels of founder effect among the B. rapa subspecies. Written records from antiquity that document these crops are consistent with these inferences. The concordance between our age estimates of domestication events with historical records provides unique support for our demographic inferences. KEYWORDS Brassica rapa, crop improvement, domestication, genetic structure, population genomics, transcriptome 1 | INTRODUCTION Demographic analyses are widely used to infer the history of popula- tions. Many analyses make demographic inferences of ancient events that occurred in prehistory. Thus, there is often no opportunity to validate these inferences with independent data. Domestication offers a unique chance to verify the inferences from methods that are used in model and nonmodel species. Artificial selection and domestication have long served as a testing ground for understanding evolution (Darwin, 1859; Diamond, 2002). The study of crop domes- tication provides fundamental insights on crop history and improve- ment, but also contributes some of our most well-understood Xinshuai Qi and Hong An contributed equally to this work. Received: 23 December 2016 | Revised: 15 March 2017 | Accepted: 17 March 2017 DOI: 10.1111/mec.14131 Molecular Ecology. 2017;26:3373–3388. wileyonlinelibrary.com/journal/mec © 2017 John Wiley & Sons Ltd | 3373
Transcript of Genomic inferences of domestication events are ...
OR I G I N A L A R T I C L E
Genomic inferences of domestication events are corroboratedby written records in Brassica rapa
Xinshuai Qi1 | Hong An2,3 | Aaron P. Ragsdale4 | Tara E. Hall1 |
Ryan N. Gutenkunst5 | J. Chris Pires2 | Michael S. Barker1
1Department of Ecology & Evolutionary
Biology, University of Arizona, Tucson, AZ,
USA
2Division of Biological Sciences, University
of Missouri, Columbia, MI, USA
3National Key Lab of Crop Genetic
Improvement, Huazhong Agricultural
University, Wuhan, China
4Program in Applied Mathematics,
University of Arizona, Tucson, AZ, USA
5Department of Molecular and Cellular
Biology, University of Arizona, Tucson, AZ,
USA
Correspondence
Michael S. Barker, Department of Ecology &
Evolutionary Biology, University of Arizona,
Tucson, AZ, USA.
Email: [email protected]
Funding information
NSF Plant Genome Research Program, Grant
Number: IOS-1339156 and NSF
Evolutionary Genetics Program, Grant
Number: NSF-DEB-1146074
Abstract
Demographic modelling is often used with population genomic data to infer the
relationships and ages among populations. However, relatively few analyses are able
to validate these inferences with independent data. Here, we leverage written
records that describe distinct Brassica rapa crops to corroborate demographic mod-
els of domestication. Brassica rapa crops are renowned for their outstanding mor-
phological diversity, but the relationships and order of domestication remain
unclear. We generated genomewide SNPs from 126 accessions collected globally
using high-throughput transcriptome data. Analyses of more than 31,000 SNPs
across the B. rapa genome revealed evidence for five distinct genetic groups and
supported a European–Central Asian origin of B. rapa crops. Our results supported
the traditionally recognized South Asian and East Asian B. rapa groups with evi-
dence that pak choi, Chinese cabbage and yellow sarson are likely monophyletic
groups. In contrast, the oil-type B. rapa subsp. oleifera and brown sarson were poly-
phyletic. We also found no evidence to support the contention that rapini is the
wild type or the earliest domesticated subspecies of B. rapa. Demographic analyses
suggested that B. rapa was introduced to Asia 2,400–4,100 years ago, and that Chi-
nese cabbage originated 1,200–2,100 years ago via admixture of pak choi and Euro-
pean–Central Asian B. rapa. We also inferred significantly different levels of founder
effect among the B. rapa subspecies. Written records from antiquity that document
these crops are consistent with these inferences. The concordance between our age
estimates of domestication events with historical records provides unique support
for our demographic inferences.
K E YWORD S
Brassica rapa, crop improvement, domestication, genetic structure, population genomics,
transcriptome
1 | INTRODUCTION
Demographic analyses are widely used to infer the history of popula-
tions. Many analyses make demographic inferences of ancient events
that occurred in prehistory. Thus, there is often no opportunity to
validate these inferences with independent data. Domestication
offers a unique chance to verify the inferences from methods that
are used in model and nonmodel species. Artificial selection and
domestication have long served as a testing ground for understanding
evolution (Darwin, 1859; Diamond, 2002). The study of crop domes-
tication provides fundamental insights on crop history and improve-
ment, but also contributes some of our most well-understoodXinshuai Qi and Hong An contributed equally to this work.
Received: 23 December 2016 | Revised: 15 March 2017 | Accepted: 17 March 2017
DOI: 10.1111/mec.14131
Molecular Ecology. 2017;26:3373–3388. wileyonlinelibrary.com/journal/mec © 2017 John Wiley & Sons Ltd | 3373

systems to reveal the powers and limits of selection to shape organ-
isms (Gross & Olsen, 2010; Meyer & Purugganan, 2013; Olsen &
Wendel, 2013; Purugganan & Fuller, 2009; Ross-Ibarra, Morrell, &
Gaut, 2007). Brassica crops are arguably one of the best examples to
illustrate the diversity that can be created by artificial selection (Pra-
kash, Wu, & Bhat, 2011; Purugganan, Boyles, & Suddith, 2000). The
three Brassica crops most well known for their morphological diver-
sity are B. rapa (AA, 2n = 20), B. oleracea (CC, 2n = 18) and their
allopolyploid derivative, B. napus (AACC, 2n = 38). Each of these taxa
includes several cultivated subspecies that were domesticated for a
variety of uses. Long considered a classic textbook example of plant
domestication (Darwin, 1859; Ladizinsky, 2012; Zohary, Hopf, &
Weiss, 2012) and the power of artificial selection (Purugganan et al.,
2000), B. oleracea includes a diversity of crops such as broccoli, cauli-
flower, cabbage, kale, Brussels sprout and kohlrabi. However, its sis-
ter species, B. rapa, has similar morphological variation and
represents a parallel example for comparative analyses of artificial
selection and evolution. Several subspecies are recognized in B. rapa
that have been cultivated for particular phenotypic characteristics.
These include turnip (subsp. rapa) with an enlarged edible root, yel-
low (subsp. trilocularis) and brown sarsons (subsp. dichotoma) that are
used as mustard and oil seeds mainly in India, the oilseed field mus-
tard (subsp. oleifera), and the leafy East Asian vegetables pak choi
(subsp. chinensis) and Chinese cabbage (subsp. pekinensis) with their
enlarged mid-rib and leaves (Figure 1). There are also several less
broadly known leafy subspecies, including rapini (subsp. sylvestris),
choy sum (subsp. parachinensis), zi cai tai (subsp. purpuraria), tatsoi
(subsp. narinosa), mizuna (subsp. nipposinica) and komatsuna (or Japa-
nese mustard spinach/rapini, subsp. perviridis).
Domestication of the diverse B. rapa crops most likely occurred
during written history (after ~3,500 BCE). Many of the classically
studied crops, such as maize and Asian rice, were domesticated in
prehistory (Fuller et al., 2009; Gross & Zhao, 2014; Kovach, Sweeney,
& McCouch, 2007; Long, Benz, Donahue, Jull, & Toolin, 2006; Molina
et al., 2011; Piperno & Flannery, 2001; Piperno, Ranere, Holst, Iriarte,
& Dickau, 2009; Sang & Ge, 2013; Smith, 1997). A written record of
domestication for most crops is simply unavailable to develop
hypotheses and corroborate genomic analyses. In contrast, the oldest
mention of Brassica crops in general dates back nearly 5,000 years.
Brassica crops were first described in a Chinese almanac from ~3,000
BCE and ancient Indian texts from around 1,500 BCE (Prakash et al.,
2011). Although the record is unclear on which European B. rapa
crop was first domesticated, turnips were on the list of plants grown
in the garden of Merodach-baladan in Babylonia (722–711 BCE)
(K€orber-Grohne, 1987). Consistent with this early written record,
archaeological evidence of turnip seeds and roots has been reported
from multiple archaeological sites of Neolithic villages in Switzerland,
India and China (Ignatov, Artemyeva, & Hida, 2008; Prakash and
Hinata 1980). Brassica rapa subsp. rapa was clearly described nearly
2600 years ago in Shi Jing, the oldest existing Chinese classic poetry
collection (Li, 1981; Luo, 1992; Ye, 1989). The authors of Shi Jing
used the ancient Chinese character for turnip, indicating that this
crop was in East Asia by that time. The earliest historical records of
Chinese cabbage (B. rapa subs. pekinensis), “Niu Du Song (beef tripe
cabbage)”, appear in Xin Xiu Ben Cao, one of the earliest official phar-
macy books edited by Jing Su (659 CE). A clear description of Chi-
nese cabbage is also found in Ben Cao Tu Jing (1,061 CE) by Song
Su. He described Niu Du Song in Yangzhou city in southern China as
a plant with large, round and tender leaves with a uniquely wrinkled
leaf. Based on these documents, we may expect that many of the
Asian B. rapa crops were domesticated as long as 3,500 years ago
and that B. rapa subsp. pekinensis may be at least 1,500 years old.
Despite the economic importance and historical records of
B. rapa crops, our understanding of their relationships and origins is
still not well resolved. Previous studies have attempted to identify
genetically discrete groups among B. rapa crops with molecular
markers (Del Carpio et al., 2011a,b; Guo, Chen, Li, & Cowling, 2014;
McGrath & Quiros, 1992; Pang et al., 2015; Ren, McFerson, Li,
Kresovich, & Lamboy, 1995; Takahashi, Yokoi, & Takahata, 2015;
Takuno, Kawahara, & Ohnishi, 2006; Tanhuanp€a€a, Erkkil€a, Tenhola-
Roininen, Tanskanen, & Manninen, 2016; Zhao et al., 2005, 2007,
2010). Most analyses identify three ambiguous geographic groups
present in Europe and Central Asia, South Asia and East Asia (Del
Carpio et al., 2011a,b; Guo et al., 2014; Pang et al., 2015) except a
recent analysis that found no evidence for geographic structure
among diverse B. rapa accessions (Tanhuanp€a€a et al., 2016). In addi-
tion, previous genetic and empirical studies suggested two distinct
hypotheses for the origin of Chinese cabbage: domesticated directly
from pak choi (Song, Osborn, & Williams, 1990; Takuno et al., 2006;
Zhao et al., 2005) or via genetic admixture of turnip and pak choi
(Li, 1981; Ren et al., 1995). Although many contemporary studies
have included large and diverse samples, the major limitation to dis-
tinguishing B. rapa subspecies and crops may be the number and
quality of the genetic markers. Fine-scale resolution of relationships
among groups within B. rapa may be beyond the power of tradi-
tional marker systems because of their relatively short evolutionary
history with high rates of outcrossing. Clarification of the number of
genetically distinct groups and their relationships is needed to
address basic questions about the domestication of B. rapa.
Genome assemblies of multiple Brassica species (Chalhoub et al.,
2014; Liu et al., 2014; Parkin et al., 2014; Wang et al., 2011) and
advancements in sequencing technology provide an opportunity to
resolve the relationships among subspecies and the domestication
history of B. rapa. Recently, Cheng et al. (2016) resequenced 199
B. rapa accessions. Their STRUCTURE and phylogenomic analyses pro-
vided improved support for the relationships among the primary sub-
species within B. rapa. However, their sampling did not include
several important Eurasian B. rapa crops that are crucial for under-
standing the timing and order of B. rapa domestication. For example,
no samples were collected from Central Asia, the potential centre of
origin for B. rapa. Cheng et al. (2016) also only sampled one yellow
sarson accession and did not include brown sarson (subsp. di-
chotoma) or rapini (subsp. sylvestris). Diverse sampling of accessions
combined with population genomic approaches is needed to better
resolve the complex series of events that occurred during domestica-
tion of the B. rapa crops.
3374 | QI ET AL.
In this study, we sequenced the transcriptomes of 126 acces-
sions representative of the geographic and crop diversity of B. rapa.
We analysed thousands of SNPs from across the nuclear genome to
resolve the genetic structure and relationships of B. rapa crops.
Using a diffusion approximation approach, @a@i (Gutenkunst, Her-
nandez, Williamson, & Bustamante, 2009), we evaluated models of
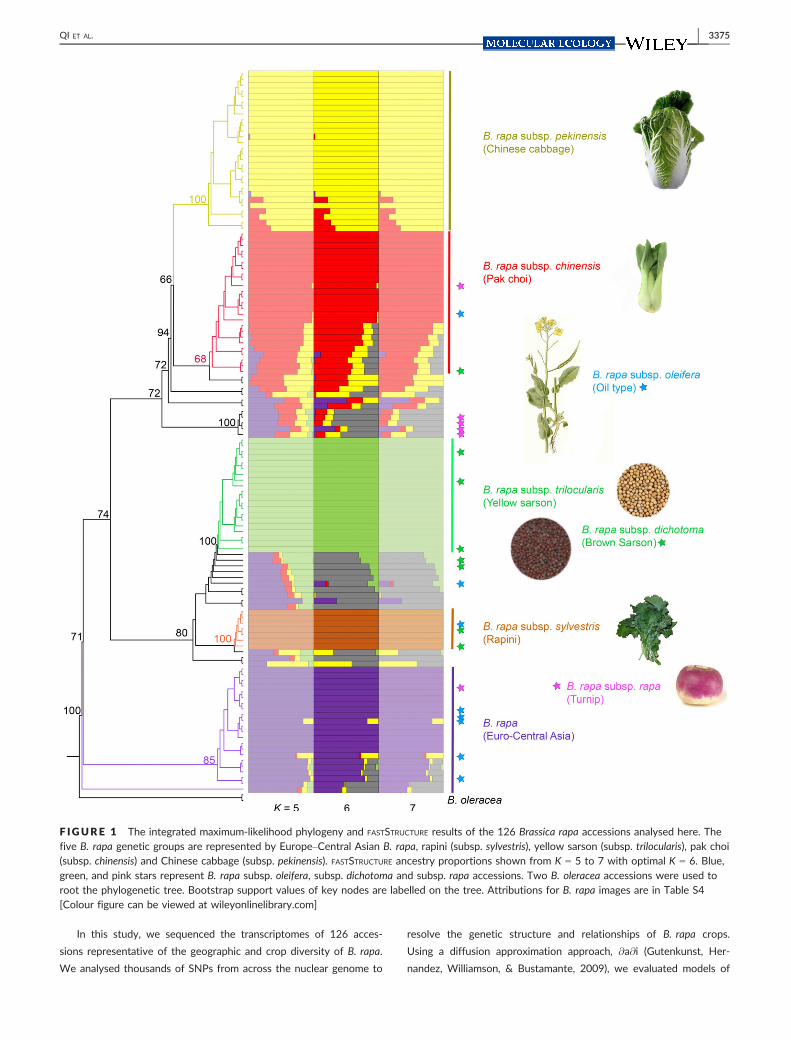
F IGURE 1 The integrated maximum-likelihood phylogeny and FASTSTRUCTURE results of the 126 Brassica rapa accessions analysed here. Thefive B. rapa genetic groups are represented by Europe–Central Asian B. rapa, rapini (subsp. sylvestris), yellow sarson (subsp. trilocularis), pak choi(subsp. chinensis) and Chinese cabbage (subsp. pekinensis). FASTSTRUCTURE ancestry proportions shown from K = 5 to 7 with optimal K = 6. Blue,green, and pink stars represent B. rapa subsp. oleifera, subsp. dichotoma and subsp. rapa accessions. Two B. oleracea accessions were used toroot the phylogenetic tree. Bootstrap support values of key nodes are labelled on the tree. Attributions for B. rapa images are in Table S4[Colour figure can be viewed at wileyonlinelibrary.com]
QI ET AL. | 3375
the demographic history and diversification of B. rapa, as well as
estimated the timing of domestication events in China and India.
These age estimates were compared to the written records available
for each phase of B. rapa domestication. We also estimated the
reduction of genetic diversity and effective population size in each
Asian B. rapa subspecies due to the potential founder effect during
their introduction and domestication in Asia. Our analyses provide
new insights into the origins and relationships of B. rapa crops.
Given that most studies of domestication are focused on crops that
arose during prehistory, our analyses of B. rapa provide a unique
opportunity to explore crop domestication and diversification with a
written record.
2 | MATERIALS AND METHODS
2.1 | Plant materials
We collected seeds of 143 B. rapa accessions, with 139 samples
from USDA GRIN database (http://www.ars-grin.gov/) and four from
the authors’ collection. Samples were selected to maximize represen-
tation of major B. rapa subspecies. These collections include B. rapa
and its 11 subspecies from 20 countries worldwide (Table S1). Six of
the major subspecies have more than eight representatives, ran-
domly chosen from different sources, with the exception of the two
sylvestris lines collected by Dr. G�omez Campo. The Asian vegetable
subspecies parachinensis, narinosa, nipposinica and perviridis are likely
derived from either or both chinensis and pekinensis (Cheng et al.,
2016). Therefore, only representative accessions of these Asian veg-
etable subspecies were included in this analysis. After we removed
misidentified seed accessions (see below), 126 B. rapa accessions
remained for the following analyses.
2.2 | Plant growth conditions and tissue collection
All seeds were grown in a Conviron growth chamber with 16 hrs of
light at 23°C. and 8 hrs of dark at 20°C. at the Bond Life Science
Center, University of Missouri (Columbia, MI, USA) during March to
May 2015. All samples were taken from the second youngest leaf
20 days after germination, and then snap-frozen in liquid nitrogen
and stored at �80°C.
2.3 | Sample preparation, RNA isolation, libraryconstruction
Total RNA was isolated using the PureLinkTM RNA Mini Kit (Invitro-
gen, USA), following the instructions. RNA samples were qualified
and quantified by a NanoDrop 1000 spectrophotometer (NanoDrop
Technologies, USA). After that, double-stranded cDNA was synthe-
sized according to the manufacturer’s protocol of the Maxima H
Minus Double-Stranded cDNA Synthesis Kit (Thermo, Lithuania) and
purified by the GeneJET PCR Purification Kit (Thermo). All samples
were sequenced with Illumina HiSeq 2000 system at the University
of Missouri DNA core. Each sample contained about 9 million 250-bp
pair-end reads. SRA files for the samples are available at NCBI-SRA
(SRP072186, http://www.ncbi.nlm.nih.gov/sra/SRP072186).
2.4 | Sequence assembly and alignment
We first trimmed each fastq file using Trimmomatic (Bolger, Lohse,
& Usadel, 2014). Read quality was assessed with FASTQC (Andrews
et al., 2010). The reference B. rapa genome (version 1.5) was down-
loaded from the Brassica Database (http://brassicadb.org/brad/).
For the reference-based assemblies, we used TOPHAT version
2.0.14 (Trapnell, Pachter, & Salzberg, 2009) with BOWTIE2 version
2.2.5 (Langmead & Salzberg, 2012). Variant calling was performed
using SAMTOOLS (Li et al., 2009). We retained only SNPs and did
not consider indels or MNPs in subsequent analyses. To obtain
high-quality SNPs for downstream analyses, we performed multiple
SNP filtering steps: the SNPs were first filtered with vcfutils.pl
script in SAMTOOLS/BCFTOOLS package (Li et al., 2009) and vcffilter
to only include SNPs with depth >10 and mapping quality >30.
For the phylogenetic and genetic structure analyses, we then fil-
tered the remaining SNPs with PLINK version 1.9 (Purcell et al.,
2007) to only include SNPs with a > 90% genotyping rate and
minor allele frequency (MAF) higher than 5%. In contrast, our fil-
tering for the @a@i demographic models and nucleotide diversity
analyses retained many more SNPs to estimate the allele frequency
spectrum. Following filtering for depth and mapping quality, we
annotated the SNPs with SnpEff (Cingolani et al., 2012) and only
retained synonymous SNPs. Further, we implemented a 25-kb slid-
ing window neutrality test (Tajima’s D) in VCFTOOLS (Danecek et al.,
2011) to filter out SNPs that may be directly or indirectly under
selection.
2.5 | Identification of misidentified Brassica seedcontaminants
Misidentified seed accessions are not uncommon in plant germplasm
collections and can confound analyses if not recognized. To identify
potential seed contamination from B. napus and B. oleracea, we
BLASTed the de novo-assembled reading frames of each newly
sequenced accession against the latest B. rapa, B. oleracea (TO1000
version 2.1; genomevolution.org) and B. napus (version 4.1; brassi-
cadb.org) genomes. De novo assemblies for each accession were per-
formed in SOAPDENOVO-TRANS version 1.03 (Xie et al., 2014) with a
127 kmer. Accessions with a majority of best BLAST hits to B. oleracea
and/or B. napus were flagged as potential contaminants. We further
verified the suspicious accessions through DNA C-value measure-
ment using flow cytometry. Fresh leaf samples were sent to the
Flow Cytometry Laboratory at the Benaroya Research Institute (WA)
for flow cytometry. The C-values of B. rapa, B. oleraceae and B. na-
pus are significantly different from each other and provide an alter-
native method of verification. A total of 11 suspicious B. napus, two
suspicious B. oleracea and four suspicious autopolyploid B. rapa were
identified among the B. rapa accessions from the USDA germplasm
seed bank (Table S2). These accessions were removed from further
3376 | QI ET AL.

analyses in this study. After contaminant removal, 126 B. rapa acces-
sions remained for the following analyses.
2.6 | Phylogenetic inference and genetic structure
SNPs called from mapping reads to the Brassica rapa reference gen-
ome were used for phylogenetic inference and genetic structure
analyses. The SNP data set was concatenated from ped format to
fasta format using a custom perl script. The data set included SNPs
from our 126 B. rapa accessions as well as two B. oleracea as out-
groups (SRA accession: SRR1032050 and SRR630924, http://www.
ncbi.nlm.nih.gov/sra). A maximum-likelihood phylogeny was con-
structed using RAXML version 8.2.4 (Stamatakis, 2014). We imple-
mented RAXML’s rapid bootstrap algorithm with the GTR+GAMMA
model and rooted the phylogeny using the two B. oleracea acces-
sions. Genetic structure among the accessions was inferred using a
Bayesian clustering method implemented in FASTSTRUCTURE (Raj, Ste-
phens, & Pritchard, 2014). We tested K = 1–10 clusters with five
replicates for each K using the default convergence criterion and
prior. The optimal K value was estimated with the CHOOSEK tool con-
tained in the FASTSTRUCTURE package. The results of all replicates were
summarized using CLUMPAK (http://clumpak.tau.ac.il/) (Kopelman,
Mayzel, Jakobsson, Rosenberg, & Mayrose, 2015). The multiple K
value FASTSTRUCTURE results were re-ordered and visualized in Excel
based on the sample order of the phylogenetic inference.
2.7 | Inference of Demographic History with @a@i
Models of the demographic history of the major B. rapa groups were
evaluated using diffusion approximations to the allele frequency
spectrum (AFS) with @a@i (Gutenkunst et al., 2009). This approach
allowed us to rapidly and flexibly test alternative demographic mod-
els. Only individuals that could be readily attributed to one of the
major genetic lineages identified in our FASTSTRUCTURE and phyloge-
netic analyses were used in this analysis (denoted by the vertical
bars on Figure 1). Individuals were assigned a group if they had
>50% FASTSTRUCTURE identity and were phylogenetically clustered. We
analysed the demographic history of 102 B. rapa accessions divided
into five groups (Table S1): 22 accessions of European and Central
Asian B. rapa (group “EU-CA”), seven accessions representing B. rapa
subsp. sylvestris (group “S”), 20 accessions of B. rapa subsp. trilocu-
laris and B. rapa subsp. dichotoma (group “I”), 25 accessions repre-
senting B. rapa subsp. chinensis (group “C”) and 28 accessions of
B. rapa subsp. pekinensis (group “P”). Based on the phylogeny, we
also combined groups S and I as a South Asian group “SA” in some
analyses. Likewise, groups C and P were merged in some analyses as
an East Asian group “EA.”
We implemented a model testing hierarchy to accommodate
@a@i’s limit of analysing three populations at a time. We first evalu-
ated one- and two-population models for each of the five B. rapa
groups to estimate the timing of divergence among the derived
groups. The results of these initial analyses informed our subsequent
demographic modelling of three different three-population model
groups (Figure 2; Table 1) described in further detail below. Notably,
we also performed the same simulations under exponential growth
models, but the models did not converge (results not shown).
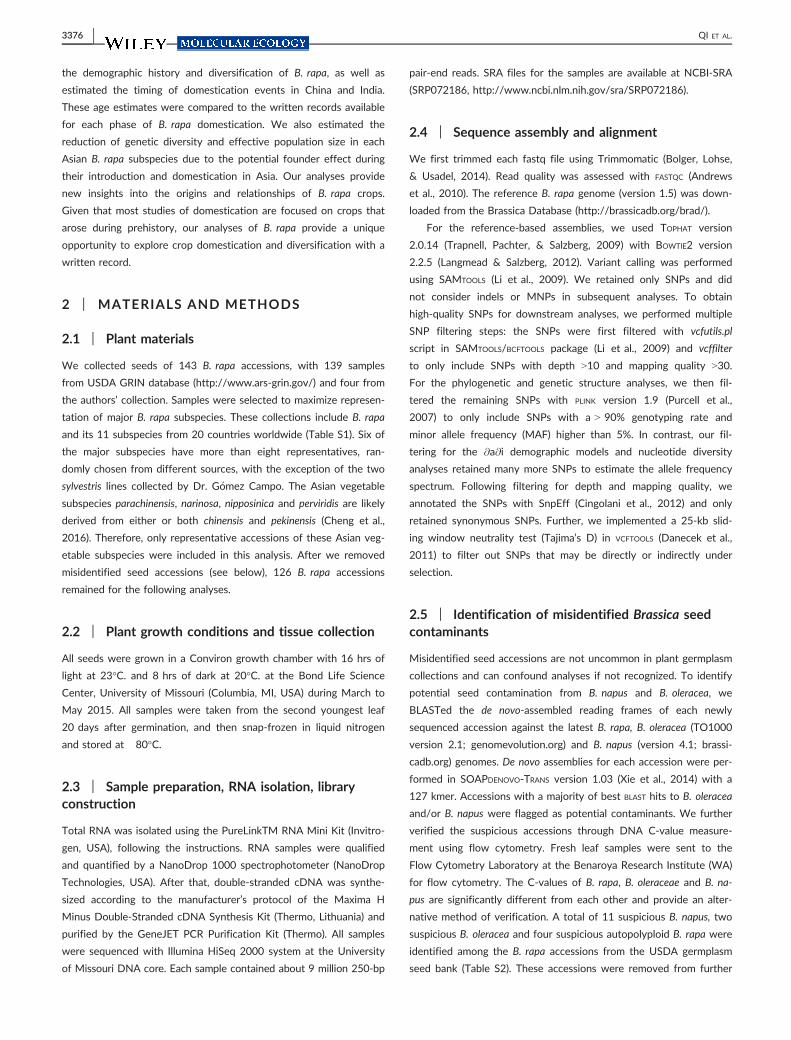
2.7.1 | Model Group A
In model group A, we tested whether the SA and EA groups were
independently derived from EU-CA or whether a group ancestral to
both SA and EA split from EU-CA and then split into SA and EA (Fig-
ure 2a).
2.7.2 | Model Group B
Model group B focused on the origins of S and I. We tested whether
S and I independently split from EU-CA, or if a common ancestor of
S and I split from EU-CA and then subsequently diverged into S and
I (Figure 2b).
2.7.3 | Model Group C
The models in group C evaluated long-debated alternative hypothe-
ses on the origin of Chinese cabbage, B. rapa subsp. pekinensis (Fig-
ure 2c). In particular, as to whether it was originated from chinensis
(Song et al., 1990; Takuno et al., 2006; Zhao et al., 2005), from EU-
CA rapa or from the admixture of the first two (Li, 1981; Ren et al.,
1995).
In each model, the EU-CA population was assumed to have con-
stant effective population size. Each of these models was parameter-
ized by the timing between each split and admixture event (e.g., T1,
T2) and the relative effective population sizes over those time inter-
vals (e.g., mEA, mSA). The effective population sizes were relative to
the ancestral population size, so m less than one indicates a popula-
tion size decline, while m greater than one indicates growth. Under
the third pekinensis origin model (C v P 3; Figure 2c), an additional
parameter f (between 0 and 1) estimated the fraction of the admixed
pekinensis population from EU-CA.
2.7.4 | Model Optimization and Testing
Our filtered SNP collections were converted to the @a@i frequency
spectrum file format using a publicly available perl script (https://
github.com/owensgl/reformat/blob/master/vcf2dadi.pl). To correct
for linkage among the SNPs, we performed a likelihood ratio test on
the models for each population using the Godambe information
matrix (GIM) (Godambe, 1960). This test statistic is compared to a
chi-square distribution with degrees of freedom equal to the differ-
ence in number of parameters between the simple and complex
model. The linkage of SNPs requires us to adjust the test statistic,
which is calculated via the GIM. We constructed the three-popula-
tion folded joint frequency spectra by projecting down to a specified
sample size for each population (Marth, Czabarka, Murvai, & Sherry,
2004). Because many SNPs were not called in every sequenced indi-
vidual, by projecting the frequency spectrum to a smaller sample
QI ET AL. | 3377
size, we were able to include more SNPs in our analysis. The sample
size that we projected to in each population was chosen so that the
frequency spectrum maximized the total number of segregating sites
for each population. We projected to 20, 40 and 40 samples for the
EU-CA, SA and EA populations in the model group A analysis,
respectively. For model group B, we projected to 13, 40 and 14
samples for the EU-CA, trilocularis and sylvestris populations, resp.
For model group C, we projected to 11, 13 and 23 for the EU-CA,
chinensis and pekinensis populations. For B. rapa subsp. sylvestris,
trilocularis and dichotoma, many SNPs for which genotypes were
missing from some individuals showed a large excess of heterozy-
gotes, and this pattern was not seen for SNPs called in every individ-
ual. Thus, we used SNPs called in every individual in the sylvestris,
trilocularis and dichotoma group to avoid any artefacts in the pro-
jected frequency spectrum.
During optimization, we imposed lower and upper bounds on
model parameters, with times allowed between 0.001 and 1 genetic
time units, and population size changes between 0.001 and 100 of
the reference (ancestral) population size. We used built-in maximum-
likelihood optimization in @a@i to fit the expected frequency spectra
under the parameterized models to the observed spectra. The popu-
lation-scaled mutation rate h was a free parameter of the models.
We repeated the optimization for each model 100 times from ran-
dom initial parameter guesses, to ensure consistent convergence to
the optimal parameters. The Godambe bootstrapping method (Coff-
man, Hsieh, Gravel, & Gutenkunst, 2016) was performed to estimate
the 95% confidence intervals of the best-fit parameters. Bootstrap
data sets were generated with a custom python script.
We selected the best-fitting model for each group of models by
selecting the model with highest log-likelihood under the best-fit
parameter set. For the best-fitting models in each group, we con-
verted the inferred population genetic parameters to years using the
relation h = 4NelL and T = 2Neg. L is the effective length in base
pairs of the region from which the SNP data were obtained. L was
calculated as the product of mean gene length, total genes covered
by the SNP data set and the fraction of SNP data set used in the
F IGURE 2 The demographic models evaluated with @a@i. The models with grey background colour are the optimal model under eachscenario. The log-likelihood value is indicated under each model. EU-CA represents B. rapa and B. rapa subsp. rapa group; SA representsB. rapa subsp. sylvestris, B. rapa subsp. trilocularis and B. rapa subsp. dichotoma group; EA represents B. rapa subsp. chinensis and B. rapa subsp.pekinensis group; S represents B. rapa subsp. sylvestris group; I represents B. rapa subsp. trilocularis and B. rapa subsp. dichotoma group; Crepresents B. rapa subsp. chinensis group; P represents B. rapa subsp. pekinensis group [Colour figure can be viewed at wileyonlinelibrary.com]
3378 | QI ET AL.
simulation due to missing data. Upper and lower mutation rates of
l = 1.5 9 10�8 and 9 9 10�9 per synonymous site per generation
and generation time of 1 year were used in our age estimates
(Kagale et al., 2014; Koch, Haubold, & Mitchell-Olds, 2000).
2.8 | Genetic diversity analysis
To assess the level of genetic diversity of the five identified genetic
groups, we estimated the average nucleotide diversity, p (Nei & Li,
1979), using VCFTOOLS version 0.1.12 (Danecek et al., 2011). A win-
dow size of 100 kbp and step size of 25 kbp were applied to the
genetic diversity estimation. All calculations and visualizations were
made in R (version 3.2.2) and RSTUDIO (Version 0.99.482).
3 | RESULTS
3.1 | Read mapping and SNP filtering
Using paired-end Illumina RNA-seq, we sequenced the transcrip-
tomes of 143 Brassica rapa accessions with 250-bp mean read
length. Following the removal of 17 misidentified accessions were
not clearly B. rapa (Table S2), the transcriptomes of 126 B. rapa
accessions were used in our analyses. On average, 8.09 million reads
per sample were left after Trimmomatic read cleaning. For each of
the reference genome-based assemblies, 33.90% (�8.51%) of the
reads mapped to the B. rapa genome on average. In total, 2.05 mil-
lion SNPs and 0.11 million indels were identified, with 13,760 multi-
allelic SNP sites, average SNP depth 4.69 (�1.97) and a transition/
transversion ratio of 1.34. After filtering, 31,662 high-quality SNPs
were retained for our phylogenetic and genetic structure analyses
and 426,740 SNPs were retained for our demographic analyses. A
summary of SNPs on each chromosome is available in Table S3.
3.2 | Inference of genetic structure andphylogenetic relationships
Our genetic structure and phylogenetic analyses of 31,662 SNPs
supported five distinct genetic clusters among the 126 B. rapa acces-
sions. Analyses of genetic structure recovered six clusters using
FASTSTRUCTURE (Figure 1 and S1). Increasing or decreasing the number
of clusters by one did not substantially change the observed cluster-
ing pattern (Figure 1; S1), and K = 6 clusters maximized the marginal
likelihood (Fig. S2). Most of the morphologically distinct crops long
recognized as subspecies—pak choi, Chinese cabbage, rapini and the
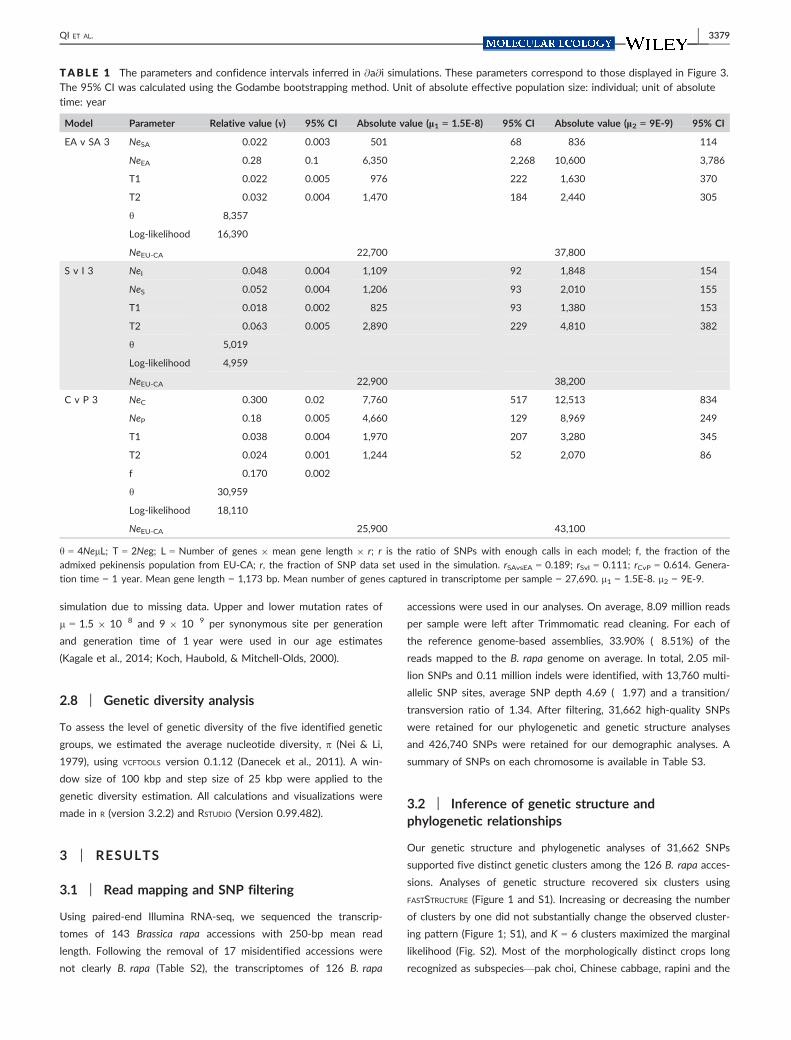
TABLE 1 The parameters and confidence intervals inferred in @a@i simulations. These parameters correspond to those displayed in Figure 3.The 95% CI was calculated using the Godambe bootstrapping method. Unit of absolute effective population size: individual; unit of absolutetime: year
Model Parameter Relative value (m) 95% CI Absolute value (l1 = 1.5E-8) 95% CI Absolute value (l2 = 9E-9) 95% CI
EA v SA 3 NeSA 0.022 0.003 501 �68 836 �114
NeEA 0.28 0.1 6,350 �2,268 10,600 �3,786
T1 0.022 0.005 976 �222 1,630 �370
T2 0.032 0.004 1,470 �184 2,440 �305
h 8,357
Log-likelihood �16,390
NeEU-CA 22,700 37,800
S v I 3 NeI 0.048 0.004 1,109 �92 1,848 �154
NeS 0.052 0.004 1,206 �93 2,010 �155
T1 0.018 0.002 825 �93 1,380 �153
T2 0.063 0.005 2,890 �229 4,810 �382
h 5,019
Log-likelihood �4,959
NeEU-CA 22,900 38,200
C v P 3 NeC 0.300 0.02 7,760 �517 12,513 �834
NeP 0.18 0.005 4,660 �129 8,969 �249
T1 0.038 0.004 1,970 �207 3,280 �345
T2 0.024 0.001 1,244 �52 2,070 �86
f 0.170 0.002
h 30,959
Log-likelihood �18,110
NeEU-CA 25,900 43,100
h = 4NelL; T = 2Neg; L = Number of genes 9 mean gene length 9 r; r is the ratio of SNPs with enough calls in each model; f, the fraction of the
admixed pekinensis population from EU-CA; r, the fraction of SNP data set used in the simulation. rSAvsEA = 0.189; rSvI = 0.111; rCvP = 0.614. Genera-
tion time = 1 year. Mean gene length = 1,173 bp. Mean number of genes captured in transcriptome per sample = 27,690. l1 = 1.5E-8. l2 = 9E-9.
QI ET AL. | 3379

yellow sarson—were largely resolved as distinct clusters in our
FASTSTRUCTURE analyses. Notably, they are also well resolved with
K = 5 or 7 clusters (Figure 1). We also identified a number of geneti-
cally diverse accessions (multicolour in FASTSTRUCTURE results, Fig-
ure 1). Some of these accessions are recently admixed crop lines
from the United State, but the history of many of these accessions
is unclear. The sixth cluster (grey colour on Figure 1) resolved in the
FASTSTRUCTURE K = 6 analysis described genetic variation in these
diverse accessions. Otherwise, FASTSTRUCTURE resolved five largely
homogenous clusters (Figure 1). Analyses with CLUMPAK found that
the same genotypes were consistently assigned to these clusters
across ten iterations of FASTSTRUCTURE (Fig. S3).
The phylogenetic relationships of the B. rapa accessions were
well resolved and consistent with our FASTSTRUCTURE clustering. More
than 98% of the nodes on the RAXML tree had bootstrap support
higher than 50% (Fig. S1). Many of the morphologically distinct crops
F IGURE 3 A combined summary of demographic inferences and written records of B. rapa domestication events. (a) The combined best-fitting demographic models based on @a@i simulations with absolute parameter values. The coloured parallelograms represent different B. rapagenetic groups: European–Central Asian B. rapa and B. rapa subsp. rapa (purple); B. rapa subsp. sylvestris (orange); B. rapa subsp. trilocularis andB. rapa subsp. dichotoma (green); B. rapa subsp. pekinensis (yellow); B. rapa subsp. chinensis (red). The width of the branches represents relativeNe. The numbers on the parallelograms represent the effective population size estimates (unit: individual). A horizontal band represents anadmixture event with proportions defined by parameters in the model. (b) A plot of the eastward introduction and diversification of B. rapawith a time scale of key domestication events corroborated by historical written records. The horizontal arrow represents time scale. Grey call-outs identify the historical written records of Brassica rapa crops (cultivar, source, time, country). The purple and yellow solid bars representthe estimated time of eastward introduction and domestication of Chinese cabbage in @a@i based on two substitution rates (l1 and l2),respectively. The dashed bars represent the time range between the inferences from two different substitution rates [Colour figure can beviewed at wileyonlinelibrary.com]
3380 | QI ET AL.
were distinguished as well supported clades in our phylogenomic
analysis. The combined phylogenetic and genetic clustering analyses
resolved five major genetic groups within B. rapa that largely corre-
sponded to different crops. These groups were a European–Central
Asian cluster (group “EU-CA”) represented by B. rapa, a group that
contained rapini and other accessions (group “S”) represented by
B. rapa subsp. sylvestris (bootstrap support 100%), an Indian sarson
group (group “I”) comprised of B. rapa subsp. trilocularis and three
accessions of subsp. dichotoma (bootstrap support of 100%), a chi-
nensis group (group “C”) composed of B. rapa subsp. chinensis (boot-
strap support of 68%) and most of the B. rapa subsp. pekinensis
accessions clustered together in a pekinensis group (group “P”; boot-
strap support of 66%). Interestingly, the eight B. rapa subsp. oleifera
(blue stars on Figure 1 and S1), six B. rapa subsp. rapa (pink stars on
Figure 1 and S1) and five of the dichotoma accessions (green stars
on Figure 1 and S1) were distributed across the phylogeny. Geneti-
cally, heterogeneous accessions identified in our FASTSTRUCTURE analy-
ses were scattered across the phylogeny. Groups of these
heterogenous samples were sister to each of the five largely
homogenous genetic groups. Whether these heterogeneous acces-
sions are the result of recent admixture or represent ancestral varia-
tion is not clear from the current analyses.
The phylogenetic analyses also supported a European–Central
Asian origin for B. rapa. Using two B. oleracea accessions as an out-
group, the concatenated phylogenetic analysis of 31,662 SNPs
resolved the European–Central Asian B. rapa cluster (EU-CA) as sis-
ter to all other B. rapa accessions (Figure 1; S1). Included in this
clade were most of the European and Central Asian accessions we
sampled (B. rapa). This relationship was well supported with a boot-
strap value of 71%. The nested set of sister relationships among the
remaining taxa indicated an eastward expansion of B. rapa crops.
Accessions from East and South Asia were among the most derived
lineages in our phylogeny.
3.3 | Demographic history of Brassica rapa’sdomestication across Asia
Our @a@i analyses of the demographic history of B. rapa also sup-
ported an eastward series of domestication events over the past few
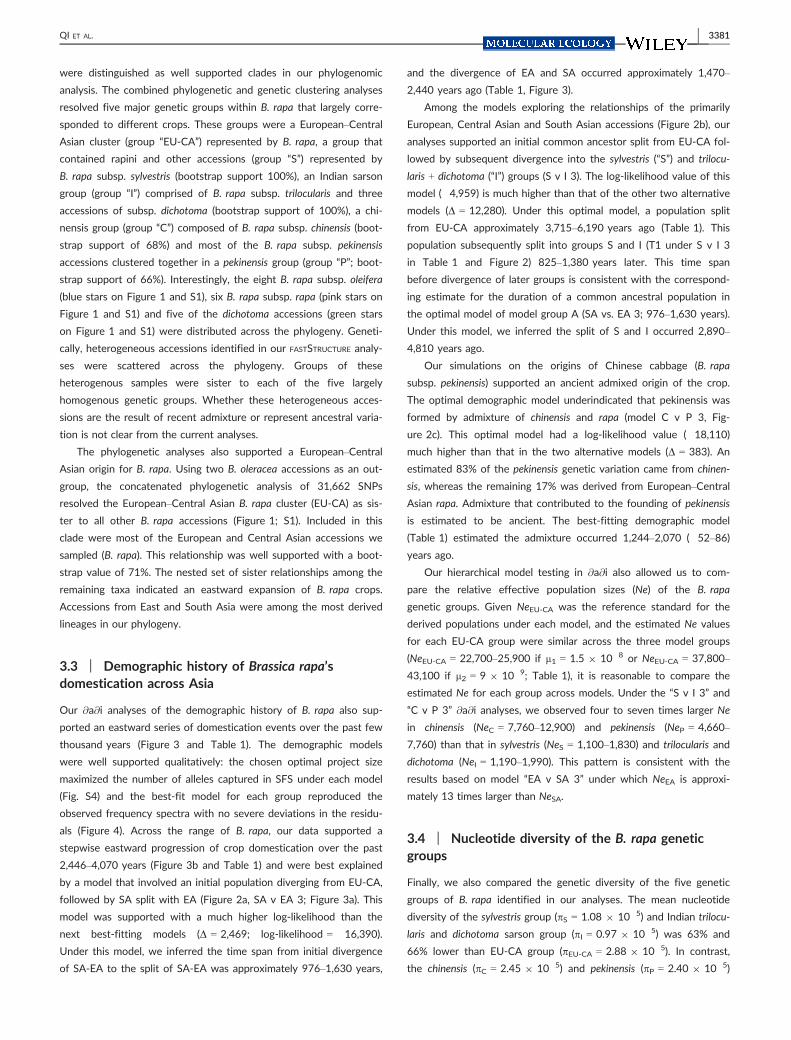
thousand years (Figure 3 and Table 1). The demographic models
were well supported qualitatively: the chosen optimal project size
maximized the number of alleles captured in SFS under each model
(Fig. S4) and the best-fit model for each group reproduced the
observed frequency spectra with no severe deviations in the residu-
als (Figure 4). Across the range of B. rapa, our data supported a
stepwise eastward progression of crop domestication over the past
2,446–4,070 years (Figure 3b and Table 1) and were best explained
by a model that involved an initial population diverging from EU-CA,
followed by SA split with EA (Figure 2a, SA v EA 3; Figure 3a). This
model was supported with a much higher log-likelihood than the
next best-fitting models (D = 2,469; log-likelihood = �16,390).
Under this model, we inferred the time span from initial divergence
of SA-EA to the split of SA-EA was approximately 976–1,630 years,
and the divergence of EA and SA occurred approximately 1,470–
2,440 years ago (Table 1, Figure 3).
Among the models exploring the relationships of the primarily
European, Central Asian and South Asian accessions (Figure 2b), our
analyses supported an initial common ancestor split from EU-CA fol-
lowed by subsequent divergence into the sylvestris (“S”) and trilocu-
laris + dichotoma (“I”) groups (S v I 3). The log-likelihood value of this
model (�4,959) is much higher than that of the other two alternative
models (D = 12,280). Under this optimal model, a population split
from EU-CA approximately 3,715–6,190 years ago (Table 1). This
population subsequently split into groups S and I (T1 under S v I 3
in Table 1 and Figure 2) 825–1,380 years later. This time span
before divergence of later groups is consistent with the correspond-
ing estimate for the duration of a common ancestral population in
the optimal model of model group A (SA vs. EA 3; 976–1,630 years).
Under this model, we inferred the split of S and I occurred 2,890–
4,810 years ago.
Our simulations on the origins of Chinese cabbage (B. rapa
subsp. pekinensis) supported an ancient admixed origin of the crop.
The optimal demographic model underindicated that pekinensis was
formed by admixture of chinensis and rapa (model C v P 3, Fig-
ure 2c). This optimal model had a log-likelihood value (�18,110)
much higher than that in the two alternative models (D = 383). An
estimated 83% of the pekinensis genetic variation came from chinen-
sis, whereas the remaining 17% was derived from European–Central
Asian rapa. Admixture that contributed to the founding of pekinensis
is estimated to be ancient. The best-fitting demographic model
(Table 1) estimated the admixture occurred 1,244–2,070 (�52–86)
years ago.
Our hierarchical model testing in @a@i also allowed us to com-
pare the relative effective population sizes (Ne) of the B. rapa
genetic groups. Given NeEU-CA was the reference standard for the
derived populations under each model, and the estimated Ne values
for each EU-CA group were similar across the three model groups
(NeEU-CA = 22,700–25,900 if l1 = 1.5 9 10�8 or NeEU-CA = 37,800–
43,100 if l2 = 9 9 10�9; Table 1), it is reasonable to compare the
estimated Ne for each group across models. Under the “S v I 3” and
“C v P 3” @a@i analyses, we observed four to seven times larger Ne
in chinensis (NeC = 7,760–12,900) and pekinensis (NeP = 4,660–
7,760) than that in sylvestris (NeS = 1,100–1,830) and trilocularis and
dichotoma (NeI = 1,190–1,990). This pattern is consistent with the
results based on model “EA v SA 3” under which NeEA is approxi-
mately 13 times larger than NeSA.
3.4 | Nucleotide diversity of the B. rapa geneticgroups
Finally, we also compared the genetic diversity of the five genetic
groups of B. rapa identified in our analyses. The mean nucleotide
diversity of the sylvestris group (pS = 1.08 9 10�5) and Indian trilocu-
laris and dichotoma sarson group (pI = 0.97 9 10�5) was 63% and
66% lower than EU-CA group (pEU-CA = 2.88 9 10�5). In contrast,
the chinensis (pC = 2.45 9 10�5) and pekinensis (pP = 2.40 9 10�5)
QI ET AL. | 3381
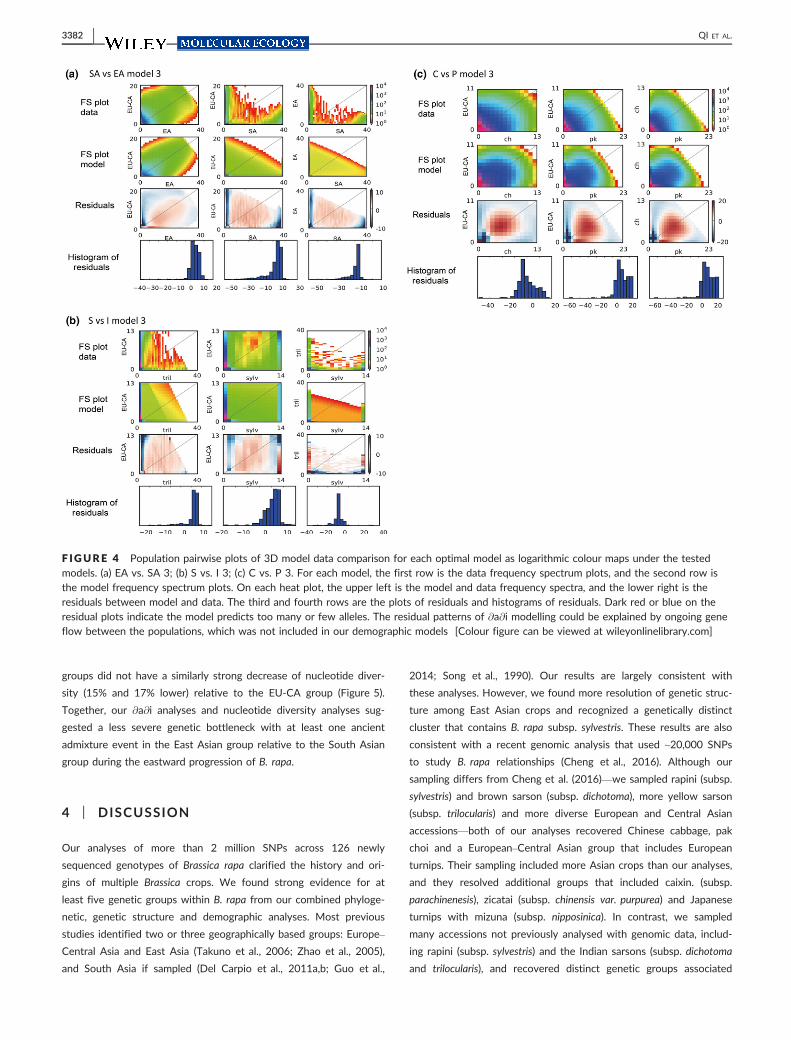
groups did not have a similarly strong decrease of nucleotide diver-
sity (15% and 17% lower) relative to the EU-CA group (Figure 5).
Together, our @a@i analyses and nucleotide diversity analyses sug-
gested a less severe genetic bottleneck with at least one ancient
admixture event in the East Asian group relative to the South Asian
group during the eastward progression of B. rapa.
4 | DISCUSSION
Our analyses of more than 2 million SNPs across 126 newly
sequenced genotypes of Brassica rapa clarified the history and ori-
gins of multiple Brassica crops. We found strong evidence for at
least five genetic groups within B. rapa from our combined phyloge-
netic, genetic structure and demographic analyses. Most previous
studies identified two or three geographically based groups: Europe–
Central Asia and East Asia (Takuno et al., 2006; Zhao et al., 2005),
and South Asia if sampled (Del Carpio et al., 2011a,b; Guo et al.,
2014; Song et al., 1990). Our results are largely consistent with
these analyses. However, we found more resolution of genetic struc-
ture among East Asian crops and recognized a genetically distinct
cluster that contains B. rapa subsp. sylvestris. These results are also
consistent with a recent genomic analysis that used ~20,000 SNPs
to study B. rapa relationships (Cheng et al., 2016). Although our
sampling differs from Cheng et al. (2016)—we sampled rapini (subsp.
sylvestris) and brown sarson (subsp. dichotoma), more yellow sarson
(subsp. trilocularis) and more diverse European and Central Asian
accessions—both of our analyses recovered Chinese cabbage, pak
choi and a European–Central Asian group that includes European
turnips. Their sampling included more Asian crops than our analyses,
and they resolved additional groups that included caixin. (subsp.
parachinenesis), zicatai (subsp. chinensis var. purpurea) and Japanese
turnips with mizuna (subsp. nipposinica). In contrast, we sampled
many accessions not previously analysed with genomic data, includ-
ing rapini (subsp. sylvestris) and the Indian sarsons (subsp. dichotoma
and trilocularis), and recovered distinct genetic groups associated
F IGURE 4 Population pairwise plots of 3D model data comparison for each optimal model as logarithmic colour maps under the testedmodels. (a) EA vs. SA 3; (b) S vs. I 3; (c) C vs. P 3. For each model, the first row is the data frequency spectrum plots, and the second row isthe model frequency spectrum plots. On each heat plot, the upper left is the model and data frequency spectra, and the lower right is theresiduals between model and data. The third and fourth rows are the plots of residuals and histograms of residuals. Dark red or blue on theresidual plots indicate the model predicts too many or few alleles. The residual patterns of @a@i modelling could be explained by ongoing geneflow between the populations, which was not included in our demographic models [Colour figure can be viewed at wileyonlinelibrary.com]
3382 | QI ET AL.
with these accessions. Further, our more sophisticated modelling of
the demographic history of B. rapa—corroborated by written records
—provides new insights on the age and relationships among the
diverse B. rapa lineages. Considering the age estimates of population
splits among the B. rapa groups, it is not surprising that past analyses
with fewer markers were unable to resolve the genetic structure
among these plants. Although our analyses provide strong evidence
for at least five groups, not all individuals of B. rapa could be placed
in one of these distinct genetic clusters. Determining whether this is
due to parallel evolution, admixture (recent or ancient), insufficient
sampling of related genotypes or lack of divergence requires further
research with new samples. Regardless, our analyses, as well as
those of others (Cheng et al., 2016; Del Carpio et al., 2011a,b; Guo
et al., 2014; Song et al., 1990; Takuno et al., 2006; Zhao et al.,
2005), contrast with one recent study (Tanhuanp€a€a et al., 2016) and
find evidence that geography and crop type contribute to the
genetic structure of B. rapa.
One of the interesting aspects of the domestication of B. rapa
crops is that many were domesticated during written history. This
provided an opportunity to compare our population genomic results
to historical records for many of the demographic splits modelled
with @a@i. Previous simulations of @a@i’s accuracy found that infer-
ences of divergence times had low error with even modest sample
sizes (Robinson, Coffman, Hickerson, & Gutenkunst, 2014). A recent
empirical analysis using @a@i recovered evidence of known recent
demographic changes in the checkerspot butterfly (McCoy, Garud,
Kelley, Boggs, & Petrov, 2014). Our inferred times of demographic
events in the history of B. rapa are consistent with these previous
analyses and appear to be accurate as they were consistent with the
available written record. Demographic inferences based on genome-
wide SNP data found that the eastward introduction and diversifica-
tion of B. rapa happened 2,400–4,100 years ago. This inferred time
span is compatible with the two oldest historical records of B. rapa
in East and South Asia. Brassica (Li, 1981; Luo, 1992; Ye, 1989) was
first described in the ancient Aryan literature of India nearly
3,500 years ago (Prakash et al., 2011), and in Shi Jing (Classic of
Poetry), the oldest existing Chinese classical poetry collection (Li,
1981; Luo, 1992; Ye, 1989). Similarly, our @a@i analyses estimated
Chinese cabbage (B. rapa subsp. pekinensis) was developed 1,200–
2,100 years ago. The earliest historical record of Chinese cabbage is
nearly 1,400 years old. Niu Du Song (i.e., beef tripe cabbage) is men-
tioned in Xin Xiu Ben Cao (Newly Revised Canon of Materia Med-
ica), one of the oldest official pharmacy books edited by Jing Su in
659 CE. A clear description of Chinese cabbage is also found in Song
Su’s Ben Cao Tu Jing (Illustrated Classics of Materia Medica) from
1,061 CE (Li, 1981). He described Niu Du Song in Yangzhou city in
southern China as a plant with large, round, crinkled leaves and a
less fibrous texture. Beyond the timing of these events, the inferred
order of domestication is also supported by the written records. Our
results suggest that turnips are likely the earliest domesticated crop
with leaf and seed crops domesticated later. A translated passage in
the Shi Jing supports this order: when collecting turnip and radish,
we should not abandon them because of their bitter root because
the leaves and stems taste good. These written records corroborate
our population genomic inference of the timing of two different
events in the history of B. rapa domestication and lend confidence
to the other estimated parameters.
Notably, the inferred timing of these demographic events better
overlapped with estimates from one of the Brassicaceae substitution
rates. Substitution rates in the Brassicaceae have recently been
debated as a new fossil provided a different calibration for the fam-
ily (Beilstein, Nagalingum, Clements, Manchester, & Mathews, 2010).
The placement of this fossil has been the subject of debate (Franzke,
Koch, & Mummenhoff, 2016) because phylogenetic inferences gen-
erally yield older dates for macroevolutionary events (Arias, Beilstein,
Tang, McKain, & Pires, 2014; Beilstein et al., 2010) than previous
estimates (Barker, Vogel, & Schranz, 2009; Edger et al., 2015; Hoh-
mann, Wolf, Lysak, & Koch, 2015; Koch et al., 2000). To work within
this debate, our demographic estimates were calculated twice using
two different estimates of the Brassicaceae nuclear substitution rate:
the faster rate from Koch et al. (2000) and a more recent, slower
rate developed by Kagale et al. (2014) based on the fossil placement
of Beilstein et al. (2010). Three of the four written records occurred
within the 95% confidence interval for the timing of population splits
estimated with l1, whereas all of the estimates using l2 preceded
the available written records. Thus, both of these substitution rates
are consistent with the written record although there is greater con-
cordance with the more recently derived and slightly slower substi-
tution rate. Considering that we expect a written record to follow a
F IGURE 5 Box plot of nucleotide diversity of the five B. rapagenetic groups. Bottom and top of the box represent the first andthird quartiles. Band inside the box represent median. The numbersrepresent mean values for each group. Colours of each group areconsistent with FASTSTRUCTURE results. EU-CA represents B. rapa andB. rapa subsp. rapa group; S represents B. rapa subsp. sylvestrisgroup; I represents B. rapa subsp. trilocularis and B. rapa subsp.dichotoma group; C represents B. rapa subsp. chinensis group; Prepresents B. rapa subsp. pekinensis group [Colour figure can beviewed at wileyonlinelibrary.com]
QI ET AL. | 3383
domestication event with some lag, the “true” substitution rate for
Brassica and other Brassicaceae may lay somewhere between these
two rate estimates.
The @a@i modelling also indicated that the South Asian group (“S”
and “I”) experienced a more severe founder effect than the East Asian
group (“EA”). The estimated effective population size and nucleotide
diversity of the East Asian group were several-fold larger than the
South Asian group. This difference of founder effect within a single
species is striking in comparison with other crops. The South Asian
group retains only approximately 35% of the genetic diversity of the
EU-CA group. This is equivalent to the domestication bottleneck in
barley (Caldwell, Russell, Langridge, & Powell, 2006), rice (Caicedo
et al., 2007; Zhu, Zheng, Luo, Gaut, & Ge, 2007) and among the most
severe bottlenecks found in annual crops (Miller & Gross, 2011). In
contrast, the East Asian group retained approximately 84% of the
genetic diversity present in the EU-CA group. The domestication bot-
tleneck of the East Asian B. rapa crops is comparable to the bottleneck
in sorghum (Casa et al., 2005), sunflower (Tang & Knapp, 2003), soy-
abean (Li et al., 2010) and among the least severe bottlenecks found
in annual crops (Miller & Gross, 2011). Considering the two lineages
diverged only a few thousand years ago and both likely experienced
long-distance introductions from ancestral European–Central Asian
populations, the difference of Ne and p between the two groups is
probably due to a combination of differences in gene flow (Meyer &
Purugganan, 2013) and inbreeding (Dempewolf, Hodgins, Rummell,
Ellstrand, & Rieseberg, 2012). In East Asia, commercial activity along
the ancient silk road (started 220 BC) may have continuously brought
diverse B. rapa genetic resources to East Asia. Consistent with this
hypothesis, we found evidence of shared genetic variation among
some European–Central Asian and East Asian accessions, as well as a
small amount of EU-CA admixture in the origin of B. rapa subsp.
pekinensis. In contrast, South Asian B. rapa may have been more punc-
tually introduced with events such as Alexander the Great’s invasion
of India in 325 BCE. Written records document his troops likely
brought mustard seeds as army provisions (Grubben, 2004). A shift to
predominant inbreeding in the yellow and brown sarsons (McGrath &
Quiros, 1992) likely further reduced their genetic diversity. Thus,
domestication of these two different regional groups of B. rapa crops
occurred with significantly different population genetic backgrounds
that essentially spans the range of possible models of domestication
(Eyre-Walker, Gaut, Hilton, Feldman, & Gaut, 1998; Gaut, D�ıez, &
Morrell, 2015; Meyer & Purugganan, 2013; Miller & Gross, 2011). This
less severe founder effect in the EA group may contribute to the
diverse crop types in East Asia, in contrast to the Indian group.
Despite the economic importance of B. rapa, the order of crop
domestication has never been well resolved. Previous studies gener-
ally considered B. rapa subsp. sylvestris to be the wild type and
reflect a European B. rapa centre of origin (Guo et al., 2014; Tan-
huanp€a€a et al., 2016). However, B. rapa subsp. sylvestris has never
been genetically distinguished from other B. rapa subspecies. Geno-
mewide analyses with 715 polymorphic SSR alleles (Guo et al., 2014)
and 209 nuclear SNPs (Tanhuanp€a€a et al., 2016) grouped B. rapa
subsp. sylvestris among European accessions or clustered with oil
types. A recent whole-genome resequencing study of B. rapa (Cheng
et al., 2016) did not include any sylvestris accessions. Our results
suggest sylvestris is not likely a wild B. rapa. The two sylvestris acces-
sions and its five genetically cognate accessions in our analyses clus-
tered into a monophyletic clade that was supported with 100%
bootstrap support in our phylogenetic analysis. These accessions
were also grouped in our genetic structure analyses and present in
multiple values of K. Importantly, this group was not sister to all of
the remaining B. rapa accessions. Using two B. oleracea as outgroups
to root the phylogenetic tree of B. rapa, we found a collection of
European and Central Asian B. rapa accessions were sister to the
remaining B. rapa. Based on recent whole-genome resequencing
analyses (Cheng et al., 2016), previous linguistic evidence (Ignatov
et al., 2008) and archaeological records (K€orber-Grohne, 1987),
turnip is likely the first domesticated Brassica in the European–Cen-
tral Asian region. Our study is less clear on this question as only one
of the turnip accessions was placed in the EU-CA clade. However,
none of our turnip collections are from the European–Central Asian
region, and two-third of them have a complex genetic background
based on our FASTSTRUCTURE analyses. Our result is congruent with
recent reports by Cheng et al. (2016) that there may be two turnip
lineages (European and Asian turnip). Further sampling of turnips
from across the geographic range would address many of the
remaining questions surrounding the early domestication of B. rapa.
With an expanded sample of yellow sarson and brown sarson,
we also found evidence for a single origin of yellow sarson (B. rapa
subsp. trilocularis), but possibly multiple origins of brown sarson
(B. rapa subsp. dichotoma). All accessions of trilocularis and three of
the dichotoma accessions formed a monophyletic clade in our phylo-
genetic analysis. This is consistent with a single origin of the yellow
sarsons with multiple origins of brown sarsons from yellow sarsons.
Further, a couple individuals of dichotoma clustered more closely
with sylvestris and a single individual was grouped with chinensis.
Other dichotoma individuals were distributed among the genetically
heterogeneous accessions. Assuming that our accessions are cor-
rectly labelled, these results suggest that brown sarsons may have
more than one origin from nonsarson ancestors. It is worth noting
that the USDA nomenclature system groups brown sarson together
with another crop, toria, as subsp. dichotoma. This may be the cause
of apparent polyphyly of subsp. dichotoma. Alternatively, the place-
ment of some dichotoma accessions may reflect more recent admix-
ture rather than independent origins. These results are mostly
consistent with a previous analysis based on five isozymes and four
RFLP markers (1992). Other similar B. rapa population and phyloge-
netic studies typically adopted or mentioned these two subspecies,
but only included a few samples to draw phylogenetic inferences
(e.g., Cheng et al., 2016 and Del Carpio et al., 2011b). Thus, our
results indicate that the potential diversity and relationships of these
morphologically similar crops have yet to be fully explored. Addi-
tional sampling beyond the available USDA accessions of the yellow
and brown sarsons—including both self-compatible and incompatible
types as well as clearly identified representatives of toria—is needed
to further resolve the origins and diversity of these crops.
3384 | QI ET AL.
Oil crops are among the most economically important crops of
B. rapa, and we found evidence for multiple origins of oil-type
B. rapa subsp. oleifera. The eight oleifera samples were distributed
throughout our phylogeny and occurred in four of the five major
genetic groups. Considering that by definition canola is a Brassica
species containing <2% erucic acid and <30 micromoles of glucosino-
lates (Eskin & McDonald, 1991), it is not surprising to find oleifera
samples scattered across the phylogeny. Oil crops are recognized as
being genetically and geographically diverse relative to other culti-
vated crops because of likely multiple origins of oilseed crops
(McGrath & Quiros, 1992; Takuno et al., 2006; Tanhuanp€a€a et al.,
2016). Our results also support parallel origins of the oil types of
B. rapa from different genetic backgrounds. Oil-type B. rapa appears
to have been primarily selected from mostly nonleafy crops with a
concentration among the European–Central Asian genetic group. The
oil crops of Brassica may have multiple, independent origins. Studies
on oilseed rape (Brassica napus) have also shown that they have rela-
tively diverse accessions that have been domesticated for winter
and spring oilseed rape in Europe and Asia (Allender & King, 2010;
Gazave et al., 2016; Li et al., 2014; Wu et al., 2014). Considering
that most Brassica oil cultivars have been domesticated relatively
recent (Reiner, Holzner, & Ebermann, 1995) that postdate the global-
ization of agriculture (Font, del Rio, Fern�andez, & de Haro, 2003;
Kumar, Banga, Meena, & Kumar, 2015; Phillips & Khachatourians,
2001), it is not surprising that they were sampled from throughout
the phylogeny. Thus, the domestication of oil-type B. rapa may be
similar to the parallel domestication of those oil types in B. napus.
Our relatively large sampling and demographic analyses allowed us
to resolve a long-held debate on the origin of Chinese cabbage. Previ-
ous genetic and empirical studies supported two distinct hypotheses
for the origin of Chinese cabbage: directly from pak choi (Song et al.,
1990; Takuno et al., 2006; Zhao et al., 2005) or via genetic admixture
of turnip and pak choi (Li, 1981; Ren et al., 1995). Our FASTSTRUCTURE
and phylogenetic inference suggest pekinensis has a closer relationship
with chinensis. Our demographic modelling supported an admixed ori-
gin of pekinensis via crossing of EU-CA Brassica rapa and subsp. chinen-
sis, with chinensis contributing ~90% of the contemporary pekinensis
genome. Given that most of the genome is chinensis, it is not unex-
pected that previous analyses with fewer markers would not detect
the modest 10% genomic contribution from European–Central Asian
B. rapa. The FASTSTRUCTURE results may also indicate the B. rapa subsp.
rapa accessions most closely related to the progenitor of pekinensis.
Components of genetic variation in a handful of B. rapa subsp. rapa
accessions were assigned to the same category as the bulk of our
pekinensis genotypes. It is not clear from the FASTSTRUCTURE analysis
whether this structure represents the ancestral variation contributed
by rapa to pekinensis, or more recent admixture from pekinensis into
some rapa accessions. Detailed analyses and expanded sampling are
required to further dissect the contributions and history of B. rapa
subsp. pekinensis. Our analyses also demonstrate that Chinese cabbage
was formed much later than other Asian B. rapa crops and indicate it
is among the most recently derived B. rapa subspecies. Samples of
other East Asian leafy-type subspecies (parachinensis, narinosa,
perviridis and nipposinica) were placed in either the pekinensis or chi-
nensis clades, consistent with a recent study with abundant sampling
of these leafy types (Cheng et al., 2016).
5 | CONCLUSIONS
Overall, our study provides many new data and insights into the his-
tory of B. rapa and provides clear direction for future research. Our
expanded sampling of frequently underrepresented groups, such as
the Indian sarsons, has provided evidence on their origins and diver-
sity. Expanded sampling of genetic diversity within B. rapa will likely
resolve additional groups and clarify the complex history of these
plants. In particular, better genomic sampling of B. rapa landraces
from Central Asia, landrace turnip from Europe, landraces and elite
rapini from Italy, landrace toria and oil-type oleifera are needed to
further resolve the domestication history of B. rapa. These samples
would augment the existing collections of B. rapa in North America
and aid curation of the existing USDA collection which contained
many misidentified accessions. Sequence data from wild B. rapa
seeds or archaeological materials would also significantly improve
our analyses. Additional genomes from putative wild B. rapa popula-
tions would also mitigate ascertainment bias in future analyses and
provide more insight into changes in structural variation associated
with domestication. Despite potential for further improvement, our
results have provided the most robust evidence to date on the
genetic structure and domestication history of B. rapa. Our use of
demographic modelling provided some of the first population geno-
mic estimates of the ages and population size changes that occurred
during B. rapa’s history. Corroboration of the estimated dates with
the written record provides added confidence in our inferences.
Given that the other Brassica crops are of similar age with equally
complicated histories, the population genomic approach employed
here will likely provide new insights into Brassica domestication
when applied to the other crops. Most importantly, our results pro-
vide a new framework for B. rapa that includes empirical estimates
of domestication times, effective population sizes and the amount
and direction of gene flow between divergent lineages.
ACKNOWLEDGEMENTS
We thank A. Baniaga, K. Dlugosch, S. Jorgensen, H. Marx and Z. Li
for helpful comments on the manuscript. Server hosting infrastruc-
ture and services provided by the Bio Computing Facility (BCF) at
the University of Arizona. X.Q., T.E.H., H.A., J.C.P. and M.S.B. were
supported by NSF-IOS-1339156. A.R. and R.G. were supported by
NSF-DEB-1146074.
AUTHOR CONTRIBUTIONS
M.S.B., J.C.P. and R.G. designed the experiments. X.Q., H.A., A.P.R
and T.E.H performed the experiments, X.Q. and M.S.B. wrote the
manuscript.
QI ET AL. | 3385
DATA ACCESSIBILITY
SRA files for the samples are available at NCBI-SRA database
(SRP072186, http://www.ncbi.nlm.nih.gov/sra/SRP072186).
REFERENCES
Allender, C. J., & King, G. J. (2010). Origins of the amphiploid species
Brassica napus L. investigated by chloroplast and nuclear molecular
markers. BMC Plant Biology, 10, 54.
Andrews, S. (2010). FastQC: a quality control tool for high throughput
sequence data. Available from http://www.bioinformatics.babraha
m.ac.uk/projects/fastqc
Arias, T., Beilstein, M. A., Tang, M., McKain, M. R., & Pires, J. C. (2014).
Diversification times among Brassica (Brassicaceae) crops suggest
hybrid formation after 20 million years of divergence. American Jour-
nal of Botany, 101, 86–91.
Barker, M. S., Vogel, H., & Schranz, M. E. (2009). Paleopolyploidy in the
Brassicales: Analyses of the Cleome transcriptome elucidate the his-
tory of genome duplications in Arabidopsis and other Brassicales. Gen-
ome Biology and Evolution, 1, 391–399.
Beilstein, M. A., Nagalingum, N. S., Clements, M. D., Manchester, S. R., &
Mathews, S. (2010). Dated molecular phylogenies indicate a Miocene
origin for Arabidopsis thaliana. Proceedings of the National Academy of
Sciences, 107, 18724–18728.
Bolger, A. M., Lohse, M., & Usadel, B. (2014). Trimmomatic: A flexi-
ble trimmer for Illumina sequence data. Bioinformatics, 30, 2114–
2120.
Caicedo, A. L., Williamson, S. H., Hernandez, R. D., Boyko, A., Fledel-
Alon, A., York, T. L., . . . Bustamante, C. D. (2007). Genome-wide pat-
terns of nucleotide polymorphism in domesticated rice. PLoS Genetics,
3, 1745–1756.
Caldwell, K. S., Russell, J., Langridge, P., & Powell, W. (2006). Extreme
population-dependent linkage disequilibrium detected in an inbreed-
ing plant species, Hordeum vulgare. Genetics, 172, 557–567.
Casa, A. M., Mitchell, S. E., Hamblin, M. T., Sun, H., Bowers, J. E., Pater-
son, A. H., . . . Kresovich, S. (2005). Diversity and selection in sor-
ghum: Simultaneous analyses using simple sequence repeats.
Theoretical and Applied Genetics, 111, 23–30.
Chalhoub, B., Denoeud, F., Liu, S., Parkin, I. A., Tang, H., Wang, X., . . .
Corr�ea, M. (2014). Early allopolyploid evolution in the post-Neolithic
Brassica napus oilseed genome. Science, 345, 950–953.
Cheng, F., Sun, R., Hou, X., Zheng, H., Zhang, F., Zhang, Y., . . . Liu, D.
(2016). Subgenome parallel selection is associated with morphotype
diversification and convergent crop domestication in Brassica rapa
and Brassica oleracea. Nature Genetics, 48, 1218–1224.
Cingolani, P., Platts, A., Wang, L. L., Coon, M., Nguyen, T., Wang, L., . . .
Ruden, D. M. (2012). A program for annotating and predicting the
effects of single nucleotide polymorphisms, SnpEff: SNPs in the gen-
ome of Drosophila melanogaster strain w1118; iso-2; iso-3. Fly, 6, 80–
92.
Coffman, A. J., Hsieh, P. H., Gravel, S., & Gutenkunst, R. N. (2016). Com-
putationally efficient composite likelihood statistics for demographic
inference. Molecular Biology and Evolution, 33, 591–593.
Danecek, P., Auton, A., Abecasis, G., Albers, C. A., Banks, E., DePristo, M.
A., . . . McVean, G. (2011). The variant call format and VCFtools.
Bioinformatics, 27, 2156–2158.
Darwin, C. (1859). The origin of species by means of natural selection. Lon-
don: John Murray.
Del Carpio, D. P., Basnet, R. K., De Vos, R. C. H., Maliepaard, C., Visser,
R., & Bonnema, G. (2011a). The patterns of population differentiation
in a Brassica rapa core collection. Theoretical and Applied Genetics,
122, 1105–1118.
Del Carpio, D. P., Basnet, R. K., De Vos, R. C. H., Maliepaard, C., Paulo,
M. J., & Bonnema, G. (2011b). Comparative methods for association
studies: A case study on metabolite variation in a Brassica rapa core
collection. PLoS ONE, 6, e19624.
Dempewolf, H., Hodgins, K. A., Rummell, S. E., Ellstrand, N. C., & Riese-
berg, L. H. (2012). Reproductive isolation during domestication. The
Plant Cell, 24, 2710–2717.
Diamond, J. (2002). Evolution, consequences and future of plant and ani-
mal domestication. Nature, 418, 700–707.
Edger, P. P., Heidel-Fischer, H. M., Bekaert, M., Rota, J., Gl€ockner, G.,
Platts, A. E., . . . Hofberger, J. A. (2015). The butterfly plant arms-race
escalated by gene and genome duplications. Proceedings of the
National Academy of Sciences of the United States of America, 112,
8362–8366.
Eskin, N. A. M., & McDonald, B. E. (1991). Canola oil. Nutrition Bulletin,
16, 138–146.
Eyre-Walker, A., Gaut, R. L., Hilton, H., Feldman, D. L., & Gaut, B. S.
(1998). Investigation of the bottleneck leading to the domestication
of maize. Proceedings of the National Academy of Sciences of the Uni-
ted States of America, 95, 4441–4446.
Font, R., del Rio, M., Fern�andez, J. M., & de Haro, A. (2003). Acid deter-
gent fiber analysis in oilseed Brassicas by near-infrared spectroscopy.
Journal of Agricultural and Food Chemistry, 51, 2917–2922.
Franzke, A., Koch, M.A., & Mummenhoff, K. (2016). Turnip time travels:
Age estimates in Brassicaceae. Trends in Plant Science, 21, 554–561.
Fuller, D. Q., Qin, L., Zheng, Y., Zhao, Z., Chen, X., Hosoya, L. A., & Sun,
G. P. (2009). The domestication process and domestication rate in
rice: Spikelet bases from the Lower Yangtze. Science, 323, 1607–
1610.
Gaut, B. S., D�ıez, C. M., & Morrell, P. L. (2015). Genomics and the con-
trasting dynamics of annual and perennial domestication. Trends in
Genetics, 31, 709–719.
Gazave, E., Tassone, E. E., Ilut, D. C., Wingerson, M., Datema, E., Witsen-
boer, H. M., . . . Brown, J. (2016). Population genomic analysis reveals
differential evolutionary histories and patterns of diversity across
subgenomes and subpopulations of Brassica napus L. Frontiers in Plant
Science, 7, 525.
Godambe, V. P. (1960). An optimum property of regular maximum likeli-
hood estimation. Annals of Mathematical Statistics, 31, 1208–1211.
Gross, B. L., & Olsen, K. M. (2010). Genetic perspectives on crop domes-
tication. Trends in Plant Science, 15, 529–537.
Gross, B. L., & Zhao, Z. (2014). Archaeological and genetic insights into
the origins of domesticated rice. Proceedings of the National Academy
of Sciences of the United States of America, 111, 6190–6197.
Grubben, G. J. H., & Denton, O. A. (2004). Plant resources of Tropical Africa
2. Vegetables. Wageningen: PROTA Foundation, Leiden: Backhuys
Publishers and Wageningen :CTA.
Guo, Y., Chen, S., Li, Z., & Cowling, W.A. (2014). Center of origin and
centers of diversity in an ancient crop, Brassica rapa (Turnip rape).
The Journal of Heredity, 105, 555–565.
Gutenkunst, R. N., Hernandez, R. D., Williamson, S. H., & Bustamante, C.
D. (2009). Inferring the joint demographic history of multiple popula-
tions from multidimensional SNP frequency data. PLoS Genetics, 5,
e1000695.
Hohmann, N., Wolf, E. M., Lysak, M. A., & Koch, M. A. (2015). A time-
calibrated road map of Brassicaceae species radiation and evolution-
ary history. The Plant Cell, 27, 2770–2784.
Ignatov, A.N., Artemyeva, A.M., & Hida, K. (2008). Origin and expansion
of cultivated Brassica rapa in Eurasia: Linguistic facts. In:. V Interna-
tional Symposium on Brassicas and XVI International Crucifer Genet-
ics Workshop, Brassica 2008 867.
Kagale, S., Robinson, S. J., Nixon, J., Xiao, R., Huebert, T., Condie, J., . . .
Sharpe, A. G. (2014). Polyploid evolution of the Brassicaceae during
the Cenozoic era. The Plant Cell, 26, 2777–2791.
3386 | QI ET AL.

Koch, M. A., Haubold, B., & Mitchell-Olds, T. (2000). Comparative evolu-
tionary analysis of chalcone synthase and alcohol dehydrogenase loci
in Arabidopsis, Arabis, and related genera (Brassicaceae). Molecular
Biology and Evolution, 17, 1483–1498.
Kopelman, N. M., Mayzel, J., Jakobsson, M., Rosenberg, N. A., & May-
rose, I. (2015). Clumpak: A program for identifying clustering modes
and packaging population structure inferences across K. Molecular
Ecology Resources, 15, 1179–1191.
K€orber-Grohne, U. (1987). Nutzpflanzen in Deutschland: Kulturgeschichte
und Biologie. Theiss, Konrad.
Kovach, M. J., Sweeney, M. T., & McCouch, S. R. (2007). New insights
into the history of rice domestication. Trends in Genetics, 23, 578–
587.
Kumar, A., Banga, S. S., Meena, P. D., & Kumar, P. R. (2015). Brassica oil-
seeds: Breeding and management. Oxfordshire: CABI.
Ladizinsky, G. (2012). Plant evolution under domestication. Netherlands:
Springer.
Langmead, B., & Salzberg, S. L. (2012). Fast gapped-read alignment with
Bowtie 2. Nature Methods, 9, 357–359.
Li, C. W. (1981). The origin, evolution, taxonomy and hybridization of chi-
nese cabbage. In: Chinese cabbage. Proceedings of the first interna-
tional symposium, pp. 3–10. AVRDC.
Li, F., Chen, B., Xu, K., Wu, J., Song, W., Bancroft, I., . . . Wang, N. (2014).
Genome-wide association study dissects the genetic architecture of
seed weight and seed quality in rapeseed (Brassica napus L.). DNA
Research, 21, 355–367.
Li, H., Handsaker, B., Wysoker, A., Fennell, T., Ruan, J., Homer, N., . . .
Durbin, R. (2009). The sequence alignment/map format and SAM-
tools. Bioinformatics, 25, 2078–2079.
Li, Y.-H., Li, W., Zhang, C., Yang, L., Chang, R. Z., Gaut, B. S., & Qiu, L. J.
(2010). Genetic diversity in domesticated soybean (Glycine max) and
its wild progenitor (Glycine soja) for simple sequence repeat and sin-
gle-nucleotide polymorphism loci. The New Phytologist, 188, 242–253.
Liu, S., Liu, Y., Yang, X., Tong, C., Edwards, D., Parkin, I. A., . . . Wang, X.
(2014). The Brassica oleracea genome reveals the asymmetrical evolu-
tion of polyploid genomes. Nature Communications, 5, 3930.
Long, A., Benz, B. F., Donahue, D. J., Jull, A. J. T., & Toolin, L. J. (2006).
First direct AMS dates on early maize from Tehuacan, Mexico. Radio-
carbon, 31, 1035–1040.
Luo, G. (1992). A analysis of historical materials about the time and place
of the origin of the peking cabbage. Studies in the History of Natural
Sciences, 2, 171–176.
Marth, G. T., Czabarka, E., Murvai, J., & Sherry, S. T. (2004). The allele
frequency spectrum in genome-wide human variation data reveals
signals of differential demographic history in three large world popu-
lations. Genetics, 166, 351–372.
McCoy, R. C., Garud, N. R., Kelley, J. L., Boggs, C. L., & Petrov, D. A.
(2014). Genomic inference accurately predicts the timing and severity
of a recent bottleneck in a nonmodel insect population. Molecular
Ecology, 23, 136–150.
McGrath, J. M., & Quiros, C. F. (1992). Genetic diversity at isozyme and
RFLP loci in Brassica campestris as related to crop type and geo-
graphical origin. Theoretical and Applied Genetics, 83, 783–790.
Meyer, R. S., & Purugganan, M. D. (2013). Evolution of crop species:
Genetics of domestication and diversification. Nature Reviews Genet-
ics, 14, 840–852.
Miller, A. J., & Gross, B. L. (2011). From forest to field: Perennial fruit
crop domestication. American Journal of Botany, 98, 1389–1414.
Molina, J., Sikora, M., Garud, N., Flowers, J. M., Rubinstein, S., Reynolds,
A., . . . Boyko, A. R. (2011). Molecular evidence for a single evolution-
ary origin of domesticated rice. Proceedings of the National Academy
of Sciences of the United States of America, 108, 8351–8356.
Nei, M., & Li, W. H. (1979). Mathematical model for studying genetic
variation in terms of restriction endonucleases. Proceedings of the
National Academy of Sciences of the United States of America, 76,
5269–5273.
Olsen, K. M., & Wendel, J. F. (2013). A bountiful harvest: Genomic
insights into crop domestication phenotypes. Annual Review of Plant
Biology, 64, 47–70.
Pang, W., Li, X., Choi, S. R., Dhandapani, V., Im, S., Park, M. Y., . . . Kim,
W. (2015). Development of a leafy Brassica rapa fixed line collection
for genetic diversity and population structure analysis. Molecular
Breeding: New Strategies in Plant Improvement, 35, 1–15.
Parkin, I. A., Koh, C., Tang, H., Robinson, S. J., Kagale, S., Clarke, W. E.,
. . . Sharpe, A. G. (2014). Transcriptome and methylome profiling
reveals relics of genome dominance in the mesopolyploid Brassica
oleracea. Genome Biology, 15, R77.
Phillips, P. W. B., & Khachatourians, G.G. (2001). The biotechnology revo-
lution in global agriculture: Innovation, invention, and investment in the
Canola industry. Oxfordshire: CABI Pub.
Piperno, D. R., & Flannery, K. V. (2001). The earliest archaeological
maize (Zea mays L.) from highland Mexico: New accelerator mass
spectrometry dates and their implications. Proceedings of the
National Academy of Sciences of the United States of America, 98,
2101–2103.
Piperno, D. R., Ranere, A. J., Holst, I., Iriarte, J., & Dickau, R. (2009).
Starch grain and phytolith evidence for early ninth millennium BP
maize from the Central Balsas River Valley, Mexico. Proceedings of
the National Academy of Sciences, 106, 5019–5024.
Prakash, S., & Hinata, K. (1980). Taxonomy, cytogenetics and origin of
crop Brassicas, a review. Opera Bot, 55, 1–57.
Prakash, S., Wu, X.-M., & Bhat, S.R. (2011). History, evolution, and
domestication of Brassica crops. In J. Janick (Ed.), Plant breeding
reviews (Vol 35, pp. 19–84). Hoboken, BJ: Wiley Online Library.
Purcell, S., Neale, B., Todd-Brown, K., Thomas, L., Ferreira, M. A., Bender,
D., . . . Sham, P. C. (2007). PLINK: A tool set for whole-genome asso-
ciation and population-based linkage analyses. American Journal of
Human Genetics, 81, 559–575.
Purugganan, M. D., Boyles, A. L., & Suddith, J. I. (2000). Variation and
selection at the CAULIFLOWER floral homeotic gene accompanying
the evolution of domesticated Brassica oleracea. Genetics, 155, 855–
862.
Purugganan, M. D., & Fuller, D. Q. (2009). The nature of selection during
plant domestication. Nature, 457, 843–848.
Raj, A., Stephens, M., & Pritchard, J. K. (2014). fastSTRUCTURE: Varia-
tional inference of population structure in large SNP data sets. Genet-
ics, 197, 573–589.
Reiner, H., Holzner, W., & Ebermann, R. (1995). The development of
turnip-type and oilseed-type Brassica rapa crops from the wild-type
in Europe–An overview of botanical, historical and linguistic facts.
Rapeseed Today Tomorrow, 4, 1066–1069.
Ren, J., McFerson, J. R., Li, R., Kresovich, S., & Lamboy, W. F. (1995).
Identities and relationships among Chinese vegetable Brassicas as
determined by Random Amplified Polymorphic DNA markers. Journal
of the American Society for Horticultural Science American Society for
Horticultural Science, 120, 548–555.
Robinson, J. D., Coffman, A. J., Hickerson, M. J., & Gutenkunst, R. N.
(2014). Sampling strategies for frequency spectrum-based population
genomic inference. BMC Evolutionary Biology, 14, 254.
Ross-Ibarra, J., Morrell, P. L., & Gaut, B. S. (2007). Plant domestication, a
unique opportunity to identify the genetic basis of adaptation. Pro-
ceedings of the National Academy of Sciences of the United States of
America, 104, 8641–8648.
Sang, T., & Ge, S. (2013). Understanding rice domestication and implica-
tions for cultivar improvement. Current Opinion in Plant Biology, 16,
139–146.
Smith, B. D. (1997). The initial domestication of Cucurbita pepo in the
Americas 10,000 years ago. Science, 276, 932–934.
QI ET AL. | 3387

Song, K., Osborn, T. C., & Williams, P. H. (1990). Brassica taxonomy
based on nuclear restriction fragment length polymorphisms (RFLPs).
Theoretical and Applied Genetics, 79, 497–506.
Stamatakis, A. (2014). RAxML version 8: A tool for phylogenetic analysis
and post-analysis of large phylogenies. Bioinformatics, 30, 1312–
1313.
Takahashi, Y., Yokoi, S., & Takahata, Y. (2015). Genetic divergence of
turnip (Brassica rapa L. em. Metzg. subsp. rapa) inferred from simple
sequence repeats in chloroplast and nuclear genomes and morphol-
ogy. Genetic Resources and Crop Evolution, 63, 869–879.
Takuno, S., Kawahara, T., & Ohnishi, O. (2006). Phylogenetic relationships
among cultivated types of Brassica rapa L. em. Metzg. as revealed by
AFLP analysis. Genetic Resources and Crop Evolution, 54, 279–285.
Tang, S., & Knapp, S. J. (2003). Microsatellites uncover extraordinary
diversity in native American land races and wild populations of
cultivated sunflower. Theoretical and Applied Genetics, 106,
990–1003.
Tanhuanp€a€a, P., Erkkil€a, M., Tenhola-Roininen, T., Tanskanen, J., & Man-
ninen, O. (2016). SNP diversity within and among Brassica rapa
accessions reveals no geographic differentiation. Genome, 59, 11–21.
Trapnell, C., Pachter, L., & Salzberg, S. L. (2009). TopHat: Discovering
splice junctions with RNA-Seq. Bioinformatics, 25, 1105–1111.
Wang, X., Wang, H., Wang, J., Sun, R., Wu, J., Liu, S., . . . Huang, S.
(2011). The genome of the mesopolyploid crop species Brassica rapa.
Nature Genetics, 43, 1035–1039.
Wu, J., Li, F., Xu, K., Gao, G., Chen, B., Yan, G., . . . Zhang, T. (2014).
Assessing and broadening genetic diversity of a rapeseed germplasm
collection. Breeding Science, 64, 321–330.
Xie, Y., Wu, G., Tang, J., Luo, R., Patterson, J., Liu, S., . . . Zhou, X. (2014).
SOAPdenovo-Trans: De novo transcriptome assembly with short
RNA-Seq reads. Bioinformatics, 30, 1660–1666.
Ye, J. (1989). The name and reality of the rape (Brassica campestris and
Brassica juncea) in China. Studies in the History of Natural Sciences, 8,
158–165.
Zhao, J., Artemyeva, A., Del Carpio, D. P., Basnet, R. K., Zhang, N., Gao,
J., . . . Bonnema, G. (2010). Design of a Brassica rapa core collection
for association mapping studies. Genome, 53, 884–898.
Zhao, J., Paulo, M.-J., Jamar, D., Lou, P., Van Eeuwijk, F., Bonnema, G.,
. . . Koornneef, M. (2007). Association mapping of leaf traits, flower-
ing time, and phytate content in Brassica rapa. Genome, 50, 963–973.
Zhao, J., Wang, X., Deng, B., Lou, P., Wu, J., Sun, R., . . . Bonnema, G.
(2005). Genetic relationships within Brassica rapa as inferred from
AFLP fingerprints. Theoretical and Applied Genetics, 110, 1301–1314.
Zhu, Q., Zheng, X., Luo, J., Gaut, B. S., & Ge, S. (2007). Multilocus analy-
sis of nucleotide variation of Oryza sativa and its wild relatives: Sev-
ere bottleneck during domestication of rice. Molecular Biology and
Evolution, 24, 875–888.
Zohary, D., Hopf, M., & Weiss, E. (2012). Domestication of plants in the
Old World: The origin and spread of domesticated plants in Southwest
Asia, Europe, and the Mediterranean basin. Oxford: Oxford University
Press.
SUPPORTING INFORMATION
Additional Supporting Information may be found online in the sup-
porting information tab for this article.
How to cite this article: Qi X, An H, Ragsdale AP, et al.
Genomic inferences of domestication events are corroborated
by written records in Brassica rapa. Mol Ecol. 2017;26:3373–
3388. https://doi.org/10.1111/mec.14131
3388 | QI ET AL.