Genomic Convergence toward Diploidy Saccharomyces cerevisiaeotto/Reprints/Gerstein2006.pdf ·...
24
Genomic Convergence toward Diploidy in Saccharomyces cerevisiae Aleeza C. Gerstein, Hye-Jung E. Chun, Alex Grant, Sarah P. Otto * Department of Zoology, University of British Columbia, Vancouver, British Columbia, Canada Genome size, a fundamental aspect of any organism, is subject to a variety of mutational and selection pressures. We investigated genome size evolution in haploid, diploid, and tetraploid initially isogenic lines of the yeast Saccharomyces cerevisiae. Over the course of ;1,800 generations of mitotic division, we observed convergence toward diploid DNA content in all replicate lines. This convergence was observed in both unstressful and stressful environments, although the rate of convergence was dependent on initial ploidy and evolutionary environment. Comparative genomic hybridization with microarrays revealed nearly euploid DNA content by the end of the experiment. As the vegetative life cycle of S. cerevisiae is predominantly diploid, this experiment provides evidence that genome size evolution is constrained, with selection favouring the genomic content typical of the yeast’s evolutionary past. Citation: Gerstein AC, Chun HJE, Grant A, Otto SP (2006) Genomic convergence toward diploidy in Saccharomyces cerevisiae. PLoS Genet 2(9): e145. DOI: 10.1371/journal. pgen.0020145 Introduction Organisms vary tremendously in genome size [1,2] yet the key evolutionary forces acting to shape genome size in any particular organism remain unclear. Genome size is subject to small-scale changes (gene insertions or deletions) as well as large-scale ploidy differences (changes in the number of full chromosome sets). Genome size is known to influence a variety of phenotypes, including cell size [3], generation time [4], ecological tolerances [5], and reproductive traits [6]. Gene copy number is also thought to affect long-term rates of evolution, by altering the available number of mutations [7] and the efficacy of selection [6,8,9]. Using the budding yeast Saccharomyces cerevisiae as a model system, experimental evolution studies have confirmed the influence of genome size on long-term rates of evolution [7,10,11]. Genomic composition can, in turn, evolve over the course of such experiments. Recent experiments provide strong evidence that genomic changes, including insertions, deletions, and translocations, contribute to adaptation to novel environ- ments in both Escherichia coli [12] and S. cerevisiae [13]. To investigate the evolutionary importance of genome size, we evolved initially isogenic haploid, diploid, and tetraploid S. cerevisiae for 1,766 asexual generations in batch culture. Five replicate lines of each ploidy level were grown in two experimental environments: an unstressful medium consist- ing of standard lab YPD (yeast extract peptone dextrose), and a salt-stressed medium consisting of YPD and 0.6 M NaCl. Large-scale (ploidy level) changes in genome size throughout the timescale of the experiment were identified using flow cytometry, while relative changes in gene copy number, including aneuploidies and indels, were identified using comparative genomic hybridization (CGH) of genomic DNA to microarrays at the final time point. Remarkably, we found convergent evolution among initially haploid and initially tetraploid lines toward diploidy, the predominant vegetative state of S. cerevisiae [14]. These results suggest that genome size is subject to evolutionary inertia, with selection opposing shifts in ploidy away from the historical level. Results/Discussion Evolution with respect to genome size was surprisingly consistent: all strains converged toward or remained diploid (Figure 1), the predominant vegetative state of S. cerevisiae. Diploid individuals appeared and rose to high frequency through all ten replicate haploid populations (25 colonies were sampled from each line at generation 1,766; only one out of 250 colonies was still haploid), in both unstressed (Figure 1A) and salt-stressed (Figure 1B) media. Similarly, all ten initially tetraploid lines decreased in genome size (unstressed medium, Figure 1E; salt-stressed medium, Figure 1F). Cells of approximately diploid DNA content were found in all 5 3 25 colonies sampled at generation 1,766 from the five unstressed medium lines and from 25 colonies sampled from one of the salt-stressed lines (line qs), while cells of approximately triploid DNA content were observed in the 4 3 25 colonies sampled from the remaining four salt-stressed lines. Consid- erable polymorphism for genome size was apparent at earlier time points in this experiment for both initially haploid and initially tetraploid lines (Figures 1 and S1). Diploid lines showed no large-scale changes, though smaller-scale fluctua- tions in genome size occurred throughout the time series in both unstressed (Figure 1C) and salt-stressed (Figure 1D) media. The pattern of convergence towards diploidy was confirmed in a second independent experiment (Figure S2). To find out whether chromosomes were present in euploid Editor: Susan Dutcher, Washington University, United States of America Received May 23, 2006; Accepted July 27, 2006; Published September 22, 2006 DOI: 10.1371/journal.pgen.0020145 Copyright: Ó 2006 Gerstein et al. This is an open-access article distributed under the terms of the Creative Commons Attribution License, which permits unrestricted use, distribution, and reproduction in any medium, provided the original author and source are credited. Abbreviations: CGH, comparative genomic hybridization; MAT, mating type; YPD, yeast extract peptone dextrose * To whom correspondence should be addressed. E-mail: [email protected] PLoS Genetics | www.plosgenetics.org September 2006 | Volume 2 | Issue 9 | e145 0001
Transcript of Genomic Convergence toward Diploidy Saccharomyces cerevisiaeotto/Reprints/Gerstein2006.pdf ·...
Genomic Convergence toward Diploidyin Saccharomyces cerevisiaeAleeza C. Gerstein, Hye-Jung E. Chun, Alex Grant, Sarah P. Otto
*
Department of Zoology, University of British Columbia, Vancouver, British Columbia, Canada
Genome size, a fundamental aspect of any organism, is subject to a variety of mutational and selection pressures. Weinvestigated genome size evolution in haploid, diploid, and tetraploid initially isogenic lines of the yeastSaccharomyces cerevisiae. Over the course of ;1,800 generations of mitotic division, we observed convergencetoward diploid DNA content in all replicate lines. This convergence was observed in both unstressful and stressfulenvironments, although the rate of convergence was dependent on initial ploidy and evolutionary environment.Comparative genomic hybridization with microarrays revealed nearly euploid DNA content by the end of theexperiment. As the vegetative life cycle of S. cerevisiae is predominantly diploid, this experiment provides evidencethat genome size evolution is constrained, with selection favouring the genomic content typical of the yeast’sevolutionary past.
Citation: Gerstein AC, Chun HJE, Grant A, Otto SP (2006) Genomic convergence toward diploidy in Saccharomyces cerevisiae. PLoS Genet 2(9): e145. DOI: 10.1371/journal.pgen.0020145
Introduction
Organisms vary tremendously in genome size [1,2] yet thekey evolutionary forces acting to shape genome size in anyparticular organism remain unclear. Genome size is subject tosmall-scale changes (gene insertions or deletions) as well aslarge-scale ploidy differences (changes in the number of fullchromosome sets). Genome size is known to influence avariety of phenotypes, including cell size [3], generation time[4], ecological tolerances [5], and reproductive traits [6]. Genecopy number is also thought to affect long-term rates ofevolution, by altering the available number of mutations [7]and the efficacy of selection [6,8,9]. Using the budding yeastSaccharomyces cerevisiae as a model system, experimentalevolution studies have confirmed the influence of genomesize on long-term rates of evolution [7,10,11]. Genomiccomposition can, in turn, evolve over the course of suchexperiments. Recent experiments provide strong evidencethat genomic changes, including insertions, deletions, andtranslocations, contribute to adaptation to novel environ-ments in both Escherichia coli [12] and S. cerevisiae [13].
To investigate the evolutionary importance of genome size,we evolved initially isogenic haploid, diploid, and tetraploidS. cerevisiae for 1,766 asexual generations in batch culture. Fivereplicate lines of each ploidy level were grown in twoexperimental environments: an unstressful medium consist-ing of standard lab YPD (yeast extract peptone dextrose), anda salt-stressed medium consisting of YPD and 0.6 M NaCl.Large-scale (ploidy level) changes in genome size throughoutthe timescale of the experiment were identified using flowcytometry, while relative changes in gene copy number,including aneuploidies and indels, were identified usingcomparative genomic hybridization (CGH) of genomic DNAto microarrays at the final time point. Remarkably, we foundconvergent evolution among initially haploid and initiallytetraploid lines toward diploidy, the predominant vegetativestate of S. cerevisiae [14]. These results suggest that genome sizeis subject to evolutionary inertia, with selection opposingshifts in ploidy away from the historical level.
Results/Discussion
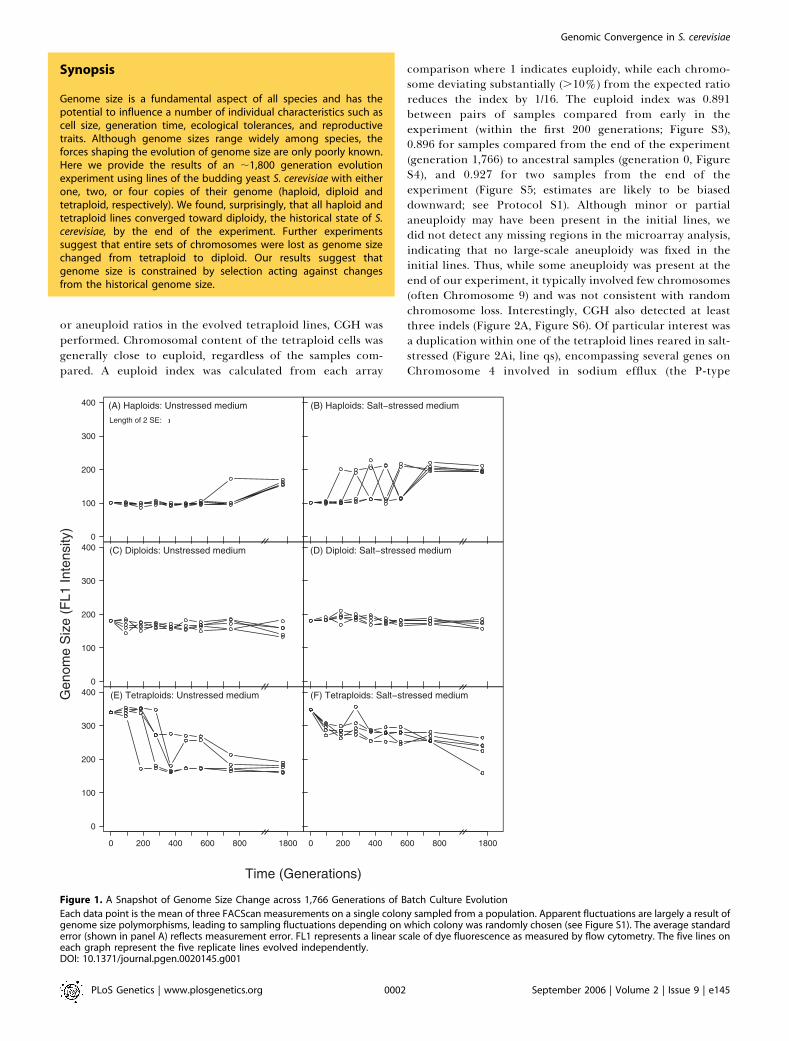
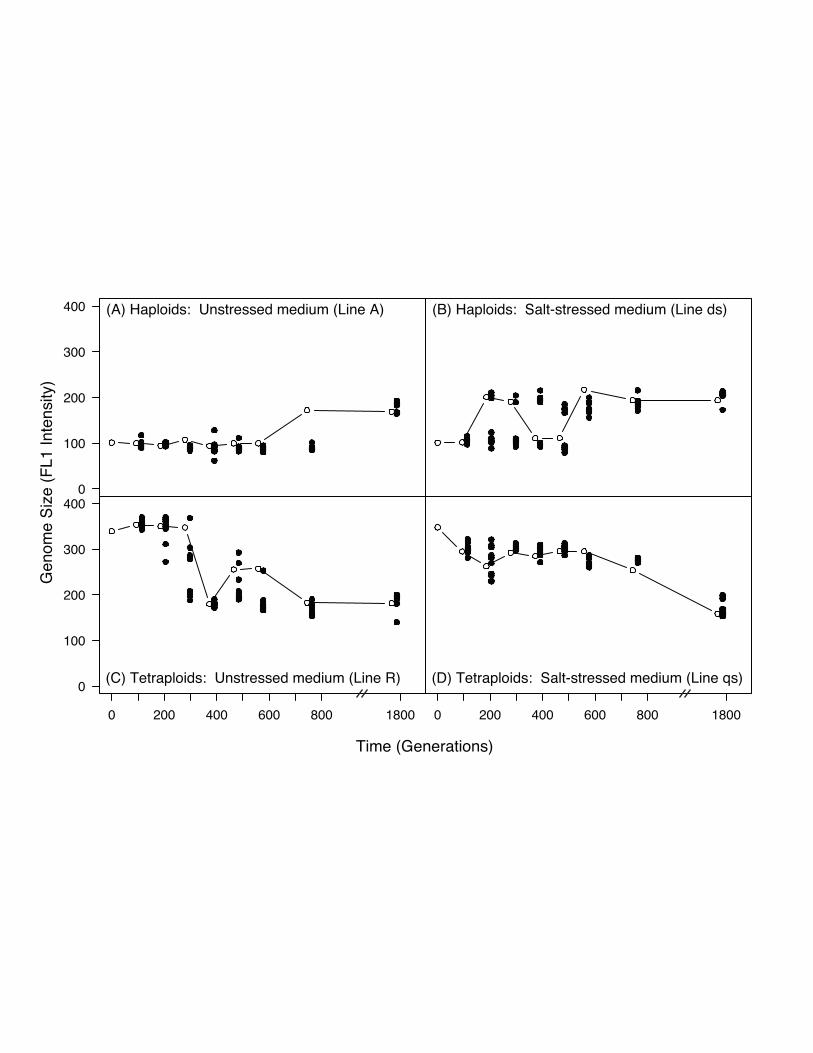
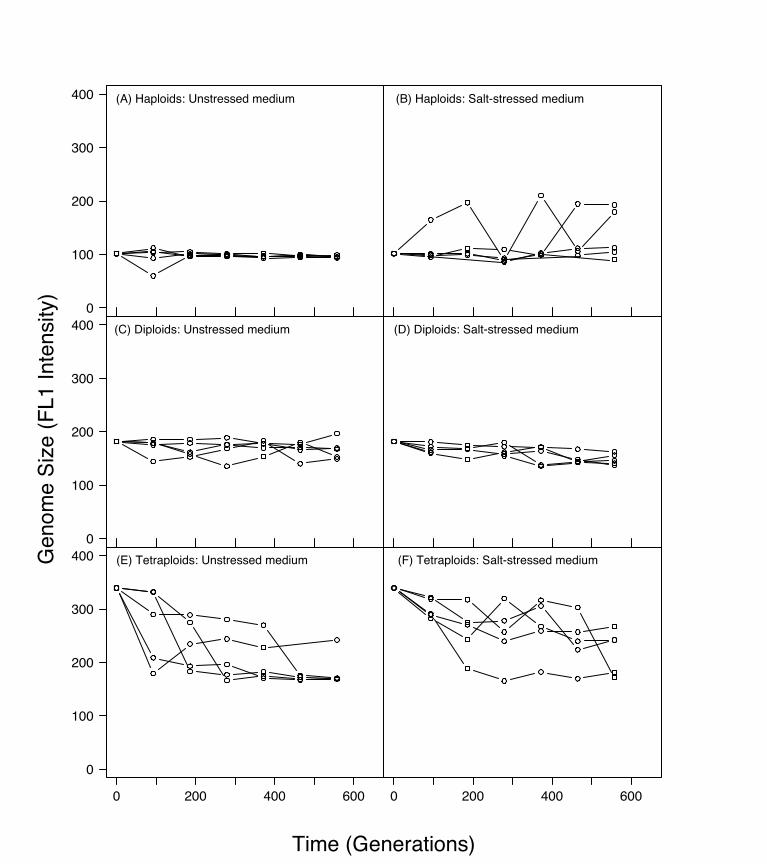
Evolution with respect to genome size was surprisinglyconsistent: all strains converged toward or remained diploid(Figure 1), the predominant vegetative state of S. cerevisiae.Diploid individuals appeared and rose to high frequencythrough all ten replicate haploid populations (25 colonieswere sampled from each line at generation 1,766; only one outof 250 colonies was still haploid), in both unstressed (Figure1A) and salt-stressed (Figure 1B) media. Similarly, all teninitially tetraploid lines decreased in genome size (unstressedmedium, Figure 1E; salt-stressed medium, Figure 1F). Cells ofapproximately diploid DNA content were found in all 5 3 25colonies sampled at generation 1,766 from the five unstressedmedium lines and from 25 colonies sampled from one of thesalt-stressed lines (line qs), while cells of approximatelytriploid DNA content were observed in the 4 3 25 coloniessampled from the remaining four salt-stressed lines. Consid-erable polymorphism for genome size was apparent at earliertime points in this experiment for both initially haploid andinitially tetraploid lines (Figures 1 and S1). Diploid linesshowed no large-scale changes, though smaller-scale fluctua-tions in genome size occurred throughout the time series inboth unstressed (Figure 1C) and salt-stressed (Figure 1D)media. The pattern of convergence towards diploidy wasconfirmed in a second independent experiment (Figure S2).To find out whether chromosomes were present in euploid
Editor: Susan Dutcher, Washington University, United States of America
Received May 23, 2006; Accepted July 27, 2006; Published September 22, 2006
DOI: 10.1371/journal.pgen.0020145
Copyright: � 2006 Gerstein et al. This is an open-access article distributed underthe terms of the Creative Commons Attribution License, which permits unrestricteduse, distribution, and reproduction in any medium, provided the original authorand source are credited.
Abbreviations: CGH, comparative genomic hybridization; MAT, mating type; YPD,yeast extract peptone dextrose
* To whom correspondence should be addressed. E-mail: [email protected]
PLoS Genetics | www.plosgenetics.org September 2006 | Volume 2 | Issue 9 | e1450001
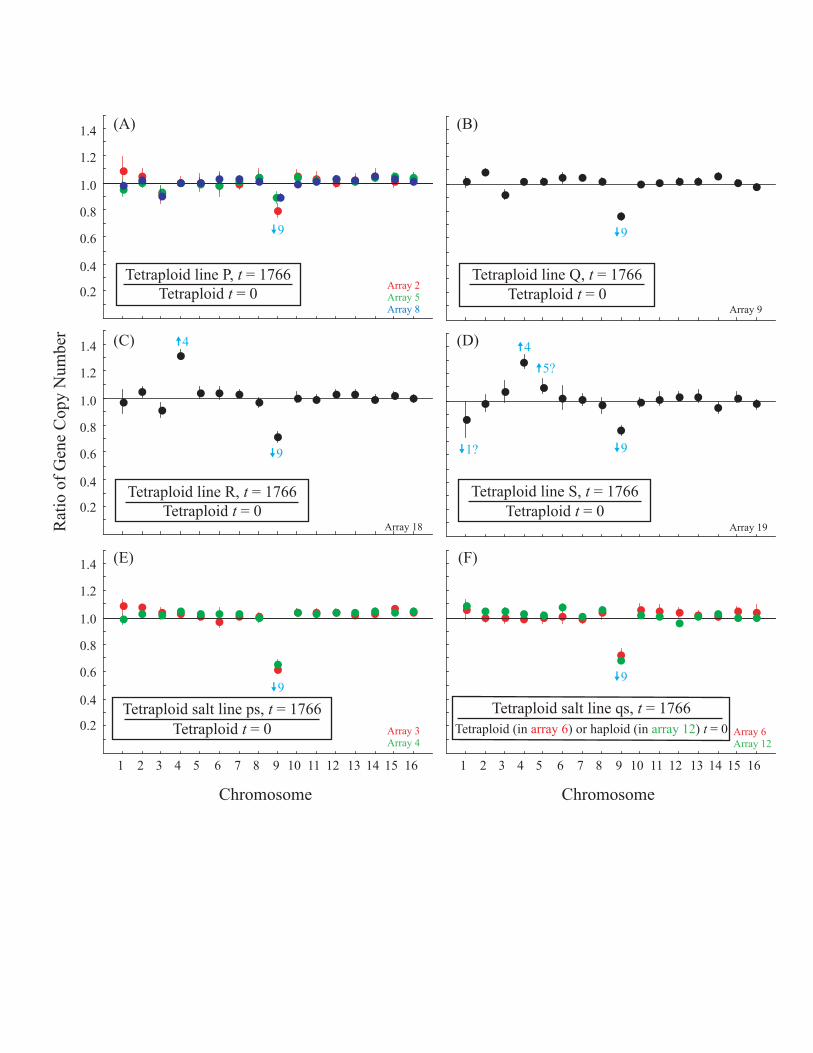
or aneuploid ratios in the evolved tetraploid lines, CGH wasperformed. Chromosomal content of the tetraploid cells wasgenerally close to euploid, regardless of the samples com-pared. A euploid index was calculated from each array
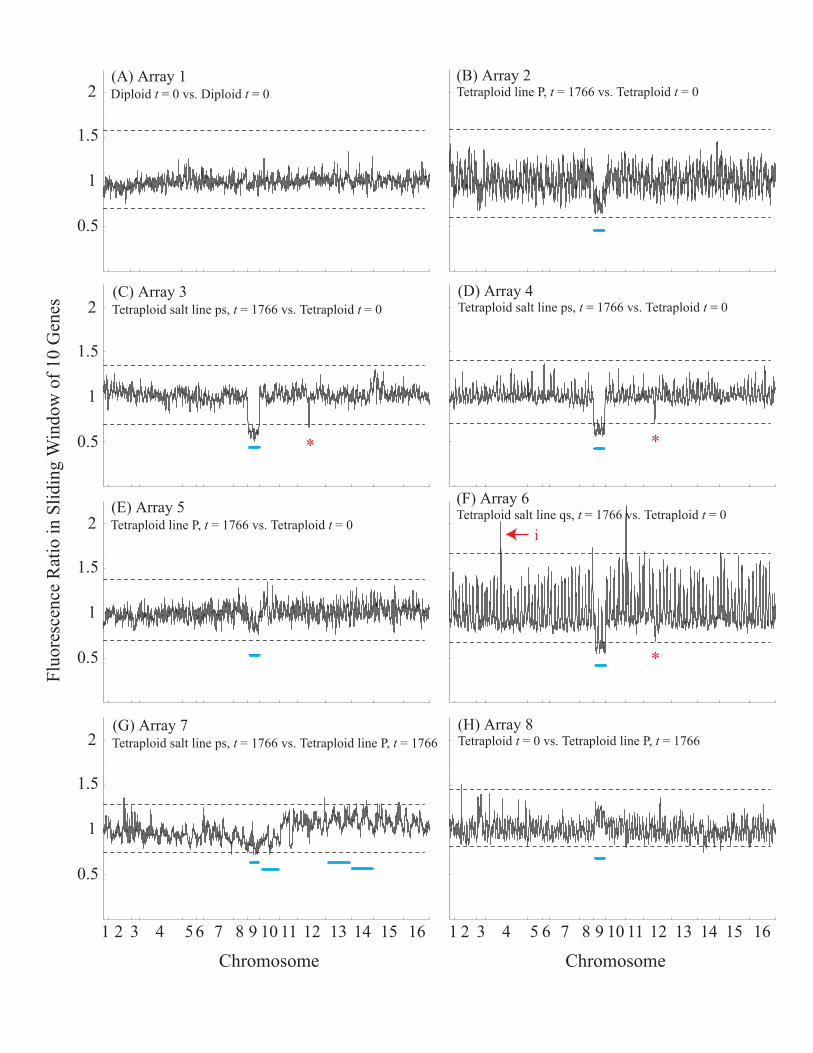
comparison where 1 indicates euploidy, while each chromo-some deviating substantially (.10%) from the expected ratioreduces the index by 1/16. The euploid index was 0.891between pairs of samples compared from early in theexperiment (within the first 200 generations; Figure S3),0.896 for samples compared from the end of the experiment(generation 1,766) to ancestral samples (generation 0, FigureS4), and 0.927 for two samples from the end of theexperiment (Figure S5; estimates are likely to be biaseddownward; see Protocol S1). Although minor or partialaneuploidy may have been present in the initial lines, wedid not detect any missing regions in the microarray analysis,indicating that no large-scale aneuploidy was fixed in theinitial lines. Thus, while some aneuploidy was present at theend of our experiment, it typically involved few chromosomes(often Chromosome 9) and was not consistent with randomchromosome loss. Interestingly, CGH also detected at leastthree indels (Figure 2A, Figure S6). Of particular interest wasa duplication within one of the tetraploid lines reared in salt-stressed (Figure 2Ai, line qs), encompassing several genes onChromosome 4 involved in sodium efflux (the P-type
Figure 1. A Snapshot of Genome Size Change across 1,766 Generations of Batch Culture Evolution
Each data point is the mean of three FACScan measurements on a single colony sampled from a population. Apparent fluctuations are largely a result ofgenome size polymorphisms, leading to sampling fluctuations depending on which colony was randomly chosen (see Figure S1). The average standarderror (shown in panel A) reflects measurement error. FL1 represents a linear scale of dye fluorescence as measured by flow cytometry. The five lines oneach graph represent the five replicate lines evolved independently.DOI: 10.1371/journal.pgen.0020145.g001
PLoS Genetics | www.plosgenetics.org September 2006 | Volume 2 | Issue 9 | e1450002
Genomic Convergence in S. cerevisiae
Synopsis
Genome size is a fundamental aspect of all species and has thepotential to influence a number of individual characteristics such ascell size, generation time, ecological tolerances, and reproductivetraits. Although genome sizes range widely among species, theforces shaping the evolution of genome size are only poorly known.Here we provide the results of an ;1,800 generation evolutionexperiment using lines of the budding yeast S. cerevisiae with eitherone, two, or four copies of their genome (haploid, diploid andtetraploid, respectively). We found, surprisingly, that all haploid andtetraploid lines converged toward diploidy, the historical state of S.cerevisiae, by the end of the experiment. Further experimentssuggest that entire sets of chromosomes were lost as genome sizechanged from tetraploid to diploid. Our results suggest thatgenome size is constrained by selection acting against changesfrom the historical genome size.
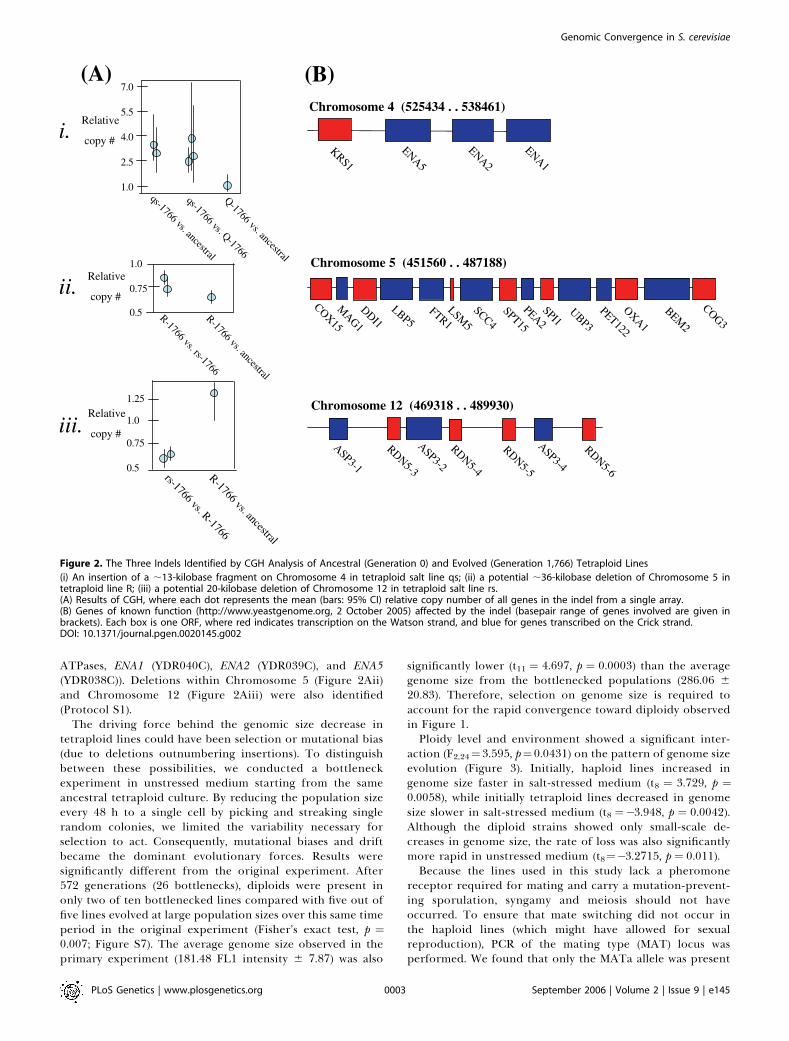
ATPases, ENA1 (YDR040C), ENA2 (YDR039C), and ENA5(YDR038C)). Deletions within Chromosome 5 (Figure 2Aii)and Chromosome 12 (Figure 2Aiii) were also identified(Protocol S1).
The driving force behind the genomic size decrease intetraploid lines could have been selection or mutational bias(due to deletions outnumbering insertions). To distinguishbetween these possibilities, we conducted a bottleneckexperiment in unstressed medium starting from the sameancestral tetraploid culture. By reducing the population sizeevery 48 h to a single cell by picking and streaking singlerandom colonies, we limited the variability necessary forselection to act. Consequently, mutational biases and driftbecame the dominant evolutionary forces. Results weresignificantly different from the original experiment. After572 generations (26 bottlenecks), diploids were present inonly two of ten bottlenecked lines compared with five out offive lines evolved at large population sizes over this same timeperiod in the original experiment (Fisher’s exact test, p ¼0.007; Figure S7). The average genome size observed in theprimary experiment (181.48 FL1 intensity 6 7.87) was also
significantly lower (t11 ¼ 4.697, p ¼ 0.0003) than the averagegenome size from the bottlenecked populations (286.06 6
20.83). Therefore, selection on genome size is required toaccount for the rapid convergence toward diploidy observedin Figure 1.Ploidy level and environment showed a significant inter-
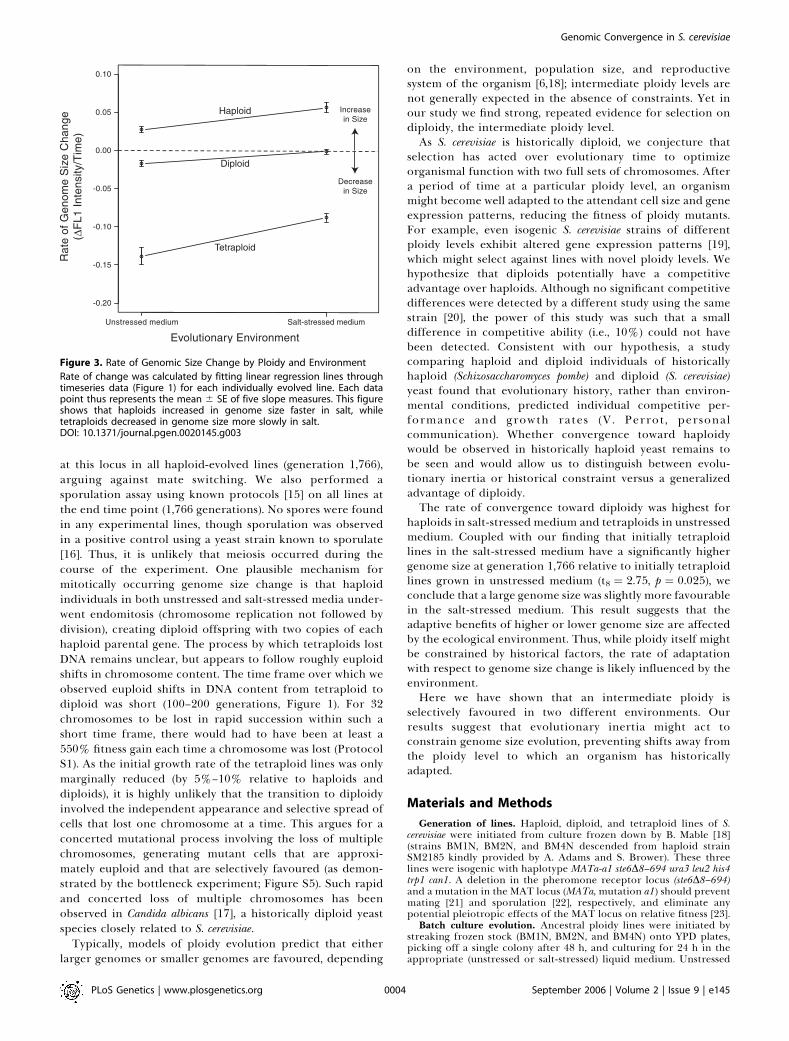
action (F2,24¼3.595, p¼0.0431) on the pattern of genome sizeevolution (Figure 3). Initially, haploid lines increased ingenome size faster in salt-stressed medium (t8 ¼ 3.729, p ¼0.0058), while initially tetraploid lines decreased in genomesize slower in salt-stressed medium (t8 ¼�3.948, p ¼ 0.0042).Although the diploid strains showed only small-scale de-creases in genome size, the rate of loss was also significantlymore rapid in unstressed medium (t8¼�3.2715, p ¼ 0.011).Because the lines used in this study lack a pheromone
receptor required for mating and carry a mutation-prevent-ing sporulation, syngamy and meiosis should not haveoccurred. To ensure that mate switching did not occur inthe haploid lines (which might have allowed for sexualreproduction), PCR of the mating type (MAT) locus wasperformed. We found that only the MATa allele was present
Figure 2. The Three Indels Identified by CGH Analysis of Ancestral (Generation 0) and Evolved (Generation 1,766) Tetraploid Lines
(i) An insertion of a ;13-kilobase fragment on Chromosome 4 in tetraploid salt line qs; (ii) a potential ;36-kilobase deletion of Chromosome 5 intetraploid line R; (iii) a potential 20-kilobase deletion of Chromosome 12 in tetraploid salt line rs.(A) Results of CGH, where each dot represents the mean (bars: 95% CI) relative copy number of all genes in the indel from a single array.(B) Genes of known function (http://www.yeastgenome.org, 2 October 2005) affected by the indel (basepair range of genes involved are given inbrackets). Each box is one ORF, where red indicates transcription on the Watson strand, and blue for genes transcribed on the Crick strand.DOI: 10.1371/journal.pgen.0020145.g002
PLoS Genetics | www.plosgenetics.org September 2006 | Volume 2 | Issue 9 | e1450003
Genomic Convergence in S. cerevisiae
at this locus in all haploid-evolved lines (generation 1,766),arguing against mate switching. We also performed asporulation assay using known protocols [15] on all lines atthe end time point (1,766 generations). No spores were foundin any experimental lines, though sporulation was observedin a positive control using a yeast strain known to sporulate[16]. Thus, it is unlikely that meiosis occurred during thecourse of the experiment. One plausible mechanism formitotically occurring genome size change is that haploidindividuals in both unstressed and salt-stressed media under-went endomitosis (chromosome replication not followed bydivision), creating diploid offspring with two copies of eachhaploid parental gene. The process by which tetraploids lostDNA remains unclear, but appears to follow roughly euploidshifts in chromosome content. The time frame over which weobserved euploid shifts in DNA content from tetraploid todiploid was short (100–200 generations, Figure 1). For 32chromosomes to be lost in rapid succession within such ashort time frame, there would had to have been at least a550% fitness gain each time a chromosome was lost (ProtocolS1). As the initial growth rate of the tetraploid lines was onlymarginally reduced (by 5%–10% relative to haploids anddiploids), it is highly unlikely that the transition to diploidyinvolved the independent appearance and selective spread ofcells that lost one chromosome at a time. This argues for aconcerted mutational process involving the loss of multiplechromosomes, generating mutant cells that are approxi-mately euploid and that are selectively favoured (as demon-strated by the bottleneck experiment; Figure S5). Such rapidand concerted loss of multiple chromosomes has beenobserved in Candida albicans [17], a historically diploid yeastspecies closely related to S. cerevisiae.
Typically, models of ploidy evolution predict that eitherlarger genomes or smaller genomes are favoured, depending
on the environment, population size, and reproductivesystem of the organism [6,18]; intermediate ploidy levels arenot generally expected in the absence of constraints. Yet inour study we find strong, repeated evidence for selection ondiploidy, the intermediate ploidy level.As S. cerevisiae is historically diploid, we conjecture that
selection has acted over evolutionary time to optimizeorganismal function with two full sets of chromosomes. Aftera period of time at a particular ploidy level, an organismmight become well adapted to the attendant cell size and geneexpression patterns, reducing the fitness of ploidy mutants.For example, even isogenic S. cerevisiae strains of differentploidy levels exhibit altered gene expression patterns [19],which might select against lines with novel ploidy levels. Wehypothesize that diploids potentially have a competitiveadvantage over haploids. Although no significant competitivedifferences were detected by a different study using the samestrain [20], the power of this study was such that a smalldifference in competitive ability (i.e., 10%) could not havebeen detected. Consistent with our hypothesis, a studycomparing haploid and diploid individuals of historicallyhaploid (Schizosaccharomyces pombe) and diploid (S. cerevisiae)yeast found that evolutionary history, rather than environ-mental conditions, predicted individual competitive per-formance and growth rates (V. Perrot, personalcommunication). Whether convergence toward haploidywould be observed in historically haploid yeast remains tobe seen and would allow us to distinguish between evolu-tionary inertia or historical constraint versus a generalizedadvantage of diploidy.The rate of convergence toward diploidy was highest for
haploids in salt-stressed medium and tetraploids in unstressedmedium. Coupled with our finding that initially tetraploidlines in the salt-stressed medium have a significantly highergenome size at generation 1,766 relative to initially tetraploidlines grown in unstressed medium (t8 ¼ 2.75, p ¼ 0.025), weconclude that a large genome size was slightly more favourablein the salt-stressed medium. This result suggests that theadaptive benefits of higher or lower genome size are affectedby the ecological environment. Thus, while ploidy itself mightbe constrained by historical factors, the rate of adaptationwith respect to genome size change is likely influenced by theenvironment.Here we have shown that an intermediate ploidy is
selectively favoured in two different environments. Ourresults suggest that evolutionary inertia might act toconstrain genome size evolution, preventing shifts away fromthe ploidy level to which an organism has historicallyadapted.
Materials and Methods
Generation of lines. Haploid, diploid, and tetraploid lines of S.cerevisiae were initiated from culture frozen down by B. Mable [18](strains BM1N, BM2N, and BM4N descended from haploid strainSM2185 kindly provided by A. Adams and S. Brower). These threelines were isogenic with haplotype MATa-a1 ste6D8–694 ura3 leu2 his4trp1 can1. A deletion in the pheromone receptor locus (ste6D8–694)and a mutation in the MAT locus (MATa,mutation a1) should preventmating [21] and sporulation [22], respectively, and eliminate anypotential pleiotropic effects of the MAT locus on relative fitness [23].
Batch culture evolution. Ancestral ploidy lines were initiated bystreaking frozen stock (BM1N, BM2N, and BM4N) onto YPD plates,picking off a single colony after 48 h, and culturing for 24 h in theappropriate (unstressed or salt-stressed) liquid medium. Unstressed
Figure 3. Rate of Genomic Size Change by Ploidy and Environment
Rate of change was calculated by fitting linear regression lines throughtimeseries data (Figure 1) for each individually evolved line. Each datapoint thus represents the mean 6 SE of five slope measures. This figureshows that haploids increased in genome size faster in salt, whiletetraploids decreased in genome size more slowly in salt.DOI: 10.1371/journal.pgen.0020145.g003
PLoS Genetics | www.plosgenetics.org September 2006 | Volume 2 | Issue 9 | e1450004
Genomic Convergence in S. cerevisiae

medium was YPD (Difco, Sparks, Maryland, United States). The salt-stressed medium was unstressed medium plus 0.6 M NaCl, whichreduced initial growth rates by 35%. Culture was then frozen down at�80 8C in 15% dimethyl sulfoxide (DMSO; Sigma, St. Louis, Missouri,United States) as the six time zero lines (three ploidy levels 3 twoenvironments). 53100 ul from each of these six initial tubes was thenpipetted into 10 ml of appropriate medium and used to initiate fivereplicate lines. 266 daily (24 h 6 1 h) 1:100 transfers (100 ll culture into10 ml medium) were conducted sequentially. As each transfer allowed;6.64 mitotic divisions (26.64¼101) before the population returned tostationary phase, a total of ;1,766 (¼ 266 3 6.64) cell generationsoccurredper line regardless of environment.Cultureswere continuallyshaken at 200 rpm and maintained at 30 8C overnight. Subsequentfreezing was conducted every 2 wk (93 generations).
Genome size determination. Flow cytometry (FACScans) was usedto determine relative ploidy of all lines at nine different time points:0, 93, 186, 279, 372, 465, 558, 744, and 1,766 cell generations. TheFACScan protocol [24] was modified as described by the FredHutchinson Cancer Research Center (http://www.fhcrc.org/science/labs/gottschling/yeast/facs.html). Cells from frozen culture werestreaked to single colonies on YPD plates. A single colony was pickedoff and grown in YPD for 24 h. The only deviation in protocol wasthat the last pellet was resuspended in 980 ll of sodium citrate and 20ll of 0.05 mM SYTOX Green dye. Cultures were kept at roomtemperature for a minimum of 3 h (but up to 24 h) to ensure dyeuptake and then stored at 4 8C overnight.
30,000 cells from each culture were analyzed on a FACSCalibur(Becton-Dickinson Immunocytometry Systems, Palo Alto, California,United States). The FL1 detector was used for the acquisition ofSYTOX Green fluorescence, where dye is taken up by the cells in amanner stoichiometric to the amount of DNA in the nucleus. TheFlowJo (Tree Star, Ashland, Oregon, United States) cell cycle analysisfunction using the Watson pragmatic option was used to fit Gaussiancurves to our data to determine the FL1 intensity corresponding tothe G1 mean, which indicates the average unreplicated DNA contentof each population of cells [25].
FACScans over all time points for the five replicate lines of eachtreatment (45 tubes) were performed on the same day. The entireprotocol was replicated on three different days using cells from thesame colonies; any variation reflects machine/treatment variation andnot genetic variation within the cultures. A significant day effect wasfound, and the data were corrected by adjusting the replicate datacollected on different days to have the same mean. The correcteddata were used for subsequent analyses.
Microarrays. On a subset of the tetraploid lines, we used CGH ofgenomic DNA of microarrays to determine whether the evolved lineswere euploid or aneuploid [26,27]. For each CGH, a colony wasisolated from frozen stock and grown to stationary phase in liquidYPD. Genomic DNA was extracted from 8 ml of stationary phaseculture using a standard yeast mini-prep DNA isolation procedure[28]. Genomic DNA (5 lg) was sonicated (3310 s at 45% of 20 kHz) toobtain DNA fragments of roughly 100 basepairs to 10 kilobases andpurified with a QIAquick PCR Purification Kit (Qiagen, Valencia,California, United States). The two DNA samples to be comparedwere labeled with Cy3 or Cy5 using the Mirus Label IT Nucleic AcidLabeling Kit (Mirus, Madison, Wisconsin, United States), according tothe manufacturer’s protocol. We then co-hybridized the labeledgenomic DNA to S. cerevisiae microarrays obtained from theUniversity Health Network Microarray Centre (Toronto, Ontario,Canada). The hybridized slides were washed and scanned usingScanArray Express (PerkinElmer, Wellesley, California, United States)set to the yeast protocol. QuantArray (PerkinElmer) was used toquantify the relative fluorescence of Cy3 and Cy5 between the twosamples of interest. Finally, GeneSpring (Agilent, Palo Alto, Cal-ifornia, United States) was used to order the data according tochromosomal location.
CGH analysis. All fluorescence ratios were log-transformed priorto analysis and back-transformed for presentation. The averagefluorescence ratio was first calculated for each chromosome to assessthe degree of aneuploidy. A 99.8% confidence interval for thechromosomal average ratio was obtained by bootstrapping. Boot-strapping involved randomly sampling from the gene ratios observedwithin a particular chromosome with replacement, yielding abootstrap dataset with the same number of data points as theoriginal chromosome; 1,000 bootstrap datasets were obtained perchromosome. A 99.8% confidence interval was chosen to correct formultiple comparisons across the 16 chromosomes of S. cerevisiae(giving an overall alpha value per genome of a¼ 0.03).
As the same concentration of DNA was hybridized to eachmicroarray, a CGH analysis cannot assess relative differences in
ploidy level between lines. Aneuploidy of a chromosome can bedetected, however, as a departure from a fluorescence ratio of one ina CGH comparison of two otherwise euploid genomes. A decrease incopy number of a particular chromosome is expected to lead to a 0.5ratio (in diploids), 0.67 (in triploids), or 0.75 ratio (in tetraploids)relative to the rest of the chromosomes. Conversely, an increase incopy number of a particular chromosome is expected to lead to a 1.5ratio (in diploids), 1.33 ratio (in triploids), or 1.25 ratio (intetraploids) relative to the rest of the chromosomes.
Bottleneck experiment. Ten replicate tetraploid populations werestreaked onto YPD plates. Every 2 d (;22 generations) of growth, asingle random colony was picked and streaked onto a new plate.Culture was frozen every 2 wk (;154 generations). This procedure ofrepeated bottlenecks ensured that each line had a low effectivepopulation size [29] (Ne ¼ 22).
Rate of genome size evolution. A regression line was fit through thegenome size data as a function of time. The y-intercept wasconstrained as the genome size at time zero and was thus the samefor all ten (replicates 3 environment) lines of each ploidy. The meanslope was calculated for each of the six populations (ploidy 3environment) as the mean of the slopes of the five replicate lines. Atwo-way ANOVA was performed to test for an interaction betweenploidy and environments. t-tests were then performed to determinedifferences in the rate of genome size evolution between environ-ments for each ploidy level. The assumption of normality was met inall cases (p . 0.05). All analyses were performed using JMP [30].
PCR. Yeast genomic DNA was isolated. PCR was run twice for allevolved (generation 1,766) haploid lines and the ancestral haploidlines using forward primers specific to the MATa (59–CTCCACTT-CAAGTAAGAGTTTGGGT–39) and MATalpha (59–TTACTCA-CAGTTTGGCTCCGGTGT–39) alleles and a common reverse primer(MAT 39–R: 59–GAACCGCATGGGCAGTTTACCTTT–39). Amplifica-tion of DNA sequence was achieved by 30 cycles of DNA denaturation(96 8C for 1 min), primer annealing (55 8C, 1 min), and primerelongation (72 8C, 1 min) followed by a 5-min incubation at 72 8Cafter the final cycle. The haploid yeast strains YPH 499 (MATa) andYPH 500 (MATalpha) were used as controls to ensure the primersamplified the proper regions.
Supporting Information
Figure S1. Temporal Polymorphism for Genome Size across 1,800Generations of Batch Culture
Found at DOI: 10.1371/journal.pgen.0020145.sg001 (725 KB PDF).
Figure S2. Genome Size Change across ;600 Generations of BatchCulture Evolution from a Replicate Experiment
Found at DOI: 10.1371/journal.pgen.0020145.sg002 (214 KB PDF).
Figure S3. Average Fluorescence Ratio by Chromosome from CGHbetween Lineages Early in the Experiment
Found at DOI: 10.1371/journal.pgen.0020145.sg003 (580 KB PDF).
Figure S4. Average Fluorescence Ratio by Chromosome from CGHbetween Lineages Late and Early in the Experiment
Found at DOI: 10.1371/journal.pgen.0020145.sg004 (631 KB PDF).
Figure S5. Average Fluorescence Ratio by Chromosome from CGHbetween Lineages Late in the Experiment
Found at DOI: 10.1371/journal.pgen.0020145.sg005 (624 KB PDF).
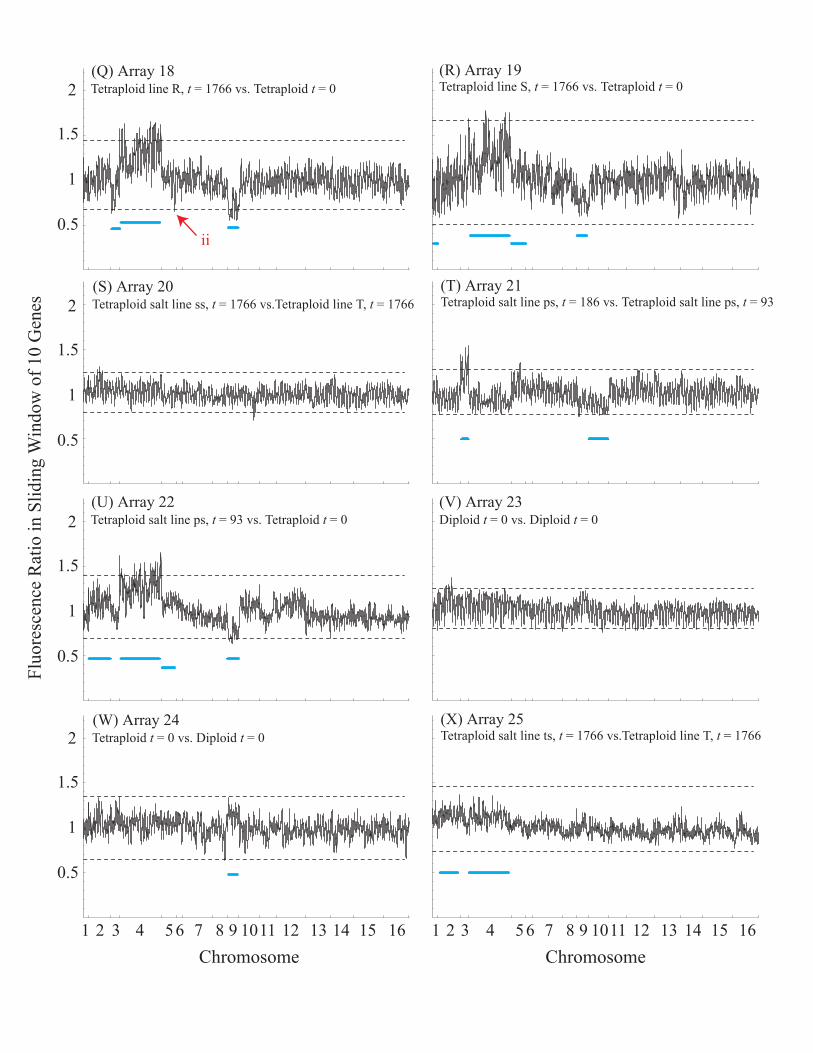
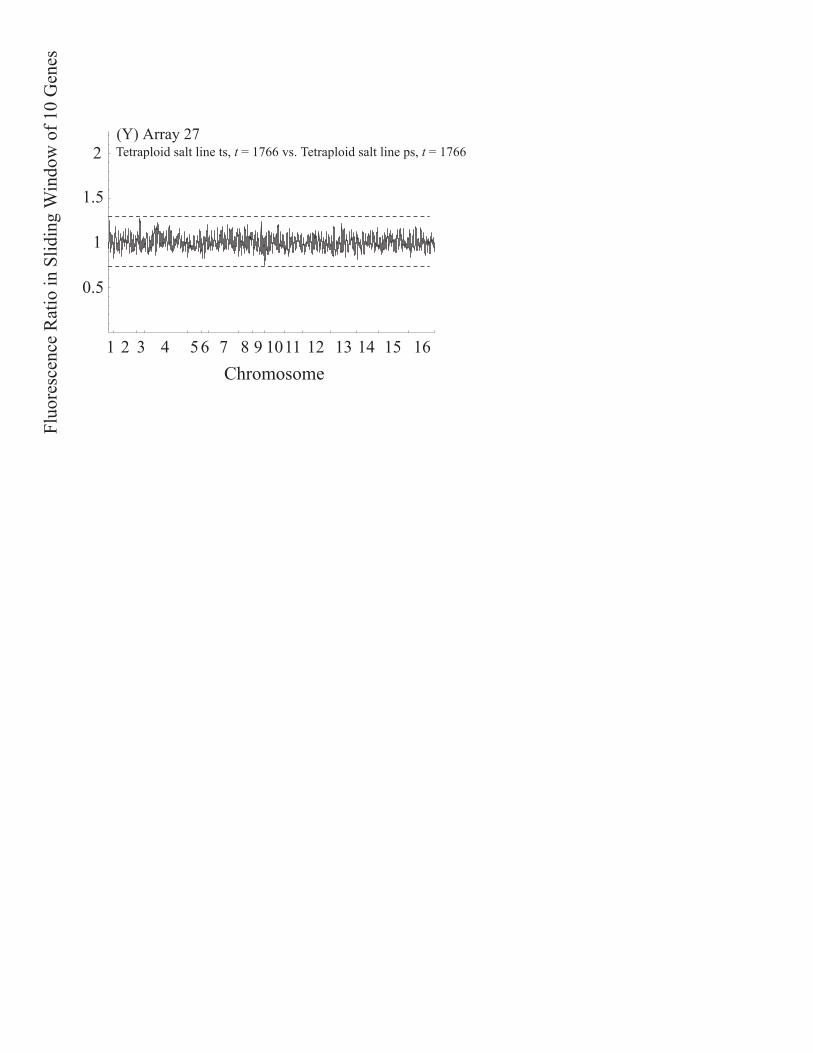
Figure S6. Sliding Window Analysis of the Arrays, using a WindowLength of Ten Genes
Found at DOI: 10.1371/journal.pgen.0020145.sg006 (4.7 KB PDF).
Figure S7. Genome Size Measured from Ten Populations (B1–B10)Evolved by Repeated Bottlenecking for 566 Generations and FivePopulations (S1–S5) Evolved through Batch Culture Transfers for 558Generations
Found at DOI: 10.1371/journal.pgen.0020145.sg007 (542 KB PDF).
Protocol S1. Supplementary Material
Found at DOI: 10.1371/journal.pgen.0020145.sd001 (46 KB DOC).
Accession Numbers
The Saccharomyces Genome Database (SGD) (http://www.yeastgenome.org) accession numbers for Chromosomes 4, 5, and 12 are
PLoS Genetics | www.plosgenetics.org September 2006 | Volume 2 | Issue 9 | e1450005
Genomic Convergence in S. cerevisiae

NC_001136.8, NC_001137, and NC_001144.4, respectively; theaccession numbers for ENA1, ENA2, and ENA5 are YDR040C,YDR039C, and YDR038C, respectively.
Acknowledgments
We thank A. Blachford, M. Brazas, A. Cameron, R. Docking, L.Glaubach, R. Hancock, M. Mandegar, R. McBride, J. Oh, M. Wang, andP. Wu for technical assistance; A. Johnson for advice on flowcytometry; and M. Whitlock, R. Redfield, the SOWD DiscussionGroup, S. Yeaman, as well as the reviewers of the manuscript for
many helpful comments. The authors are especially grateful to R.Redfield for her expertise and advice.
Author contributions. ACG, HJEC, AG, and SPO conceived anddesigned the experiments. ACG, HJEC, and AG performed theexperiments. ACG, HJEC, and SPO analyzed the data. ACG and SPOwrote the paper.
Funding. This work was supported by an NSERC PGS-A Grant toACG and an NSERC Discovery Grant to SPO.
Competing interests. The authors have declared that no competinginterests exist.
References1. Cavalier-Smith T (1978) Nuclear volume control by nucleoskeletal DNA,
selection for cell volume and cell growth rate, and the solution of the DNAC-value paradox. J Cell Sci 34: 247–278.
2. Gregory TR (2001) Coincidence, coevolution, or correlation? DNA content,cell size, and the C-value enigma. Biol Rev 76: 65–101.
3. Weiss RL, Kukora JR, Adams J (1975) The relationship between enzymeactivity, cell geometry, and fitness in Saccharomyces cerevisiae. Proc Natl AcadSci U S A 72: 794–798.
4. Petrov DA (2001) Evolution of genome size: New approaches to an oldproblem. Trends Genet 17: 23–28.
5. Lewis WH (1980) Polyploidy: Biological relevance. New York: Plenum Press.583 p.
6. Otto SP, Whitton J (2000) Polyploid incidence and evolution. Annu RevGenet 34: 401–437.
7. Paquin C, Adams J (1983) Frequency of fixation of adaptive mutations ishigher in evolving diploid than haploid yeast populations. Nature 302: 495–500.
8. Perrot V, Richerd S, Valero M (1991) Transition from haploidy to diploidy.Nature 351: 315–317.
9. Orr HA, Otto SP (1993) Does diploidy increase the rate of adaptation?Genetics 136: 1475–1480.
10. Zeyl C, Vanderford T, Carter M (2003) An evolutionary advantage ofhaploidy in large yeast populations. Science 299: 555–558.
11. Anderson JB, Sirjusingh C, Ricker N (2004) Haploidy, diploidy andevolution of antifungal drug resistance in Saccharomyces cerevisiae. Genetics168: 1915–1923.
12. Riehle MM, Bennett AF, Long AD (2001) Genetic architecture of thermaladaptation in Escherichia coli. Proc Natl Acad Sci U S A 98: 525–530.
13. Dunham MJ, Badrane H, Ferea T, Adams J, Brown PO, et al. (2002)Characteristic genome rearrangements in experimental evolution ofSaccharomyces cerevisiae. Proc Natl Acad Sci U S A 99: 16144–16149.
14. Nasmyth K, Shore D (1987) Transcriptional regulation in the yeast lifecycle. Science 237: 1162–1170.
15. Kassir Y, Simchen G (1991) Monitoring meiosis and sporulation inSaccharomyces cerevisiae. Methods in Enzym 194: 94–110.
16. Zeyl C, deVisser JA (2001) Estimates of the rate and distribution of fitness
effects of spontaneous mutation in Saccharomyces cerevisiae. Genetics 157: 53–61.
17. Bennett RJ, Johnson AD (2003) Completion of a parasexual cycle in Candidaalbicans by induced chromosome loss in tetraploid strains. EMBO J 22:2505–2515.
18. Mable BK, Otto SP (2001) Masking and purging mutations following EMStreatment in haploid, diploid and tetraploid yeast (Saccharomyces cerevisiae).Genet Res 77: 9–26.
19. Galitski T, Saldanha AJ, Styles CA, Lander ES, Fink GR (1999) Ploidyregulation of gene expression. Science 285: 251–254.
20. Mable BK (2001) Ploidy evolution in the yeast Saccharomyces cerevisiae: A testof the nutrient limitation hypothesis. J Evol Biol 14: 157–170.
21. Kuchler K, Sterne RE, Thorner J (1989) Saccharomyces cerevisiae STE6 geneproduct: A novel pathway for protein export in eukaryotic cells. EMBO 8:3973–3984.
22. Kassir Y, Hicks JB, Herskowitz I (1983) SAD Mutation of Saccharomycescerevisiae is an extra a cassette. Mol Cell Biol 3: 871–880.
23. Selk E, Wills C (1998) Mismatch repair and the accumulation of deleteriousmutations influence the competitive advantage of MAT (mating type)heterozygosity in the yeast Saccharomyces cerevisiae. Genet Res Camb 71: 1–10.
24. Nash R, Tokiwa G, Anand S, Erickson K, Futcher AB (1998) The WHI1þgene of Saccharomyces cerevisiae tethers cell division to cell size and is a cyclinhomolog. EMBO J 71: 4335–4346.
25. Watson JV, Chambers SH, Smith PJ. (1987) A pragmatic approach to theanalysis of DNA histograms with a definable G1 peak. Cytometry 8: 1–8.
26. Pollack JR, Perou CM, Alizadeh AA, Elsen MB, Pergamenschikov A, et al.(1999) Genome-wide analysis of DNA copy-number changes using cDNAmicroarrays. Nat Genet 23: 41–46.
27. Hughes TR, Roberts CJ, Dai H, Jones AR, Meyer MR, et al. (2000)Widespread aneuploidy revealed by DNA microarray expression profiling.Nat Genet 25: 333–337.
28. Davis RW, Thomas M, Cameron J, St John TP, Scherer S, et al. (1980) RapidDNA isolation for enzymatic and hybridization analysis. Methods Enzymol65: 404–411.
29. Gerrish PJ, Wahl LM (2001) The probability that beneficial mutations arelost in populations with periodic bottlenecks. Evolution 55: 2606–2610.
30. SAS Institute (2005) JMP 5.1. Cary NC: SAS Institute Inc.
PLoS Genetics | www.plosgenetics.org September 2006 | Volume 2 | Issue 9 | e1450006
Genomic Convergence in S. cerevisiae

Protocol S1
Replicate Evolution Experiment
30 lines were initiated from the same ancestral stock (BM1N, BM2N, BM4N) andwere evolved for 582 asexual generations using the same batch culture evolutionmethodology as the primary experiment. Results from FACScans are shown in Figure
S1.
Analysis of Aneuploidy by CGH
Comparative genomic hybridization (CGH) was performed using 27 microarrays.
Some arrays that appeared nosiy after intial analysis (e.g. array 10) were repeated.Otherwise, we attempted to maximize the number of lines hybridized onto the arrays
using a round robin appraoch. All 25 successful arrays are shown (hybridization failedon arrays 17 and 25). Supplementary Figures S3 – S5 show the average fluorescence
ratio of each chromosome obtained by CGH, along with 99.8% confidence intervals
obtained by bootstrapping all of the gene ratio data from the particular chromosome.
Figure S3 compares genomes early in the experiment. Figure S3a compares
two diploid lines from time point 0. The small amount of variation from the expectedratio of one is unlikely to be biologically significant. For example, consider the puzzling
observation that numerically similar chromosomes (e.g., chromosomes 10 – 16) differ
significantly from the expected ratio of one in the same direction (see green array 23 inFigure S3a). This observation is likely explained by the fact that genes on the same
chromosome and from numerically adjacent chromosomes are more likely to be withinthe same row or column on the microarrays provided by the University Health Network.
This interpretation is supported by the fact that the confidence intervals approximately
double in length if we bootstrap by block (i.e., sample with replacement among the 48blocks of 16
€
×17 spots), a procedure that controls for the non-random design of the array
within blocks. As aneuploidy should cause downward shifts to 0.75 (loss of onechromsomome in a tetraploid) or upward shifts to 1.25 (gain of one chromosome in a
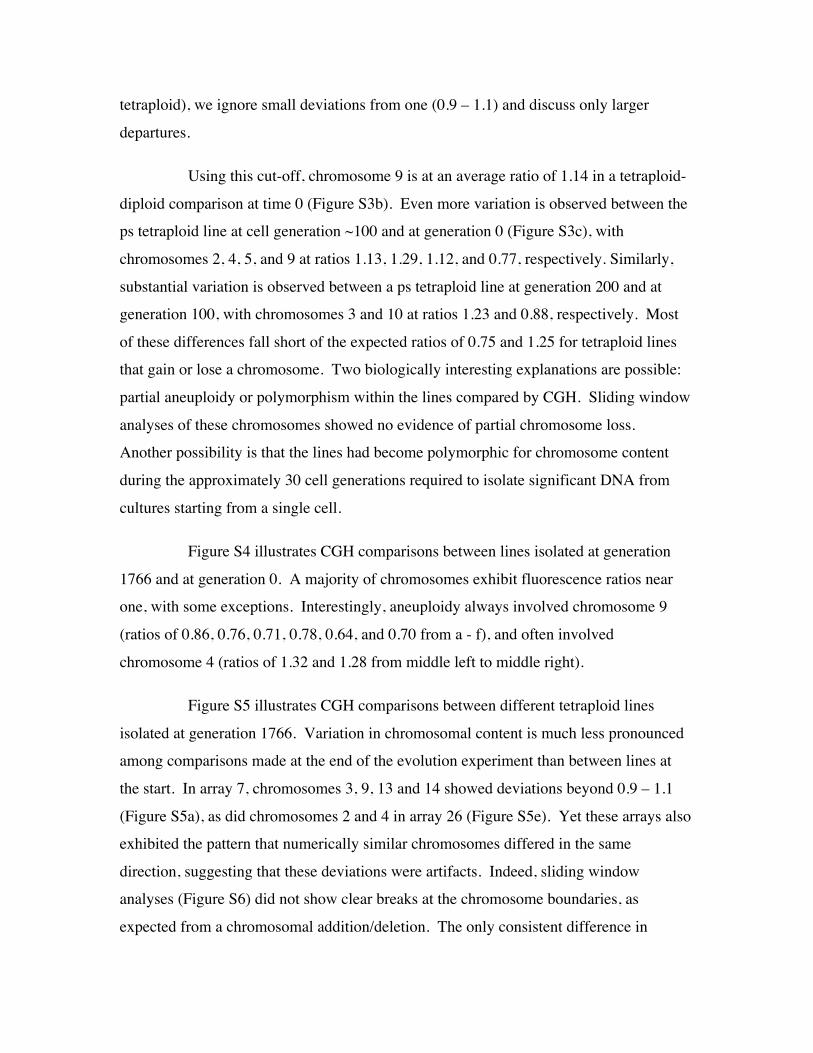
tetraploid), we ignore small deviations from one (0.9 – 1.1) and discuss only larger
departures.
Using this cut-off, chromosome 9 is at an average ratio of 1.14 in a tetraploid-
diploid comparison at time 0 (Figure S3b). Even more variation is observed between theps tetraploid line at cell generation ~100 and at generation 0 (Figure S3c), with
chromosomes 2, 4, 5, and 9 at ratios 1.13, 1.29, 1.12, and 0.77, respectively. Similarly,
substantial variation is observed between a ps tetraploid line at generation 200 and atgeneration 100, with chromosomes 3 and 10 at ratios 1.23 and 0.88, respectively. Most
of these differences fall short of the expected ratios of 0.75 and 1.25 for tetraploid linesthat gain or lose a chromosome. Two biologically interesting explanations are possible:
partial aneuploidy or polymorphism within the lines compared by CGH. Sliding window
analyses of these chromosomes showed no evidence of partial chromosome loss.Another possibility is that the lines had become polymorphic for chromosome content
during the approximately 30 cell generations required to isolate significant DNA from
cultures starting from a single cell.
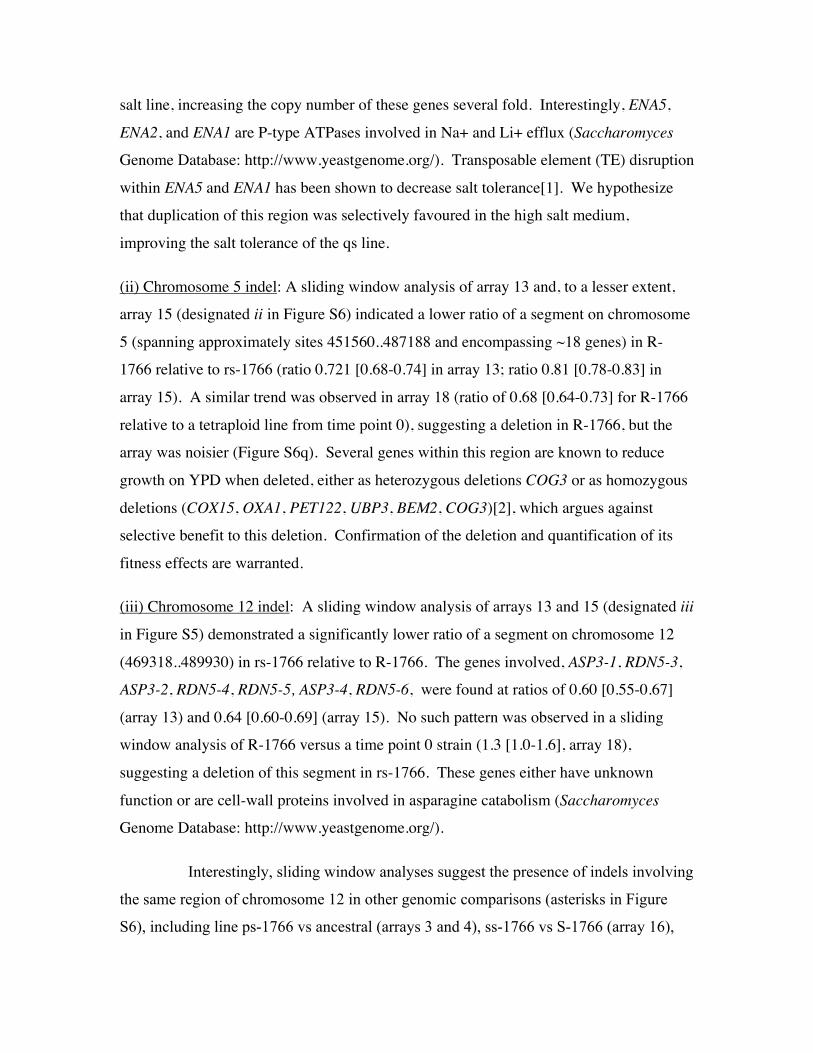
Figure S4 illustrates CGH comparisons between lines isolated at generation
1766 and at generation 0. A majority of chromosomes exhibit fluorescence ratios nearone, with some exceptions. Interestingly, aneuploidy always involved chromosome 9
(ratios of 0.86, 0.76, 0.71, 0.78, 0.64, and 0.70 from a - f), and often involved
chromosome 4 (ratios of 1.32 and 1.28 from middle left to middle right).
Figure S5 illustrates CGH comparisons between different tetraploid lines
isolated at generation 1766. Variation in chromosomal content is much less pronouncedamong comparisons made at the end of the evolution experiment than between lines at
the start. In array 7, chromosomes 3, 9, 13 and 14 showed deviations beyond 0.9 – 1.1
(Figure S5a), as did chromosomes 2 and 4 in array 26 (Figure S5e). Yet these arrays alsoexhibited the pattern that numerically similar chromosomes differed in the same
direction, suggesting that these deviations were artifacts. Indeed, sliding windowanalyses (Figure S6) did not show clear breaks at the chromosome boundaries, as
expected from a chromosomal addition/deletion. The only consistent difference in

genomic content among the lines at the end of the experiment was chromosome 3 in the
comparisons between line rs19 and R19 in arrays 13 and 15 (Figure S5c; average ratio =1.15). Sliding window analyses of arrays 13, 15, and 18 suggest a partial deletion of
chromosome 3 in line R19.
The interpretation of the microarrays is made complicated by the fact that the
time 0 “controls” exhibited variation in chromosomal content (Figure S3). Nevertheless,
several broad patterns are apparent in the results. Most importantly, the roughly triploidor diploid DNA content of the evolved lines detected by FACS analysis (Figure 1) is not
consistent with random chromosome loss, as most of the lines analyzed from generation1766 exhibited chromosomal ratios near one. However, the lines do exhibit aneuploid
differences, appearing early in the experiment and often involving chromosome 9.
Analysis of Indels by CGH
CGH was also used to detect smaller deletions and insertions. We performed
sliding window analyses using a window size of 10 genes to search for indels. We onlyfocused on those windows that showed peaks or troughs that were outside of the range
observed in 100 randomizations of the genome and that were consistent across multiplearrays involving the same lines. Using these criteria, three potential indels were
identified. Multiple arrays allowed us to pinpoint the type of indel that occurred in case
(i); our inferences for cases (ii) and (iii) are based on fewer arrays and are more tentative.
(i) Chromosome 4 insertion: A sliding window analysis of arrays 6 and 12 (designated i
in Figure S6) demonstrated a higher ratio of the same segment on chromosome 4(525434..538461) in qs-1766 relative to Q-1766. The genes involved, KRS1, ENA1,
ENA2, and ENA5, were found at ratios in this region of 3.7 [2.5,5.6] and 3.1 [2.0-4.7]
with 95% confidence intervals in brackets (based on a normal approximation usingobserved standard errors for the log-ratio data). Arrays 10, 11, and 14 also exhibit higher
ratios in this region at 2.8 [1.2-6.4] (array 10), 4.0 [2.0-8.1] (array 11), and 2.6 [2.0-3.4](array 14), indicating that qs-1766 carries an insertion. Consistent with this conclusion,
the ratio in this region was not significantly different from one in array 9 (0.94 [0.73-
1.13]) involving line Q-1766. We thus infer that an insertion has occurred in the qs high-
salt line, increasing the copy number of these genes several fold. Interestingly, ENA5,
ENA2, and ENA1 are P-type ATPases involved in Na+ and Li+ efflux (Saccharomyces
Genome Database: http://www.yeastgenome.org/). Transposable element (TE) disruption
within ENA5 and ENA1 has been shown to decrease salt tolerance[1]. We hypothesizethat duplication of this region was selectively favoured in the high salt medium,
improving the salt tolerance of the qs line.
(ii) Chromosome 5 indel: A sliding window analysis of array 13 and, to a lesser extent,array 15 (designated ii in Figure S6) indicated a lower ratio of a segment on chromosome
5 (spanning approximately sites 451560..487188 and encompassing ~18 genes) in R-1766 relative to rs-1766 (ratio 0.721 [0.68-0.74] in array 13; ratio 0.81 [0.78-0.83] in
array 15). A similar trend was observed in array 18 (ratio of 0.68 [0.64-0.73] for R-1766
relative to a tetraploid line from time point 0), suggesting a deletion in R-1766, but thearray was noisier (Figure S6q). Several genes within this region are known to reduce
growth on YPD when deleted, either as heterozygous deletions COG3 or as homozygous
deletions (COX15, OXA1, PET122, UBP3, BEM2, COG3)[2], which argues againstselective benefit to this deletion. Confirmation of the deletion and quantification of its
fitness effects are warranted.
(iii) Chromosome 12 indel: A sliding window analysis of arrays 13 and 15 (designated iii
in Figure S5) demonstrated a significantly lower ratio of a segment on chromosome 12
(469318..489930) in rs-1766 relative to R-1766. The genes involved, ASP3-1, RDN5-3,ASP3-2, RDN5-4, RDN5-5, ASP3-4, RDN5-6, were found at ratios of 0.60 [0.55-0.67]
(array 13) and 0.64 [0.60-0.69] (array 15). No such pattern was observed in a slidingwindow analysis of R-1766 versus a time point 0 strain (1.3 [1.0-1.6], array 18),
suggesting a deletion of this segment in rs-1766. These genes either have unknown
function or are cell-wall proteins involved in asparagine catabolism (Saccharomyces
Genome Database: http://www.yeastgenome.org/).
Interestingly, sliding window analyses suggest the presence of indels involving
the same region of chromosome 12 in other genomic comparisons (asterisks in Figure
S6), including line ps-1766 vs ancestral (arrays 3 and 4), ss-1766 vs S-1766 (array 16),

qs-1766 vs time 0 or Q-1766 (arrays 6, 12, 14). These signals were not, however,
detectable across all arrays involving the same lines. This inconsistency might be due to
the difficulties of detecting small indels using CGH and/or due to polymorphisms arising
repeatedly in the preparation of DNA if this is an indel hotspot.
Bottleneck Experiment
Genome size was measured for ten initially tetraploid populations (B1-B10) evolved by
repeated bottlenecking from colonies down to single cells for 566 cell generations. The
genome size of five individuals were sampled from each line and compared to five
individuals from each of the tetraploid populations evolved through batch culture
transfers for 558 generations (from the orignial experiment). The population averages
were significantly higher (p=0.0003; Figure S7) in the bottleneck line.
Calculating required fitness gains
We observed transitions from tetraploid (4n=64 chromosomes) to diploid (2n = 32
chromosomes) in replicate populations over the course of 100 – 200 generations (Figure
1e). We hypothesize that these transitions were driven by large-scale reductions in
genome size, involving more than one chromosome at a time. Here, we show that it
would take extremely strong selection if the transition instead involved a series of 32
mutations, each involving the loss of a single chromosome.
In the absence of sex and recombination, successive beneficial mutation can only
spread to fixation if they arise sequentially in the same background. Following Crow &
Kimura[3], we calculate the expected number of generations between the appearance of
the first beneficial mutation in an asexual population and the appearance of an individual
that carries two beneficial mutations, counting only those beneficial mutations that
survive stochastic loss while rare. At generation t, we expect N p(t) µ second mutations
to occur in an individual carrying the first mutation, where p(t) is the frequency of the
first mutation, N is the population size, and µ is the rate at which the second mutation
occurs. Of these second mutations, only a fraction will survive loss while rare[4]; when
selection is strong, the fraction surviving is approximately
€
1− e−2s .
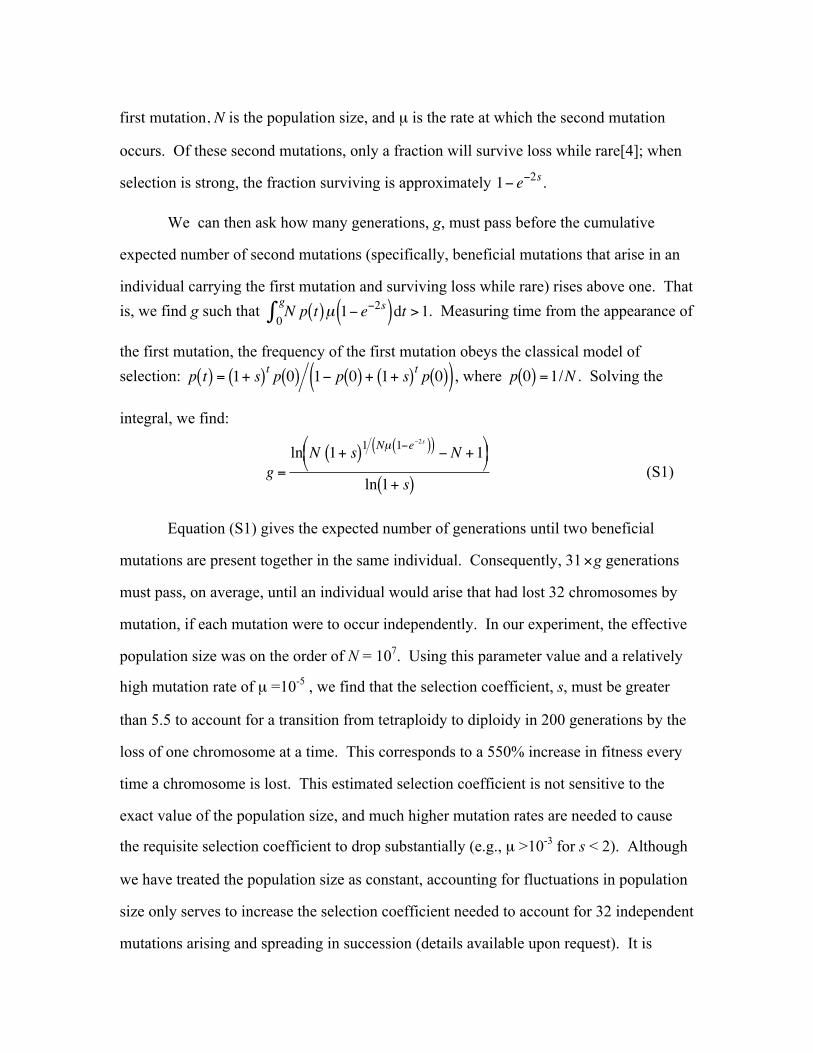
We can then ask how many generations, g, must pass before the cumulative
expected number of second mutations (specifically, beneficial mutations that arise in an
individual carrying the first mutation and surviving loss while rare) rises above one. That
is, we find g such that
€
N p t( )µ 1− e−2s( )0g∫ dt >1. Measuring time from the appearance of
the first mutation, the frequency of the first mutation obeys the classical model of
selection:
€
p t( ) = 1+ s( )t p 0( ) 1− p 0( ) + 1+ s( )t p 0( )( ) , where
€
p 0( ) =1/N . Solving the
integral, we find:
€
g =ln N 1+ s( )1 Nµ 1−e−2s( )( ) − N +1
ln 1+ s( )(S1)
Equation (S1) gives the expected number of generations until two beneficial
mutations are present together in the same individual. Consequently, 31
€
×g generations
must pass, on average, until an individual would arise that had lost 32 chromosomes by
mutation, if each mutation were to occur independently. In our experiment, the effective
population size was on the order of N = 107. Using this parameter value and a relatively
high mutation rate of µ =10-5 , we find that the selection coefficient, s, must be greater
than 5.5 to account for a transition from tetraploidy to diploidy in 200 generations by the
loss of one chromosome at a time. This corresponds to a 550% increase in fitness every
time a chromosome is lost. This estimated selection coefficient is not sensitive to the
exact value of the population size, and much higher mutation rates are needed to cause
the requisite selection coefficient to drop substantially (e.g., µ >10-3 for s < 2). Although
we have treated the population size as constant, accounting for fluctuations in population
size only serves to increase the selection coefficient needed to account for 32 independent
mutations arising and spreading in succession (details available upon request). It is

highly implausible that the loss of each chromosome is accompanied by such extreme
selection, leading us to conclude that the transition from tetraploidy to diploidy did not
occur by a series of independent mutations, losing one chromosome at a time. Instead,
our data support the hypothesis that multiple chromosomes were lost simultaneously.
Whether or not this was precipitated by a mutational event (e.g., losing one chromosome
increases the mutation rate to loss of non-homologous chromosomes) remains unknown.
Supplementary Information References:
1. de Jesus Ferreira, M.C., Bao, X., Laizé, V., & Hohmann, S. Transposon
mutagenesis reveals novel loci affecting tolerance to salt stress and growth at low
temperature. Curr Genet. 40:27-39 (2001)
2. Deutschbauer A. M et al. Mechanisms of haploinsufficiency revealed by genome-
wide profiling in yeast. Genetics 169:1915-25 (2005)
3. Crow, J.F. & Kimura, M. Evolution in sexual and asexual populations. Am Nat 99:
439-450 (1965)
4. Haldane, J.B.S. The mathematical theory of natural and artificial selection. Proc.
Camb. Philos. Soc. 23: 838-844 (1927)

Supplementary Figure S1: Temporal polymorphism for genome size across1800 generations of batch culture. One line from each hapoid and tetraploidpopulation was picked for more in depth analysis. 10 colonies at each timepoint were assayed for genome size (closed circles). The line and opencircles denote the original, single colony data presented in Figure 1.
Supplmentary Figure S2: Genome size change across ~600 generations ofbatch culture evolution from a replicate experiment. FL1 is a linear scale ofdye fluorescence as measured by flow cytometry (FACS). The five lines oneach graph represent the five replicate lines evolved independently. Notethe similar pattern of genome size change depicted in this figure and the first~600 generations of Figure 1.
Supplementary Figure S3: Average fluorescence ratio by chromosomefrom a comparative genomic hybridization between lineages early in theexperiment. Repeated arrays are illustrated in different colors.Chromosomes with average fluorescence ratios outside of 0.9 – 1.1 areindicated in blue text.
Supplementary Figure S4: Average fluorescence ratio by chromosomefrom a comparative genomic hybridization between lineages late and early inthe experiment. Repeated arrays are illustrated in different colors.Chromosomes with average fluorescence ratios outside of 0.9 – 1.1 areindicated in blue text.
Supplementary Figure S6: Fluorescence ratios for sliding window analysesof the arrays, using a window length of 10 genes. Dashed lines representthe maximum and minimum observed in sliding windows of 100 randomizedgenomes. Blue lines represent chromosomal differences inferred fromFigures S1 – S3. Letters i - iii (and *) represent indels discussed in the text.
Supplementary Figure S7: Genome size measured from ten populations(B1-B10) evolved by repeated bottlenecking for 566 generations and fivepopulations (S1-S5) evolved through batch culture transfers for 558generations. Five individuals were sampled from each population (circles).The population averages were significantly higher (p=0.0003) for thebottleneck lines (B1-B10) than the original batch culture lines (S1-S5). Thetwo arrows pointing at the y-axis indicate the average genome size (±2.5) offive individuals sampled from the ancestral diploid and tetraploid stocks.
0
100
200
300
400
●●●
●
●●●●●● ●●●●
●●●●●● ●●●●●●●●●● ●●●
●●●●●
●
●
●●●
●
●●●●●● ●●●●●●●●●● ●●●●●●●●
●●
●●●
●●●●●●
●
(A) Haploids: Unstressed medium (Line A)
●●●●●●●●●●
●
●●
●
●
●●●●● ●●●●
●
●
●
●●●
●●
●●
●
●
●
●●●●
●●●●●●
●●●
●●●●●
●
●●●
●
●●●
●
●●●●●●
●●●●
●
●●●●●
(B) Haploids: Salt-stressed medium (Line ds)
0 200 400 600 800 1800
0
100
200
300
400 ●●●●●●●●
●●
●
●●●
●
●
●
●●
●
●●
●●●
●
●
●●
●●●●●●●●●●
●
●●●●●●
●
●
●●●
●
●●●●
●●● ●
●●
●●
●●●
●
●●●●●
●
●●●●
(C) Tetraploids: Unstressed medium (Line R)
Time (Generations)
0 200 400 600 800 1800
●●●●●
●
●●
●
●
●●●
●
●
●●●●●
●●
●●
●●●●
●
● ●●●●●●●●●● ●●●
●
●●●●●● ●
●●●●●●●
●●
●●●●
●●
●●●● ●●●●●●●●●
●●●●●
●
●●
●
●
(D) Tetraploids: Salt-stressed medium (Line qs)
Gen
ome
Size
(FL1
Inte
nsity
)
0
100
200
300
400 (A) Haploids: Unstressed medium (B) Haploids: Salt-stressed medium
0
100
200
300
400 (C) Diploids: Unstressed medium (D) Diploids: Salt-stressed medium
0 200 400 600
0
100
200
300
400 (E) Tetraploids: Unstressed medium
0 200 400 600
(F) Tetraploids: Salt-stressed medium
Time (Generations)
Gen
ome
Size
(FL1
Inte
nsity
)

0.2
0.4
0.6
0.8
1.2
1.4
1.0
Rat
io o
f G
ene
Cop
y N
umbe
r
0.2
0.4
0.6
0.8
1.2
1.4
1.0
1 2 3 4 5 6 7 8 9 10 11 12 13 14 15 16
Tetraploid salt line ps, t = 186Tetraploid salt line ps, t = 93
Chromosome Chromosome
1 2 3 4 5 6 7 8 9 10 11 12 13 14 15 16
Array 1Array 23
Tetraploid salt line ps, t = 93Tetraploid t = 0
Array 22
Array 24
Array 21
Diploid t = 0Diploid t = 0
Tetraploid t = 0Diploid t = 0
ì2
ì4
ì5
î9
ì9
ì3
↓10
(A) (B)
(D)(C)
0.2
0.4
0.6
0.8
1.2
1.4
1.0
Tetraploid t = 0
Rat
io o
f G
ene
Cop
y N
umbe
r
0.2
0.4
0.6
0.8
1.2
1.4
1.0
Tetraploid t = 0 Tetraploid t = 0
0.2
0.4
0.6
0.8
1.2
1.4
1.0
1 2 3 4 5 6 7 8 9 10 11 12 13 14 15 16
Tetraploid (in array 6) or haploid (in array 12) t = 0
Chromosome Chromosome
1 2 3 4 5 6 7 8 9 10 11 12 13 14 15 16
Array 2Array 5Array 8
Array 3Array 4
Array 6Array 12
Tetraploid t = 0
Tetraploid t = 0
Array 18 Array 19
Array 9
ì4
î9 î9
î9î9
î9î9
ì4
î1?
ì5?
Tetraploid salt line qs, t = 1766Tetraploid salt line ps, t = 1766
Tetraploid line R, t = 1766 Tetraploid line S, t = 1766
Tetraploid line Q, t = 1766Tetraploid line P, t = 1766
(A) (B)
(D)(C)
(F)(E)

0.2
0.4
0.6
0.8
1.2
1.4
1.0
Rat
io o
f G
ene
Cop
y N
umbe
r
0.2
0.4
0.6
0.8
1.2
1.4
1.0
0.2
0.4
0.6
0.8
1.2
1.4
1.0
1 2 3 4 5 6 7 8 9 10 11 12 13 14 15 16
Chromosome Chromosome
1 2 3 4 5 6 7 8 9 10 11 12 13 14 15 16
Array 10 Array 11 Array 14
Array 13 Array 15
Array 26
Array 16
Array 7
Array 27
ì3
î9?
ì13? ì14?
ì2? ì4?
Tetraploid salt line ps, t = 1766
Tetraploid line P, t = 1766 Tetraploid salt line qs, t = 1766
Tetraploid line Q, t = 1766
Tetraploid salt line ss, t = 1766
Tetraploid line S, t = 1766
Tetraploid salt line rs, t = 1766
Tetraploid line S, t = 1766
Tetraploid salt line ts, t = 1766
Tetraploid line T, t = 1766 Tetraploid salt line ts, t = 1766 Tetraploid salt line ps, t = 1766
(A) (B)
(D) (C)
(F) (E)
î10?
(C) Array 3
i
* *
*
Chromosome
1 2 3 4 5 6 7 8 9 10 11 12 13 14 15 16
Chromosome
1 2 3 4 56 7 8 9 10 11 12 13 14 15 16
Tetraploid salt line ps, t = 1766 vs. Tetraploid t = 0
(F) Array 6Tetraploid salt line qs, t = 1766 vs. Tetraploid t = 0
(D) Array 4Tetraploid salt line ps, t = 1766 vs. Tetraploid t = 0
(G) Array 7Tetraploid salt line ps, t = 1766 vs. Tetraploid line P, t = 1766
(H) Array 8Tetraploid t = 0 vs. Tetraploid line P, t = 1766
(A) Array 1Diploid t = 0 vs. Diploid t = 0
(B) Array 2Tetraploid line P, t = 1766 vs. Tetraploid t = 0
(E) Array 5Tetraploid line P, t = 1766 vs. Tetraploid t = 0
0.5
1
1.5
2
0.5
1
1.5
2
0.5
1
1.5
2
0.5
1
1.5
2
Fluo
resc
ence
Rat
io in
Slid
ing
Win
dow
of
10 G
enes

*
*
*
(K) Array 11
Chromosome
1 2 3 4 56 7 8 9 1011 12 13 14 15 16
Chromosome
1 2 3 4 56 7 8 9 1011 12 13 14 15 16
Tetraploid salt line qs, t = 1766 vs.Tetraploid line Q, t = 1766
(N) Array 14Tetraploid salt line qs, t = 1766 vs.Tetraploid line Q, t = 1766
(L) Array 12Tetraploid salt line qs, t = 1766 vs. Haploid t = 0
(O) Array 15Tetraploid salt line R, t = 1766 vs.Tetraploid line rs, t = 1766
(P) Array 16Tetraploid salt line ss, t = 1766 vs.Tetraploid line S, t = 1766
(I) Array 9Tetraploid line Q, t = 1766 vs. Tetraploid t = 0
(J) Array 10Tetraploid salt line qs, t = 1766 vs.Tetraploid line Q, t = 1766
(M) Array 13Tetraploid salt line rs, t = 1766 vs.Tetraploid line R, t = 1766
i
0.5
1
1.5
2
0.5
1
1.5
2
0.5
1
1.5
2
0.5
1
1.5
2
ii
ii
iii
iii
ii
i
Fluo
resc
ence
Rat
io in
Slid
ing
Win
dow
of
10 G
enes
(S) Array 20
Chromosome
1 2 3 4 56 7 8 9 1011 12 13 14 15 16
Chromosome
1 2 3 4 56 7 8 9 1011 12 13 14 15 16
Tetraploid salt line ss, t = 1766 vs.Tetraploid line T, t = 1766
(V) Array 23Diploid t = 0 vs. Diploid t = 0
(T) Array 21Tetraploid salt line ps, t = 186 vs. Tetraploid salt line ps, t = 93
(W) Array 24Tetraploid t = 0 vs. Diploid t = 0
(X) Array 25Tetraploid salt line ts, t = 1766 vs.Tetraploid line T, t = 1766
(Q) Array 18Tetraploid line R, t = 1766 vs. Tetraploid t = 0
(R) Array 19Tetraploid line S, t = 1766 vs. Tetraploid t = 0
(U) Array 22Tetraploid salt line ps, t = 93 vs. Tetraploid t = 0
0.5
1
1.5
2
0.5
1
1.5
2
0.5
1
1.5
2
0.5
1
1.5
2
ii
Fluo
resc
ence
Rat
io in
Slid
ing
Win
dow
of
10 G
enes
Chromosome
1 2 3 4 56 7 8 9 1011 12 13 14 15 16
(Y) Array 27Tetraploid salt line ts, t = 1766 vs. Tetraploid salt line ps, t = 1766
0.5
1
1.5
2
Fluo
resc
ence
Rat
io in
Slid
ing
Win
dow
of
10 G
enes

●
●
●● ●
●
●
●
●
●
●
●● ●
●
LineB1 B2 B3 B4 B5 B6 B7 B8 B9 B10 S1 S2 S3 S4 S5
0
100
200
300
●
●
●
●
●
●●
●
●
●
●●
●
●●
●
●
●
●
●●
●
●
●
●
●●
●●
●
●
●
●
●
●
●●
●
●
●
●
●
●
●
●
●
●
● ●
●
● ●
●
●●
●●
●
●●
4N
2N
p−value = 0.0003
Gen
ome
Size
(FL1
Inte
nsity
)