Genomic collinearity and the genetic architecture of floral
8
ORIGINAL ARTICLE Genomic collinearity and the genetic architecture of floral differences between the homoploid hybrid species Iris nelsonii and one of its progenitors, Iris hexagona SJ Taylor, LD Rojas, SW Ho and NH Martin Hybrid speciation represents a relatively rapid form of diversification. Early models of homoploid hybrid speciation suggested that reproductive isolation between the hybrid species and progenitors primarily resulted from karyotypic differences between the species. However, genic incompatibilities and ecological divergence may also be responsible for isolation. Iris nelsonii is an example of a homoploid hybrid species that is likely isolated from its progenitors primarily by strong prezygotic isolation, including habitat divergence, floral isolation and post-pollination prezygotic barriers. Here, we used linkage mapping and quantitative trait locus (QTL) mapping approaches to investigate genomic collinearity and the genetic architecture of floral differences between I. nelsonii and one of its progenitor species I. hexagona. The linkage map produced from this cross is highly collinear with another linkage map produced between I. fulva and I. brevicaulis (the two other species shown to have contributed to the genomic makeup of I. nelsonii), suggesting that karyotypic differences do not contribute substantially to isolation in this homoploid hybrid species. Similar to other studies of the genetic architecture of floral characteristics, at least one QTL was found that explained 420% variance in each color trait, while minor QTLs were detected for each morphological trait. These QTLs will serve as hypotheses for regions under selection by pollinators. Heredity (2013) 110, 63–70; doi:10.1038/hdy.2012.62; published online 10 October 2012 Keywords: homoploid hybrid speciation; QTL mapping; floral isolation INTRODUCTION The evolution of new, reproductively isolated species usually involves the gradual accumulation of multiple prezygotic and postzygotic reproductive isolating barriers over time (Coyne and Orr, 1989, 1997; Moyle et al., 2004; Malone and Fontenot, 2008; Scopece et al., 2008). An exception to this is hybrid speciation, where reproductive isolation can evolve quite quickly (James and Abbott, 2005; Mallett, 2007; Buerkle and Rieseberg, 2008). Most commonly, reproductive isolation between a hybrid species and its progenitors results from postzygotic isolation caused primarily by a change in ploidy (polyploid specia- tion), although a growing number of hybrid species are being detected that are reproductively isolated from their progenitor species without an increase in ploidy (homoploid hybrid species; reviewed by Rieseberg and Willis, 2007). Reproductive isolation between new homoploid hybrid species and their progenitors may result from the rapid fixation of chromosomal rearrangements and/or genic incompatibilities in addition to ecolo- gical divergence between the hybrid taxa and their parental species (Grant, 1971; Buerkle et al., 2000, Buerkle and Rieseberg, 2008). A majority of homoploid hybrid species described to date have a mosaic genome (mosaic genome hybrid speciation; Jiggins et al., 2008), where genomic differences are sorted in the hybrid genome through both fertility and ecological selection (Karrenberg et al., 2007). In the most well studied of these systems, chromosomal rearrangements have a substantial role in strong postzygotic isolation between several independently derived homoploid hybrid sunflower species and their progenitors (Rieseberg et al., 1995; Rieseberg, 2000; Lai et al., 2005), as was predicted in earlier verbal models of homoploid hybrid speciation (Grant, 1971). Strong reproductive isolation between the homoploid hybrid species and the progenitors may also result primarily from genic differences and ecological divergence (Jiggins et al., 2008). In a few identified homoploid hybrid species (for example, Heliconius butter- flies), the introgression of relatively few traits that confer an ecological advantage may be sufficient to cause reproductive (mainly ecological) isolation (hybrid trait speciation; Jiggins et al., 2008; Salazar et al., 2010). Such systems present an opportunity to investigate alternative models of hybrid speciation, especially ones in which genic incom- patibilities and ecological isolation are of primary importance in reproductive isolation. One of the ‘classic examples’ (Coyne and Orr, 2004) of homoploid hybrid speciation is that of the Louisiana Iris species I. nelsonii. Randolph (1966) first described this new species and hypothesized a homoploid hybrid origin based on cytological (Randolph et al., 1961) and morphological data (Randolph, 1966). Randolph (1966) sug- gested that I. nelsonii was derived from hybridization between two widespread species of Louisiana Iris (I. fulva and I. hexagona) and possibly a third widespread species (I. brevicaulis). These three species are all found in southern Louisiana but occupy slightly different habitats and display divergent floral phenotypes. I. fulva flowers are relatively small in size, have a copper red color and have reflexed sepals. The larger I. brevicaulis and I. hexagona flowers are blue, with Department of Biology, Texas State University-San Marcos, San Marcos, TX, USA Correspondence: SJ Taylor, Department of Biology, Texas State University-San Marcos, 601 University Drive, San Marcos, TX 78666, USA. E-mail: [email protected] Received 5 March 2012; revised 10 July 2012; accepted 6 August 2012; published online 10 October 2012 Heredity (2013) 110, 63–70 & 2013 Macmillan Publishers Limited All rights reserved 0018-067X/13 www.nature.com/hdy
Transcript of Genomic collinearity and the genetic architecture of floral
ORIGINAL ARTICLE
Genomic collinearity and the genetic architecture of floraldifferences between the homoploid hybrid speciesIris nelsonii and one of its progenitors, Iris hexagona
SJ Taylor, LD Rojas, SW Ho and NH Martin
Hybrid speciation represents a relatively rapid form of diversification. Early models of homoploid hybrid speciation suggestedthat reproductive isolation between the hybrid species and progenitors primarily resulted from karyotypic differences betweenthe species. However, genic incompatibilities and ecological divergence may also be responsible for isolation. Iris nelsonii isan example of a homoploid hybrid species that is likely isolated from its progenitors primarily by strong prezygotic isolation,including habitat divergence, floral isolation and post-pollination prezygotic barriers. Here, we used linkage mapping andquantitative trait locus (QTL) mapping approaches to investigate genomic collinearity and the genetic architecture of floraldifferences between I. nelsonii and one of its progenitor species I. hexagona. The linkage map produced from this cross ishighly collinear with another linkage map produced between I. fulva and I. brevicaulis (the two other species shown to havecontributed to the genomic makeup of I. nelsonii), suggesting that karyotypic differences do not contribute substantially toisolation in this homoploid hybrid species. Similar to other studies of the genetic architecture of floral characteristics, at leastone QTL was found that explained 420% variance in each color trait, while minor QTLs were detected for each morphologicaltrait. These QTLs will serve as hypotheses for regions under selection by pollinators.Heredity (2013) 110, 63–70; doi:10.1038/hdy.2012.62; published online 10 October 2012
Keywords: homoploid hybrid speciation; QTL mapping; floral isolation
INTRODUCTION
The evolution of new, reproductively isolated species usually involvesthe gradual accumulation of multiple prezygotic and postzygoticreproductive isolating barriers over time (Coyne and Orr, 1989, 1997;Moyle et al., 2004; Malone and Fontenot, 2008; Scopece et al., 2008).An exception to this is hybrid speciation, where reproductive isolationcan evolve quite quickly (James and Abbott, 2005; Mallett, 2007;Buerkle and Rieseberg, 2008). Most commonly, reproductive isolationbetween a hybrid species and its progenitors results from postzygoticisolation caused primarily by a change in ploidy (polyploid specia-tion), although a growing number of hybrid species are being detectedthat are reproductively isolated from their progenitor species withoutan increase in ploidy (homoploid hybrid species; reviewed byRieseberg and Willis, 2007).
Reproductive isolation between new homoploid hybrid species andtheir progenitors may result from the rapid fixation of chromosomalrearrangements and/or genic incompatibilities in addition to ecolo-gical divergence between the hybrid taxa and their parental species(Grant, 1971; Buerkle et al., 2000, Buerkle and Rieseberg, 2008).A majority of homoploid hybrid species described to date have amosaic genome (mosaic genome hybrid speciation; Jiggins et al.,2008), where genomic differences are sorted in the hybrid genomethrough both fertility and ecological selection (Karrenberg et al.,2007). In the most well studied of these systems, chromosomalrearrangements have a substantial role in strong postzygotic isolationbetween several independently derived homoploid hybrid sunflower
species and their progenitors (Rieseberg et al., 1995; Rieseberg, 2000;Lai et al., 2005), as was predicted in earlier verbal models ofhomoploid hybrid speciation (Grant, 1971).
Strong reproductive isolation between the homoploid hybridspecies and the progenitors may also result primarily from genicdifferences and ecological divergence (Jiggins et al., 2008). In a fewidentified homoploid hybrid species (for example, Heliconius butter-flies), the introgression of relatively few traits that confer an ecologicaladvantage may be sufficient to cause reproductive (mainly ecological)isolation (hybrid trait speciation; Jiggins et al., 2008; Salazar et al.,2010). Such systems present an opportunity to investigate alternativemodels of hybrid speciation, especially ones in which genic incom-patibilities and ecological isolation are of primary importance inreproductive isolation.
One of the ‘classic examples’ (Coyne and Orr, 2004) of homoploidhybrid speciation is that of the Louisiana Iris species I. nelsonii.Randolph (1966) first described this new species and hypothesized ahomoploid hybrid origin based on cytological (Randolph et al., 1961)and morphological data (Randolph, 1966). Randolph (1966) sug-gested that I. nelsonii was derived from hybridization between twowidespread species of Louisiana Iris (I. fulva and I. hexagona) andpossibly a third widespread species (I. brevicaulis). These three speciesare all found in southern Louisiana but occupy slightly differenthabitats and display divergent floral phenotypes. I. fulva flowers arerelatively small in size, have a copper red color and have reflexedsepals. The larger I. brevicaulis and I. hexagona flowers are blue, with
Department of Biology, Texas State University-San Marcos, San Marcos, TX, USACorrespondence: SJ Taylor, Department of Biology, Texas State University-San Marcos, 601 University Drive, San Marcos, TX 78666, USA.E-mail: [email protected]
Received 5 March 2012; revised 10 July 2012; accepted 6 August 2012; published online 10 October 2012
Heredity (2013) 110, 63–70& 2013 Macmillan Publishers Limited All rights reserved 0018-067X/13
www.nature.com/hdy

prominent nectar guides and stiff sepals. I. nelsonii flowers are darkred in color and morphologically intermediate between I. fulva andI. hexagona for some traits, while extreme to the means of thepurported progenitors for others (Randolph, 1966). The hybrid originof I. nelsonii was later confirmed with allozyme (Arnold et al., 1990)and nuclear (Arnold, 1993) data that suggested that a majority of theI. nelsonii genome was derived from I. fulva with contributions of locifrom I. hexagona and I. brevicaulis.
When Randolph (1966) initially described I. nelsonii, he proposedecological isolation as a major barrier to gene flow between I. nelsoniiand the progenitors. Indeed, I. nelsonii is endemic to interconnectedswamp systems in southern Louisiana and responds differently thanits progenitors to abiotic habitat conditions (Taylor et al., 2011). Inportions of its limited range, I. nelsonii is sympatric with one of itsprogenitors, I. hexagona. These two species occupy similar swamphabitats and respond to abiotic habitat characteristics differently thanthe other species of Louisiana Iris (Taylor et al., 2011). However,I. nelsonii is often found in understory habitats, while I. hexagona isfound in more open habitats and seems to be limited by shade(Bennett and Grace, 1990). Additionally, as reflected by their suites offloral characters, these species are pollinated by different suites ofpollinators. The large blue flowers of I. hexagona are primarily visitedby bumblebees (Emms and Arnold, 2000), while the large red flowersof I. nelsonii are primarily visited by ruby-throated hummingbirds(Taylor et al., 2012). Pollinator isolation, thus, has the potential to bean extremely important ecological barrier to hybridization betweenI. nelsonii and one of its progenitors, I. hexagona.
This classic example of homoploid hybrid speciation representsan opportunity to investigate hybrid speciation where postzygoticisolation is potentially minimal between the hybrid species andprogenitors and, instead, prezygotic isolation—especially ecologicalisolation—is responsible for inhibiting gene flow in the system. Here,we utilize a comparative mapping approach to investigate genomiccollinearity between I. nelsonii and its progenitors, noting thatincreased collinearity should be consistent with the high first-generation hybrid fertility observed between these species. Addition-ally, we investigate the genetic architecture of floral differencesbetween I. nelsonii and I. hexagona to identify loci potentially underselection by pollinators and responsible for ecological isolationbetween these taxa.
MATERIALS AND METHODSMapping PopulationIn order to produce the mapping population used herein, pollen of a wild-
collected I. nelsonii individual (In10—collected from Vermillion Parish, LA,
USA) was dusted onto the stigmatic surface of a wild-collected I. hexagona
individual (IhA32—collected from St Martin Parish, LA, USA) to produce F1
hybrid offspring. Flowers from a single F1 hybrid were self-pollinated to
produce the F2 hybrid mapping population, and ultimately several hundred F2
hybrid seeds were produced. The F2 seeds were planted at the University of
Georgia greenhouse and monitored for germination success. Successfully
germinated seeds were transplanted into six-inch Azalea pots, and repotted
into 8-inch Azalea pots. All F2, F1, and pure-species plants were transported to
the Texas State University greenhouse in 2007 where they have been
maintained and transplanted annually into new 10-inch Azalea pots until
the present. In all, 281F2 plants were used in the genetic map construction
described herein.
Map constructionDNA was extracted from IhA32, In10, the F1 and the 281 F2 plants using a
modified cetyltrimethyl ammonium bromide DNA extraction protocol. A total
of 282 microsatellite primers (developed by Tang et al. (2009) for I. fulva and
I. brevicaulis map production) were screened for utility in the I. nelsonii�I. hexagona F2 mapping population. Of those, 137 markers were both
polymorphic and reliably scored in the mapping population. The marker
names reported here are the same as those reported for linkage maps
previously constructed using I. brevicaulis� I. fulva reciprocal backcross
populations (Tang et al., 2010). PCR reactions (modified from Tang et al.,
2009) were performed in 10ml reaction volumes that included 1x PCR buffer,
2.5 mM MgCl2, 0.3 mM of each deoxyribonucleotide triphosphate, 4 pmol fluo-
rescently labeled forward primer (either 6-FAM/HEX/TAMRA dye), 4 pmol
reverse primer, 0.5 units GoTaq Flexi DNA Polymerase (Promega Corporation,
Madison, WI, USA), and B10 ng of genomic DNA. Loci were amplified using
touchdown PCR (Don et al., 1991) to minimize nonspecific amplification.
Thermocycling conditions were as follows: initial denaturation was at 94 1C for
1 minute followed by six cycles of: 94 1C for 30 s, 64 1C (decreasing in 1 1C
increments each cycle to 58 1C) for 30 s, 72 1C for 30 s, then 33 cycles of: 94 1C
for 20 s, 58 oC for 20 s, 72 1C for 30 s with a final extension period of 72 1C for
15 min (Tang et al., 2009). Fragments were multiplexed when possible (when
fluorescent labels and/or allele sizes allowed for multiplexing) and run on an
ABI 3700xl capillary sequencer (Applied Biosystems, Foster City, CA, USA) at
the Georgia Genomics Facility and scored by eye in Peakscanner v.1.0 (Applied
Biosystems) and GeneMarker v.1.8 (Softgenetics LLC, State College, PA, USA).
Linkage groups were generated in both TMAP (Cartwright et al., 2007) and
MAPMAKER 3.0 (Lander et al., 1987; Lincoln et al., 1992) with LODX8 and
a maximum distance of 40 cM. Marker order was determined in TMAP
(Cartwright et al., 2007). Initially unlinked markers were added to the existing
linkage groups at a maximum distance of 45 cM and LODX3 using the ‘near’
command in MAPMAKER 3.0. Total map length was calculated by summing
the lengths of the linkage groups. Average marker spacing and map coverage
was estimated as in Fishman et al. (2001). Genome length was calculated using
two methods. First, the genome length was estimated by adding the length of
an average marker interval to each end of each linkage group and summing the
lengths of the linkage groups. Second, the genome length was estimated as in
method 4 of Chakravarti et al. (1991). Map coverage was calculated separately
for each of these genome length estimates.
Transmission ratio distortionRegions of transmission ratio distortion (TRD) are potentially important for
preventing (or favoring) locus-specific gene flow between I. nelsonii and
I. hexagona when interspecific pollination occurs between the two species.
Deviations from expected Mendelian segregation ratios (1AA:2Aa:1aa) in the
F2 generation were analyzed for each microsatellite marker by w2 analyses
(2 df). For those loci that significantly deviated from 1:2:1 expectations, we
further explored for transmission bias (that is, whether I. nelsonii or
I. hexagona homozygotes were overrepresented at each locus), using w2
analyses (1 df).
Flower color and morphologyMorphological characters potentially responsible for differential pollinator
attraction were measured in the Texas State University greenhouses during the
spring of 2009. The total length of the sepal, the length of the sepal blade and
sepal stalk, width of the sepal and flower stalk height were measured on the
first flower of each plant on the second day when the flower was fully opened.
I. nelsonii and I. hexagona flowers differ in multiple aspects of color, with
I. nelsonii flowers being dark red and I. hexagona flowers being blue. The
concentration of anthocyanin pigments in a single petal of each flower was
estimated based on absorbance (Wilken, 1982). Petals were used instead of
sepals as they do not have nectar guides, and color is relatively uniform
throughout the entirety of the petal. Anthocyanins were extracted from one
pre-weighed petal using acidified methanol (1% w/v HCl in methanol). A
subset of individual samples (including red, blue and hybrid flowers) was
screened between 400 and 800 nm on a Biomate 3 UV–vis spectrophotometer
(Thermo Fisher Scientific, MA, USA). All samples in this subset revealed a
maximum absorbance at 537 nm, so absorbance of the full set of samples was
measured only at 537 nm. Absorbance values were divided by the weight of the
petal to calculate the concentration of anthocyanin pigment (Wilken, 1982).
These species also differ with respect to nectar guide area. I. nelsonii flowers are
Iris interspecific linkage mapSJ Taylor et al
64
Heredity

generally devoid of a nectar guide, while I. hexagona flowers display a
prominent nectar guide on each sepal. The length and width of the nectar
guide of the pure species and F2 plants were both measured in ImageJ
(Rasband, 1997–2011). As Iris nectar guides are roughly triangular, the area of
the nectar guide was calculated as the area of a triangle.
Phenotypic correlations between traits may potentially result from genetic
correlation owing to pleiotropy or tight linkage between genes. Phenotypic
correlations in the F2 mapping population were estimated for all pairwise trait
combinations. The significance of each phenotypic correlation was assessed
after sequentially rejective Bonferroni tests (Holm, 1979).
Quantitative trait locus (QTL) analysesGenomic regions associated with variation in floral characteristics were
detected by composite interval mapping (Zeng, 1994) in Windows QTL
Cartographer version 2.5.10 (Wang et al., 2011) using forward and backward
regression with the programs default settings (2 cM intervals, 10 cM window
size, 5 control markers). A genome-wide significance threshold was set for each
trait after 1000 permutations of the data (Churchill and Doerge, 1994; Doerge
and Churchill, 1996). A drop below the permutation threshold or a change in
the direction of the additive effect was used to distinguish among QTLs on the
same linkage group.
RESULTS
Linkage mapAll except four markers coalesced into the 22 linkage groups (Figure 1).The remaining markers were unlinked at the minimum criteria set forlinking unlinked markers (LODX3, maximum distance 45 cM). Forconvenience, the linkage groups detected in this mapping populationare named to correspond with the linkage groups in Tang et al. (2010).These groups corresponded with 20 of the 21 linkage groups detectedin reciprocal backcross linkage maps developed for the closely relatedI. fulva and I. brevicaulis species (Tang et al., 2010; SupplementalFigure). The linkage map produced by Tang et al. (2010) is denser thanthe current map (average 4.6 cM intervals between markers in Tanget al., 2010 versus the 12.4 cM intervals in this map). The reduceddensity of the current map is attributed to the fact that themicrosatellite markers used in this and the Tang et al. (2010) studywere developed from I. brevicaulis and I. fulva individuals and someof these loci did not amplify in the I. nelsonii� I. hexagona popula-tion or were not variable between the mapping parents (IhA32 andIn10). As this map contains fewer loci than the map produced byTang et al. (2010), including markers necessary to link distal ends ofthe linkage groups, some of the larger linkage groups detected by Tanget al. (2010) were split into the smaller ‘unlinked’ linkage groups bythe mapping programs with this population. Markers from the endsof the linkage groups 1, 2 and 7, respectively, grouped together(Figure 1), yet because of the large recombination distance betweenthe ends of these linkage groups, they did not link together in thecurrent map. As such, the portions of the current linkage groups arelabeled with ‘a’ and ‘b’ in Figure 1. As the markers from the ‘a’ and ‘b’segments are not linked, the orientation of the segments in relation toeach other cannot be determined. The placement of the segments inFigure 1 is one interpretation of the possible placement of thesesegments. No markers from the relatively small linkage group 20 fromTang et al. (2010) were amplified in this F2 population. The sumlength of this I. nelsonii� I. hexagona linkage map was 1379.9 cM,with an average marker spacing of 12.4 cM. The estimated genomelength was calculated two ways, which yielded similar results. Ifcalculated by adding twice the marker interval spacing to each linkagegroup, the genome length was estimated as 1926.9 cM. If calculated asmethod 4 from Chakravarti et al. (1991), the genome length wasestimated as 1948.8 cM. Each estimate of genome length was used
in calculations of genome coverage. Based on these calculations,B74% of the genome is within 10 cM of a marker.
Transmission ratio distortionTRD was observed for approximately one-third of the marker loci(Figure 2). Some markers were difficult to genotype with certainty.These markers were re-coded to reflect that uncertainty, which resultsin a potential loss of genetic information, (for example, for someindividuals, it was difficult to distinguish with certainty amonghomozygotes and heterozygotes for the I. nelsonii allele (to use anexample)—yet it was clear that the individual was not homozygousfor the I. hexagona allele. These individuals were all coded as aseparate category (essentially as ‘not homozygous for I. hexagona’)recognized by the mapping programs). Segregation at these loci wasinvestigated under the simplifying assumption that approximately halfof the re-coded loci were homozygotes and half were heterozygotes. Ifthis investigation resulted in a substantial change in the TRD (andP-value), the marker was designated with a caret (^) on the linkagemap and TRD figures (Figures 1 and 2). No directional bias in TRDwas observed. Of the markers that revealed significant TRD anduncertain genotypes did not affect the interpretation of the results,homozygotes for the I. nelsonii allele were overrepresented for 13markers, while homozygotes for the I. hexagona allele were over-represented in 14 markers. For the remaining markers, heterozygoteswere largely underrepresented (10/13 markers had a heterozygotedeficiency, Figure 2).
Flower color and morphologyA majority of the F2 plants (N¼ 184) flowered during the 2009flowering season. However, only six pure-species I. hexagona and fiveI. nelsonii individuals flowered in the experimental setup during the2009 flowering season. Owing to this reduced sample size of pure-species individuals and lack of information from the mappingparents, QTL effect sizes are only reported as a proportion of thevariance explained in the F2 population. The morphological measure-ments made in the greenhouse (Tables 1 and 2) reflected measurementsmade in natural populations by Randolph (1966), suggesting that thefew pure-species plants that did flower in the greenhouse representtypical samples of the species. The flower stalks of the I. nelsoniiindividuals (m¼ 51.4±12.14 cm) were slightly shorter than those ofI. hexagona (m¼ 64.5±11.77 cm; t¼ 1.6, df¼ 7, P¼ 0.15). One QTLwas detected that explained a small percentage of the variance in theF2 population (proportion of the variance explained¼ 0.09; Figure 1,Table 2). At this QTL, the I. hexagona allele resulted in a decrease inflower stalk height.
In Iris flowers, the sepal subtends the anther and stigma and is thuslikely important in pollinator attraction. The sepal shape of I. nelsoniiand I. hexagona differ in that the sepals of I. nelsonii are reflexed andI. hexagona sepals are upright. As the I. nelsonii sepal is reflexed, thesepal stalk of the I. nelsonii flowers (m¼ 1.84±0.36 cm) is significantlyshorter than that of the I. hexagona flowers (m¼ 3.67±0.45 cm;t¼ 6.6, df¼ 7, P¼ 0.0003). Three QTLs were detected for sepal stalklength. The I. hexagona allele results in an increase in the sepal stalklength at all QTLs detected. The sepal blade of I. nelsonii individuals(m¼ 4.85±0.60 cm) in the greenhouse was also significantly shorterthan the sepal blade of I. hexagona individuals (m¼ 6.25±0.51 cm;t¼ 3.8, df¼ 7, P¼ 0.007). No QTLs were detected for sepal bladelength. The total length of sepals was significantly lower in I. nelsonii(m¼ 6.69±0.29 cm) than in I. hexagona (m¼ 9.92±0.82 cm; t¼ 7.5,df¼ 7, P¼ 0.0001). Three of the four QTLs detected for sepal totallength were in the expected direction, where the I. hexagona allele
Iris interspecific linkage mapSJ Taylor et al
65
Heredity
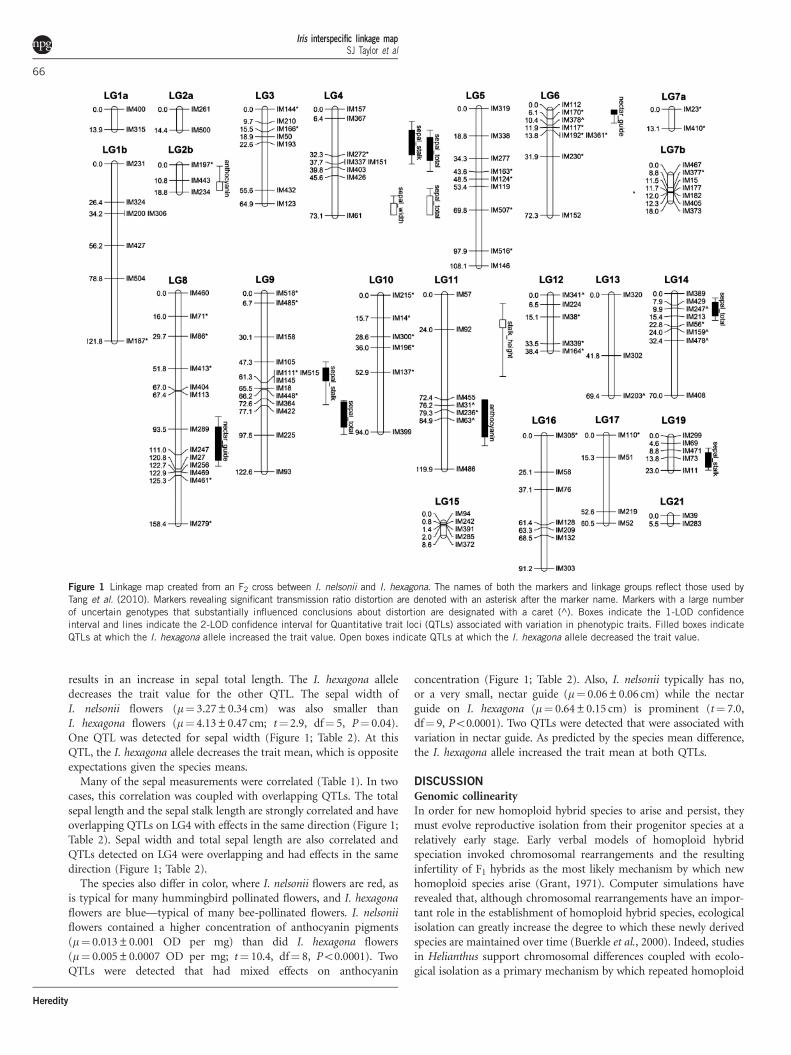
results in an increase in sepal total length. The I. hexagona alleledecreases the trait value for the other QTL. The sepal width ofI. nelsonii flowers (m¼ 3.27±0.34 cm) was also smaller thanI. hexagona flowers (m¼ 4.13±0.47 cm; t¼ 2.9, df¼ 5, P¼ 0.04).One QTL was detected for sepal width (Figure 1; Table 2). At thisQTL, the I. hexagona allele decreases the trait mean, which is oppositeexpectations given the species means.
Many of the sepal measurements were correlated (Table 1). In twocases, this correlation was coupled with overlapping QTLs. The totalsepal length and the sepal stalk length are strongly correlated and haveoverlapping QTLs on LG4 with effects in the same direction (Figure 1;Table 2). Sepal width and total sepal length are also correlated andQTLs detected on LG4 were overlapping and had effects in the samedirection (Figure 1; Table 2).
The species also differ in color, where I. nelsonii flowers are red, asis typical for many hummingbird pollinated flowers, and I. hexagonaflowers are blue—typical of many bee-pollinated flowers. I. nelsoniiflowers contained a higher concentration of anthocyanin pigments(m¼ 0.013±0.001 OD per mg) than did I. hexagona flowers(m¼ 0.005±0.0007 OD per mg; t¼ 10.4, df¼ 8, Po0.0001). TwoQTLs were detected that had mixed effects on anthocyanin
concentration (Figure 1; Table 2). Also, I. nelsonii typically has no,or a very small, nectar guide (m¼ 0.06±0.06 cm) while the nectarguide on I. hexagona (m¼ 0.64±0.15 cm) is prominent (t¼ 7.0,df¼ 9, Po0.0001). Two QTLs were detected that were associated withvariation in nectar guide. As predicted by the species mean difference,the I. hexagona allele increased the trait mean at both QTLs.
DISCUSSION
Genomic collinearityIn order for new homoploid hybrid species to arise and persist, theymust evolve reproductive isolation from their progenitor species at arelatively early stage. Early verbal models of homoploid hybridspeciation invoked chromosomal rearrangements and the resultinginfertility of F1 hybrids as the most likely mechanism by which newhomoploid species arise (Grant, 1971). Computer simulations haverevealed that, although chromosomal rearrangements have an impor-tant role in the establishment of homoploid hybrid species, ecologicalisolation can greatly increase the degree to which these newly derivedspecies are maintained over time (Buerkle et al., 2000). Indeed, studiesin Helianthus support chromosomal differences coupled with ecolo-gical isolation as a primary mechanism by which repeated homoploid
Figure 1 Linkage map created from an F2 cross between I. nelsonii and I. hexagona. The names of both the markers and linkage groups reflect those used by
Tang et al. (2010). Markers revealing significant transmission ratio distortion are denoted with an asterisk after the marker name. Markers with a large number
of uncertain genotypes that substantially influenced conclusions about distortion are designated with a caret (^). Boxes indicate the 1-LOD confidenceinterval and lines indicate the 2-LOD confidence interval for Quantitative trait loci (QTLs) associated with variation in phenotypic traits. Filled boxes indicate
QTLs at which the I. hexagona allele increased the trait value. Open boxes indicate QTLs at which the I. hexagona allele decreased the trait value.
Iris interspecific linkage mapSJ Taylor et al
66
Heredity

hybrid species have arisen (Rieseberg et al., 1995, 2003; Lai et al., 2005).However, hybrid speciation may also be achieved without chromo-somal rearrangements if genic incompatibilities and/or ecologicaldivergence isolate the hybrid species from its progenitors (Templeton,1981; Jiggins et al., 2008). The relative importance of karyotypicdifferences versus genic incompatibilities is not known because thereare relatively few studies specifically examining the genomic colli-nearity of homoploid hybrid species and their progenitors (but seeRieseberg et al., 1995; Lai et al., 2005). While studies in Helianthussupport chromosomal differences as a largely important barrier to
gene flow (Rieseberg et al., 1995; Lai et al., 2005), a recent study inCottus (Stemshorn et al., 2011) and the current study reveal highdegrees of genomic collinearity between the homoploid hybrid lineageand the progenitors, suggesting that other mechanisms are potentiallyresponsible for reproductive isolation between the hybrid lineage andprogenitors.
The genomes of all four hybridizing Louisiana Iris species show ahigh degree of genetic collinearity. Although I. hexagona has adifferent chromosome number than the other three species, inter-specific linkage maps between the species reveal little evidence of
LG 1.a LG 2.a LG 2.b LG 3LG 1.b
LG 4 LG 5 LG 6 LG 7.a LG 7.b
LG 8 LG 9 LG 10
LG 11 LG 12 LG 13 LG 14
LG 15 LG 16 LG 17 LG 19 LG 21
Homozygous Iris nelsonii
Homozygous Iris hexagona
Heterozygotes
Figure 2 Observed genotype frequencies of homozygous I. nelsonii (squares), homozygous I. hexagona (circles) and heterozygotes (triangles). The X-axis
denotes the distances (cM) along each linkage group. Lines at 0.25 and 0.5 represent Mendelian expected frequencies for homozygotes and heterozygotes,
respectively. Markers that deviated from these expectations (Po0.05) are designated with an asterisk (*). Genotype frequencies of markers designated with
a caret (^) are not represented because these markers had a large number of undistinguishable genotypes.
Iris interspecific linkage mapSJ Taylor et al
67
Heredity

major chromosomal rearrangements between it and the other threeLouisiana Iris species (Tang et al., 2010; E. Ballerini et al.,unpublished data). The markers in the current study grouped asin maps produced by Tang et al. (2010), and updated by E. Balleriniet al., unpublished data), from crosses between I. brevicaulis andI. fulva, with few exceptions. Marker IM192 is the terminal markerof LG 6 in the I. brevicaulis� I. fulva map, but is 13.8 cM from thetop in the current map. Also, on LG9, marker spacing in the currentmap is greater than marker spacing in Tang et al. (2010) and markerIM364 is the terminal marker of LG 9 in Tang et al. (2010) but inthe middle (72.6 cM) of LG 9 in the current map (Figure 1;Supplementary Figure). Future mapping studies in a cross betweenI. nelsonii and I. fulva and between I. hexagona and I. fulva willallow us to identify the specific order of markers within each of thespecies. However, the high degree of genetic collinearity observedbetween these interspecific maps, combined with the fact that F1
hybrids do not reveal substantial reductions in pollen fertility(I. fulva� I. nelsonii, I. nelsonii� I. fulva, and I. nelsonii�I. hexagona preliminary data shows F1 fertility is B85% that ofpure species fertility) imply that major chromosomal rearrange-ments are not effecting a high degree of postzygotic isolation,lending support to Randolph’s (1966) hypothesis of ecologicalisolation being primarily responsible for the origin and mainte-nance of I. nelsonii in its unique cypress swamp habitat.
Transmission ratio distortionNon-Mendelian transmission of alleles is routinely reported across awide variety of interspecific and intraspecific crosses and across a widevariety of taxa (Fishman et al., 2001; Bouck et al., 2005; Hall andWillis, 2005; Tang et al., 2010; Casellas et al., 2012; Koevoets et al.,2012). TRD may result from any number of post-pollinationprezygotic (for example Fishman et al., 2008), or postzygotic (priorto genotyping) biological processes. Our crossing design could haveresulted in some amount of inbreeding depression, as the originalparents were wild-collected and they could have been harboringsome deleterious alleles in heterozygous form. This could resultin an underrepresentation of parental genotypes linked to thosedeleterious alleles or an overrepresentation of heterozygotes. Assuch, the TRD observed for loci in which either I. nelsonii orI. hexagona homozygotes are underrepresented could be caused bypost-pollination barriers and/or postzygotic processes (includinginbreeding depression).
However, for the 13 markers in which TRD was found and theparental genotypes were roughly equal, ten markers revealed hetero-zygote deficiencies. This pattern cannot be explained by inbreedingdepression, and suggests selection against heterozygote individuals atthose loci. In reciprocal backcross linkage mapping populationsproduced between I. fulva and I. brevicaulis and germinated, and grownas seedlings in the same greenhouse as the I. nelsonii� I. hexagona
Table 1 Spearman’s correlation coefficients for tests of pairwise phenotypic correlations
Stalk height 170
Sepal stalk 0.05 176
Sepal blade 0.08 0.34 174
Sepal total 0.06 0.66 0.92 176
Sepal width 0.11 0.13 0.49 0.43 175
Nectar guide 0.06 0.15 0.23 0.25 0.24 168
Anthocyanin �0.17 �0.18 �0.23 �0.27 �0.35 �0.02 115
Stalk height Sepal stalk Sepal blade Sepal total Sepal width Nectar guide Anthocyanin
Coefficients in bold are significant after a sequentially rejective Bonferroni test. Italicized coefficients were significant before, but not after, correction with the sequentially rejective Bonferroni test.Sample size for each trait is given in the diagonal.
Table 2 F2 means, sample sizes, and QTL associated with variation in floral characteristics in Iris nelsonii� I. hexagona F2 hybrids
Trait N F2 mean (s.d.) Linkage
group
Location (cM) Proportion of the
variance explained
Additive
effect
Dominance
effect
Stalk height (cm) 170 87.63 (13.96) LG14 21.4 (6.0–56.4) 0.09 �3.228 7.414
Sepal stalk (cm) 176 3.14 (34) LG4 21.4 (8.4–37.7) 0.16 0.183 0.013
Sepal stalk (cm) 176 3.14 (34) LG9 56.3 (47.3–76.6) 0.10 0.130 0.114
Sepal stalk (cm) 176 3.14 (34) LG19 13.8 (7.6–22.8) 0.09 0.136 0.052
Sepal blade (cm) 174 5.81 (59) no QTL detected
Sepal total (cm) 176 8.95 (77) LG4 28.4 (14.4–42.8) 0.12 0.367 0.042
Sepal total (cm) 176 8.95 (77) LG4 72.6 (54.6–72.6) 0.09 �0.338 �0.033
Sepal total (cm) 176 8.95 (77) LG9 83.1 (73.6–97.1) 0.10 0.303 0.178
Sepal total (cm) 176 8.95 (77) LG14 0.0991 (0.03–18) 0.14 0.389 �0.279
Sepal width (cm) 175 4.32 (39) LG4 72.6 (59.6–72.6) 0.12 �0.189 �0.075
Nectar guide area (cm2) 168 0.61 (47) LG6 0 (0–9.1) 0.14 0.245 �0.049
Nectar guide area (cm2) 168 0.61 (47) LG11 104.9 (84.9–118.9) 0.21 0.307 0.046
Anthocyanin (OD per mg) 115 0.011 (0026) LG2B 17.8 (1–17.8) 0.13 �0.001 �0.001
Anthocyanin (OD per mg) 115 0.011 (0026) LG11 82.3 (72.4–103.9) 0.24 0.002 0.001
The location of the highest likelihood ratio is given with 2-logarithm of odds confidence intervals in parentheses. The magnitude of QTL effect is reported as the proportion of the varianceexplained in the mapping population. Additive and dominance effects are in units of the trait.
Iris interspecific linkage mapSJ Taylor et al
68
Heredity

mapping population roughly one-third of the markers revealedsignificant TRD (Bouck et al., 2005; Tang et al., 2010). In those samemaps, TRD was largely asymmetric, in that I. fulva alleles wereoverrepresented in each genetic background (Tang et al., 2010).Indeed, introgression in natural hybrid populations between thesespecies often shows a pattern of asymmetric introgression of I. fulvaalleles across species boundaries (Arnold and Martin, 2010). However,markers in the current F2 mapping population showed no suchasymmetries.
Genetic architecture of floral characteristicsEcological divergence is important in reducing gene flow between thehomoploid hybrid lineage and its progenitors (Buerkle et al., 2000;Gross and Rieseberg, 2005). I. nelsonii is likely isolated from at leasttwo of its progenitors (I. hexagona and I. brevicaulis) by pollinatorisolation and differs from all of its progenitors in its unique suite offloral characteristics (Randolph, 1966). As a result of these highlydivergent floral morphologies, I. nelsonii and I. hexagona are primarilyvisited by different pollinator groups. I. hexagona is primarilypollinated by bumblebees (Emms and Arnold, 2000) while I. nelsoniiis primarily pollinated by hummingbirds (Taylor et al., 2012).
The unique floral morphology of I. nelsonii is likely due toinheritance of a mixture of loci from the progenitor species. As such,I. nelsonii shares some floral characteristics with I. fulva and otherswith I. hexagona, but it also has characteristics that are outside of themeans of the other species (Randolph, 1966). Here, we used QTLmapping to identify loci that differentiate I. nelsonii from one of itsprogenitor species, I. hexagona. These loci serve as hypotheses for lociunder selection during the formation of I. nelsonii. These loci are alsolikely responsible for maintaining species barriers via pollinatorisolation where these species occur in sympatry. Divergent floralmorphologies may directly cause reduced interspecific visitationbetween these two taxa as has been observed between I. fulva andI. brevicaulis (Martin et al., 2008) and between I. fulva and I. hexagona(Emms and Arnold, 2000).
QTL mapping studies have often found genomic regions thatinfluence variation in multiple floral traits (for example, Juenger et al.,2000; Fishman et al., 2002; Goodwillie et al., 2006; Bouck et al., 2007).Pleitropy or tight linkage of QTLs that influence floral traits mayconstrain floral evolution in a hybrid zone. We detected somecolocalization of QTLs for traits in this mapping population. QTLsfor sepal traits colocalized on LG4 and LG9. These overlapping QTLsinfluenced traits for which we detected positive phenotypic correla-tions (Table 1). Although the remainder of the significant phenotypiccorrelations is not explained by colocalized QTLs in this map, wecaution that many QTLs, especially those of small effect, may remainundetected due to small sample size, as at least half of the phenotypicvariance in the F2 population remains unexplained for all traits.
The genetic architecture of floral characteristics in this system issimilar to studies examining the genetic architecture of floralcharacteristics in other species. Here, we detected two QTLs foranthocyanin concentration that together explained a large portion ofthe variance in the F2 population (total B37%; Table 2). While QTLmapping studies, especially those with limited sample sizes, may tendto overestimate effect sizes (Beavis, 1998), a number of other studiesthat have quantified flower color in mapping populations havegenerally detected few loci of large effect on the trait as well (forexample, Bradshaw et al., 1995; Bouck et al., 2007; reviewed in Galliotet al., 2006). We also detected two QTLs for nectar guide area thatexplained B35% of the variation in the trait (Table 2), which issimilar to the findings of Bouck et al. (2007) in a cross between the
other two Louisiana Iris species (I. brevicaulis and I. fulva). In contrastto floral color differences between species, differences in other aspectsof floral morphology appear to be influenced by a larger number ofminor QTLs (Fishman et al., 2002; Bouck et al., 2007; Kim andRieseberg, 1999; reviewed in Galliot et al., 2006; but see Bradshawet al., 1995). Here, we similarly detected between 0 and 4 QTLs foreach morphological trait, with an average of 0.11±0.03 proportionof the variance explained by each of these loci.
The large effect of the color loci and the relatively small effect of themorphological loci suggest that the color difference between speciesmay be accomplished with relatively few substitutions, while moremutational steps lay between the divergent morphologies of closelyrelated species (reviewed in Galliot et al., 2006). Understanding thegenetic architecture of floral traits and pollinator visitation allows aninvestigation of the loci that are under selection by pollinators (forexample, Bradshaw and Schemske, 2003). The genetic architecture offloral differences and the effect of these differences on pollinatorvisitation have been studied in few systems. In Mimulus and Petunia,mutations with large effect on color (carotenoids and anthocyanins,respectively) also have a large effect on pollinator visitation (Bradshawand Schemske, 2003; Hoballah et al., 2007). In analyses of pollinatorvisitation in experimental arrays of Louisiana Iris, pollinator pre-ference QTLs overlapped with brightness and hue QTLs of relativelysmall effect in a backcross population between Iris fulva andI. brevicaulis (Martin et al., 2008). The current mapping populationhas an advantage over the I. brevicaulis� I. fulva mapping populationfor examining pollinator preferences, because I. nelsonii andI. hexagona have near-identical flowering phenologies. Iris fulva andI. brevicaulis have highly divergent flowering times (the peak floweringtimes of these species are shifted by approximately a month; Martinet al., 2007), which potentially results in experimental arrays that areoffered to the pollinators differing throughout the field season, or the‘training’ of pollinators to prefer certain floral traits over time.
Summary and conclusionsWe have shown that I. nelsonii, a homoploid hybrid, has a genomethat is highly collinear with its progenitor species, which comportswith the relatively high fertility observed when F1 hybrids areproduced between I. nelsonii and its parents. This suggests thatbarriers other than karyotypic rearrangements were largely respon-sible for the early establishment of this species. Indeed, Randolph(1966) posited that ecological barriers were likely important inreducing gene flow between I. nelsonii and its progenitors, andTaylor et al. (2011) have shown that, in fact this hybrid taxonresponds differently to abiotic environmental factors than its parentalspecies. This mapping population and the newly-created mappresented here will enable us to examine the genetic architecture ofecological divergence between I. nelsonii and I. hexagona. Pollinatorisolation is a potentially strong ecological barrier between I. nelsoniiand I. hexagona, and we are now in the position to perform pollinatorarray experiments to examine the genetic architecture of pollinatorisolation between these species, and to determine whether the geneticarchitecture of the floral traits examined here reflects that ofpollinator isolation.
DATA ARCHIVING
Genotype and phenotype data have been deposited at Dryad(doi:10.5061/dryad.6cn04).
CONFLICT OF INTEREST
The authors declare no conflict of interest.
Iris interspecific linkage mapSJ Taylor et al
69
Heredity

ACKNOWLEDGEMENTSWe thank M Arnold for the plant material. M Shaw, M Ramirez, J Matlock and
J Fugette assisted in data collection. Thank you to the Dharmasiri lab at Texas
State University-San Marcos for allowing use of their equipment, and to
M Arnold, C Nice, J Ott, and K Whitney for helpful discussions. We also
thank S Tang for providing map files for creation of the supplemental
comparison map. This work was funded by the National Science Foundation
(DEB-0816905, DEB-0949424 and DGE-0742306).
Arnold ML (1993). Iris nelsonii (Iridaceae): origin and genetic composition of a homoploidhybrid species. Am J Bot 80: 577–583.
Arnold ML, Hamrick JL, Bennett BD (1990). Allozyme variation in Louisiana irises: a testfor introgression and hybrid speciation. Heredity 65: 297–306.
Arnold ML, Martin NH (2010). Hybrid fitness across time and habitats. Trends in Ecologyand Evolution 25: 530–536.
Beavis W (1998). QTL analyses: power, precision, and accuracy. In: Paterson AH (ed)Molecular Dissection of Complex Traits. CRC Press: Boca Raton, pp 145–162.
Bennett BD, Grace JB (1990). Shade tolerance and its effect on the segregation of twospecies of Louisiana Iris and their hybrids. Am J Bot 77: 100–107.
Bouck A, Peeler R, Arnold ML, Wessler SR (2005). Genetic mapping of species boundaries inLouisiana irises using IRRE retrotransposon display markers. Genetics 171: 1289–1303.
Bouck A, Wessler SR, Arnold ML (2007). QTL analysis of floral traits in Louisiana Irishybrids. Evolution 61: 2308–2319.
Bradshaw Jr HD, Schemske DW (2003). Allele substitution at a flower colour locusproduces a pollinator shift I monkeyflowers. Nature 426: 176–178.
Bradshaw Jr HD, Wilbert SM, Otto KG, Schemske DW (1995). Genetic mapping of floral traitsassociated with reproductive isolation in monkeyflowers (Mimulus). Nature 376: 762–765.
Buerkle CA, Morris RJ, Asmussen MA, Rieseberg LH (2000). The likelihood of homoploidhybrid speciation. Heredity 84: 441–451.
Buerkle CA, Rieseberg LH (2008). The rate of genome stabilization in homoploid hybridspecies. Evolution 62: 266–275.
Cartwright DA, Troggio M, Velasco R, Gutin A (2007). Genetic mapping in the presence ofgenotyping errors. Genetics 176: 2521–2527.
Casellas J, Gularte RJ, Farber CR, Varona L, Mehrabian M, Schadt EE et al. (2012). Genomescans for transmission ratio distortion regions in mice. Genetics 191: 247–259.
Chakravarti A, Lasher LK, Reefer JE (1991). A maximum likelihood method for estimatinggenome length using genetic linkage data. Genetics 128: 175–182.
Churchill GA, Doerge RW (1994). Empirical threshold values for quantiatitve traitmapping. Genetics 138: 963–971.
Coyne JA, Orr HA (1989). Patterns of speciation in Drosophila. Evolution 43: 362–381.Coyne JA, Orr HA (1997). ‘Patterns of speciation in Drosophila’ revisited. Evolution 51:
295–303.Coyne JA, Orr HA (2004). Speciation. Sinauer: Sunderland, MA.Doerge RW, Churchill GA (1996). Permutation tests for multiple loci affecting a
quantitative character. Genetics 142: 285–294.Don RH, Cox PT, Wainwright BJ, Baker K, Mattick J (1991). ‘Touchdown’ PCR to
circumvent spurious priming during gene amplification. Nucleic Acids Res 19: 4008.Emms SK, Arnold ML (2000). Site-to-site differences in pollinator visitation patterns in a
Louisiana iris hybrid zone. Oikos 91: 568–578.Fishman L, Aagaard J, Tuthill JC (2008). Toward the evolutionary genomics of gameto-
phytic divergence: patterns of transmission ratio distortion in monkeyflower (Mimulus)hybrids reveal a complex genetic basis for conspecific pollen precedence. Evolution 62:2958–2970.
Fishman L, Kelly AJ, Morgan E, Willis JH (2001). A genetic map in the Mimulus guttatusspecies complex reveals transmission ratio distortion due to heterospecific interactions.Genetics 159: 1701–1716.
Fishman L, Kelly AJ, Willis JH (2002). Minor quantitative trait loci underlie floral traitsassociated with mating system divergence in Mimulus. Evolution 56: 2138–2155.
Galliot C, Stuurman J, Kuhlemeier C (2006). The genetic dissection of floral pollinationsyndromes. Curr Opin Plant Biol 9: 78–82.
Goodwillie C, Ritland C, Ritland K (2006). The genetic basis of floral traits associated withmating system evolution in Leptosiphon (Polemoniaceae): an analysis of quantitativetrait loci. Evolution 60: 491–504.
Grant V (1971). Plant Speciation. Columbia University Press: New York.Gross BL, Rieseberg LH (2005). The ecological genetics of homoploid hybrid speciation.
J Hered 96: 241–252.Hall MC, Willis JH (2005). Transmission ratio distortion in intraspecific hybrids of
Mimulus guttatus. Genetics 170: 375–386.Hoballah ME, Gubitz T, Stuurman J, Broger L, Barone M, Mandel T et al. (2007). Single
gene-mediated shift in pollinator attraction in Petunia. Plant Cell 19: 779–790.
Holm S (1979). A simple sequentially rejective multiple test procedure. Scan J Statist 6:65–70.
James JK, Abbott RJ (2005). Recent, allopatric, homoploid hybrid speciation: the origin ofSenecio squalidus (Asteraceae) in the British Isles from a hybrid zone on Mount Etna,Sicily. Evolution 59: 2533–2547.
Jiggins CD, Salazar C, Linares M, Mavarez J (2008). Hybrid trait speciation and Heliconiusbutterflies. Phil Trans R Soc B 363: 3047–3054.
Juenger T, Purugganan M, Mackay TFC (2000). Quantitative trait loci for floral morphologyin Arabidopsis thaliana. Genetics 156: 1379–1392.
Karrenberg S, Lexer C, Rieseberg L (2007). Reconstructing the history of selection duringhomoploid hybrid speciation. Amer Nat 169: 725–737.
Kim S-C, Rieseberg LH (1999). Genetic architecture of species differences inannual sunflowers: implications for adaptive trait introgression. Genetics 153:965–977.
Koevoets T, Niehuis O, van de Zande L, Beukeboom LW (2012). Hybrid incompatibilitiesin the parasitic wasp genus Nasonia: negative effects of hemizygosity and theidentification of transmission ratio distortion loci. Heredity 108: 302–311.
Lai Z, Nakazoto T, Salmaso M, Burke JM, Tang S, Knap SJ et al. (2005). Extensivechromosomal repatterning and the evolution of sterility barriers in hybrid sunflowerspecies. Genetics 171: 291–303.
Lander ES, Green P, Abrahamson J, Barlow A, Daly MJ, Lincoln SE et al. (1987).MAPMAKER: an interactive computer package for constructing primary genetic linkagemaps of experimental and natural populations. Genomics 1: 174–181.
Lincoln SE, Daly MJ, Lander ES (1992). Constructing Genetic Maps with MAPMAKER/EXP 3.0 Manual. Whitehead Institute: Cambridge, MA.
Mallett J (2007). Hybrid speciation. Nature 446: 279–283.Malone JH, Fontenot BE (2008). Patterns of reproductive isolation in toads. PLoS ONE 3:
e3900.Martin NH, Bouck AC, Arnold ML (2007). The genetic architecture of reproductive
isolation in Louisiana irises: flowering phenology. Genetics 175: 1803–1812.Martin NH, Sapir Y, Arnold ML (2008). The genetic architecture of reproductive isolation
in Louisiana irises: pollination syndromes and pollinator preferences. Evolution 62:740–752.
Moyle LC, Olson MS, Tiffin P (2004). Patterns of reproductive isolation in threeangiosperm genera. Evolution 58: 1195–1208.
Randolph LF (1966). Iris nelsonii, a new species of Louisiana Iris of hybrid origin. Baileya14: 143–169.
Randolph LF, Mitra J, Nelson IS (1961). Cytotaxonomic studies of Louisiana Irises. BotGazette 123: 125–133.
Rasband WS (1997–2011). ImageJ. U. S. National Institutes of Health: Bethesda,Maryland, USA. http://imagej.nih.gov/ij/.
Rieseberg LH (2000). Crossing relationships among ancient and experimental sunflowerhybrid lineges. Evolution 54: 859–865.
Rieseberg LH, Raymond O, Rosenthal DM, Lai Z, Livingstone K, Nakazato T et al. (2003).Major ecological transitions in wild sunflowers facilitated by hybridization. Science301: 1211–1216.
Rieseberg LH, Van Fossen C, Desrochers AM (1995). Hybrid speciation accompanied bygenomic reorganization in wild sunflowers. Nature 375: 313–316.
Rieseberg LH, Willis JH (2007). Plant speciation. Science 317: 910–914.Salazar C, Baxter SW, Pardo-Diaz C, Wu G, Surridge A, Linares M et al. (2010).
Genetic evidence for hybrid trait speciation in Heliconius butterflies. PLoS Genet 6:e1000930.
Scopece G, Widmer A, Cozzolino S (2008). Evolution of postzygotic reproductive isolationin a guild of deceptive orchids. Amer Nat 171: 315–326.
Stemshorn KC, Reed FA, Nolte AW, Tautz D (2011). Rapid formation of distinct hybridlineages after secondary contact of two fish species (Cottus sp.). Mol Ecol 20:1475–1491.
Tang S, Okashah RA, Cordonnier-Pratt MM, Pratt LH, Johnson VE, Taylor CA et al. (2009).EST and EST-SSR marker resources for Iris. BMC Plant Biol 9: 72.
Tang S, Okashah RA, Knapp SJ, Arnold ML, Martin NH (2010). Transmission ratiodistortion results in asymmetric introgression in Louisiana Iris. BMC Plant Biol10: 48.
Taylor SJ, AuBuchon KJ, Martin NH (2012). Identification of Floral Visitors of Iris nelsonii.Southeastern Naturalist 11: 141–144.
Taylor SJ, Willard RW, Shaw JP, Dobson MC, Martin NH (2011). Differential response ofthe homoploid hybrid species Iris nelsonii (Iridaceae) and its progenitors to abiotichabitat conditions. Am J Bot 98: 1309–1316.
Templeton AR (1981). Mechanisms of speciation - a population genetic approach. AnnRev Ecol Syst 12: 23–48.
Wang S, Basten CJ, Zeng Z-B (2011). Windows QTL Cartographer 2.5. Department ofStatistics, North Carolina State University: Raleigh, NC (http://statgen.ncsu.edu/qtlcart/WQTLCart.htm).
Wilken DH (1982). A simple method for estimating anthocyanin concentrations in tissueextracts. Phytochemical Bulletin 15: 7–13.
Zeng Z-B (1994). Precision mapping of quantitative trait loci. Genetics 136: 1457–1468.
Supplementary Information accompanies the paper on Heredity website (http://www.nature.com/hdy)
Iris interspecific linkage mapSJ Taylor et al
70
Heredity