
GENOME-WIDE GENETIC INTERACTION ANALYSIS OF GLAUCOMA · PDF fileGENOME-WIDE GENETIC...
12
GENOME-WIDE GENETIC INTERACTION ANALYSIS OF GLAUCOMA USING EXPERT KNOWLEDGE DERIVED FROM HUMAN PHENOTYPE NETWORKS TING HU † , CHRISTIAN DARABOS † , MARIA E. CRICCO, EMILY KONG, JASON H. MOORE Institute for the Quantitative Biomedical Sciences, Geisel School of Medicine, Dartmouth College Hanover, NH 03755, U.S.A. E-mail: [email protected] The large volume of GWAS data poses great computational challenges for analyzing genetic interactions associated with common human diseases. We propose a computational framework for characterizing epistatic interactions among large sets of genetic attributes in GWAS data. We build the human phenotype network (HPN) and focus around a disease of interest. In this study, we use the GLAUGEN glaucoma GWAS dataset and apply the HPN as a biological knowledge-based filter to prioritize genetic variants. Then, we use the statistical epistasis network (SEN) to identify a significant connected network of pairwise epistatic interactions among the prioritized SNPs. These clearly highlight the complex genetic basis of glaucoma. Furthermore, we identify key SNPs by quantifying structural network characteristics. Through functional annotation of these key SNPs using Biofilter, a software accessing multiple publicly available human genetic data sources, we find supporting biomedical evidences linking glaucoma to an array of genetic diseases, proving our concept. We conclude by suggesting hypotheses for a better understanding of the disease. Keywords : GWAS; Epistasis; Gene-gene interaction; Human phenotype network; Statistical epistasis network; Biofilter; Eye diseases; Glaucoma; SNPs; Pathways. 1. Introduction With the rapid development of genotyping technologies and exponential increase in computa- tional power, we are able to leverage the wealth of genome-wide association studies (GWAS) data to test millions of genetic variations (single nucleotide polymorphisms, SNPs) for their associations with common human diseases. 1,2 However, common disorders are usually the result of the non-linear combined effect of many variations. The study of these complex, epistatic interactions among multiple genetic attributes is crucial in explaining portions of the genotype-to-phenotype associations. 3,4 Detecting and analyzing complex genetic interactions in GWAS data pose great statistical and computational challenges. Epistatic effects potentially involve any number of SNPs, from a couple to hundreds or even thousands. In turn, the uncertainty of size of the interacting SNP set would require interaction studies to comprehensively explore all possible combinations of SNPs. A typical GWAS dataset encompasses hundreds of thousands of variations, making the enumeration of all pairwise SNP interactions computationally infeasible, and the com- putational cost increases exponentially with the number of features at hand. This inevitably becomes a computational bottleneck of processing and analyzing GWAS data. Therefore, genetic interaction studies meant to process modern GWAS data require the development of advanced informatics methodologies. These novel algorithms must be able to † Co-first authors – TH and CD have contributed equally to this work.
Transcript of GENOME-WIDE GENETIC INTERACTION ANALYSIS OF GLAUCOMA · PDF fileGENOME-WIDE GENETIC...
GENOME-WIDE GENETIC INTERACTION ANALYSIS OF GLAUCOMAUSING EXPERT KNOWLEDGE DERIVED FROM HUMAN PHENOTYPE
NETWORKS
TING HU†, CHRISTIAN DARABOS†, MARIA E. CRICCO, EMILY KONG, JASON H. MOORE
Institute for the Quantitative Biomedical Sciences, Geisel School of Medicine, Dartmouth CollegeHanover, NH 03755, U.S.A.
E-mail: [email protected]
The large volume of GWAS data poses great computational challenges for analyzing geneticinteractions associated with common human diseases. We propose a computational framework forcharacterizing epistatic interactions among large sets of genetic attributes in GWAS data. We buildthe human phenotype network (HPN) and focus around a disease of interest. In this study, we usethe GLAUGEN glaucoma GWAS dataset and apply the HPN as a biological knowledge-based filterto prioritize genetic variants. Then, we use the statistical epistasis network (SEN) to identify asignificant connected network of pairwise epistatic interactions among the prioritized SNPs. Theseclearly highlight the complex genetic basis of glaucoma. Furthermore, we identify key SNPs byquantifying structural network characteristics. Through functional annotation of these key SNPsusing Biofilter, a software accessing multiple publicly available human genetic data sources, wefind supporting biomedical evidences linking glaucoma to an array of genetic diseases, proving ourconcept. We conclude by suggesting hypotheses for a better understanding of the disease.
Keywords: GWAS; Epistasis; Gene-gene interaction; Human phenotype network; Statistical epistasisnetwork; Biofilter; Eye diseases; Glaucoma; SNPs; Pathways.
1. Introduction
With the rapid development of genotyping technologies and exponential increase in computa-tional power, we are able to leverage the wealth of genome-wide association studies (GWAS)data to test millions of genetic variations (single nucleotide polymorphisms, SNPs) for theirassociations with common human diseases.1,2 However, common disorders are usually theresult of the non-linear combined effect of many variations. The study of these complex,epistatic interactions among multiple genetic attributes is crucial in explaining portions of thegenotype-to-phenotype associations.3,4
Detecting and analyzing complex genetic interactions in GWAS data pose great statisticaland computational challenges. Epistatic effects potentially involve any number of SNPs, froma couple to hundreds or even thousands. In turn, the uncertainty of size of the interacting SNPset would require interaction studies to comprehensively explore all possible combinations ofSNPs. A typical GWAS dataset encompasses hundreds of thousands of variations, makingthe enumeration of all pairwise SNP interactions computationally infeasible, and the com-putational cost increases exponentially with the number of features at hand. This inevitablybecomes a computational bottleneck of processing and analyzing GWAS data.
Therefore, genetic interaction studies meant to process modern GWAS data require thedevelopment of advanced informatics methodologies. These novel algorithms must be able to
†Co-first authors – TH and CD have contributed equally to this work.
simultaneously analyze large sets of interactions and identify genetic attributes potentiallyinvolved in higher-order interactions. Network modeling has emerged as a suitable frameworkfor such purposes,5–7 thanks to its ability to represent a large number of entities, as vertices,and their relationships, as edges.
In this study, we propose an informatics framework of detecting and analyzing genetic in-teractions for GWAS data. We use the example of the GLAUGEN study, a GWAS on glaucomaconsisting of over a million attributes. We pre-screen the dataset using a knowledge-based fil-ter by building human phenotype network (HPN) to prioritize SNPs and reduce the searchspace according to their known relationship to the disease/phenotype in question. This re-duced SNP list is then used to quantitatively evaluate all pairwise epistatic interactions andto build statistical epistasis network (SEN) to characterize their global interaction structure.The key SNPs identified by the SEN are functionally annotated and evaluated for their inter-action with other disorders. This new framework has the potential to elucidate large parts ofthe complex genetic architecture of common human diseases, such as glaucoma, and identifykey SNPs for further biological validations.
2. Dataset and Methods
2.1. Glaucoma and the GLAUGEN Study
Glaucoma, a neurodegenerative disease, is the primary cause of irreversible blindness, affectingover 60 million people worldwide. The most common kind of glaucoma, in all populations, isprimary open-angle glaucoma (POAG). Currently the only modifiable risk factor of POAGis intraocular pressure (IOP), but even lowering that will only slow the process, not stop it.8
However, a substantial amount of POAG has been shown to have a genetic basis. Familialaggregation of POAG has been long recognized and studied to find multiple loci linked tothem, causing the discovery of glaucoma-causing genes myocilin (MYOC), optineurin (OPTN)and WDa-repeat domain 36.9 About 5% of POAG is presently attributed to a single-gene orMendelian forms of glaucoma. More cases of POAG are caused by the combined epistaticeffects of many genetics risk factors.10
The Glaucoma Gene Environment (GLAUGEN) seeks to illuminate the origin of the dis-ease, to discover genetic loci associated with POAG, and to identify gene-gene and gene-environment associations.8 GLAUGEN is a GWAS, case-control study, with about 2,000 un-related cases and over 2,300 controls. To be involved in the study, both the cases and thecontrols had to be at least 40 years of age and European derived or Hispanic Caucasian.Subjects were genotyped with 1,048,965 SNPs examined.8
2.2. Human Phenotype Network (HPN)
The human disease network,11 or the more general human phenotype networks (HPNs),12,13
are mathematical graph models where nodes represent human genetic disorders and edgeslink those nodes with shared biology.14 The underlying connections of the HPN contribute to
atryptophan-aspartic acid
Permanent tooth development
Response to platinum-based chemotherapy in non-small-cell lung cancer
Ovarian reserve
beta Carotene
Heart Function Tests
Odontogenesis
Behcet's disease
Membranous Glomerulonephritis
Pulse
Serum uric acid levels
Response to TNF antagonist treatmentWalking
PR interval
Heart Atria
Alanine Transaminase
Tooth EruptionAcenocoumarol
Emphysema
Gallbladder cancer
Left Atrial Function
Brain structure
Lupus Vulgaris
Interleukin-1beta
Cyclic Peptides
bipolar disorder and depression (combined) Schizophrenia
Testicular Neoplasms
Parathyroid Hormone
1-Alkyl-2-acetylglycerophosphocholine Esterase
Electrocardiography
Sj�gren's syndrome
Lung cancer
Frontal Lobe
External Ear
Open-Angle Glaucoma
Dupuytren's disease
Exfoliation Syndrome
Phytosterols
Speech Perception
alpha-Macroglobulins
vWF and FVIII levels
Subcutaneous Fat
Glucose Tolerance Test
Adverse response to carbamapezine
Urinary Bladder Neoplasms
Hair
Paget's disease
Vascular endothelial growth factor levelsSelf-reported allergy
Primary biliary cirrhosis
5-HTT brain serotonin transporter levels
Bladder cancer
Coronary spasm
oxaliplatin [Supplementary Concept] Telomere length
Respiratory Function TestsBrain imaging
Menarche and menopause (age at onset) Cystatin CSepsis
Precursor Cell Lymphoblastic Leukemia-Lymphoma
Menarche
Nevus count
Citalopram
Carotid Artery Diseases
Bone Density
Atrial Natriuretic Factor
Lymphocytic Leukemia
Eye color
Ankle Brachial Index
Thyroid cancer
Idiopathic pulmonary fibrosis
Vitamin B 12
Common traits (Other)
Sleep
Forced Expiratory Volume
Aging traits
Depression
Gallbladder Neoplasms
White matter integrity
Esophageal cancer
Endometriosis
Ileal carcinoids
Major CVD
T-Lymphocytes
Atherosclerosis
Digit length ratio
Interleukin-6
Tumor biomarkers
Coronary Vasospasm
Carbamazepine
Biliary Liver CirrhosisBrain Mapping
Thyroid Neoplasms
Cytomegalovirus Vaccines
Soluble levels of adhesion molecules
Alcohol Drinking Sex Hormone-Binding Globulin
Thyrotoxic hypokalemic periodic paralysis
Quantitative traits
HIV-1 viral setpoint
Neurobehavioral Manifestations
Luteinizing Hormone
Glycoproteins
Pancreatic cancer
Optic Nerve
Antidepressive Agents
Urinary albumin excretion
Hodgkin Disease
CD8-Positive T-Lymphocytes
Partial Thromboplastin Time
Astigmatism
Myeloid Leukemia
Ferritins
Colorectal cancer
Primary Ovarian Insufficiency
Palmitic acid (16:0) plasma levels
Memory
Social Desirability
Apolipoproteins C
Non-albumin protein levels
Hoarding
Amygdala
Occipital Lobe
carbohydrate-deficient transferrin [Supplementary Concept]
Meningococcal disease
Aromatase Inhibitors
Nasopharyngeal Neoplasms
Cognitive test performance
Anemia
Cornea
Lymphoid Leukemia
Eosinophils
Visual Cortex
Benzodiazepines
Anthropometric traits
Metabolic Syndrome XEndometrial cancer
Perphenazine
Chemokines
Germinoma
Tumor Necrosis Factor-alpha
Sneezing
Cardiac Arrhythmias
Response to gemcitabine in pancreatic cancer
Movement Disorders
Select biomarker traits
Thoracic Aortic Aneurysm
Resting heart rate
Glycemic traits
Endometrial NeoplasmsCardiovascular Diseases
Tamoxifen
lipoprotein A-I [Supplementary Concept]
Intestinal Diseases
Maximal Midexpiratory Flow Rate
Extraversion (Psychology)
Pain
Ulcerative colitis
AIDS
Chronic Hepatitis B
Glucosylceramides
Dietary macronutrient intake
Carotid intima media thicknessDysplastic Nevus Syndrome
Migraine Disorders
Crohn's disease and celiac disease
Mean forced vital capacity from 2 exams
Tetralogy of Fallot
Celiac disease and Rheumatoid arthritis
Insulin-Like Growth Factor I
QT interval
Hyperkalemic Periodic Paralysis
Vital Capacity
Butyrylcholinesterase
Urinalysis
Cystatins
Beta-2 microglubulin plasma levels
gamma-Glutamyltransferase
Brain Natriuretic Peptide
Blood Glucose
Blue vs. brown eyes
Allopurinol
Complement C4b-Binding Protein
Reading and spelling
Proinsulin levels
Hyperactive-impulsive symptoms
Vascular Calcification
Obesity
Cortical thickness
Vitamin K
Oligospermia
Neurotic Disorders
Cardiovascular disease risk factors
Hormone measurements
Braces
Weight
Inflammatory biomarkers
Transforming Growth Factor beta1
Blood Platelets
Suntan
Gastric cancer
Cleft Lip
Interleukin-6 Receptors
T-tau
Personality dimensions
Uterine fibroids
Folic Acid
Intercellular Adhesion Molecule-1
L-Lactate Dehydrogenase
Skin pigmentation
Basal Cell Carcinoma
Word reading
Caffeine
Protein quantitative trait loci
Erectile Dysfunction
Follicle Stimulating Hormone
Primary sclerosing cholangitis
Isoxazoles
Breast Neoplasms
Morbidity-free survival
Insulin-Like Growth Factor Binding Protein 3
Interleukin-2 Receptor alpha Subunit
Migraine
Stearic acid (18:0) plasma levels
Folate pathway vitamin levels
Cardiac hypertrophy
Behavioural disinhibition (generation interaction)
Muscular Diseases
Monocyte count
Iris
Cervical cancer
Aorta
Chronic Kidney Failure
LDL Lipoproteins
Fuchs Endothelial Dystrophy
Hair Color
Polysaccharides
Hepatitis B Vaccines
Glaucoma
Corneal Topography
Eye
Alpha-Globulins
Hippocampus
Brain Waves
Optic Disk
Prostate cancer
Anti-cyclic Citrullinated Peptide Antibody
Intracranial volume
Reasoning
Two-hour glucose challenge
Inattentive symptoms
Circulating cell-free DNA
Floxacillin
Jaw Abnormalities
Cognitive decline
Papillomaviridae
Fibromyoma Myoglobin
Alopecia
Vitamin A
Central Nervous System
Vitamin B 6
Hippocampal volume
Apolipoproteins E
Acquired Immunodeficiency SyndromeAngiotensin-converting enzyme activity
Glomerulosclerosis
human [Supplementary Concept] F8 protein
Leptin
HIV-1 susceptibility
Blood trace element (Zn levels)
Chemokine CCL2
Serotonin Plasma Membrane Transport Proteins
MelanomaIGA Glomerulonephritis
InsulinEpirubicin-induced leukopenia
Lung Neoplasms
Allergic Rhinitis
Acetaminophen
Metabolic traits
Face
Aging
Neuroanatomy
SmokingDepressive Disorder
Transferrin
Blood pressure measurement (cold pressor test)
Inflammatory bowel disease
mean corpuscular hemoglobin concentration
Dengue shock syndrome
Autistic Disorder
Gallbladder Diseases
IgE levels
Colony-Forming Units Assay
alpha-Tocopherol
Red blood cell count
Chronic myeloid leukemia
Blood Flow Velocity
Esophagitis
Tissue Plasminogen Activator
Endothelial function traits
Response to acetaminophen (hepatotoxicity)
Smoking behavior
BrainNeutrophils
Common Carotid Artery
Temporal Lobe
Dengue Hemorrhagic Fever
Pure-Tone Audiometry
Abdominal Aorta
Taste
InflammationVenous thromboembolism
Antipsychotic Agents
Testicular cancer
Caffeine consumption
Cytomegalovirus antibody response
Intuition
Chronic hepatitis B infection
Migraine without aura
AsthmaKidney stones
Crohn Disease
Myeloproliferative Disorders
Follicule stimulating hormone
Liver Cirrhosis
Oocytes
Chemokine CCL4
Gout
Interleukin-12
Non-substance related behavioral disinhibition
Metabolism
Eye color traits
Transferrin Receptors
RisperidoneAddiction
Circadian Rhythm
Nasopharyngeal carcinoma
Adverse response to aromatase inhibitors
Subclinical atherosclerosis traits (other)
IgA levels
Sphingomyelins
Sudden Death
Osteitis Deformans
Creutzfeldt-Jakob Syndrome
End-stage coagulation
Rhabdomyolysis
Keratoconus
Cardiomegaly
Vascular Diseases
von Willebrand Factor
Neuropsychological Tests
Psychological Sexual Dysfunctions
Warfarin
Myopia
Soluble ICAM-1
Leukopenia
Stevens-Johnson Syndrome
Hearing Loss
Left Ventricular Function
Cardiac structure and function
Response to iloperidone treatment (PANSS-T score)
Autism
Prion diseases
Pancreatic Neoplasms
Alkaline Phosphatase
Anxiety
N-glycan levels
Multiple myeloma
Goiter
Event-related brain oscillations
Dialysis-related mortality
Allergic sensitization
Response to Vitamin E supplementation
Mental Disorders
Neuranatomic and neurocognitive phenotypes
Functional Laterality
Recombination rate (males)
Facial morphology
Foot
Hand Strength
Pulmonary function
Carotid Stenosis
Amyloid beta-Peptides
Response to platinum-based agents
Anthropometry
Religion and Psychology
Melanosis
Angiotensin-Converting Enzyme Inhibitors
Thyroid volume
Hodgkin's lymphoma
Retinal Vein
Interleukin-10
Echocardiographic traits
Androgen levelsTelomere
Response to cerivastatin
CerebrumSclerosis
Illicit drug useMyasthenia gravis
Heart rate variability traits
Gambling
Response to radiation
Immunoglobulin E
Thyrotropin
Mortality
Brugada syndromeCeliac disease
Blood Viscosity
Phospholipids
Mortality among heart failure patients
tau Proteins
Volumetric brain MRI
P-tau181p
Small Cell Lung Carcinoma
Adiponectin
Aortic root size
Systemic lupus erythematosus and Systemic sclerosis
Emphysema-related traits
gemcitabine [Supplementary Concept]
Albuminuria
Response to antineoplastic agents
Prostatic Neoplasms
Protein C
DehydroepiandrosteroneTanning
Kidney Diseases
Colonic Neoplasms
Working memory
Vascular Endothelial Growth Factor A
Brachial Artery
Oleic acid (18:1n-9) plasma levels
Essential Tremor
Iris characteristics
Caudate nucleus volume
Lipid Metabolism
Palmitoleic acid (16:1n-7) plasma levels
Hypothyroidism
Substance-Related Disorders
Gestational Diabetes
Paget's disease
Forced Vital Capacity
Angiography
Azoospermia
Hair morphology
Interleukin-18
Glioma
Tobacco Use Disorder
Head and Neck Neoplasms
Hematological and biochemical traits
Rheumatoid arthritis
Esophageal adenocarcinoma
Menopause
Focal Segmental Glomerulosclerosis
Hearing impairment
Drug-Induced Liver Injury
Iron deficiency
Esophageal Neoplasms
Interleukin-8
Psychomotor Performance
Blood Cells
Stomach Neoplasms
Personality
Sclerosing Cholangitis
Breast size
Metabolome
Anticonvulsants
Homocysteine
Attention Deficit Disorder with Hyperactivity
Serum selenium levels
Sunburns
Blood Sedimentation
Blood Vessels
Renal sinus fat
Clozapine
Macular Degeneration
Radiation response
Ovarian cancer
Autoimmune Diseases
Urinary metabolites
Short-Term Memory
Sensory disturbances after bilateral sagittal split ramus osteotomy
Colorectal Neoplasms
Thyroxine
Cleft Palate
Aspartate aminotransferase
Entorhinal Cortex
Acute lung injury
Vitamin K 1
Graves Disease Atrioventricular conduction
Vitamin E
Natriuretic peptide levels
Cortical structure
Erythrocyte Indices
Kawasaki disease
Nephropathy
DNA
radiation-related) Thyroid cancer (Papillary
Functional MRI
Kidney Calculi
Duodenal Ulcer
Coffee
Internal Carotid Artery
Pain Measurement
HIV-1
Handedness in dyslexia
Nevi and Melanomas
Migraine - clinic-based
Addictive Behavior
LongevityMonocyte early outgrowth colony forming units
Drug Toxicity
Vascular constriction
Chronic kidney disease
Insulin-Like Growth Factor Binding Protein 4
Parietal Lobe
Serum dimethylarginine levels (symmetric)
Comprehensive strength and appendicular lean mass
Aortic-valve calcification
Caudate Nucleus
Erythropoietin
Immunoglobulin A
Venous Thrombosis
Platelet function and related traits
Glucose Transporter Type 2
Biomedical quantitative traits
Exploratory Behavior
Soluble E-selectin levels
Marijuana Abuse
Mucocutaneous Lymph Node Syndrome
Osteoporosis
Attention Deficit and Disruptive Behavior Disorders
Insulin-Like Growth Factor Binding Protein 5
Antipsychotic-induced QTc interval prolongation
Asperger SyndromeLymphocytes
Sleep duration
Moyamoya disease
Survival
Infantile hypertrophic pyloric stenosis
E-Selectin
Carotid Arteries
Retinol levels
Fuchs's corneal dystrophy
gamma-Glutamylcyclotransferase
Ovarian NeoplasmsFructose-Bisphosphate Aldolase
Meningococcal Infections
Apolipoprotein A-I
Peroxidase
Intra-Abdominal Fat
Abdominal Fat
Coronary Disease
Vitamin D
Thyroid hormone levels
Blue vs. green eyes
Sphingolipids
Hypertrophic Pyloric Stenosis
Upper aerodigestive tract cancers
Response to tamoxifen in breast cancer
Life Expectancy
Ceramides
Serum alkaline phosphatase levels
β2-Glycoprotein I (β2-GPI) plasma levels
Progranulin levels
Insulin-like growth factors
Adverse response to lamotrigine and phenytoin
Dehydroepiandrosterone Sulfate
Dupuytren Contracture
Coronary restenosis
Abdominal Aortic Aneurysm
Male fertility
Leukocyte Count
fibrin fragment D [Supplementary Concept]
CD40 Ligand
Systemic Scleroderma
Apolipoprotein Levels
Chronic lymphocytic leukemia
Retinal vascular caliber
Behavior
Carcinoid Tumor
Heart Diseases
Interleukin 1 Receptor Antagonist ProteinBleomycin sensitivity
total Cholesterol
Iris color
Response to treatment for acute lymphoblastic leukemia
Corneal curvature
Iron-Regulatory Proteins
Coffee consumption
Pubertal anthropometrics
Blood Proteins
Barrett's esophagus
Treatment response for severe sepsis
Non-Small-Cell Lung Carcinoma
Genetic Recombination
Lymphoma
Migraine with aura
Digestive system disease (Barrett's esophagus and esophageal adenocarcinoma combined)
Haptoglobins
Blood Coagulation Factor Inhibitors
P-Selectin
Information processing speed
Circulating vasoactive peptide levels
Hepatocellular carcinoma
Type 2 diabetesChemerin levels
Hepatitis B vaccine response
0"
100"
200"
300"
1" 5" 9" 13" 17"
frequ
ency"
degree"
0.1$
1$
10$
100$
1000$
1$ 10$ 100$
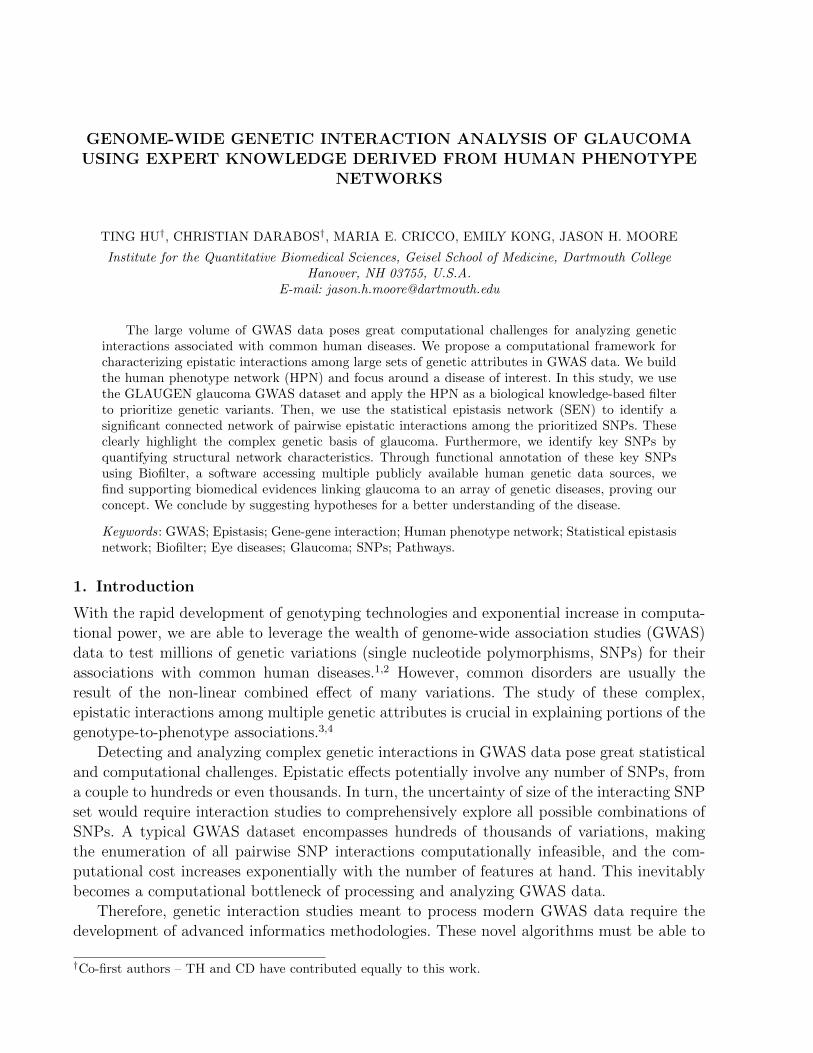
Fig. 1. The SNP-based human phenotype network, filtered (edge weight cutoff = 0.002). Vertices are coloredby “modules”13 to increase readability. The vertex sizes are proportional to the number of associated SNPs.The degree distribution is given on both linear and logarithmic scales.
the understanding of the basis of disorders, which in turn leads to a better understanding ofhuman diseases.
In the present work, we rely on the SNP-based HPN, where connected diseases share com-mon SNPs. We use two sources for the phenotype-to-SNPs mapping: the National HumanGenome Research Institute GWAS catalog,15 a manually curated list of all the National Insti-tute of Heath (NIH) funded GWAS studies, and the NIH’s database of Genotypes and Phe-notypes (dbGaP, http://www.ncbi.nlm.nih.gov/gap). To build the HPN, all traits listed inthe GWAS catalog and dbGaP are annotated with their risk-associated SNPs. All the traitsbecome nodes in our network. Then, traits that have one or more SNPs in common are linkedin the HPN by an edge, the weight of which is proportional to the size of the SNPs’ overlap.The GWAS catalog and dbGaP report 1,252 traits combined, annotated with 37,681 SNPs in16,411 loci. The resulting bipartite network is projected in the space of phenotype vertices toobtain the HPN shown in Fig. 1.
The HPN contains 985 vertices and over 26,000 edges, and encompasses all phenotypeslisted in the GWAS catalog and dbGaP, provided that they are connected to at least one othertrait. The resulting network is extremely dense, with an average degree greater than 500.
2.3. Statistical Epistasis Network (SEN)
Statistical epistasis network (SEN) is designed to study a global aggregation of pairwiseepistatic interactions among a large number of factors.16,17 First, pairwise epistatic interaction
is quantified using the information-theoretic measure called information gain18 for all possiblepairs of genetic attributes. Specifically, the genotypes of two SNPs A and B, and the discretephenotypic class C are regarded as variables. Mutual information I(A;C) or I(B;C) measuresthe shared information between (A or B) and C calculated as I(A;C) = H(A)+H(C)−H(A,C)
or I(B;C) = H(B) +H(C)−H(B,C), where entropy H measures the uncertainty of a randomvariable or joint multiple random variables. Therefore, mutual information I(A;C) or I(B;C)
describes the reduction of the uncertainty of the phenotypic class C given the knowledge ofthe genotype of A or B, known as the main effect of A or B on C. Similarly, the joint mutualinformation I(A,B;C) measures the total effect of combining A and B on explaining the phe-notype C. Subtracting the individual mutual information I(A;C) and I(B;C) from I(A,B;C)
captures the gained information on C by considering A and B together rather than individ-ually. This information gain IG(A;B;C) is a practical measure for the epistatic interactioneffect of SNPs A and B on phenotype C, and has been used as an efficient non-parametric andmodel-free statistical quantification of pairwise epistasis in genetic association studies.19–23
Second, all pairwise SNP-SNP interactions are quantified and ranked. We build statisticalepistasis networks where vertices are SNPs and edges are weighted pairwise interactions. Weonly include pairs of SNPs if their interaction strengths are stronger than a preset threshold.We analyze the network topological properties at each cutoff value of the threshold, such as thesize of the network (the number of its vertices and the number of its edges), the connectivity ofthe network (the size of its largest connected component), and its vertex degree distribution.
Then, a threshold of the pairwise interaction strength is determined systematically byfinding the cutoff where the topological properties of the real-data network differentiate themost from the null distribution of permutation testing. Such a SEN provides a significantglobal structure of clustered strong pairwise epistatic interactions associated with a particularphenotype. It serves as a map for further network properties investigation and key SNPsprioritization as discussed in the following section.
2.4. Network Property Analysis of SEN
The assortativity of a network measures the propensities of vertices with similar characteristicsto connect to one another.24,25 In the context of SENs, we are interested in looking into themain effect assortativity, i.e., whether there exists a correlation of main effects between pairsof interacting SNPs. Such main effect assortativity is calculated as the Pearson correlationcoefficient r of the main effects at either ends of an edge in a SEN,
r =M−1
∑i jiki − [M−1
∑iji+ki
2 ]2
M−1∑
ij2i +k
2i
2 − [M−1∑
iji+ki
2 ]2, (1)
where M is the total number of edges, and ji and ki are the main effects, calculated asthe mutual information of a SNP and the phenotypic class of the vertices (SNPs) at theends of the i-th edge, with i = 1, 2, ...,M . The coefficient r lies between -1 and 1, with r =
1 indicating perfectly assortative, r = 0 for non-assortative, and r = −1 for complete dis-assortative networks.
At the vertex level, centrality measures the importance of individual vertices in a network.The most commonly used centrality measure is the node’s degree CD(v), which is the total
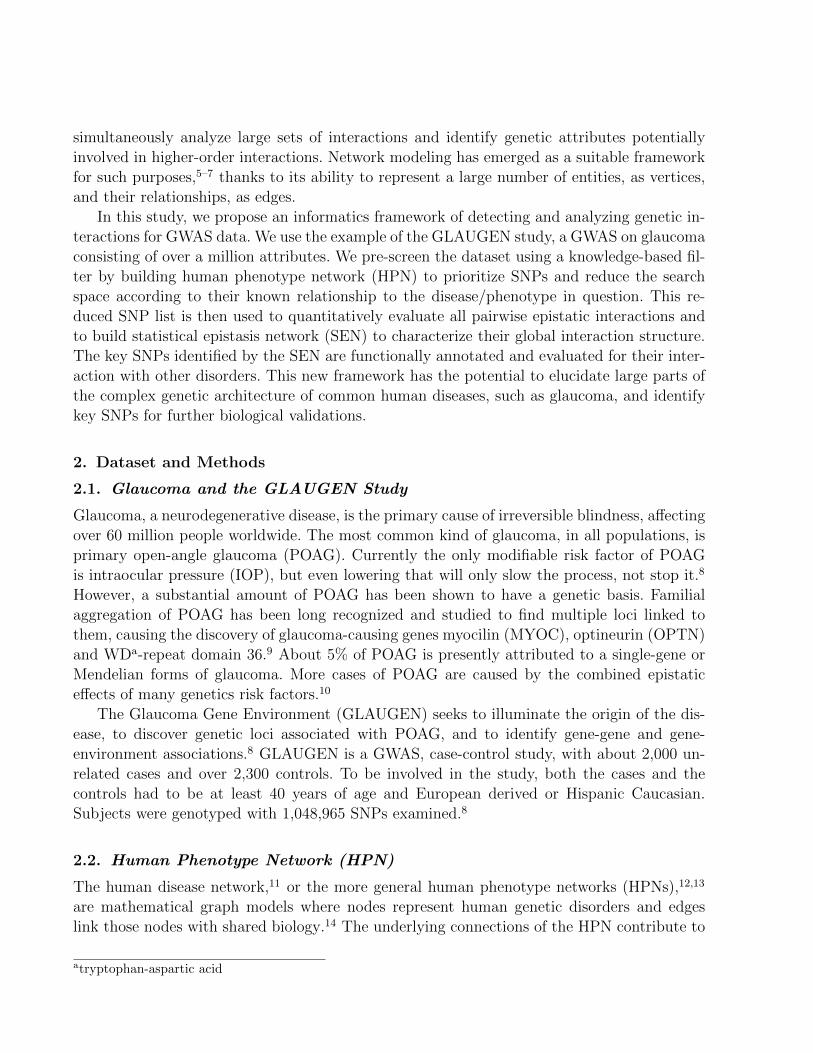
Phenotype #SNPs DegreeExfoliation Syndrome 1 1Coronary Artery Disease 639 2Cardiovascular Diseases 70 2Corneal curvature 13 4Optic Disk 17 4Open-Angle Glaucoma 6 5Glioma 12 2Eye 13 4Glaucoma 18 9Coronary restenosis 56 3
2SHQ�$QJOH�*ODXFRPD
([IROLDWLRQ�6\QGURPH
&DUGLRYDVFXODU�'LVHDVHV
*ODXFRPD (\H
2SWLF�'LVN
&RURQDU\�$UWHU\�'LVHDVH
*OLRPD
&RURQDU\�UHVWHQRVLV
&RUQHDO�FXUYDWXUH
(a) (b)
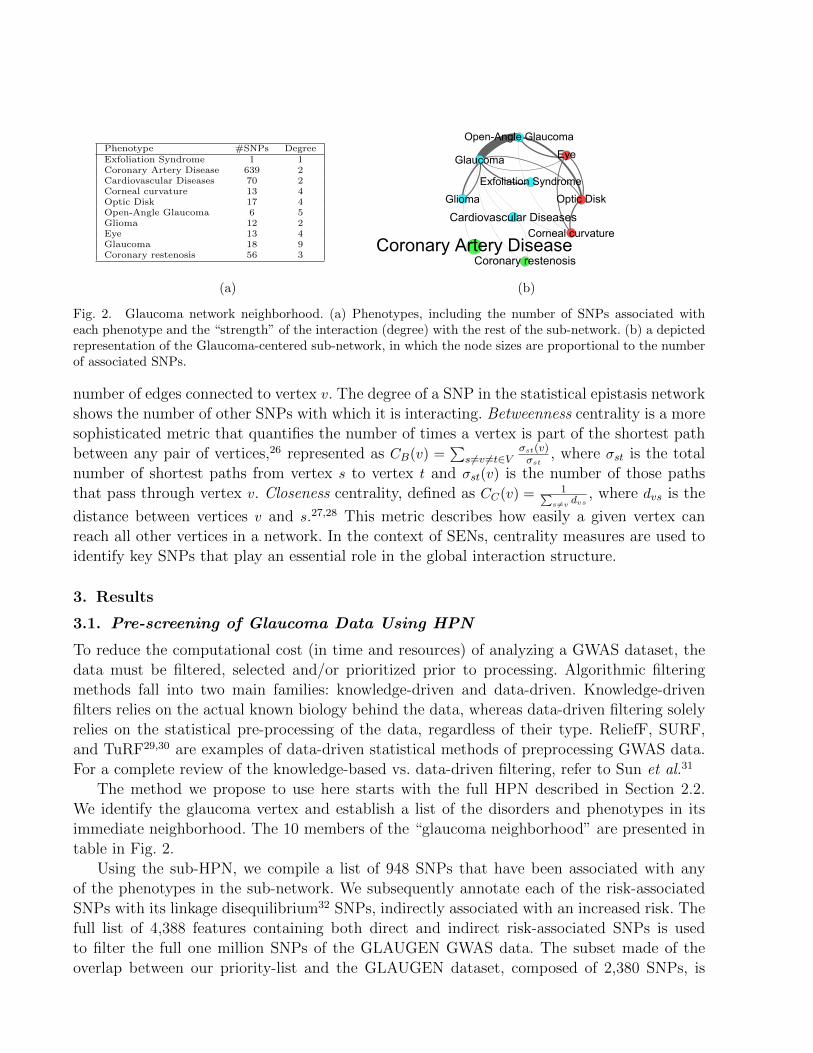
Fig. 2. Glaucoma network neighborhood. (a) Phenotypes, including the number of SNPs associated witheach phenotype and the “strength” of the interaction (degree) with the rest of the sub-network. (b) a depictedrepresentation of the Glaucoma-centered sub-network, in which the node sizes are proportional to the numberof associated SNPs.
number of edges connected to vertex v. The degree of a SNP in the statistical epistasis networkshows the number of other SNPs with which it is interacting. Betweenness centrality is a moresophisticated metric that quantifies the number of times a vertex is part of the shortest pathbetween any pair of vertices,26 represented as CB(v) =
∑s 6=v 6=t∈V
σst(v)σst
, where σst is the totalnumber of shortest paths from vertex s to vertex t and σst(v) is the number of those pathsthat pass through vertex v. Closeness centrality, defined as CC(v) = 1∑
s 6=v dvs, where dvs is the
distance between vertices v and s.27,28 This metric describes how easily a given vertex canreach all other vertices in a network. In the context of SENs, centrality measures are used toidentify key SNPs that play an essential role in the global interaction structure.
3. Results
3.1. Pre-screening of Glaucoma Data Using HPN
To reduce the computational cost (in time and resources) of analyzing a GWAS dataset, thedata must be filtered, selected and/or prioritized prior to processing. Algorithmic filteringmethods fall into two main families: knowledge-driven and data-driven. Knowledge-drivenfilters relies on the actual known biology behind the data, whereas data-driven filtering solelyrelies on the statistical pre-processing of the data, regardless of their type. ReliefF, SURF,and TuRF29,30 are examples of data-driven statistical methods of preprocessing GWAS data.For a complete review of the knowledge-based vs. data-driven filtering, refer to Sun et al.31
The method we propose to use here starts with the full HPN described in Section 2.2.We identify the glaucoma vertex and establish a list of the disorders and phenotypes in itsimmediate neighborhood. The 10 members of the “glaucoma neighborhood” are presented intable in Fig. 2.
Using the sub-HPN, we compile a list of 948 SNPs that have been associated with anyof the phenotypes in the sub-network. We subsequently annotate each of the risk-associatedSNPs with its linkage disequilibrium32 SNPs, indirectly associated with an increased risk. Thefull list of 4,388 features containing both direct and indirect risk-associated SNPs is usedto filter the full one million SNPs of the GLAUGEN GWAS data. The subset made of theoverlap between our priority-list and the GLAUGEN dataset, composed of 2,380 SNPs, is
used to build the SNP interaction network presented in the following section.
3.2. Statistical Epistasis Network of Glaucoma
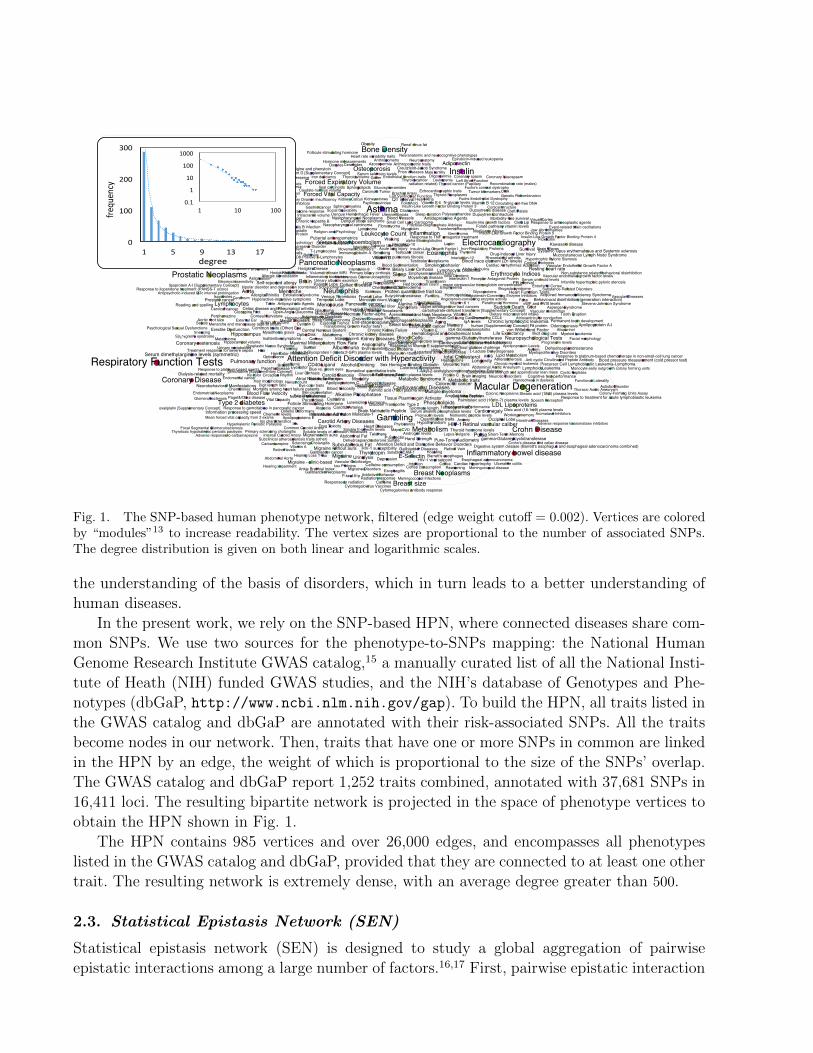
Using the list of 2,380 SNPs, we evaluate all the pairwise epistatic interactions (>2.8 million)using the information gain measure. The strongest interacting pair is SNPs rs13123790 andrs6572380 with a strength of 1.163% association of the disease class. We set the pairwiseinteraction strength threshold decreasing from the strongest observed value with a step of0.0001. At each cutoff, a SEN is built by including pairs of SNPs as edges and two endvertices if their interaction strength is above the cutoff. Then for each network we evaluate itstopological properties including the number of non-isolated vertices, the number of edges, thesum of weighted edges, and the size of its largest connected component. A 100-fold permutationtest assesses the significance of these observed network properties. We permute the data 100times by randomly shuffling the disease class column, and for each permuted dataset all thepairwise interaction strengths are calculated and networks are built using the same cutoffs asthe read-data networks.
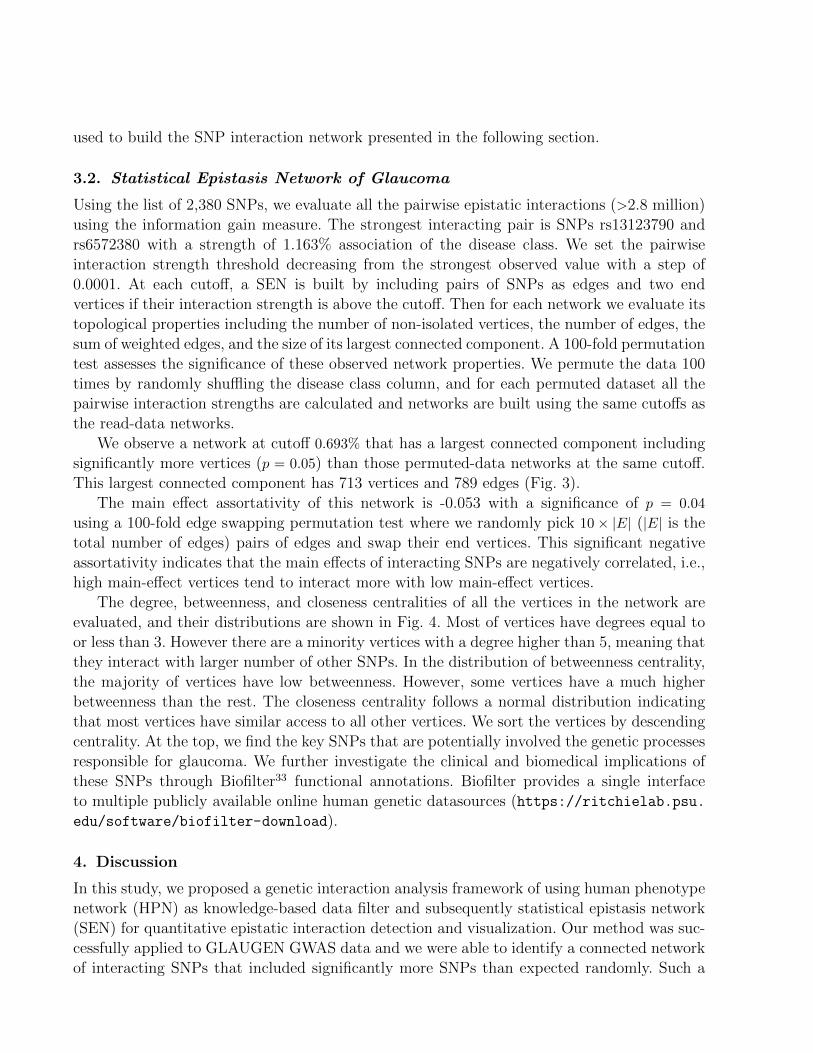
We observe a network at cutoff 0.693% that has a largest connected component includingsignificantly more vertices (p = 0.05) than those permuted-data networks at the same cutoff.This largest connected component has 713 vertices and 789 edges (Fig. 3).
The main effect assortativity of this network is -0.053 with a significance of p = 0.04
using a 100-fold edge swapping permutation test where we randomly pick 10× |E| (|E| is thetotal number of edges) pairs of edges and swap their end vertices. This significant negativeassortativity indicates that the main effects of interacting SNPs are negatively correlated, i.e.,high main-effect vertices tend to interact more with low main-effect vertices.
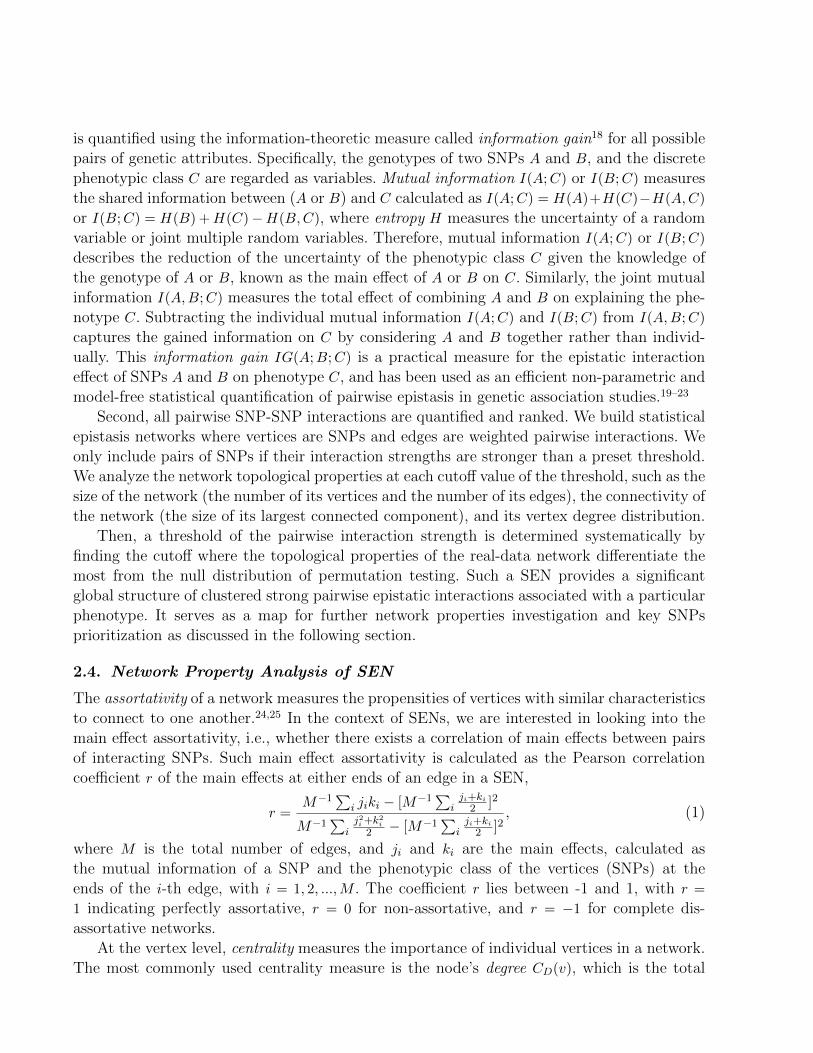
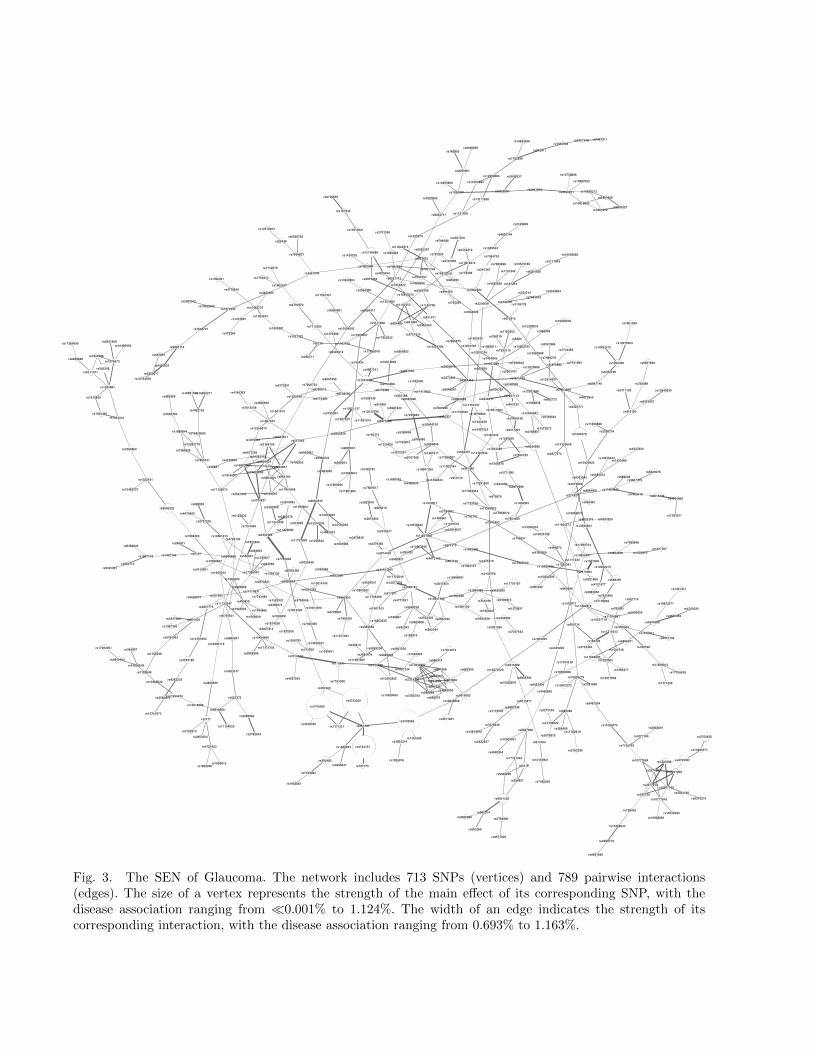
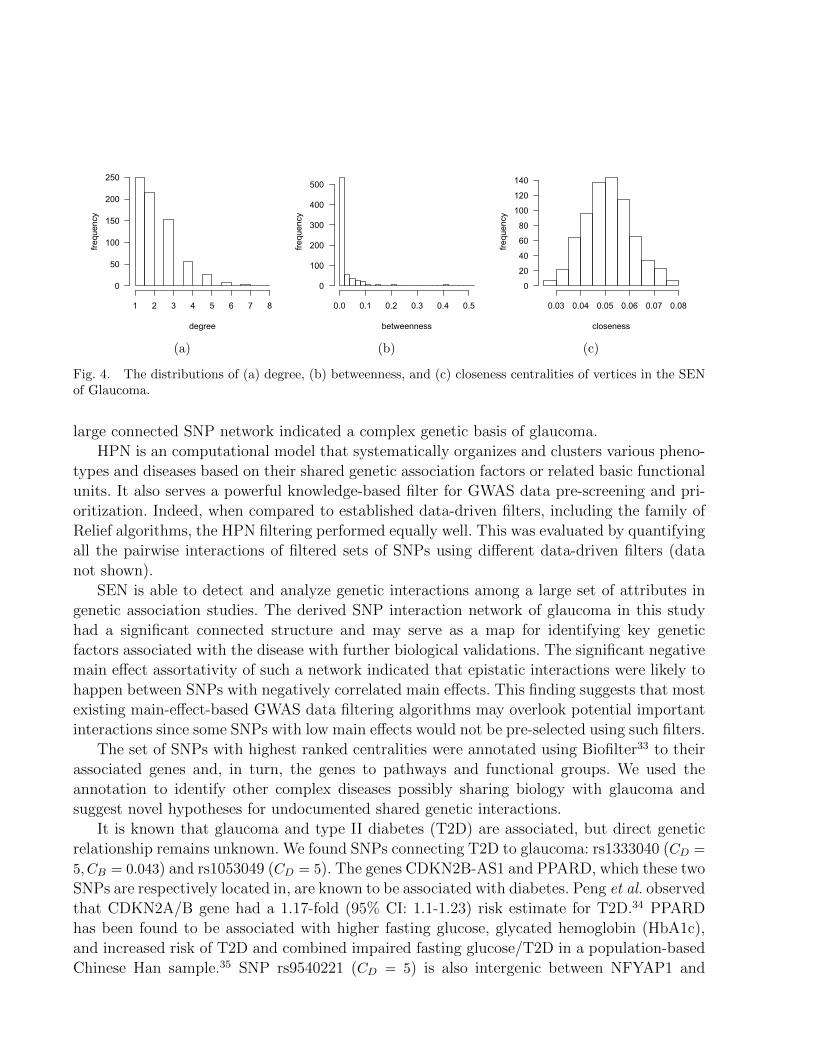
The degree, betweenness, and closeness centralities of all the vertices in the network areevaluated, and their distributions are shown in Fig. 4. Most of vertices have degrees equal toor less than 3. However there are a minority vertices with a degree higher than 5, meaning thatthey interact with larger number of other SNPs. In the distribution of betweenness centrality,the majority of vertices have low betweenness. However, some vertices have a much higherbetweenness than the rest. The closeness centrality follows a normal distribution indicatingthat most vertices have similar access to all other vertices. We sort the vertices by descendingcentrality. At the top, we find the key SNPs that are potentially involved the genetic processesresponsible for glaucoma. We further investigate the clinical and biomedical implications ofthese SNPs through Biofilter33 functional annotations. Biofilter provides a single interfaceto multiple publicly available online human genetic datasources (https://ritchielab.psu.edu/software/biofilter-download).
4. Discussion
In this study, we proposed a genetic interaction analysis framework of using human phenotypenetwork (HPN) as knowledge-based data filter and subsequently statistical epistasis network(SEN) for quantitative epistatic interaction detection and visualization. Our method was suc-cessfully applied to GLAUGEN GWAS data and we were able to identify a connected networkof interacting SNPs that included significantly more SNPs than expected randomly. Such a
rs6571228
rs5768690
rs9941233
rs953259
rs956627
rs992014rs9366399
rs10814916
rs7678436
rs2822557
rs4640244
rs9841585
rs4369779
rs13266634
rs738494
rs10777084
rs2274557
rs1320288 rs3752591
rs13201929
rs10165941
rs5219
rs17141444
rs9563035
rs2079918
rs7466269
rs9557082
rs10505031 rs813164
rs10486771 rs7138792
rs1077165
rs4653061 rs10184275
rs3752823
rs2462140
rs10010325 rs10008860
rs10777845 rs245136
rs2277142 rs2277912
rs9374274
rs1401471
rs4743034 rs16872571
rs2605463
rs9472138
rs9349200
rs1570211
rs11669012
rs17706439
rs1771428
rs189798
rs6996971
rs1504749
rs7336332
rs1396477
rs12517906
rs1220025
rs11714343
rs11664670
rs150724
rs2449222
rs569688
rs7209435
rs930716
rs11580979 rs1533971
rs2732494
rs12076129 rs5015480
rs10505879
rs10508288
rs9935794
rs1816002 rs4455882
rs17103138
rs882300
rs6663404
rs2162256
rs11782819 rs284489
rs989488
rs9487094
rs10502372
rs10509779
rs2281680
rs12199222
rs4897336 rs7172432
rs4313471
rs2273194
rs4121677
rs7542900 rs7178902
rs10237118 rs11108037
rs739981
rs551719
rs1035025
rs688391rs2621469
rs6982250
rs2106913
rs3924153
rs1491192
rs1436900
rs1553847 rs1270837
rs756199
rs7017184 rs2291256
rs597425rs11730157
rs3125050 rs1490388
rs1568482
rs1524976
rs3825214 rs1251588
rs3748069
rs7914674
rs4371861
rs972869
rs891088
rs10848958
rs7525553
rs886374
rs892267
rs888663
rs894558
rs891835
rs896076
rs3916765
rs747175
rs353121
rs3743200
rs3743157 rs1858943
rs3745060
rs7171517
rs1935881
rs7249094
rs300483rs3805647
rs4537554
rs391300
rs1245531 rs3118914
rs173700rs2844479
rs11981985
rs7191006
rs710841
rs6885224
rs2149998
rs10499480
rs12502295
rs1037124
rs7318731
rs3766793
rs17034592
rs10468542 rs4242252
rs2580816 rs11856676
rs12741973
rs9449444
rs344907
rs10506546
rs1746048
rs7128948
rs2783169
rs17084051
rs6918956
rs923375
rs4503747
rs10906115
rs11154022
rs2286036
rs2782934
rs9946041 rs6764363
rs270504
rs10791993
rs2347824
rs1367158
rs1805015 rs1802295
rs4721923
rs2853552
rs2171
rs2849460
rs10518996
rs4722613
rs943855
rs10506627 rs1239947 rs7756992
rs944260
rs540937rs8048899
rs9326439
rs2522425
rs13097792
rs538827
rs4771591
rs282544
rs2015454
rs2829588 rs2522422
rs4672150
rs1558139
rs2750023
rs6020814
rs6504218
rs553346
rs10014145
rs322239
rs7743494
rs7502462
rs2670321
rs1532357
rs2948998
rs17171705
rs10424480
rs3827414
rs1944866
rs1949009
rs300493
rs6725887
rs7403531
rs10014970
rs4365558
rs11211081
rs7025486
rs13438327 rs334213
rs1880781
rs188019
rs1040046
rs9568793 rs1901103
rs8055236
rs535343
rs4951536
rs16852525
rs2024341
rs785422
rs517871
rs11131055
rs11123849
rs13077378
rs11708189
rs2074404
rs6585827
rs10502032
rs17286397
rs1950500
rs3825569
rs1945085
rs499818
rs11170631
rs7069291
rs1058793
rs2306374 rs7812590
rs1875206
rs1874326
rs2410501
rs2627775
rs727957
rs1950702
rs11122547
rs9626074
rs4793501
rs745557rs10829156
rs17356672
rs11926571 rs12592821
rs7954465
rs655487
rs1293151
rs1438342
rs12356233 rs10518527 rs2319517
rs1410518
rs10863936
rs1406961
rs804125
rs974110
rs11807640
rs10518622
rs7873584
rs7314446
rs2383208
rs6435396
rs3774937
rs11241936
rs9391221 rs560713
rs6499640
rs1847118 rs1407149
rs248471
rs1137
rs13012046
rs12576239
rs7833986
rs4982323 rs2478830
rs12150284
rs1229542 rs7669668
rs4842838 rs498872 rs1017307
rs1029973
rs11090754
rs7498403
rs6905922
rs10801913
rs3797235
rs6476642
rs928952
rs4792192
rs6129032
rs7810842
rs2385576
rs1399004
rs212062
rs11223996
rs11127920
rs10496091
rs13389923
rs1545552
rs1275419 rs1052131
rs1865640
rs2146758
rs1733724
rs1007000
rs10922273 rs2470984
rs1111233
rs6780569 rs10895547
rs1525361 rs10085496
rs10834309
rs11599750
rs925019
rs2853676
rs2876303
rs4379368
rs745324
rs6779469
rs2753268
rs1538138
rs1333040
rs4687161
rs17565975
rs914981
rs13123790 rs12651137
rs11921014 rs7239883
rs7669856
rs6572380
rs7754614 rs706080
rs10504130
rs7129429
rs9328448
rs9323914
rs1192415
rs4507859
rs6708562
rs2750024
rs1357523
rs9897551
rs2833836 rs9317297 rs10497323
rs1467242 rs1549250
rs1444439
rs7003283
rs1741344
rs6107955 rs7823896 rs11918414
rs779388 rs6010620
rs2171963
rs10509680
rs10510189
rs297367
rs7084752
rs7481311 rs1057510 rs1540923
rs918911
rs16852600
rs7792939
rs9498099 rs766992
rs2123808
rs4800148
rs2142219 rs1039524
rs2221618
rs1151008
rs2701248 rs10518221
rs7028544
rs4978434
rs11196686 rs1434709
rs11943513
rs7090871
rs1048228 rs701276
rs1325273
rs9863717
rs798489
rs9285397
rs803422
rs7031748 rs10932055
rs6895327
rs10807323
rs1859428
rs10816943
rs9540221 rs2047870
rs1861612
rs10738886
rs10828213
rs12359685
rs2223662
rs13102884
rs13117608
rs2080401
rs7208097
rs2048327
rs10493900
rs1559777
rs12418204
rs6566726
rs8190893
rs1167242
rs26438
rs7604827
rs4421636
rs6565681 rs1473533
rs1324034 rs1012997
rs10929060 rs10485733 rs6795970
rs6699417
rs834485rs3111828
rs17550532 rs5751614
rs2367563
rs1145153
rs831571
rs1145796
rs831983
rs7183263 rs12338076
rs10520520 rs815815
rs6284
rs968008
rs4380028
rs788178rs7856675
rs705384
rs7044529
rs2236691
rs7084584
rs1965072
rs4979264 rs9521112
rs1216472
rs7029757
rs7669522 rs13240504
rs2554380 rs9399799
rs284495
rs494459 rs3134904
rs7045593 rs704744
rs1044581
rs167275
rs1105778
rs17261321 rs4845405
rs1324982 rs2439312
rs4778818 rs16940375
rs17553657 rs3027322
rs10504592 rs1635281 rs472265
rs7648727 rs1376486
rs2547416
rs1022141
rs17041869
rs964184
rs10483727 rs3129055
rs7916697 rs9644059
rs17128272
rs557962
rs6856061
rs795955rs9294851
rs6013871
rs4129959
rs38831
rs1889151
rs12597778
rs12420080
rs1260836
rs1888814
rs3786800
rs7665764
rs16861329 rs885389
rs16860271
rs4952125
rs1412444 rs1932397
rs1412829
rs1935681
rs6774494
rs6780510
rs5215
rs7606754
rs280171
rs7112925
rs6773931
rs1230545
rs295208
rs9521509
rs6869688 rs1933988
rs8111071
rs10495936
rs1076673
rs17584499
rs1267043
rs4666636 rs7013518
rs4346352
rs1541010
rs1480577
rs1719079
rs1754073 rs1490331
rs10754458 rs9359617
rs4405822
rs587847
rs9358118
rs16893890
rs9296824 rs10282118
rs6671793
rs12358475
rs1870661 rs2168159
rs16897288
rs2206734
rs6667140
rs6670655
rs11656696
rs1293470
rs9325777
rs2717128
rs919129
rs7741993 rs7488278
rs642773
rs7963889
rs1476882
rs7742369
rs7651039
rs758099
rs10491472
rs6507838 rs1363258
rs12940030
rs6570507
rs6765739
rs12679004
rs4527850
rs1435066 rs10915424
rs10430923
rs6929078
rs4977574
rs13150558
rs7092929 rs792747
rs2794467
rs8000245
rs16886072
rs9825379
rs1410811
rs1898162 rs2390024
rs11782634 rs913170
rs9386234
rs7809017
rs2405781
rs140174
rs12682841
rs11861962
rs11859036
rs668204
rs1484948
rs17364464
rs3771395 rs941567
rs1549318
rs17291650
rs979976
rs343079
rs4794665 rs9318225 rs7660418
rs3847375
rs11900940 rs6564651
rs6480314 rs6563943 rs989548
rs1572072
rs274917
rs4072683
rs2188857
rs2376999
rs7000183
rs6036896
rs13167932 rs952361rs17288067
rs1281317
rs16907259
rs2767000
rs11062784
rs1870301
rs2501968 rs10502182 rs1968011 rs1019156
rs12583288 rs7332115
rs7698623 rs12579680
rs2305707
rs1315134
rs4130328
rs12931996
rs10514431 rs9304456
rs12970134
rs565659rs1053049
rs7404645
rs2495699
rs9848261
rs4648011 rs7027110
rs756202
rs10505784
rs2839670
rs1532358
rs17117825
rs2273301
rs1998038
rs6792584 rs12446047
rs463235
rs10511904
rs10496166
rs7283906 rs11763147
rs11749320 rs10758892 rs400337
rs2869832
rs10514995
rs2967055
rs342169rs8042680
rs6981943
Fig. 3. The SEN of Glaucoma. The network includes 713 SNPs (vertices) and 789 pairwise interactions(edges). The size of a vertex represents the strength of the main effect of its corresponding SNP, with thedisease association ranging from �0.001% to 1.124%. The width of an edge indicates the strength of itscorresponding interaction, with the disease association ranging from 0.693% to 1.163%.
degree
frequency
1 2 3 4 5 6 7 8
0
50
100
150
200
250
betweenness
frequency
0.0 0.1 0.2 0.3 0.4 0.5
0
100
200
300
400
500
closeness
frequency
0.03 0.04 0.05 0.06 0.07 0.08
0
20
40
60
80
100
120
140
(a) (b) (c)
Fig. 4. The distributions of (a) degree, (b) betweenness, and (c) closeness centralities of vertices in the SENof Glaucoma.
large connected SNP network indicated a complex genetic basis of glaucoma.HPN is an computational model that systematically organizes and clusters various pheno-
types and diseases based on their shared genetic association factors or related basic functionalunits. It also serves a powerful knowledge-based filter for GWAS data pre-screening and pri-oritization. Indeed, when compared to established data-driven filters, including the family ofRelief algorithms, the HPN filtering performed equally well. This was evaluated by quantifyingall the pairwise interactions of filtered sets of SNPs using different data-driven filters (datanot shown).
SEN is able to detect and analyze genetic interactions among a large set of attributes ingenetic association studies. The derived SNP interaction network of glaucoma in this studyhad a significant connected structure and may serve as a map for identifying key geneticfactors associated with the disease with further biological validations. The significant negativemain effect assortativity of such a network indicated that epistatic interactions were likely tohappen between SNPs with negatively correlated main effects. This finding suggests that mostexisting main-effect-based GWAS data filtering algorithms may overlook potential importantinteractions since some SNPs with low main effects would not be pre-selected using such filters.
The set of SNPs with highest ranked centralities were annotated using Biofilter33 to theirassociated genes and, in turn, the genes to pathways and functional groups. We used theannotation to identify other complex diseases possibly sharing biology with glaucoma andsuggest novel hypotheses for undocumented shared genetic interactions.
It is known that glaucoma and type II diabetes (T2D) are associated, but direct geneticrelationship remains unknown. We found SNPs connecting T2D to glaucoma: rs1333040 (CD =
5, CB = 0.043) and rs1053049 (CD = 5). The genes CDKN2B-AS1 and PPARD, which these twoSNPs are respectively located in, are known to be associated with diabetes. Peng et al. observedthat CDKN2A/B gene had a 1.17-fold (95% CI: 1.1-1.23) risk estimate for T2D.34 PPARDhas been found to be associated with higher fasting glucose, glycated hemoglobin (HbA1c),and increased risk of T2D and combined impaired fasting glucose/T2D in a population-basedChinese Han sample.35 SNP rs9540221 (CD = 5) is also intergenic between NFYAP1 and

LGMNP1, of which the former has also been associated with diabetes and obesity. Indeed,population-based studies suggest that persons with T2D have an increased risk of developingopen-angle glaucoma (OAG): the Beaver Dam Eye Study,36 the Framingham Eye Study,37
and the Los Angeles Latino Eye Study.38 Chopra et al. has noted that there is a positiveassociation between T2D and OAG in a sample Latino population study in Los Angeles,USA.38 The Rotterdam Study39 has also previously reported a positive association betweenDM and OAG, with a relative risk of 3.11 (95% CI, 1.12-8.66). Laboratory evidence for T2Dand glaucoma linkages also exists. Some have observed that there is an inner retinal celldeath, determined by the presence of hyaline bodies in the ganglion cell and retinal nerve fiberlayer of the eyes of post-mortem eyes of patients with T2D.40 Possible hypotheses of T2D toglaucoma direct linkage include how altered biochemical pathways and vascular changes inT2D reduce blood flow and impaired oxygen diffusion, thus increasing oxidative stress andendothelial cell injury.41 Excessive glial cell activation may contribute to chronic inflammation,making the retinal ganglion cells more susceptible to glaucomatous damage.42 Connectivetissue remodeling might also promote increased intraocular pressure (IOP) and greater opticnerve head mechanical stress, which can result in glaucomatous optic neuropathy.43 Diabetesis known to cause microvascular damage and may affect the vascular autoregulation of theoptic nerve and retina. Thus a longer duration of T2D would be associated with a higher riskof OAG.
Obesity, like T2D, is a trait often associated with glaucoma, but whose connection remainselusive. We found associations between obesity and glaucoma in SNPs rs12970134 (CD =
5, CC = 0.062), rs11807640 (CD = 8, CB = 0.516, CC = 0.071), rs9540221 (CD = 5), rs10777845(CD = 5), and rs4365558 (CD = 5, CC = 0.063), all of which showed significance in our glaucomastudy. SNP rs12970134 is located upstream of gene MC4R, the defects of which have beenidentified as a cause for autosomal dominant obesity.44 SNP rs11807640 is located downstreamto gene CDK4PS, which has been associated with obesity traits among some postmenuposalwomen.45 Both rs9540221, which is intergenic between NFYAP1 and LGMNP1 and rs4365558,which is intergenic between A4GALT and RPL5P34, are SNPs situated between genes thathave been associated with obesity as well. Finally, rs10777845 is upstream to gene RMST,which has been observed to be associated with severe early-onset obesity.46 In the investigationto determine direct linkage between glaucoma and obesity, several hypotheses exist. Newman-Casey et al. observed that not only was the frequency of OAG was higher among obeseindividuals (3.1%) than among non-obese individuals (2.5%), but that the relationship betweenOAG and obesity had significant correlations with gender.47 Obese women had a 6% increasedhazard of developing OAG when compared to non-obese women, while there was no significanteffect in men. Similar findings were made by Zang and Wynder, in which they observed OAGdiagnosis as twice as likely in women with a body mass index (BMI) above 27.5, but no impactof BMI in men.48 Some hypothesize that increased orbital pressure as a result of excess fattissue may cause a rise in venous pressure and a consequent increase in intraocular pressure(IOP).47
Our study also show links between Alzheimer’s disease (AD) and glaucoma. The SNPrs803422 (CD = 5, CC = 0.060), which we found to affect glaucoma is also associated with
AD. In addition, the two genes SORCS3 and MTHFD1L which contain two of the SNPs withthe strongest association are also known to be associated with AD. Patients with AD havea significantly increased rate of glaucoma occurrence. In a study in four nursing homes inGermany, 112 Alzheimer’s patients were taken as a case group. 29 of those 112 were found tohave Glaucoma, a rate of 25.9% as opposed to a 5.2% rate in the control group.49 However,in spite of significant research on this topic, there have still been no clear clinical or geneticrelationships found between the two diseases.50
Perhaps unsurprisingly, our research has also led to us connecting glaucoma with otherphenotypes relating to the eye, particularly cataracts and myopia. The association betweencataracts and glaucoma can be seen in the similar genes CDK4PS , NFYAP1, and LGMNP1,all of which contain SNPs found to be highly associated with glaucoma. Myopia and glaucomaare both directly related to the SNP rs569688 (CB = 0.415, CC = 0.074). There have been manyrecent studies about the connection between glaucoma and myopia, particularly primary open-angle glaucoma (POAG) and high myopia. Though the connection has still not been found, itis believed the high myopia is another risk factor of POAG, though it is not as important asintraocular pressure. However, it is recommended that those with high myopia be screen forglaucoma more frequently.51
Of the SNPs and genes associated to glaucoma in our study, the majority that are notdirectly eye-related, are heart related. Glaucoma is connected therefore probably connectedto cardiovascular disease, coronary artery disease, and coronary restenosis. SNPs rs17034592(CD = 7, CC = 0.060) and loci LDB2, CDKN2B and TRNAQ46P are all associated withcoronary artery disease. SNPs rs499818 (CD = 5, CC = 0.052), rs1333040 (CD = 5, CC = 0.052),and loci A4GALT, RPL5P34, and CST7 are all associated with myocardial infarction, andA4GALT and RPL5P34 are associated with cardiovascular disease. Studies have shown thatcardiovascular disease may play an important role in the development and progression ofglaucoma. However, it is also hypothesized that this relationship may be indirect, due tothe variable of age.52 Additional studies about the relationship between intraocular pressure,the main risk factor for glaucoma, and cardiovascular disease exist. However, any geneticrelationship between these two diseases is yet to be found.
An undocumented interaction found in this study is the link between glaucoma and col-orectal carcinoma. Relevant SNPs that were significant were rs972869 (CD = 7, CC = 0.052),located near the EPHB1 gene, and rs300493 (CD = 6, CB = 0.311, CC = 0.066), located inthe gene NAV3, both of which are linked to colorectal carcinoma. Studies have shown thatobesity and T2D are associated risks of colorectal cancer, which could lead to the hypothesisthat colorectal carcinoma and glaucoma may be co-morbidities and are affected by similarpathways.
In summary, the successful application of our methodology on GLAUGEN GWAS dataproves the effectiveness of our bioinformatics framework, and suggests its great potential indetecting and characterizing gene-gene interactions in GWAS data. In future studies, we expectto extend the interaction analysis beyond the order of pairs. The increased computationaldemand would, however, require a stricter data pre-filtering. The more stringent SNP filteringcan be achieved using a HPN based on SNP overlap to restrict the interactions to the most
significant ones. Other avenues of research would include using eye-specific tissue genotypedata to further refine the analysis and the drug response of the nodes of interest.
Acknowledgements
This work was supported by the National Institute of Health (NIH) grants R01-EY022300,R01-LM010098, R01-LM009012, R01-AI59694, P20-GM103506, P20-GM103534.
References
1. R. Sachidanandam, D. Weissman, S. C. Schmidt, J. M. Kakol, L. D. Stein and et al., Nature409, 928 (2001).
2. W. Y. S. Wang, B. J. Barratt, D. G. Clayton and J. A. Todd, Nature Review Genetics 6, 109(2005).
3. H. J. Cordell, Human Molecular Genetics 11, 2463 (2002).4. J. H. Moore, Nature Genetics 37, 13 (2005).5. N. A. Davis, J. E. Crowe Jr., N. M. Pajewski and B. A. McKinney, Genes and Immunity 11,
630 (2010).6. T. Hu and J. H. Moore, Network modeling of statistical epistasis, in Biological Knowledge Dis-
covery Handbook: Preprocessing, Mining, and Postprocessing of Biological Data, eds. M. Elloumiand A. Y. Zomaya (Wiley, 2013) pp. 175–190.
7. A. Pandey, N. A. Davis, B. C. White, N. M. Pajewski, J. Savitz, W. C. Drevets and B. A.McKinney, Translational Psychiatry 2, p. e154 (2012).
8. J. L. Wiggs, M. A. Hauser, W. Abdrabou, R. R. Allingham, D. L. Budenz, E. Delbono, D. S.Friedman, J. H. Kang, D. Gaasterland, T. Gaasterland, R. K. Lee, P. R. Lichter, S. Loomis,Y. Liu, C. McCarty, F. A. Medeiros, S. E. Moroi, L. M. Olson, A. Realini, J. E. Richards, F. W.Rozsa, J. S. Schuman, K. Singh, J. D. Stein, D. Vollrath, R. N. Weinreb, G. Wollstein, B. L.Yaspan, S. Yoneyama, D. Zack, K. Zhang, M. Pericak-Vance, L. R. Pasquale and J. L. Haines,J Glaucoma 22, 517 (Sep 2013).
9. M. Takamoto and M. Araie, Ophthalmology Journal 58, 1 (2014).10. J. H. Fingert, Eye (Lond) 25, 587 (May 2011).11. K.-I. Goh, M. E. Cusick, D. Valle, B. Childs, M. Vidal and A.-L. Barabasi, Proceedings of the
National Academy of Sciences 104, 8685 (2007).12. C. Darabos, K. Desai, R. Cowper-Sallari, M. Giacobini, B. Graham, M. Lupien and J. Moore,
Lecture Notes in Computer Science 7833, 23 (2013).13. C. Darabos, M. J. White, B. E. Graham, D. N. Leung, S. Williams and J. H. Moore, BioData
Mining 7, p. 1 (Jan 2014).14. H. Li, Y. Lee, J. L. Chen, E. Rebman, J. Li and Y. A. Lussier, Journal of the American Medical
Informatics Association : JAMIA 19, 295 (January 2012).15. D. Welter, J. MacArthur, J. Morales, T. Burdett, P. Hall, H. Junkins, A. Klemm, P. Flicek,
T. Manolio, L. Hindorff and H. Parkinson, Nucleic Acids Res 42, D1001 (Jan 2014).16. T. Hu, N. A. Sinnott-Armstrong, J. W. Kiralis, A. S. Andrew, M. R. Karagas and J. H. Moore,
BMC Bioinformatics 12, p. 364 (2011).17. T. Hu, Y. Chen, J. W. Kiralis and J. H. Moore, Genetic Epidemiology 37, 283 (2013).18. T. M. Cover and J. A. Thomas, Elements of Information Theory: Second Edition (Wiley, 2006).19. A. Jakulin and I. Bratko, Analyzing attribute dependencies, in Proceedings of the 7th European
Conference on Principles and Practice of Knowledge Discovery in Databases (PKDD 2003), ,Lecture Notes in Artificial Intelligence Vol. 2838 (Springer-Verlag, 2003).

20. J. H. Moore, J. C. Gilbert, C.-T. Tsai, F.-T. Chiang, T. Holden, N. Barney and B. C. White,Journal of Theoretical Biology 241, 252 (2006).
21. D. Anastassiou, Molecular Systems Biology 3, p. 83 (2007).22. J. H. Moore, N. Barney, C.-T. Tsai, F.-T. Chiang, J. Gui and B. C. White, Human Heredity 63,
120 (2007).23. B. A. McKinney, J. E. Crowe, J. Guo and D. Tian, PLoS Genetics 5, p. e1000432 (2009).24. M. E. J. Newman, Networks: An Introduction (Oxford University Press, 2010).25. M. E. J. Newman, Physical Review Letters 89, p. 208701 (2002).26. L. C. Freeman, Sociometry 40, 35 (1977).27. A. Bavelas, Journal of the Acoustical Society of America 22, 725 (1950).28. G. Sabidussi, Psychometrika 31, 581 (1966).29. J. H. Moore and B. C. White, Lecture Notes in Computer Science 4447, 166 (2007).30. C. S. Greene, N. M. Penrod, J. Kiralis and J. H. Moore, BioData Min 2, p. 5 (2009).31. X. Sun, Q. Lu, S. Mukheerjee, P. K. Crane, R. Elston and M. D. Ritchie, Front Genet 5, p. 106
(2014).32. C. International HapMap, Nature 437, 1299 (Oct 2005).33. S. A. Pendergrass, A. Frase, J. Wallace, D. Wolfe, N. Katiyar, C. Moore and M. D. Ritchie,
BioData Min 6, p. 25 (2013).34. F. Peng, D. Hu, C. Gu, X. Li, Y. Li, N. Jia, S. Chu, J. Lin and W. Niu, Gene 531, 435 (Dec
2013).35. L. Lu, Y. Wu, Q. Qi, C. Liu, W. Gan, J. Zhu, H. Li and X. Lin, PLoS One 7, p. e34895 (2012).36. B. E. Klein, R. Klein and S. C. Jensen, Ophthalmology 101, 1173 (Jul 1994).37. P. Mitchell, W. Smith, T. Chey and P. R. Healey, Ophthalmology 104, 712 (Apr 1997).38. V. Chopra, R. Varma, B. A. Francis, J. Wu, M. Torres and S. P. Azen, Ophthalmology 115, 227
(Feb 2008).39. S. de Voogd, M. K. Ikram, R. C. W. Wolfs, N. M. Jansonius, J. C. M. Witteman, A. Hofman
and P. T. V. M. de Jong, Ophthalmology 113, 1827 (Oct 2006).40. J. R. Wolter, Am J Ophthalmol 51, 1123 (May 1961).41. V. H. Y. Wong, B. V. Bui and A. J. Vingrys, Clin Exp Optom 94, 4 (Jan 2011).42. M. Nakamura, A. Kanamori and A. Negi, Ophthalmologica 219, 1 (Jan-Feb 2005).43. V. C. Lima, T. S. Prata, C. G. V. De Moraes, J. Kim, W. Seiple, R. B. Rosen, J. M. Liebmann
and R. Ritch, Br J Ophthalmol 94, 64 (Jan 2010).44. K. M. Ling Tan, S. Q. D. Ooi, S. G. Ong, C. S. Kwan, R. M. E. Chan, L. K. Seng Poh, J. Mendoza,
C. K. Heng, K. Y. Loke and Y. S. Lee, J Clin Endocrinol Metab 99, E931 (May 2014).45. P. Coveney and R. Highfield, Frontiers of Complexity: The Search for Order in a Chaotic World
(Faber and Faber, London, 1995).46. E. Wheeler, N. Huang, E. G. Bochukova, J. M. Keogh, S. Lindsay, S. Garg, E. Henning, H. Black-
burn, R. J. F. Loos, N. J. Wareham, S. O’Rahilly, M. E. Hurles, I. Barroso and I. S. Farooqi,Nat Genet 45, 513 (May 2013).
47. P. A. Newman-Casey, N. Talwar, B. Nan, D. C. Musch and J. D. Stein, Ophthalmology 118,1318 (Jul 2011).
48. E. A. Zang and E. L. Wynder, Nutr Cancer 21, 247 (1994).49. A. U. Bayer, F. Ferrari and C. Erb, Eur Neurol 47, 165 (2002).50. P. Wostyn, K. Audenaert and P. P. De Deyn, Br J Ophthalmol 93, 1557 (Dec 2009).51. S.-J. Chen, P. Lu, W.-F. Zhang and J.-H. Lu, Int J Ophthalmol 5, 750 (2012).52. S. S. Hayreh, Survey of Ophthalmology 43, Supplement 1, S27 (1999).