Genome Analysis of Latin American Cervical Cancer: Frequent Activation of the PIK3CA Pathway...
20
Genome Analysis of Latin American Cervical Cancer: Frequent Activation of the PIK3CA Pathway Supplementary Data Files in this Data Supplement: Supplementary Figure 1- Supplementary Figure 1. Sample and analyses diagram. Supplementary Figure 2- Supplementary Figure 2. Aggregate mutation spectrum of Guatemalan cervical tumors. Supplementary Figure 3- Supplementary Figure 3. Highly amplified regions of chromosome (Chr.) 2, 6 and 10 in tumor A4. Supplementary Figure 4- Supplementary Figure 4. Chromosome breakpoints in cervical tumors. Supplementary Figure 5- Supplementary Figure 5. PIK3CA mutation and pathology. Supplementary Figure 6- Supplementary Figure 6. Co-occurring mutations in the PIK3CA and PTEN genes. Supplementary Figure 7- Supplementary Figure 7. Sanger sequence concordance of mutant read percentage. Supplementary Figure 8- Supplementary Figure 8. Mutation Fraction of PIK3CA mutations. Supplementary Figure 9- Supplementary Figure 9. Age range associations with PIK3CA mutation and HPV type. Supplementary Figure 10- Supplementary Figure 10. PIK3CA and HPV E6 and E7 mRNA expression. Supplementary Figure 11- Supplementary Figure 11. Model of cervical cancer progression.
-
Upload
scot-atkinson -
Category
Documents
-
view
216 -
download
2
Transcript of Genome Analysis of Latin American Cervical Cancer: Frequent Activation of the PIK3CA Pathway...
Genome Analysis of Latin American Cervical Cancer: Frequent Activation of the PIK3CA PathwaySupplementary Data Files in this Data Supplement:
Supplementary Figure 1- Supplementary Figure 1. Sample and analyses diagram.Supplementary Figure 2- Supplementary Figure 2. Aggregate mutation spectrum of Guatemalan cervical tumors.Supplementary Figure 3- Supplementary Figure 3. Highly amplified regions of chromosome (Chr.) 2, 6 and 10 in tumor A4.Supplementary Figure 4- Supplementary Figure 4. Chromosome breakpoints in cervical tumors.Supplementary Figure 5- Supplementary Figure 5. PIK3CA mutation and pathology.Supplementary Figure 6- Supplementary Figure 6. Co-occurring mutations in the PIK3CA and PTEN genes.Supplementary Figure 7- Supplementary Figure 7. Sanger sequence concordance of mutant read percentage.Supplementary Figure 8- Supplementary Figure 8. Mutation Fraction of PIK3CA mutations.Supplementary Figure 9- Supplementary Figure 9. Age range associations with PIK3CA mutation and HPV type.Supplementary Figure 10- Supplementary Figure 10. PIK3CA and HPV E6 and E7 mRNA expression.Supplementary Figure 11- Supplementary Figure 11. Model of cervical cancer progression.
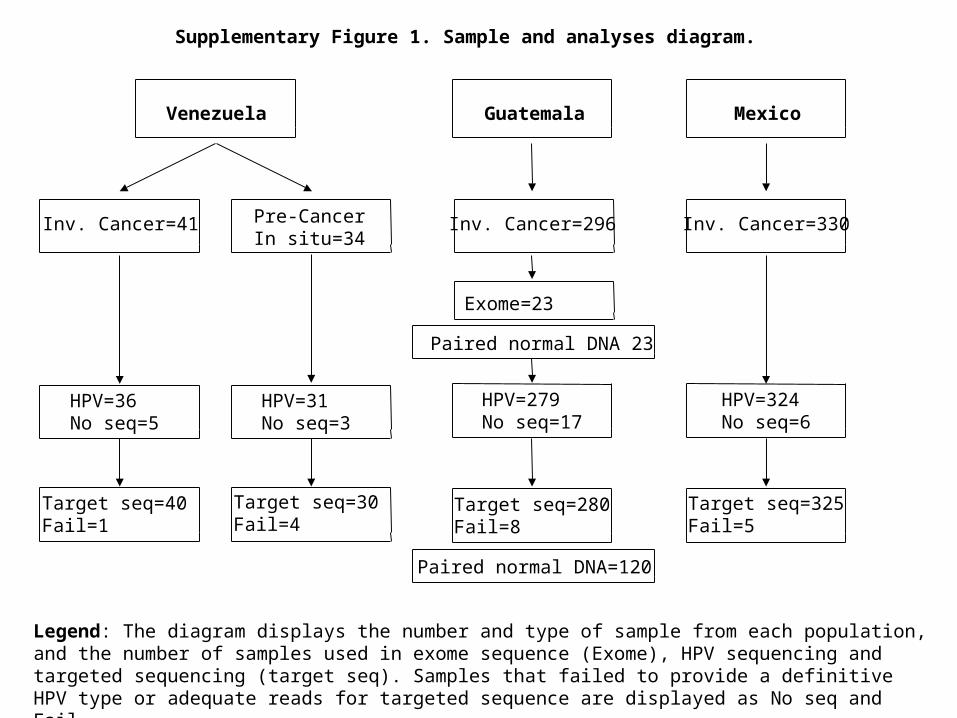
Supplementary Figure 1. Sample and analyses diagram.
Venezuela Guatemala Mexico
Inv. Cancer=41 Pre-CancerIn situ=34
HPV=36No seq=5
HPV=31No seq=3
Target seq=40Fail=1
Target seq=30Fail=4
Paired normal DNA=120
Inv. Cancer=296 Inv. Cancer=330
Exome=23
Paired normal DNA 23
HPV=279No seq=17
HPV=324No seq=6
Target seq=280Fail=8
Target seq=325Fail=5
Legend: The diagram displays the number and type of sample from each population, and the number of samples used in exome sequence (Exome), HPV sequencing and targeted sequencing (target seq). Samples that failed to provide a definitive HPV type or adequate reads for targeted sequence are displayed as No seq and Fail

Supplementary Figure 2. Aggregate mutation spectrum of Guatemalan cervical tumors.
Legend: The aggregate mutation spectrum of mutations of different type and context is shown. Predicted somatic mutations were categorized by mutation type and flanking sequence and displayed in aggregate for 23 tumors with exome sequence.

Supplementary Figure 3. Highly amplified regions of chromosome (Chr.) 2, 6 and 10 in tumor A4.
Chr. 2 Chr. 6 Chr. 10
Legend: Chromosome plots are displayed for a tumor (A4) with three amplified chromsosomal regions.

Supplementary Figure 4. Chromosome breakpoints in cervical tumors.
A9 B6 B5 A7 A3 A5 B4 A4 A2A11
B110
50
100
150
200
250
300
ASC AC SC
Ch
rom
oso
me
Ab
no
rma
lite
s
Legend: Total number of chromosomal breakpoint was determined by ngCGH (See Methods) for each tumor is displayed. ASC represent Adenosquamous, AC represent Adenocarcinoma and SC represent Squamous.

Supplementary Figure 5. PIK3CA mutation and pathology
Legend: The percentage of PIK3CA mutations are shown separately for each major histological type. Squamous tumors have significantly higher levels of helical mutations (residues E542 and E545); X2=5.7, P=0.017 for squamous and adeno tumors vs. helical mutations and non-helical mutations.
Helical otherSquamous 132 20Adeno 14 7

Supplementary Figure 6. Co-occurring mutations in the PIK3CA and PTEN genes.
ABD RBD C2 Helical Kinase1 108 191 696330291 525480 1068

A B
E542K_E545Q cisE542Q_E545K cis
Supplementary Figure 6. Co-occurring mutations in the PIK3CA and PTEN genes

C D
E542K/Q546R transE542K/E545K trans
Supplementary Figure 6. Co-occurring mutations in the PIK3CA and PTEN genes

Supplementary Figure 6. Co-occurring mutations in the PIK3CA and PTEN genes
E
E542K/E547D cis

F G
Supplementary Figure 6. Co-occurring mutations in the PIK3CA and PTEN genes
E542K/E545K cis
E453K_D454Y cis

H
PTEN R130L/F154I trans
Legend: Eight examples are shown of unique combinations of adjacent mutations in the PIK3CA helical domain involving residues 542-547 (A-G) and the PTEN gene (H). The sequence reads are displayed above the reference DNA and protein sequence (red reads are forward; blue, reverse). Mutations are observed that are on the same strand (cis) or different strands (trans). A, E542Q_E545K in cis; B, E542K_E545Q in cis; C, E542K/E545K in trans; D, E542K_Q546R in trans (blue circle is the rare E542K found in 1% of reads in this sample, and red circles the Q546K reads found at 6%); E, E542K_E547D in cis; F, E542K and E545K in cis; G, E453K and D454Y in cis; H, PTEN R130L and F154I in trans.

Supplementary Figure 7. Sanger sequence concordance of mutant read percentage.
R38H 41% mutant by AmpliSeq; 31-37% by Sanger
A

Supplementary Figure 7. Sanger sequence concordance of mutant read percentage.
B C
E545KNG=5%, Sanger ~5%
E545K NG=15%, Sanger 17-20%

Legend Supplementary Figure 7: Three examples are shown of mutations in the PIK3CA gene at differing percentages of mutant reads, and the corresponding Sanger sequencing traces. A, A R38H mutation seen in 41% of mutant reads by AmpliSeq was observed to have a 31% drop in wt signal in the forward direction and 37% drop in the reverse direction (from the Mutation Surveyor software.) B, E545K mutation seen at 15% by Next-generation sequence (NG) and 17-20% by Sanger sequencing; C, E545K detected in 5% of mutant reads and called in the next-generation sequence, not called by Mutation Surveyor, but visible in the sequence traces (red circles).

E542K Mut E545K Mut Other0
5
10
15
20
253-10%
11-20%
20-33%
>33%
Mu
tati
on
fra
cti
on
(%
)
Supplementary Figure 8. Mutation Fraction of PIK3CA mutations.
E542K E545K0
0.05
0.1
0.15
0.2
0.25
Mu
tati
on
Fra
cti
on
A
B
Legend: Mutation fraction of PIK3CA mutations. A) The number of tumors with PIK3CA mutations at different mutation fraction is shown for E542K, E545K, and others. B) The mutation fraction of each mutation is displayed for tumors with E542K-E545K double mutants.

Supplementary Figure 9. Age range associations with PIK3CA mutation and HPV type.
A.
B.

Supplementary Figure 9. Age range associations with PIK3CA mutation and HPV type.
C.
Legend: Age groups of cervical tumor patients. A) The frequency of PIK3CA mutation by age group is displayed. The mean ages are 49.1 for non-mutated and 53.8 for mutated, which is a statistically significant difference (P=0.001). B. Relation of major HPV type with age. C. Percentage of total somatic driver mutations by age group and stage for squamous carcinomas. Subjects sampled under age 50 have a significantly lower percentage [X2=31, P= 2.1 E-08].

Supplementary Figure 10. PIK3CA and HPV E6 and E7 mRNA expression.
A B
Legend: A, PIK3CA mRNA expression levels are significantly higher in HPV16 positive tumors with mutated PIK3CA than with wild-type PIK3CA, as determined by quantitative RT-PCR (P = 0.029). B, Differences in E6 and E7 mRNA expression levels between wild-type PIK3CA (PIK3CA _WT) and mutant PIK3CA (PIK3CA _MT) in HPV16 positive cervical tumors. The E7 expression level in PIK3CA_MT is significantly higher than in PIK3CA_WT (P = 0.040). Primer sequences were GAGCGACCCAGAAAGTTACCA (forward) and AAA TCC CGA AAA GCA AAG TCA (reverse) for E6 HPV16; TCC AGC TGG ACA AGC AGA AC (forward) and CAC AAC CGA AGC GTA GAG TC (reverse) for E7 HPV16; AAT AAG GTG CCT GCG GTG (forward) and CTT GTG TTT CTC TGC GTC GT (reverse) for E6 HPV18; AAC ATT TAC CAG CCC GAC GA (forward) and TCG TCT GCT GAG CTT TCT AC (reverse) for E7 HPV18.

HPV Infection
E6, E7
PIK3CA
Metastasis
PI3K-downstream Pathway Activation
HPV Integration/Chromosome 3q Duplication/
PIK3CA Mutation
1. Gain C ˃ Mutation
W
3q Gain mutation
W W M ≤33% readsPIK3CA
2. Mutation C ˃ Amplification
W
mutation
WM WM M> 66% readsPIK3CAPIK3CA
amplification
Supplementary Figure 11. Model of cervical cancer progression.
W
Legend: Model for the role of PIK3CA up-regulation and mutation in invasive cervical cancer. The expression of the HPV E6/E7 is crucial for HPV-induced cervical cancer transformation, and leads to elevated PIK3CA expression. Duplication of one copy of chromosome 3q may precede PIK3CA mutations or duplication may occur on a wild-type allele (1) and yield a tumor with <33% PIK3CA mutant fraction; or PIK3CA mutation can occur before amplification of chromosome 3q. (2) leading a >66% mutant fraction. Permanent activation of the PI3K-downstream signaling pathway by mutation helps drive invasion and eventual metastatic spread.