
Genetic modification of flux (GMF) for flux prediction of mutants Kyushu Institute of Technology...
43
Genetic modification of flux (GMF) for flux prediction of mutants Kyushu Institute of Technology Quanyu Zhao, Hiroyuki Kurata
-
Upload
preston-james -
Category
Documents
-
view
219 -
download
0
Transcript of Genetic modification of flux (GMF) for flux prediction of mutants Kyushu Institute of Technology...
Genetic modification of flux (GMF) for flux prediction of
mutants
Kyushu Institute of TechnologyQuanyu Zhao, Hiroyuki Kurata

Topics
• Background of computational modeling of biological systems
• Elementary mode analysis based
Enzyme Control Flux (ECF)
Genetic Modification of Flux (GMF)
Our objectives
Quantitative modeling of metabolic networks is necessary for computer-aided rational design.
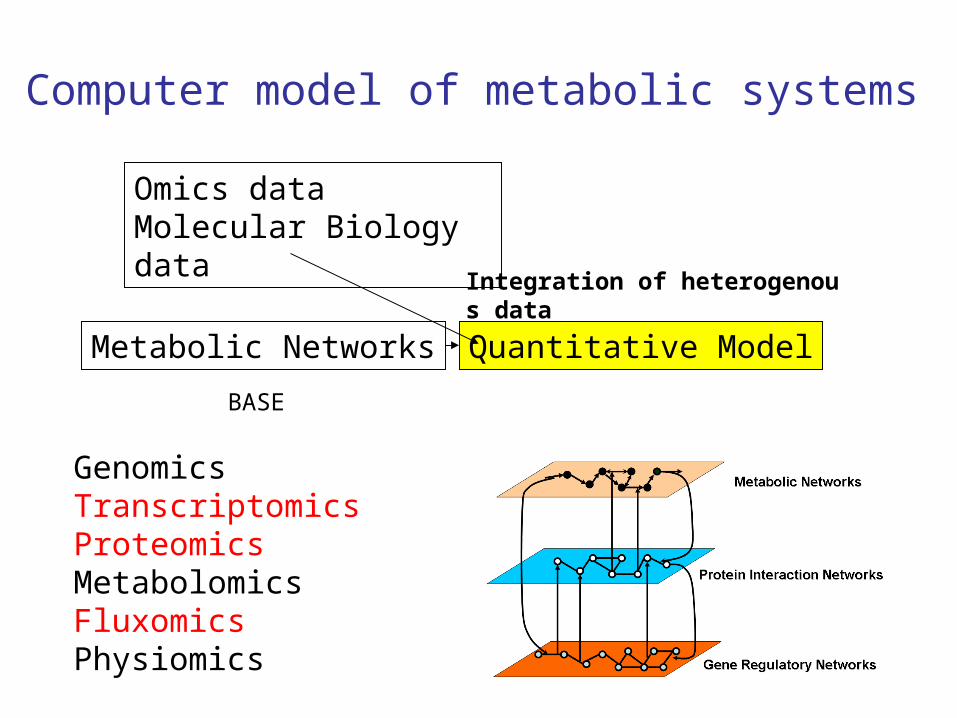
Computer model of metabolic systems
Metabolic Networks Quantitative Model
Omics data Molecular Biology data Integration of heterogenous data
BASE
GenomicsTranscriptomicsProteomicsMetabolomicsFluxomicsPhysiomics
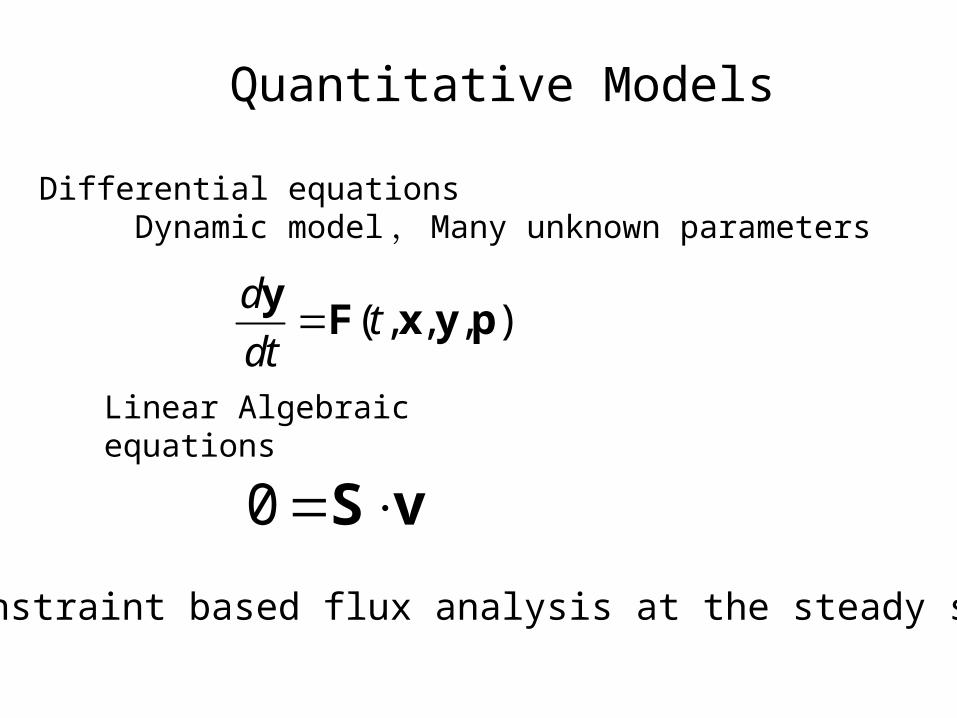
Differential equationsDynamic model , Many unknown parameters
Quantitative Models
Linear Algebraic equations
( , , , ) d
tdt
y
F x y p
0 S v
Constraint based flux analysis at the steady state

S Stoichiometric matrix v flux distribution
Constraint
Prediction of a flux distribution at the steady state
X1
X2
X3
100 v1
v2
v3
v4
v5
v6
1
21
32
43
5
6
0 1 1 1 0 0 0
0 0 1 0 1 1 0
0 0 0 1 1 0 1
v
vX
vX
vX
v
v
5( )F vv
0 S v
Objective function
FLUX BALANCE ANALYSIS: FBA

For gene deletion mutants, steady state flux is predicted using Boolean Logic
0S v Method Optimization Algorithm
Additional information
rFBA (regulatory FBA)
Linear Programming Regulatory network(genomics)
SR-FBA (Steady-state Regulatory-FBA)
Mixed Integer Linear Programming
Regulatory network
MOMA (Minimization Of Metabolic
Adjustment)
Quadratic Programming
Flux distribution of wild type(fluxomics)
ROOM (Regulatory On/Off Minimization)
Mixed Integer Linear Programming
Flux distribution of wild type
Reactions for knockout gene = 0Other reactions =1
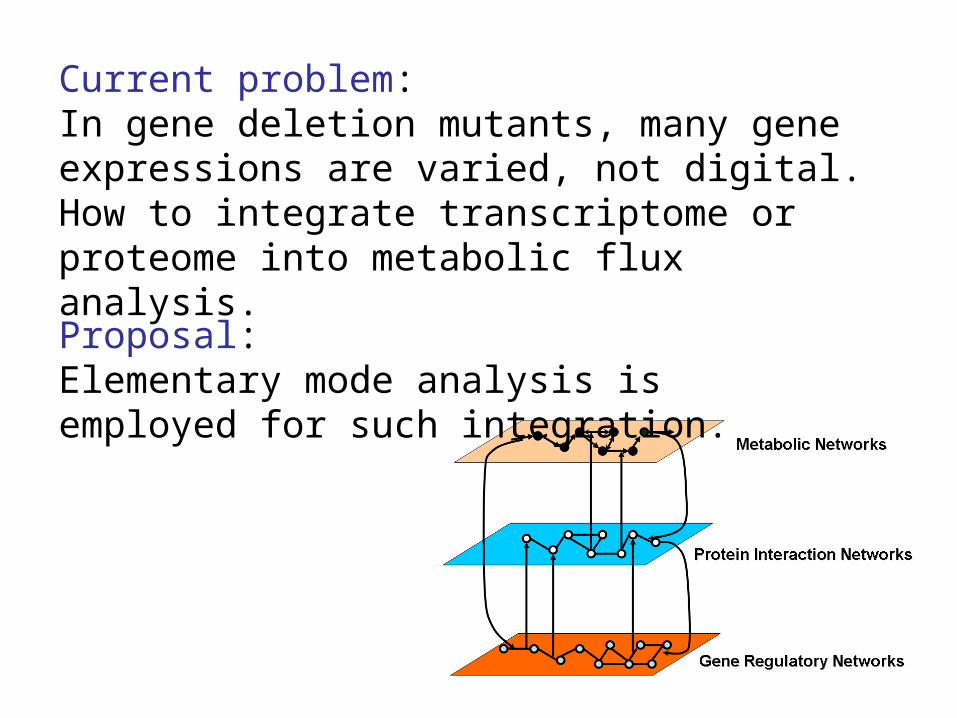
Current problem:In gene deletion mutants, many gene expressions are varied, not digital.How to integrate transcriptome or proteome into metabolic flux analysis.
Proposal:Elementary mode analysis is employed for such integration.
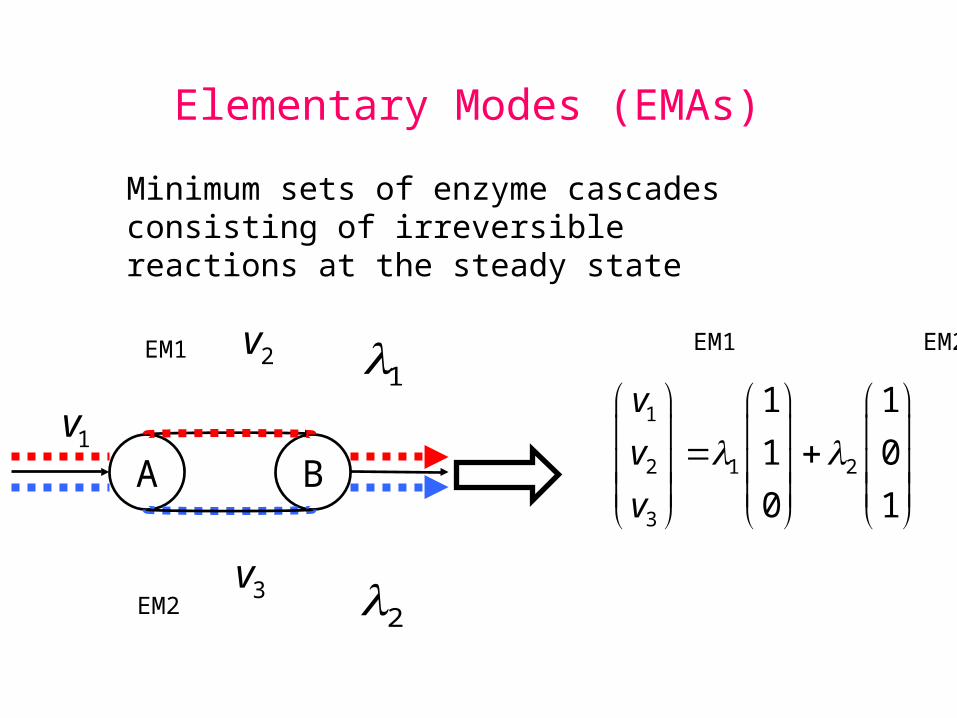
Elementary Modes (EMAs)
A B1v
3v
1
2
2v
1
2 1 2
3
1 1
1 0
0 1
v
v
v
EM1 EM2EM1
EM2
Minimum sets of enzyme cascades consisting of irreversible reactions at the steady state

X1
X2
X3
100
60
70
20
40 30
v1
v2
v3
v4
v5
v6
v7
30
Elementary Modes (Ems)
Stoichiometric Matrix
1
2
3
4
5
6
7
1
1 2
1 3
3 2
2
3
2 3
v X
v X X
v X X
v X X
v X
v X
v X X
1
2
3
4
5
EM
v P
Flux distribution
Elementary modematrix
Coefficients
1
2
3
4 1 2 3 4 5
5
6
7
1 1 1 1 0
1 0 0 1 0
0 1 1 0 0
0 0 1 0 1
1 0 1 0 0
0 1 0 1 0
0 0 0 1 1
v
v
v
v
v
v
v
1
2 1
3 2
4 3
5 4
6 5
7
1 1 1 1 0
1 0 0 1 0
0 1 1 0 0
0 0 1 0 1
1 0 1 0 0
0 1 0 1 0
0 0 0 1 1
v
v
v
v
v
v
v
1 1 1 1 1
100 1 1 1 1 0
60 1 0 0 1 0
40 0 1 1 0 0
( 30) (70 ) (60 ) ( 40)30 0 0 1 0 1
70 1 0 1 0 0
30 0 1 0 1 0
20 0 0 0 1 1
1 2 3 4 5
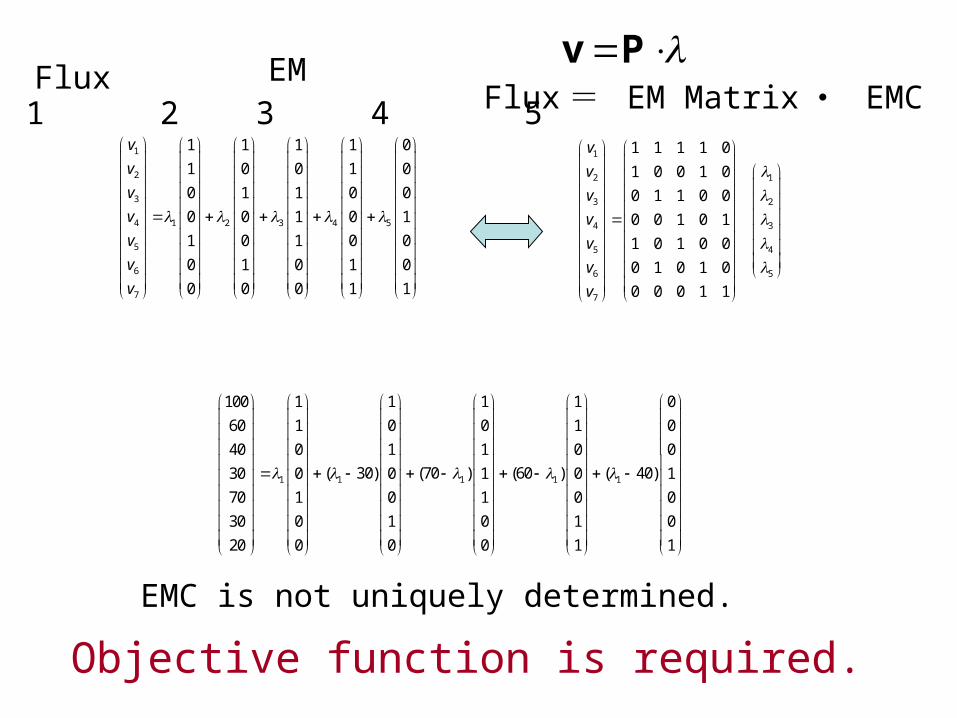
EMC is not uniquely determined.
EMFluxFlux = EM Matrix ・ EMC
v P
Objective function is required.
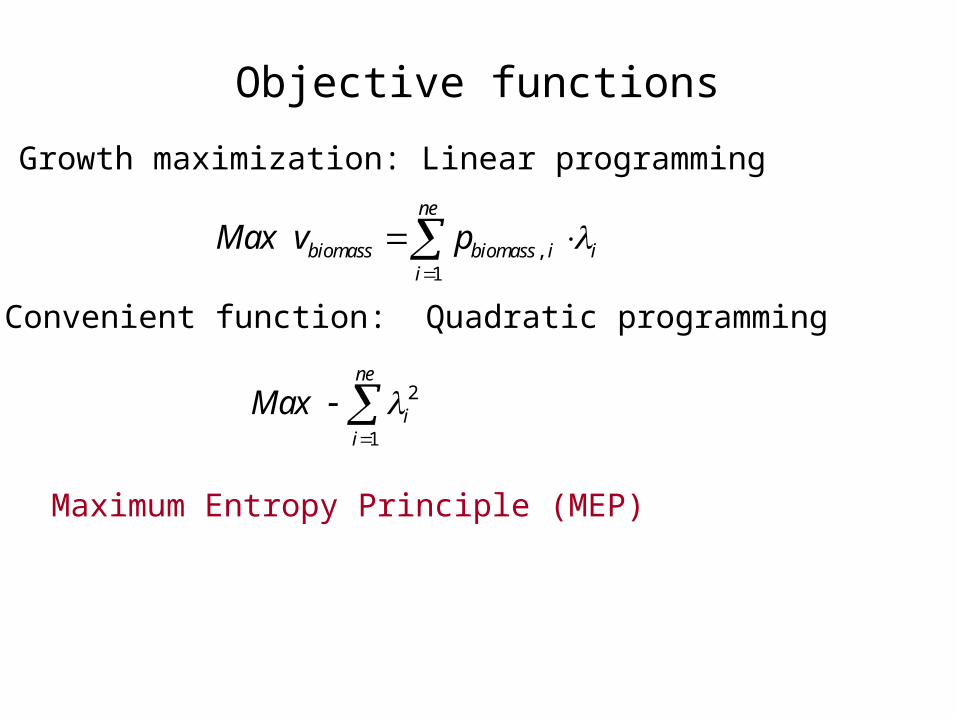
Objective functions
Growth maximization: Linear programming
Convenient function: Quadratic programming
2
1
ne
ii
Max
,1
ne
biomass biomass i ii
Max v p
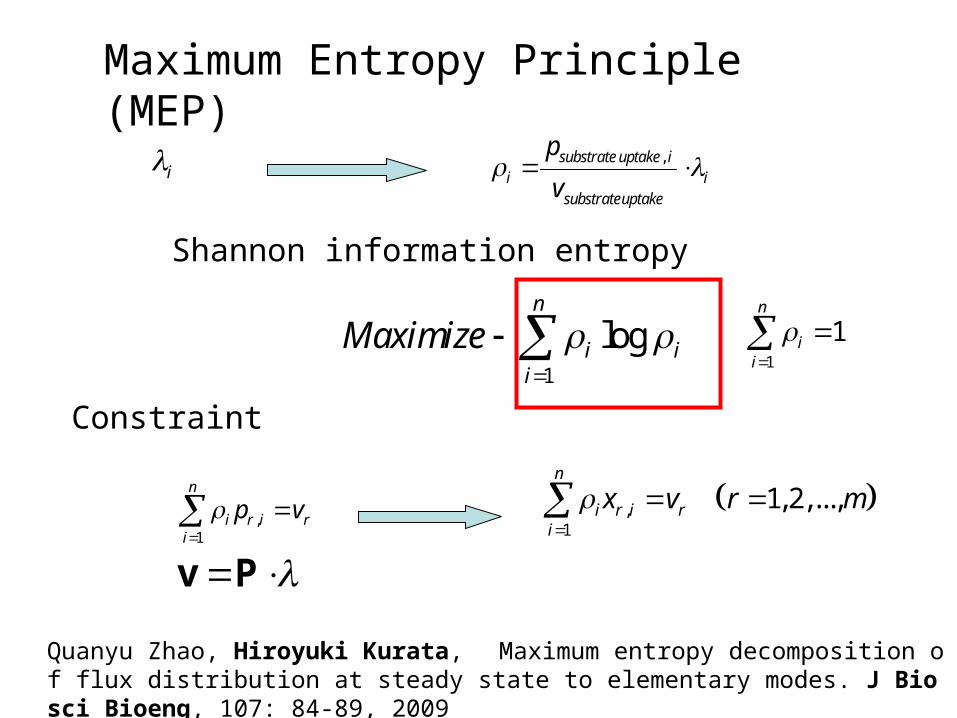
Maximum Entropy Principle (MEP)
1
logn
i ii
Maximize
i ,substrate uptake ii i
substrateuptake
p
v
1
1n
ii
,1
1,2,...,n
i r i ri
x v r m
Maximum Entropy Principle (MEP)
,1
n
i r i ri
p v
Shannon information entropy
Constraint
v P
Quanyu Zhao, Hiroyuki Kurata, Maximum entropy decomposition of flux distribution at steady state to elementary modes. J Biosci Bioeng, 107: 84-89, 2009

ECF integrates enzyme activity profiles into elementary modes.
ECF presents the power-law formula describing how changes in an enzyme activity profile between wild-type and a mutant is related to changes in the elementary mode coefficients (EMCs).
Enzyme Control Flux (ECF)
Kurata H, Zhao Q, Okuda R, Shimizu K. Integration of enzyme activities into metabolic flux distributions by elementary mode analysis. BMC Syst Biol. 2007;1:31.

Network model with flux of WT Enzyme activity profileMutant / WT
X1
X2
X3
100
60
70
20
40 30
v1
v2
v3
v4
v5
v6
v7
30
Estimation of a flux distribution of a mutant
Power-Law formula
Enzyme Control Flux (ECF)
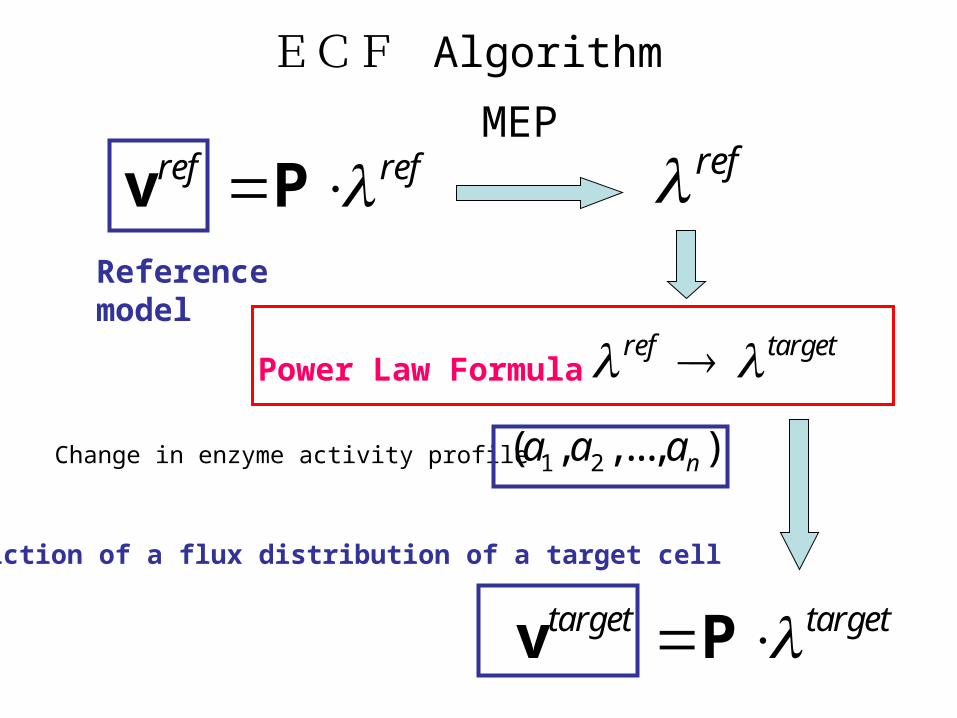
ref ref v PReference model
Power Law Formula
Change in enzyme activity profile
target target v P
Prediction of a flux distribution of a target cell
ref target
refMEP
1 2( , ,..., )na a a
ECF Algorithm

a1 a5a2
,1
mtarget refi i j i
j
a
,
,,
( 0)
1 ( 0)j j i
j ij i
a if p
if p
1
1
0
0
1
0
0
1
2
5
1
1
1
1
a
a
a
1 1 2 5( )target ref1 a a a
EMi
Power Law Formula
EMi
Enzyme activity profile
Optimal = 1
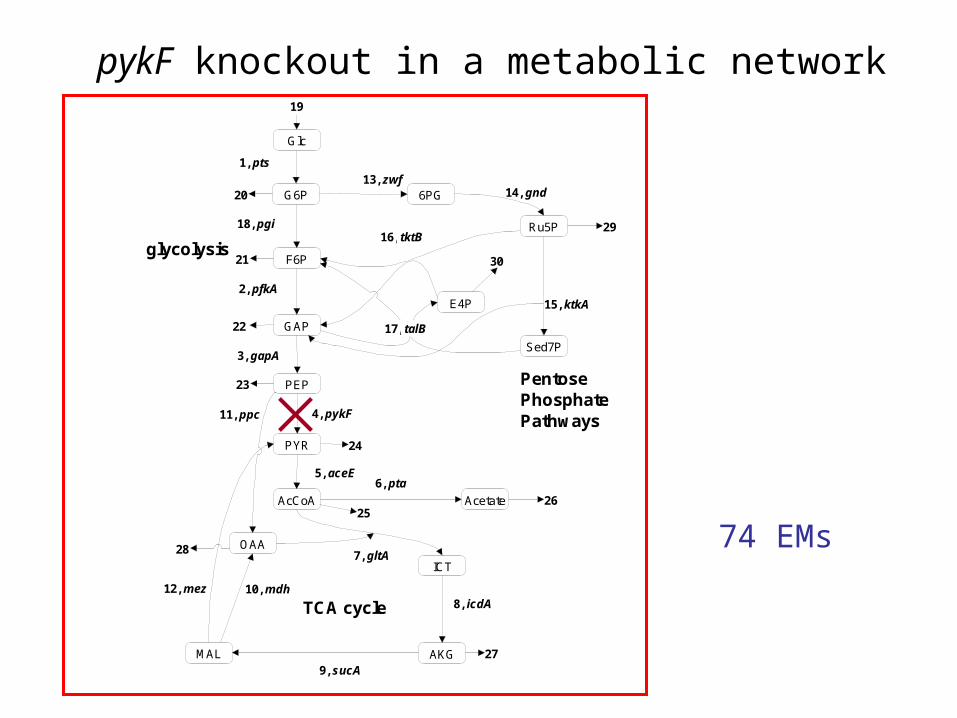
pykF knockout in a metabolic network
74 EMs
Glc
G6P
F6P
GAP
6PG
Ru5P
E4P
Sed7P
PEP
AcCoA
ICT
AKGMAL
OAA
Acetate
PYR
glycolysis
Pentose PhosphatePathways
TCA cycle
1, pts
2, pfkA
3, gapA
4, pykF
5, aceE6, pta
7, gltA
8, icdA
9, sucA
10, mdh
11, ppc
12, mez
18, pgi
13, zwf
15, ktkA
14, gnd
16, tktB
17, talB
19
20
21
22
24
25
29
30
27
28
23
26
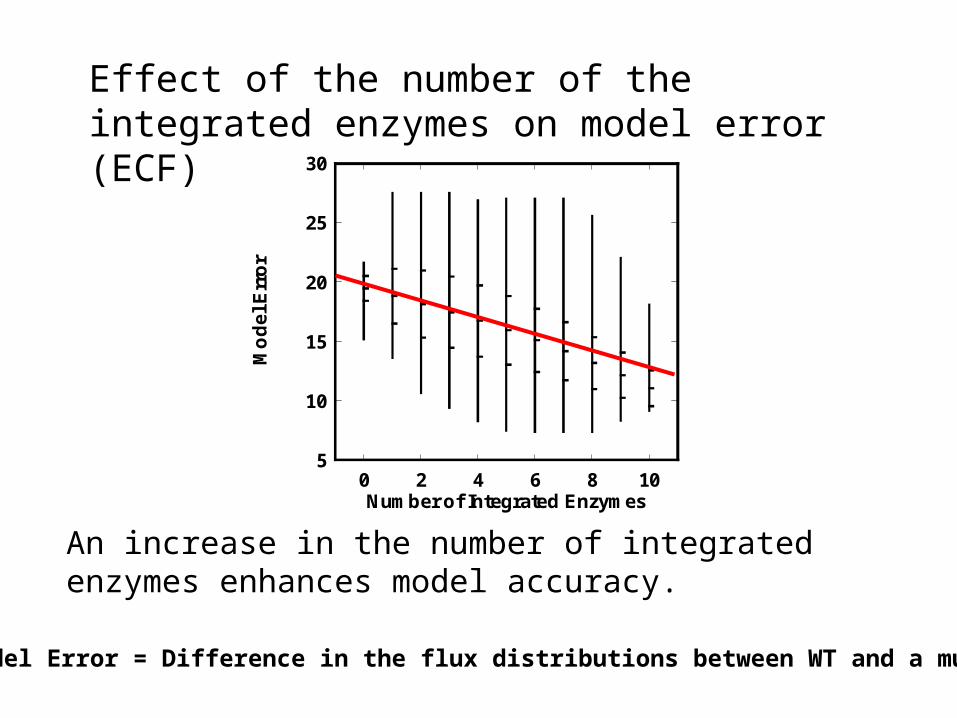
Effect of the number of the integrated enzymes on model error (ECF)
5
10
15
20
25
30
0 2 4 6 8 10
Mo
de
l Err
or
Number of Integrated Enzymes
An increase in the number of integrated enzymes enhances model accuracy.
Model Error = Difference in the flux distributions between WT and a mutant

Prediction accuracy of ECF
Gene deletion Number of enzymes used for
prediction
Prediction accuracy(control: no enzyme
activity profile is used)
pykF 11 +++
ppc 8 +++
pgi 5 +
cra 6 +++
gnd 4 +
fnr 6 +++
FruR 6 +++
ECF provides quantitative correlations between enzyme activity profile and flux distribution.
Summary of ECF
Genetic Modification of Flux
Quanyu Zhao, Hiroyuki Kurata, Genetic modification of flux for flux prediction of mutants, Bioinformatics, 25: 1702-1708, 2009
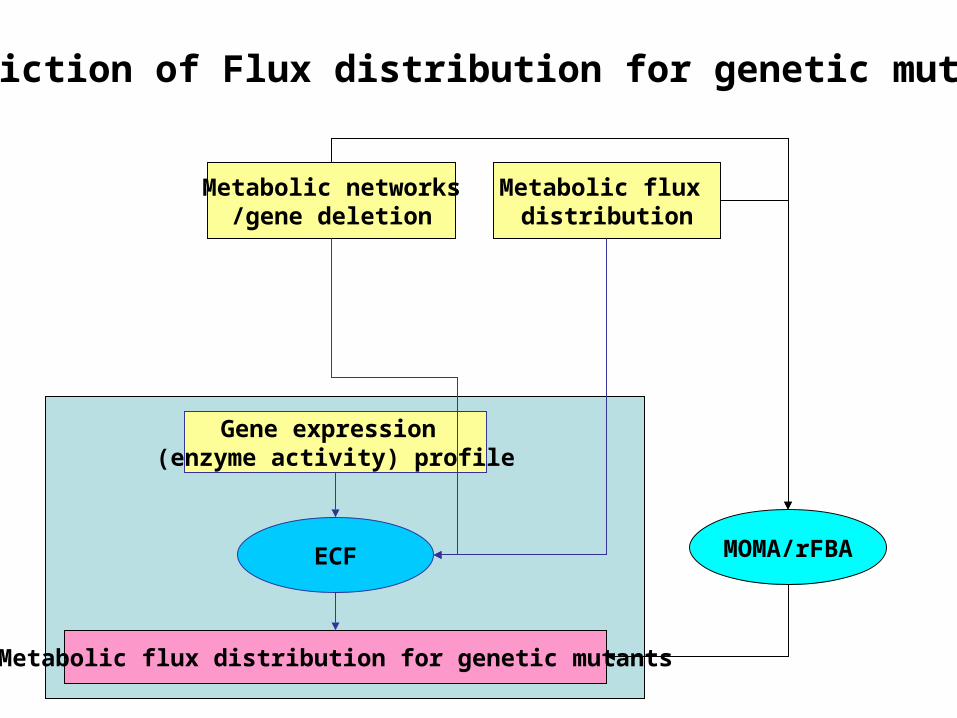
Gene expression (enzyme activity) profile
Metabolic networks/gene deletion
Metabolic flux distribution
Metabolic flux distribution for genetic mutants
ECF MOMA/rFBA
Prediction of Flux distribution for genetic mutants

Flow chart of GMF
Gene expression (enzyme activity) profile
Metabolic networks/genetic modification
Metabolic flux distribution
Metabolic flux distribution for genetic mutants
mCEF
ECF
Expected advantage of GMF
• Available to gene knockout,
over-expressing or under-expressing mutants
• MOMA/rFBA are available only for gene deletion, because they use Boolean Logic.

Control Effective Flux (CEF)
Transcript ratio for the growth on glycerol versus glucose
Stelling J, et al, Nature, 2002, 420, 190-193
( 2)( 1, 2)
( 1)i
ii
cef ss s
cef s
Transcript ratio of metabolic genes
CEFs for different substratesglucose, glycerol and acetate.
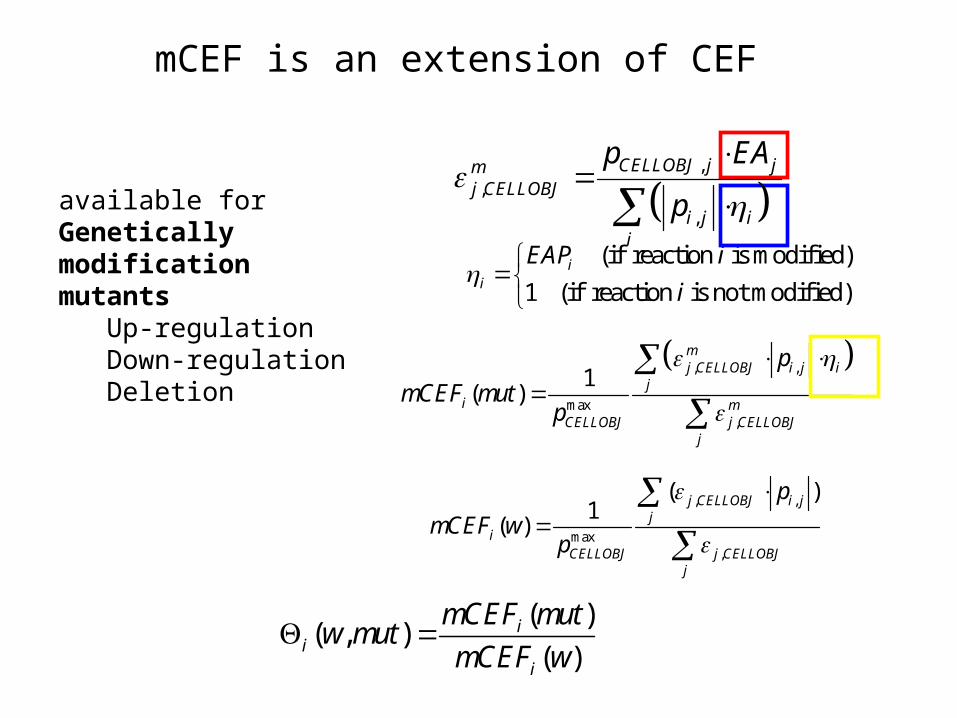
mCEF is an extension of CEF
(if reaction is modified)
1 (if reaction is not modified)i
i
EAP i
i
, ,
max,
( )1
( )j CELLOBJ i j
ji
CELLOBJ j CELLOBJj
p
mCEF wp
( )( , )
( )i
ii
mCEF mutw mut
mCEF w
,
,
,
CELLOBJ j jmj CELLOBJ
i j ii
p EA
p
, ,
max,
1( )
mj CELLOBJ i j i
ji m
CELLOBJ j CELLOBJj
p
mCEF mutp
available for Genetically modification mutants
Up-regulationDown-regulationDeletion
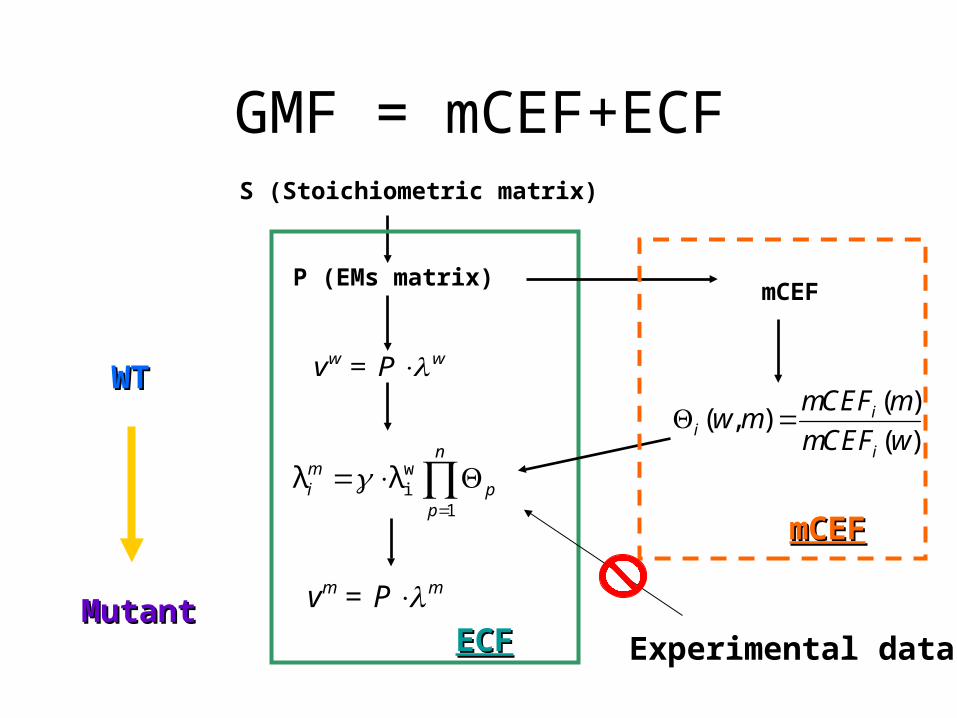
GMF = mCEF+ECF
m mv = P
( )( , )
( )i
ii
mCEF mw m
mCEF w
S (Stoichiometric matrix)
w wv = P
P (EMs matrix) mCEF
ECFECF
mCEFmCEF
WTWT
MutantMutant
wiλ λ
1
nmi p
p
Experimental data
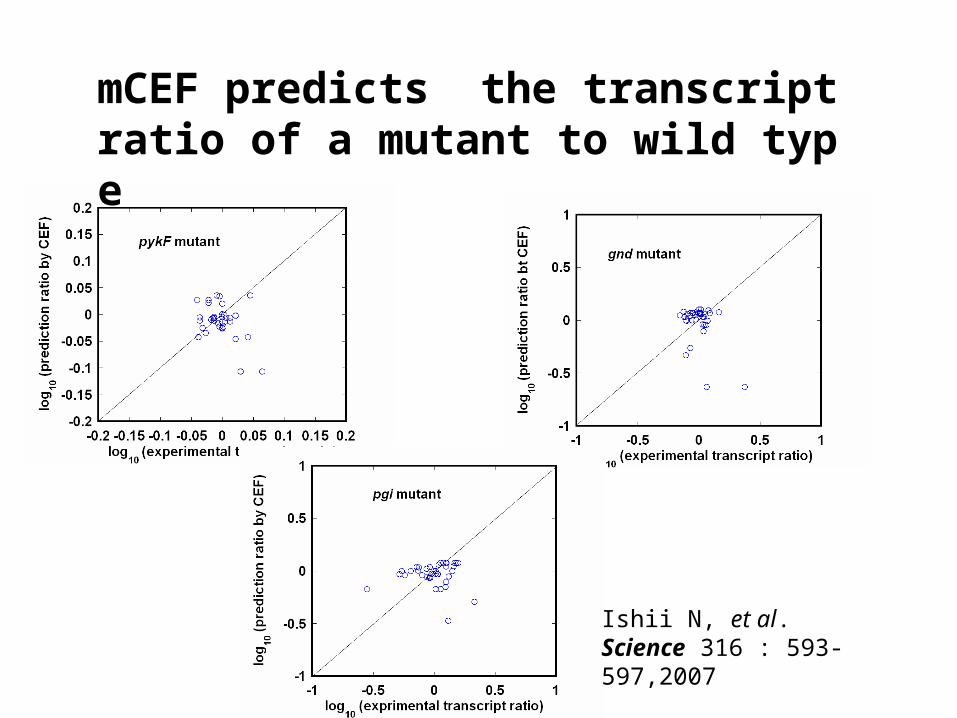
Ishii N, et al. Science 316 : 593-597,2007
mCEF predicts the transcript ratio of a mutant to wild type

Comparison of GMF(CEF+ECF) with FBA and MOMA for E. coli gene deletion mutants
Characterization of GMF

• FBA
• MOMA
,min ,max
0
0
[ , ] 1,...,
biomass
k
i i i
Maximize v
subject to S v
v
v v v i n
2
1
,min ,max
( )
0
0
[ , ] 1,...,
N
i ii
k
i i i
Minimize w x
subject to S v
v
v v v i n
Vk is the flux of gene knockout reaction k
Vk is the flux of gene knockout reaction k

Prediction of the flux distribution of an E. coli zwf mutant by GM
F, FBA, and MOMA
Zhao J, Baba T, Mori H, Shimizu K.
Appl Microbiol Biotechnol. 2004;64(1):91-8.

Prediction of the flux distribution of an E. coli gnd mutant by CEF
+ECF, FBA, and MOMA
Zhao J, Baba T, Mori H, Shimizu K.
Appl Microbiol Biotechnol. 2004;64(1):91-8.

Prediction of the flux distribution of an E. coli ppc mutant by CEF
+ECF, FBA, and MOMA
Peng LF, Arauzo-Bravo MJ, Shimizu K.
FEMS Microbiol Letters, 2004, 235(1): 17-23
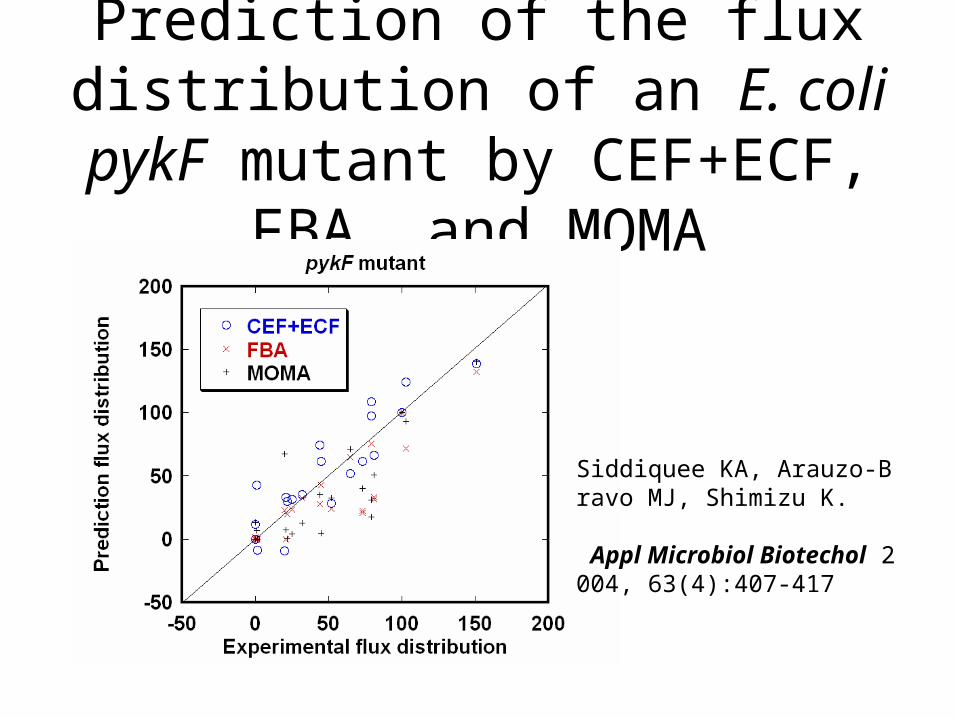
Prediction of the flux distribution of an E. coli pykF mutant by CEF+ECF, FBA, and MOMA
Siddiquee KA, Arauzo-Bravo MJ, Shimizu K.
Appl Microbiol Biotechol 2004, 63(4):407-417
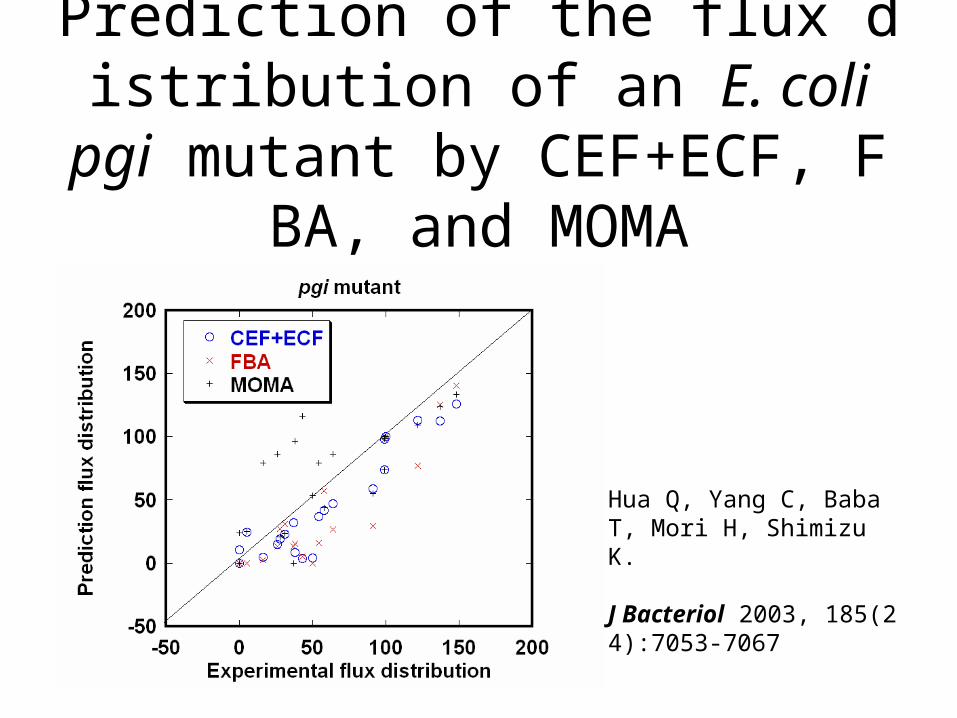
Prediction of the flux distribution of an E. coli pgi mutant by CEF+
ECF, FBA, and MOMA
Hua Q, Yang C, Baba T, Mori H, Shimizu K.
J Bacteriol 2003, 185(24):7053-7067
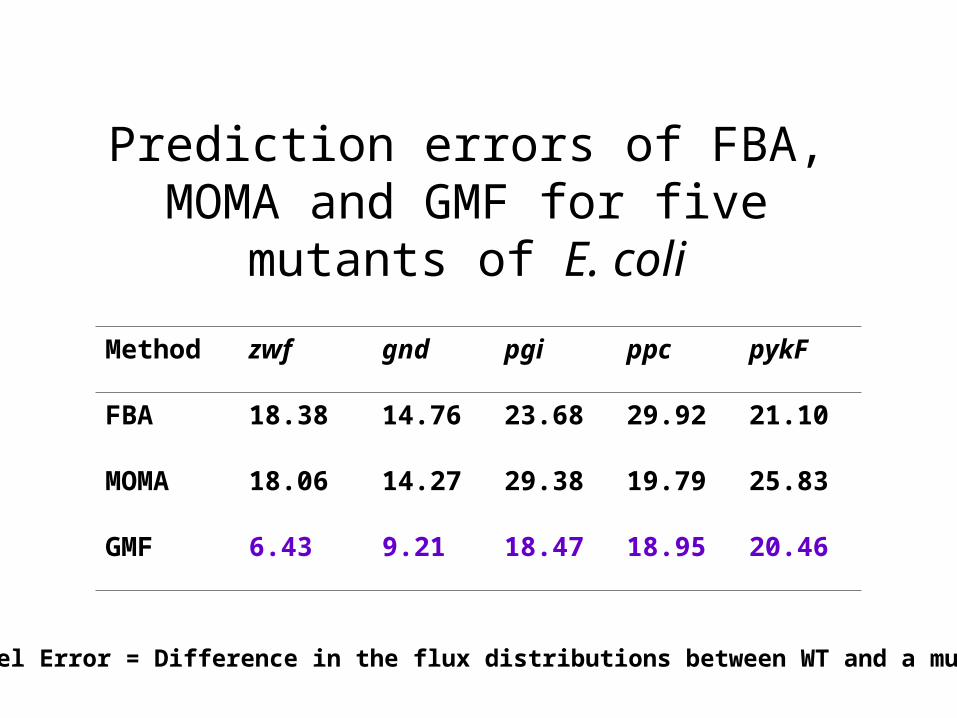
Prediction errors of FBA, MOMA and GMF for five mutants of E. coli
Method zwf gnd pgi ppc pykF
FBA 18.38 14.76 23.68 29.92 21.10
MOMA 18.06 14.27 29.38 19.79 25.83
GMF 6.43 9.21 18.47 18.95 20.46
Model Error = Difference in the flux distributions between WT and a mutant
Is GMF applicable to over-expressing or less-expressing mutants?
(FBA and MOMA are not applicable to these mutants.)
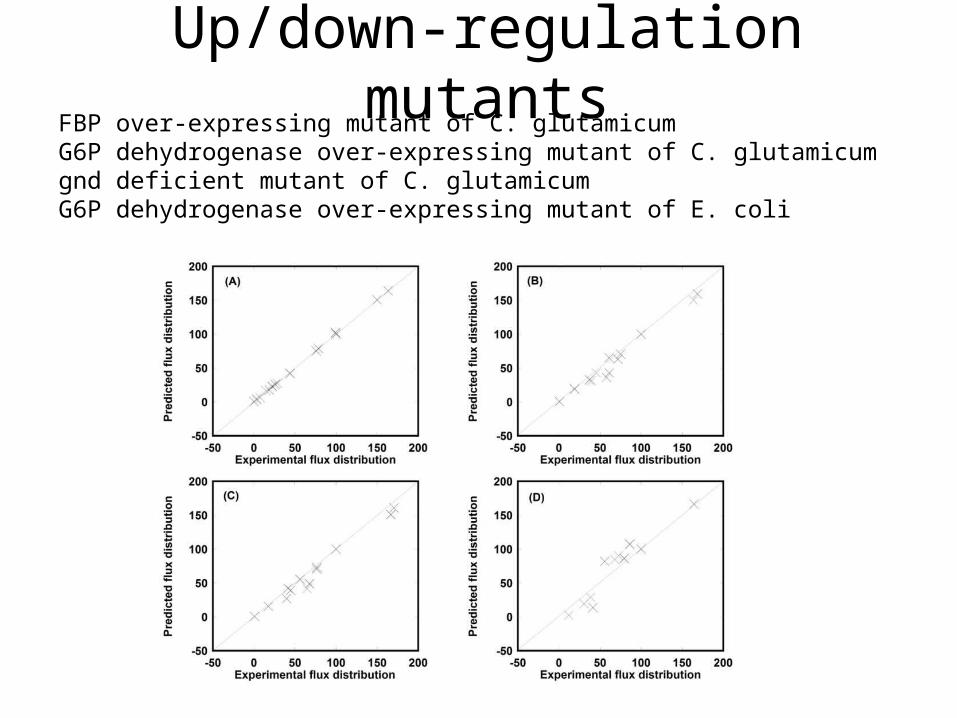
Up/down-regulation mutantsFBP over-expressing mutant of C. glutamicumG6P dehydrogenase over-expressing mutant of C. glutamicumgnd deficient mutant of C. glutamicumG6P dehydrogenase over-expressing mutant of E. coli

Summary of GMF
• mCEF is combined to ECF for the accurate prediction of flux distribution of mutants.
• GMF is applied to the mutants where an enzyme is over-expressed, less-expressed. It has an advantage over rFBA and MOMA.

Conclusion
• ECF is available for the quantitative correlation between an enzyme activity profile and its associated flux distribution
• GMF is a new tool for predicting a flux distribution for genetically modified mutants.

Thank you very much
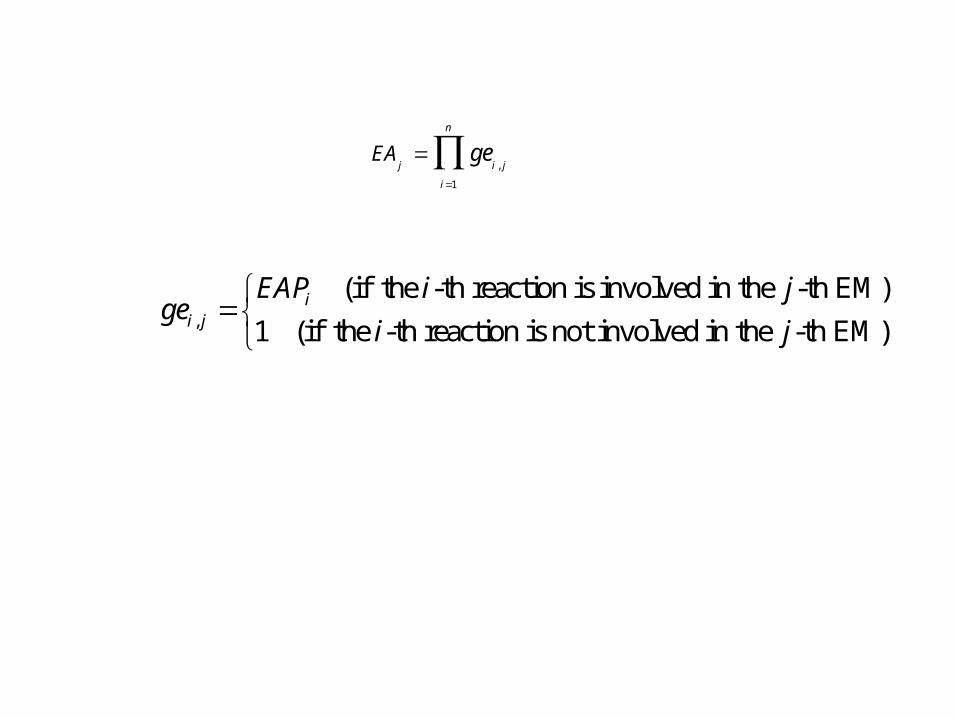
,
1
n
j i j
i
EA ge
,
(if the -th reaction is involved in the -th EM)
1 (if the -th reaction is not involved in the -th EM)i
i j
EAP i jge
i j


![OPM Financials (GMF) Troubleshooting Guide [ID 1213193.1]](https://static.fdocuments.in/doc/165x107/55cf9d8b550346d033ae174c/opm-financials-gmf-troubleshooting-guide-id-12131931.jpg)