Genetic diversity and population history of eight Italian ...
21
RESEARCH ARTICLE Genetic diversity and population history of eight Italian beef cattle breeds using measures of autozygosity Maria Chiara Fabbri ID 1 *, Christos Dadousis ID 2 , Francesco Tiezzi 3 , Christian Maltecca 3 , Emmanuel Lozada-Soto 3 , Stefano Biffani 4 , Riccardo Bozzi 1 1 Dipartimento di Scienze e Tecnologie Agrarie, Alimentari, Ambientali e Forestali, Università di Firenze, Firenze, Italy, 2 Dipartimento di Scienze Medico-Veterinarie, Università di Parma, Parma, Italy, 3 Department of Animal Science, North Carolina State University, Raleigh, NC, United States of America, 4 Institute of Agricultural Biology and Biotechnology (CNR), Milano, Italy * [email protected] Abstract In the present study, GeneSeek GGP-LDv4 33k single nucleotide polymorphism chip was used to detect runs of homozygosity (ROH) in eight Italian beef cattle breeds, six breeds with distribution limited to Tuscany (Calvana, Mucca Pisana, Pontremolese) or Sardinia (Sarda, Sardo Bruna and Sardo Modicana) and two cosmopolitan breeds (Charolais and Limousine). ROH detection analyses were used to estimate autozygosity and inbreeding and to identify genomic regions with high frequency of ROH, which might reflect selection signatures. Comparative analysis among breeds revealed differences in length and distribu- tion of ROH and inbreeding levels. The Charolais, Limousine, Sarda, and Sardo Bruna breeds were found to have a high frequency of short ROH (~ 15.000); Calvana and Mucca Pisana presented also runs longer than 16 Mbp. The highest level of average genomic inbreeding was observed in Tuscan breeds, around 0.3, while Sardinian and cosmopolitan breeds showed values around 0.2. The population structure and genetic distances were analyzed through principal component and multidimensional scaling analyses, and resulted in a clear separation among the breeds, with clusters related to productive purposes. The frequency of ROH occurrence revealed eight breed-specific genomic regions where genes of potential selective and conservative interest are located (e.g. MYOG, CHI3L1, CHIT1 (BTA16), TIMELESS, APOF, OR10P1, OR6C4, OR2AP1, OR6C2, OR6C68, CACNG2 (BTA5), COL5A2 and COL3A1 (BTA2)). In all breeds, we found the largest proportion of homozygous by descent segments to be those that represent inbreeding events that occurred around 32 generations ago, with Tuscan breeds also having a significant propor- tion of segments relating to more recent inbreeding. Introduction Runs of homozygosity (ROH) consist of contiguous regions of the genome where an individ- ual is homozygous in all sites [1]. This occurs when the haplotypes transmitted from both PLOS ONE PLOS ONE | https://doi.org/10.1371/journal.pone.0248087 October 25, 2021 1 / 21 a1111111111 a1111111111 a1111111111 a1111111111 a1111111111 OPEN ACCESS Citation: Fabbri MC, Dadousis C, Tiezzi F, Maltecca C, Lozada-Soto E, Biffani S, et al. (2021) Genetic diversity and population history of eight Italian beef cattle breeds using measures of autozygosity. PLoS ONE 16(10): e0248087. https://doi.org/ 10.1371/journal.pone.0248087 Editor: Roberta Davoli, Universita degli Studi di Bologna, ITALY Received: February 17, 2021 Accepted: October 6, 2021 Published: October 25, 2021 Copyright: © 2021 Fabbri et al. This is an open access article distributed under the terms of the Creative Commons Attribution License, which permits unrestricted use, distribution, and reproduction in any medium, provided the original author and source are credited. Data Availability Statement: Data cannot be shared publicly because owned by a third party. Data are available from ANACLI, Associazione Nazionale degli Allevatori delle razze bovine Charolaise e Limousine Italiane (http://www.anacli. it/), sending an email to [email protected]. As the authors are service providers, they had special privileges in accessing this data, but have confirmed that other researchers could access the same data following the steps described here.
Transcript of Genetic diversity and population history of eight Italian ...
RESEARCH ARTICLE
Genetic diversity and population history of
eight Italian beef cattle breeds using
measures of autozygosity
Maria Chiara FabbriID1*, Christos DadousisID
2, Francesco Tiezzi3, Christian Maltecca3,
Emmanuel Lozada-Soto3, Stefano Biffani4, Riccardo Bozzi1
1 Dipartimento di Scienze e Tecnologie Agrarie, Alimentari, Ambientali e Forestali, Università di Firenze,
Firenze, Italy, 2 Dipartimento di Scienze Medico-Veterinarie, Università di Parma, Parma, Italy,
3 Department of Animal Science, North Carolina State University, Raleigh, NC, United States of America,
4 Institute of Agricultural Biology and Biotechnology (CNR), Milano, Italy
Abstract
In the present study, GeneSeek GGP-LDv4 33k single nucleotide polymorphism chip was
used to detect runs of homozygosity (ROH) in eight Italian beef cattle breeds, six breeds
with distribution limited to Tuscany (Calvana, Mucca Pisana, Pontremolese) or Sardinia
(Sarda, Sardo Bruna and Sardo Modicana) and two cosmopolitan breeds (Charolais and
Limousine). ROH detection analyses were used to estimate autozygosity and inbreeding
and to identify genomic regions with high frequency of ROH, which might reflect selection
signatures. Comparative analysis among breeds revealed differences in length and distribu-
tion of ROH and inbreeding levels. The Charolais, Limousine, Sarda, and Sardo Bruna
breeds were found to have a high frequency of short ROH (~ 15.000); Calvana and Mucca
Pisana presented also runs longer than 16 Mbp. The highest level of average genomic
inbreeding was observed in Tuscan breeds, around 0.3, while Sardinian and cosmopolitan
breeds showed values around 0.2. The population structure and genetic distances were
analyzed through principal component and multidimensional scaling analyses, and resulted
in a clear separation among the breeds, with clusters related to productive purposes. The
frequency of ROH occurrence revealed eight breed-specific genomic regions where genes
of potential selective and conservative interest are located (e.g. MYOG, CHI3L1, CHIT1
(BTA16), TIMELESS, APOF, OR10P1, OR6C4, OR2AP1, OR6C2, OR6C68, CACNG2
(BTA5), COL5A2 and COL3A1 (BTA2)). In all breeds, we found the largest proportion of
homozygous by descent segments to be those that represent inbreeding events that
occurred around 32 generations ago, with Tuscan breeds also having a significant propor-
tion of segments relating to more recent inbreeding.
Introduction
Runs of homozygosity (ROH) consist of contiguous regions of the genome where an individ-
ual is homozygous in all sites [1]. This occurs when the haplotypes transmitted from both
PLOS ONE
PLOS ONE | https://doi.org/10.1371/journal.pone.0248087 October 25, 2021 1 / 21
a1111111111
a1111111111
a1111111111
a1111111111
a1111111111
OPEN ACCESS
Citation: Fabbri MC, Dadousis C, Tiezzi F, Maltecca
C, Lozada-Soto E, Biffani S, et al. (2021) Genetic
diversity and population history of eight Italian beef
cattle breeds using measures of autozygosity.
PLoS ONE 16(10): e0248087. https://doi.org/
10.1371/journal.pone.0248087
Editor: Roberta Davoli, Universita degli Studi di
Bologna, ITALY
Received: February 17, 2021
Accepted: October 6, 2021
Published: October 25, 2021
Copyright: © 2021 Fabbri et al. This is an open
access article distributed under the terms of the
Creative Commons Attribution License, which
permits unrestricted use, distribution, and
reproduction in any medium, provided the original
author and source are credited.
Data Availability Statement: Data cannot be
shared publicly because owned by a third party.
Data are available from ANACLI, Associazione
Nazionale degli Allevatori delle razze bovine
Charolaise e Limousine Italiane (http://www.anacli.
it/), sending an email to [email protected]. As the
authors are service providers, they had special
privileges in accessing this data, but have
confirmed that other researchers could access the
same data following the steps described here.

parents are identical due to being inherited from a common ancestor. The length of a ROH is
an imprint of the history of a population linked to its effective population size and provides
evidence for phenomena such as inbreeding, mating system, and population bottlenecks. In
theory, longer ROH are due to recent inbreeding, as recombination has not had the possibility
of breaking up the homozygous segment, on the other hand, short ROH demonstrate an older
origin because several meiosis have been occurred [2]. Information on inbreeding is crucial in
the design of breeding and conservation programs to control the increase in inbreeding levels
and to avoid the unfavorable effect of inbreeding depression in progeny [3].
The inbreeding coefficient of an individual (F) is defined as the probability that two ran-
domly chosen alleles at a specific locus within an individual are identical by descent (IBD) [4].
Homozygosity caused by two IBD genomic segments is defined “autozygosity”, F is therefore
an estimate of genome-wide autozygosity [5] and ROH are highly likely to be autozygous [6].
The estimation of the inbreeding coefficient from the proportion of the genome covered by
ROH (FROH) has been considered a powerful and accurate method of detecting inbreeding
effects [5] and a valid alternative to pedigree inbreeding coefficient [7, 8], which doesn’t take
into account the stochastic nature of recombination. Pedigree information could be incom-
plete and/or incorrect especially for local breeds, where the extensive breeding system and the
natural mating system could allow a limited control of relatedness.
The high occurrence of ROH in chromosomes could potentially represent a selection signa-
ture, i.e. a genomic footprint that could provide an overview for understanding the mechanism
of selection and adaptation, and could help to uncover regions related to important physiologi-
cal, economical and adaptive traits [9]. A selection signature is characterized by a reduced hap-
lotype variability, defined as ROH island [10]. Two different methods have been applied to
detect ROH islands: the first one based on an arbitrarily defined frequency of common ROH
within the population (for e.g., 20% [11]; 45% [12]; 70% [13]), while the second approach on a
percentile threshold (99th percentile) based on the top 1% of SNPs observed in a ROH [14,
15].
However, the use of ROH as markers for the identification of genomic regions potentially
subjected to non-recent evolutionary events is not straightforward. It requires that homozy-
gous segments have been inherited from old ancestors and were not caused by recent demo-
graphic events [16]. A further approach to estimate global inbreeding (FG) for each
population, which links the genomic homozygous segments to the time of living of the most
recent common ancestor, is the Homozygous-Identical by Descent (HBD) state probabilities.
Druet and Gautier [17] presented an approach to investigate local and global inbreeding,
based on the hidden Markov model (HMM). This approach assumes that the genome is
formed by HBD and non-HBD segments, where each segment has a HBD state probability.
Sole et al. [18] implemented a new HMM with multiple age based HBD-classes in which the
length of HBD segments have distinct distributions: longer segments for more recent common
ancestors, and shorter for more ancient ancestors. The expected HBD segment lengths are
inversely related to the number of generations to the common ancestor and their frequency to
past effective population size and individual inbreeding coefficients [17].
Assessment of genetic diversity and population structure is an important task to understand
the evolutionary history of the breeds, but also to provide important information for the con-
servation and management of biodiversity [19]. Italy has a biodiversity reservoir for local
breeds, but generally, local populations have a small sample size and one of the most important
obstacle is the increase in inbreeding, leading to negative effect on production and reproduc-
tion traits [20]. The maintenance of genetic diversity should be the priority for countries such
as Italy, where local breeds guarantee the economical survivor of marginal areas. Selection pro-
grams are not easy to apply to local populations for the reduced sample size which also implies
PLOS ONE Genetic diversity and population history of eight Italian beef cattle breeds
PLOS ONE | https://doi.org/10.1371/journal.pone.0248087 October 25, 2021 2 / 21
Funding: This work was financially supported by
Associazione Nazionale degli Allevatori delle razze
bovine Charolaise e Limousine Italiane (Cup:
J89H18000010005, URL: http://www.anacli.it/i-
beef). Grant was received by RB. The funders had
no role in study design and analysis, decision to
publish, or preparation of the manuscript.
Competing interests: The authors have declared
that no competing interests exist.

a higher level of inbreeding than in selected breeds [21]. For the former populations, it is even
more necessary to organize conservation programs aimed at maintaining genetic diversity and
controlling inbreeding. Within this context, improving the knowledge about the genomic
background of local breeds is crucial.
The aim of this study was to assess genome-wide autozygosity in eight Italian beef breeds,
six at critical risk of extinction, namely Calvana (CAL), Mucca Pisana (MUP), Pontremolese
(PON), mainly reared in Tuscany, Sardo Bruna (SAB), Sardo Modicana (SAM), Sarda (SAR)
reared in Sardinia. The cosmopolitan breeds, i.e. Charolais (CHA) and Limousine (LIM), were
included in the analysis to compare results and to highlight the differences between local
breeds and two of the most widespread breeds reared in Italy. ROH distribution and character-
ization have been investigated across the genome, and consequently, the inbreeding coeffi-
cients (FROH) within breeds were calculated; the HDB state probabilities have been used to
estimate global inbreeding (FG) and to investigate its change across generations, in order to
describe the demographic history of the populations.
Materials and methods
Ethics statement
DNA sampling for all the eight breeds was conducted using nasal swabs and no invasive proce-
dures were applied. Thus, in accordance to the 2010/63/EU guide and the adoption of the Law
D.L. 04/03/2014, n.26 by the Italian Government, an ethical approval was not required for our
study.
Animal sampling, quality control and SNPs characterization
A total of 1,308 animals, belonging to eight breeds, have been genotyped with GeneSeek
GGP-LDv4 33k (Illumina Inc., San Diego, California, USA) single nucleotide polymorphism
(SNP) DNA chip. Sampled animals for the three Tuscan breeds were 179, 190 and 45 for CAL,
MUP and PON, respectively. The limited number of alive animals of these breeds restricted
the total samples. Also, for SAM, being at risk of extinction, only 101 genotypes have been
recovered. Samples of SAR (n = 199) and SAB (n = 194) were animals born from 2005 and
2000, respectively. CHA and LIM samples consisted of cattle born from 2015 to 2019 (200
samples for each breed). Genotype quality control and data filtering were performed with
PLINK v1.9 [22] and were conducted separately for each breed: only SNPs located on the 29
autosomes were included (n = 28,289). Linkage Disequilibrium (LD) pruning was not per-
formed as suggested by Dixit et al. [23], as LD is related to various evolutionary forces which
are the phenomena ROH analysis investigates (e.g. inbreeding, nonrandom mating, popula-
tion bottleneck, artificial and natural selection). Editing for SNP MAF was not applied to the
dataset because it does not improve ROH detection, on the contrary homozygous regions
could be ignored [24]. A SNP characterization was performed based on MAF categories. SNPs
were classified into 5 classes: monomorphic SNPs, SNPs with MAF ranged from 0 to 0.005,
from 0.005 to 0.01, from 0.01 to 0.05 and>0.05. The aim was to evaluate the number of mono-
morphic SNPs within and between breeds, given that numerous common monomorphic
SNPs could influence ROH investigation.
Multidimensional scaling plot analysis
A multidimensional scaling plot analysis (MDS) was performed to investigate the population
structure between the eight breeds based on genetic distances. The first three dimensions were
obtained with PLINK v1.9 [22] using the—mds-plot flag, which were estimated on the matrix
PLOS ONE Genetic diversity and population history of eight Italian beef cattle breeds
PLOS ONE | https://doi.org/10.1371/journal.pone.0248087 October 25, 2021 3 / 21

of genome wide pairwise Identical by State (IBS) distances [25]. Results were plotted using
Scatterplot3d R package [26].
Runs of homozygosity detection
Analysis of runs of homozygosity was conducted with the R package detectRUNS v. 0.9.5 [27].
The following parameters were applied in order to detect a ROH: i) the minimum number of
consecutive SNPs was set to 15; ii) the minimum ROH length required was 1 Mbp; iii) the
maximum gap between consecutive homozygous SNPs was 1 Mbp; iv) the maximum number
of opposite genotypes in the run was set to 2; v) the maximum number of missing genotypes
allowed was 2. The consecutive method was preferred than the sliding windows one in order
to avoid the detection of artificial ROH shorter than the window described above (15 SNPs)
[28].
A principal component analysis (PCA) was conducted on the number of ROH per chromo-
some for each breed, to infer the similarities between populations based on ROH chromoso-
mic distribution. All ROH were classified into five classes of length as suggested by Kirin et al.
[2], and Ferenčaković et al. [29]: 0–2, 2–4, 4–8, 8–16, >16 Mbp. For each of the eight breeds
the total number of ROH, the ROH average number per individuals, the average length of
ROH, the number of ROH per breed per chromosome, and the number of ROH per class of
length were estimated.
Genomic inbreeding based on ROH
The genomic inbreeding (FROH) was calculated as suggested by McQuillan et al. [30]:
FROH ¼P
LROHLgenome
Where ∑LROH was the sum of the length of all ROH found in an individual and Lgenome was
the total autosomal genome length. The FROH per class of ROH length was calculated.
Selection signatures and Gene enrichment
In order to investigate the selection signatures in the eight cattle breeds, the occurrences of
ROH across genome was explored. The SNPs frequencies (%) in detected ROH were evaluated
for each breed and plotted against the position of the SNP across autosomes. The threshold
considered was the 80% of ROH occurrence for each breed, which were filtered taking only
the genomic regions containing a minimum number of 15 SNPs. These genomic regions were
analyzed and overlapped to Genome Data Viewer (https://www.ncbi.nlm.nih.gov/genome/
gdv/) of NCBI (National Center for Biotechnology information) to identify genes. The UMD
3.1 assembly was used for mapping.
Homozygosity by descent (HBD) segments and global inbreeding
The hidden Markov model (HMM)-based approach was used to scan the individual genome
for the HBD segments as described in Sole et al. [18]. The analysis was computed with the
RZooROH R package [31]. The HBD state probability values for each marker were averaged
across individual in each population. Averaging HBD probabilities of all loci across the
genome led to global (genome-wide) inbreeding (FG) calculation. Each class (K) has its own
rate parameter, RK, which indicates the length of the segments for its respective class. The
length of HBD classes is exponentially distributed with rate RK, which is double the number of
generations to the common ancestor of the respective class. The length of the HBD segment is
PLOS ONE Genetic diversity and population history of eight Italian beef cattle breeds
PLOS ONE | https://doi.org/10.1371/journal.pone.0248087 October 25, 2021 4 / 21

1/RK Morgans, indicating high rates associated with shorter segments. The study focused on
<16 Mbp ROH length, so the model applied was six HBD classes with respective rates (RK =
21, 22, 23, . . ., 26) and one non-HBD with an RK rate of 26, so that 32 generations
(generation = R/2) and short HBD segments from 1.5 Mbp (1/26) of length were included in
the analysis. The rate of the non-HBD class was fixed as the most ancient class.
A MixKR [18] model with K = 7 was performed. To estimate the inbreeding coefficient, we
considered the ancestors with an RK rate higher than a threshold T as unrelated. The corre-
sponding genomic inbreeding coefficient (FG−T) was then estimated, with RK� T averaged
over the whole genome (as reported by Druet et al. [32]).
Results
Animal sampling, quality control and SNPs characterization
In total, 28,178 SNPs were divided into 5 classes of MAF (Table 1) while 111 SNPs remained
unclassified. PON presented the highest number of monomorphic SNPs (n = 4,151; i.e. the
15.6% of the total number of SNPs), followed by LIM and CHA, namely 3,915 (14.4%) and
3,456 (12.8%) respectively. CAL had an intermediate value (2,968–11.40%) while MUP, SAB,
SAM and SAR had less than 2,000 monomorphic SNPs, which maintained lower than the 8%
of the total amount of them. The first two classes of MAF (0–0.005 and 0.005–0.01) contained
few SNPs, exceeding 1,000 markers only in MUP.
In order to investigate the presence of common SNPs between breeds, pairs comparisons
have been performed. Fig 1 explains the total number of monomorphic SNPs on the diagonal,
and the off-diagonal represents the common SNPs deriving from pairs comparisons among
breeds. PON had the highest number of monomorphic SNPs (n = 4,151), while they amounted
to 3,456 for CHA and 3,915 for LIM. MUP and SAB presented numbers close to 2,000 while
SAM and SAR had the lowest values of monomorphic SNPs (1,663 and 1,447, respectively). As
expected, the two breeds under selection shared the greatest number of monomorphic SNPs
and were followed by LIM vs. PON and PON vs. CAL. However, no monomorphic SNP was
found in common in all eight breeds.
The monomorphic SNPs distribution across autosomes has been investigated and it is
showed in Fig 2. As expected, the amounts of monomorphic SNPs decreased relative to chro-
mosomic length. However, the highest total number was reported in BTA5, except for SAR
and SAM (BTA6); the lowest number of monomorphic SNPs was found in BTA25 for Tuscan
breeds and LIM, in BTA26 for Sardinian breeds and lastly, in BTA28 for CHA.
Multidimensional scaling plot analysis
The MDS plot evidenced clustering of breeds (Fig 3).
Table 1. Number of autosomal SNPs per breed1 classified into 5 classes of minor allele frequency.
CAL (n = 179) CHA (n = 200) LIM (n = 200) MUP (n = 190) PON (n = 45) SAB (n = 194) SAM (n = 101) SAR (n = 199)
Monomorphic 2,968 3,456 3,915 1,999 4,151 1,903 1,663 1,447
0–0.005 589 544 234 912 0 588 313 396
0.005–0.01 323 123 109 477 0 290 242 253
0.01–0.05 1,359 714 759 1,653 1,628 893 1,162 1,308
>0.05 23,032 23,450 23,271 23,230 22,473 24,609 24,887 24,878
Sample size for each breed was reported.1 CAL = Calvana; CHA = Charolais; LIM = Limousine; MUP = Mucca Pisana; PON = Pontremolese; SAB = Sardo Bruna; SAM = Sardo Modicana; SAR = Sarda.
https://doi.org/10.1371/journal.pone.0248087.t001
PLOS ONE Genetic diversity and population history of eight Italian beef cattle breeds
PLOS ONE | https://doi.org/10.1371/journal.pone.0248087 October 25, 2021 5 / 21

MUP and CAL were extremely distant from each other and from the other six breeds,
which grouped in a unique large cluster. Only a small group of MUP samples were nearer to
the third cluster (Sardinian and Cosmopolitan breeds). Both LIM and CHA showed extremely
compact clusters, suggesting as expected, a low genetic variability within each breed, and also
close to each other, underlining their different genetic background compared to local breeds.
SAM and SAB individuals were more scattered than SAR and PON which, however, over-
lapped with these former.
Runs of homozygosity detection
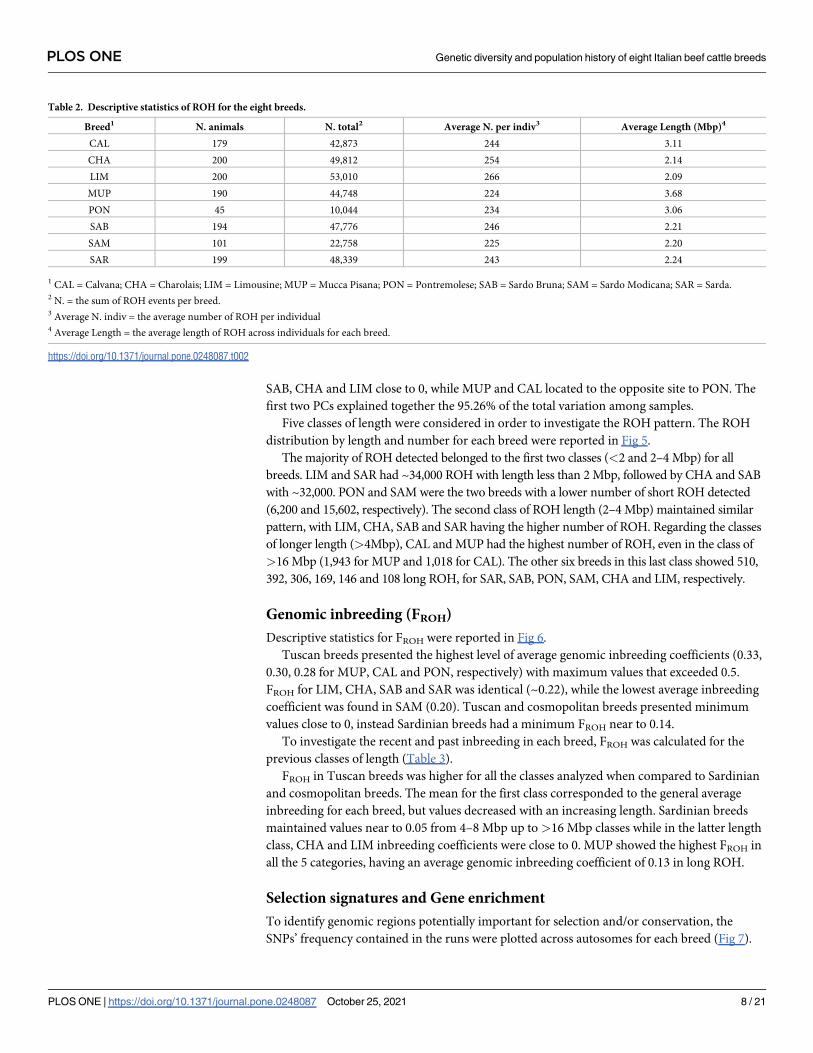
Table 2 shows the total number of ROH detected per breed, the average number per individual
and the ROH total length.
The two cosmopolitan breeds displayed the highest number of identified ROH
(LIM = 53,010; CHA = 49,812), whereas SAM and PON showed the lowest values, 22,758 and
10,044, respectively. However, the average number per individuals was almost the same in
each breed, ranging from 224 in SAB to 266 in SAR. For each chromosome the number of
ROH per breed (S1 Table) has been calculated. Bos taurus autosome (BTA) 1 had consistently
the highest ROH number in all breeds, except for MUP, where BTA2 had the highest number
of ROH. The average length was found to be higher in Tuscan breeds (ranging from 3.06 to
3.68 Mbp). The Sardinian breeds had intermediate values (2.20–2.24 Mbp) while the average
ROH length for the cosmopolitan breeds was 2.14 Mbp for CHA and 2.09 Mbp for LIM. PCA
analysis on the number of ROH per chromosome revealed groups among breeds (Fig 4). PC1
clearly separated Tuscan breeds from Sardinian and cosmopolitan, while PC2 placed SAR,
Fig 1. Heatmap of monomorphic SNPs pairs comparison among breeds; CAL = Calvana; CHA = Charolais;
LIM = Limousine; MUP = Mucca Pisana; PON = Pontremolese; SAB = Sardo Bruna; SAM = Sardo Modicana;
SAR = Sarda.
https://doi.org/10.1371/journal.pone.0248087.g001
PLOS ONE Genetic diversity and population history of eight Italian beef cattle breeds
PLOS ONE | https://doi.org/10.1371/journal.pone.0248087 October 25, 2021 6 / 21

Fig 2. Monomorphic single nucleotide polymorphisms distribution across chromosomes in each breed1, where 1 CAL = Calvana; CHA = Charolais;
LIM = Limousine; MUP = Mucca Pisana; PON = Pontremolese; SAB = Sardo Bruna; SAM = Sardo Modicana; SAR = Sarda.
https://doi.org/10.1371/journal.pone.0248087.g002
Fig 3. Multidimensional scaling plot for 8 cattle beef breeds, where CAL = Calvana; CHA = Charolais; LIM = Limousine; MUP = Mucca Pisana;
PON = Pontremolese; SAB = Sardo Bruna; SAM = Sardo Modicana; SAR = Sarda.
https://doi.org/10.1371/journal.pone.0248087.g003
PLOS ONE Genetic diversity and population history of eight Italian beef cattle breeds
PLOS ONE | https://doi.org/10.1371/journal.pone.0248087 October 25, 2021 7 / 21
SAB, CHA and LIM close to 0, while MUP and CAL located to the opposite site to PON. The
first two PCs explained together the 95.26% of the total variation among samples.
Five classes of length were considered in order to investigate the ROH pattern. The ROH
distribution by length and number for each breed were reported in Fig 5.
The majority of ROH detected belonged to the first two classes (<2 and 2–4 Mbp) for all
breeds. LIM and SAR had ~34,000 ROH with length less than 2 Mbp, followed by CHA and SAB
with ~32,000. PON and SAM were the two breeds with a lower number of short ROH detected
(6,200 and 15,602, respectively). The second class of ROH length (2–4 Mbp) maintained similar
pattern, with LIM, CHA, SAB and SAR having the higher number of ROH. Regarding the classes
of longer length (>4Mbp), CAL and MUP had the highest number of ROH, even in the class of
>16 Mbp (1,943 for MUP and 1,018 for CAL). The other six breeds in this last class showed 510,
392, 306, 169, 146 and 108 long ROH, for SAR, SAB, PON, SAM, CHA and LIM, respectively.
Genomic inbreeding (FROH)
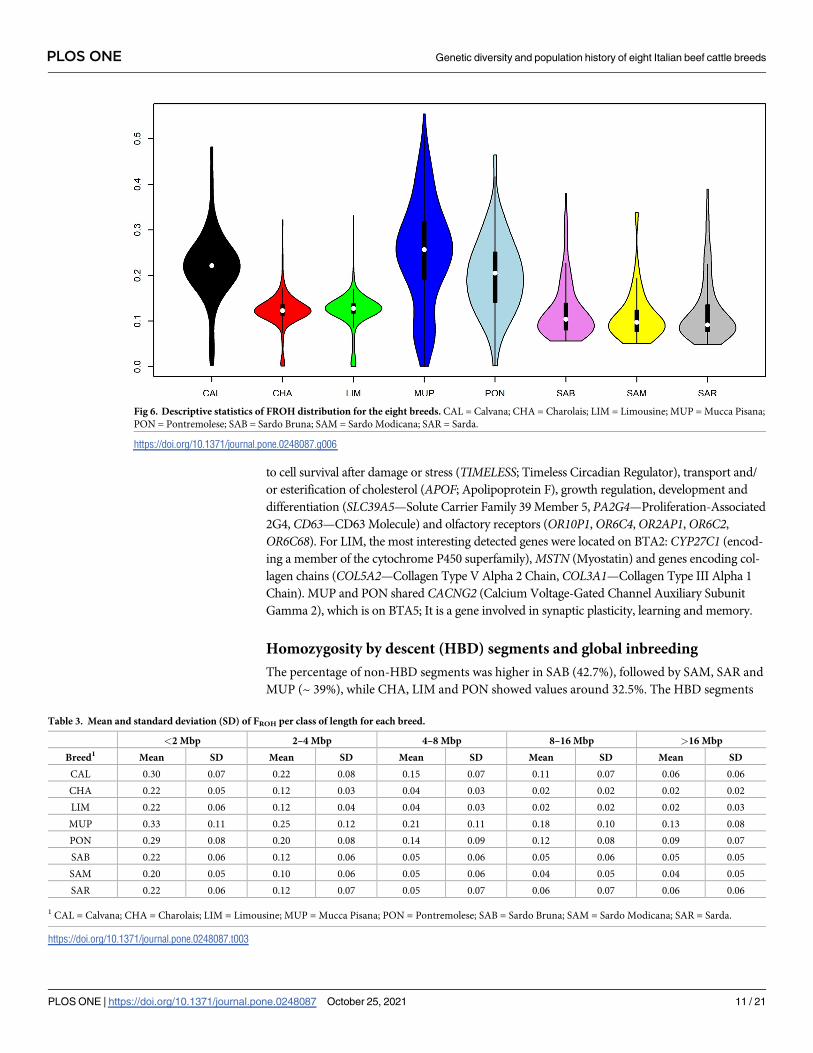
Descriptive statistics for FROH were reported in Fig 6.
Tuscan breeds presented the highest level of average genomic inbreeding coefficients (0.33,
0.30, 0.28 for MUP, CAL and PON, respectively) with maximum values that exceeded 0.5.
FROH for LIM, CHA, SAB and SAR was identical (~0.22), while the lowest average inbreeding
coefficient was found in SAM (0.20). Tuscan and cosmopolitan breeds presented minimum
values close to 0, instead Sardinian breeds had a minimum FROH near to 0.14.
To investigate the recent and past inbreeding in each breed, FROH was calculated for the
previous classes of length (Table 3).
FROH in Tuscan breeds was higher for all the classes analyzed when compared to Sardinian
and cosmopolitan breeds. The mean for the first class corresponded to the general average
inbreeding for each breed, but values decreased with an increasing length. Sardinian breeds
maintained values near to 0.05 from 4–8 Mbp up to>16 Mbp classes while in the latter length
class, CHA and LIM inbreeding coefficients were close to 0. MUP showed the highest FROH in
all the 5 categories, having an average genomic inbreeding coefficient of 0.13 in long ROH.
Selection signatures and Gene enrichment
To identify genomic regions potentially important for selection and/or conservation, the
SNPs’ frequency contained in the runs were plotted across autosomes for each breed (Fig 7).
Table 2. Descriptive statistics of ROH for the eight breeds.
Breed1 N. animals N. total2 Average N. per indiv3 Average Length (Mbp)4
CAL 179 42,873 244 3.11
CHA 200 49,812 254 2.14
LIM 200 53,010 266 2.09
MUP 190 44,748 224 3.68
PON 45 10,044 234 3.06
SAB 194 47,776 246 2.21
SAM 101 22,758 225 2.20
SAR 199 48,339 243 2.24
1 CAL = Calvana; CHA = Charolais; LIM = Limousine; MUP = Mucca Pisana; PON = Pontremolese; SAB = Sardo Bruna; SAM = Sardo Modicana; SAR = Sarda.2 N. = the sum of ROH events per breed.3 Average N. indiv = the average number of ROH per individual4 Average Length = the average length of ROH across individuals for each breed.
https://doi.org/10.1371/journal.pone.0248087.t002
PLOS ONE Genetic diversity and population history of eight Italian beef cattle breeds
PLOS ONE | https://doi.org/10.1371/journal.pone.0248087 October 25, 2021 8 / 21

As presented in Fig 7, the autosomes generally more interested by ROH with high occurrence
was BTA21, except for CAL, which were BTA13 and BTA6. LIM and CHA presented ROH
peaks also on BTA2 and BTA5, respectively.
Applying the abovementioned threshold of 80%, 35 ROH have been detected in total across
all breeds (S2 Table); the highest number of genomic regions identified was found in Tuscan
breeds (n = 11, CAL; n = 9, MUP; n = 6, PON). Five ROH with high occurrence were found
both for CHA and LIM, while each Sardinian breed presented only one run. The longest runs
were found in LIM (2.65 and 2.38 Mbp), followed by MUP (2.17 Mbp), SAM and SAR (2
Mbp).
One genomic region on BTA21 was found in common in several breeds starting at 83,766
Mbp with BovineHD2100000012. The region was almost identical for CHA, PON, SAB with a
length of ~1.70 Mbp; this run contained 18 SNPs for CHA and PON, 17 for SAB. This ROH
was present also in LIM, MUP, SAM, and SAR starting at the same SNP but finishing with dif-
ferent markers (BovineHD2100000320 for LIM located at 2,467,774 bp, BovineHD2100000283
for MUP at 2,256,102 bp and BovineHD2100000258 for SAM and SAR positioned at 2,085,345
bp). For the aforementioned breeds, the number of SNPs within this region ranged from 25
(LIM) to 20 (Sardinian). Within this shared run, four genes were detected: IGHM (Immuno-
globulin heavy constant Mu), MKRN3 (Makorin finger protein 3), MAGEL2 (MAGE family
member L2) and NDN (Necdin), located upstream of the Prader-Willi syndrome (PWS)
region.
From the 35 ROH detected, within-breed specific regions containing a minimum number
of 15 SNPs were selected to investigate the genes (Table 4). The list of genes in each run is
reported in S3 Table.
Fig 4. Scatterplot of the first two principal components (PCs). Principal component analysis (PCA) was performed
on the number of identified ROH per chromosome in each breed. CAL = Calvana; CHA = Charolais;
LIM = Limousine; MUP = Mucca Pisana; PON = Pontremolese; SAB = Sardo Bruna; SAM = Sardo Modicana;
SAR = Sarda.
https://doi.org/10.1371/journal.pone.0248087.g004
PLOS ONE Genetic diversity and population history of eight Italian beef cattle breeds
PLOS ONE | https://doi.org/10.1371/journal.pone.0248087 October 25, 2021 9 / 21

Among genes presented in S3 Table, we found some of special interest. For CAL, we found
the MYOG (Myogenin) (a muscle-specific transcription factor), CHI3L1 (Chitinase 3 Like 1)
and CHIT1 (Chitinase 1) genes on BTA16, both of these are involved in inflammatory pro-
cesses. On BTA5, for CHA we found the largest number of genes (n = 57). These were linked
Fig 5. ROH classified into 5 classes of length. CAL = Calvana; CHA = Charolais; LIM = Limousine; MUP = Mucca Pisana; PON = Pontremolese; SAB = Sardo
Bruna; SAM = Sardo Modicana; SAR = Sarda.
https://doi.org/10.1371/journal.pone.0248087.g005
PLOS ONE Genetic diversity and population history of eight Italian beef cattle breeds
PLOS ONE | https://doi.org/10.1371/journal.pone.0248087 October 25, 2021 10 / 21
to cell survival after damage or stress (TIMELESS; Timeless Circadian Regulator), transport and/
or esterification of cholesterol (APOF; Apolipoprotein F), growth regulation, development and
differentiation (SLC39A5—Solute Carrier Family 39 Member 5, PA2G4—Proliferation-Associated
2G4, CD63—CD63 Molecule) and olfactory receptors (OR10P1, OR6C4,OR2AP1, OR6C2,
OR6C68). For LIM, the most interesting detected genes were located on BTA2: CYP27C1 (encod-
ing a member of the cytochrome P450 superfamily), MSTN (Myostatin) and genes encoding col-
lagen chains (COL5A2—Collagen Type V Alpha 2 Chain, COL3A1—Collagen Type III Alpha 1
Chain). MUP and PON shared CACNG2 (Calcium Voltage-Gated Channel Auxiliary Subunit
Gamma 2), which is on BTA5; It is a gene involved in synaptic plasticity, learning and memory.
Homozygosity by descent (HBD) segments and global inbreeding
The percentage of non-HBD segments was higher in SAB (42.7%), followed by SAM, SAR and
MUP (~ 39%), while CHA, LIM and PON showed values around 32.5%. The HBD segments
Fig 6. Descriptive statistics of FROH distribution for the eight breeds. CAL = Calvana; CHA = Charolais; LIM = Limousine; MUP = Mucca Pisana;
PON = Pontremolese; SAB = Sardo Bruna; SAM = Sardo Modicana; SAR = Sarda.
https://doi.org/10.1371/journal.pone.0248087.g006
Table 3. Mean and standard deviation (SD) of FROH per class of length for each breed.
<2 Mbp 2–4 Mbp 4–8 Mbp 8–16 Mbp >16 Mbp
Breed1 Mean SD Mean SD Mean SD Mean SD Mean SD
CAL 0.30 0.07 0.22 0.08 0.15 0.07 0.11 0.07 0.06 0.06
CHA 0.22 0.05 0.12 0.03 0.04 0.03 0.02 0.02 0.02 0.02
LIM 0.22 0.06 0.12 0.04 0.04 0.03 0.02 0.02 0.02 0.03
MUP 0.33 0.11 0.25 0.12 0.21 0.11 0.18 0.10 0.13 0.08
PON 0.29 0.08 0.20 0.08 0.14 0.09 0.12 0.08 0.09 0.07
SAB 0.22 0.06 0.12 0.06 0.05 0.06 0.05 0.06 0.05 0.05
SAM 0.20 0.05 0.10 0.06 0.05 0.06 0.04 0.05 0.04 0.05
SAR 0.22 0.06 0.12 0.07 0.05 0.07 0.06 0.07 0.06 0.06
1 CAL = Calvana; CHA = Charolais; LIM = Limousine; MUP = Mucca Pisana; PON = Pontremolese; SAB = Sardo Bruna; SAM = Sardo Modicana; SAR = Sarda.
https://doi.org/10.1371/journal.pone.0248087.t003
PLOS ONE Genetic diversity and population history of eight Italian beef cattle breeds
PLOS ONE | https://doi.org/10.1371/journal.pone.0248087 October 25, 2021 11 / 21
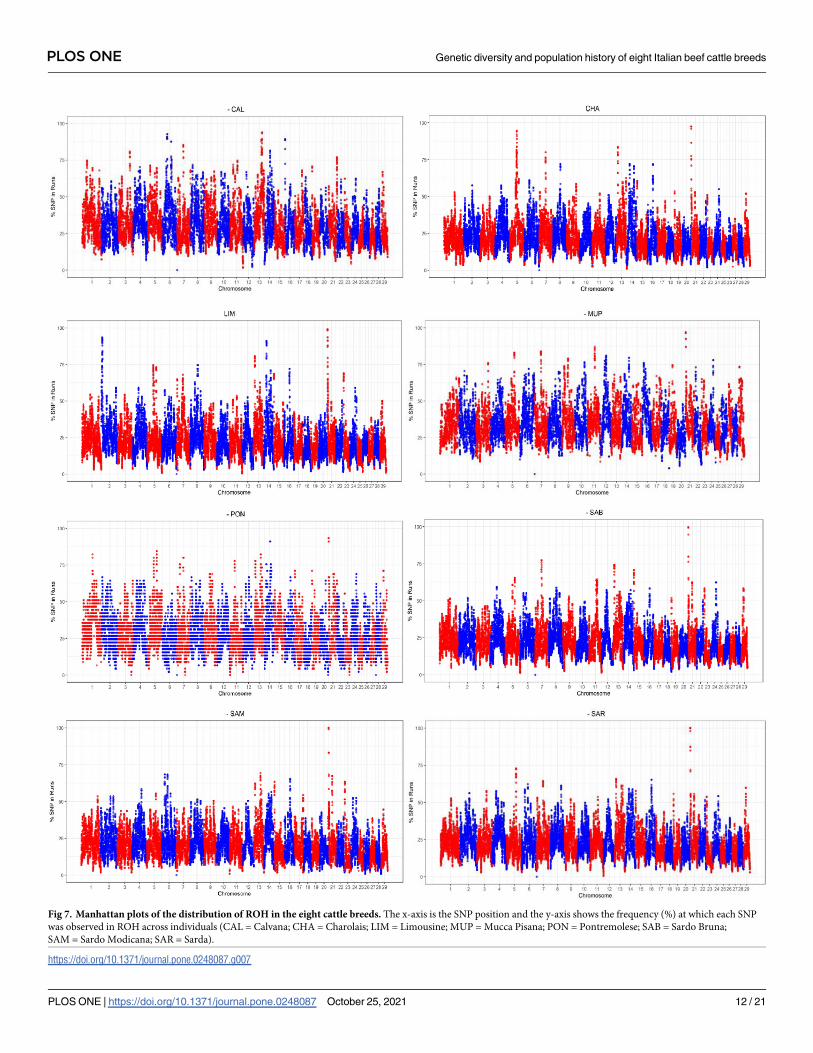
Fig 7. Manhattan plots of the distribution of ROH in the eight cattle breeds. The x-axis is the SNP position and the y-axis shows the frequency (%) at which each SNP
was observed in ROH across individuals (CAL = Calvana; CHA = Charolais; LIM = Limousine; MUP = Mucca Pisana; PON = Pontremolese; SAB = Sardo Bruna;
SAM = Sardo Modicana; SAR = Sarda).
https://doi.org/10.1371/journal.pone.0248087.g007
PLOS ONE Genetic diversity and population history of eight Italian beef cattle breeds
PLOS ONE | https://doi.org/10.1371/journal.pone.0248087 October 25, 2021 12 / 21

identified (Fig 8) belonged mainly to HBD class with RK equal to 64. Tuscan breeds showed a
greater proportion of HBD genome also for RK ranged from 4 to 8, while CAL is the breed
with higher proportion of HBD segments when RK was 16.
The results suggested that all the breeds suffered an increase in inbreeding during ancient
generations (around 32 generations ago), and only Tuscan breeds have been involved in new
consistent inbreeding events, approximately 2–4 generations ago. Results were similar when
inbreeding (FG-T) was calculated respect to different base populations (Fig 9). The FG-T was
estimated as the probability of belonging to any of the HBD classes with a RK� a threshold T,
averaged over the whole genome.
The FG estimated with the most remote base population showed values exceeding 0.2 for
Tuscan breeds, while LIM and CHA had FG around 0.1. Sardinian maintained FG close to
0.06. Classes associated with smaller RK rates (i.e., with longer HBD segments) explained a
smaller HBD proportion: the average inbreeding coefficient was close to 0 in cosmopolitan
and Sardinian breeds, while for PON and MUP FG was slightly lower than 0.1 from classes
with 8� RK� 32, while CAL didn’t exceed 0.05. The inbreeding coefficient associated with
common ancestors tracing back up to approximately two generations ago (corresponding to
HBD-classes with RK� 4) tended to 0 in all Tuscan breeds.
Table 4. Characterization of within-breed common runs of homozygosity at a threshold of 80% and with at least 15 SNPs and the number of genes included.
Breed1 CHR Start_SNP End_SNP Length_Mbp N. genes
CAL 6 BovineHD0600010715 Hapmap26233-BTA-75846 1.49 2
16 BovineHD1600000011 BovineHD1600000286 1.06 11
CHA 5 BovineHD0500016070 BovineHD0500016088 0.09 3
5 BovineHD0500016090 BovineHD0500016469 1.74 57
LIM 2 ARS-BFGL-NGS-21306 BTB-01111412 2.65 22
14 BovineHD1400007190 Hapmap40958-BTA-34312 1.70 7
MUP 5 5_74951342 5_75130860 0.18 1
PON 5 BovineHD0500021258 5_75130860 0.37 6
1 CAL = Calvana; CHA = Charolais; LIM = Limousine; MUP = Mucca Pisana; PON = Pontremolese.
https://doi.org/10.1371/journal.pone.0248087.t004
Fig 8. Proportion of the genome consisted of HBD classes in different RK. CAL = Calvana; CHA = Charolais; LIM = Limousine; MUP = Mucca Pisana;
PON = Pontremolese; SAB = Sardo Bruna; SAM = Sardo Modicana; SAR = Sarda.
https://doi.org/10.1371/journal.pone.0248087.g008
PLOS ONE Genetic diversity and population history of eight Italian beef cattle breeds
PLOS ONE | https://doi.org/10.1371/journal.pone.0248087 October 25, 2021 13 / 21

Partitioning of individual genomes in different HBD classes was also performed and Fig 10
reports the plot of 40 randomly chosen individuals per breed. Each bar represents an individ-
ual, the white spaces are individuals with no HBD segments belonging to HBD classes ana-
lyzed, the height of the different stacks is the proportion of the genome associated with the
HBD class of the corresponding color and the total height showed the overall level of
inbreeding.
Fig 9. Genomic inbreeding coefficients estimated respect to different base populations (FG-T) selecting different thresholds T, setting the base population
approximately 0.5 � T generations ago.
https://doi.org/10.1371/journal.pone.0248087.g009
Fig 10. Proportion of the genome interested by HBD classes in different RK. CAL = Calvana; CHA = Charolais; LIM = Limousine; MUP = Mucca
Pisana; PON = Pontremolese; SAB = Sardo Bruna; SAM = Sardo Modicana; SAR = Sarda.
https://doi.org/10.1371/journal.pone.0248087.g010
PLOS ONE Genetic diversity and population history of eight Italian beef cattle breeds
PLOS ONE | https://doi.org/10.1371/journal.pone.0248087 October 25, 2021 14 / 21

The results confirmed that all breeds acquired the majority of their inbreeding load derived
from ancient ancestors (32 generations ago), but once again, the Tuscan breeds appeared with
a different demographic historical structure compared to Sardinian and cosmopolitan breeds;
the level of inbreeding was higher in Tuscan and deriving both from past and recent phenom-
ena. Indeed, PON and MUP were affected also by inbreeding acquired in recent generations
(2–4, i.e. RK = 4 and 8, respectively). CAL also showed traces of ancestors from 8 generation
ago in several individuals. Sardinian and cosmopolitan breeds showed lower levels of inbreed-
ing and HBD segments derived from ancient ancestors.
Discussion
The advent of high-throughput genotyping arrays facilitated the study of genetic diversity and
population structure in cattle [20], but local breeds remained understudied, even if in the last
years greater importance has been given to the maintenance of biodiversity and the adoption
of conservation measures for breeds at risk of extinction. Several advantages are brought with
the conservation of local breeds, such as economical and genetic benefits [33]. This study com-
prehensively describes the genome-wide autozygosity and the consequent population structure
of six local breed reared in Italy, namely Calvana, Mucca Pisana, Pontremolese, Sardo Bruna,
Sardo Modicana and Sarda, by exploring the distribution of ROH, the level of genomic
inbreeding (FROH) and the partitioning of homozygous identical by descent (HBD) segments
across generations.
Multidimensional scaling plot analysis
MDS approach has been preferred to Principal component analysis (PCA) because it detects
meaningful dimensions that explain observed genetic distance, i.e. pairwise IBS distance, while
PCA method calculates the population structure based on genetic correlations among individ-
uals [28]. The genome feature analysis carried out using MDS decomposition (Fig 3) was in
accordance with the ROH-based PCA (Fig 4), highlighting a grouping among breeds. In par-
ticular, in both analyses Sardinian and cosmopolitan breeds were more similar to each other
than Tuscan populations, except for PON, which clustered together with Sardinian and cos-
mopolitan breeds in MDS but not in PCA. This might be because sampled animals of PON
were few due to the little size of population (only 49 living animals are reported [34]), and this
could affect PCA results but it does not influence MDS analysis, solely based on genetic dis-
tances clustering. Plotting of the eight breeds was therefore a description of the breeds sample
size. The SAB and SAR breeds counted approximately ~ 25,000 alive animals [35], Charolais ~
18,000 and Limousine ~ 50,000 (http://www.anacli.it/), while Calvana and Mucca Pisana sam-
ples amounted to a few hundred [33]. CHA and LIM formed the most compact cluster indicat-
ing that the breeding management in these breeds has a narrower genetic basis.
Runs of homozygosity and genomic inbreeding (FROH)
The total number of ROH detected in each breed, was higher than what found in other studies
focusing on cattle [14, 35, 36]. Differences might be due to the low-density panel used for gen-
otyping, the quality control of the genotypes, the parameters used to define a ROH and the
sample size. The small number of detected ROH in PON and SAM might be a result of limited
sample size. The relatively high average length of ROH, ranged from 2.09 to 3.68 (Table 2),
suggested that ancient inbreeding is present in all breeds. Short ROH represented the vast
majority of ROH detected in all breeds (Fig 5), being more profound for LIM and CHA. This
is in line with the history of cosmopolitan breeds, which have seen a crucial increase in sample
size in the last 15 years (http://www.anacli.it). The growing interest in selection programs have
PLOS ONE Genetic diversity and population history of eight Italian beef cattle breeds
PLOS ONE | https://doi.org/10.1371/journal.pone.0248087 October 25, 2021 15 / 21

probably led to a slight increase in inbreeding compared to other European Limousine and
Charolais populations; indeed, Szmatola et al. [14] described FROH in Polish Limousine rang-
ing from 0.059 (>1Mbp) to 0.011 (>16 Mbp), while, Polish Charolaise showed values from
0.065 to 0.009. In this study FROH decreased in both selected breeds from 0.22 to 0.02 for the
aforementioned classes of length.
Nowadays, SAB, SAR and SAM are distributed across 1,432, 950 and 146 farms, and it is
known that Sardinian farmers exchange bulls between herds, causing a high average related-
ness of individuals within farm but allowing a low degree of kinship among farms [35]. This
could explain why FROH in SAR, SAB and SAM has been maintained near 0.05 (Fig 6 and
Table 3) in medium (4–8 Mbp) and long ROH (>16 Mbp), suggesting that ancient and recent
inbreeding has created a plateau of consanguinity across Sardinian populations. Results
reported by Cesarani et al. [35], where the average length per individual ranged from 2.9 for
SAR to 2.4 Mbp for SAM, showed a trend of decreased inbreeding in these populations. Tus-
can breeds are in a more worrisome situation with their population sizes and inbreeding levels
being at critical levels. The MUP breed presented average FROH values equal to 0.33 and 0.13
for short and long runs, respectively. The PON and CAL breeds had genomic inbreeding equal
to 0.30 in the first mentioned class and 0.9–0.6 in the last, respectively. To the best of our
knowledge, studies on Tuscan breeds here investigated were not present in literature, but sev-
eral studies on local cattle breeds reported lower FROH values than our results. Addo et al. [37]
analyzed two German local cattle populations (Angler and Red-and-White dual-purpose
breeds) compared to Red Holstein and, on the contrary of this study, is the cosmopolitan pop-
ulation to have the greater values of genomic inbreeding. However, FROH decreased quickly in
the two local breeds, arriving to 0.009 and 0.02 in>16 Mbp length class, while in the Tuscan
breeds FROH ranged from 0.06 to 0.13.
Quantification of the genome wide autozygosity for genetic conservation aims is funda-
mental because several studies correlated FROH with inbreeding depression in production and
fertility traits [38–40]. In addition, recent inbreeding could fix recessive deleterious variants
because there was a strong positive correlation between the number of deleterious homozy-
gotes and the genomic ROH proportion [41].
Selection signatures and Gene enrichment
The higher threshold used in this study (80% of frequency) for the investigation of selection
signatures, led to the identification of a common run between breeds. It is located on BTA21,
starting from 83.766 kbp to 1,786.020 kbp.
An interesting genomic region with an occurrence of more than 80%, has been found in
CAL on BTA16 (from 99,900 to 1,163,809 bp), where MYOG and FMOD genes were located.
MYOG is related with MSTN gene which regulates muscle mass. The different myogenin geno-
types are related to the variation in the number of muscle fibers and the growth rate, which
lead to a variation in the muscle mass [42]. Indeed, has been suggested to use MYOG in
marker-assisted selection for improving the growth trait in chicken [43].
FMOD plays an important role in the maintenance of mature tissues and has been discov-
ered that reduces scar formation without diminishing the tensile strength in adult wound
models (i.e. mice, rats and pig) [44]. It might be related to the higher rusticity and adaptability
to harshly areas of local breeds. CHA reported a genomic region dense in genes (Table 4) on
BTA5 (from 56,722,571 to 58,464,570 bp). Here two groups of genes are located: the first one
included TIMELESS, APON, APOF, STAT2, IL23A and PAN2; the second one contained sev-
eral genes of Olfactory Receptor Families.
PLOS ONE Genetic diversity and population history of eight Italian beef cattle breeds
PLOS ONE | https://doi.org/10.1371/journal.pone.0248087 October 25, 2021 16 / 21

APOF and APON are apolipoproteins which are component of lipoproteins and it has been
showed that overexpression of Apolipoprotein F in mice reduced HDL cholesterol levels by
20–25% by accelerating clearance from the circulation [45].
Olfactory receptors (ORs) are essential for mammals to avoid dangers and search food [46].
Nowadays, a few genome-wide association studies reported associations between ORs and
intake-related traits of livestock. Magalhães et al. [47] argued that olfactory receptors play a
role in transferring energy within the cell, participating in the change of GDP (guanosine
diphosphate) to GTP (guanosine triphosphate). Other explanations for the effect of ORs on
meat traits are their action by promoting the absorption of fatty acids and by differentiating
adipocyte, that leads to an increase in accumulation of fat; in addition, their known role to
increase the search of food improve the weight gain.
This cluster of genes found in CHA, is in line with artificial selection purposes, as for LIM,
which included in the first significant run (BTA2; 5,305,197–7,958,492 bp), the presence of
MSTN gene. It is known that MSTN inhibits the proliferation of muscle fibers, regulating mus-
cle mass by negatively influencing cell differentiation via the myogenic regulatory factors
(such as MYOG) [48]; three traits are associated with this gene: meat color L� (QTL:11644),
meat percentage (QTL:11883; QTL:18424) and meat weight (QTL:11694) (https://www.
animalgenome.org). Previous studies identified MSTN within ROH island in Limousine cattle,
highlighting that MSTN is a gene under selective pressure for the phenotypic features in Lim-
ousine breed, indeed, MSTN has a strong positive effect on muscling and it is negative corre-
lated with fat deposition [14, 49].
MUP and PON presented consecutive genomic regions on BTA5, sharing the CACNG2gene. Interestingly, this gene was found to be associated with milk protein percentage QTL
(https://www.animalgenome.org), which is probably because these two breeds originate from
several past crossbreeding events including with Holstein and Schwyz (MUP) [34] and Reggi-
ana (PON) (http://www.anacli.it).
Homozygosity by descent (HBD) segments and global inbreeding
The parameters used in this analysis were chosen according to ROH results. The length of
ROH ranged from >0 and<16 Mbp, consequently, we are interested to investigate HBD clas-
ses with RK equal to 2, 4, 8, 16, 32, 64, which correspond to 1, 2, 4, 8, 16 and 32 generations
ago. FG values are higher than FROH observing the equivalent length of segments, and this
could be because the algorithm has difficulties to detect very short ROH when a low and/or
medium density chips have used [10], even if the HBD probability of the SNP in these regions
can be estimated, leading to FG values higher than FROH values. However, within 32 genera-
tions, no pronounced differences in FG levels have been found by Solè et al. [18] when low,
medium or high density SNP chips were compared, defining GGP-LDv4 33k SNP chip ade-
quate and cheaper for HBD segments identification. The greater proportion of HBD genome
originated from ancient ancestors dates back to 32 generations ago and this is in line with the
numerous short ROH detected. An unexpected result was that Sardinian breeds showed
almost halved values in HBD classes (when RK is 64) compared to cosmopolitan, suggesting
that for these breeds, RK should be increased in order to detect shorter HBD segments which
have been found during ROH analysis (Fig 5). It would be interesting to investigate historic
events during the 16th and 32th generation observing the inbreeding increase from each to the
other generation. No pedigree data on these generations was available when pedigree inbreed-
ing has been calculated in a previous study for these Italian breeds, except for CHA whose
results are comparable [33].
PLOS ONE Genetic diversity and population history of eight Italian beef cattle breeds
PLOS ONE | https://doi.org/10.1371/journal.pone.0248087 October 25, 2021 17 / 21

However, in the last generations the inbreeding coefficients decreased. This suggests that
the increased attention to the maintenance of biodiversity have led to a greater mating control
by farmers. Unexpectedly, the investigation of individual proportion of HBD genome, identi-
fied some individuals that are not HBD. Further analyses are needed but these individuals
could be identified and selected for their use in mating programs to decrease inbreeding. Fur-
thermore, animals with a small proportion of HBD genome compared to population could be
also useful in conservation plans of local endangered cattle. Nevertheless, the worrisome situa-
tion for Tuscan breeds in terms of inbreeding has been underlined. Also, issues in mating
management have been arising since the global inbreeding depends on past ancestors but also
to recent generations. Given the limited diffusion of CAL, MUP and PON, the number of
potential matings is extremely reduced.
Conclusion
The genomic results using a low-density SNP chip panel showed critical inbreeding levels in
smaller local populations. Cosmopolitan breeds showed lower genetic variability but also neg-
ligible inbreeding levels, demonstrating the soundness of the ongoing breeding scheme. The
population structure and genetic distances highlighted a clear separation among the breeds,
with clusters related to productive purposes and sample sizes. The results obtained in this
study represent a useful tool for preserving biodiversity, proving background information for
the correct genetic management and conservation for the described populations.
Supporting information
S1 Table. Number of ROH per chromosome in each breed, where CAL = Calvana;
CHA = Charolais; LIM = Limousine; MUP = Mucca Pisana; PON = Pontremolese;
SAB = Sardo Bruna; SAM = Sardo Modicana; SAR = Sarda.
(DOCX)
S2 Table. Characterization of genomic regions with frequency equal to 80% of ROH occur-
rence, where CAL = Calvana; CHA = Charolais; LIM = Limousine; MUP = Mucca Pisana;
PON = Pontremolese; SAB = Sardo Bruna; SAM = Sardo Modicana; SAR = Sarda.
(DOCX)
S3 Table. List of genes within significant ROH (80% of occurrence) with a minimum of 15
SNPs, where CAL = Calvana; CHA = Charolais; LIM = Limousine; MUP = Mucca Pisana;
PON = Pontremolese.
(DOCX)
Acknowledgments
We acknowledge Associazione Nazionale Allevatori delle razze bovine Charolaise e Limousine
(ANACLI) for providing the data.
Author Contributions
Data curation: Emmanuel Lozada-Soto.
Formal analysis: Maria Chiara Fabbri.
Funding acquisition: Stefano Biffani, Riccardo Bozzi.
Methodology: Francesco Tiezzi, Christian Maltecca.
PLOS ONE Genetic diversity and population history of eight Italian beef cattle breeds
PLOS ONE | https://doi.org/10.1371/journal.pone.0248087 October 25, 2021 18 / 21

Project administration: Riccardo Bozzi.
Supervision: Christos Dadousis, Stefano Biffani, Riccardo Bozzi.
Writing – original draft: Maria Chiara Fabbri.
Writing – review & editing: Christos Dadousis, Francesco Tiezzi, Christian Maltecca,
Emmanuel Lozada-Soto, Stefano Biffani, Riccardo Bozzi.
References1. Ceballos FC, Joshi PK, Clark DW, Ramsay M, Wilson JF. Runs of homozygosity: windows into popula-
tion history and trait architecture. Nat Rev Genet 2018; 19:220–34. https://doi.org/10.1038/nrg.2017.
109 PMID: 29335644
2. Kirin M, McQuillan R, Franklin CS, Campbell H, McKeigue PM, Wilson JF. Genomic Runs of Homozy-
gosity Record Population History and Consanguinity. PLOS ONE 2010; 5:e13996. https://doi.org/10.
1371/journal.pone.0013996 PMID: 21085596
3. Zhang Q, Calus MP, Guldbrandtsen B, Lund MS, Sahana G. Estimation of inbreeding using pedigree,
50k SNP chip genotypes and full sequence data in three cattle breeds. BMC Genet 2015;16. https://doi.
org/10.1186/s12863-015-0168-1 PMID: 25887754
4. Wright S. Coefficients of Inbreeding and Relationship. Am Nat 1922; 56:330–8.
5. Keller MC, Visscher PM, Goddard ME. Quantification of Inbreeding Due to Distant Ancestors and Its
Detection Using Dense Single Nucleotide Polymorphism Data. Genetics 2011; 189:237–49. https://doi.
org/10.1534/genetics.111.130922 PMID: 21705750
6. Broman KW, Weber JL. Long Homozygous Chromosomal Segments in Reference Families from the
Centre d’Etude du Polymorphisme Humain. Am J Hum Genet 1999; 65:1493–500. https://doi.org/10.
1086/302661 PMID: 10577902
7. Saura M, Fernandez A, Varona L, Fernandez AI, de Cara MAR, Barragan C, et al. Detecting inbreeding
depression for reproductive traits in Iberian pigs using genome-wide data. Genet Sel Evol GSE 2015;
47:1. https://doi.org/10.1186/s12711-014-0081-5 PMID: 25595431
8. Yengo L, Zhu Z, Wray NR, Weir BS, Yang J, Robinson MR, et al. Detection and quantification of
inbreeding depression for complex traits from SNP data. Proc Natl Acad Sci 2017; 114:8602–7. https://
doi.org/10.1073/pnas.1621096114 PMID: 28747529
9. Mastrangelo S, Jemaa SB, Ciani E, Sottile G, Moscarelli A, Boussaha M, et al. Genome-wide detection
of signatures of selection in three Valdostana cattle populations. J Anim Breed Genet 2020; 137:609–
21. https://doi.org/10.1111/jbg.12476 PMID: 32219904
10. Nandolo W, Meszaros G, Banda LJ, Gondwe TN, Lamuno D, Mulindwa HA, et al. Timing and Extent of
Inbreeding in African Goats. Front Genet 2019;10. https://doi.org/10.3389/fgene.2019.00010 PMID:
30815010
11. Mastrangelo S, Tolone M, Sardina MT, Sottile G, Sutera AM, Di Gerlando R, et al. Genome-wide scan
for runs of homozygosity identifies potential candidate genes associated with local adaptation in Valle
del Belice sheep. Genet Sel Evol 2017; 49:84. https://doi.org/10.1186/s12711-017-0360-z PMID:
29137622
12. Dadousis C, Cecchi F, Ablondi M, Fabbri MC, Stella A, Bozzi R. Keep Garfagnina alive. An integrated
study on patterns of homozygosity, genomic inbreeding, admixture and breed traceability of the Italian
Garfagnina goat breed. PLOS ONE 2021; 16:e0232436. https://doi.org/10.1371/journal.pone.0232436
PMID: 33449925
13. Strillacci MG, Marelli SP, Martinez-Velazquez G. Hybrid Versus Autochthonous Turkey Populations:
Homozygous Genomic Regions Occurrences Due to Artificial and Natural Selection. Animals 2020;
10:1318. https://doi.org/10.3390/ani10081318 PMID: 32751760
14. Szmatoła T, Gurgul A, Ropka-Molik K, Jasielczuk I, Ząbek T, Bugno-Poniewierska M. Characteristics of
runs of homozygosity in selected cattle breeds maintained in Poland. Livest Sci 2016; 188:72–80.
https://doi.org/10.1016/j.livsci.2016.04.006.
15. Xu L, Zhao G, Yang L, Zhu B, Chen Y, Zhang L, et al. Genomic Patterns of Homozygosity in Chinese
Local Cattle. Sci Rep 2019; 9:16977. https://doi.org/10.1038/s41598-019-53274-3 PMID: 31740716
16. Alvarez I, Fernandez I, Traore A, Perez-Pardal L, Menendez-Arias NA, Goyache F. Ancient Homozy-
gosity Segments in West African Djallonke Sheep Inform on the Genomic Impact of Livestock Adapta-
tion to the Environment. Anim Open Access J MDPI 2020; 10. https://doi.org/10.3390/ani10071178
PMID: 32664651
PLOS ONE Genetic diversity and population history of eight Italian beef cattle breeds
PLOS ONE | https://doi.org/10.1371/journal.pone.0248087 October 25, 2021 19 / 21

17. Druet T, Oleński K, Flori L, Bertrand AR, Olech W, Tokarska M, et al. Genomic Footprints of Recovery
in the European Bison. J Hered 2020; 111:194–203. https://doi.org/10.1093/jhered/esaa002 PMID:
32027367
18. Sole M, Gori A-S, Faux P, Bertrand A, Farnir F, Gautier M, et al. Age-based partitioning of individual
genomic inbreeding levels in Belgian Blue cattle. Genet Sel Evol GSE 2017; 49:92. https://doi.org/10.
1186/s12711-017-0370-x PMID: 29273000
19. Senczuk G, Mastrangelo S, Ciani E, Battaglini L, Cendron F, Ciampolini R, et al. The genetic heritage of
Alpine local cattle breeds using genomic SNP data. Genet Sel Evol 2020; 52:40. https://doi.org/10.
1186/s12711-020-00559-1 PMID: 32664855
20. Mastrangelo S, Tolone M, Gerlando RD, Fontanesi L, Sardina MT, Portolano B. Genomic inbreeding
estimation in small populations: evaluation of runs of homozygosity in three local dairy cattle breeds.
Animal 2016; 10:746–54. https://doi.org/10.1017/S1751731115002943 PMID: 27076405
21. Fontanesi L, Scotti E, Samorè AB, Bagnato A, Russo V. Association of 20 candidate gene markers with
milk production and composition traits in sires of Reggiana breed, a local dairy cattle population. Livest
Sci 2015; 176:14–21. https://doi.org/10.1016/j.livsci.2015.03.022.
22. Chang CC, Chow CC, Tellier LC, Vattikuti S, Purcell SM, Lee JJ. Second-generation PLINK: rising to
the challenge of larger and richer datasets. GigaScience 2015;4. https://doi.org/10.1186/s13742-014-
0038-1 PMID: 25741440
23. Dixit SP, Singh S, Ganguly I, Bhatia AK, Sharma A, Kumar NA, et al. Genome-Wide Runs of Homozy-
gosity Revealed Selection Signatures in Bos indicus. Front Genet 2020; 11. https://doi.org/10.3389/
fgene.2020.00092 PMID: 32153647
24. Meyermans R, Gorssen W, Buys N, Janssens S. How to study runs of homozygosity using PLINK? A
guide for analyzing medium density SNP data in livestock and pet species. BMC Genomics 2020;
21:94. https://doi.org/10.1186/s12864-020-6463-x PMID: 31996125
25. Manunza A, Noce A, Serradilla JM, Goyache F, Martınez A, Capote J, et al. A genome-wide perspective
about the diversity and demographic history of seven Spanish goat breeds. Genet Sel Evol 2016;
48:52. https://doi.org/10.1186/s12711-016-0229-6 PMID: 27455838
26. scatterplot3d function | R Documentation n.d. https://www.rdocumentation.org/packages/scatterplot3d/
versions/0.3-41/topics/scatterplot3d (accessed January 20, 2021).
27. Biscarini F, Cozzi P, Gaspa G, Marras G. detectRUNS: Detect Runs of Homozygosity and Runs of Het-
erozygosity in Diploid Genomes. 2019.
28. Marras G, Gaspa G, Sorbolini S, Dimauro C, Ajmone-Marsan P, Valentini A, et al. Analysis of runs of
homozygosity and their relationship with inbreeding in five cattle breeds farmed in Italy. Anim Genet
2015; 46:110–21. https://doi.org/10.1111/age.12259 PMID: 25530322
29. FerenčakovićM, HamzićE, Gredler B, Solberg TR, Klemetsdal G, Curik I, et al. Estimates of autozygos-
ity derived from runs of homozygosity: empirical evidence from selected cattle populations. J Anim
Breed Genet 2013; 130:286–93. https://doi.org/10.1111/jbg.12012 PMID: 23855630
30. McQuillan R, Leutenegger A-L, Abdel-Rahman R, Franklin CS, Pericic M, Barac-Lauc L, et al. Runs of
homozygosity in European populations. Am J Hum Genet 2008; 83:359–72. https://doi.org/10.1016/j.
ajhg.2008.08.007 PMID: 18760389
31. Alemu SW, Kadri NK, Harland C, Faux P, Charlier C, Caballero A, et al. An evaluation of inbreeding
measures using a whole-genome sequenced cattle pedigree. Heredity 2020. https://doi.org/10.1038/
s41437-020-00383-9 PMID: 33159183
32. Druet T, Bertrand A, Kadri N, Gautier M. The RZooRoH package n.d.:46.
33. Fabbri MC, Goncalves de Rezende MP, Dadousis C, Biffani S, Negrini R, Souza Carneiro PL, et al.
Population Structure and Genetic Diversity of Italian Beef Breeds as a Tool for Planning Conservation
and Selection Strategies. Anim Open Access J MDPI 2019;9. https://doi.org/10.3390/ani9110880
PMID: 31671823
34. Fabbri MC, Dadousis C, Bozzi R. Estimation of Linkage Disequilibrium and Effective Population Size in
Three Italian Autochthonous Beef Breeds. Animals 2020; 10:1034. https://doi.org/10.3390/
ani10061034 PMID: 32545850
35. Cesarani A, Sorbolini S, Criscione A, Bordonaro S, Pulina G, Battacone G, et al. Genome-wide variabil-
ity and selection signatures in Italian island cattle breeds. Anim Genet 2018; 49:371–83. https://doi.org/
10.1111/age.12697 PMID: 30070013
36. Peripolli E, Stafuzza NB, Amorim ST, de Lemos MVA, Grigoletto L, Kluska S, et al. Genome-wide scan
for runs of homozygosity in the composite Montana Tropical® beef cattle. J Anim Breed Genet Z Tier-
zuchtung Zuchtungsbiologie 2020; 137:155–65. https://doi.org/10.1111/jbg.12428 PMID: 31397015
PLOS ONE Genetic diversity and population history of eight Italian beef cattle breeds
PLOS ONE | https://doi.org/10.1371/journal.pone.0248087 October 25, 2021 20 / 21

37. Addo S, Klingel S, Hinrichs D, Thaller G. Runs of Homozygosity and NetView analyses provide new
insight into the genome-wide diversity and admixture of three German cattle breeds. PLOS ONE 2019;
14:e0225847. https://doi.org/10.1371/journal.pone.0225847 PMID: 31800604
38. Browett S, McHugo G, Richardson IW, Magee DA, Park SDE, Fahey AG, et al. Genomic Characterisa-
tion of the Indigenous Irish Kerry Cattle Breed. Front Genet 2018;9. https://doi.org/10.3389/fgene.2018.
00009 PMID: 29472945
39. Martikainen K, Tyriseva AM, Matilainen K, Poso J, Uimari P. Estimation of inbreeding depression on
female fertility in the Finnish Ayrshire population. J Anim Breed Genet 2017; 134:383–92. https://doi.
org/10.1111/jbg.12285 PMID: 28748554
40. Kim ES, Sonstegard TS, Van CT, Wiggans G, Rothschild MF. The Relationship between Runs of
Homozygosity and Inbreeding in Jersey Cattle under Selection. PloS One 2015; 10:e0129967–
e0129967. https://doi.org/10.1371/journal.pone.0129967 PMID: 26154171
41. Zhang Q, Guldbrandtsen B, Bosse M, Lund MS, Sahana G. Runs of homozygosity and distribution of
functional variants in the cattle genome. BMC Genomics 2015; 16:542. https://doi.org/10.1186/s12864-
015-1715-x PMID: 26198692
42. Xue H-L, Zhou Z-X. Effects of the MyoG Gene on the Partial Growth Traits in Pigs. Acta Genet Sin
2006; 33:992–7. https://doi.org/10.1016/S0379-4172(06)60134-0 PMID: 17112970
43. Wei Y, Zhang GX, Zhang T, Wang JY, Fan QC, Tang Y, et al. Myf5 and MyoG gene SNPs associated
with Bian chicken growth trait. Genet Mol Res GMR 2016;15. https://doi.org/10.4238/gmr.15037043
PMID: 27525903
44. Jiang W, Ting K, Lee S, Zara JN, Song R, Li C, et al. Fibromodulin reduces scar size and increases scar
tensile strength in normal and excessive-mechanical-loading porcine cutaneous wounds. J Cell Mol
Med 2018; 22:2510–3. https://doi.org/10.1111/jcmm.13516 PMID: 29392829
45. Lagor WR, Fields DW, Khetarpal SA, Kumaravel A, Lin W, Weintraub N, et al. The effects of apolipopro-
tein F deficiency on high density lipoprotein cholesterol metabolism in mice. PloS One 2012; 7:e31616.
https://doi.org/10.1371/journal.pone.0031616 PMID: 22363685
46. Lee SH, Cho YM, Lim D, Kim HC, Choi BH, Park HS, et al. Linkage Disequilibrium and Effective Popula-
tion Size in Hanwoo Korean Cattle. Asian-Australas J Anim Sci 2011; 24:1660–5. https://doi.org/2011.
24.12.1660.
47. Magalhães AFB, Camargo GMF de, Junior GAF, Gordo DGM, Tonussi RL, Costa RB, et al. Genome-
Wide Association Study of Meat Quality Traits in Nellore Cattle. PLOS ONE 2016; 11:e0157845. https://
doi.org/10.1371/journal.pone.0157845 PMID: 27359122
48. Snijders T, Wall BT, Dirks ML, Senden JMG, Hartgens F, Dolmans J, et al. Muscle disuse atrophy is not
accompanied by changes in skeletal muscle satellite cell content. Clin Sci 2014; 126:557–66. https://
doi.org/10.1042/CS20130295.
49. Esmailizadeh AK, Bottema CDK, Sellick GS, Verbyla AP, Morris CA, Cullen NG, et al. Effects of the
myostatin F94L substitution on beef traits. J Anim Sci 2008; 86:1038–46. https://doi.org/10.2527/jas.
2007-0589 PMID: 18245504
PLOS ONE Genetic diversity and population history of eight Italian beef cattle breeds
PLOS ONE | https://doi.org/10.1371/journal.pone.0248087 October 25, 2021 21 / 21