Genetic and Morphometric Variation in the Pacific ... · Genetic and Morphometric Variation in the...
19
Genetic and Morphometric Variation in the Pacific Sardine, Sardinops sagax caerulea: Comparisons and Contrasts with Historical Data and with Variability in the Northern Anchovy, Engraulis mordax Dennis Hedgecock, Elmarie S. Hutchinson, Gang Li, Frederic L. Sly, and Keith Nelson ABSTRACT: Pacific sardines from five widely separated localities are found to have little genetic variation both within and between populations. Of the 32 allozyme-coding loci examined from a total of 149 fish. the proportions that are polymorphic within a population (P) range from 7% to 27% with a mean of 12%. Average proportions of hetero- zygous individuals per locus (He) range from 0.5% to 1.6% with a mean of 1.0% over the five popula- tions. Pacific sardine populations are virtually ge- netically identical at the presumptive gene loci ex- amined. For each locus that is polymorphic in more than one population, the same rare variant allele is shared at about the same frequency, suggesting strongly that there has been gene flow throughout the present range of the species. These results con- trast with substantial genetic variation detected within and between northern anchovy populations from the California central stock (average P = 40%. average He = 7.5%) and with the significantly higher levels of genetic variation reported for other marine clupeoids. Despite a low level of genetic variation. the Pacific sardine shows a north-south cline in size-at-age that is as steep and as large as that seen in historical. precollapse populations. In the past, such differences were interpreted as evi- dence of genetically distinct subpopulations. Our results imply that rapid differentiation of growth rate among geographic populations, probably to- gether with differentiation of correlated life history traits. is largely environmentally, and not geneti- cally, determined. It appears that biological data from historical populations can safely be used for area-specific fisheries models of the recovering sar- dine stocks in California. A variety of studies have suggested that. prior to its collapse in abundance, the Pacific sardine, Dennis Hedgecock, Elmarie S. Hutchinson, Frederic L. Sly, Keith Nelson: Aquaculture and Fisheries Program, University of California, Davis, Bodega Marine Laboratory. Bodega Bay, CA 94923. Li Gang, South China Sea Institute of Oceanology. Aca- demia Sinica, 164 Xin Gang-Xi Road, Guangzhou. People's Republic of China. Manuscript accepted February 1989. Fishery Bulletin, U.S. 87:653-671. Sardinops sagax wendea. comprised two or more distinct subpopulations (morphometry and meristics: Hubbs 1925; Clark 1936, 1947; McHugh 1950; growth: Phillips 1948; Felin 1954; Clark and Marl' 1955; Radovich 1962, 1982; movements of tagged fish: Clark and Janssen 1945; Clark and Marl' 1955; spatio- temporal distribution of spawning: Ahlstrom 1954, 1959; erythrocyte antigens: Sprague and Vrooman 1962; Vrooman 1964; reviews by Marl' 1957; Radovich 1982). Population structure likely played a role in the collapse of the fishery, perhaps directly, by virtue of differences among subpopulations in life histOl'y and resilience to fishing pressure (Wisner 1961; Murphy 1966; Radovich 1982) and more celtainly, indirectly, by contributing to overestimations of stock size in the waning years of the fishery (MacCall 1979). With the return of substantial numbers of Pacific sardines to the California Current in recent years and the lifting of the fishing mora- torium (Wolf et al. 1987) has come interest in management questions such as wh-ich sardine has recovered and what life history character- istics and yields can be expected (MacCaIl1986). We have made studies of protein and morpho- logical variation in the Pacific sardine to shed light on such questions. Electrophoretic separa- tion of proteins followed by chemical staining to reveal the locations of proteins or specific en- zymes allows inferences to be made concerning variation in the genes encoding these proteins. This in turn provides a description, useful for management, of the genetic structures of ex- ploited fish populations (see Ryman and Utter 1987). Several clupeoids, including the northern anchovy, EngrauHs 1norda..l=, which co-occurs with the Pacific sardine in the California Cur- rent, have been shown to harbor considerable stores of electrophoretically detectable genetic variability <Hedgecock and Li 1983; Table 8). In this paper, we compare protein and allozyme variation in samples of Pacific sardines collected 653
-
Upload
truongminh -
Category
Documents
-
view
230 -
download
0
Transcript of Genetic and Morphometric Variation in the Pacific ... · Genetic and Morphometric Variation in the...

Genetic and Morphometric Variation in the PacificSardine, Sardinops sagax caerulea: Comparisons and
Contrasts with Historical Data and with Variability inthe Northern Anchovy, Engraulis mordax
Dennis Hedgecock, Elmarie S. Hutchinson, Gang Li,Frederic L. Sly, and Keith Nelson
ABSTRACT: Pacific sardines from five widelyseparated localities are found to have little geneticvariation both within and between populations. Ofthe 32 allozyme-coding loci examined from a totalof 149 fish. the proportions that are polymorphicwithin a population (P) range from 7% to 27% witha mean of 12%. Average proportions of heterozygous individuals per locus (He) range from 0.5%to 1.6% with a mean of 1.0% over the five populations. Pacific sardine populations are virtually genetically identical at the presumptive gene loci examined. For each locus that is polymorphic in morethan one population, the same rare variant allele isshared at about the same frequency, suggestingstrongly that there has been gene flow throughoutthe present range of the species. These results contrast with substantial genetic variation detectedwithin and between northern anchovy populationsfrom the California central stock (average P =40%. average He = 7.5%) and with the significantlyhigher levels of genetic variation reported for othermarine clupeoids. Despite a low level of geneticvariation. the Pacific sardine shows a north-southcline in size-at-age that is as steep and as large asthat seen in historical. precollapse populations. Inthe past, such differences were interpreted as evidence of genetically distinct subpopulations. Ourresults imply that rapid differentiation of growthrate among geographic populations, probably together with differentiation ofcorrelated life historytraits. is largely environmentally, and not genetically, determined. It appears that biological datafrom historical populations can safely be used forarea-specific fisheries models of the recovering sardine stocks in California.
A variety of studies have suggested that. priorto its collapse in abundance, the Pacific sardine,
Dennis Hedgecock, Elmarie S. Hutchinson, Frederic L.Sly, Keith Nelson: Aquaculture and Fisheries Program,University of California, Davis, Bodega Marine Laboratory.Bodega Bay, CA 94923.Li Gang, South China Sea Institute of Oceanology. Academia Sinica, 164 Xin Gang-Xi Road, Guangzhou. People'sRepublic of China.
Manuscript accepted February 1989.Fishery Bulletin, U.S. 87:653-671.
Sardinops sagax wendea. comprised two ormore distinct subpopulations (morphometry andmeristics: Hubbs 1925; Clark 1936, 1947;McHugh 1950; growth: Phillips 1948; Felin1954; Clark and Marl' 1955; Radovich 1962,1982; movements of tagged fish: Clark andJanssen 1945; Clark and Marl' 1955; spatiotemporal distribution of spawning: Ahlstrom1954, 1959; erythrocyte antigens: Sprague andVrooman 1962; Vrooman 1964; reviews byMarl' 1957; Radovich 1982). Population structurelikely played a role in the collapse of the fishery,perhaps directly, by virtue of differences amongsubpopulations in life histOl'y and resilience tofishing pressure (Wisner 1961; Murphy 1966;Radovich 1982) and more celtainly, indirectly,by contributing to overestimations of stock sizein the waning years of the fishery (MacCall1979). With the return of substantial numbers ofPacific sardines to the California Current inrecent years and the lifting of the fishing moratorium (Wolf et al. 1987) has come interest inmanagement questions such as wh-ich sardinehas recovered and what life history characteristics and yields can be expected (MacCaIl1986).
We have made studies of protein and morphological variation in the Pacific sardine to shedlight on such questions. Electrophoretic separation of proteins followed by chemical staining toreveal the locations of proteins or specific enzymes allows inferences to be made concerningvariation in the genes encoding these proteins.This in turn provides a description, useful formanagement, of the genetic structures of exploited fish populations (see Ryman and Utter1987). Several clupeoids, including the northernanchovy, EngrauHs 1norda..l=, which co-occurswith the Pacific sardine in the California Current, have been shown to harbor considerablestores of electrophoretically detectable geneticvariability <Hedgecock and Li 1983; Table 8). Inthis paper, we compare protein and allozymevariation in samples of Pacific sardines collected
653

from five widely separated localities with thatdetected by us in nine trawl samples of northemanchovy taken from the central stock (sensuVrooman et al. 1981).
MATERIALS AND METHODS
Sardinops sagax
Collections
Samples were collected from Guaymas,Sonora, Mexico (February 1985; Fig. I, GUAYM;
N := 48), Magdalena Bay, Baja Califomia Sur,Mexico (May 1984; MAGDA; N = 37), the Southern California Bight (February-April 1986;Huntington Beach, CA, N := 8; San Pedro, CA,N := 28; pooled into one sample, SOCAL),
Monterey Bay, CA (November 1984; MONTE; N:= 29) and Tomales Bay, CA <December 1984;TOMAL; N := 5). Whole fish were frozen after
FISHERY BULLETIN: VOL. 87. NO.3. 1989
collection and transpOlted to the Bodega MarineLaboratory where they were kept at -70°Cuntil thawed for morphometric measurementsand dissection of tissue samples for electrophoresis.
Morphological Characters
Measurements of the following 12 morphometric traits were made on partially thawedspecimens using either vernier caliper ormounted millimeter rule: a series of lengthsmeasured from the snout to the 1) end of thehypural bones (standard length), 2) anteriormargin of the orbit, 3) posterior edge of themaxillary, 4) posterior border of the supraoccipital, 5) posterior edge of the operculum, 6)dorsal-fin origin, and 7) vent, followed bymeasurements of 8) interorbital width, 9) maximum head width, 10) minimum body depth, 11)
IIII
"-" ,
","" "- ,
" "
FIGURE I.-Map showing locations of collections for Pacific sardine(solid arrowheads) and northern anchovy (open arrowheads).
654

HEDGECOCK ET AL.: GENETIC VARIATION IN PACIFIC SARDINES
anal-fin-base length, and 12) caudal-peduncledepth.
Tissue Samples
After morphological measurements weremade, eye, heaIt, liver, and skeletal (epa.xial)muscle tissues were dissected from each specimen for electrophoretic analyses. Tissue sampleswere kept in plastic well-trays on ice during dissection, then covered and stored frozen at -70°Cfor a peliod of several days prior to electrophoresis. The day before electrophoresis, tissue samples were thawed, equal volumes of 0.5 M TrisHCI, pH 7.1 buffer were added to the samples,and the tissues were homogenized on ice, byhand, with a ground-glass pestle. Homogenizedsamples were then returned to the -70°Cfreezer overnight. On the day of electrophoresis,samples were allowed to thaw slowly on ice.
Otoliths
Sagittal otoliths were removed from specimens and cleared overnight in a 2% KOH solution. They were then linsed in deionized waterfor one or more days, air dried, placed by pairs ingelatin capsules with the specimen number, andstored in envelopes labeled by population. Specimen identification for the Magdalena Bay samplewas lost.
The age of each specimen was determined bycounting otolith annuli following the methods ofCollins and Spratt (1969). Each pair of otolithswas placed for examination under water in aseparate well (1 cm in diameter and paintedblack) drilled into a stlip of plexiglass. All annuliwere counted under a binocular dissection microscope with incident illumination by one of us (F.L. Sly). His recounts agreed with his initialcounts (98% consistency); in a comparison test,80% of his counts were in agreement with thoseof California State Department of Fish andGame otolith readers.
Electrophoretic Protocol, GeneticInterpretation, and Allozyme Nomenclature
Methods for horizontal starch-gel electrophoresis, protein assays, aI1(1 genetic interpretationof zymograms were substantially the same asthose described previously (Ayala et al. 1973;Tracey et al. 1975; Utter et al. 1987). The protocol used to separate and resolve 20 enzymes orproteins infelTed to be encoded by a total of 32
genes is summarized in Table 1. Nomenclaturesfor proteins, for genes inferred to encode theseproteins, and for alleles at these genes are detailed by Utter et al. (1987). Proteins are referred to by the capitalized abbreviations givenin Table 1 and the cOlTesponding genes by thesesame abbreviations italicized "in upper and lowercase. Numerical suffixes distinguish amongisozymes or multiple proteins in order of increasing anodal migration. Alleles are symbolized byitalicized numerals obtained by adding or subtracting the number of millimeters separatingValiaIltS from the most common electromorphsobserved for each protein. Alleles encoding common electromorphs are arbitrarily designated100. Specimens from several populations wereincluded in every electrophoretic run so that repeated compalisons of relative mobilities of theirallozymes were made.
Allozyme Data Analysis
Maximum-likelihood estimates of allelic frequencies and observed proportions of heterozygous genotypes at each locus scored in at leasttwo population samples were computed fromnumbers of individuals in allelic or genotypiccategories and the total numbers of genomes(2N) or individuals (N) sampled, respectively.Observed and expected proportions of heterozygous genotypes at each locus were averagedover loci to obtain means (Nei's [1978] unbiasedestimates of Ho and He, respectively). The proportion of genes for which any electrophoreticvariation was detected in a population samplewas defined as P; for the population sample sizesused, this criterion of polymorphism is close tothe frequently used definition that the most common allele cannot exceed a frequency of 0.99 fora polymorphic locus. Averaging of P and Hoverpopulation samples was done using angulartransformation of these proportional values followed by back-transformation of means and confidence limits. Owing to the nature of the results, no flUther genetic statistics were calculated.
Morphometric Data Analysis
The BMDP multivariate statistical softwarepackage (Dixon 1981) was used to perform discriminant function (P7M) and principal component (P4M) analyses on log-transformed morphometric data. Standard settings were used in thediscriminant analysis for toleran<:.e (O.Oll, F-to-
655

FISHERY BULLETIN: VOL. 87. NO.3. 1989
TABLE 1.-8tarch-gel electrophoretic protocols used to reveal allozyme variation.
Pacific sardine Northern anchovy
No. No.Enzyme or protein E.C. no. Tissue Buffer1 loci Tissue Buffer' loci
AAT aspartate aminotransferase 2.6.1.1 E AAOA adenosine deaminase 3.5.4.4 L A 1 L AAOH alcohol dehydrogenase 1.1.1.1 E B 1AOK adenylate kinase 2.7.4.3 M 0 2 M 0 1ALOO aldolase 4.1.2.13 M B 1CK creatine kinase 2.7.3.2 M 0 1 M 0 1EST esterase2 3.1.1.- L A,B 1 L A 2FBP fructose biphosphatase 3.1.3.11 L B 1FUM fumarate hydratase 4.2.1.2 M C,O 1 M 0 1GAPOH glyceraldehyde-3-phosphate dehydrogenase 1.2.1.12 M C 2 M+E C 2GL dipeptidase3 3.4.13.11 E B 1GPOH glycerol-3-phosphate dehydrogenase 1.1.1.8 M 0 1 M 0 1GPI glucose-6-phosphate isomerase 5.3.1.9 L,M O,B 1 L B 1HBOH 3-hydroxybutyrate dehydrogenase 1.1.1.30 E+L B 2 E+L B 2HK hexokinase 2.7.1.1 M B 1IOH isocitrate dehydrogenase 1.1.1.42 H+L 0 2 H 0 1LAP leucine aminopeptidase 3.4.11.1 L A 1LOH lactate dehydrogenase 1.1.1.27 L+M B 2 L+M B 2LGG tripeptidase4 3.4.13.4 E B 1 E,L B 1LT dipeptidase5 3.4.13.11 E B 1 E+L B 2MDH malate dehydrogenase 1.1.1.37 H D 2 H D 2ME NAOP-dependent malate dehydrogenase6 1.1.1.40 M B 16PGOH 6-phosphogluconate dehydrogenase 1.1.1.44 E,M C 1 E,M CPGM phosphoglucomutase 2.7.5.1 M A 1 M APNP purine nucleoside phosphorylase 2.4.2.1 L EPP dipeptidase7 3.4.13.9 L B 1PROT general proteins6 general E+M A 4 E+M A 9SOD superoxide dismutase9 1.15.1.1 L B 1 L B 1TPI triosephosphate isomerase 5.3.1.1 M 0 1XOH xanthine dehydrogenase 1.1.1.204 L B 1
Totals1O 20 proteins, 32 loci 24 proteins, 39 loci
'Buffers A. B. C, and 0 as described by Tracey et a!. (1975); buffer Eis the lithium borate discontinuous buffer system 2of Selander et a!.(1971).
2a -naphthyl butyrate and (3-naphthyl acetate as substrates.3L-glycyl-Jeucine as substrate.4L.leucyl-glycyl-glycine as substrate.5A 1:1 mixture of L-Ieucyl-valine and L-Ieucyl-tyrosine as substrates.8Known as malic enzyme.7L-phenylalanyl-proline as substrate.8Stained with Coomassie blue.9Usually scored on gels stained for HBOH.,oOi- and tripeptidases counted as one enzyme in totals.
enter (4.000), F-to-remove (3.996), and priorprobabilities (equal).
Engraulis Mordax
Collections
Samples of 48 anchovies were obtained fromeach of nine midwater trawl stations (Fig. 1)occupied between the nights of 24 January and 1February 1982. by CalCOFI cruise 8202 aboardthe RV DavidSta1"rJo'rdan of NOAA SouthwestFisheries Center, La Jolla. CalCOFI grid coor-
656
dinates (CaICOFI Atlas No.1, 1963) for thesecollections and place names assigned to them forconvenience were as follows: 1) Half MoonBay, 63.3:51.0; 2) Half Moon Bay, 63.3:52.0; 3)Santa Cruz, 66.7:49.0; 4) Santa Cruz, 66.7:50.0;5) Santa Barbara, 81.3:42.4; 6) Point Dume,85.0:44.0; 7) Santa Monica Bay, 85.8:34.0; 8)Santa Monica Bay, 85.8:36.0; 9) Santa MonicaBay, 85.8:41.0. Whole fish were frozen individually aboard ship at -70°C and then packaged inplastic bags labeled by locality. Frozen packageswere shipped by air to the Bodega Marine

HEDGECOCK ET AL.: GENETIC VARIATION IN PACIFIC SARDINES
Laboratory where they were kept in a -70°Cfreezer until dissection.
Data Taken on Specimens
Eye, heart, liver, and skeletal muscle tissuesamples were taken from each of the 432 northern anchovy used for this study. For all specimens but those from population sample 8, standard length and sex were recorded and otolithswere taken. Annuli were counted by one of us(F. L. Sly) in a manner similar to that describedfor the sardine, following the methods of Collinsand Spratt (1969).
The electrophoretic protocol used to separate24 proteins encoded by 39 scorable genes is givenin Table 1. These proteins were assayed in tissuesamples from an average of nearly 46 specimens(minimum of three) from each of the 9 populationsamples. Genetic interpretation and allozymenomenclature were as described above for thesardine analysis with the following additions:1) Gels for polymorphic enzymes were scoredindependently by the authors D. Hedgecock andGang Li, and any discrepancy between the twoscores was resolved by reexamination and negotiation; and 2) problems with the resolution ofcertain allozymes from liver tissue became apparent. A pattern of missing IDH-2, missingEST-5, and blurred LDH-3 and HBDH-2 phenotypes-the last mimicking the 100/105 polymorphism-was subsequently associated with degenerated liver tissues in individual specimensor even entire population samples that were,perhaps, not frozen soon enough after trawling.IDH-2 appeared most sensitive to this and waseliminated from the study, except as an indicatorof degenerate liver tissue. To correct for potential bias in Hbdh-2 data, individual HBDH-2scores were omitted if (i) any other element ofthe above composite, degenerate-liver zymogram was observed in that individual and (ii)missing elements (i.e., IDH-2 and EST-5) wereobserved in at least one other specimen from thesame population sample (to prevent a missing orfailed enzyme assay from causing data rejection). Mean number of individuals assayed forHBDH per population sample was thus reducedto 33 ± 3.
Allozyme Data Analysis
Single-individual genotypes were recoded aspaired alphabetical characters and submitted tothe BIOSYS-1 program of Swofford and Selan-
del' (1981) for calculations of allelic frequencies,average proportions of heterozygous individualsper locus (Ho and He as defined above), proportions of polymorphic genes (P, where a locus isconsidered polymorphic if the frequency of themost common allele does not exceed 0.99), chisquare goodness-of-fit tests to Hardy-Weinberg-Castle (H-W-C) equilibrium genotypic proportions using Levene's (1949) correction forsmall sample sizes, Wright's (1978) F-statistics,and Nei's (1978) unbiased estimates of averagegenetic identity (l) and genetic distance (D).Averaging of P and H over population sampleswas done using angular transformation followedby back-transformation of means and confidencelimits. Spearman rank correlations of angulartransformed allelic frequencies with the sines oflatitude of collection localities, log-likelihoodratio (G) tests of the independence of allelic frequency and locality, and analyses of allelic frequencies cross-classified by locality, sex, and age(ACCCD; Fienberg 1980) were used to evaluatesources of genetic heterogeneity.
RESULTS
Sardinops sagax caerulea
Genetic Variation
We detected electrophoretic variation in thezymograms of seven proteins, including threedi- and tripeptidases, from Pacific sardines,(EST-6, FBP, GPDH, IDH-2, LGG, LT, PP,6PGDH, SOD; Table 2B). There is, however,remarkably little protein polymorphism and individual heterozygosity at the total 32 loci examined in 149 Pacific sardines (Table 2A). Theproportion of polymorphic genes ranges from7.4% in each of the samples from Tomales andMagdalena Bays to 26.9% in the Guaymassample, with an average of 12.3% (95% C.L.:6.4-19.6%). Average heterozygosities rangefrom 0.5% in the Magdalena Bay sample to 1.7%in the Guaymas sample, with a mean over allpopulation samples of 1.0% (95% C. L.: 0.61.5%). Estimates of genetic valiation are probably best for the Guaymas sample, for tworeasons: 1) There were generally larger numbers of individuals sampled per gene, which accounts for the finding of rare heterozygotes atIdh-2, Lgg, and Pp, loci that were not wellsampled elsewhere. 2) We sampled two moderately polymorphic loci, Est-6 and Fbp, that werenot scored in any other large population sample.There are no significant differences between
657

FISHERY BULLETIN: VOL. 87. NO.3, 1989
TABLE 2.-Allozyme variation in five population samples of Pacific sardine.
Tomales Monterey S. Calif. MagdalenaBay Bay Bight Bay Guaymas
A. Summary statisticsNo. of fish (N) 5 29 30 37 48No. of loci 27 27 23 27 26P (as percent) 7.4 14.8 8.7 7.4 26.9He, (as percent) 1.5 1.0 0.6 0.5 1.7He (as percent) 1.5 1.0 0.6 0.5 1.6
B. Polymorphic enzymes1
Variants No. of heterozygotes in samples of size (N)
EST-6 (103) o (5) 3 (48)FBP (102) 1 (5) 7 (47)GPDH (102) o (2) 1 (29) o (30) o (34) o (12)IDH-2 (93) o (5) o (22) 1 (29) o (23) 1 (48)LGG (96) o (5) o (30) o (7) 1 (48)LT (97) o (5) o (30) o (7) 1 (48)PP (103) o (5) 3 (28) o (30) 1 (37) 4 (48)6PGDH (103+98) 1 (5) 3 (29) 3 (30) 4 (37) 3+1 (48)SOD (93) o (5) 1 (29) o (30) o (37) o (48)
1Zymogram banding patterns of presumptive heterozygotes at the loci inferred to encodethese proteins conform to those expected on the basis of known subunit structures: tetramericstructure for FBP; dimeric structure for GPDH, IDH, LGG, 6PGDH, and SOD; monomericstructure for EST-6, LT and PP (Darnall and Klotz 1975; Harris and Hopkinson 1976; Ruth andWold 1976; Koehn and Eanes 1978; Utter et al. 1987).
observed and expected average heterozygositiesin any of the population samples. For no imlividual locus is it possible to test H-W-C expectedgenotypic proportions in a population sample,owing to the low frequencies of variant allelesand the relatively small sample sizes.
In addition to the low genetic valiation withineach of the samples of Pacific sardines, there isalmost no variation among populations in the frequencies of allozymes (Table 2B). Except for6PGDH, for which a third allozyme was inferredfrom observation of a single 98/103 heterozygousphenotype in the Guaymas sample, all polymorphic allozymes are represented by just two alleles. For each locus that is polymorphic in morethan one population, the same rare variant alleleis shared at about the same frequency (Table 2B).
Thus, the five, widely separated populations ofPacific sardine sampled in our study are virtuallygenetically identical at the 32 loci examined.
Ageing from Otolith Annuli
Under the assumption that an annulus represents a yearly growth ling and that fish withone ring are one year old, three age classes, 1's,2's, and 3's, predominate in all five populationsamples. There are no statistically significantdifferences in distribution of ages among thefour lal'ger samples X~df = 10.7083, 0.1 < P <0.5; data in Table 3). Nor is there a differencebetween the small Tomales Bay sample and theothers (Fisher's exact test on Tomales Bay dataversus all other data combined, P > 0.90).
TABLE 3.-Distributions of ages in five population samples of Pacific sardine.
Tomales Monterey S.Calif. MagdalenaAge Bay Bay Bight Bay Guaymas
1 0 9 10 19 212 4 14 14 13 223 1 3 5 1 34 0 0 1 0 0
Sample size: 5 26 30 33 46Mean: 2.2 1.8 1.8 1.5 1.6
658

Morphological Variation
In contrast to the similarity of age class compositions among population samples, size distributions among sites are grossly different, withsardines from California being much larger thanthose from Mexico (Fig. 2). Stepwise discriminant function analysis (DFA) of the 12 logtransformed morphometric variates reveals,after 10 steps, significant differences among thefive population samples (approximate F =
22.085 with 32,499 df, P « 0.001). However,discrimination is based plimarily on log of standard length which enters the discriminant function first with F = 243.49 (P « 0.001; 4, 142df). A principal component analysis (PCA) ofthose traits contlibuting to between-group valiance in the DFA produces a single factor,heavily and positively loaded by all traits andaccounting for 97% of the Valiance in data space(minimum factor eigenvalue set to 1.0); such afactor is generally interpreted to representvariance in size (Humphlies et al. 1981). Theevident geographic cline in size apparently reflects a cline in growth rate; at the extremes,
HEDGECOCK ET AL.: GENETIC VARIATION IN PACIFIC SARDINES
fish of the same age from central California andfrom the Gulf of California can differ in standal"d length by nearly 100 mm (see Figure 2).
Two further analyses do indicate minor butsignificant morphological variation attlibutableto shape differences among sardines from different geographic areas. First, two factors extracted in a PCA of log-transformed valiatesstandardized by subtraction of the log of standard length show complementary patterns offactor loadings suggestive of different allometries of head size relative to body size amongpopulations (Fig. 3A). The separation of populations along the factor 1 axis (Fig. 3B) isin.·versel-yrelated to standard length; i.e, lal'ger Californiafish are on the left of smaller Mexican fish, owingto the negative allometry of head dimensionsrelative to standard length. This result is consistent with observations on postlarval Pacific Sal'dines (McHugh 1950) as well as with a generalgeographical pattern in fish morphology (Jensen1944; Martin 1949),
Second, comparisons of pairs of populationsamples for which there is considerable overlapin the sizes of specimens (Southern California
Age
2 3
TOMAl
II
I
1 2 3
MONTE
I
SOCAl
1 234
t· 1
1-3
MAGDA
1 2 3
250
rTI.c o 10...01c:Q)
"0 200...as"0c:as...
(/)
150 I~;I
GUAYM
FIGURE 2.-Histograms of standard lengths for various ages of Pacific sardines in five populationsamples. Open arrowheads along the baselines of the Magdalena Bay and Southern California Bightpopulation samples indicate the mean sizes of two- and three-year-old fish in the 1961--62 sardine catchesof Blija California and Califonlia, respectively (from Vrooman 1964).
659

FISHERY BULLETIN: VOL. 87, NO.3. 1989
o
Factor 1
+2
6. 6.6. 6.v
6. 0 0• 6. V 0 006. ...
--~/v V~I 00t'.Iav I
V 0 ...OV 0 100 0
';;"v v o:qf" 0 ...0
.jJ'IJ § 0 V asu..... ... O~ /
I o 0 /('WV 0
0 I... /V ::'-010... ......I .....--... y -2
... t..V/ "'0 0 B0
-2
Factor 1
o
10VE
DO
SD
OPHWOR~
CP
AL
A
-1
...o... 0oas
LL
FIGURE 3.-1Al Loadings on the first two factors from a principal components analysis of size-standardized morphometric traitsmeasured on 147 Pacific sardines; 10 = interorbital width, VE = snout to vent length, DO = snout to dorsal-fin origin, AL =anal-fin base length. CP = caudal-peduncle depth, HW = maximum head width. BD = minimum body depth, OR = snout to orbitlength, OP = snout to operculum length, MX = snout to maxillary length, SO = snout to supraoccipital length. 18> Scores forindividual sardines on these first two factors. Open triangles, solid line: SOCAL; open inverted triangles. dashed line: MAGDA.Other populations are solid circles. TOMAL; solid triangles, MONTE; open circles, GUAYM I see Figure 1),
Bight VS. Monterey Bay and Magdalena Bay VS.
Guaymas) also show valiation in head: body-sizeallometry. A standard length range of 192--240mm defines a subset of the Monterey Bay samplecomprising 17 individuals whose mean length isidentical to that of the 30 southern Californiaspecimens. DFA of log-transformed variatestakes two steps to produce significant betweengroup variance (F = 13.344, P « 0.001; 2, 44df) and an average percent correct assignment ina posteriOli classifications of 77% C!'able 4A). Thetwo characters used in the classification functions are interorbital width and head width(Table 4A). Between subsets of similarly sizedfish (145--162 mm) from Guaymas (N = 37) andMagdalena Bay (N = 11), DFA of nine log-transformed variates (three were discarded to keepthe number of variates less than N = 11 forMagdalena Bay) produces significant variance inthree steps (F = 17.568, P « 0.001; 3, 44 df)and 90% correct classification (Table 4B). Maxillary length, interorbital width, and length ofanal-fin base contribute to the classification func-
tions for these two Mexican populations (Table4B).
Engraulis mordax
Genetic Variation Within Populations
Electrophoretic variation was detected in allnorthern anchovy proteins examined exceptALDO and CK. From this variation in proteinphenotypes, we infer that our samples of northern anchovy populations contain substantiallevels of individual genetic variation (Table 5>.Over the 39 loci examined, the average numberof alleles per locus per population is 1.61 ± 0.02,ranging from 1.49 ± 0.13 in the inshore HalfMoon Bay sample to 1.72 ± 0.16 in the offshoreSanta Cruz sample. PropOltions of polymorphicloci per population range from 33.3% in the inshore Half Moon Bay sample to 46.2% in themiddle station of the Santa Monica Bay transect;mean P over the nine samples is 39.8% (95%C.L.: 37.2--42.5%). Average expected hetero-
660

HEDGECOCK ET AL.: GENETIC VARIATION IN PACIFIC SARDINES
TABLE 4.-elassification functions and a posteriori (jackknifed)classifications from discriminant function analyses of similarlysized Pacific sardines from (A) California and (B) Mexican population samples.
A. California's classification functions:
Variate Monterey S. Calif. Bight
log interorbital -668.284 -597.504log head width 2437.560 2357.524constant -1311.788 --1274.079
Population % correct Cases classified in samplesample classifi-
(192-240 mm) cation Monterey S. Calif. Bight N
Monterey Bay 82.4 14 3 17S. Calif. Bight 73.3 8 22 30
B. Mexico's classification functions:
Variate
log maxillarylog interorbitallog anal-fin baseconstant
Guaymas
3061.400-449.694
521.755-2006.101
Magdalena Bay
2871.099-537.635
591.291-1949.291
Population % correct Cases classified in samplesample classifi-
(145-162 mm) cation Guaymas Magdalena Bay N
Guaymas 89.2 33 4 37Magdalena Bay 90.9 1 10 11
zygosities range from 6.9% in the inshore HalfMoon Bay and Point Dume samples to 8.0% inthe middle Santa Monica Bay sample, with amean over the nine samples of 7.5% (95% C.L.:7.1-7.9%). There are no significant differencesbetween observed and expected average heterozygosities in any of the samples.
Sample sizes and levels of polymorphism permit goodness-of-fit tests to H-W-C genotypicproportions in 27 cases, involving five lociFum, Hbdh-2. Lgg, Pgm, and Xcih. Prior to 14 ofthese tests, rare alleles were pooled and the frequencies of composite genotypic classes recalculated accordingly (Pamilo and Varvio-Aho.1984). The probability assigned to a significantdeviation from the H-W-C (null) hypothesis,P aO.05, was adjusted for multiple testing bydividing <l0.05 by the number of populations overwhich a given locus was simultaneously tested(Cooper 1968). None of the 27 tests is significantat the adjusted <l0.05 level, although chi-squarevalues for Hbdh-2 in the offshore Santa Cruzsample and for Lgg in the Point Dume samplecome close.
Deviations from H-W-C equilibrium forHbdh-2 and Lgg tend towards excess hetero-
zygotes. Wright's (1978) fixation indices <FIS) forHbdh-2 in population 4 and for Lgg in populations4, 6, and 8 (four chi-square tests with P 0;;; 0.06)are -0.49, -0.:37, -0.:36, and -0.19, respectively. Averaged over populations and alleles.F IS for Hbdh-2 and Lgg is -0.13 and -0.175,respectively; the weighted average F IS over allloci is -0.045 (see Table 7). There is, owing tothese excesses of heterozygotes within population samples, an overall excess of heterozygotesin the total population sampled (mean FIT overall loci and populations is -0.012), despite divergence among populations (next section), which isexpected to reduce heterozygosity (Wahlund1928).
Genetic Variation Between Populations
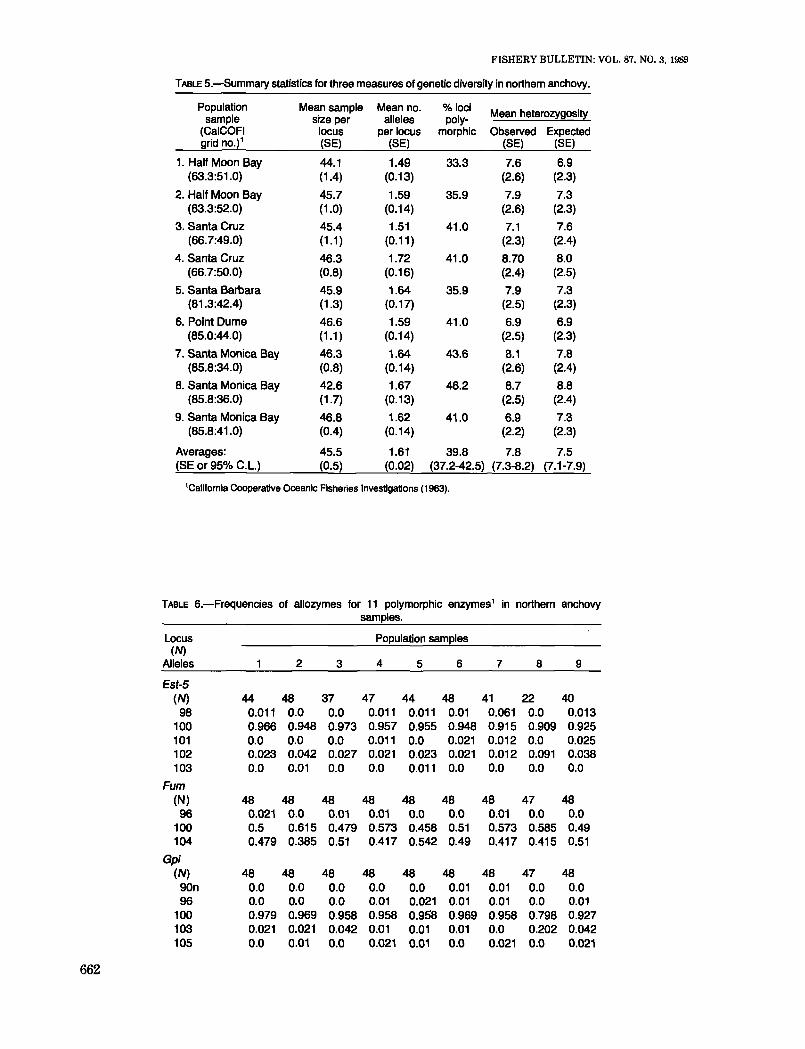
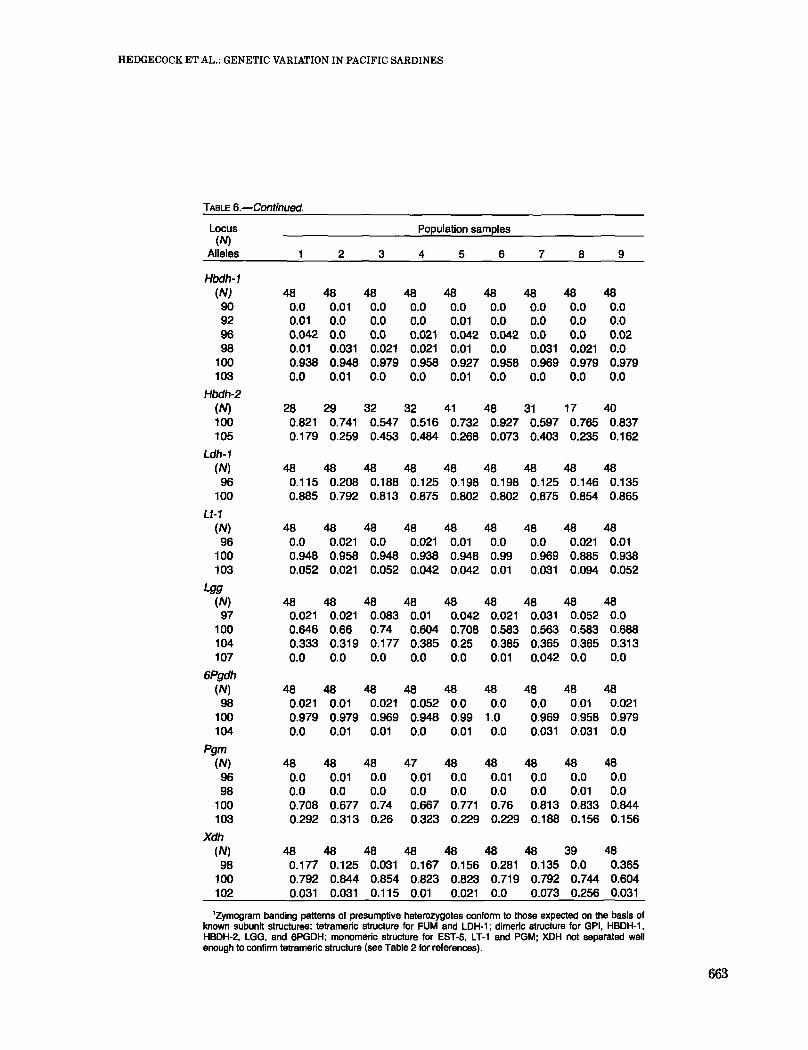
Eleven loci were polymorphic enoughthroughout the nine population samples (Table 6)to permit analyses of geographical heterogeneityin allelic frequencies. Rare alleles were pooledinto one class for all but the Lgg and .Ydh loci, forwhich two rare-allele classes were formed. Theresulting two- or three-by-nine matrices weretested for r x c independence by log-likelihood
661
FISHERY BULLETIN: VOL. 87. NO.3. 1989
TABLE 5.-Summary statistics for three measures of genetic diversity in northern anchovy.
Population Mean sample Mean no. % loci Mean heterozygositysample size per alleles poly-(CaICOFI locus per locus morphic Observed Expectedgrid no.)' (SE) (SE) (SE) (SE)
1. Half Moon Bay 44.1 1.49 33.3 7.6 6.9(63.3:51.0) (1.4) (0.13) (2.6) (2.3)
2. Half Moon Bay 45.7 1.59 35.9 7.9 7.3(63.3:52.0) (1.0) (0.14) (2.6) (2.3)
3. Santa Cruz 45.4 1.51 41.0 7.1 7.6(66.7:49.0) (1.1 ) (0.11 ) (2.3) (2.4)
4. Santa Cruz 46.3 1.72 41.0 8.70 8.0(66.7:50.0) (0.8) (0.16) (2.4) (2.5)
5. Santa Barbara 45.9 1.64 35.9 7.9 7.3(81.3:42.4) (1.3) (0.17) (2.5) (2.3)
6. Point Dume 46.6 1.59 41.0 6.9 6.9(85.0:44.0) (1.1 ) (0.14) (2.5) (2.3)
7. Santa Monica Bay 46.3 1.64 43.6 8.1 7.8(85.8:34.0) (0.8) (0.14) (2.6) (2.4)
8. Santa Monica Bay 42.6 1.67 46.2 8.7 8.8(85.8:36.0) (1.7) (0.13) (2.5) (2.4)
9. Santa Monica Bay 46.8 1.62 41.0 6.9 7.3(85.8:41.0) (0.4) (0.14) (2.2) (2.3)
Averages: 45.5 1.61 39.8 7.8 7.5(SE or 95% C.L.) (0.5) (0.02) (37.2-42.5) (7.3-8.2) (7.1-7.9)
'California Cooperative Oceanic Fisheries Investigations (1963).
TABLE 5.-Frequencies of allozymes for 11 polymorphic enzymes' in northern anchovysamples.
Locus Population samples(N)
Alleles 2 3 4 5 5 7 8 9
Est-5(N) 44 48 37 47 44 48 41 22 40
98 0.011 0.0 0.0 0.011 0.011 0.01 0.061 0.0 0.013100 0.966 0.948 0.973 0.957 0.955 0.948 0.915 0.909 0.925101 0.0 0.0 0.0 0.011 0.0 0.021 0.012 0.0 0.025102 0.023 0.042 0.027 0.021 0.023 0.021 0.012 0.091 0.038103 0.0 0.01 0.0 0.0 0.011 0.0 0.0 0.0 0.0
Fum(N) 48 48 48 48 48 48 48 47 4896 0.021 0.0 0.01 0.01 0.0 0.0 0.01 0.0 0.0
100 0.5 0.615 0.479 0.573 0.458 0.51 0.573 0.585 0.49104 0.479 0.385 0.51 0.417 0.542 0.49 0.417 0.415 0.51
Gpi(N) 48 48 48 48 48 48 48 47 48
90n 0.0 0.0 0.0 0.0 0.0 0.01 0.01 0.0 0.096 0.0 0.0 0.0 0.01 0.021 0.01 0.01 0.0 0.01
100 0.979 0.969 0.958 0.958 0.958 0.969 0.958 0.798 0.927103 0.021 0.021 0.042 0.01 0.01 0.01 0.0 0.202 0.042105 0.0 0.Q1 0.0 0.021 0.01 0.0 0.021 0.0 0.021
662
HEDGECOCK ET AL.: GENETIC VARIATION IN PACIFIC SARDINES
TABLE 5.-Continued.
Locus Population samples(N)
Alleles 2 3 4 5 5 7 8 g
Hbdh-1(N) 48 48 48 48 48 48 48 48 48
gO 0.0 0.01 0.0 0.0 0.0 0.0 0.0 0.0 0.092 0.01 0.0 0.0 0.0 0.01 0.0 0.0 0.0 0.096 0.042 0.0 0.0 0.021 0.042 0.042 0.0 0.0 0.0298 0.01 0.031 0.021 0.021 0.01 0.0 0.031 0.021 0.0
100 0.938 0.948 0.979 0.958 0.927 0.958 0.969 0.979 0.979103 0.0 0.01 0.0 0.0 0.01 0.0 0.0 0.0 0.0
Hbdh-2(N) 28 29 32 32 41 48 31 17 40100 0.821 0.741 0.547 0.516 0.732 0.927 0.597 0.765 0.837105 0.179 0.259 0.453 0.484 0.268 0.073 0.403 0.235 0.162
Ldh-1(N) 48 48 48 48 48 48 48 48 48
96 0.115 0.208 0.188 0.125 0.198 0.198 0.125 0.146 0.135100 0.885 0.792 0.813 0.875 0.802 0.802 0.875 0.854 0.865
Lt-1(N) 48 48 48 48 48 48 48 48 4896 0.0 0.021 0.0 0.021 0.01 0.0 0.0 0.021 0.01
100 0.948 0.958 0.948 0.938 0.948 0.99 0.969 0.885 0.938103 0.052 0.021 0.052 0.042 0.042 0.01 0.031 0.094 0.052
Lgg(N) 48 48 48 48 48 48 48 48 4897 0.021 0.021 0.083 0.01 0.042 0.021 0.031 0.052 0.0
100 0.646 0.66 0.74 0.604 0.708 0.583 0.563 0.583 0.688104 0.333 0.319 0.177 0.385 0.25 0.385 0.365 0.365 0.313107 0.0 0.0 0.0 0.0 0.0 0.01 0.042 0.0 0.0
6Pgdh(N) 48 48 48 48 48 48 48 48 4898 0.021 0.01 0.021 0.052 0.0 0.0 0.0 0.01 0.021
100 0.979 0.979 0.969 0.948 0.99 1.0 0.969 0.958 0.979104 0.0 0.01 0.01 0.0 0.01 0.0 0.031 0.031 0.0
Pgm(N) 48 48 48 47 48 48 48 48 4896 0.0 0.01 0.0 0.01 0.0 0.01 0.0 0.0 0.098 0.0 0.0 0.0 0.0 0.0 0.0 0.0 0.01 0.0
100 0.708 0.677 0.74 0.667 0.771 0.76 0.813 0.833 0.844103 0.292 0.313 0.26 0.323 0.229 0.229 0.188 0.156 0.156
Xdh(N) 48 48 48 48 48 48 48 39 4898 0.177 0.125 0.031 0.167 0.156 0.281 0.135 0.0 0.365
100 0.792 0.844 0.854 0.823 0.823 0.719 0.792 0.744 0.604102 0.031 0.031 0.115 0.01 0.021 0.0 0.073 0.256 0.031
'Zymogram banding patterns of presumptive heterozygotes conform to those expected on the basis ofknown subunit structures: tetrameric structure for FUM and LDH-l; dimeric structure for GPI, HBDH-l.HBDH-2, LGG. and 6PGDH; monomeric structure for EST-5. LT-l and PGM; XDH not separated wellenough to confirm tetrameric structure (see Table 2 for references).
663

ratios (G, Table 7). For five of the 11 loci, allelicfrequencies are significantly nonindependent oflocality; significant heterogeneity of allelic frequencies corresponds to FST values ;;?!:0.019.Considering just the 11 polymorphic loci, Nei's(1978) unbiased genetic identity and distancestatistics for 36 pairs ofpopulation samples average 0.992 ± 0.001 and 0.008 ± 0.001, respectively; over all 39 loci these statistics average0.998 ± 0.0003 and 0.002 ± 0.0003, respectively.
Further analyses show that some of the hetel'ogeneity in allelic frequencies is geographically
TABLE 7.-F-statistics and log-likelihood ratio (G) tests ofallelic frequency x locality independence for polymorphic lociin nine population samples of northern anchovy.
Locus Fis fiT FST G df Sig.'
Est-5 0.083 0.095 0.012 5.53 8 nsFum 0.006 0.019 0.013 11.21 8 nsGpi 0.069 0.123 0.057 31.14 8Hbdh-1 -0.040 -0.027 0.012 8.05 8 nsHbdh-2 -0.130 -0.037 0.082 57.66 8Ldh-A 0.043 0.051 0.008 7.28 8 nsLt-1 0.033 0.046 0.013 13.06 8 nsLgg -0.175 -0.153 0.019 37.98 166Pgdh -0.036 -0.021 0.015 11.19 8 nsPgm -0.067 -0.047 0.019 16.68 8Xdh 0.006 0.067 0.062 130.15 16
Means: -0.045 -0.012 0.032
1Probability levels for significance of G-tests are • = 0.01 < P< 0.05; .. = 0.001 < P < 0.01; ••• = P < 0.001.
FISHERY BULLETIN: VOL. 87, NO.3. 1989
patterned, some is associated with genetic differences between the sexes and among ageclasses, but that most is not associated withany obvious environmental or biological factor.Allelic frequencies at two of the five variableloci, Pgm and Xdh, are significantly correlatedwith latitude (Fig. 4). An attempt was made toexamine the dependence of gene frequencies onsex and age as well as locality, but analyses ofcross-classified data are made difficult by smallsample sizes and uneven distlibutions of sexesand age classes over localities. In tests of threefactor (LOCALITY x SEX X ALLELIC FREQUENCY)log-linear models for Hbdh-2. Lgg, Pgm. andXdh, sex was found to be associated withALLELIC FREQUENCY only for Hbdh-i, for whicha fully saturated model with all three pairwiseinteractions among factors appeared to be thebest fit. In 15 tests of log-linear models of AGE xSEX X ALLELIC FREQUENCY within individualpopulation samples, only four could not be fit bythe model of complete factor independence(Hbdh-2 in population 9, Lgg in population 4,Pgtn in populations 3 and 4). AGE and ALLELICFREQUENCY were associated only for Pgm. in theinshore Santa Cnlz sample, for which, again, afully saturated model was the best fit. Interestingly, interactions of AGE and SEX independent of(or only conditionally associated with) ALLELICFREQUENCY were significant in all four cases; anassociation of older males with younger femalesappeared to be responsible for this.
75
>- 70()Z •W 00 •::::) ,... 65 0 • •0 Il:W a • •0::
III
~0
I&J 60I.L. z 0iii • 0U u
::J ! 55 0 0W o PGM100-J •-J
50 • XDH 100«
450.55 0.56 0.57 0.58 0.59 0.60
LATITUDE(SINE)
FIGURE 4.-Frequencies of the common alleles for Pgm and Xdh (arcsinesquare-root transformed) plotted against the sine oflatitude of collection site.Spearman rank correlation coefficients for the two loci are rs = -0.783. t =-3.330 for Pgm and rs = 0.812, t = 3.681 for Xdh.
664
HEDGECOCK ET AL.: GENETIC VARIATION IN PACIFIC SARDINES
DISCUSSION
Low Genetic Variation in the PacificSardine
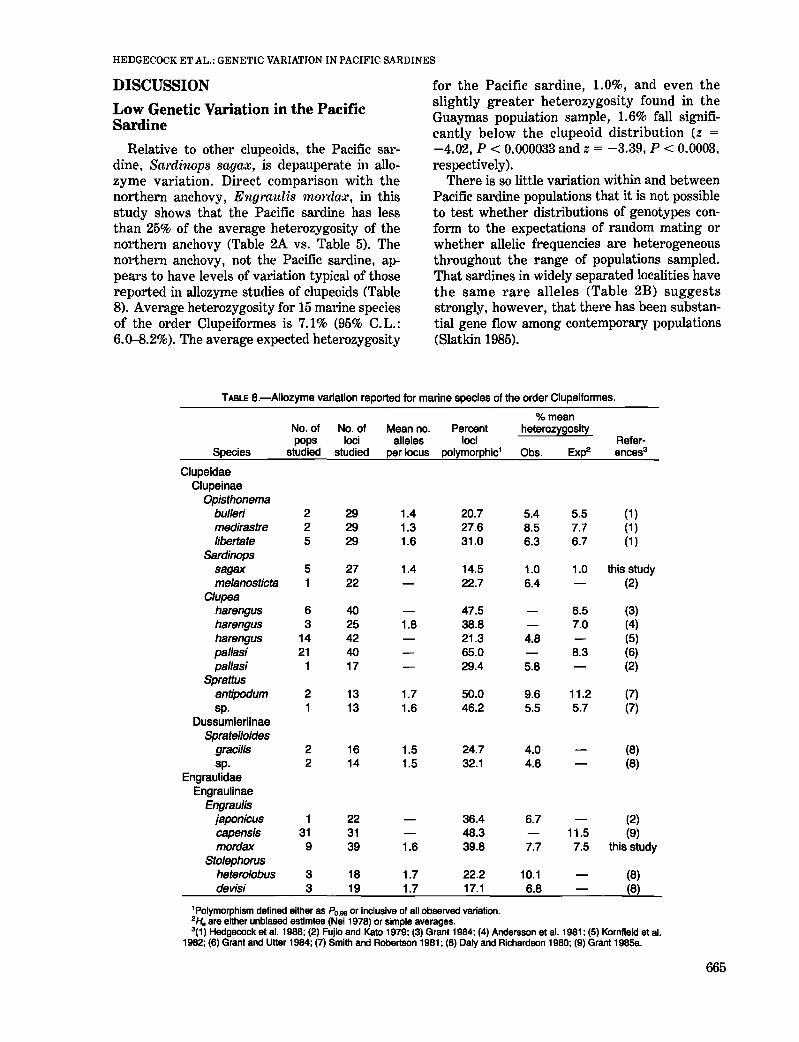
Relative to other clupeoids, the Pacific sardine, Sardinops sagax, is depauperate in allozyme variation. Direct comparison with thenorthern anchovy, Engraulis nwnlax, in thisstudy shows that the Pacific sardine has lessthan 25% of the average heterozygosity of thenorthel1l anchovy (Table 2A vs. Table 5). Thenorthel1l anchovy, not the Pacific sardine, appears to have levels of valiation typical of thosereported in allozyme studies of clupeoids (Table8). Average heterozygosity for 15 maline speciesof the order Clupeiformes is 7.1% (95% C. L.:6.0-8.2%). The average expected heterozygosity
for the Pacific sardine, 1.0%, and even theslightly greater heterozygosity found in theGuaymas population sample, 1.6% fall significantly below the clupeoid distribution (z =-4.02, P < 0.000033 and z = -3.39, P < 0.0003,respectively).
There is so little variation within and betweenPacific sardine populations that it is not possibleto test whether distributions of genotypes conform to the expectations of random mating orwhether allelic frequencies are heterogeneousthroughout the range of populations sampled.That sardines in widely separated localities havethe same rare alleles (Table 2B) suggestsstrongly, however, that there has been substantial gene flow among contemporary populations(Slatkin 1985).
TABLE 8.-Allozyme variation reported for marine species of the order Clupeiformes.
% meanNo. of No. of Mean no. Percent heterozygositypops loci alleles loci Refer-
Species studied studied per locus polymorphic1 Obs. EXp2 ences3
ClupeidaeClupeinae
Opisthonemabulleri 2 29 1.4 20.7 5.4 5.5 (1 )medirastre 2 29 1.3 27.6 8.5 7.7 (1 )libertate 5 29 1.6 31.0 6.3 6.7 (1 )
Sardinopssagax 5 27 1.4 14.5 1.0 1.0 this stUdymelanosticta 1 22 22.7 6.4 (2)
Clupeaharengus 6 40 47.5 6.5 (3)harengus 3 25 1.8 38.8 7.0 (4)harengus 14 42 21.3 4.8 (5)pallasi 21 40 65.0 8.3 (6)pallasi 1 17 29.4 5.8 (2)
Sprattusantipodum 2 13 1.7 50.0 9.6 11.2 (7)sp. 1 13 1.6 46.2 5.5 5.7 (7)
DussumieriinaeSpratelloides
gracilis 2 16 1.5 24.7 4.0 (8)sp. 2 14 1.5 32.1 4.6 (8)
EngraulidaeEngraulinae
Engraulisjaponicus 1 22 36.4 6.7 (2)capensis 31 31 48.3 11.5 (9)mordax 9 39 1.6 39.8 7.7 7.5 this study
Stolephorusheterolobus 3 18 1.7 22.2 10.1 (8)devisi 3 19 1.7 17.1 6.8 (8)
'Polymorphism defined either as PO,99 or inclusive of all observed variation.2H" are either unbiased estimtes (Nei 1978) or simple averages.3(1) Hedgecock et al. 1988; (2) Fujio and Kala 1979; (3) Grant 1984: (4) Andersson et al. 1981; (5) Kornfield et al.
1982; (6) Grant and Utter 1984; (7) Smith and Robertson 1981; (8) Daly and Richardson 1980; (9) Grant 19858.
665

By contrast, the substantial allozyme polymorphism in the northern anchovy allows testsof both random mating and spatial homogeneityof allelic frequencies. Chi-square goodness-of-fittests detect no significant depal·tures from thegenotypic proportions expected under randommating, although substantial excesses ofheterozygotes are found at the Hbdh-2 and Lggloci. While liver-tissue degradation may havecontributed to this result for Hbdh-2 (see Materials and Methods), this explanation cannothold for Lgg, which was scored reliably fromboth liver and eye zymograms. Differences inallelic frequencies either among age classes orbetween sexes can produce excess heterozygosity, and significant interaction of sex and allelicfrequency is detected by fitting of log-linearmodels to Hbdh-2 data. For Lgg. on the otherhand, sex and allelic frequency are independentgiven locality. It must be remembered that thechi-square test of Hardy-Weinberg-Castleequilibrium has little power to detect failure ofits basic assumptions, notably no selection atthe locus and an infinite, unsubdivided population (Wallace 1958; Lewontin and Cockerham1959).
The nOl'thel11 anchovy, again in contrast to thePacific sardine, appears to have a complex population structure as evidenced by significantheterogeneity of allelic frequencies at 5 of 11polymorphic loci (Table 7), correlations of somealleles with latitude (Fig. 4), and dependence ofsome allelic frequencies on sex and age. Thisheterogeneity is unexpected. All samples werecollected within the area occupied by the centralstock, which has been considered a single, randomly mating population, primarily on the basisof transferrin-allele frequencies and meristicdata (Vrooman et al. 1981; see MacCall et al.1983). Differences among populations within thisarea have nevertheless been described forgrowth and age composition (Parrish et al. 1985),size-adjusted otolith weight (Spratt 1972), size atage (Collins 1969; Mais 1974; Mallicoate and Parrish 1981), seasonality of spawning (Mais 1974;PalTIsh1
), and migration patterns (Haugen et al.1969; Mais 1974), together with between-yearvariation in many of these life history traits.Similar genetic heterogeneity of anchovy stockshas been described for Engra-ulis encrasicholi.s(Altukhov et al. 1969a, b; Dobrovolov 1978), al-
Iparrish. R. H. 1983. Evidence for a fall spawning anchovy stock. Paper presented at 1983 CalCOFI Conference.
666
FISHERY BULLETIN: VOL. 87. NO.3. 1989
though homogeneity of allelic frequencies wasreported by Grant (l985b) for E. capens-is.
For loci polymorphic over the nine populationsamples, Wright's (1978) measure of averagegenetic variance among populations, F ST' andNei's (1978) average genetic distance D-twomeasures that are maximized by allele replacement among populations-are both relativelysmall: 0.032 and 0.008, respectively. Significantheterogeneity of allelic frequencies without substantial allele replacement may reflect population subdivision and differentiation resultingfrom ecological, rather than historical processes.We will explore the causes of this paradoxicalgenetic heterogeneity in subsequent reportsdrawing on much larger sets of allozyme, sex,age, and morphological data for northern anchovy collected between 1982 and 1985.
Why does the Pacific sardine have low geneticvariation? One possibility is that this speciesoriginally had levels of variation typical ofclupeoids, but that much of this was lost in thecollapse of the California sardine fishery in the1950's and eal'ly 1960's. That this fishery collapsedid not constitute a population genetic bottleneck, however, appears likely for severalreasons. First, the genetically effective population size during the bottleneck would have had tohave been very small, on the order of 10 or fewerindividuals, in order to account for the currentlow level of heterozygosity (Chakraborty andNei 1977). Second, sardine populations in southern Baja California and in the Gulf of Californiawere unaffected by the collapse of the Californiafishery (Murphy 1969; Sokolov 1974), yet thesepopulations today show low variation also. Finally, by analogy, the Japanese sardine, Sa,rdin.ops mela:nosticta, which also experienced asevere fishery collapse in the 1940's but has sincerecovered (Kondo 1980), does not have reducedlevels of genetic valiation (Fujio and Kato 1979;Table 8).
Alternatively, a restriction in population sizein the more distant past might explain low variation in the Pacific sardine. The historicalrecord of scale deposits in varved, anaerobicmaline sediments of the Santa Barbara Basin,southern California, does show that, relative tonorthern anchovy and Pacific hake, Pacific sardines were always less abundant and muchmore frequently absent (Soutar 1967; Soutarand Isaacs 1969, 1974). Over the past 1,850years, ·the Pacific sardine was abundant during12 periods, each lasting from 20 to 150 years.Intervals between these periods of abundance

HEDGECOCK ET AL.: GENETIC VARIATION IN PACIFIC SARDINES
lasted, on average, 80 years and ranged in duration from 20 to 200 years (Soutar and Isaacs1969). One or more of these peliods of low abundance could have been a severe enough bottleneck to cause loss of variation, but this hypothesis may be difficult to falsify. According to Fitch(1969), fossil remains of Sa:rdinops are absentfrom samples of California Pliocene and Pleistocene sediments, whereas evidence of five otherpelagic species (Clupea palla-si, Eng·r(tulis'tnorda,;x:, Merlu.ccius p'roducfu,s, Scomber japonicus, and Trochu.rus symmetricus) is present inat least some samples. This raises the possibility that Sm'dinops sagaJ.: caerulea. may be arecent arrival in the California Cun'ent Systemand that the low valiation is attributable to asmall number of founders rather than to a subsequent bottleneck.
Other than such histolical hypotheses, we canpose no ecological explanation of low genetic variation (such as provided for decapod crustaceansby Nelson and Hedgecock 1980, for example);the ecology of the Pacific sardine does not appearto be unique relative to those clupeoids havinghigher levels of valiation <Blaxter and Hunter1982). So we are left at present with nO,compelling hypothesis to explain the observation of lowgenetic valiation in the Pacific sardine.
Structures of Historical andContemporary Populations ofthe Pacific Sardine
Sprague and Vrooman (1962) and Vrooman(1964) desclibed three genetically distinct subpopulations of Sardinops sagax caernlea, on thebasis of significantly different frequencies of aC-positive blood factor (13.6% in samples takenfrom California waters, 6.0% in samples takenfrom Baja California, and 16.8% in fish from theGulf of California). Regrettably, though understandably, electrophoretic separation of allozymes has completely supplanted immunologicalmethods for studying population structure. Datacomparable in quantity and quality to historicaldata on serotype frequencies would be difficultto gather today. A considerable drawback to theimmunological method is the requirement forfresh blood, whereas allozymes can be readilyobtained from fresh or fresh frozen, muscle orvisceral tissues. Moreover, allozyme methodsallow a much larger survey of genes than doesblood typing; this, in turn, provides for statistical analyses of genetic diversity that take into
account the large component of variance amongloci (Nei 1978).
Ow' finding of low genetic valiation across awidespread sampling of Pacific sardines contradicts the hypothesis that there are currentlygenetically different, geographic subpopulationsof Pacific sardine. Combined with the recency ofthe Pacific sardine's reexpansion into the California CUlTent (Wolf et al. 1987), our observations support the alternative hypothesis that thisspecies comprises a single, homogeneous genepool. Examination of the distributions and abundances of sardine eggs and larvae (Ahlstrom1954, 1957) does suggest the possibility of dispersal around the tip of Baja California, particularly during cold-water (anti-El Nino) years.2
Our data on the shaling of rare alleles by widelyseparated populations support this conjecture byimplying a high rate of gene flow throughout therange of the species (Slatkin 1985).
The present study does not falsify the subpopulation hypothesis for historical sardinepopulations, but our data show that it is unlikely.The former hypothesis requires that only asingle southern subpopulation survived the fishery collapse to repopulate the Gulf of California,the Pacific coast of Baja California Sur, and morerecently, the California Current. Data on thefrequency of C-positive blood type in contemporary sardine populations would be useful.However, morphological and life history dataalso played an important role in past inferencesconcerning the structure of historical sardinepopulations (Radovich 1982). The implications ofour data on morphological valiation among contemporary populations are discussed next.
Morphological and Life HistoryVariation Among Historical andContemporary Pacific SardinePopulations
Life history traits, such as the schedules ofage-specific growth, mortality, and reproduction, and the covariances among these tI'aits,determine responses by fish populations to exploitation (Cushing 1973; Nelson and Soule1987). Indeed, the histolical biology of the California sardine fishery and its demise provides anelegant example of this axiom. An important
2R. A. Schwartzlose. Centro de Investigaciones Biologicasde Baja California sur and Scripps Institution of Oceanography. La Jolla, CA 92093. pel's. commun. 1988.
667

feature of the collapse of the sardine fishery wasits north-to-south progression, which owedgreatly to the interaction of underlying life history variation (in particular, steep north-southclines in size-at-age, age of first reproduction,maximum size, and the schedule of natural mortality), geographical shifts in fishing pressure,and natural between-year variation in recruitment (Murphy 1966; Radovich 1982). That lifehistory variation was built upon genetic differences among geographic populations, however,now appears unlikely from the results of ourstudy.
The single, most obvious component of morphological vmiation in Pacific sardines today is ageographic cline in size-at-age that is as steepand as large as that seen in historical populations(Fig. 2). In the past, such differences were usedby several authors to infer the existence of genetically distinct subpopulations, yet the differences have been reestablished in geneticallyhomogeneous, contemporary populations withinjust a few generations. This implies that rapiddifferentiation of growth rate among geographicpopulations-probably together with differentiation of correlated life history features such asage at first reproduction, ma.ximum size, andage-specific mortality (Clark and Marl' 1955;Bla.xter and Hunter 1982)-is largely environmentally, and not genetically, determined. Thisis not to say that there m'e not genes that determine life history traits; but vm'iation of thesegenes cannot be responsible for geographic variation in life history. The genotype of the Pacificsardine must instead provide for remarkableplasticity in life history phenotype.
One must now be skeptical of the interpretation that life history differences among histOlicalsardine populations were conditioned by geneticdifferences among subpopulations or races. Thequestion of which sardine stock is now recovering is moot. More importantly, it appem's thatinformation on the biology of sm'dine populationsprior to the collapse of the fishery can safely beused for area-specific fisheries models of the recovering stocks.
ACKNOWLEDGMENTS
The authors dedicate this paper to the memory of Dr. Reuben Lasker in appreciation for hisencouragement to make these studies, for hisadvocacy of our proposals, and for his unfailing,forthright, and constructive criticism of ourmethods and conclusions. The authors thank P.
668
FISHERY BULLETIN: VOL. 87, NO.3, 1989
Woods, R. H. PmTish, P. Wolf, K. Worcester,Giovanni Malagrino, W. Borgeson, and J.Estrada for help in obtaining Pacific sardines; wethank R. D. Methot for collecting the northernanchovy used in the study. This resem'ch wasfunded by a grant (R/F-98) from the CaliforniaSea Grant College Program.
LITERATURE CITED
Ahlstrom, E. H.1954. Distribution and abundance of egg and larval
populations of the Pacific sardine. U.S. Fish Wildl.Serv., Fish. Bull. 56:83--140.
195!!. Distribution and abundance of eggs of the Pacificsardine, 1952-56. U.S. Fish Wildl. Serv., Fish. Bull.60:185-213.
Altukhov, Yu. P.. V. V. Limanskii, A. N. Payusova, andK. A. Truveller.
1969a. Immunogenetic analysis of the intraspecies differentiation of the European anchovy inhabiting theBlack Sea and the Sea of Azov. I. Anchovy bloodgroups and a hypothetical mechanism of genetic regulation: heterogeneity of the Azov race. [Transl.]Genetika 5(4):50-64.
1969b. Immunogenetic analysis of intraspecific differentiation of the European anchovy (ElIgraulis encrasichollts) inhabiting the Black Sea and the Sea ofAzov. II. Elementary anchovy populations and theirplace in the population-genetic structure of thespecies. [Transl.] Genetika 5(5):81-94.
Andersson, L., N. Ryman, R. Rosenberg, and G. Stahl.1981. Genetic variability in Atlantic herring (ell/pea.
harel/gus harel/gus): description of protein loci andpopulation data. Hereditas 95:69--78.
Ayala, F. J .• D. Hedgecock. G. S. Zumwalt, and J. W.Valentine.
1973. Genetic variation in Tridacn.a ma;r:ima, an ecological analog of some unsuccessful evolutionary lineages. Evolution 27:177-191.
Bla.'(ter,J. H. S., andJ. R. Hunter.1982. The biology of the clupeoid fishes. Adv. Mar.
BioI. 20:1-223.Calif. Coop. Oceanic Fish. Invest.
1963. Atlas No.1. Calif. Mal'. Res. Comm.Chakraborty, R.. and M. Nei.
1977. Bottleneck effects on average heterozygosityand genetic distance with the stepwise mutationmodel. Evolution 31:347-356.
Clark, F. N.1936. VaIiations in the number of vertebrae of the
sardine, Sardinops ca.erulea· (Girard). Copeia1936(3):147-150. .
1947. Analysis of populations of the Pacific sardine onthe basis of vertebral counts. Calif. Div. Fish GaIne,Fish Bull. 65, 26 p.
Clark, F. N., and J. F. Janssen.1945. Movements and abundance of the sardine as
measured by tag returns. Calif. Div. Fish Game,Fish Bull. 61:7-42.
Clark, F. N., andJ. C. Marr.1955. Population dytlaInics of the Pacific sardine. Cali
fornia Marine Research Committee, Progress Report
HEDGECOCK ET AL.: GENETIC VARIATION IN PACIFIC SARDINES
1 July 1953 to 31 March 1955. Calif. Mar. Res.Comm. p 11-48, 24 figs.
Collins, R. A.1969. Size and age composition of northern anchovies
(Ellgmulis m.ordaxl in the California anchovy reduction fishery for the 1965-66. 1966-67, and 1967-68seasons. Calif. Dep. Fish Game, Fish Bull. 147:5674.
Collins, R. A.• and J. D. Spratt.1969. Age determination of northern anchovies,
EngmuHsmol'dax, from otoliths. Calif. Dep. FishGame. Fish Bull. 147:39--55.
Cooper, D. W.1968. The significance level in multiple tests made
simultaneously. Heredity 23:614--617.Cushing, D. H.
1973. Recruitment and parent stock in fishes. Wash.Sea Grant Publ. WSG 73-1, Univ. Wash., Seattle, 197p.
Daly. J. C., and B. J. Richardson.1980. Allozyme variation between populations of bait
fish species Stolephorlls hete1'Oioims and St. devisi(Pisces: Engraulidael and Spratelloides gracilis(Pisces: Dussumieriidael from Papua New Guineawaters. Aust. J. mar. Freshwater Res. 31(5):701711.
Darnell. D. W., and I. M. Klotz.1975. Subunit constitution of proteins: a table. Arch.
Biochem. Biophys. 166:651-682.Dixon, W.J.
1981. BMDP statistical software. Univ. Calif. Press,Berkeley, 725 p.
Dobrovolov, I.1978. Polymorphism of muscle proteins of the anchovy,
Engronlis encrosicholus. of the Azov-Black Sea Basinand the Atlantic Ocean. J. Ichthyol. 18:483--489.
Felin. F. E.1954. Population heterogeneity in the Pacific pil
chard. U.S. Fish Wildl. Serv., Fish. Bull. 54:201225.
Fienberg, S. E.1980. The analysis of cross-classified categorical
data. 2nd ed. MIT Press. Cambridge. 198 p.Fitch, J. E.
1969. Fossil records of certain schooling fishes of theCalifornia Current System. Calif. Coop. OceanicFish. Invest. Rep. 13:71-80.
Fujio, Y.• and Y. Kato.1979. Genetic variation in fish populations. Bull. J pn.
Soc. Sci. Fish. 45:1169--1178.Grant. W. S.
1984. Biochemical population genetics of Atlantic herring, Clupea hal'engns. Copeia 1984:357--364.
1985a. Biochemical genetic variation in the cape anchovy Engraulis capensis Gilchrist. S. Afr. J. mar.Sci. 3:23--31.
1985b. Biochemical genetic stock structure of thesouthern African anchovy, Engl'aulis capensisGilchrist. Fish BioI. 27:23-29.
Grant, W. S.• and F. M. Utter.1984. Biochemical population genetics of Pacific her
ring cClupea pallasil. Can. J. Fish. Aquat. Sci.41:856-864.
Harris. H., and D. A. Hopkinson.1976. Handbook of enzyme electrophOl"esis in human
genetics. American Elsevier. N.Y.. var. p.
Haugen. C. W.• J. D. Messersmith, and R. H. Wickwire.1969. Progress report on anchovy tagging off Cali
fornia and Baja California, March 1966 through May1969. Calif. Dep. Fish Game, Fish Bull. 147:7589.
Hedgecock, D., and G. Li.1983. Enzyme polymorphism and genetic variation in
the northern anchovy, Engraulismol'dax Girard.Genetics 104:s34.
Hedgecock. D., K. Nelson. and L. G. Lopez-Lemus.1988. Biochemical genetic and morphological diver
gence among three species of thread herring COpisthon.ema) in northwest Mexico. Calif. Coop. OceanicFish. Invest. Rep. 29:110--121.
Hubbs, C. L.1925. Racial and seasonal variation in the Pacific her
ring, California sardine and California anchovy. Calif.Fish Game Comm. Fish Bull. No.8. 23 p.
Humphries, J. M., F. L. Bookstein, B. Chernoff, G. R.Smith. R. L. Elder, and S. G. Poss.
1981. Multivariate discrimination by shape in relationto size. Syst. Zool. 30(3):291--308.
Jensen, Ad. S.1944. On specific constancy and segregation into races
in sea-fishes. Det. K. Dan. Vidensk. Selsk. BioI.Medd., Bind 19(8):1-19.
Koehn. R. K.. and W. F. Eanes.1978. Molecular structure and protein variation within
and among populations. In M. K. Hecht. W. C.Steere. and B. Wallace (editors), Evolutionary biology. vol. 11, p. 39--100. Plenum. N.Y.
Kondo, K.1980. The recovery of the Japanese sardine-the bio
logical basis of stock-size fluctuations. Rapp. P.-v.Reun. Cons. into Explor. Mer 177:332-354.
Kornfield, I .• B. D. Sidell, and P. S. Gagnon.1982. Stock definition in Atlantic herring CClupell
harengus harengusl: Genetic evidence for discrete falland spring spawning populations. Can. J. Fish.Aquat. Sci. 39:1610--1621.
Levene, H.1949. On a matching problem arising in genetics. Ann.
Math. Stat. 20:91-94. .Lewontin, R. C.• and C. C. Cockerham.
1959. The goodness-of-fit test for detecting naturalselection in random mating populations. Evolution13:561-564.
MacCall, A. D.1979. Population estimates for the waning years of the
Pacific sardine fishery. Calif. Coop. Oceanic Fish.Invest. Rep. 20:72-82.
1986. Review of the biological rationale for identifyingsubpopulations in fisheries. In D. Hedgecock(editor). Identifying fish subpopulations, p. 9--13.Calif. Sea Grant Coli. Program Publ. T-CSGCP-013.
MacCall. A. D., R. D. Methot. D. D. Huppert. and R.Klingbeil.
1983. Northern anchovy fishery management plan(Amendment No.5). Pacific Fishery ManagementCouncil. Portland, 165 p.
Mais, K. F.1974. Pelagic fish surveys in the California Current.
Calif. Dep. Fish Game, Fish Bull. 162:1-79.Mallicoate, D. L., and R. H. Parrish.
1981. Seasonal growth patterns of California stocks ofnorthern anchovy, Engl'a.u./-is mordax. Pacific
669

mackerel. Scomber japonicns. and jack mackerel,Trachu.rus symmetricus. Calif. Coop. Oceanic Fish.Invest. Rep. 22:69-81.
Marr. J. C.1957. The subpopulation problem in the Pacific sardine
Sardin-ops caemlea. In J. C. Man' (editor), Contributions to the study of subpopulations of fishes. p.108-125. U.S. Fish WildI. Serv., Spec. Sci. Rep.Fish. 208.
Martin. W. R.1949. The mechanics of environmental control of body
form in fishes. Univ. Toronto Stud.• BioI. Ser..58:5-91. Univ. Toronto Press. Toronto.
McHugh, J. L.1950. Valiations and populations in t.he cIupeoid fishes
of the north Pacific. Ph.D. Thesis. Univ. Calif. LosAngeles, 152 p.
Murphy, G. I.1966. Populat.ion biology of the Pacific sardine (Sa'/'
din-ops cuernleu). Proc. Calif. Acad. Sci. 34(1):1-84.Nei.M.
1978. Estimation of average heterozygosity and genetic dist.ance from a small number of individuals.Genetics 89:583-590.
Nelson, K., and D. Hedgecock.1980. Enzyme polymorphism in t.he decapod Crus
tacea. Am. Nat. 116:238-280.Nelson, K., and M. Soule.
1987. Genet.ical conservation of exploited fishes. IIIN. Ryman and F. Utter (editors), Population geneticsand fisheries management. p. 345-368. Wash. SeaGrant Program. Univ. Wash. Press. Seattle.
Pamilo. P.. and S. Varvio-Aho.1984. Testing genotype frequencies and heterozygo
sities. Mar. BioI. (Berl.) 79:9~100.Parrish. R. H.• D. L. Mallicoate, and K. F. Mais.
1985. Regional variations in the growth and age composition of northern anchovy. Engraulismorda:\·.Fish. Bull.• U.S. 83:483--496.
Phillips. J. B.1948. Growth of the sardine. Sardinops caerulea,
1941-42 through 1946-47. Calif. Div. Fish Game,Fish Bull. No. 71. 33 p.
Radovich, J.1962. Effects of sardine spawning stock size and en
vironment. on year class production. Calif. FishGanle 48:123--140.
1982. The collapse of t.he California sardine fishery.What have we learned? Calif. Coop. Oceanic Fish.Invest. Rep. 28:56-78.
Ruth, R. C., and F. Wold.1976. The subunit structure of glycolytic enzymes.
Compo Biochem. PhysioI. 54B:I-6.Ryman. N.. and F. Utter (editors).
1987. Population genetics and fishery management.Wash. Sea Grant Program. Univ. Wash. Press, Seattie, 420p.
Selander, R. K., M. H. Smith, S. Y. Yang. W. E. Johnson.and J. B. Gentry.
1971. Biochemical polymorphism and systematics inthe genus Pe-romyscus. I. Variation in the old-fieldmouse (Per'omyscus polionotusl. St.ud. Genet..VI:49-90. Univ. Texas Pub!. 7103, Univ. TexasPress, Austin.
Slatkin, M.1985. Rare alleles as indicators of gene flow. Evolu-
670
FISHERY BULLETIN: VOL. 87, NO.3, 1989
tion 39:53-65.Smith, P. J., and D. A. Robertson.
1981. Genetic evidence for two species of sprat (Sprattus) in New Zealand waters. Mar. BioI. <BerI.)62:227-233.
Sokolov, V. A.1974. Investigaciones biol6gico pesqueras de los
peces pelagicos del golfo de Calif0111ia. Calif. Coop.Oceanic Fish. Invest. Rep. 27:1)'>.......96.
Soutar. A.1967. The accumulation of fish debris in certain Cali
fornia coastal sediments. Calif. Coop. Oceanic Fish.Invest. Rep. 11:136-139.
Soutar, A., andJ. D. Isaacs.1969. History of fish populations inferred from fish
scales in anaerobic sediments off California. Calif.Coop. Oceanic Fish. Invest. Rep. 13:63--70.
1974. Abundance of pelagic fish during the 19th and20th centuries as recorded in anaerobic sediments offthe Californias. Fish. Bull.. U.S. 72:257-273.
Sprague. L., and A. M. Vrooman.1962. A racial analysis of the Pacific sardine (Sar
dinops caernlea) based on studies of erythrocyte antigens. Ann. N.Y. Acad. Sci. 97:131-138.
Spratt. J. D.1972. The use of otoliths to separate groups of north
ern anchovies. Calif. Fish Game. Mar. Resourc.Tech. Rep. 1.25 p.
Swofford, D. L .. and R. B. Selander.1981. BIOSYS-l: a FORTRAN program for the com
prehensive analysis of electrophoretic data in population genetics and systematics. J. Hered. 72:281283.
Tracey, M. L.• K. Nelson, D. Hedgecock, R. A. Shleser. andM. L. Pressick.
1975. Biochemical genetics of lobsters: genetic valiation and the stl1lcture of American lobster (Homu.N.lsamericanus) populations. J. Fish. Res. Board Can.32:2091-2101.
Utter, F., P. Aebersold. and G. Winans.1987. Interpreting genetic variation detected by elec
trophoresis. In N. Ryman and F. Utter (editors).Population genetics and fishery management, p. 2146. Wash. Sea Grant PTogram, Univ. Wash. Press,Seattle.
Vrooman, A. M.1964. Serologically differentiated subpopulations of
the Pacific sardine, Sardillops cae/'/dea. J. Fish.Res. Board Can. 21:691-701.
Vrooman, A. M.. P. A. Paloma, and J. R. Zweifel.1981. Electrophoretic, morphometric, and meristic
studies of subpopulations of northern anchovy.Engra1tlis rnordax. Calif. Fish Game 67(1):39-51.
Wahlund, S.1928. Zusammensetzung von Populationen und Kor
relationserschmeinungen von Standpunkt del'Vererbungslehre aus bet.rachtet. Hereditas 11:65106.
Wallace. B.1958. The comparison of observed and calculated
zygotic distributions. Evolution 12:113--115.Wisner. R. L.
1961. Evidence of a northward movement of stocks ofthe Pacific sardine based on the number of vertebrae. Calif. Coop. Oceanic Fish. Invest. Rep. 8:7582.

HEDGECOCK ET AL.: GENETIC VARIATION IN PACIFIC SARDINES
Wolf. P., P. E. Smith, and C. L. Scannell.1987. The relative magnitude of the 1986 Pacific sar
dine spawning biomass off California. Calif. Coop.Oceanic Fish. Invest. Rep. 28:21-26.
Wright, S.1978. Evolution and the genetics of populations, vol. 4:
Variability within and among natural populations.Univ. Chicago Press, Chicago, 580 p.
671