Genetic Algorithms and Decision Trees for Condition ... · training and classification are...
23
1 Genetic Algorithms and Decision Trees for Condition Monitoring and Prognosis of A320 Aircraft Air Conditioning Mike Gerdes Hamburg University of Applied Sciences Aero - Aircraft Design and Systems Group Berliner Tor 9, 20099 Hamburg, Germany Email: [email protected] Diego Galar Luleå University of Technology Division of Operation and Maintenance Engineering SE-971 87 Luleå, Sweden Email: [email protected] University of Skövde Reliability and Maintenance Engineering SE-54128, Skövde, Sweden Email: [email protected] Dieter Scholz Hamburg University of Applied Sciences Aircraft Design and Systems Group (AERO) Berliner Tor 9, 20099 Hamburg, Germany Email: [email protected] Source: Insight - Non-Destructive Testing and Condition Monitoring, Volume 59, Number 8, August 2017, pp. 424-433(10) Publisher: The British Institute of Non-Destructive Testing DOI: 10.1784/insi.2017.59.8.424 Download: http://PAHMIR.ProfScholz.de Abstract Unscheduled maintenance is a large cost driver for airlines, but condition monitoring and prognosis can reduce the number of unscheduled maintenance actions. The paper shows condition monitoring can be introduced into most system by adopting a data-driven approach and using existing data sources. The goal is to forecast the remaining useful life (RUL) of a system based on various sensor inputs. We use decision trees to learn the characteristics of a system. The data for the decision tree training and classification are processed by a generic parametric signal analysis. To obtain the best classification results for the decision tree, the parameters are optimized by a genetic algorithm. A forest of three different decision trees with different signal analysis parameters is used as classifier. The proposed method is validated with data from an A320 aircraft from ETIHAD Airways. Validation shows condition monitoring can classify the sample data into ten predetermined categories, representing the total useful life (TUL) in 10 percent steps. This is used to predict the RUL. There are 350 false classifications out of 850 samples. Noise reduction reduces the outliers to nearly zero, making it possible to correctly predict condition. It is also possible to use the classification output to detect a maintenance action in the validation data.
Transcript of Genetic Algorithms and Decision Trees for Condition ... · training and classification are...

1
Genetic Algorithms and Decision Trees for Condition Monitoring and Prognosis of A320
Aircraft Air Conditioning
Mike Gerdes Hamburg University of Applied Sciences
Aero - Aircraft Design and Systems Group Berliner Tor 9, 20099 Hamburg, Germany
Email: [email protected]
Diego Galar Luleå University of Technology
Division of Operation and Maintenance Engineering SE-971 87 Luleå, Sweden Email: [email protected]
University of Skövde
Reliability and Maintenance Engineering SE-54128, Skövde, Sweden Email: [email protected]
Dieter Scholz
Hamburg University of Applied Sciences Aircraft Design and Systems Group (AERO) Berliner Tor 9, 20099 Hamburg, Germany
Email: [email protected]
Source: Insight - Non-Destructive Testing and Condition Monitoring, Volume 59, Number 8, August 2017, pp. 424-433(10) Publisher: The British Institute of Non-Destructive Testing DOI: 10.1784/insi.2017.59.8.424 Download: http://PAHMIR.ProfScholz.de
Abstract Unscheduled maintenance is a large cost driver for airlines, but condition monitoring and prognosis can reduce the number of unscheduled maintenance actions. The paper shows condition monitoring can be introduced into most system by adopting a data-driven approach and using existing data sources. The goal is to forecast the remaining useful life (RUL) of a system based on various sensor inputs. We use decision trees to learn the characteristics of a system. The data for the decision tree training and classification are processed by a generic parametric signal analysis. To obtain the best classification results for the decision tree, the parameters are optimized by a genetic algorithm. A forest of three different decision trees with different signal analysis parameters is used as classifier. The proposed method is validated with data from an A320 aircraft from ETIHAD Airways. Validation shows condition monitoring can classify the sample data into ten predetermined categories, representing the total useful life (TUL) in 10 percent steps. This is used to predict the RUL. There are 350 false classifications out of 850 samples. Noise reduction reduces the outliers to nearly zero, making it possible to correctly predict condition. It is also possible to use the classification output to detect a maintenance action in the validation data.
2
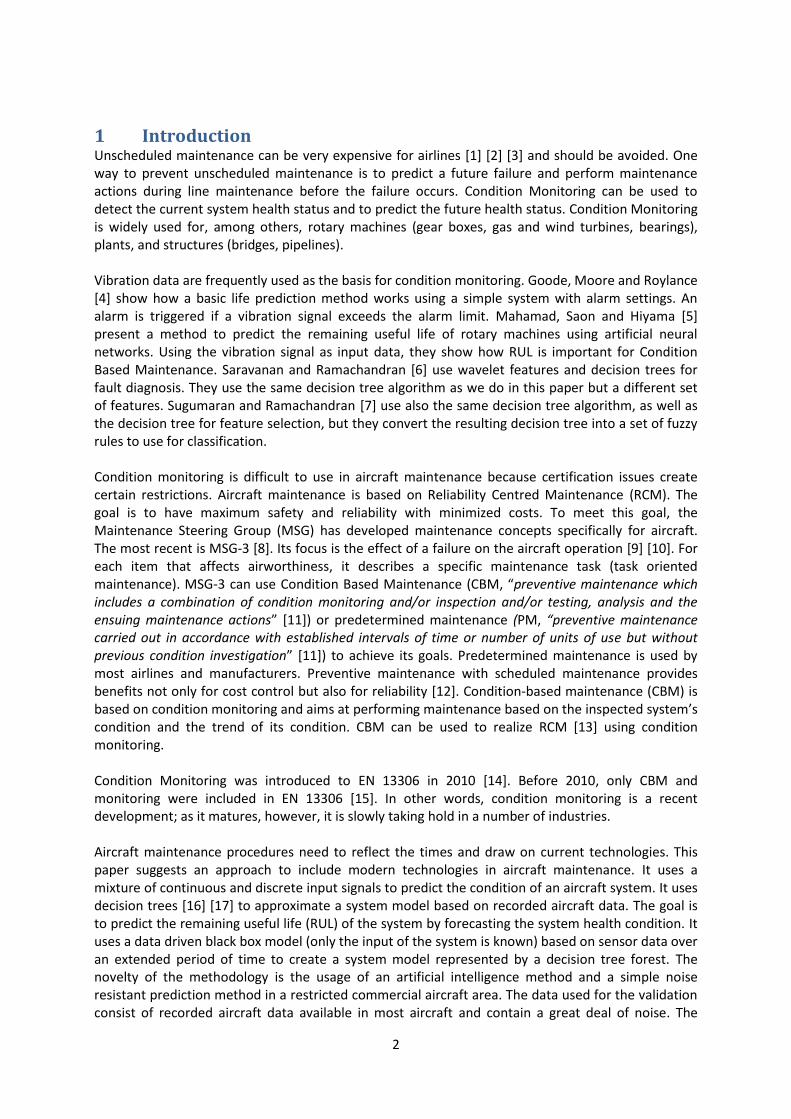
1 Introduction Unscheduled maintenance can be very expensive for airlines [1] [2] [3] and should be avoided. One way to prevent unscheduled maintenance is to predict a future failure and perform maintenance actions during line maintenance before the failure occurs. Condition Monitoring can be used to detect the current system health status and to predict the future health status. Condition Monitoring is widely used for, among others, rotary machines (gear boxes, gas and wind turbines, bearings), plants, and structures (bridges, pipelines). Vibration data are frequently used as the basis for condition monitoring. Goode, Moore and Roylance
[4] show how a basic life prediction method works using a simple system with alarm settings. An alarm is triggered if a vibration signal exceeds the alarm limit. Mahamad, Saon and Hiyama [5] present a method to predict the remaining useful life of rotary machines using artificial neural networks. Using the vibration signal as input data, they show how RUL is important for Condition Based Maintenance. Saravanan and Ramachandran [6] use wavelet features and decision trees for fault diagnosis. They use the same decision tree algorithm as we do in this paper but a different set of features. Sugumaran and Ramachandran [7] use also the same decision tree algorithm, as well as the decision tree for feature selection, but they convert the resulting decision tree into a set of fuzzy rules to use for classification. Condition monitoring is difficult to use in aircraft maintenance because certification issues create certain restrictions. Aircraft maintenance is based on Reliability Centred Maintenance (RCM). The goal is to have maximum safety and reliability with minimized costs. To meet this goal, the Maintenance Steering Group (MSG) has developed maintenance concepts specifically for aircraft. The most recent is MSG-3 [8]. Its focus is the effect of a failure on the aircraft operation [9] [10]. For each item that affects airworthiness, it describes a specific maintenance task (task oriented maintenance). MSG-3 can use Condition Based Maintenance (CBM, “preventive maintenance which includes a combination of condition monitoring and/or inspection and/or testing, analysis and the ensuing maintenance actions” [11]) or predetermined maintenance (PM, “preventive maintenance carried out in accordance with established intervals of time or number of units of use but without previous condition investigation” [11]) to achieve its goals. Predetermined maintenance is used by most airlines and manufacturers. Preventive maintenance with scheduled maintenance provides benefits not only for cost control but also for reliability [12]. Condition-based maintenance (CBM) is based on condition monitoring and aims at performing maintenance based on the inspected system’s condition and the trend of its condition. CBM can be used to realize RCM [13] using condition monitoring. Condition Monitoring was introduced to EN 13306 in 2010 [14]. Before 2010, only CBM and monitoring were included in EN 13306 [15]. In other words, condition monitoring is a recent development; as it matures, however, it is slowly taking hold in a number of industries. Aircraft maintenance procedures need to reflect the times and draw on current technologies. This paper suggests an approach to include modern technologies in aircraft maintenance. It uses a mixture of continuous and discrete input signals to predict the condition of an aircraft system. It uses decision trees [16] [17] to approximate a system model based on recorded aircraft data. The goal is to predict the remaining useful life (RUL) of the system by forecasting the system health condition. It uses a data driven black box model (only the input of the system is known) based on sensor data over an extended period of time to create a system model represented by a decision tree forest. The novelty of the methodology is the usage of an artificial intelligence method and a simple noise resistant prediction method in a restricted commercial aircraft area. The data used for the validation consist of recorded aircraft data available in most aircraft and contain a great deal of noise. The

3
methods and operations were selected with certification and on-line monitoring in mind. The advantages of this approach are that it can be used on-ground or on-aircraft, and real-time monitoring of a single aircraft or a fleet is possible without the installation of additional hardware. The structure of the paper is as follows. This section gives background information on the methods and technologies used to develop the proposed method. The next section explains the method in detail, and the following one validates the method with real world data from an in-service aircraft. The paper ends with a conclusion and offers some final comments.
2 Condition Monitoring Condition Monitoring is defined as [11]: “Activity, performed either manually or automatically, intended to measure at predetermined intervals the characteristics and parameters of the actual state of an item” It is based on three steps [18]:
1. Data Acquisition: Collecting and storing data from physical assets. This includes event data and condition data. Event data are what happened and what the condition data represent.
2. Data Processing: The first step of data processing is data cleaning followed by data analysis. Data analysis includes transformation of data from the time domain into the frequency domain and feature extraction.
3. Maintenance-Decision-Making Condition monitoring can either be continuous or periodic [18]. Continuous monitoring (automatic) is often performed by installed sensors and automatically by machines. Periodic monitoring (manual or automatic) can be done by humans and can include checks at regular maintenance intervals.
Implementing condition monitoring is a difficult and costly task. Diagnosis and prediction are two goals of condition monitoring [18]. Diagnosis (posterior event) deals with detection (Did something fail?), isolation (What failed?) and identification (Why did it fail?) of faults when they occur and is defined as [15]: “Actions taken for fault recognition, fault localization and cause identification”. Prognostic (prior event) deals with predicting future faults and how soon they will occur [18]. There are two types of prediction: prediction of remaining time until a failure occurs and prediction of the chance a machine will operate without a fault until the next scheduled maintenance [18]. Condition prediction can be done based on sensor data or based on system condition [19]. The analysis algorithm looks not just at recorded parameters at a single moment in time; it also takes the full parameter history into account. The need for maintenance of the component is indicated if the data trend of parameters points to a degradation of the component. Based on the parameter time history, the analysis algorithm allows a forecast of the remaining lifetime of the component [20]. Analysis and prediction use a variety of methods to predict future values. Physics-based approaches for prediction include Kalman filter, sequential Monte Carlo, Markov models, and others. Data-driven approaches include artificial ARMA (Autoregressive-Moving Average), ARIMA (Autoregressive Integrated Moving Average), neural-networks, Bayesian Networks, and others. All these methods can be used to predict values for a complex time series [21] [22] [23] [24]. Output of the prediction is

4
normally an estimated time to failure (ETTF) and a confidence interval [25]. The confidence interval defines how reliable a prediction is [26] [25] and can be calculated using standard time series. The condition of the system is often defined by setting limits on certain values based on experience (knowledge based) [19] or by creating a mathematical representation of the physical system model or a data driven model [20] [27] [28]. Other methods include machine learning techniques (decision trees [29] [30] [31], vector support machines [32] [29] [33], and neural networks [34] [5] [35]…) used to map the features of the input signal to a condition. Another option is to use a physics-based model (representing the system’s physical features, components and interactions), feeding the sensor input into the model, calculating the output and checking how the output of the theoretical model deviates from the real system. This approach can also be used for fault isolation and fault identification of failures in addition to prognosis [36] [27] [20] [18]. Data-driven models use past data to create models with stochastically or machine learning algorithms [37] [38] [18]. These models require many data samples representing different conditions of the system. Data-driven models require less “manpower” than a mathematical model; model validation and testing can be performed almost automatically. All three techniques are widely used and often are combined to perform more accurate diagnosis and prognosis.
3 Feature Extraction Feature extraction is the process of reducing the dimension of the initial input data to a feature set of a lower dimension that contains most of the significant information of the original data [39]. This is done to extract features from noisy sensor data [40]; [41] and to avoid problems caused by having too many input features (especially for vibration data) for the classifier learning phase [42]. Feature extraction is often a first and essential step for any classification [42]. Methods of feature extraction include extracting features from the time domain and the frequency domain (Fourier Transformation, Wavelet Transformation [41]) and clustering, if necessary. Basic features include maximum, mean, minimum, peak, peak-to-peak interval etc. [18]. Complex feature extraction methods include principal component analysis (PCA), independent component analysis (ICA) and kernel principal component analysis (KPCA) [43]. Other feature extraction methods are: t-test, correlation matrix, stepwise regression and factor analysis (FA) [44]. A comparison of the various feature extraction methods appears in [45]. Selecting relevant features for classifiers is important for a variety of reasons, such as generalization performance, computational efficiency, and feature interpretability [46]. Using all available features can result in over-fitting and bad predictions, but i is not possible to look at each feature alone because many features are inter-correlated [47]. Noise, irrelevant features or redundant features complicate the selection of features even more. Thus, features are often selected using methods from pattern recognition or heuristic optimization, or a combination. Sugumaran et al. [29] show how different technologies can be combined for a single goal; they use a decision tree for feature selection and a Proximal Support Vector Machine for classification. Widodo and Yang [43] combine ICA/PCA with SVM for feature extraction and classification. Many algorithms combine Genetic Algorithms (GA) with a pattern recognition method, like decision trees (DT), SVM or Artificial Neural Networks (ANN). In these combinations, GA used to optimize the process parameter [48] [49] or for feature extraction and the pattern recognition required for classification. [50] [51] [52] [53]

5
3.1 Time Domain Features Time domain features can be direct features, such as the number of peaks, zero-crossings, mean amplitude, maximum amplitude, minimum amplitude or peak-to-peak intervals [18] [54]. In addition, it is possible to analyse a signal using probabilistic moments like root mean square, variance, skewness or kurtosis to get features that represent the signal [55]. Other methods include using correlation, autocorrelation, Entropy, PCA, ICA and (KPCA [43].
3.2 Frequency and Time-Frequency Domain Fast Fourier Transformation (FFT) transforms a signal from the time domain into the frequency domain. Specifically, FFT takes a time series and transforms it into a complex vector that represents the frequency power in frequency domain. The basis of the FFT algorithm is the discrete Fourier transformation (DFT), defined in Equation (2) with xn… xn-1 as complex numbers.
(1)
FFT is performed in O(N log N) time [56] and can be calculated in real time because it can be executed in parallel. It is a widely used and well-established method [57]; [41]. Recent research uses the discrete wavelet transformation (DWT) to represent time series in the frequency domain. The DWT represents the time series in a time-scale form [18] and is especially suited to represent non-stationary signals [40]. Failure diagnosis mostly focuses on the frequency domain, e.g. using Fourier transform or Wavelet transform, but in the early stage of failure development, the damage is not significant and the defect signal is masked by the noise in the acquired signal. The periodicity of the signal is not significant. Although spectral analysis may not be effective, using the time domain feature is recommended. Normal and defect signals differ in their statistical characteristics in the time domain, so the combined use of time domain features and features of other domains can improve diagnosis accuracy.
4 Method The method proposed in this paper for condition monitoring (CM) is based on decision trees (DTs). The inputs for the DTs are features (e.g. maximum value, mean values, frequency domain data; see Table 1) extracted from processed sensor data; the output is the current health condition in ten percent steps of the total useful life (TUL) (see Figure 4 and Figure 5). The health condition is used to forecast the remaining useful life (RUL). The quality of the monitoring is increased by using a genetic algorithm [58] to optimize the process parameters. The method is divided into a training process and a classification process. The goal of the former is to create a set of optimal decision trees to classify the system condition. The goal of the latter is to classify a new sensor data sample in the current system condition and use the system condition history to make a prediction about the remaining RUL. The novelty of the approach is the discretisation of the system’s condition into ten categories and using the condition changes to create a time series that can be used for condition prediction (see Galar, Kumar et al. [59] for a similar approach using Support Vector Machines). The method adds the input from multiple mixed sensors (Boolean and continuous) to detect the system’s health condition. The goal is to prevent unscheduled maintenance operations by estimating
6
the RUL of the monitored system. The goal is not to predict the future time series of a sensor as well as possible. Nor will the method output what failures will happen; it will only show that a failure will happen at a certain point in time. Ideally, the generic approach of this method will avoid the “better mousetrap symptom” (reinvent a common product with some improvements and higher costs) and will be applicable to more than one specific system. Jack and Nandi [60] show that using a genetic algorithm to select features from a given set can significantly improve the accuracy of a classifier.
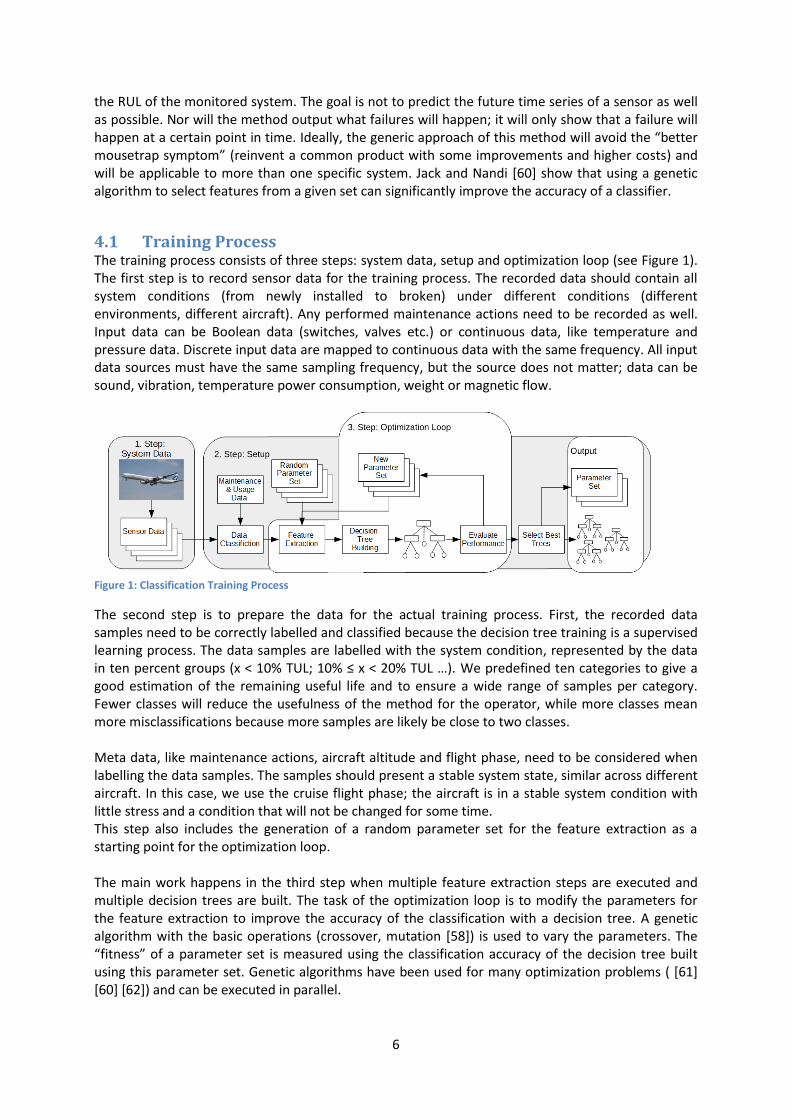
4.1 Training Process The training process consists of three steps: system data, setup and optimization loop (see Figure 1). The first step is to record sensor data for the training process. The recorded data should contain all system conditions (from newly installed to broken) under different conditions (different environments, different aircraft). Any performed maintenance actions need to be recorded as well. Input data can be Boolean data (switches, valves etc.) or continuous data, like temperature and pressure data. Discrete input data are mapped to continuous data with the same frequency. All input data sources must have the same sampling frequency, but the source does not matter; data can be sound, vibration, temperature power consumption, weight or magnetic flow.
Figure 1: Classification Training Process
The second step is to prepare the data for the actual training process. First, the recorded data samples need to be correctly labelled and classified because the decision tree training is a supervised learning process. The data samples are labelled with the system condition, represented by the data in ten percent groups (x < 10% TUL; 10% ≤ x < 20% TUL …). We predefined ten categories to give a good estimation of the remaining useful life and to ensure a wide range of samples per category. Fewer classes will reduce the usefulness of the method for the operator, while more classes mean more misclassifications because more samples are likely be close to two classes. Meta data, like maintenance actions, aircraft altitude and flight phase, need to be considered when labelling the data samples. The samples should present a stable system state, similar across different aircraft. In this case, we use the cruise flight phase; the aircraft is in a stable system condition with little stress and a condition that will not be changed for some time. This step also includes the generation of a random parameter set for the feature extraction as a starting point for the optimization loop. The main work happens in the third step when multiple feature extraction steps are executed and multiple decision trees are built. The task of the optimization loop is to modify the parameters for the feature extraction to improve the accuracy of the classification with a decision tree. A genetic algorithm with the basic operations (crossover, mutation [58]) is used to vary the parameters. The “fitness” of a parameter set is measured using the classification accuracy of the decision tree built using this parameter set. Genetic algorithms have been used for many optimization problems ( [61] [60] [62]) and can be executed in parallel.

7
The first step is to create many different sets of training input vectors by applying feature extraction operations to the labelled data samples. These feature extraction operations are controlled by the previously created parameter sets. The second step of the optimization loop is to create a decision tree with the input vector representing the current feature set.
4.2 Feature Extraction Having a set of elemental feature extraction operations controlled by a parameter means the operations can be executed in any order, and the feature extraction algorithm can be adapted for multiple problems [63] by using a genetic algorithm for optimization without human interaction. In [64], signal analysis and machine learning are used to detect the condition of an experimental setup. The concept is almost automated and bur requires minimal fine-tuning by hand because the process depends on several different parameters, each of which must be adapted to the data for optimal classification. These parameters include the following: Table 1: Data Processing Parameters
Parameter Name Possible Values
Block width 0 – 1000 (Hz)
Use Blocks Boolean
Calculate the mean amplitude for each block Boolean
Calculate the maximum amplitude for each block Boolean
Calculate the mean frequency power for each block Boolean
Calculate the maximum frequency power for each block Boolean
Calculation the number of peaks for each block Boolean
Minimum value of a peak 0 – 5
Calculate the overall mean and maximum values Boolean
Confidence factor 0.00001 - 0.5
Block Width defines how many frequencies are grouped in the frequency domain to form a block for detailed feature extraction. Noise Reduction Factor defines how much noise will be reduced. The noise reduction in this concept removes all frequencies in the frequency wherein power is below noise reduction factor times mean power. (2 shows how noise is defined for this method.
(2)
Minimum Value of a peak controls what frequencies are defined as peaks. It is the opposite of noise (Eq. (3). Any frequency where power is greater than or equal to the peak border times the mean power is defined as a peak, as shown in Equation 3.
(3)
Confidence Factor controls the extent of tree pruning and is a parameter of the J48 algorithm of the WEKA software [65]. A confidence factor greater than 0.5 means no pruning is done. The lower the confidence factor, the more pruning. All other parameters are Boolean; they control whether a given feature is calculated or not. Elementary feature extraction operations can be executed in any order and allow the creation of a set of feature extraction operations that can be different for each problem [63]. This makes
8
elementary extraction operations good for machine learning. The operations are also fast to compute and can be used for online monitoring. The data from the various sensors are not merged at the sensor level but at the feature extraction level. A feature set is calculated for each input from each sensor. These features are merged into one feature input vector for the decision tree learning phase. No frequency features are calculated for signals that are nearly constant (Boolean switches, discrete system settings, certain process parameters). The selection of features is determined by the parameters in Table 1. The values for the parameters are randomly generated or generated during optimization using a search algorithm. We use these quite basic feature extraction operations to ensure that, even with simple hardware, a near real time monitoring is possible.
4.3 Building a Decision Tree Decision trees are used in the area of artificial intelligence for decision making and machine learning. Decision trees are often binary; each node has an if-then-else function on an attribute of the sample data. The ID3 algorithm (Iterative Dichotomiser 3, J. Ross Quinlan, 1986 [17]) was the first algorithm to construct decision trees. ID3 had some problems and was improved in C4.5 [66]. The latter algorithm has the ability to handle both discrete and continuous attributes, to handle samples with missing attributes and to support pruning of the tree (removing branches from the tree). It uses the concept of information gain and information entropy to choose attributes from the data and build a decision tree. The result is a binary decision tree, whose root is the attribute with the highest normalized information gain. Nodes in subsequent levels of the tree represent attributes with lower normalized information gain. Decision trees are used to solve a large variety of problems, e.g. tag speech parts [67], land cover mapping [68], text mining [69]. We use the C4.5 algorithm, specifically the open source implantation J48 from the WEKA [65] software. We selected it because it supports continuous values and pruning and is very well understood. The next step is to evaluate the fitness of the decision tree by checking how many samples are correctly classified. This checking is done by classifying a test data set. The test data set can contain data samples used to build the decision tree, but preferably, the test set should be disjunctive from the training set. A new parameter set for the feature extraction is created using the genetic algorithm, and a new input vector for the next iteration is created. The optimization loop is executed until a given accuracy is achieved or a set number of iterations is performed.
4.4 Classification and Prediction The process for predicting condition (Figure 2) is based on the results of continuous condition monitoring and classification. Each classification adds a new data sample to the class time series. The process has three steps: the first recording new sensor data; the second is classifying the sensor data and adding the classification result to a time series; the third is marking when the system condition switches from one state to another and using these data points to extrapolate the data into the future.

9
Figure 2: Classification and Prediction Process
Having a network of different sensors to monitor a system can cause sensor data fusion. Multi-sensor data fusion prevents the problem of combining sensor data from different sources into one consistent model, but the main questions of sensor fusion are [70]:
How to get accurate and reliable information from multiple and possibly redundant sensors;
How to fuse multi-sensor data with imprecise and conflicting data. Techniques for sensor fusion can be grouped into the following levels [18]; [71]; [72]:
Data-level fusion (e.g. combining sensor data from same sensors directly [73]);
Feature-level fusion (e.g. combining vectors and feature reduction techniques [71]);
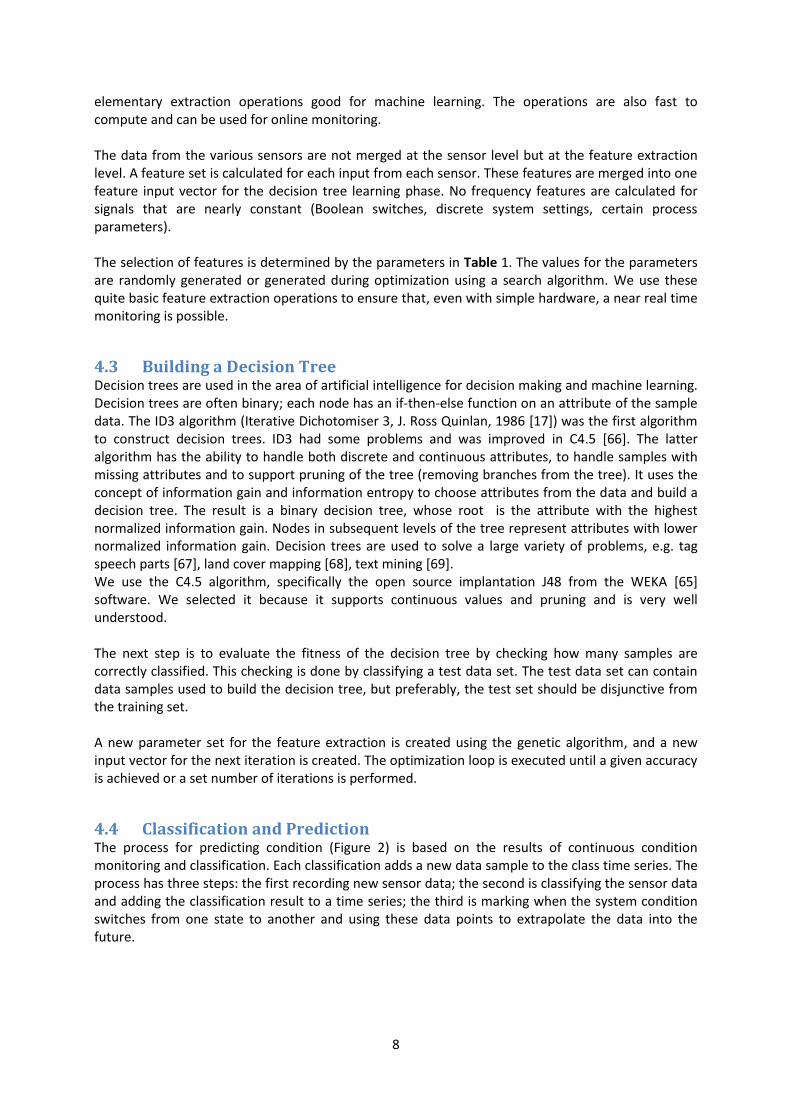
Decision-level fusion (e.g. vote schemes [71]). The use of multiple decision trees has been shown to improve the overall accuracy and robustness of predictions [28]. The data of the decision trees are fused onto the decision level using a voting method [71]. If the majority of the trees classifies a data sample as being in a certain class, this class is selected. If all trees get a different result, the result of the tree with the highest classification accuracy for the training data is used.
10
Figure 3: Condition Monitoring with Multiple Trees [74]
The proposed method uses the three best performing decision trees. Only three are selected to allow real time condition monitoring while increasing the accuracy in a noticeable way [64]. A new data sample is taken and processed according to the feature extraction parameter set of each tree. The sample is classified using a voting process among the three decision trees (Figure 3). If two or more trees classify a data sample as the same class, this class is selected. If all three trees get a different result, the result of the first tree is taken. The resulting time series is subject to noise in form of erroneous classifications (Figure 4). If there are no errors, the curve should look like a set of stairs. To reduce the wrong classifications, each data point is set to the class of 20 of its neighbours (this value may change depending on the noise in the time series) (Figure 5). This means that for each data point in Figure 4, 20 neighbouring data points are taken; the current data point takes the value of the class with the most members. Each noise reduced data point is now added to a new vector. The new classification vector is shown in Figure 5.

11
Figure 4: Classification Time Series with Noise/Wrong Classifications
Figure 5: Classification Time Series with Applied Noise Reduction
Condition prediction uses past condition monitoring data to predict the RUL of the monitored system by taking the first dot after each “health condition class jump” (jumps in Figure 5). Ideally, this plot should be a linear function, with the health condition changes equally spaced (see Figure 6). Maintenance action can alter the gradient of the function and/or introduce a discontinuity. In such cases, the prediction needs to be restarted from maintenance action data point.
0
10
20
30
40
50
60
70
80
90
100
0 200 400 600 800 1000 1200 1400 1600 1800 2000
Tota
l Use
ful L
ife
[%
]
Flight Hour [h]
0
10
20
30
40
50
60
70
80
90
100
0 200 400 600 800 1000 1200 1400 1600 1800 2000
Tota
l Use
ful L
ife
[%
]
Flight Hour [h]

12
Depending on the usage of the system and the operation environment, the health condition changes may not be equally spaced. Such spacing indicates a change in the degradation and, thus, in the RUL. Prediction is possible when two or more state changes have been detected, however. Because the plot does not have more than 11 data points, it is possible to use a simple approximation method. The classification rules (the rules determining in which TUL class a sample belongs) are automatically generated by the samples used to train the decision tree. The threshold for an RUL of zero (or a TUL of 100%) is gained by extrapolating the already classified samples (see Figure 6). This means the RUL is based on experience, not on physical models or aircraft regulations (maximum number of flight hours).
Figure 6: Remaining Useful Life Prediction
5 Validation We now evaluate the proposed method using sensor data from the air conditioning system of an A320 aircraft operated by ETIHAD Airways in the Middle East. The sensor data are from 589 flights over two years. Each sensor reading includes over 80 values, consisting of continuous and Boolean data. The data are sampled with a frequency of 1 Hz. Table 2 lists the sensor data.
0
10
20
30
40
50
60
70
80
90
100
0 200 400 600 800 1000 1200 1400 1600 1800
Tota
l Use
ful L
ife
[%
]
Flight Hour [h]

13
Table 2: A320 Sensor Data Description
Description Bus Type
Cabin Compartment Temperature Group 1 Zone Control Numerical
Cabin Compartment Temperature Group 2 Zone Control Numerical
Cabin Compartment Temperature Group 3 Zone Control Numerical
Cabin Temperature Regulation Valve Position Group 1 Zone Control Numerical
Cabin Temperature Regulation Valve Position Group 2 Zone Control Numerical
Cabin Temperature Regulation Valve Position Group 3 Zone Control Numerical
Duct Overheat Warning Group 1 Zone Control Boolean
Duct Overheat Warning Group 2 Zone Control Boolean
Duct Overheat Warning Group 3 Zone Control Boolean
Duct Temperature 4 Times Limit Exceedance Group 1 Zone Control Boolean
Duct Temperature 4 Times Limit Exceedance Group 2 Zone Control Boolean
Duct Temperature 4 Times Limit Exceedance Group 3 Zone Control Boolean
Duct Temperature Group 1 Zone Control Numerical
Duct Temperature Group 2 Zone Control Numerical
Duct Temperature Group 3 Zone Control Numerical
G + T Fan OFF Zone Control Boolean
Hot Air Switch Position ON Zone Control Boolean
Minimum Bleed Air Pressure Demand Zone Control Numerical
Nacell Anti Ice - Engine 1 Zone Control Boolean
Nacell Anti Ice - Engine 2 Zone Control Boolean
Recirculation Fan Left Hand Fault Zone Control Boolean
Recirculation Fan Right Hand Fault Zone Control Boolean
Trim Air Pressure Regulation Valve Disagree Zone Control Boolean
Trim Air Pressure High Zone Control Boolean
Trim Air Pressure Regulation Valve Close Zone Control Boolean
Trim Air System Inoperational Zone Control Boolean
Zone Main Control Inoperational Zone Control Boolean
Zone Secondary Control Inoperational Zone Control Boolean
Description refers to the name of the sensor, bus indicates from which system data are taken (Air Data Computer, Flight Data Interface Unit, Inertial Reference System, Zone Control, Bleed Monitoring

14
Computer, Pack Control) and type indicates if data are Boolean or continuous. Zone Control, Bleed Monitoring Computer and Pack Control buses are directly related to the air conditioning system. The Bleed Monitoring Computer bus monitors the input to the system (56 sensor values), the Pack Control bus has data directly related to the monitored system (8 sensor values) and the Zone Control bus contains sensor data that monitor the output of the system (28 sensor values). Data from the Air Data Computer, Flight Data Interface Unit and Inertial Reference System bus concern the position and environment of the aircraft (air temperature, time). As the table shows, the data contain failure states (e.g. Trim Air System Inoperational, Boolean value), switches (e.g. Hot Air Switch Position ON, Boolean value) and direct output data (e.g. Cabin Compartment Temperature Group 1, numerical value). We generate samples for the decision tree by taking 1024 samples of sensor data after the aircraft has reached a height of 30,000 ft. Such a sample equals 17 minutes of data in cruise flight and yields about 3400 data samples. Samples for the training and test set are randomly taken from the flight data with a chance of 25% to prevent the training data from overlapping with the test data and to ensure the number of samples per class is not equally distributed. We divide the data samples into ten categories. The first category includes all data samples with a time stamp lower than 10% of the TUL of the system, and the last category contains samples with a timestamp between 90% and 100% of the TUL. All categories in between are split equally, each covering a 10% range of TUL. We feed data samples into the condition monitoring process and classify them, generating a time series with the classifications and a list with the sample numbers where the system’s condition has changed (see Figure 8). We use a DT forest of three trees to classify the samples. Data analysis shows a maintenance action after approximately 840 flight hours (FH). The nature of the maintenance action is unknown, but the sample classifications show the data samples after 840 FH are similar to the ones at the beginning of the data recording. This indicates the maintenance action reset the system condition and hints at a major maintenance action.

15
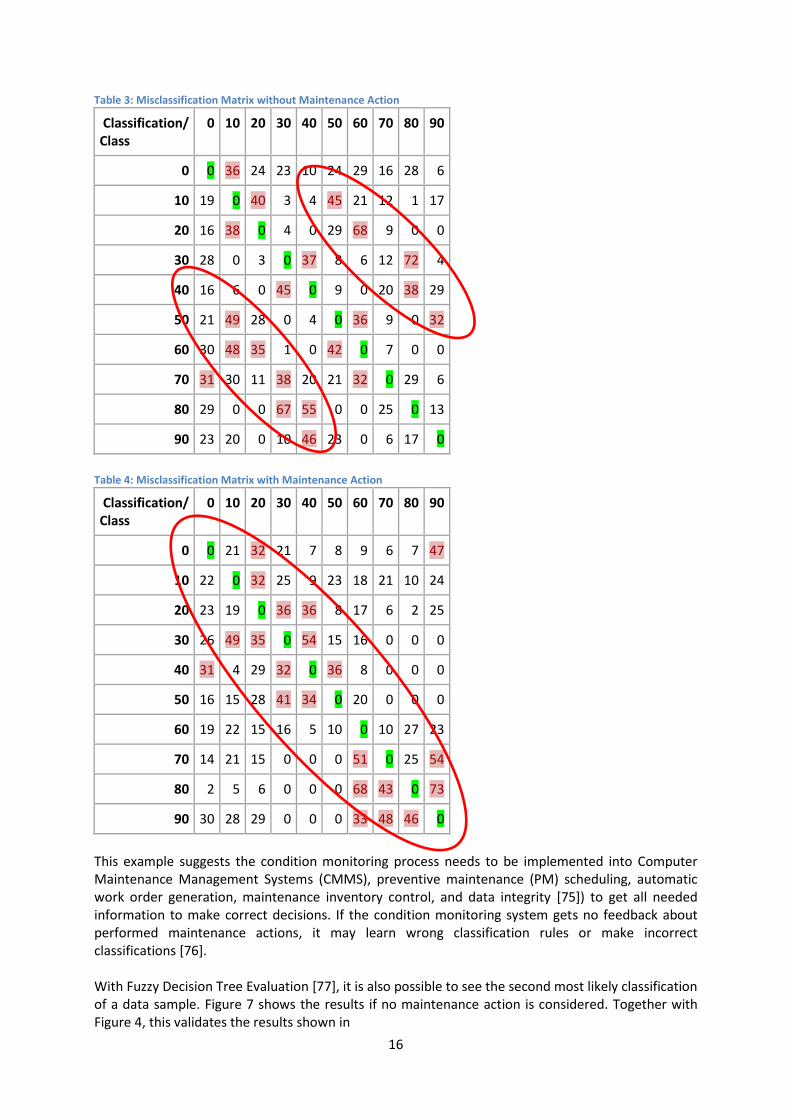
Table 3 shows the misclassification of samples if it is assumed there was no maintenance action. The green marked entries are the correct classifications. On the left and right are misclassifications that are very similar to the correct ones. Each entry in the table is a set of “X sample of class Y classified as class Z”. Class Y is the left-most column and class Z is the top row of the table. X is the number where Y and Z intersect. For example, “19 samples of class 10 are classified as class 0”, or “49 samples of class 50 are classified as class 10”. Many misclassifications are clustered. This is visible in Figure 4 and Figure 5, where the classified class is often the real class +/- “50” (TUL, class label). It is also apparent that parallel to the correct classifications are two groups of misclassifications. The misclassifications in these groups indicate class "50" is similar to class "10", class "60" is similar to class "20", class "70" is similar to class "30" etc. That means after class "40" the health condition is very similar to the beginning of the time series, suggesting something reset the system health condition. Table 4 shows the misclassifications after it is assumed that at flight hour 840, the system health condition was reset. Now the misclassifications are neighbours of the correct classification; this is a good sign, because neighbouring classes should have similar features. It also shows that the assumption of the maintenance action at 840FH is correct.
16
Table 3: Misclassification Matrix without Maintenance Action
Classification/ Class
0 10 20 30 40 50 60 70 80 90
0 0 36 24 23 10 24 29 16 28 6
10 19 0 40 3 4 45 21 12 1 17
20 16 38 0 4 0 29 68 9 0 0
30 28 0 3 0 37 8 6 12 72 4
40 16 6 0 45 0 9 0 20 38 29
50 21 49 28 0 4 0 36 9 0 32
60 30 48 35 1 0 42 0 7 0 0
70 31 30 11 38 20 21 32 0 29 6
80 29 0 0 67 55 0 0 25 0 13
90 23 20 0 10 46 23 0 6 17 0
Table 4: Misclassification Matrix with Maintenance Action
Classification/ Class
0 10 20 30 40 50 60 70 80 90
0 0 21 32 21 7 8 9 6 7 47
10 22 0 32 25 9 23 18 21 10 24
20 23 19 0 36 36 8 17 6 2 25
30 26 49 35 0 54 15 16 0 0 0
40 31 4 29 32 0 36 8 0 0 0
50 16 15 28 41 34 0 20 0 0 0
60 19 22 15 16 5 10 0 10 27 23
70 14 21 15 0 0 0 51 0 25 54
80 2 5 6 0 0 0 68 43 0 73
90 30 28 29 0 0 0 33 48 46 0
This example suggests the condition monitoring process needs to be implemented into Computer Maintenance Management Systems (CMMS), preventive maintenance (PM) scheduling, automatic work order generation, maintenance inventory control, and data integrity [75]) to get all needed information to make correct decisions. If the condition monitoring system gets no feedback about performed maintenance actions, it may learn wrong classification rules or make incorrect classifications [76]. With Fuzzy Decision Tree Evaluation [77], it is also possible to see the second most likely classification of a data sample. Figure 7 shows the results if no maintenance action is considered. Together with Figure 4, this validates the results shown in

17
Table 3 and the assumption of the occurrence of a maintenance action.
Figure 7: Second Most Likely Class
The maintenance action during the duration of the recorded data is assumed to be the end of the lifetime and the first data point is the beginning, because no data above the whole life of the system are available. However, this should be sufficient to validate the concept. Recall that the TUL of the system was set to 840 FH, because of the maintenance action around FH 840. All samples between 0 FH and 840 FH are slotted into the 10 classes; the same is done for the samples between 840 FH and 1700 FH. This simulates two total lifetimes of the system. The process is able to classify the randomly taken data sample correctly, with an error rate of 346 wrong samples from a total of 835 samples, or 41%. This large error rate is due to the high noise in the data and the lack of perfect division of the data into two time series (two total life times). It is difficult to reduce the noise at the source level, because we are using direct data from the aircraft, but it is possible to reduce the noise before the feature extraction step by applying noise reduction. Noise reduction needs to be applied carefully so that no significant features (especially for the Boolean data sources) are removed. For this reason, we do not perform noise reduction for each channel; instead, we perform noise reduction on the results, because without maintenance, the TUL can only increase. The wrong classifications are spread over nine classes; this allows correct classification because it indicates the most common class over a range of 20 classifications (three flights or 10 FH) in the time series. Note that the misclassifications are mostly caused by samples that are close to the border of a class and wrongly classified as the neighbouring class (see Table 4). The resulting condition time series is shown in Figure 8. In the figure, the points at which the current system condition switches are nearly equally spaced, even with many misclassifications in the data source, and deviate very little from the correct data points.
0
10
20
30
40
50
60
70
80
90
100
0 200 400 600 800 1000 1200 1400 1600 1800 2000
Tota
l Use
ful L
ife
[%
]
Flight Hour [h]

18
Figure 8: Start of Different System Health Conditions
Table 5 shows how the error rate improves when more training samples are used for testing. The table shows the number of samples selected for training or testing (out of 3400 samples), the method of sample selection (random is self-explanatory; separation means training samples and testing samples don't mix), the error rate of the classification, and a list of the detected condition changes. There is an overlap/intersection of training and testing data in all cases. Table 5: Different Splitting of Training and Test Data
Number of Samples Method Error Rate TUL -> FH
850 Training 850 Testing
Random 41% 72;163;264;70;434;532;620;702;808;840
850 Training 3400 Testing
Random 43% 85;39;259;341;429;4;169;688;196;840
1700 Training 1700 Testing
Random 23% 86;176;263;357;443;535;623;708;800;840
1700 Training 1700 Testing
Separation 40% 88;172;264;282;443;528;623;711;800;840
1700 Training 3400 Testing
Random 24% 72;176;266;357;441;537;623;711;802;840
3400 Training 3400 Testing
- 7% 88;174;264;355;441;532;620;708;800;840
Table 5 shows the classification error rate is about 40% for classifications where the training and testing data are separated or where is little overlap. The accuracy increases as soon as the overlap between training and test data increases. This behaviour is to be expected; it shows the algorithm and data are prone to over fitting, something common to many experiments. It also shows that
0
10
20
30
40
50
60
70
80
90
100
0 100 200 300 400 500 600 700 800 900
Pe
rce
nt
of
Tota
l Use
ful L
ife
[%
]
Flight Hour [h]
19
beside a few outliers in the time series, all cases detect nearly the same condition changes in the system. The error rate of 40% looks very high, even with noise in the input data. However, the high error rate can be explained by the nature of the air conditioning system and the input data. The air conditioning system is a large distributed system constructed of active and passive sub-systems. The subsystems are one “main” unit: the air cycle machine, multiple fans, filters, valves and tubes. The sensor data used for validation are the input and output data of the system; no sensor data representing the internal state are used. Finally, most of the sensor data are Boolean signals representing valves, switches or failure states.
6 Conclusions Condition monitoring and prognostics are complex processes, difficult to establish in the aircraft environment. The method proposed in this paper can be used to classify a system’s health condition and forecast its remaining useful life. The novelty of this approach is that it offers a simple method for condition monitoring and prediction that can be used in the restricted aircraft environment. The method uses decision trees to generate simple logical clauses; these can be checked and certified with little difficulty. It can be used on-ground to monitor all aircraft that submit sensor data without the need to install additional sensors or hard- or software. This makes the method very interesting for fleet health monitoring applications. Finally, the relatively simple feature extraction, classification and prediction are handy when there is a need to monitor multiple aircraft with multiple systems in real time. Classification and prediction are possible with this method, even with noisy real-world data and with no additional information about the system being monitored. It can be used for existing systems that already log events, process parameters, and input/output data, but do not have a condition monitoring and prediction system. The method is generally applicable; it can use any available input data from any system because of the use of mixed data input channels (discrete and continuous data). One caveat is the need to combine CMMS and CM to avoid too many misclassifications caused by unknown maintenance actions in the training phase. The validation process shows RUL can be forecast after 400 FH. This makes it possible to plan maintenance actions for aircraft in advance and avoid unscheduled maintenance. In fact, forecasting is possible after one condition change is detected (after about 90 FH), but if several conditions change, the forecasting accuracy improves. Despite its efficacy, the method can be improved in future research. The accuracy of the individual decision trees and, thus, the overall accuracy can be improved by using advanced feature extraction methods, like wavelet package transformation, ICA, KPAC or PCA. Fusion of additional sources using noise reduction techniques and validation of the proposed method using flight data from multiple aircraft to perform sensitivity analysis at a system level should be considered in future research on aircraft prognostics in systems and at a fleet level. It would also be possible to use a hybrid model to generate a decision tree and an artificial neural network or other classification method for each set of parameters. The best method for the given parameter set could then be used in the final classification forest. The method cannot be used to forecast a specific failure, nor can it be used for diagnosis, because the health condition of the whole system, i.e. prognosis at a system level, is detected and forecast. The method could be improved with the use of cleaner and less noisy data. Nevertheless, the process is robust; it can compensate by applying noise reduction to the time series because of the uniform
20
distribution of the noise. The cost of this compensation is a delay in the detection of the system’s health.
References
[1] Institut du Transport Aerien, „Costs of Air Transport Delay in Europe,“ 2000.
[2] Eurocontrol, „Cost of Delays - Notes,“ 2006.
[3] A. J. Cook, G. Tanner und S. Anderson, „Evaluating the true cost to airlines of one minute of airborne or ground delay: final report,“ 2004.
[4] K. Goode, J. Moore und B. Roylance, „Plant machinery working life prediction method utilizing reliability and condition-monitoring data,“ Proceedings of the Institution of Mechanical Engineers, Part E: Journal of Process Mechanical Engineering, Bd. 214, Nr. 2, pp. 109-122, 2000.
[5] A. K. Mahamad, S. Saon und T. Hiyama, „Predicting remaining useful life of rotating machinery based artificial neural network,“ Computers & Mathematics with Applications, Bd. 60, Nr. 4, pp. 1078-1087, 2010.
[6] N. Saravanan und K. Ramachandran, „Fault diagnosis of spur bevel gear box using discrete wavelet features and Decision Tree classification,“ Expert Systems with Applications, Bd. 36, Nr. 5, pp. 9564-9573, 2009.
[7] V. Sugumaran und K. Ramachandran, „Effect of number of features on classification of roller bearing faults using SVM and PSVM,“ Expert Systems with Applications, Bd. 38, Nr. 4, pp. 4088-4096, 2011.
[8] Federal Aviation Administration, „AC 121-22C - Maintenance Review Boards, Maintenance Type Boards, and OEM/TCH Recommended Maintenance Procedures,“ 2012.
[9] F. Nowlan und H. Heap, Reliability-centered Maintenance, Dolby Access Press, 1978.
[10] Air Transport Association of America, „MSG-3: Operator/Manufacturer Scheduled Maintenance Development,“ 2007.
[11] European Committee for Standardization, „EN 13306 - Maintenance terminology - draft,“ 2015.
[12] E. Kiyak, „The effects of aircraft preventive maintenance on reliability,“ International Journal of Applied Mathematics and Informatics, Bd. 6, Nr. 1, pp. 9-16, 2012.
[13] G. Niu und M. Pecht, „A framework for cost-effective and accurate maintenance combining CBM RCM and data fusion,“ in Reliability, Maintainability and Safety, 2009. ICRMS 2009. 8th International Conference on, 2009.
[14] European Committee for Standardization, „EN 13306 - Maintenance terminology,“ 2010.
[15] European Committee for Standardization, „EN 13306 - Maintenance terminology,“ 2001.
[16] M. Cernak, „A Comparison of Decision Tree Classifiers for Automatic Diagnosis of Speech Recognition Errors,“ Computing and Informatics, Bd. 29, Nr. 3, pp. 489-501, July 2010.
[17] J. R. Quinlan, „Induction of Decision Trees,“ Mach. Learn, pp. 81-106, 1986.
[18] A. K. Jardine, D. Lin und D. Banjevic, „A review on machinery diagnostics and prognostics implementing condition-based maintenance,“ Mechanical systems and signal processing, Bd. 20, Nr. 7, pp. 1483-1510, 2006.
[19] R. K. Mobley, An introduction to predictive maintenance, Butterworth-Heinemann, 2002.
[20] J. Kolerus und J. Wassermann, Zustandsüberwachung von Maschinen: Das Lehr- und Arbeitsbuch für den Praktiker, Expert-Verlag, 2011.

21
[21] C. Chen, B. Zhang, G. Vachtsevanos und M. Orchard, „Machine condition prediction based on adaptive neuro--fuzzy and high-order particle filtering,“ Industrial Electronics, IEEE Transactions on, Bd. 58, Nr. 9, pp. 4353-4364, 2011.
[22] W. Caesarendra, G. Niu und B.-S. Yang, „Machine condition prognosis based on sequential Monte Carlo method,“ Expert Systems with Applications, Bd. 37, Nr. 3, pp. 2412-2420, 2010.
[23] H. T. Pham und B.-S. Yang, „Estimation and forecasting of machine health condition using ARMA/GARCH model,“ Mechanical Systems and Signal Processing, Bd. 24, Nr. 2, pp. 546-558, 2010.
[24] Z. Tian, L. Wong und N. Safaei, „A neural network approach for remaining useful life prediction utilizing both failure and suspension histories,“ Mechanical Systems and Signal Processing, Bd. 24, Nr. 5, pp. 1542-1555, 2010.
[25] J. Sikorska, M. Hodkiewicz und L. Ma, „Prognostic modelling options for remaining useful life estimation by industry,“ Mechanical Systems and Signal Processing, Bd. 25, Nr. 5, pp. 1803-1836, 2011.
[26] L. Schruben, „Confidence interval estimation using standardized time series,“ Operations Research, Bd. 31, Nr. 6, pp. 1090-1108, 1983.
[27] J. H. Williams, A. Davies und D. P. R., Condition-based Maintenance and Machine Diagnostics, Chapman & Hall, 1994.
[28] J. Zhang, „Improved on-line process fault diagnosis through information fusion in multiple neural networks,“ Computers & chemical engineering, Bd. 30, Nr. 3, pp. 558-571, 2006.
[29] V. Sugumaran, V. Muralidharan und K. Ramachandran, „Feature selection using decision tree and classification through proximal support vector machine for fault diagnostics of roller bearing,“ Mechanical systems and signal processing, Bd. 21, Nr. 2, pp. 930-942, 2007.
[30] V. Sugumaran und K. Ramachandran, „Automatic rule learning using decision tree for fuzzy classifier in fault diagnosis of roller bearing,“ Mechanical Systems and Signal Processing, Bd. 21, Nr. 5, pp. 2237-2247, 2007.
[31] V. T. Tran, B.-S. Yang und A. C. C. Tan, „Multi-step ahead direct prediction for machine condition prognosis using regression trees and neuro-fuzzy systems,“ Expert Systems With Applications, Bd. 36, Nr. 5, pp. 9378-9387, July 2009.
[32] H. T. Pham, B.-S. Yang, T. T. Nguyen und others, „Machine performance degradation assessment and remaining useful life prediction using proportional hazard model and support vector machine,“ Mechanical Systems and Signal Processing, Bd. 32, pp. 320-330, 2012.
[33] A. Widodo und B.-S. Yang, „Support vector machine in machine condition monitoring and fault diagnosis,“ Mechanical Systems and Signal Processing, Bd. 21, Nr. 6, pp. 2560-2574, 2007.
[34] C. Chen, B. Zhang und G. Vachtsevanos, „Prediction of machine health condition using neuro-fuzzy and Bayesian algorithms,“ Instrumentation and Measurement, IEEE Transactions on, Bd. 61, Nr. 2, pp. 297-306, 2012.
[35] Z. Tian, „An artificial neural network method for remaining useful life prediction of equipment subject to condition monitoring,“ Journal of Intelligent Manufacturing, Bd. 23, Nr. 2, pp. 227-237, 2012.
[36] T. Wang, J. Yu, D. Siegel und J. Lee, „A similarity-based prognostics approach for remaining useful life estimation of engineered systems,“ in Prognostics and Health Management, 2008. PHM 2008. International Conference on, 2008.
[37] M. Pecht, Prognostics and health management of electronics, Wiley Online Library, 2008.

22
[38] M. C. Garcia, M. A. Sanz-Bobi und J. del Pico, „SIMAP: Intelligent System for Predictive Maintenance: Application to the health condition monitoring of a windturbine gearbox,“ Computers in Industry, Bd. 57, Nr. 6, pp. 552-568, 2006.
[39] J. Fonollosa, A. Vergara und R. Huerta, „Algorithmic mitigation of sensor failure: Is sensor replacement really necessary?,“ Sensors and Actuators B: Chemical, Bd. 183, pp. 211-221, 2013.
[40] J. Lin und L. Qu, „Feature extraction based on Morlet wavelet and its application for mechanical fault diagnosis,“ Journal of sound and vibration, Bd. 234, Nr. 1, pp. 135-148, 2000.
[41] T.-c. Fu, „A review on time series data mining,“ Engineering Applications of Artificial Intelligence, Bd. 24, Nr. 1, pp. 164-181, 2011.
[42] G. G. Yen und K.-C. Lin, „Wavelet packet feature extraction for vibration monitoring,“ Industrial Electronics, IEEE Transactions on, Bd. 47, Nr. 3, pp. 650-667, 2000.
[43] A. Widodo und B.-S. Yang, „Application of nonlinear feature extraction and support vector machines for fault diagnosis of induction motors,“ Expert Systems with Applications, Bd. 33, Nr. 1, pp. 241-250, 2007.
[44] C.-F. Tsai, „Feature selection in bankruptcy prediction,“ Knowledge-Based Systems, Bd. 22, Nr. 2, pp. 120-127, 2009.
[45] A. Arauzo-Azofra, J. L. Aznarte und J. M. Benítez, „Empirical study of feature selection methods based on individual feature evaluation for classification problems,“ Expert Systems with Applications, Bd. 38, Nr. 7, pp. 8170-8177, 2011.
[46] M. H. Nguyen und F. De la Torre, „Optimal feature selection for support vector machines,“ Pattern recognition, Bd. 43, Nr. 3, pp. 584-591, 2010.
[47] R. Meiri und J. Zahavi, „Using simulated annealing to optimize the feature selection problem in marketing applications,“ European Journal of Operational Research, Bd. 171, Nr. 3, pp. 842-858, 2006.
[48] B. Samanta, K. Al-Balushi und S. Al-Araimi, „Artificial neural networks and support vector machines with genetic algorithm for bearing fault detection,“ Engineering Applications of Artificial Intelligence, Bd. 16, Nr. 7, pp. 657-665, 2003.
[49] C.-L. Huang und C.-J. Wang, „A GA-based feature selection and parameters optimizationfor support vector machines,“ Expert Systems with applications, Bd. 31, Nr. 2, pp. 231-240, 2006.
[50] B. Samanta, „Artificial neural networks and genetic algorithms for gear fault detection,“ Mechanical Systems and Signal Processing, Bd. 18, Nr. 5, pp. 1273-1282, 2004.
[51] A. Saxena und A. Saad, „Evolving an artificial neural network classifier for condition monitoring of rotating mechanical systems,“ Applied Soft Computing, Bd. 7, Nr. 1, pp. 441-454, 2007.
[52] L. Jack und A. Nandi, „Fault detection using support vector machines and artificial neural networks, augmented by genetic algorithms,“ Mechanical systems and signal processing, Bd. 16, Nr. 2, pp. 373-390, 2002.
[53] B. Samanta, „Gear fault detection using artificial neural networks and support vector machines with genetic algorithms,“ Mechanical Systems and Signal Processing, Bd. 18, Nr. 3, pp. 625-644, 2004.
[54] D. G. Pascual, Artificial Intelligence Tools: Decision Support Systems in Condition Monitoring and DIagnosis, Crc Press, 2015.
[55] T. Lambrou, P. Kudumakis, R. Speller, M. Sandler und A. Linney, „Classification of audio signals using statistical features on time and wavelet transform domains,“ in Acoustics, Speech and Signal Processing, 1998. Proceedings of the 1998 IEEE International Conference on, 1998.
[56] J. Ohm und H. Lüke, Signalübertragung: Grundlagen der digitalen und analogen Nachrichtenübertragungssysteme, Springer Berlin Heidelberg, 2010.
[57] Z. Peng, F. Chu und Y. He, „Vibration signal analysis and feature extraction based on reassigned wavelet scalogram,“ Journal of Sound and Vibration, Bd. 253, Nr. 5, pp. 1087-1100, 2002.
23
[58] S. J. Russell und P. Norvig, Artificial Intelligence: A Modern Approach, Pearson Education, 2003.
[59] D. Galar, U. Kumar, J. Lee und W. Zhao, „Remaining useful life estimation using time trajectory tracking and support vector machines,“ in Journal of Physics: Conference Series, 2012.
[60] L. Jack und A. Nandi, „Genetic algorithms for feature selection in machine condition monitoring with vibration signals,“ in Vision, Image and Signal Processing, IEE Proceedings-, 2000.
[61] M. Golub und A. B. Posavec, „Using Genetic Algorithms for Adapting Approximation Functions,“ Proceedings of the 19th International Conference on Information Technology Interfaces ITI '97 , 1997.
[62] G. Stein, B. Chen, A. S. Wu und K. A. Hua, „Decision tree classifier for network intrusion detection with GA-based feature selection,“ in Proceedings of the 43rd annual Southeast regional conference - Volume 2, New York, NY, USA, 2005.
[63] I. Mierswa und K. Morik, „Automatic feature extraction for classifying audio data,“ Machine learning, Bd. 58, Nr. 2-3, pp. 127-149, 2005.
[64] M. Gerdes und D. Scholz, „Parameter Optimization for Automated Signal Analysis for Condition Monitoring of Aircraft Systems,“ in 3nd International Workshop on Aircraft System Technologies, AST 2011 (TUHH, Hamburg, 31. März - 01. April 2011), 2011.
[65] U. o. Waikato, WEKA, 2009.
[66] J. R. Quinlan, C4.5: Programs for Machine Learning, San Francisco, CA, USA: Morgan Kaufmann Publishers Inc., 1993.
[67] H. Schmid, „Probabilistic part-of-speech tagging using decision trees,“ in Proceedings of the international conference on new methods in language processing, 1994.
[68] M. A. Friedl und C. E. Brodley, „Decision tree classification of land cover from remotely sensed data,“ Remote sensing of environment, Bd. 61, Nr. 3, pp. 399-409, 1997.
[69] C. Apte, F. Damerau, S. M. Weiss, C. Apte, F. Damerau und S. Weiss, „Text mining with decision trees and decision rules,“ in In Proceedings of the Conference on Automated Learning and Discorery, Workshop 6: Learning from Text and the Web, 1998.
[70] O. Basir und X. Yuan, „Engine fault diagnosis based on multi-sensor information fusion using Dempster--Shafer evidence theory,“ Information Fusion, Bd. 8, Nr. 4, pp. 379-386, 2007.
[71] A. Ross und A. Jain, „Information fusion in biometrics,“ Pattern recognition letters, Bd. 24, Nr. 13, pp. 2115-2125, 2003.
[72] F. Castanedo, „A review of data fusion techniques,“ The Scientific World Journal, Bd. 2013, 2013.
[73] Y. Lu und J. E. Michaels, „Feature extraction and sensor fusion for ultrasonic structural health monitoring under changing environmental conditions,“ Sensors Journal, IEEE, Bd. 9, Nr. 11, pp. 1462-1471, 2009.
[74] A. Zaher und S. McArthur, „A Multi-Agent Fault Detection System for Wind Turbine Defect Recognition and Diagnosis,“ in 2007 IEEE Lausanne Powertech, 2007.
[75] A. Van Horenbeek, L. Pintelon und D. Galar, „Integration of disparate data sources to perform maintenance prognosis and optimal decision making,“ Insight-non-destructive testing and condition monitoring, Bd. 54, Nr. 8, pp. 440-445, 2012.
[76] D. Galar, A. GuSTAFSON, B. Tormos und L. Berges, „Maintenance Decision Making Based on Different Types of Data Fusion,“ Eksploatacja i Niezawodnosc, Maintenance and Reliability, Bd. 14, Nr. 2, pp. 135-144, 2012.
[77] M. Gerdes und D. Scholz, „Fuzzy Condition Monitoring of Recirculation Fans and Filters,“ CEAS Aeronautical Journal, Bd. 2, pp. 81-87, 2011.