“GENESIS Project” and High-Temperature …global-sei.com/technology/tr/bn66/pdf/66-02.pdf ·...
17
1. Introduction The world’s population reached 6.5 billion in February 2006 (22) and was reported to have exceeded 6.6 billion in August 2007 (65) . It is expected to rise to between nine and ten billion by the middle of the 21st century (23) . Meanwhile, according to International Energy Agency (IEA) experts, worldwide demand for energy will expand by 1.5 times by 2030 (15) . In terms of electricity alone, demand is estimated to grow 2.6 times by 2030 (16) . Total demand for primary energies will double between 2000 and 2050. Assuming that generation of greenhouse gas emissions would increase along with expansion of energy consumption, which could have adverse impacts on the environment, there is potential for a sudden, irreversible catastrophe to occur prior to the exhaustion of natural resources such as crude oil and natural gas (40-60 years of reserves). In light of these considerations, Japan, the U.S., and Europe have recently been advocating an expansion of nuclear power generation, which uses uranium and does not emit carbon dioxide, while China and other developing countries have announced plans to construct a large number of nuclear power plants (16) . Uranium, however, is a transient resource of which reserves are pro- jected to last no longer than 60 years (1)-(3) . Another seri- ous issue is that after the current generation of humans have utilized the available uranium stocks, successive gen- erations will have to manage 100 years of intermediate storage of radioactive waste, to be followed by as long as ten thousand years of ultimate storage (16), (17) . These issues indicate that, while there is a clear demand for more nuclear generation capacity right now, nuclear energy should not be regarded as the ultimate solution to energy, resource and environmental issues. Development of nuclear fusion reaction technology, in other words cre- ating an artificial sun on Planet Earth, has been proposed by some academics since many years ago. However, com- pletion of development of such a technology would take centuries according to a recent projection based on tech- nical evaluation, and still provide no lasting solution. This paper sets out to argue that, given such an impasse, the only ultimate solution that present-day engineers can pro- pose is the “GENESIS Project.” This proposal combines new, solar-derived, recyclable energies, such as photo- voltaic power, wind-turbine power, and hydraulic power, with the high-temperature superconducting power cable on which sufficient progress has recently been made to enable it to be put to practical use. The paper also describes the importance of application of PPLP Solid DC submarine cable to international interconnection of electric power in order to materialize the “global electri- cal network,” which will enable the ultimate accomplish- ment of the “GENESIS Project”. Note: The description of the GENESIS Project is based largely on references (1) through (14), although they are not always cited. 14 · “GENESIS Project” and High-Temperature Superconducting (HTS) DC Cable –Keen Use of Ultimately Sustainable New Energies– SPECIAL The world population has overpassed 6.6 billion in August, 2007, and is expected to reach 9 to 10 billion by the middle of this century. The International Energy Agency expects that the world electricity demand will grow by 50% by the year 2030 accordingly. In terms of all primary energies, the growth of demand between 2000 and 2050 is expected to be as high as 200%. Since greenhouse gas emissions increase along with the expansion of energy consumption that will bring about environmental degradation, it is pointed out that the irreversible world catastrophe would suddenly occur before energy resources become depleted. Recently, there exists an opinion that more nuclear energy that emits no CO2 gas should be used, and today there are a lot of plans for building nuclear power stations in China and other developing countries in addition to Japan, the U.S. and Europe. One problem of uranium, however, is that it is only temporarily available and its reserve will last no more than 60 years. Another serious problem is that once the present generation consumed uranium, future generations should take care of radioactive wastes during around 100 years of interim storage and more than 10 thousands years of final storage. These problems show that nuclear energy is not the ultimate solution. Academic people are saying that making an artificial sun on earth through nuclear fusion should be the solution. However, it is presently predicted that it will take over centuries to realize artificial sun, meaning that at this point in time nuclear fusion is not the solution. In this paper, the author strongly insists that, in this impasse, the only ultimate solution that the present-day engineers can propose is the “GENESIS Project” that combines new solar-oriented recyclable energies such as photovoltaic power, wind-turbine power or hydraulic power with high-temperature superconducting power cable that has recently become technologically practical. In addition, the author also describes the importance of applying PPLP solid DC submarine cable to the international interconnection of electric power systems so as to realize the “Global Electric Power Network” and finally accomplish the “GENESIS Project”. “GENESIS Project” and High-Temperature Superconducting (HTS) DC Cable –Keen Use of Ultimately Sustainable New Energies– Ryosuke HATA
-
Upload
doankhuong -
Category
Documents
-
view
218 -
download
2
Transcript of “GENESIS Project” and High-Temperature …global-sei.com/technology/tr/bn66/pdf/66-02.pdf ·...

1. Introduction
The world’s population reached 6.5 billion inFebruary 2006 (22) and was reported to have exceeded 6.6billion in August 2007 (65). It is expected to rise to betweennine and ten billion by the middle of the 21st century (23).Meanwhile, according to International Energy Agency(IEA) experts, worldwide demand for energy will expandby 1.5 times by 2030 (15). In terms of electricity alone,demand is estimated to grow 2.6 times by 2030 (16). Totaldemand for primary energies will double between 2000and 2050. Assuming that generation of greenhouse gasemissions would increase along with expansion of energyconsumption, which could have adverse impacts on theenvironment, there is potential for a sudden, irreversiblecatastrophe to occur prior to the exhaustion of naturalresources such as crude oil and natural gas (40-60 years ofreserves). In light of these considerations, Japan, the U.S.,and Europe have recently been advocating an expansionof nuclear power generation, which uses uranium anddoes not emit carbon dioxide, while China and otherdeveloping countries have announced plans to constructa large number of nuclear power plants (16). Uranium,however, is a transient resource of which reserves are pro-jected to last no longer than 60 years (1)-(3). Another seri-ous issue is that after the current generation of humanshave utilized the available uranium stocks, successive gen-erations will have to manage 100 years of intermediate
storage of radioactive waste, to be followed by as long asten thousand years of ultimate storage (16), (17). Theseissues indicate that, while there is a clear demand formore nuclear generation capacity right now, nuclearenergy should not be regarded as the ultimate solution toenergy, resource and environmental issues. Developmentof nuclear fusion reaction technology, in other words cre-ating an artificial sun on Planet Earth, has been proposedby some academics since many years ago. However, com-pletion of development of such a technology would takecenturies according to a recent projection based on tech-nical evaluation, and still provide no lasting solution. Thispaper sets out to argue that, given such an impasse, theonly ultimate solution that present-day engineers can pro-pose is the “GENESIS Project.” This proposal combinesnew, solar-derived, recyclable energies, such as photo-voltaic power, wind-turbine power, and hydraulic power,with the high-temperature superconducting power cableon which sufficient progress has recently been made toenable it to be put to practical use. The paper alsodescribes the importance of application of PPLP SolidDC submarine cable to international interconnection ofelectric power in order to materialize the “global electri-cal network,” which will enable the ultimate accomplish-ment of the “GENESIS Project”.
Note: The description of the GENESIS Project isbased largely on references (1) through (14), althoughthey are not always cited.
14 · “GENESIS Project” and High-Temperature Superconducting (HTS) DC Cable –Keen Use of Ultimately Sustainable New Energies–
SPECIAL
The world population has overpassed 6.6 billion in August, 2007, and is expected to reach 9 to 10 billion by the middleof this century. The International Energy Agency expects that the world electricity demand will grow by 50% by the year2030 accordingly. In terms of all primary energies, the growth of demand between 2000 and 2050 is expected to be ashigh as 200%. Since greenhouse gas emissions increase along with the expansion of energy consumption that will bringabout environmental degradation, it is pointed out that the irreversible world catastrophe would suddenly occur beforeenergy resources become depleted. Recently, there exists an opinion that more nuclear energy that emits no CO2 gasshould be used, and today there are a lot of plans for building nuclear power stations in China and other developingcountries in addition to Japan, the U.S. and Europe. One problem of uranium, however, is that it is only temporarilyavailable and its reserve will last no more than 60 years. Another serious problem is that once the present generationconsumed uranium, future generations should take care of radioactive wastes during around 100 years of interimstorage and more than 10 thousands years of final storage. These problems show that nuclear energy is not the ultimatesolution. Academic people are saying that making an artificial sun on earth through nuclear fusion should be thesolution. However, it is presently predicted that it will take over centuries to realize artificial sun, meaning that at thispoint in time nuclear fusion is not the solution. In this paper, the author strongly insists that, in this impasse, the onlyultimate solution that the present-day engineers can propose is the “GENESIS Project” that combines new solar-orientedrecyclable energies such as photovoltaic power, wind-turbine power or hydraulic power with high-temperaturesuperconducting power cable that has recently become technologically practical. In addition, the author also describesthe importance of applying PPLP solid DC submarine cable to the international interconnection of electric powersystems so as to realize the “Global Electric Power Network” and finally accomplish the “GENESIS Project”.
“GENESIS Project” and High-TemperatureSuperconducting (HTS) DC Cable–Keen Use of Ultimately Sustainable New Energies–
Ryosuke HATA

2. Increasing Population and EnergyConsumption, and Energy Reserves
Figure 1 shows global population growth from theyear 1 A.D. to recent times. Figure 2 shows historicalenergy consumption, which began to grow very rapidlyfrom the time of the Industrial Revolution in the late18th century, when humanity acquired the capacity to
use fossil fuel resources. Population followed the explo-sive growth function shown in the middle of Fig. 1, pass-ing a point of no return and rising from less than 3 bil-lion in 1945 to more than 6.6 billion in 2007 (22), (65), andis projected to reach 7 billion in 2030, and 9 billion in2045 (23). Energy consumption likewise skyrocketed, asshown in Fig. 2, and by 2030 is projected to be five timesthe current level (see Fig. 15).
Figure 3 presents a comparison of the growth ofenergy demand in developed and developing countries,showing that electricity demand has been growingmarkedly faster in the developing countries, and itsgrowth trend is contributing substantially to energy-related problems. Figure 4 charts installed electricalgeneration capacity per capita (which has risen extreme-ly rapidly in China, to 0.45 kW per capita in 2007). If thelevel of 1 kW per capita, which Japan reached duringthe 1970s, is taken as the steppingstone to developednation status, then the people of every country of theworld may be said to have the right to enjoy a capacity of
SEI TECHNICAL REVIEW · NUMBER 66 · APRIL 2008 · 15
(Source: Japanese Ministry of the Environment)
Discovery of Fire
Fire Energy forHousehold Activities
Coal Oil
Energies from Firewood,Watermill, Windmill & Horsepower
M Barrel per day in 1993
250
200
150
100
50
212
26
77
100
149
75
50
25
230
14
24
32
23
4
1
4
4
7
63
66
91
10
7126
Global E
nergy Consum
ption in Oil E
quivalents(M
Barrel per day for C
urve)
Engineers
TransportationIndustries
& A
gricultureH
ouseholds&
Com
merce
Food
Households &
Com
merce
Gasoline &
Engine
Thermal Pow
er Station
Coal M
ining Begins (D
rake)
Generator (S
iemens)
Coal C
onsumption in U
K: 0.1 B
-tons
Watt’s S
team E
ngine
Waterm
ill for Spinning
Partial Use of C
oal
Windm
ill for Grinding
Waterm
ill for Grinding (A
sia Minor)
Transportation by Anim
al (Egypt)
Sailing B
oat (Egypt)
Agriculture B
egins (Mesopotam
ia)C
hipped Stone Tool &
Fire (Peking Man)
Use of Tools &
Fire (Australopithecus Africanus)
IndustrialWorkers
AdvancedFarmersEarly
Farmers
AncientHunters
PrimitivePeople
A.D
. 1
1900
1970
1800
1700
1600
1000
1000
5000
Som
e Hundreds
Thousand years A
goS
everal Million
Years Ago
Energy C
onsumption Per C
apita(1000 kilocalorie)
5
Fig. 2. Historical trend of global energy consumption
10
1
0.1
0.011910 1930 1950In
stal
led
elec
trica
l gen
erat
ion
capa
city
per
cap
ita
1970 1990 Year
USA
Hong Kong/SingaporeTaiwan/South Korea
Malaysia
Thailand/China/PhilippinesIndia/PakistanIndonesia/Laos/VietnamNepal/Bhutan
kW/capita
Japan
1 kW/capita: Stepping stone to developed nation status
1 kWH 3,600K joule = 860 kcal ( ·=·0.2 ltr of petroleum oil)<1 ltr of C-type heavy oil>
Average adult consumes0.6 ltr of petroleum oil a day
( ·=·3 kWH ·=·2,500 kcal)
Fig. 4. Increase of electric power generation capacity in Japan andother Asian countries
100
50
0 1000 160018001900
1950 2050
2000 (AD)
Hundredmillion
Pop
ulat
ion
Year
3 61216 25
60
90~100
Population increase(Recent occurrence)
Warm Earth climate : Paradise
Environmentaldestruction
Rapidpopulationincrease
Doubled in 1600 years
Populationincrease
Humanactivities
2 million years ago: 6 ice ages 10 thousand years ago: Last ice age Now: Interglacial period
Environmentaldisorders
Now facingconsequences
Explosively increasing function orCatastrophe function
dtdy
ay y ∝ eat=Post-WWII period
IndustrialRevolution
Point of no return
Emergence of Homo sapiens(about 500 thousand years ago)
Fig. 1. Population increase, energy consumption increase, and Earth’senvironment
2.5
2
1.5
1
0.5
01970 1980
Year
1990 2000
OECD countries
Electricity
GDP
Energy
9
8
7
6
5
4
3
1
2
01970 1980
Year
1990 2000
Other than OECD
Electricity
GDP
Energy
Source : Mohan Munasinghe – World Energy Council Journal (Dec 1991) www.oecdtokyo.org
Developed Countries Developing Countries
Consistency exists between economic expansion and electricity demand growth
Electricity demand growth
raises total energy demand
Fig. 3. Relationship between GDP growth and increase in total energyor electricity consumption

at least 1 kW per capita. Let us take as a standard unitthe situation of Japan, which has the world’s thirdlargest total electricity capacity of 250 GW (a little morethan one third of which is generated from 55 nuclearpower plants). If there is to be 1 kW per capita for thecurrent world population of 6.6 billion, and if we dividethat total by the Japan unit of 250 GW, the world wouldhave about 26 zones equivalent to Japan, which has theworld’s second largest GDP. Indeed the populationproblem will continue to be one of the gravest problemsthat humanity faces in the future.
From the standpoint of energy, although there is astrongly rooted idea that distributed generation andconsumption of electricity may change the picture inthe future, megalopolitan areas of more than one mil-lion people are rapidly proliferating through the world,as shown in Fig. 5, and it is clear that urban areas willcontinue to develop more and more intensively, as inJapan where the three largest metropolitan areas ofTokyo, Osaka and Nagoya have now (as of 2007) cometo include more than 50% of the total population (18).Thus the reality is that if the combination of enormouspower generation, enormous power transmission andenormous power consumption cannot be maintained, itwill be impossible to sustain civilization as we know it. Asfor distributed electricity generation, wind turbines gen-erated a grand total of 74 GW in 2006 (equivalent toabout seventy-four 1 GW nuclear power plants) (19), andphotovoltaic generation amounted to 3.7 GW in 2005(equivalent to about three point seven 1 GW nuclearpower plants) (20), and these sources are steadily grow-ing. However, distributed use will not be the ultimatesolution for human energy use, as in all likelihood dis-tributed use will remain limited to first-stage use of newenergy resources, or complementary use.
The major sources of energy are the fossilfuels–petroleum, natural gas, and coal–and the non-fos-sil fuel, uranium. Figure 6 shows the current reserves ofthose fuels (21). Coal stands out with a reserve/produc-tion ratio of more than 200 years, and it is vital to recog-
nize that the others, with reserve/production ratios ofjust 40 to 60 years, are transient resources. It is also vitalto recognize that the reserve/production calculationsrely mainly on the population-related denominator, soeven if the numerators of the ratios improve there is notheoretical basis for a meaningful major expansion ofreserves. [See the Author’s Note II after Section 7“Conclusion.”]
We live now in the era of a shift from metallic tonon-metallic infrastructure components, as shown inFig. 7 (3). (The figure does not include the replacementof iron and steel structures by carbon-fiber reinforce-ment plastics (62).) In electronics, vacuum tubes (metalelectrodes) have been replaced by silicon-based semi-conductors; in telecommunications, copper wire isbeing replaced with glass-based optical fiber; and in
16 · “GENESIS Project” and High-Temperature Superconducting (HTS) DC Cable –Keen Use of Ultimately Sustainable New Energies–
Asia & Pacific29.7%
Latin America2.2%
Latin America6.5%
Latin America4.6%
Latin America9.1%
North America26.2%
Former Soviet Union23.4%
Former Soviet Union30.2%
Former Soviet Union36.2%
Former Soviet Union6.2%
Africa7.3%
Africa7.2%
Africa17.9%
Africa & Middle East5.8%
North America17.9%Middle East
36.1%
Middle East65.3%
North America4.9%
North America6.1%
Asia & Pacific7.9%
Asia & Pacific4.2%
Europe1.8%
Europe12.7%
Europe3.8%
Europe3.1%
Asia & Pacific23.8%
Coal
Uranium
Oil
NaturalGas
(As of end of 2001) (As of end of 2001)
(As of end of 2001) (As of January 2001)
(Source: “OECD/NEA,IAEA” , “BP Statistics”)
1.5 trillion barrelsReserve-production Ratio in Years: 40.3
984.5 million tonsReserve-production Ratio in Years: 216
155 trillion m3Reserve-production Ratio in Years: 61.9
4.39 million tonsReserve-production Ratio in Years: 61
1800
2 3 35
220(Year 1999)
1850 1900 1950 2000 2050
400
1000
(Year)
1000
450
400
350
300
250
200
150
100
50
0
Num
ber
of m
egal
opol
ises
(Paris) (Present)
Many megalopolises in developing countries
12
Advanced country capitals,
NY, Chicago and Osaka
London andEdo (former
name of Tokyo)
Including 6 Japanese
megalopolises
* Is decentralization of population & city functions possible?
* Is distributed power generation effective? (Necessary but not sufficient.)
Fig. 5. Number of megalopolitan areas (over 1 million people) in past,present and future (1800-2050)
Fig. 6. World energy resource reserves
Present Near Future Long TermProspect
*Ubiquitous*Safety (*Comfortable)
(*Biotechnology)
Ele
ctro
nics Ene
rgy
Wide-band-gapSemiconductor
(SiC, GaN)
Al
Ceramics(HTS)Glass
Carbon (CNT)
Overhead Line AutomotiveWiring Harness
Automotive Wiring Harness
Overhead Line
Electronic Wire
Optical Device
Optical Fiber
Conductor, Wiring Harness
ADSL
MRI / NMR
Transformer
Sumi-Altough
Energy
Energy
Energy
Communications
Separation
Communications
Communications
HTS
Conductivity
CNT Al Cu
Cu
Weight
TensileStrength
Temperature
MeritFigure
∞ (200)
0.9
1
-196˚C
200
0.5 ~ 10
0.2
200
Normal
2.5 ~ 50
0.6
0.3
1
Normal
2
1
1
1
Normal
1
Non-metal · Reduction· Reuse· Recycle
3R
· Safety· Security· Stability· Sustainability
4S
Laser
PLC
HTS AC/DC Cable
Motor
Si (
Sili
con)
Sem
icon
duct
or
Sumitomo Electric
Mat
eria
ls fo
r In
fras
truc
ture
s(4
00-y
ear
hist
ory)
*Energy Saving*Resources
Conservation (Lightweight &
Compact)*Environment
Fig. 7. Change and progression from metals to non-metals

electricity transmission, ceramics-based high-tempera-ture superconductors (HTS) are emerging as a replace-ment for copper cable (24)-(27). Also in motors, one of thelargest categories of electrical energy use, there is atrend away from copper wire and toward ceramic HTSwire (28). The shift to non-metallic components indeedseems inevitable in the energy-related field as well.
Copper is actually still used in large quantities as themainstay of electricity transmission and motors. Theelectricity infrastructures of the 30 developed nations inthe OECD are made up chiefly of copper, yet if heavilypopulated developing nations including BRICs continueto rely chiefly on copper materials for their infrastruc-ture expansion, copper reserves will eventually beexhausted. Furthermore, before the point of exhaustionis reached, easily accessible copper deposits will bemined out, forcing the development of new mines withmore serious environmental impacts. Thus over the longterm, weaning the electricity infrastructure from itsmainstay material of copper, or in other words makingelectricity infrastructure non-metallic, will become moreand more important. Already the remarkable pace ofdevelopment in China alone has created such anunprecedented surge in copper consumption that steepjumps in the price of copper are becoming the norm (29).
3. Increasing Energy Consumption andEnvironmental Problems
The rapid increase in global population and energyconsumption since the Industrial Revolution was notedin the previous section. Figure 8 shows the trend ofemissions of carbon dioxide (CO2), which is one ofgreenhouse gases, discharged into the atmosphere forthe past 200 years (21). The increase in CO2 emissionsnaturally corresponds to the growth of energy consump-tion seen in Fig. 2. CO2 emissions notably increasedsince 1945, as the explosively increasing function in Fig.1 has pushed it past the point of no return. Currently,global CO2 emissions amount to approximately 6 billiontons of carbon (C) equivalent per year, about half ofwhich is reduced to oxygen (O2) through solar-driven
photosynthesis, while the other half or so remain in theatmosphere, causing an ever greater accumulation (21).As a result, environmental change is occurring on aglobal scale (31) and according to the Fourth AssessmentReport of the Intergovernmental Panel on ClimateChange (IPCC) released in 2007, there is a strong possi-bility that the global environment will dramatically dete-riorate during this century (30). Figure 9 is a newspaperarticle presenting one possible scenario of environmen-tal deterioration (31).
Figure 10 shows the CO2 emissions for the varioustypes of electricity generation that serve mainly to sup-port technically advanced civilization (about one thirdof CO2 emissions in the OECD countries is from elec-tricity generation) (21). The levels of CO2 emissions fromthe coal, crude oil and liquefied natural gas (LNG)-
SEI TECHNICAL REVIEW · NUMBER 66 · APRIL 2008 · 17
7,000
6,000
5,000
4,000
3,000
2,000
1,000
1800 1820 1840 1860 1880 1900 1920 1940 1960 1980 20000
(C-Mton)
World War Ι
World Financial Crisis
Disintegration of USSR
World War ΙΙ
First Oil Crisis
Second Oil CrisisGas
Gasflaring & Cement Production
Oil
Coal
(Year)
Fig. 8. Changes in CO2 emissions in past 200 years
Fig. 9. Newspaper article on dangers posed to living creatures shouldglobal warming continue
0
Solar
FuelFacilities & OperationHydro
Geothermal
Wind
CO2 Emissions [g-CO2/kWh]
Nuclear (PWR)
Nuclear (BWR)
LNG-combined
LNG Steam
Oil-fired
Coal-fired
200 400 600 800 1,000 1,200
53.4
11.3
15
29.5
35.3
28.4407.5 111.3
37.8
88.4886.8
704.3
129.6478
(Source: OHM Nov. 2004 Issue)
Fig. 10. Comparison of CO2 emissions among various electric powergeneration technologies
Nihon Keizai Shimbun (July 22 ,2007)

fueled thermal power station systems that provide thebulk of current power generation are overwhelminglyhigher than the levels from the solar derived “new ener-gy resources” or nuclear power generation. Therefore,in order to alleviate CO2 and other greenhouse gasemissions, which is the crucial issue for this century, itwill be necessary to make a shift as quickly as possiblefrom fossil fuels (coal, crude oil and LNG) to new ener-gy resources including nuclear power.
Under the Kyoto Protocol which came into force onFebruary 16, 2005, Japan is committed to reduce green-house gas emissions from 2008 through 2012 to an aver-age of 6% below the 1990 level, and toward that end thegovernment of Japan has prepared a plan to decreasedomestic CO2 generation by 0.5% (21). It includes a set ofvoluntary restraints for power companies designed torealize a 20% unit reduction of CO2 emissions (from425 to 340 g per kW hour), which is expected to beachieved mostly through construction of new nuclearpower plants and improvement of nuclear power plantutilization rates (21) (see Table 1). The government’sbasic policy for reducing CO2 emissions is the encour-agement of nuclear power (32), (33). There is a worldwidemovement for the resurgence of nuclear power, includ-ing the US plan to build more than 30 new plants (34), andreported plans for building between 100 (34) and 200 (35)
new plants in other countries, especially in China andIndia. However, considering the uranium reserve/pro-duction ratio in Fig. 6 (less than 60 years), even thoughthe necessity of nuclear power at the present time has tobe respected, the question of whether or not a policy ofurgently expanding nuclear power could provide a realsolution to problems of energy, resources and the envi-ronment must be answered in the negative (see the next
section).The problems of population growth and environ-
mental degradation are worsening the world food situa-tion. In the 1980s the global grain inventory was morethan 35% of the consumption level, but in 2005 it hadfallen to 17.7% (23). In recent years global warming hasled to persistent drought conditions in the grain belts ofthe US, Australia, southwest Europe and northwestChina, and harvest levels are declining. Water resourcesare also under pressure, as demand for water increasedduring the “oil century” (the 1900s) by a factor of six,twice the rate of population growth (36), (37). There aresome 60 countries, mainly in Asia and Africa, that haveless than the human survival requirement of 50 liters ofwater per day per capita (37), while the IPCC predicts thatas global warming progresses, there will be two extremeregions of drought regions and large-scale floodingregions. Some oil-producing countries have drawn upplans for utilization of new energy resources and large-scale seawater desalination (38), (39).
Meanwhile, as a means to reduce CO2 emissions,there is rapidly increasing production of biomass fuelssourced mainly from grains such as corn (40), and this isconsidered likely to have the negative effects of reduc-ing food inventories and increasing the demands foragricultural water (40), (64).
4. The Role and Problems of Nuclear Power
Table 2 shows the number of currently operatingnuclear power plants in the ten countries with the largestnuclear power outputs, and the total number of opera-tional plants (429) (33). The US has the highest numberwith 103 plants providing 20% of total power generation,
18 · “GENESIS Project” and High-Temperature Superconducting (HTS) DC Cable –Keen Use of Ultimately Sustainable New Energies–
Table 1. Self-imposed CO2 emissions reduction target of Japan’s powergeneration industry
CO2 Emissions in Power Generation Industry
Electricity Growth Rate and CO2 Emissions
Self-Imposed Reduction Target
(1) Newly Installed Nuclear Power Stations
(2) Increase of Coefficient of Utilization of All Nuclear Power Stations
(3) Increase of Efficiency of Thermal Power Stations
(4) Adoption of Kyoto Mechanism
2002
20% Reduction in unit power generation 425 g-CO2/kWh in 1990
340 g-CO2/kWh in 2010
Electricity growth rate: 37% (from1990 to 2010)CO2 Emissions: 1.37 × 0.8 = 1.096(CO2 Emissions increase by 10%)
5 stations ×3%/station =15%(7-8 M ton-CO2 reduction/station/year)
3% increase for each of 53 stations3%
1%
1%(Equivalent to reduction of 3.8 M ton-CO2/year)
350 M ton-CO2/year (27%)
2003 363 M ton-CO2/year (32.4%)
Mea
sure
s fo
r 20
% C
O2
Red
ucti
on
in U
nit
Pow
er G
ener
atio
n
Table 2. Present worldwide status of nuclear power stations
1
2
3
4
5
6
7
8
9
10
(Country)
429 units
Underoperation
Underconstruction
Underplanning
USA
France
Japan
Russia
Germany
South Korea
Canada
Ukraine
UK
Sweden
103
59
55
27
17
20
18
15
19
10
3
4
4
2
1
11
5
4
Nihon Keizai Shimbun, April 3, 2007
As of 2006In order of total output(Survey by JAIF)
(Unit)
Overall number of nuclear power plants now under operation

France with its national policy to encourage nuclearpower has 59 plants providing 78%, and Japan has 55plants providing 30% to 40%. In addition, China andIndia are surging rapidly into the field with plans for sev-eral tens of new plants each, and the number of plannednew plants worldwide exceeds 200 (35). Thus it is impossi-ble to consider the current world energy situation with-out taking account of nuclear power generation (41).
From the standpoint of CO2 emissions, nuclearpower is regarded as a clean energy source (see Fig. 10)and hence a trump card for the environment-conscious21st century, and the world is said to be seeing a renais-sance of nuclear power (41). However, from the stand-point of reserve/production ratio (see Fig. 6), uraniummust be classed as a transient resource (21) for whichinternational competition is fierce (35), and so the ques-tion of whether or not nuclear power can be the ulti-mate answer for energy supplies in this and future cen-turies must be answered in the negative.
Table 3 presents preliminary calculations of thepotential for using nuclear power to attain the per capi-ta energy supply level of 1 kW (the steppingstone todeveloped nation status attained by Japan in the 1970s,charted in Fig. 4), in China and in the world. In view ofthe uranium reserve/production ratio of roughly 60years for the existing 400-odd plants, projections ofsome 400 nuclear plants in China alone and some 6,000for the world as a whole cannot be regarded as feasibleno matter how the numbers are juggled. In other words,we must inevitably realize that nuclear power is a veryshort-term, transient resource. Furthermore, even with-
out bringing up the case of the Chernobyl disaster, vari-ous concerns about safety guarantees will have to beaddressed. Then there is the back-end policy for manag-ing radioactive waste, typically involving vitrification for50 to 100-year surveillance followed, if all goes well, bytransfer to deep underground storage for as long as tenthousand years, which forces serious consideration ofthe imbalance between the service life for the user gen-erations and the need for long-term management byfuture generations (42).
Another area that must be pointed out is the issuesof service life, maintenance and renovation of nuclearreactors. The design life of nuclear reactor, even in thecase of the 103 reactors in the US and the 55 in Japan,two of the leading nuclear-power countries, has been setat 30 to 40 years from the technical standpoint.Consequently most of the nuclear plants in the US,which entered the field first, have already reached theend of their design life, and most of the plants in Japanwill reach theirs between 2020 and 2030. At this time,neither the US nor Japan has any plan whatsoever inplace for reactor renovation, other than measures toextend service life. The US addressed the issue for thefirst time in 2000 with a decision to extend the life ofexisting plants by 20 years (43), and has since taken somesteps toward that end. Naturally any policies for exten-sion of service life should include serious and prudentinvestigations of the appropriate engineering standardsand procedures for surveying and testing equipmentthat was designed with 30 to 40-year-old technology, forassessing the potentials for repair and life extension andrenovation, and for the planning of subsequent techni-cal monitoring (see Fig. 11). An opinion survey con-ducted in Japan by the Japanese Cabinet Office and theMinistry of Economy, Trade and Industry in December2005 found that the majority of Japanese believe thereshould be “cautious encouragement of nuclear powerwhile addressing safety concerns” (44).
The Chuetsu offshore earthquake in NiigataPrefecture, Japan occurred on July 16, 2007, caused
SEI TECHNICAL REVIEW · NUMBER 66 · APRIL 2008 · 19
Table 3. Expected worldwide electric energy status in near future:Electricity demand in China and atomic power generation
Electricity industry ·=·1/3 of total CO2 emissions; Stepping stone to developed nation status = 1kW/capita
Population(in 2007) = 6.6 billion ; = 250 million kW ;
(6.6 billion × 1kW/capita) ÷ 250 million kW = 26.5
(6.6 billion × 1kW/capita) ÷ 900 million kW = 7.3
(6.6 billion × 1kW/capita) ÷ 1GW = 6,600GW/1GW = 6,600 plants
6,600 units × 0.35 = 2,310 plants (Presently ·=·400 plants)
622 million kW/1.3 billion = 0.48kW/capita(Japan: 2kW per capita) (USA: 3kW per capita)
1,300 × 0.35 = 455 plants(Presently 10 plants in China)
Present worldwide atomicpower generation = 385GW(USA: 103 plants ( ·=·1/4))
Power generation capacity of standard atomic power plant
Japan’s electricity
generation capacity
= 1M kW = 1GW
Global energy use when all nations are fully developed.(How many times that of Japan?)
Global energy use when all nations are fully developed. (How many times that of USA?)
Number of nuclear plants required for meeting all of electricity demand when all nations are fully developed.
Number of nuclear plants required for supplying 35% of electricity demand when all nations are fully developed.
Number of nuclear plants required for meeting all of electricity demand in fully developed China.
Number of nuclear plants required for supplying 35% of electricity demand in fully developed China.
Per capita electricity consumption in present China.
1.3 billion × 1kW/capita = 1,300GW 1,300 plants
Industrial product Life of n years
(Products should have markers for monitoring life spans) Renewal
End-of-life determination(Life expectancy)
Miner's LawDesign(Resistance to cyclic fatigue, etc.)
Materials
Arrenius’ equation
Who should be responsible?
Examination & determination(Combination of new & old)
Partial Renewal
Monitoring
Life extension
Life extension
Technologically immature
Industrial wastetreatment
(3R)
All
indu
stria
l pro
duct
sha
ve li
mite
d lif
e sp
ans
[Designers &manufacturers]
[Operation/maintenance/renewal persons]
Generation change
Generation change
Nuclear power station(Life: 30-40 years)
(Only present generations are benefited)
(Industry world & power companies)
Retain for10 thousand
years
Radioactivewastes
Almost all of 55 nuclear power units in Japan reach end
of life by 2020Negative legacy
for future generations
Renewal??(New)
Fig. 11. Life extension measures of nuclear power plants: Importanceof technology for determining life span of industrial products
about 50 aspects of damage (48) (up to 2900 aspectsaccording to another report (58)) to the Kashiwazaki-Kariwa Nuclear Power Plant, the world’s largest nucleargenerating station by net electrical power rating, includ-ing a leak of water containing traces of radioactive mate-rials from the No. 6 reactor. The overall performance ofthe plant during the earthquake, including routineautomatic shutdown of the four units in operation, wasregarded in some quarters as a demonstration thatnuclear plants in Japan actually have basically soundseismic resistance (49). Yet the quake also raised the fun-damental question of whether the Japanese archipelago,most of which is riven by active faults that cause numer-ous earthquakes, should have as many as 55 nuclearplants (50), (51), and heightened the controversy over theproposed national project to set a new world standardfor nuclear plants through joint public-private develop-ment of a next-generation ultra-large light-water reactorwith a power rating of 1.7 to 1.8 GW (52).
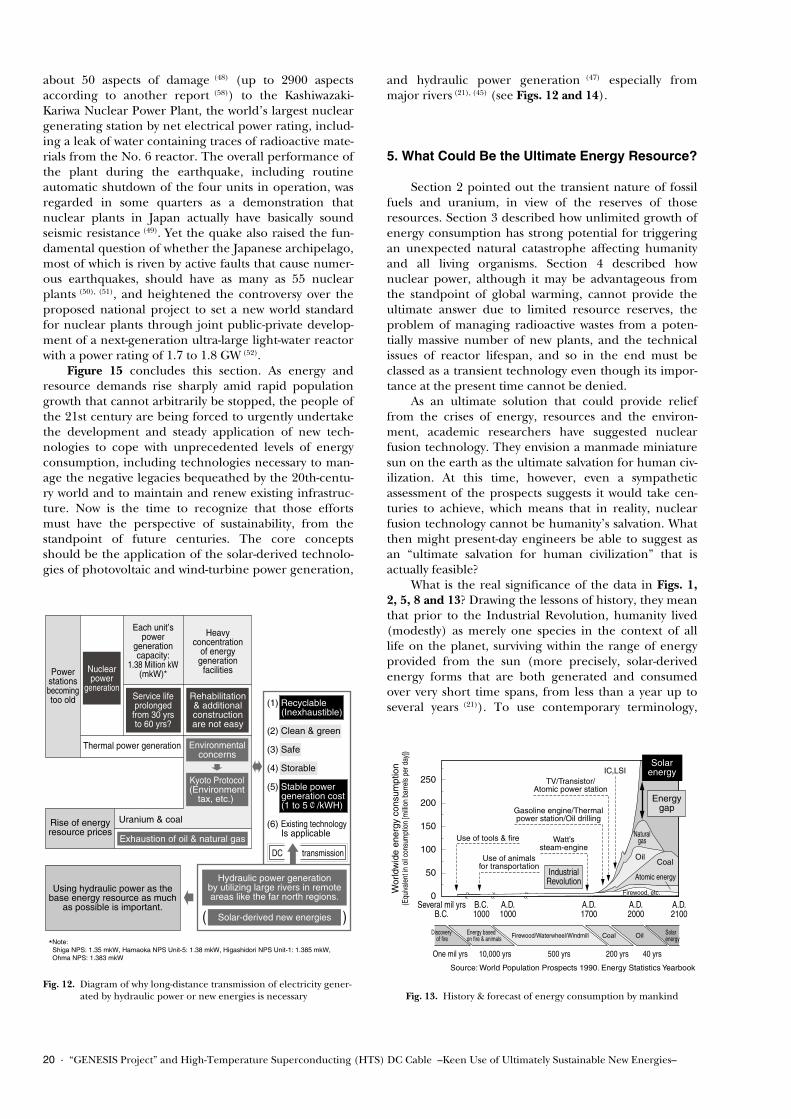
Figure 15 concludes this section. As energy andresource demands rise sharply amid rapid populationgrowth that cannot arbitrarily be stopped, the people ofthe 21st century are being forced to urgently undertakethe development and steady application of new tech-nologies to cope with unprecedented levels of energyconsumption, including technologies necessary to man-age the negative legacies bequeathed by the 20th-centu-ry world and to maintain and renew existing infrastruc-ture. Now is the time to recognize that those effortsmust have the perspective of sustainability, from thestandpoint of future centuries. The core conceptsshould be the application of the solar-derived technolo-gies of photovoltaic and wind-turbine power generation,
and hydraulic power generation (47) especially frommajor rivers (21), (45) (see Figs. 12 and 14).
5. What Could Be the Ultimate Energy Resource?
Section 2 pointed out the transient nature of fossilfuels and uranium, in view of the reserves of thoseresources. Section 3 described how unlimited growth ofenergy consumption has strong potential for triggeringan unexpected natural catastrophe affecting humanityand all living organisms. Section 4 described hownuclear power, although it may be advantageous fromthe standpoint of global warming, cannot provide theultimate answer due to limited resource reserves, theproblem of managing radioactive wastes from a poten-tially massive number of new plants, and the technicalissues of reactor lifespan, and so in the end must beclassed as a transient technology even though its impor-tance at the present time cannot be denied.
As an ultimate solution that could provide relieffrom the crises of energy, resources and the environ-ment, academic researchers have suggested nuclearfusion technology. They envision a manmade miniaturesun on the earth as the ultimate salvation for human civ-ilization. At this time, however, even a sympatheticassessment of the prospects suggests it would take cen-turies to achieve, which means that in reality, nuclearfusion technology cannot be humanity’s salvation. Whatthen might present-day engineers be able to suggest asan “ultimate salvation for human civilization” that isactually feasible?
What is the real significance of the data in Figs. 1,2, 5, 8 and 13? Drawing the lessons of history, they meanthat prior to the Industrial Revolution, humanity lived(modestly) as merely one species in the context of alllife on the planet, surviving within the range of energyprovided from the sun (more precisely, solar-derivedenergy forms that are both generated and consumedover very short time spans, from less than a year up toseveral years (21)). To use contemporary terminology,
20 · “GENESIS Project” and High-Temperature Superconducting (HTS) DC Cable –Keen Use of Ultimately Sustainable New Energies–
DC transmission
Powerstationsbecomingtoo old
Nuclearpower
generation
Thermal power generation
Uranium & coal
(1) Recyclable (Inexhaustible)
(2) Clean & green
(3) Safe
(4) Storable
(5) Stable power generation cost (1 to 5¢/kWH)
(6) Existing technology Is applicable
Exhaustion of oil & natural gas
Using hydraulic power as thebase energy resource as much
as possible is important.
Service lifeprolongedfrom 30 yrsto 60 yrs?
Environmentalconcerns
Kyoto Protocol(Environment
tax, etc.)
Rehabilitation& additionalconstructionare not easy
Rise of energyresource prices
Hydraulic power generationby utilizing large rivers in remoteareas like the far north regions.
Solar-derived new energies( )
*Note: Shiga NPS: 1.35 mkW, Hamaoka NPS Unit-5: 1.38 mkW, Higashidori NPS Unit-1: 1.385 mkW, Ohma NPS: 1.383 mkW
Heavyconcentration
of energygeneration
facilities
Each unit’spower
generationcapacity:
1.38 Million kW(mkW)*
Fig. 12. Diagram of why long-distance transmission of electricity gener-ated by hydraulic power or new energies is necessary
Several mil yrsB.C.
B.C.1000
One mil yrs 10,000 yrs 500 yrs 200 yrs 40 yrs
Source: World Population Prospects 1990. Energy Statistics Yearbook
A.D.1000
A.D.1700
A.D.2000
A.D.2100
250
200
150
100
50
0
Wor
ldw
ide
ener
gy c
onsu
mpt
ion
(Equ
ivale
nt in
oil c
onsu
mpt
ion
[milli
on b
arre
ls pe
r day
])
Discovery of fire Firewood/Waterwheel/WindmillEnergy based
on fire & animals OilCoal Solarenergy
Use of tools & fire
IndustrialRevolution
Solarenergy
Energygap
OilCoal
Naturalgas
Atomic energy
Firewood, etc.
IC,LSITV/Transistor/
Atomic power station
Gasoline engine/Thermalpower station/Oil drilling
Watt’ssteam-engine
Use of animalsfor transportation
Fig. 13. History & forecast of energy consumption by mankind

humanity survived over millions of years by relyingexclusively on energy and other resources that wererecyclable, sustainable, clean, and green (45). Rather thanproceeding to survey nuclear fusion technology, Fig. 14provides a simple outline of mechanisms that rely essen-tially on recyclable, sustainable, solar-derived “new ener-gy resources.” The sole doubt about these new energytechnologies is whether the necessary resources will beavailable in sufficient quantity, and Table 4 in the nextsection shows that in theory those resources are nearlyinexhaustible (5).
Figure 13 shows human energy consumptionthrough the past and into the future, from several mil-lion years ago up to 2100. We know now that the cur-rently exploited energy resources are being used up, asstated above, which indicates that on the whole we willinevitably be forced to utilize new types of solar-derivedenergy. We are also being forced to use new energyresources in order to avoid triggering an environmentalcatastrophe. It took an unimaginably long period (atleast two billion years) for the dynamics of solar energyto form the earth’s atmosphere through stabilizationand accumulation of CO2 and continuous generation of
O2 (see Fig. 16). Now that the equilibrium has beendestabilized in a relatively very short period by anthro-pogenic discharges of fossil fuel byproducts, it may takean extremely long time to recover, or it may even beirreversibly altered. In other words, we cannot avoidconsidering the possibility that humanity is rushing fulltilt toward a catastrophe (which could occur before cur-rent resources are exhausted) (21), (45). [See the Author’sNote II after Section 7 “Conclusion.”]
Photovoltaic power generation, one of the leadingnew energy resources, is growing by 150 percent (or 1.5times) each year, with a total installed capacity of 3.7GW at the end of 2005 (see Fig. 17), and the reason ithas not been generally adopted is that the generatingcost remains too high, at 46 yen per kW hour (46). This isa problem to be resolved by future eco-innovation (newtechnology to meet environmental challenges), as wellas by public policy decisions based on a future perspec-tive (see Section 6 and Figs. 15 and 32).
SEI TECHNICAL REVIEW · NUMBER 66 · APRIL 2008 · 21
Fossil fuels and uranium aretransitory resources
Solar energy
Photosynthesis overultra-long period
Fossil fuel resourcesdepleted over ultra-short
period of time
*Global warming
*No recovery over short period of time
CO2 fixation & O2 generation
Resources
Environm
ent
Fig. 16. Fixation of CO2 and generation of O2
Japan
Germany
USA
150
100
50
2001
10 thousand kW
(Source: Agency for Natural Resources and Energy)
Nihon Keizai Shimbun, July 6, 2007
02 03 04 050
Pho
tovo
ltaic
Pow
er
Year
Fig. 17. Total installed capacity of photovoltaic power generation
Sustainability
* Policy* Government
Support
R&D of New Technology
Environmental Issues
Decision Made From the
Standpoint of Future
Generations
Life of Infrastructure
Maintenance → Life Extensionor
Renewal
Nuclear Plant Electric Power
System
Life Expectancy
(30 to 40 years)
(1) Preservation of Engineers and Industries
(2) Countermeasures for Increasing Population and Energy Consumption
(3) Environmentally Friendly
Increasing CO2 Emissions→ Global Warming
Increase in Energy Demand
12
11
10
9
8
70
2002 2010 2020 2030
(10 Million Barrel/day)
(Year)~~
Oil
Increase in Population
120
100
80
60
40
20
01950 1970 1995 2025 2050 2100 2150
(Billion)
(Year)
Pop
ulat
ion
Fig. 15. Necessity of passing on technologies to future generations anddeveloping new technologies
Sufficient quantitySustainable
Clean and green
Impartial and universal
Solar-derived
Energies
(HTS DC cable)
Continuous volume increase is possible
Return to energy use status of pre-Industrial Revolution times while maintaining current civilization level
- Establishment of practically usable technologies- Must be simple, clean and green
New energies [Photovoltaic, wind turbine and hydraulic power]
GENESIS Project
<The only realistic proposal from present-day engineers>
ToFrom nuclear fusionMaking artificial
sun on EarthPrompt
implementation!
Fig. 14. Ultimate energies for future generations and Earth’s environment
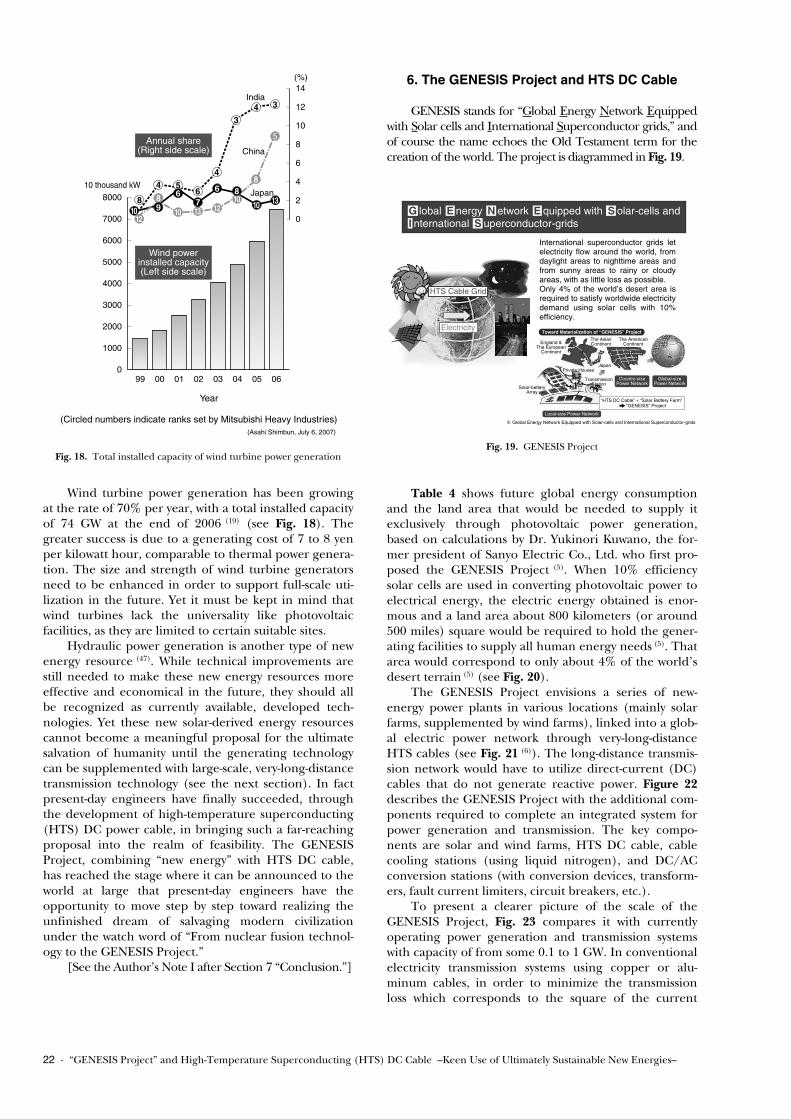
Wind turbine power generation has been growingat the rate of 70% per year, with a total installed capacityof 74 GW at the end of 2006 (19) (see Fig. 18). Thegreater success is due to a generating cost of 7 to 8 yenper kilowatt hour, comparable to thermal power genera-tion. The size and strength of wind turbine generatorsneed to be enhanced in order to support full-scale uti-lization in the future. Yet it must be kept in mind thatwind turbines lack the universality like photovoltaicfacilities, as they are limited to certain suitable sites.
Hydraulic power generation is another type of newenergy resource (47). While technical improvements arestill needed to make these new energy resources moreeffective and economical in the future, they should allbe recognized as currently available, developed tech-nologies. Yet these new solar-derived energy resourcescannot become a meaningful proposal for the ultimatesalvation of humanity until the generating technologycan be supplemented with large-scale, very-long-distancetransmission technology (see the next section). In factpresent-day engineers have finally succeeded, throughthe development of high-temperature superconducting(HTS) DC power cable, in bringing such a far-reachingproposal into the realm of feasibility. The GENESISProject, combining “new energy” with HTS DC cable,has reached the stage where it can be announced to theworld at large that present-day engineers have theopportunity to move step by step toward realizing theunfinished dream of salvaging modern civilizationunder the watch word of “From nuclear fusion technol-ogy to the GENESIS Project.”
[See the Author’s Note I after Section 7 “Conclusion.”]
6. The GENESIS Project and HTS DC Cable
GENESIS stands for “Global Energy Network Equippedwith Solar cells and International Superconductor grids,” andof course the name echoes the Old Testament term for thecreation of the world. The project is diagrammed in Fig. 19.
Table 4 shows future global energy consumptionand the land area that would be needed to supply itexclusively through photovoltaic power generation,based on calculations by Dr. Yukinori Kuwano, the for-mer president of Sanyo Electric Co., Ltd. who first pro-posed the GENESIS Project (5). When 10% efficiencysolar cells are used in converting photovoltaic power toelectrical energy, the electric energy obtained is enor-mous and a land area about 800 kilometers (or around500 miles) square would be required to hold the gener-ating facilities to supply all human energy needs (5). Thatarea would correspond to only about 4% of the world’sdesert terrain (5) (see Fig. 20).
The GENESIS Project envisions a series of new-energy power plants in various locations (mainly solarfarms, supplemented by wind farms), linked into a glob-al electric power network through very-long-distanceHTS cables (see Fig. 21 (6)). The long-distance transmis-sion network would have to utilize direct-current (DC)cables that do not generate reactive power. Figure 22describes the GENESIS Project with the additional com-ponents required to complete an integrated system forpower generation and transmission. The key compo-nents are solar and wind farms, HTS DC cable, cablecooling stations (using liquid nitrogen), and DC/ACconversion stations (with conversion devices, transform-ers, fault current limiters, circuit breakers, etc.).
To present a clearer picture of the scale of theGENESIS Project, Fig. 23 compares it with currentlyoperating power generation and transmission systemswith capacity of from some 0.1 to 1 GW. In conventionalelectricity transmission systems using copper or alu-minum cables, in order to minimize the transmissionloss which corresponds to the square of the current
22 · “GENESIS Project” and High-Temperature Superconducting (HTS) DC Cable –Keen Use of Ultimately Sustainable New Energies–
(Circled numbers indicate ranks set by Mitsubishi Heavy Industries)(Asahi Shimbun, July 6, 2007)
8000
7000
6000
5000
14(%)
12
10
8
6
4
2
0
4000
3000
2000
1000
99 00 01 02 03 04 05 060
10 thousand kW
Wind powerinstalled capacity(Left side scale)
Annual share(Right side scale) China
Japan
India
8
4 56
4
34 3
10 10
1013 12 10
12
89
67
6 813
8
5
Year
Fig. 18. Total installed capacity of wind turbine power generation
HTS Cable Grid
Electricity
International superconductor grids let electricity flow around the world, from daylight areas to nighttime areas and from sunny areas to rainy or cloudy areas, with as little loss as possible.Only 4% of the world’s desert area is required to satisfy worldwide electricity demand using solar cells with 10% efficiency.
England &The European
Continent
Solar-batteryArray
Private Houses
TransmissionStation
Japan
The AsianContinent
The AmericanContinent
Local-size Power Network
Country-sizePower Network
Global-sizePower Network
Toward Materialization of “GENESIS” Project
G lobal E nergy N etwork E quipped with S olar-cells and I nternational S uperconductor-grids
※ Global Energy Network Equipped with Solar-cells and International Superconductor-grids
“HTS DC Cable” + “Solar Battery Farm” “GENESIS” Project
Fig. 19. GENESIS Project
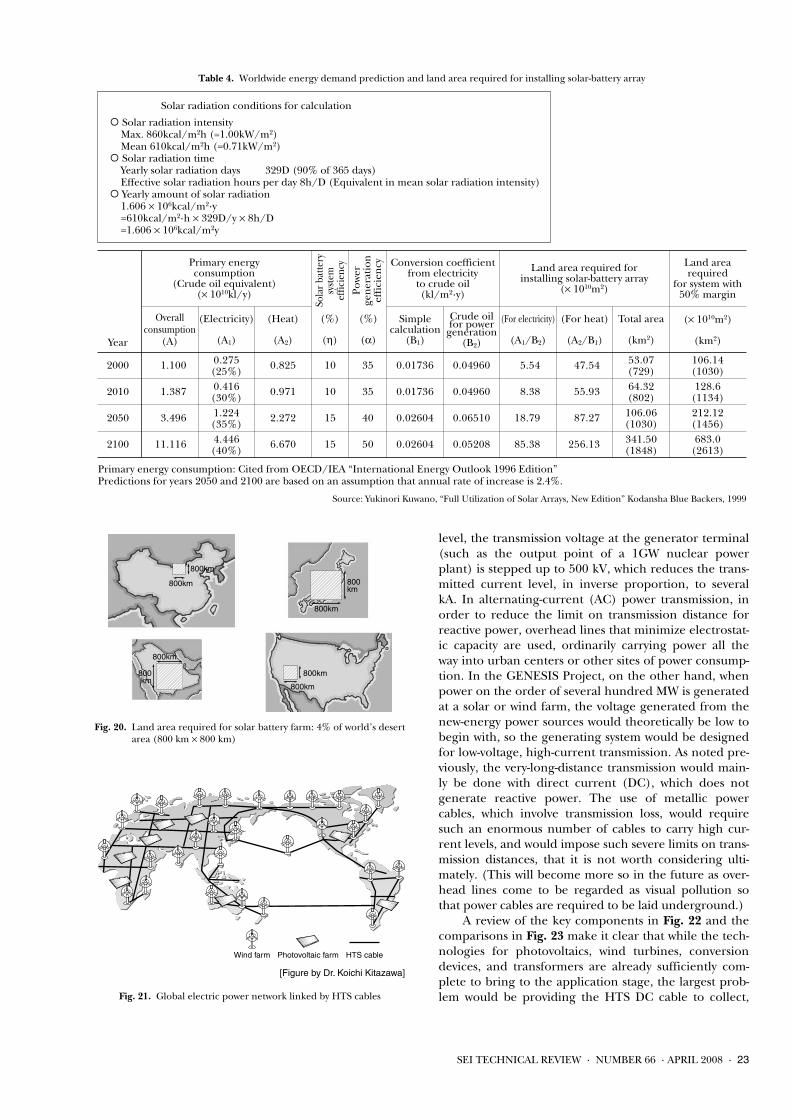
level, the transmission voltage at the generator terminal(such as the output point of a 1GW nuclear powerplant) is stepped up to 500 kV, which reduces the trans-mitted current level, in inverse proportion, to severalkA. In alternating-current (AC) power transmission, inorder to reduce the limit on transmission distance forreactive power, overhead lines that minimize electrostat-ic capacity are used, ordinarily carrying power all theway into urban centers or other sites of power consump-tion. In the GENESIS Project, on the other hand, whenpower on the order of several hundred MW is generatedat a solar or wind farm, the voltage generated from thenew-energy power sources would theoretically be low tobegin with, so the generating system would be designedfor low-voltage, high-current transmission. As noted pre-viously, the very-long-distance transmission would main-ly be done with direct current (DC), which does notgenerate reactive power. The use of metallic powercables, which involve transmission loss, would requiresuch an enormous number of cables to carry high cur-rent levels, and would impose such severe limits on trans-mission distances, that it is not worth considering ulti-mately. (This will become more so in the future as over-head lines come to be regarded as visual pollution sothat power cables are required to be laid underground.)
A review of the key components in Fig. 22 and thecomparisons in Fig. 23 make it clear that while the tech-nologies for photovoltaics, wind turbines, conversiondevices, and transformers are already sufficiently com-plete to bring to the application stage, the largest prob-lem would be providing the HTS DC cable to collect,
SEI TECHNICAL REVIEW · NUMBER 66 · APRIL 2008 · 23
Wind farm Photovoltaic farm HTS cable
[Figure by Dr. Koichi Kitazawa]
Fig. 21. Global electric power network linked by HTS cables
800km
800km
800km
800km
800km
800km
800km
800km
Fig. 20. Land area required for solar battery farm: 4% of world’s desertarea (800 km × 800 km)
Table 4. Worldwide energy demand prediction and land area required for installing solar-battery array
¡ Solar radiation intensity Max. 860kcal/m2h (=1.00kW/m2) Mean 610kcal/m2h (=0.71kW/m2)¡ Solar radiation time Yearly solar radiation days 329D (90% of 365 days) Effective solar radiation hours per day 8h/D (Equivalent in mean solar radiation intensity)¡ Yearly amount of solar radiation 1.606 × 10⁶kcal/m2·y =610kcal/m2·h × 329D/y × 8h/D =1.606 × 10⁶kcal/m2y
Solar radiation conditions for calculation
Land arearequired
for system with50% margin
Land area required forinstalling solar-battery array
(× 1010m2)
Conversion coefficientfrom electricity
to crude oil(kl/m2·y)
Primary energyconsumption
(Crude oil equivalent)(× 1010kl/y)
0.04960
0.04960
0.06510
0.05208
0.01736
0.01736
0.02604
0.02604
0.825
0.971
2.272
6.670
1.100
1.387
3.496
11.116
35
35
40
50
10
10
15
15
47.54
55.93
87.27
256.13
5.54
8.38
18.79
85.38
2000
2010
2050
2100
106.14(1030)128.6
(1134)212.12(1456)683.0
(2613)
53.07(729)64.32(802)106.06(1030)341.50(1848)
0.275(25%)0.416(30%)1.224(35%)4.446(40%)
(× 1010m2)
(km2)
Total area
(km2)
Crude oilfor power
generation(B2)
Simplecalculation
(B1)
(For heat)
(A2/B1)
(For electricity)
(A1/B2)
(Heat)
(A2)
(Electricity)
(A1)
Overallconsumption
(A)Year
Primary energy consumption: Cited from OECD/IEA “International Energy Outlook 1996 Edition” Predictions for years 2050 and 2100 are based on an assumption that annual rate of increase is 2.4%.
Pow
erge
ner
atio
nef
fici
ency
Sola
r ba
ttery
syst
emef
ficie
ncy
(%)
(α)
(%)
(η)
Source: Yukinori Kuwano, “Full Utilization of Solar Arrays, New Edition” Kodansha Blue Backers, 1999

transmit and distribute the power. This key component,which would be required in huge quantities, is neededto achieve the construction of the global power supplynetwork as shown in Fig. 21. Therefore, the develop-ment of HTS DC cable made using ceramic materialscan open the way to realization of the GENESIS Project(and also avoid the difficulty of obtaining large suppliesof copper, which is a vanishing resource). [See theAuthor’s Note II after Section 7 “Conclusion.”]
Since the discovery of the high-temperature super-conducting phenomenon in 1986, Sumitomo Electrichas undertaken continuous research and developmentof HTS wire. The results have included the developmentof the controlled-over-pressure (CT-OP) method of sin-tering, and commercialization of a first generation ofhigh-performance bismuth-based HTS wire (marketedas DI-BSCCO) (53). Figure 24 shows the construction of 3-core HTS AC cable that Sumitomo Electric developedusing these DI-BSCCO wires (54). That cable was installedas an actual commercial line in Albany, the capital cityof the State of New York, and has been supplying powerto about 70,000 households since July 2006 in the
world’s first practical demonstration of HTS cable (27), (54)
(see Fig. 25). The insulation design of HTS DC cable issimpler to achieve than that of HTS AC cable (55). Thesuccess of the Albany HTS AC cable demonstration pro-ject proves for the first time that the GENESIS Project istechnically feasible, giving us full confidence that it canbe realized. (The DC cable with DI-BSCCO conductorsmanufactured by Sumitomo Electric was used in theworld’s first DC current application test performed in2006 at Chubu University. The test used a Peltier lead tocontrol the heat invasion from a room-temperature cop-per conductor to an ultra-low-temperature HTS conduc-tor, and proved the HTS DC cable’s effectiveness (59)-(61).)
The advantages of HTS are brought out most fullyin its DC application. The main reasons are that, evenwith superconductivity, AC transmission inherentlyinvolves AC transmission loss, and also inductance dif-ferences between the individual HTS wires, due to theway the wire is wound, which cause differences in thecurrents distributed to multiple HTS wires. Figure 26
24 · “GENESIS Project” and High-Temperature Superconducting (HTS) DC Cable –Keen Use of Ultimately Sustainable New Energies–
500 to 1,000 kV
Wind Farm
Solar Farm
(1GW Nuclear Power Plant)
1,000 to 2,000 A
500 to 1,000kVOHL
HTS Cable (small loss and compact)
Substation(Voltage Increase)
S/S
Output Voltage Several100 V to Several kV
Submarine cable(1 kV x 1 Million A)
Conventional Nuclear Power Plant of 20th Century
Electricity of 1 GW is generated at a plant at sea side and transmitted over a long distance through high-voltage, low-current OHL.
Wind Farm & Solar Farm of 21st Century
Electricity of 1 GW is generated by 10 to100 units of generators located at offshore, desert or other remote areas.
Transmission over a long distance can be achieved through low-voltage high-current HTS DC cable.
Overhead Line (OHL)
Underground Transmission Cable
Conventional Cu or Al cables have large transmission loss and extremely large number of cables need to be installed
DC Cable(1kV x 1 Million A)
Fig. 23. 1-GW low-voltage, high-current transmission system using HTSDC cables for linking wind/solar farms
Secondarybattery
(Long-distance, low-voltage & large-capacity)HTS DC cables
(DC)
(DC)
(DC)
Solar farm[1]
Other groups ofsolar or wind farms
Existing AC network
Solarbattery (1)
Coolingstation (1)
Secondarybattery
Solarbattery (2)
Inverter/converterstationCooling
station (2)
Solar farm[n]
Wind farm[n]
Plurality of HTS DC cables
Multilateral power network
1
2
Over severalhundred thousand kw
Key points
*DC/AC inverter
*Voltage-up Transformer
*Fault current limiter
*Current control
(AC)
(AC)
(AC)
AC (or DC)network forconsumers
‥
‥
‥
‥
*Several to several ten kV
*Several ten thousand to several hundred thousand amperes
Fig. 22. GENESIS Project and HTS DC cables
PPLP insulation(high dielectric stress & small dielectric loss)Developed by Sumitomo Electric
Corrugated SUSpipe cryostat
(thermal insulation)High integrity
Former
Bi-2223 tape
Superconducting shield
ø136mm
0.5mm
ø39mm
Superconductor
Fig. 24. Three-cores-in-one-cryostat HTS cable (Cold dielectric, 100 m,114 MVA, 1000 A)
<Installation location>Albany City, NY, USANewly constructed route between two substations (Menands and Riverside) (Niagara-Mohawk’s actual route)<Specifications> Cable Type : 3 core configuration Cable Length : 350 m Voltage : 34.5 kV Current : 0.8 kArms Cable to joint : 320 m - 30 m<Schedule> BSCCO cable installation : 2005 YBCO 30-m cable installation : 2006
<Purpose> Demonstration of long-length HTS cable in actual route<Partners> IGC-SP / SEI / BOC / Niagara-Mohawk<Project cost> 26M$ including NYSERDA (6M$)and DOE(13M$)
HTS Cable 350 m
OH line
Coolingstation
Highway350m
Joint
Termination
34.5 kV 800 A; Termination-date: 2006
Fig. 25. Outline of Albany HTS cable project

shows that while the transmitted current is limited bythe heat generated during current-flow through HTSAC cable, with HTS DC cable that limitation is not at allpresent, so as much current as necessary can be carriedsimply by increasing the number of HTS wire. For exam-ple, using DI-BSCCO wire that is 4 mm wide and about0.23 mm thick (˜ 1 mm2) with a critical current (Ic) of200 A, it is possible to double the Ic to 400 A by meansof subcooling with liquid nitrogen (LiN2) (see Table 5).If liquid hydrogen (LiH2) could be used as the coolant,the Ic could be increased 5.7 fold to more than 1,000 A,enabling lossless transmission of 400 to 600 times thecurrent that copper wires can carry, over any distance.(Expanding on this concept, there is a team working onplans to place HTS DC cable inside liquid hydrogentransport pipes, to enable simultaneous delivery of twoimportant energy resources, liquid hydrogen and elec-tric power, to distant places in the 21st Century that ischaracterized as the “Century of Hydrogen” (63).)
Since HTS cable functions only at temperaturesbelow 77 K (-196˚C), no matter how strong the thermalinsulation properties of the cable could be furnished,heat from the open air will gradually penetrate it andincrease the temperature of the liquid nitrogen coolant.Consequently it will be necessary both to recool the liq-uid nitrogen and to reboost the coolant pressure atcooling stations at given intervals that will have to bebuilt. Figure 27 shows the distance between typical cool-ing stations that would be able to service both AC andDC cable, with HTS AC cable projected to require a sta-tion every 5 km, and HTS DC cable every 15 km (55). Theelectricity needs of the cooling stations would be tiny incomparison to the transmission capacity (0.001% oftransmission capacity per kilometer (14)), and each sta-
tion should be able to provide its own power preferablywith a combination of photovoltaic cells and secondarybatteries (see Fig. 22).
Table 6 is a comparison of conventional copperconductor cable, HTS AC cable and HTS DC cable interms of compactness (transmission capacity differen-tial), transmission loss, present value of the reduction intransmission loss (including CO2 emission right utiliza-tion), and total transmission line construction cost. HTScable is likely to be the cable of the future, and it isquite clear that it is HTS DC cable that will providesuperior performance. Figure 28 shows an example of aGENESIS Project system for installing six 1.5 kV/12 kAHTS DC cables for a transmission capacity of 100 MW.
One key component for the project (shown in Fig.22), the electric conversion devices (inverters and con-
SEI TECHNICAL REVIEW · NUMBER 66 · APRIL 2008 · 25
Transmissionvoltage
66 - 77 kVrms(Conventional level)
130 kV (O-P)(Design value derived frompolarity reversal properties)
27 kA / 3 cores(200A×50 wires/core×3 cores×0.9)
·3-cores-in-one-cryostat type·HTS wires: (Conductor) About 50 wires/core (Shield) About 50 wires/core·Ic of HTS wire: 200 A·Insulation thickness: 6 mm
HTS DC CableHTS AC Cable
Structure
Current capacity(Margin: 10%)
3 kArms
0
15,000
10,000
5,000
01 2 3 4 5 6
Total loss(W/m)D
ista
nce
betw
een
cool
ing
stat
ions
Feasible value forHTS DC cable
Target value forHTS AC cable
ø150mm duct∆T : Below 10K∆P : Below 1MPa
About350 MVA
Transmission capacity
About3,500 MVA10 times
(m)
Fig. 27. Transmission capacity of HTS cable
Table 6. Economical evaluation of HTS cable
800600400200
015
10
5
0100
755025
-250
ACConventional Cable
(275kV Single Phase)
Reduction of Loss
Tunnel Cost
Cable
Loss ReductionCO2 Emission
InstallationDuct
HTS Cable800 600
340
150230
150
Tunnel
2,100
ModelCapacity: 1,500MVA
TransmissionLoss
(kW/km)
Loss Reduction(conv. to Initial Cost)
& CO2 Emission(M$/km)
Installation Cost(M$/km)
HTS Cable (66kV 3-in-One)
HTS Cable (DC130kV 3-in-One)
DC
150
Duct
HTS Cable
Loss ReductionCO2 Emission
Troughing
ConventionalCable
150
COCO2 Emission (100$/t-C) Emission (100$/t-C)CO2 Emission (100$/t-C)
<CO2 Reduction> <778 ton-C/km/year> <210 ton-C/km/year> <21 ton-C/km/year>
1/2
1/4
1/4
1/10
ConditionIc of Wire: 200APrice of Wire: 20$/mCOP: 0.1Power Cost: 0.1$/kWhLoad Factor: 1.0Tunnel Cost: 70k$/m
HTS <AC> Cable
Hea
t
+
(A)
(B)*
*
*
*
Current has LimitCoolingDistance: ShortCryogenic Refrigeration System: LargeCooling Loss: Large
(C)
AC Current
Cooling Limit
HTS <DC> Cable
Hea
t
+
(A)=(C)
(B)
*
*
*
*
Current has No Limit→Compact CableCoolingDistance: LongCryogenic Refrigeration System: SmallCooling Loss: SmallDC Current
Cooling Limit
Cryostat
Dielectric+
Liq-N2
HTS Conductor
Heat Invasion (A)
AC Joule Heat (B)
Total Heat (C)
Heat Invasion (A)
(DC Joule Heat=)0
Total Heat=Heat Invasion (C)
Fig. 26. Advantages of HTS DC cable over HTS AC cable
Table 5. Increase of critical current (Ic) of DI-BSCCO with differentcoolants
Liquid hydrogen (LH2) 20 1,140 (α=5.7)
400 (α=2.0)
200 (α=1.0)
Ic of DI-BSCCO (A)Coolant Temp. (K)
Liquid nitrogen (LN2) 77
Liquid nitrogen (Subcooled) (LN2) 65
Liquid helium (LHe) 4 1,400 (α=7.0)

verters), would have to be made more loss-resistant inorder to transmit very large currents. The practical con-version devices at this time are silicon-based semicon-ductors. However, intensive development work is nowunder way on wide-band-gap semiconductors, and if asilicon-carbide (SiC) power semiconductor devicebecomes available, its on-resistance at normal tempera-tures would shrink at least by one hundredth comparedwith silicon-based semiconductors (21) (see Fig. 29). Inaddition, as shown in the graph in Fig. 29, the use of sili-con carbide device for HTS cables can be expected tosharply reduce on-resistance at negative temperaturesobtained preferably by liquid nitrogen (LiN2) coolant,
26 · “GENESIS Project” and High-Temperature Superconducting (HTS) DC Cable –Keen Use of Ultimately Sustainable New Energies–
HTS DC cable (1,500 V DC)
DC/DCconverter
Solar farm
Solar batteryunit of several
hundred kW class
DC/DCconverter
Solar farm
Solar batteryunit of several
hundred kW class
Total space: About 2,750 m × 500 m
Inner cryostat pipe
Outer cryostat pipeAnti-corrosionjacket
Li N2
circulation90ø
Former
Cable core
HTSconductor
PPLPinsulation
HTS shielding& Protection layer
Thermal insulation
HTS DC Cable System
Solar Farm
(3-cores-in-one-cryostat type, monopolar, 1,500 V to12 kA) × 6 cables
Fig. 28. 100-MW-class GENESIS System with HTS DC cable
-270 -200 -40
Operational temperature
150 300 ˚C0
Loss generationis minimized
On-
resi
stan
ce
Rec
ipro
cal n
umbe
rof
ele
ctro
n m
obili
ty
Mol
ecul
ar m
ovem
ent,
etc.
Opt
imal
te
mp.
Large current converter with low loss
Use of SiCconverter cooled
by LiN2
Easy removalof heat due to
conversion loss
Range of use
[HTS]
(Solar batteries)
Conversionsystem
Inverter
Existing AC network
Consumptionarea
Solarfarm
Solarfarm (1)
Solarfarm (2)
PPLP SolidDC cable
Submarine cable
interconnection
Solarfarm (3)
Solarfarm (4)
(Cu cable)
(Si)
Battery
Battery
Inverter
Solarfarm
Battery
Step I Step II
(Local) (Local: Domestic) Within individual power company’sservice territory: Domestic
Multinational: International interconnection
In practice Partially in pracitce (until 2020) (From 2010 to 2050 and onwards) (From 2020 to 2050 and onwards)
Step III Step IV
Consumptionarea
Existing AC network
HTS DC cable interconnection
Solarfarm
Solarfarm
HTS DC cable interconnection
(*1) Battery can be omitted when network has sufficient power storage capability.
*Small to large solar/wind farms
*HTS DC cable network (Ultra-long-distance, large-power transmission with low loss) →Establishment of “global power grid”
*SiC low-loss converter
*International interconnection of electric power
*PPLP Solid DC submarine cable (Ultra-long international interconnection)
[*No battery is needed in principle]
*Individual houses
*Small-scale communities
*Battery & converter
*Autonomous consumption
*Small solar/wind farms
*Connection to existing grid
*Small to medium-sized battery & conversion system
*Cu cable & Si-based converter
*Sale of generated power
*Small to large solar/wind farms
*Connection to existing AC network & network between farms
*Middle to large-scale battery(*1) & converter
*Cu cable + HTS DC cable As many SiC converters as
possible can be applied
*Sale of power is dominant
Fig. 30. Step-by-step development of “GENESIS Project”
From WaterCooling to AirCooling
Inverter/ConverterEquipment
(B-to-B, SVC)
3 times
Attained Status* for SBD;
Others for pn
Application Effect
Transistor (SiC/Si)
High Temp.Operation
3 times (350˚C)
High SpeedSwitching
Low Loss
High ElectricalStrength
10 times
1/100
10 times
Compact & HighSpeed
Compact & HighEfficiency
Reduction ofSeries Devices
10 times
1/420
2.5 times
(29-130 ns)
(23 mΩcm2)*
(19.5 kV)
Fig. 29. Use of SiC converter at very-low temperature

and to simplify the elimination of generated conversionloss. The concept of combining the use of silicon car-bide-based conversion devices at very low temperaturewith liquid nitrogen cooled HTS DC cable offers apotential foundation for significantly advancing the effi-cient implementation of the GENESIS Project.
Ideas for the specific development of the GENESISProject are explored in references 4, 5, 6 and 14. Here,in Fig. 30, a phased development scheme consisting offour steps is presented. Step I and Step II are alreadythe subjects of development programs in various partsof the world. Step III is quite easy to envision, as thepower generated by each solar or wind farm can imme-diately be connected to the existing regional grid, withsuitable arrangements for prioritizing local consump-tion and passing surplus power along to neighboringareas. In Step IV–the final phase of realizing the globalsuperconducting power network portrayed in Fig.21–full international linkage would be established bymeans of submarine cables, and rather than HTS cable,the undersea portions would probably utilize PPLPSolid DC cable with copper conductor (45), (56). TheBakun Project for transmitting 2 GW of electricity acrossthe South China Sea for 680 km from Sarawak on theisland of Borneo to the Malay Peninsula (both inMalaysia) is now under way (see Fig. 31) (45), (56), and infuture this submarine DC cable technology in that pro-ject is likely to become associated with the GENESISProject.
In terms of other promising technologies for GEN-ESIS Project, there would be special HTS DC cablewhich partially includes the second-generation YBCO(or HoBCO) wires at both ends of the cable line wherefault currents can be eliminated by HTS cable itself, inother words, HTS cable with the function of fault cur-rent limiter (FCL) (57). Also under investigation are inno-vative approaches to utilize the extensive length of theHTS DC cable to increase its inductance (L), which isproportionate to a cable length or a line distance, and,
through the application of ultra large currents (I), toadd an electricity storage function (W =
2–1 LI2) to the
cable (60), (61), either of which would be an eagerly await-ed dream technology for making the HTS DC cable-based GENESIS Project more practicable.
7. Conclusions
The 21st century will be “the century of energy,resources and environment”. Amid rapid increases ofpopulation and energy consumption, we will have tomake the fullest efforts to preserve our energy,resources and environment while clearing up the nega-tive legacies of the 20th century, and work to spreadstrong consideration for the welfare of all life includingfuture human generations. Given that populationgrowth is inevitable, we must make comprehensive plansfor development of new technologies, inspired by newideas, for the preservation of energy, resources and envi-ronment, and act forcefully to implement them.Moreover, in view of the exponential advance of energyconsumption and environmental degradation, we haveno more important duty than to introduce new systemsbased on those new technologies into human societysufficiently before it reaches the point of no return, andbring those systems to maturity. If we survey the futurewith the wisdom oriented by the lessons of history, it isclear that rather than nuclear fusion, the “GENESISProject plus extra something”, combining HTS DCcable as well as PPLP Solid DC cable with new solar-derived energy resources (photovoltaic, wind andhydraulic power), is indeed the only feasible solution(see Fig. 32). Viewed from the standpoint of the present(looking outward from our current situation or “In-Out”), the GENESIS Project may appear to be just anidea which faces very high hurdles. However, viewedfrom the standpoint of the future (looking back at ourcurrent situation or “Out-In” ), it can be seen clearly asan inevitable reality.
Finally, the essence of this entire paper is encapsulat-ed in Fig. 33. Now is the time for each of us to reflect onthe true meaning of sustainability, in addition, for us to
SEI TECHNICAL REVIEW · NUMBER 66 · APRIL 2008 · 27
Policy and mechanism
Sun
PPLP Solid DC cable
HTS DC cable
(Necessary to achieve “Wisdom of mankind”)
(Should be judged based not on present but on future!)
All necessary amount of energy can be obtained from the Sun!
Hydraulic powerSolar battery(Photovoltaic power)
Wind power
GENESISProject
New energy
Advancedinnovativetechnology
Political decision
Sustainable!
* Clean
* Green
* Inexhaustible
* Equitable (No conflict)
Fig. 32. Challenge for sustainable energy system
(Bakun Project)
THAILAND
MY
AN
MA
R
LA
OP
DR V
IET
NA
M
COMBODIA
MALAYSIA
I ND
ON
ES
I A
I N D O N E S I A
BRUNEI
SINGAPORE
680km
(South China Sea)Sarawak
(Kalimantan)
PH
IL
IP
PI
NE
S
MALAYSIA
OHL Between B·H·P·P and TG. DATU; 660 km 2 bipoles (4 cables)
2,400 MWSPC (Sime Darby, etc.)
DescriptionsItemsCustomer
Hydraulic power
Submarinecable
Construction period 2010 to 2013 & 2015Estimated
construction cost 3.5 to 4B$
Tran
smis
sion
cabl
e Between TG. DATU and TG. SEDILI; 680km ;2 PPLP Solid Cables±500kV 1×2,000mm2
1,000MW/cableTotal transmission power: 2GW
Fig. 31. ASEAN Power Grid and Bakun Project

ask to all people what inevitable scenario we should envi-sion, and to endeavor to do our best to work steadily alongthat scenario, under the firm conviction that can be led byour wisdom, vision, sense of mission, and courage, as webegin to act to open up our path to the future.
[ Note I ] Dr. Kenshi Matsuura, professor emeritusat Osaka University, prudently pointed out that usingsolar-derived new energies is the same thing as safelyand constantly utilizing the energy generated from thenuclear fusion reactions taking place in the sun.
[ Note II ] All fossil fuels that human beings arenow using are composed of carbon-related materialsthat have been accumulated for such a super-long timeas 4.6 billion years since the birth of this Planet Earth,essentially through solar-driven photosynthesis, in otherwords, carbon is fixed while oxygen is released. In ashort time, such solar-derived energy are scattered allover the glove widely and impartially and not so densely,so it is meaningless unless energy had accumulated andcondensed over a long period of time. Enormous ener-gy can be released today when the accumulated andcondensed fossil fuels are oxidized both in a large scaleand in a short time, while carbon-dioxide is emitted atthe same time.
To the contrary, in order to produce meaningfully suf-ficient energy from solar-derived new energy that is widely-scattered and sparse today, it is necessary that we collectand condense this energy by concentrating it into a smallvolume (or limited small spaces). This means that toobtain useful amount of energy, the integral of timeshould be replaced by the integral of space. Therefore, thekey technology today to make the best use of new energyshould be “electric power collection, transmission and dis-tribution” followed by “electric power condensation.”
Now it is in question whether or not the presentgeneration living after the Industrial Revolution andenjoying the highly civilized life by means of consuminglarge amounts of energy can accomplish the “switchfrom time to space” in terms of energy resources byachieving the development of innovative and advancedtechnologies within a very limited period of time.
References(1) R. Hata, “HTS Applications and GENESIS Program”, ISIS-16,
Philadelphia, U.S. (2007)(2) R. Hata, “High Temperature Superconducting (HTS) Cable and
“GENESIS” Project”, Milken’s Global Conference (2007)(3) Hata, “The Role of High-temperature Superconducting Technology
in ‘Energy, Resources and Environment for the 21st Century’ – TheGENESIS Project and HTS DC CABLE,” Special Lecture to theHokuriku Section Joint Convention of Institutes of ElectricalEngineering (September 2007)
28 · “GENESIS Project” and High-Temperature Superconducting (HTS) DC Cable –Keen Use of Ultimately Sustainable New Energies–
13
12
11
10
9
8
7
0
120
10080
60
40
20
0
2002
19501970 2025 2100
1995 2050 2150
2010 2020 2030
(10 mil barrel per day)
(0.1 billion)
(Year)
(Year)
Solarbattery
Rotatingmachine
Wind Water Bioplant
Thermalenergy
Maintain and develop “the Kyoto Protocol” & Return to using “Solar-derived energy”
[Sustainability]
Shortage
Oil
Population
Innovativetechnology
Nuclearfusion
Catastrophe Fall of humancivilization
CO2 & global warming
Current situation & coming crises New proposal
New energyLight
Sun
Electric power
HTS DC cable
Wide-band-gappower transistor
PPLP Solid DCSubmarine Cable
GENESIS Program
Over-consumption
Environment
Comparison
IndustrialRevolution
Presentday
Future
Life(Year)
Fossil fuel resources
GasOil CoalUranium
6241 21661
Adv
ance
d in
nova
tive
tech
nolo
gy
Living within the range of energy provided from the sun
New technologies for using solar-derived energy
Fossil fuel & uranium
Increase inpopulation
Increase inenergy resources
Fig. 33. Energy, resources and environment for 21st Century

(4) Kuwano, Kitazawa and Hata, “Special Symposium: Utilization ofEnergy on a Global Scale,” OHM, May 2004
(5) Kuwano, “Full Utilization of Solar Arrays, New Edition,”Kodansha Blue Backs, 1999
(6) Kitazawa, “A Technologist’s View of Japan and the EconomicDream,” Maruzen Adthree (2002)
(7) Y. Kuwano, “Global Energy Network Using Solar Cells –Solar cellssave the earth (GENESIS Project)-”, Tokyo, Japan (June 18, 1996)
(8) Y. Kuwano, “The PV Era is coming – the way to GENESIS”, SolarEnergy Materials and Solar Cells, Elsevier Science B.V. (1994)
(9) Kuwano, “The Era of Solar Array Utilization,” Electronics, November1993
(10) Kuwano, “The Current State and Future Prospects of Clean-Energy Solar Arrays,” Science and Industry, Vol. 65 (1991)
(11) Y. Kuwano, “PROGRESS OF AMORPHOUS SILICON SOLARCELLS”, 4th International Photovoltaic Science and EngineeringConference, Sydney, Australia (February, 1989)
(12) Kuwano, “A Global Energy Network – GENESIS Project Proposal,”Sunshine Journal, Vol. 11 No. 1 (1990)
(13) Kuwano, “GENESIS Project Proposal: Photovoltaic Power is theUltimate Energy for Humanity – A Plan for a Japanese Initiativeto Create a Global Network,” Economist Special Issue, August 15and 22, 1989 (combined issue)
(14) Kitazawa, “The Future of Superconducting Technology,” Journalof the Cryogenic Association of Japan (2007)
(15) “World Energy Demand to Rise Fivefold by 2030,” Nihon KeizaiShimbun, November 8, 2006
(16) “The Future of Energy,” Nikkei Science, December 2006(17) “Whither Nuclear Trash?” Asahi Shimbun Evening Edition, March
2, 2002(18) “Acceleration of Urban Population Inflows,” Nihon Keizai Shimbun,
September 14, 2007(19) “Toward Windmills that Withstand Heavy Weather,” Asahi Shimbun,
July 6, 2007(20) “Breakthrough in Photovoltaic Efficiency,” Nihon Keizai Shimbun,
July 6, 2007(21) R. Hata, “The Kyoto Protocol and Northeast Asia Energy, Resource,
Environmental and Economic Cooperation Region: A Study on theDC Power Transmission System for International Interconnection”,SEI TECHNICAL REVIEW·NUMBER61·JANURAY 2006
(22) “World Population Reaches 6.5 Billion,” Asahi Shimbun, February27, 2006
(23) “World Population Exceeds 6.5 Billion,” Chigasaki Method theLatest News in English Monthly Book No. 110, Unit 18 (May2006)
(24) Hata, “Structure and Materials of Superconducting-enabled Devices– Superconducting Cable,” Denki Hyoron, December 2001
(25) M. Watanabe, T. Masuda, et al., “Construction of 22.9-kV HTSCable System for KEPCO Project in South Korea”, SEI TECHNI-CAL REVIEW·NUMBER 63·DECEMBER 2006
(26) “Demonstration Test of High-temperature SuperconductingTransmission Cable Fully Under Way,” Asahi Shimbun EveningEdition, March 6, 2007
(27) “Super-efficient Power Transmission with Superconductivity,” AsahiShimbun, September 7, 2007
(28) K. Fujino, K. Ohmatsu, T. Okazaki, et al., “Development ofSuperconducting Coil for Ship Pod-Propulsion Motors”, SEITECHNICAL REVIEW·NUMBER 65·OCTOBER 2007
(29) “Strong Chinese Demand Raises Prices for Nonferrous Metals andCopper,” Nihon Keizai Shimbun, August 21, 2007
(30) E.g. “IPCC Fourth Assessment Report: Stark Sense of Crisis,” AsahiShimbun Evening Edition, February 2, 2007
(31) “Another Crisis for Living Beings at the End of This Century?”Nihon Keizai Shimbun, July 22, 2007
(32) “2008 Economic and Industrial Policy Priorities (The Plan toForge a Nuclear-powered Nation)”, Ministry of Economy, Tradeand Industry (2007)
(33) “429 Operational Nuclear Power Plants Worldwide (3 underConstruction and 11 Planned in Japan),” Nihon Keizai Shimbun,April 3, 2007
(34) “Plan to Build over 30 Nuclear Power Plants as US Aims toRehabilitate Nuclear Power,” Nihon Keizai Shimbun, July 9, 2007
(35) “Leading Nuclear Power Companies Battle for Uranium,” NihonKeizai Shimbun, August 21, 2007
(36) “Approaching Crisis: Half the World’s Population has InsufficientWater (The ‘Age of Water’ Has Arrived (1)),” Nihon KeizaiShimbun, November 6, 2004
(37) Nishikawa, “Water and Subsistence Environments,” Essay, Journal ofthe Institute of Electrical Engineers of Japan, Vol. 127 No. 9 (2007)
(38) “Oil-producing Countries Compete in New Energy,” Nihon KeizaiShimbun, August 25, 2007
(39) “Saudi Power and Desalination Project,” Nihon Keizai Shimbun,November 23, 2006
(40) “New Fuels: Japan-US Acceleration,” Asahi Shimbun, January 25,2007
(41) “Special Issue: Nuclear Power Renaissance,” Energy and Resources,Vol. 28 No. 5 (September 2007)
(42) “Problems with Underground Disposal of Spent Nuclear Fuel:Nevada Governor’s Veto,” Asahi Shimbun Evening Edition, April9, 2002
(43) “US Issues First Operating Permit Renewal, Extending 40-yearPermit for Calvert Cliffs Plant by 20 Years,” Atomic IndustrialJournal, August 24, 2000
(44) “Findings and Release of Cabinet Office/METI Survey of PublicOpinion on Energy,” Energy OHM, April 2006
(45) R. Hata, “CO2 Emission Reduction Using PPLP Solid DCSubmarine Cable and Kyoto Mechanism”, SEI TECHNICALREVIEW·NUMBER63·DECEMBER 2006
(46) “Breakthrough in Power Generating Efficacy: ‘Quantum Dot’Photovoltaics Provides More than Doubles ConventionalPerformance,” Nihon Keizai Shimbun, July 6, 2007
(47) “Series of Easily-controlled Environment-friendly Small-scaleHydraulic Power Stations Being Built,” Nihon Keizai Shimbun,September 27, 2007
(48) “The Niigata Chuetsu Offshore Earthquake,” Chigasaki Method theLatest News in English Monthly Book No. 126 (September 2007)
(49) “Many Doubts about Press Reports,” Atomic Industrial Journal,September 30, 2007
(50) “Chuetsu Offshore Shock for Nuclear Power Leader US,” AsahiShimbun, September7, 2007
(51) “Long-term of Nuclear Power Plant Stoppage: What is the ChuetsuOffshore Earthquake Mechanism?” Asahi Shimbun, July 19, 2007
(52) “Joint Public-Private Development of 1.8 GW-Class BWR andPWR,” Atomic Industrial Journal, September 20, 2007
(53) T. Kato, et al., “Development of Drastically Innovative BSCCO (DI-BSCCO) Wire”, SEI TECHNICAL REVIEW·NUMBER 62·JUNE2006
(54) H. Yumura, T. Masuda, R. Hata, et al., “World’s First In-gridDemonstration of Long-length “3-in-One” HTS Cable (AlbanyProject)”, SEI TECHNCIAL REVIEW·UMBER 64·APRIL 2007
(55) M. Hirose, T. Masuda, K. Sato and R. Hata, “High-TemperatureSuperconducting (HTS) DC Cable”, SEI TECHNICALREVIEW·NUMBER 61·JANUARY 2006
(56) R. Hata, “Solid DC Submarine Cable Insulated with PolypropyleneLaminated Paper (PPLP)”, SEI TECHNCIAL REVIEW·NUMBER62·JUNE 2006
(57) Ohmatsu, “Superconducting Cable,” Patent Abstracts of JapanBulletin, Unexamined Application No. 2003-141946 (November2, 2001)
(58) “Earthquake-spilled Waste,” Asahi Shimbun, October 8, 2007(59) Yamaguchi, Hamabe et al, “First-term Experiment Report on
Experimental Equipment for DC Superconducting TransmissionExperiment,” Presentation 3A-a07, 76th Conference of theCryogenic and Superconductivity Association of Japan, Spring 2007
SEI TECHNICAL REVIEW · NUMBER 66 · APRIL 2008 · 29

(60) Yamaguchi, Hamabe et al, “Investigation of a DC Long-DistanceSuperconducting Power Transmission System,” Cryogenic andSuperconductivity Association of Japan (2005)
(61) S. Yamaguchi et al, Rev Sci Instrum 75 207, 2004 (Also scheduledfor publication during 2008 in Physics C)
(62) “Automotive Parts from Toray Carbon Fiber,” Nihon KeizaiShimbun, October 9, 2007
(63) P. M. Grant, “The SuperCable: Dual Delivery of Chemical andElectric Power”, IEEE Trans. Appl. Super 15 (2005) 1810
(64) “Increasing Ethanol Demand Boosts Corn Prices” Nihon KeizaiShimbun, October 3, 2007
(65) “Population Worldwide Reachs 6.6 Billion”, Nihon Keiziai Shimbun,June 28, 2007
30 · “GENESIS Project” and High-Temperature Superconducting (HTS) DC Cable –Keen Use of Ultimately Sustainable New Energies–
Contributor
R. HATA• Dr. Eng., Managing Executive Officer